DOI: 10 - ars.els-cdn.com€¦ · Web viewFigure S2. Photographs of transferred PFDMA of 20- μm...
9
Supporting Information Title Transfer-printable Micropatterned Fluoropolymer-based Triboelectric Nanogenerator Jaewook Ha 1+ , Jihoon Chung 2+ , SeongMin Kim 3,4+ , Jong Hun Kim 5 , Seungmin Shin 1 , Jeong Young Park ,5,6 , Sangmin Lee 2* , Jin-Baek Kim 1* Figure S1. Results of transfer printing process. (a)~(c) SEM images of original SU 8 template, replicated PDMS mold, and transferred PFDMA with 5 μm height on substrate. (d)~(f) SEM images of original SU 8 template, replicated PDMS mold, and transferred PFDMA with 10- μm height on substrate. (g)~(i) SEM images of original SU 8 template, replicated PDMS mold, and transferred PFDMA with 20 μm height on substrate. 1
Transcript of DOI: 10 - ars.els-cdn.com€¦ · Web viewFigure S2. Photographs of transferred PFDMA of 20- μm...

Supporting Information
Title Transfer-printable Micropatterned Fluoropolymer-based Triboelectric Nanogenerator
Jaewook Ha1+, Jihoon Chung2+, SeongMin Kim3,4+, Jong Hun Kim5, Seungmin Shin1, Jeong
Young Park,5,6, Sangmin Lee2*, Jin-Baek Kim1*
Figure S1. Results of transfer printing process. (a)~(c) SEM images of original SU 8 template, replicated PDMS mold, and transferred PFDMA with 5 μm height on substrate. (d)~(f) SEM images of original SU 8 template, replicated PDMS mold, and transferred PFDMA with 10- μm height on substrate. (g)~(i) SEM images of original SU 8 template, replicated PDMS mold, and transferred PFDMA with 20 μm height on substrate.
1

Figure S2. Photographs of transferred PFDMA of 20- μm height by transfer printing onto (a) polyimide film, (b) thin PET, (c) slide glass, (d) Al substrate.
2

Figure S3. Characterizations of PFDMA (a) 1H NMR spectroscopy (b) FT-IR spectroscopy
(c) inherent viscosity of PFDMA
3
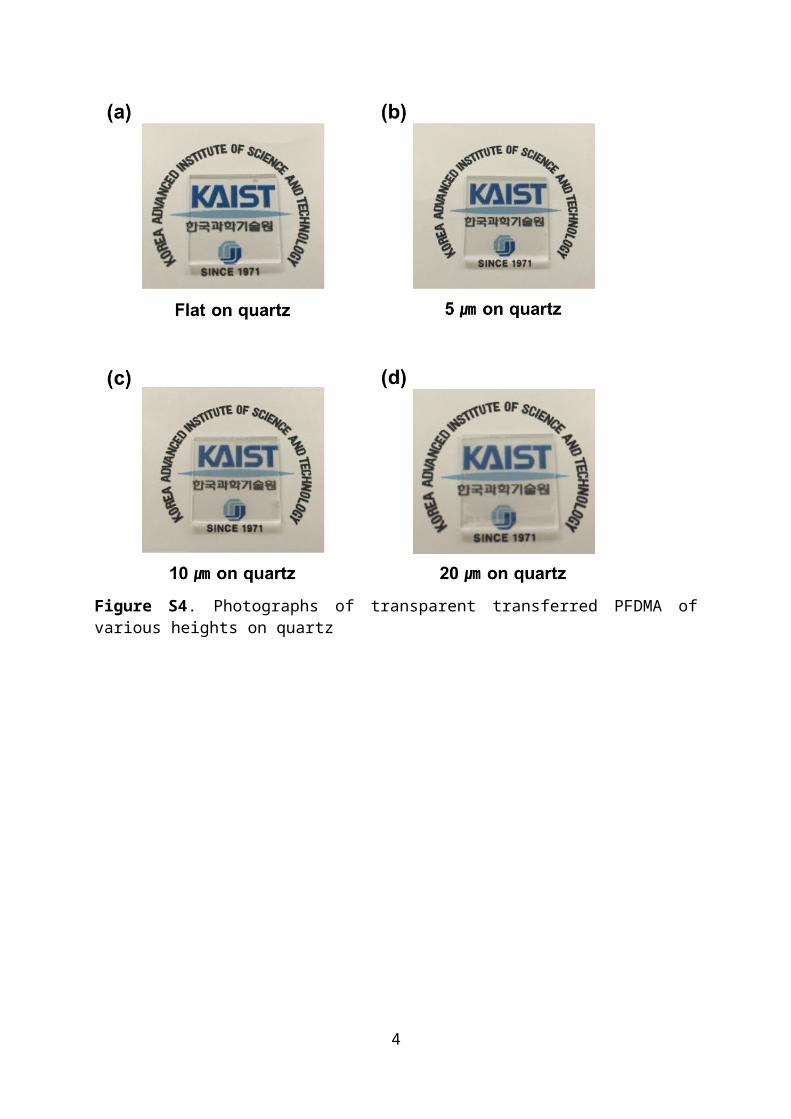
Figure S4. Photographs of transparent transferred PFDMA of various heights on quartz
4

Figure S5. (a)-(k) time-evolution of CPD on PFDMA. Scan size is 20 × 20 μm. (i) Representative profiles of topography and CPD
5

Figure S6. (a) CPD distribution of Al and PFDMA in virgin state. (b) Schematics demonstrating the charge transfer between surfaces as driven by the effective work function difference between them.
Figure S7. Schematic of bridge rectifying circuit connecting TENG with LED array
6

Figure S8. Theoretical model for metal to dielectric mode of TENG, S is surface area, σ is the triboelectric charge density, x i is the varying distance between the top metal and the dielectric material, d i is the varying distance between the dielectric material and the bottom metal, and ε is the dielectric constant of the material.
Figure S9. Theoretically calculated results of the output triboelectric potential distribution between fluoropolymer and Al film. (a) flat. Height of (b) 5 μm, (c) 10 μm, and (d) 20 μm, (e) plot of tribocharge density and VOC as a function of height
7
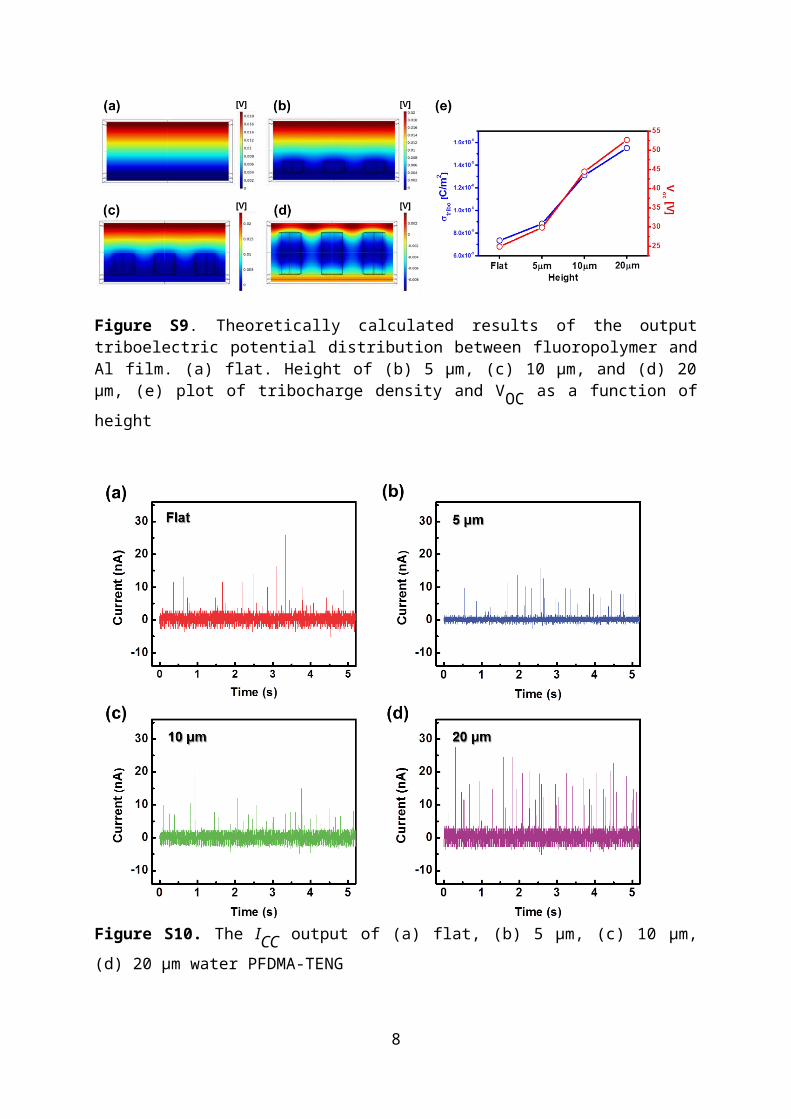
Figure S10. The ICC output of (a) flat, (b) 5 μm, (c) 10 μm, (d) 20 μm water PFDMA-TENG
8