DNase I hypersensitivity in the γ globin gene locus of K562 cells
13
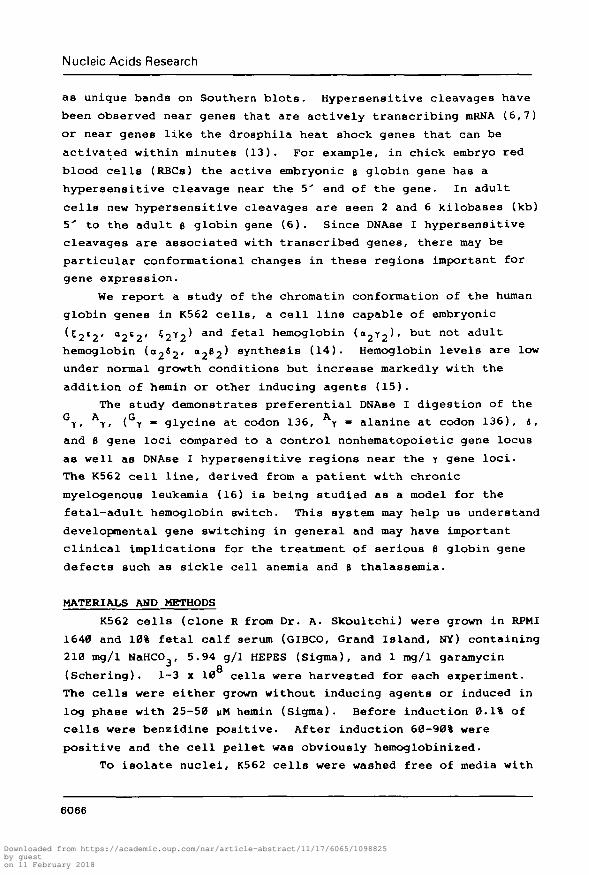
Volume 11 Number 17 1983 Nucleic Acids Research DNase I hvpersensitfvit) In the 7 globin gene locus of K562 cefls Herbert M.Lachman and J.Gregory Mears* + Division of Experimental Hematology, Department of Medicine, Albert Einstein College of Medicine, 1300 Morris Park Avenue, Bronx, NY 10461, USA Received 20 April 1983; Revised and Accepted 1 August 1983 ABSTRACT We have probed the chromatin conformation of the y- y-t-6 globin gene locus of K562 cells, a human hematopoietic cell line, with the enzyme pancreatic DNAse I. This enzyme preferentially digests genes in an active configuration. We have found that in K562 cells, which produce embryonic and fetal but not adult hemoglobins, both the active y and inactive 8 genes are DNAse I sensitive. However, only the active y genes have DNAse I hypersensitive regions. The hypersensitive regions have been mapped to an area approximately 100 base pairs 5' to the y and y genes. INTRODUCTION The control of human globin gene expression is a poorly understood process. Despite an impressive accumulation of knowledge of the fine DNA structure of normal and mutant human globin genes in recent years the mechanism responsible for the precise, efficient regulation of these genes in the developing erythron has not been elucidated. It has been shown in other eucaryotic gene systems that the chromatin conformation of expressed or developmentally committed genes is altered, as defined by sensitivity to DNAse I digestion (see 1 for review). When nuclei are partially digested with DNAse I, actively expressed genes and genes that will be developmentally activated, are digested faster than non-active genes (2-5). The domain of increased sensitivity includes the structural genes and large portions of the 5' and 3' regions (3,6,7). DNAse I sensitive regions are also undermethylated (7-9) and bind the non-histone proteins HMG 14 & 17 (10-12). With minimal DNAse I digestion specific double stranded (hypersensitive) DNA cleavages are often seen (6,7). These appear © IRL Press Limited, Oxford, England. 6065 Downloaded from https://academic.oup.com/nar/article-abstract/11/17/6065/1098825 by guest on 11 February 2018
Transcript of DNase I hypersensitivity in the γ globin gene locus of K562 cells
Volume 11 Number 17 1983 Nucleic Acids Research
DNase I hvpersensitfvit) In the 7 globin gene locus of K562 cefls
Herbert M.Lachman and J.Gregory Mears* +
Division of Experimental Hematology, Department of Medicine, Albert Einstein College ofMedicine, 1300 Morris Park Avenue, Bronx, NY 10461, USA
Received 20 April 1983; Revised and Accepted 1 August 1983
ABSTRACTWe have probed the chromatin conformation of the y- y-t-6
globin gene locus of K562 cells, a human hematopoietic cell line,with the enzyme pancreatic DNAse I. This enzyme preferentiallydigests genes in an active configuration. We have found that inK562 cells, which produce embryonic and fetal but not adulthemoglobins, both the active y and inactive 8 genes are DNAse Isensitive. However, only the active y genes have DNAse Ihypersensitive regions. The hypersensitive regions have beenmapped to an area approximately 100 base pairs 5' to the y and ygenes.
INTRODUCTION
The control of human globin gene expression is a poorly
understood process. Despite an impressive accumulation of
knowledge of the fine DNA structure of normal and mutant human
globin genes in recent years the mechanism responsible for the
precise, efficient regulation of these genes in the developing
erythron has not been elucidated.
It has been shown in other eucaryotic gene systems that the
chromatin conformation of expressed or developmentally committed
genes is altered, as defined by sensitivity to DNAse I digestion
(see 1 for review). When nuclei are partially digested with DNAse
I, actively expressed genes and genes that will be developmentally
activated, are digested faster than non-active genes (2-5). The
domain of increased sensitivity includes the structural genes and
large portions of the 5' and 3' regions (3,6,7). DNAse I
sensitive regions are also undermethylated (7-9) and bind the
non-histone proteins HMG 14 & 17 (10-12).
With minimal DNAse I digestion specific double stranded
(hypersensitive) DNA cleavages are often seen (6,7). These appear
© IRL Press Limited, Oxford, England. 6065
Downloaded from https://academic.oup.com/nar/article-abstract/11/17/6065/1098825by gueston 11 February 2018
Nucleic Acids Research
as unique bands on Southern blots. Hypersensitive cleavages have
been observed near genes that are actively transcribing mRNA (6,7)
or near genes like the drosphila heat shock genes that can be
activated within minutes (13). For example, in chick embryo red
blood cells (RBCs) the active embryonic (j globin gene has a
hypersensitive cleavage near the 5' end of the gene. In adult
cells new hypersensitive cleavages are seen 2 and 6 kilobases (kb)
5' to the adult B globin gene (6). Since DNAse I hypersensitive
cleavages are associated with transcribed genes, there may be
particular conformational changes in these regions important for
gene expression.
We report a study of the chromatin conformation of the human
globin genes in K562 cells, a cell line capable of embryonic
(t2l2' a2 e2' ^2^2^ a n d f e t a l hemoglobin ( O 2 Y 2 ) , but not adult
hemoglobin (ao*2' a2^2^ synthesis (14). Hemoglobin levels are low
under normal growth conditions but increase markedly with the
addition of hemin or other inducing agents (15).
The study demonstrates preferential DNAse I digestion of theGT» A T , (GY - glycine at codon 136, A T - alanine at codon 136), «,
and B gene loci compared to a control nonhematopoietic gene locus
as well as DNAse I hypersensitive regions near the t gene loci.
The K562 cell line, derived from a patient with chronic
myelogenous leukemia (16) is being studied as a model for the
fetal-adult hemoglobin switch. This system may help us understand
developmental gene switching in general and may have important
clinical implications for the treatment of serious B globin gene
defects such as sickle cell anemia and 6 thalassemia.
MATERIALS AMD METHODS
K562 cells (clone R from Dr. A. Skoultchi) were grown in RPMI
1640 and 10% fetal calf serum (GIBCO, Grand Island, NY) containing
210 mg/1 NaHCO , 5.94 g/1 HEPES (Sigma), and 1 mg/l garamycin•3 Q
(Schering). 1-3 x 10 cells were harvested for each experiment.
The cells were either grown without inducing agents or induced in
log phase with 25-50 pM hemin (Sigma). Before induction 0.1% of
cells were benzidine positive. After induction 60-90% were
positive and the cell pellet was obviously hemoglobinized.
To isolate nuclei, K562 cells were washed free of media with
6066
Downloaded from https://academic.oup.com/nar/article-abstract/11/17/6065/1098825by gueston 11 February 2018
Nucleic Acids Research
phosphate buffered saline, then lysed after a 15 minute incubation
in reticulocyte standard buffer (RSB) S. 0.5% nonidet. Nuclei were
pelleted and washed 3 times in RSB then resuspended in RSB to
yield a DNA concentration of 0.5-1.0 mg/ml. Bovine pancreatic
DNAse I (Boehringer Mannheim, West Germany, lot # 1201427) was
added either at a fixed concentration (0.1-2.0 pg DNAse i/mg DNA)
with aliquots removed at 0, 1/2, 1, 3, 5, 10, 15, 20, and 30
minutes or at increasing concentration (0, 0.5, 1, 2, 5 yg DNAse
i/mg DNA) for 5 minutes. Experiments were performed at 37° C.
50x aliquots were removed and added to 50i of 0.1 M EDTA and
centrifuged. DNA in the supernatant was determined by optical
density at 260 nM and percent solubility obtained in order to
monitor the activity of DNAse I. The reactions were stopped by
adding 3 volumes of PK buffer (0.05 M Tris, pH 7.5, 0.1 M NaCl,
0.001 M EDTA, 0.5% SDS) and 50 yg/ral proteinase K (Boehringer).
Solutions were incubated overnight at 55° C and the DNA purified
as previously described (17).
15 yg of DNA were restriction digested with either Eco RI,
Hpa I, Bam HI, or Bgl II (New England Biolabs), using sufficient
enzyme to ensure complete digestion. DNA was electrophoresed on a
0.9% agarose gel for 18 hours at 15-20 volts, then blotted to
nitrocellulose paper (Schleicher & Schuell) as previously
described (18). Filters were hybridized to 32P-labelled probes
(Amersham) prepared by nick translation (19). The probes used
were human 8 globin (4.4 kb Pst I fragment), T globin (Bam HI-Eco
RI IVS-2 fragment), and human insulin (pH INS 214). The 8 and y
probes were kindly provided by Dr. A. Bank and the insulin probe
by Dr. J. Cohen. The specific activity after nick translation wasg
l-5x 10 cpm/yg DNA.
Human peripheral blood leukocytes (WBCs), pelleted following
NH4C1-
NH^COj lysis of RBCs were used as control cells.
RESULTS
Figure 1 shows a DNAse I digestion pattern for uninduced
(Fig. 1A) and induced (Fig. IB) K562 cells. In Fig. 1A the nuclei
were partially digested with 0, 0.5, 1.0, and 5.0 yg DNAse i/mg
DNA whereas in Fig. IB digestion with 0, 0.5, and 1.0 ug DNAse
6067
Downloaded from https://academic.oup.com/nar/article-abstract/11/17/6065/1098825by gueston 11 February 2018
Nucleic Acids Research
B Induced KDb<i - y inironA Uninduced K 5 6 2 - r Intron
7.2kb- b2.7 kb— 1
*l.5kb- * *'-5kb"
1 2 3 4 1 2 3
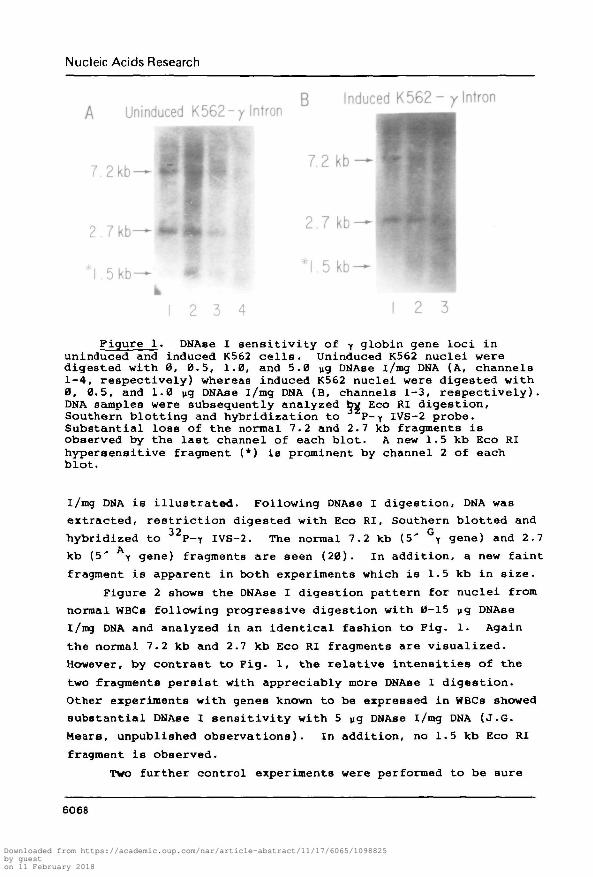
Figure 1. DNAse I sensitivity of y globin gene loci inuninduced and induced K562 cells. Uninduced K562 nuclei weredigested with 0, 0.5, 1.0, and 5.0 wg DNAse i/mg DNA (A, channels1-4, respectively) whereas induced K562 nuclei were digested with0, 0.5, and 1.0 yg DNAse i/mg DNA (B, channels 1-3, respectively).DNA samples were subsequently analyzed by Eco RI digestion,Southern blotting and hybridization to P-y IVS-2 probe.Substantial loss of the normal 7.2 and 2.7 kb fragments isobserved by the last channel of each blot. A new 1.5 kb Eco RIhypersensitive fragment (*) is prominent by channel 2 of eachblot.
I/mg DNA is illustrated. Following DNAse I digestion, DNA was
extracted, restriction digested with Eco RI, Southern blotted and
hybridized to 32P-y IVS-2. The normal 7.2 kb (5' Gy gene) and 2.7
kb (5' y gene) fragments are seen (20). In addition, a new faint
fragment is apparent in both experiments which is 1.5 kb in size.
Figure 2 shows the DNAse I digestion pattern for nuclei from
normal WBCs following progressive digestion with 0-15 yg DNAse
I/rag DNA and analyzed in an identical fashion to Fig. 1. Again
the normal 7.2 kb and 2.7 kb Eco RI fragments are visualized.
However, by contrast to Fig. 1, the relative intensities of the
two fragments persist with appreciably more DNAse I digestion.
Other experiments with genes known to be expressed in WBCs showed
substantial DNAse I sensitivity with 5 Mg DNAse i/mg DNA (J.G.
Meara, unpublished observations). In addition, no 1.5 kb Eco RI
fragment is observed.
Two further control experiments were performed to be sure
6068
Downloaded from https://academic.oup.com/nar/article-abstract/11/17/6065/1098825by gueston 11 February 2018
Nucleic Acids Research
WBCs-Y Intron
2.7 kb — • - #
1 2 3 4 5 6 7
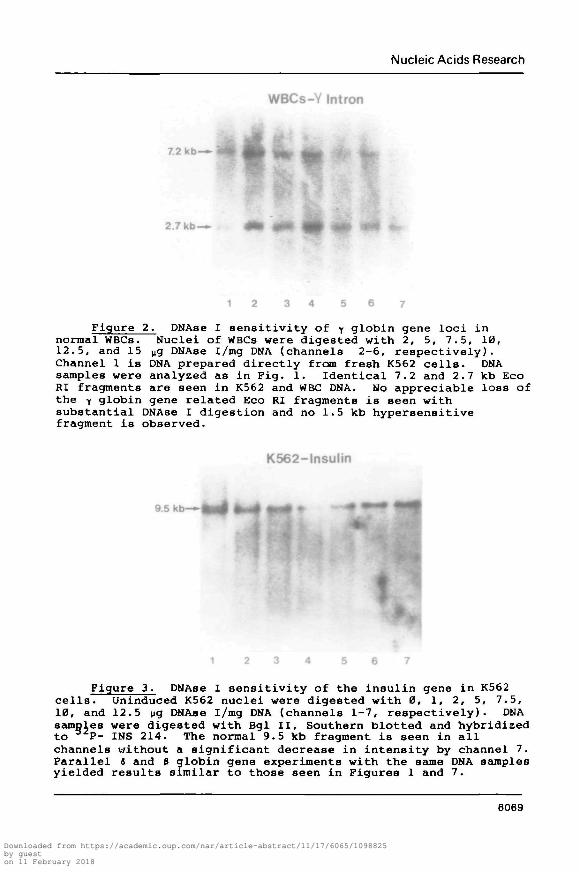
Figure 2. DNAse I sensitivity of y globin gene loci innormal WBCs. Nuclei of WBCs were digested with 2, 5, 7.5, 10,12.5, and 15 vg DNAse i/mg DNA (channels 2-6, respectively).Channel 1 is DNA prepared directly from fresh K562 cells. DNAsamples were analyzed as in Fig. 1. Identical 7.2 and 2.7 kb EcoRI fragments are seen in K562 and WBC DNA. No appreciable loss ofthe y globin gene related Eco RI fragments is seen withsubstantial DNAse I digestion and no 1.5 kb hypersensitivefragment is observed.
K562-lnsulin
9.5 kb—1
1 2 3 4 5 6 7
Figure 3. DNAse I sensitivity of the insulin gene in K562cells. Uninduced K562 nuclei were digested with 0, 1, 2, 5, 7.5,10, and 12.5 yg DNAse i/mg DNA (channels 1-7, respectively). DNAsamples were digested with Bgl II, Southern blotted and hybridizedto P- INS 214. The normal 9.5 kb fragment is seen in allchannels without a significant decrease in intensity by channel 7.Parallel 3 and B globin gene experiments with the same DNA samplesyielded results similar to those seen in Figures 1 and 7.
6069
Downloaded from https://academic.oup.com/nar/article-abstract/11/17/6065/1098825by gueston 11 February 2018
Nucleic Acids Research
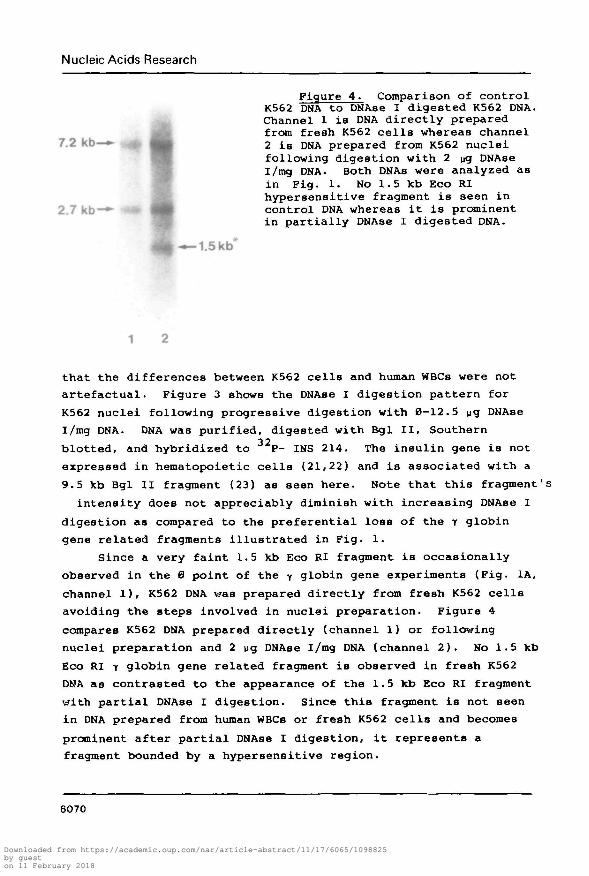
Figure 4. Comparison of controlK562 DNA to DNAse I digested K562 DNA.Channel 1 is DNA directly prepared
^^^ from fresh K562 cells whereas channel7.2 kb—^ «^i ^ ^ 2 is DNA prepared from K562 nuclei
following digestion with 2 pg DNAseI/mg DNA. Both DNAs were analyzed asin Fig. 1. No 1.5 kb Eco RIhypersensitive fragment is seen in
2.7 kb—•" «*• fl^B control DNA whereas it is prominentin partially DNAse I digested DNA.
— 1.5 kb*
that the differences between K562 cells and human WBCs were not
artefactual. Figure 3 shows the DNAse I digestion pattern for
K562 nuclei following progressive digestion with 0-12.5 ug DNAse
i/mg DNA. DNA was purified, digested with Bgl II, Southern
blotted, and hybridized to P- INS 214. The insulin gene is not
expressed in hematopoietic cells (21,22) and is associated with a
9.5 kb Bgl II fragment (23) as seen here. Note that this fragment's
intensity does not appreciably diminish with increasing DNAse I
digestion as compared to the preferential loss of the T globin
gene related fragments illustrated in Fig. 1.
Since a very faint 1.5 kb Eco RI fragment is occasionally
observed in the 0 point of the y globin gene experiments (Fig. IA,
channel 1), K562 DNA was prepared directly from fresh K562 cells
avoiding the steps involved in nuclei preparation. Figure 4
compares K562 DNA prepared directly (channel 1) or following
nuclei preparation and 2 |ig DNAse i/mg DNA (channel 2). Ho 1.5 kb
Eco RI T globin gene related fragment is observed in fresh K562
DNA as contrasted to the appearance of the 1.5 kb Eco RI fragment
with partial DNAse I digestion. Since this fragment is not seen
in DNA prepared from human WBCs or fresh K562 cells and becomes
prominent after partial DNAse I digestion, it represents a
fragment bounded by a hypersensitive region.
6070
Downloaded from https://academic.oup.com/nar/article-abstract/11/17/6065/1098825by gueston 11 February 2018
Nucleic Acids Research
Ikb
G r
probe yIVS2 I 1 I 1
Hi- -I 5---Eco RI I » 1 I x 1
72 27
•-I 3-Hpol —/f X 1 1
24 5 I
4 5Bom HI I x—I TV—
5 1 15 5
5 0 i 6 36 7----
113
B q l l I x x 113
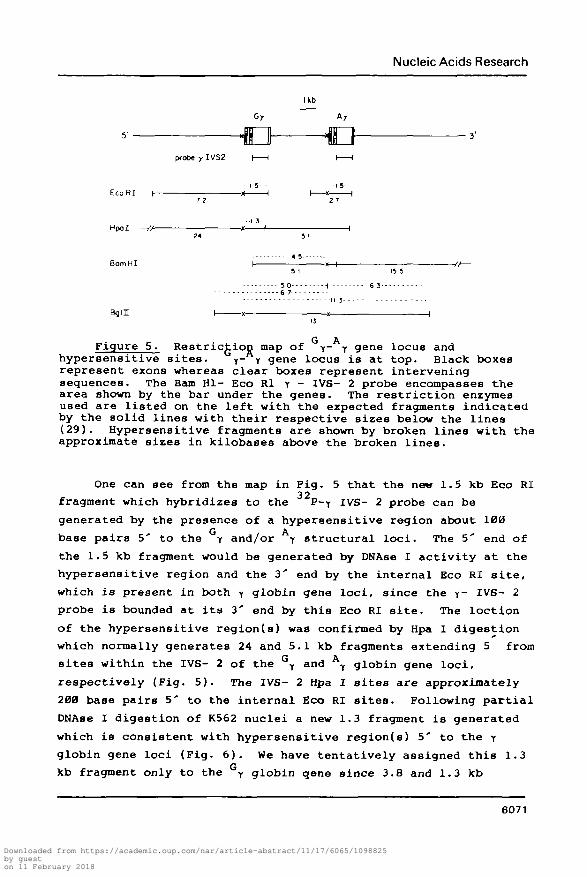
Figure 5 • Restriction map of y- y gene locus andhypersensitive sites. T- Y gene locus is at top. Black boxesrepresent exons whereas clear boxes represent interveningsequences. The Bam HI- Eco Rl r - IVS- 2 probe encompasses thearea shown by the bar under the genes. The restriction enzymesused are listed on the left with the expected fragments indicatedby the solid lines with their respective sizes below the lines(29). Hypersensitive fragments are shown by broken lines with theapproximate sizes in kilobases above the broken lines.
One can see from the map in Fig. 5 that the new 1.5 kb Eco RI32
fragment which hybridizes to the P~r IVS- 2 probe can be
generated by the presence of a hypersensitive region about 100G A
base pairs 5' to the y and/or Y structural loci. The 5' end of
the 1.5 kb fragment would be generated by DNAse I activity at the
hypersensitive region and the 3' end by the internal Eco RI site,
which is present in both Y globin gene loci, since the y- IVS- 2
probe is bounded at its 3' end by this Eco RI site. The loction
of the hypersensitive region(s) was confirmed by Hpa I digestion
which normally generates 24 and 5.1 kb fragments extending 5 from
sites within the IVS- 2 of the G T and A Y globin gene loci,
respectively (Fig. 5). The IVS- 2 Hpa I sites are approximately
200 base pairs 5' to the internal Eco RI sites. Following partial
DNAse I digestion of K562 nuclei a new 1.3 fragment is generated
which is consistent with hypersensitive region(s) 5' to the Y
globin gene loci (Fig. 6). We have tentatively assigned this 1.3
kb fragment only to the T globin qene since 3.8 and 1.3 kb
6071
Downloaded from https://academic.oup.com/nar/article-abstract/11/17/6065/1098825by gueston 11 February 2018
Nucleic Acids Research
Bam HI Bgl 11
I-4.5* • - . 6 . 7
— 11.3*
-6.7*-6.3*
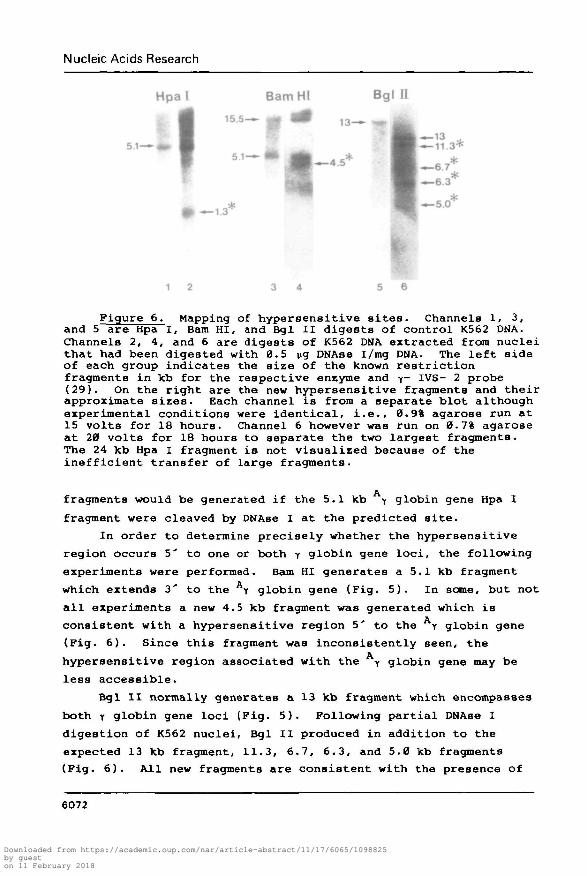
Figure 6. Mapping of hypersensitive sites. Channels 1, 3,and 5 are Hpa I, Bam HI, and Bgl II digests of control K562 DNA.Channels 2, 4, and 6 are digests of K562 DNA extracted from nucleithat had been digested with 0.5 jig DNAse i/mg DNA. The left sideof each group indicates the size of the known restrictionfragments in kb for the respective enzyme and y- IVS- 2 probe(29). On the right are the new hypersensitive fragments and theirapproximate sizes. Each channel is from a separate blot althoughexperimental conditions were identical, i.e., 0.9% agarose run at15 volts for 18 hours. Channel 6 however was run on 0.7% agaroseat 20 volts for 18 hours to separate the two largest fragments.The 24 kb Hpa I fragment is not visualized because of theinefficient transfer of large fragments.
fragments would be generated if the 5.1 kb y globin gene Hpa I
fragment were cleaved by DNAse I at the predicted site.
In order to determine precisely whether the hypersensitive
region occurs 5' to one or both y globin gene loci, the following
experiments were performed. Bam HI generates a 5.1 kb fragment
which extends 3' to the \ globin gene (Fig. 5). In some, but not
all experiments a new 4.5 kb fragment was generated which is
consistent with a hypersensitive region 5' to the y globin gene
(Fig. 6). Since this fragment was inconsistently seen, the
hypersensitive region associated with the y globin gene may be
less accessible.
Bgl II normally generates a 13 kb fragment which encompasses
both y globin gene loci (Fig. 5). Following partial DNAse I
digestion of K562 nuclei, Bgl II produced in addition to the
expected 13 kb fragment, 11.3, 6.7, 6.3, and 5.0 kb fragments
(Fig. 6). All new fragments are consistent with the presence of
6072
Downloaded from https://academic.oup.com/nar/article-abstract/11/17/6065/1098825by gueston 11 February 2018
Nucleic Acids Research
A uninduced KDc^- p oene g Induced K562- (3 Gene
_, 5.2 kb-3 6 k b^ 3.6 kb-
2.3kb— 2.3kb-
1 2 3 4 1 2 3
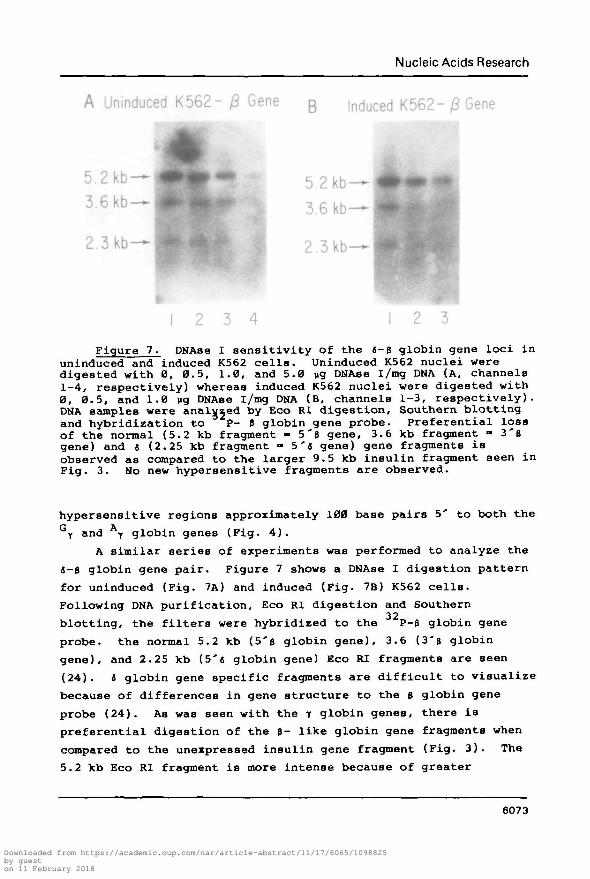
Figure 7. DNAae I sensitivity of the 6-B globin gene loci inuninduced and induced K562 cells. Uninduced K562 nuclei weredigested with 0, 0.5, 1.0, and 5.0 ug DNAse i/mg DNA (A, channels1-4, respectively) whereas induced K562 nuclei were digested with0, 0.5, and 1.0 ug DNAse l/mg DNA (B, channels 1-3, respectively).DNA samples were analysed by Eco RI digestion. Southern blottingand hybridization to P- B globin gene probe. Preferential lossof the normal (5.2 kb fragment - 5'6 gene, 3.6 kb fragment = 3'Bgene) and t (2.25 kb fragment » 5's gene) gene fragments isobserved as compared to the larger 9.5 kb insulin fragment seen inFig. 3. No new hypersensitive fragments are observed.
hypersensitive regions approximately 100 base pairs 5' to both the
Y and T globin genes (Fig. 4).
A similar series of experiments was performed to analyze the
6-8 globin gene pair. Figure 7 shows a DNAse I digestion pattern
for uninduced (Fig. 7A) and induced (Fig. 7B) K562 cells.
Following DNA purification, Eco RI digestion and Southern
blotting, the filters were hybridized to the P-B globin gene
probe. the normal 5.2 kb (5'B globin gene), 3.6 (3'B globin
gene), and 2.25 kb (5'6 globin gene) Eco RI fragments are seen
(24). « globin gene specific fragments are difficult to visualize
because of differences in gene structure to the 3 globin gene
probe (24). As was seen with the y globin genes, there is
preferential digestion of the B- like globin gene fragments when
compared to the unexpressed insulin gene fragment (Fig. 3). The
5.2 kb Eco RI fragment is more intense because of greater
6073
Downloaded from https://academic.oup.com/nar/article-abstract/11/17/6065/1098825by gueston 11 February 2018
Nucleic Acids Research
representation in the 6 globin gene probe. No 6- like
hypersensitive fragment is observed although a 1.5 kb Eco RI 6
globin gene fragment would be expected if a hypersensitive^site
similar to those observed for the y globin genes existed 5 to the
B globin gene. Because of the previously mentioned differences in
homology with S globin gene related fragments we cannot rule out
the existence of a i globin gene related hypersensitive region.
DISCUSSION
Our findings that both the y- y and J-B gene pairs are DNAse
I sensitive in uninduced and induced K562 cells suggests that the
gene pairs share a single chromosomal domain of altered chromatin
conformation despite the lack of 6 globin gene expression. Since
we find hypersensitive regions associated only with the actively
expressed y globin gene loci, one implication is that human globin
gene expression requires the presence of one or more
hypersensitive regions within the chromosomal domain. Thus,
developmental changes in human globin gene expression such as the
fetal to adult hemoglobin switch may be accompanied by changes in
the location of hypersensitive regions within a larger domain of
altered chromatin which encompasses all genes which have the
potential for expression within a genetic program. A recent study
suggests the presence of nascent i globin RNA transcripts in K562
cells which may not be full length and demonstrates that no B
globin RNA is detectable (25). One prediction from this would be
the presence of a & globin gene related hypersensitive region.
Use of a B globin gene related probe does not allow us to
determine whether such a region exists.
Our results in the K562 cell line are similar to those of H.
Weintraub in the chick embryo system (2) and D.M. Miller, et al.
in mouse erythroleukemia cells (MELC) (26) that an entire
developmental locus is DNAse I sensitive whether or not RNA is
being transcribed. We are presently attempting to determine the
extent of DNAse I sensitivity. It is possible, as others have
shown, that the degree of DNAse I sensitivity may vary somewhat
within the chromosomal domain in addition to extending for many
kilobases beyond the genes of interest (3,6,7,).
In normal humans, both y globin genes are expressed although
6074
Downloaded from https://academic.oup.com/nar/article-abstract/11/17/6065/1098825by gueston 11 February 2018
Nucleic Acids Research
the ratio of their protein products varies according to the stage
of development. In fetuses, in which the y globin genes are the
major active non-o globin genes, the ratio is typically T/ T =
7/3 whereas in adults, in which the T globin are expressed at a
low level, the Gy/AT " 2/3 (27). It is interesting to note that
in K562 cells, which display many characteristics of fetal
development including a Gy/AY = 7/3 (28), both T globin genes are
flanked at their 5" ends by hypersensitive regions. Thus, if
hypersensitive regions are necessary for expression, one
conclusion from our study may be that the y globin genes possess
the potential for independent regulation of expression rather than
a single regulatory area responsible for fetal or adult type y
globin gene expression. We presently do not understand why the y
globin gene related hypersensitive region is less easily
demonstrable by our methodology. Both the Hpa I and the Bam HI
studies are consistent with the presence of a less accessible
hypersensitive region. It is possible that this region is not as
extensive as that related to the y globin gene. Further studies
are required to determine if possible differences in the two Y
globin gene hypersensitivve regions are related to the
developmentally changing ratios of their protein products.
Both T globin gene hypersensitive regions map to 5' flanking
regions which are highly conserved in their DNA structure and
which have been shown to contain two putative promotor sequences,
the ATA sequence and the CCAAT sequence 30 base pairs and 80 base
pairs 5' to the cap site, respectively (29). Since we have not
yet identified any other hypersensitive regions near the y globin
genes, it is possible that the presently described hypersensitive
regions which are closely allied to putative promotor sequences
are sufficient for active y globin gene expression.
The K562 cell line is viewed by many investigators as a
useful model for the study of human globin gene expression,
particularly since globin gene expression is enhanced by the
addition of hemin and other inducing agents in a manner similar to
that described for MELC (30). However, induction in MELC has
recently been shown to be accompanied by a 6 to 10 fold increase
in the generation of hypersensitive regions 5' to the a and S
major globin genes (9), whereas we have not been able to identify
6075
Downloaded from https://academic.oup.com/nar/article-abstract/11/17/6065/1098825by gueston 11 February 2018
Nucleic Acids Research
a similar trend between uninduced and induced K562 cells. ThuB,
induction as defined by the activation of a genetic program of
differentiaition, may not occur in K562 cells. Rather, inducing
agents produce an augmentation of the low level expression of the
globln genes detectable in uninduced cells. In addition, it is
unlikely that inducing agents select for a subpopulation of cells
capable of hemoglobin production since the hypersensitive regions,
if considered a marker for active y globin gene expression, are
equally discernible in uninduced and induced K562 cells. This is
consistent with the finding that uninduced K562 cells have uniform
amounts of globin mRNA as detected by in situ hybridization (31).
The K562 cell line is an interesting substrate for further
studies of differential human globin gene expression at the level
of chromatin. Experiments designed to study differences in the
5'regions of the y globin gene versus S globin gene loci which
relate to the presence or absence of hypersensitive regions may be
useful in understanding the mechanism(s) of the fetal to adult
hemoglobin switch in humans. Insight into the fetal to adult
hemoglobin switch may point to future therapy which can favorably
modify the clinical course of the common genetic disorders of
hemoglobin synthesis.
ACKNOWLEDGEMENTS
We would like to thank Kim E. Schaefer for excellent
technical assistance. This work was supported by NIH grants GM
28841 and AM 7294 and the Sinsheimer Foundation. Dr. Mears is a
Hartford Fellow.
A preliminary report describing parts of this paper has
appeared in an abstract (32).
*To whom correspondence should be addressed
+ Present address: Columbia University College of Physicians and Surgeons, Department ofMedicine, Hammer Health Sciences Center, Room 1602, 701 West 168th Street, New York,NY 10032, USA
REFERENCES1. Weisbrod, S. (1982) Na tu re 297, 289-295.2. Wein t r aub , H. and Groudine, M. (1976) Sc ience 193, 848-856.
6076
Downloaded from https://academic.oup.com/nar/article-abstract/11/17/6065/1098825by gueston 11 February 2018
Nucleic Acids Research
3. Stadler, J., Groudine, M., Dodgson, J., Engel, J.D., andWeintraub, H. (1980) Cell 19, 973-980.
4. Flint, S.J. and Weintraub, H. (1977) Cell 12, 783-792.5. Wu, C , Yuk-Chor Wong and Elgin S.D.R. (1979) Cell 16,
807-814.6. Stadler, J., Larson, A., Engel, J.D., Dolan, M. , Groudine, M.
and Weintraub, H. (1980) Cell 20, 451-460.7. Weintraub, H., Larson, A., and Groudine, M. (1981) Cell 24,
333-344.8. Groudine, M. and Weintraub, H. (1981) Cell 24, 393-401.9. Sheffery, M., Rifkind, R.A., and Marks, P.A. (1982) Proc.
Natl. Acad. Sci. USA 79, 1180-1184.10. Weiabrod, S. and Weintraub, H. (1979) Proc. Natl. Acad. Sci.
USA 76, 630-634.11. Weisbrod, S., Groudine, M. and Weintraub, H. (1980) Cell 19,
289-301.12. Sandeen, G., Wood, W.I. and Felsenfeld, G. (1980) Nucleic
Acids Res. 8, 3757-3778.13. Wu, C. (1980) Nature 286, 854-860.14. Rutherford, T.R., Clegg, J.B. and Weatherall, D.J. (1979)
Nature 280, 164-165.15. Erard, R., Dean, A., and Schechter, A.N. (1981) Blood 58,
1236-1239.16. Lozzio, C.B. and Lozzio, B. (1975) Blood 45, 321-334.17. Kan, Y.W. and Dozy, A.M. (1978) Proc Natl. Acad. Sci. USA
75, 5631-5635.18. Southern, E.M. (1975) J. Mol. Biol. 98, 503-517.19. Maniatis, T., Jeffrey, A., and Kleid, D.G. (1975) Proc.
Natl. Acad. Sci. USA 72, 1184-1188.20. Ramirez, F., Burns, A.L., Mears, J.G., Spence, S., Starkman,
D., and Bank, A. (1979) Nucl. Acids Res. 7, 1147-1162.21. Rosenzweig, J.L., Havrankava, J., Lesnick, M.A., Brownstein,
M., and Roth, J. (1980) Proc. Natl. Acad. Sci. USA 77,572-576.
22. Eng, J. and Yalow, R.S. (1981) Proc. Natl. Acad. Sci. USA78, 4576-4578.
23. Bell, G.I., Karam, J.H. and Rutter, W.J. (1981) Proc. Natl.Acad. Sci. USA 78, 5759-5763.
24. Mears, J.G., Ramirez, F., Leibowitz, D., and Bank, A. (1978)Cell 15, 15-23.
25. Dean, A., Ley, T., Humphries, R.K., Fordis, M. and Schechter,A.N. (1982) Blood 60, 52a (abstract).
26. Miller, D.M., Turner, P., Nienhuis, A.W., Axelrod, D.E., andGopalakrishnan, T.V. (1978) Cell 14, 511-521.
27. Alter, B.P. (1979) Blood 54, 1158-1163.28. Alter, B.P. and Goff, S.C. (1980) Biochem. Biophys. Res.
Comm. 94, 843-848.29. Shen, S., Slightom, J.L., and Smithies, O. (1981) Cell 26,
191-203.30. Marks, P.A. and Rifkind, R.A. (1978) Ann. Rev. Biochem. 47,
419-448.31. Mazur, E.M., Murnane, M.J., and Benz, E.J. (1982) Blood 59,
738-746.32. Lachman, H.M., Schaefer, K.E., and Mears, J.G. (1982) Clin.
Res. 30, 321a.
6077
Downloaded from https://academic.oup.com/nar/article-abstract/11/17/6065/1098825by gueston 11 February 2018