Dispersion measurements of a 1.3μm quantum dot ... · Dispersion measurements of a 1.3μm quantum...
4
Dispersion measurements of a 1.3μm quantum dot semiconductor optical amplifier over 120 nm of spectral bandwidth M. Bagnell, J. Davila-Rodriguez, A. Ardey, and P. J. Delfyett Citation: Appl. Phys. Lett. 96, 211907 (2010); doi: 10.1063/1.3430742 View online: http://dx.doi.org/10.1063/1.3430742 View Table of Contents: http://apl.aip.org/resource/1/APPLAB/v96/i21 Published by the American Institute of Physics. Related Articles Phase and coherence extraction from a phased vertical cavity laser array Appl. Phys. Lett. 101, 031116 (2012) Direct generation of optical vortex pulses Appl. Phys. Lett. 101, 031113 (2012) Self-organized InAs/InGaAsP quantum dot tube lasers Appl. Phys. Lett. 101, 031104 (2012) Directional whispering gallery mode emission from Limaçon-shaped electrically pumped quantum dot micropillar lasers Appl. Phys. Lett. 101, 021116 (2012) Semiconductor lasers driven by self-sustained chaotic electronic oscillators and applications to optical chaos cryptography Chaos 22, 033108 (2012) Additional information on Appl. Phys. Lett. Journal Homepage: http://apl.aip.org/ Journal Information: http://apl.aip.org/about/about_the_journal Top downloads: http://apl.aip.org/features/most_downloaded Information for Authors: http://apl.aip.org/authors Downloaded 20 Jul 2012 to 132.170.95.49. Redistribution subject to AIP license or copyright; see http://apl.aip.org/about/rights_and_permissions
Transcript of Dispersion measurements of a 1.3μm quantum dot ... · Dispersion measurements of a 1.3μm quantum...

Dispersion measurements of a 1.3μm quantum dot semiconductor opticalamplifier over 120 nm of spectral bandwidthM. Bagnell, J. Davila-Rodriguez, A. Ardey, and P. J. Delfyett Citation: Appl. Phys. Lett. 96, 211907 (2010); doi: 10.1063/1.3430742 View online: http://dx.doi.org/10.1063/1.3430742 View Table of Contents: http://apl.aip.org/resource/1/APPLAB/v96/i21 Published by the American Institute of Physics. Related ArticlesPhase and coherence extraction from a phased vertical cavity laser array Appl. Phys. Lett. 101, 031116 (2012) Direct generation of optical vortex pulses Appl. Phys. Lett. 101, 031113 (2012) Self-organized InAs/InGaAsP quantum dot tube lasers Appl. Phys. Lett. 101, 031104 (2012) Directional whispering gallery mode emission from Limaçon-shaped electrically pumped quantum dot micropillarlasers Appl. Phys. Lett. 101, 021116 (2012) Semiconductor lasers driven by self-sustained chaotic electronic oscillators and applications to optical chaoscryptography Chaos 22, 033108 (2012) Additional information on Appl. Phys. Lett.Journal Homepage: http://apl.aip.org/ Journal Information: http://apl.aip.org/about/about_the_journal Top downloads: http://apl.aip.org/features/most_downloaded Information for Authors: http://apl.aip.org/authors
Downloaded 20 Jul 2012 to 132.170.95.49. Redistribution subject to AIP license or copyright; see http://apl.aip.org/about/rights_and_permissions
Dispersion measurements of a 1.3 �m quantum dot semiconductor opticalamplifier over 120 nm of spectral bandwidth
M. Bagnell,a� J. Davila-Rodriguez, A. Ardey, and P. J. Delfyettb�
CREOL, The College of Optics and Photonics, University of Central Florida, Orlando, Florida 32816, USA
�Received 2 March 2010; accepted 27 April 2010; published online 27 May 2010�
Group delay and higher order dispersion measurements are conducted on a 1.3 �m quantum dotsemiconductor optical amplifier at various injection currents. White-light spectral interferometry isperformed, along with a wavelet transform to recover the group delay. The group delay, groupvelocity dispersion, and higher order dispersion terms are quantified. The measurement spans bothground state and first excited state transitions, ranging from 1200 to 1320 nm. The group velocitydispersion, �2, is found to be −6.3�103 fs2 �7.6 fs/nm� at an injection current of 500 mA. © 2010American Institute of Physics. �doi:10.1063/1.3430742�
Semiconductor quantum dot materials have gained wide-spread attention for use as sources in mode-locked lasers.Large gain bandwidth, wide variability of linewidth enhance-ment factor, low chirp, relatively low sensitivity to tempera-ture fluctuation, and high modulation bandwidth have beencited as advantages over quantum well devices.1 Their largegain bandwidth, which can be greater than 15 THz, is espe-cially attractive for the generation of broad mode-locked la-ser spectra, with the potential for transform limited pulsewidths of less than 100 fs. This capability is attractive formany applications including high speed communication andsignal processing.2
Semiconductor optical amplifier �SOA� gain is con-trolled by current injection, which also results in a change inthe carrier concentration in the active region. The complexindex of refraction of a medium is known to be dependent onthe carrier concentration in the medium. Therefore, changingthe gain in a laser cavity changes the mode spacing of amode-locked laser. As the SOA gain is often one of the keyelements determining both the static and dynamic dispersionof a mode-locked laser, it is important to have a clear under-standing of the dependence of the dispersion and its higherorder terms on injection current. This information can beused in determining the proper dispersion compensationtechniques for broad bandwidth mode-locked laser sources.
A Taylor expansion of the propagation constant, �, pro-vides a set of coefficients which is used to quantify the dis-persive properties of the SOA. ���� is related to the spectralphase by the following:
���� =����
L=
�/c · n���L
, �1�
where ���� is the spectral phase, L is the length of themedium, and n is the frequency dependent refractive index.Taking the first derivative yields the following:
d�/d� =d�/d�
L. �2�
This is the group delay over the length of the device, thequantity measured in this work. The expansion of � is
� = �0 + �1�� − �0� +1
2!�2�� − �0�2 +
1
3!�3�� − �0�3
+ . . . , �3�
and its derivative is
d�
d�= �1 + �2�� − �0� +
1
2!�3�� − �0�2 + . . . , �4�
where the first term is constant in frequency, representing thepath length difference of the interferometer arms. By fittingthe acquired group delay curve to Eq. �4�, the group velocitydispersion, �2, and higher order dispersion terms are deter-mined.
White-light interferometry has been used for dispersioncharacterization of a wide variety of materials.3–5 The tech-nique uses a Michelson or Mach–Zehnder style interferom-eter with a broadband light source �Fig. 1�. The light is di-vided into a reference beam and another which passesthrough the device under test. The beams are recombined andthe spectral phase is determined by the interference of thebeams. Interference can be measured either temporally, witha movable mirror and single photodetector or spectrally, bykeeping the relative path length difference static, and spa-tially separating and detecting spectral components with aspectrometer. The static version, used here, has no movingparts and is preferable under the condition that a spectrom-eter with sufficient resolution is available.
The interference spectrum, shown in Fig. 2, has sinu-soidal fringes which vary in periodicity due to the differentphase delays arising from a frequency dependent refractive
a�Electronic mail: [email protected]�Electronic mail: [email protected].
FIG. 1. �Color online� Mach–Zehnder style, spectral interferometer experi-mental setup; SOA, semiconductor optical amplifier; DUT, device undertest; BS, beam splitter; L, coupling lens; M, mirror; VOD, variable opticaldelay; and OSA, optical spectrum analyzer.
APPLIED PHYSICS LETTERS 96, 211907 �2010�
0003-6951/2010/96�21�/211907/3/$30.00 © 2010 American Institute of Physics96, 211907-1
Downloaded 20 Jul 2012 to 132.170.95.49. Redistribution subject to AIP license or copyright; see http://apl.aip.org/about/rights_and_permissions
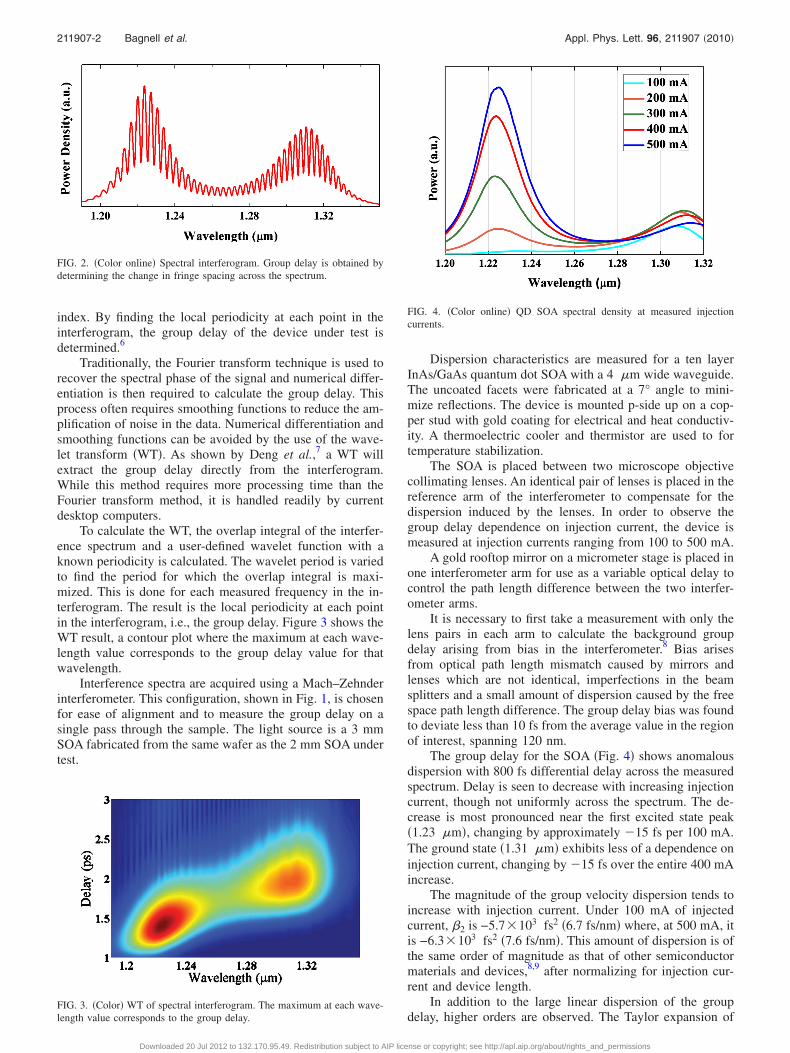
index. By finding the local periodicity at each point in theinterferogram, the group delay of the device under test isdetermined.6
Traditionally, the Fourier transform technique is used torecover the spectral phase of the signal and numerical differ-entiation is then required to calculate the group delay. Thisprocess often requires smoothing functions to reduce the am-plification of noise in the data. Numerical differentiation andsmoothing functions can be avoided by the use of the wave-let transform �WT�. As shown by Deng et al.,7 a WT willextract the group delay directly from the interferogram.While this method requires more processing time than theFourier transform method, it is handled readily by currentdesktop computers.
To calculate the WT, the overlap integral of the interfer-ence spectrum and a user-defined wavelet function with aknown periodicity is calculated. The wavelet period is variedto find the period for which the overlap integral is maxi-mized. This is done for each measured frequency in the in-terferogram. The result is the local periodicity at each pointin the interferogram, i.e., the group delay. Figure 3 shows theWT result, a contour plot where the maximum at each wave-length value corresponds to the group delay value for thatwavelength.
Interference spectra are acquired using a Mach–Zehnderinterferometer. This configuration, shown in Fig. 1, is chosenfor ease of alignment and to measure the group delay on asingle pass through the sample. The light source is a 3 mmSOA fabricated from the same wafer as the 2 mm SOA undertest.
Dispersion characteristics are measured for a ten layerInAs/GaAs quantum dot SOA with a 4 �m wide waveguide.The uncoated facets were fabricated at a 7° angle to mini-mize reflections. The device is mounted p-side up on a cop-per stud with gold coating for electrical and heat conductiv-ity. A thermoelectric cooler and thermistor are used to fortemperature stabilization.
The SOA is placed between two microscope objectivecollimating lenses. An identical pair of lenses is placed in thereference arm of the interferometer to compensate for thedispersion induced by the lenses. In order to observe thegroup delay dependence on injection current, the device ismeasured at injection currents ranging from 100 to 500 mA.
A gold rooftop mirror on a micrometer stage is placed inone interferometer arm for use as a variable optical delay tocontrol the path length difference between the two interfer-ometer arms.
It is necessary to first take a measurement with only thelens pairs in each arm to calculate the background groupdelay arising from bias in the interferometer.8 Bias arisesfrom optical path length mismatch caused by mirrors andlenses which are not identical, imperfections in the beamsplitters and a small amount of dispersion caused by the freespace path length difference. The group delay bias was foundto deviate less than 10 fs from the average value in the regionof interest, spanning 120 nm.
The group delay for the SOA �Fig. 4� shows anomalousdispersion with 800 fs differential delay across the measuredspectrum. Delay is seen to decrease with increasing injectioncurrent, though not uniformly across the spectrum. The de-crease is most pronounced near the first excited state peak�1.23 �m�, changing by approximately �15 fs per 100 mA.The ground state �1.31 �m� exhibits less of a dependence oninjection current, changing by �15 fs over the entire 400 mAincrease.
The magnitude of the group velocity dispersion tends toincrease with injection current. Under 100 mA of injectedcurrent, �2 is −5.7�103 fs2 �6.7 fs/nm� where, at 500 mA, itis −6.3�103 fs2 �7.6 fs/nm�. This amount of dispersion is ofthe same order of magnitude as that of other semiconductormaterials and devices,8,9 after normalizing for injection cur-rent and device length.
In addition to the large linear dispersion of the groupdelay, higher orders are observed. The Taylor expansion of
FIG. 2. �Color online� Spectral interferogram. Group delay is obtained bydetermining the change in fringe spacing across the spectrum.
FIG. 3. �Color� WT of spectral interferogram. The maximum at each wave-length value corresponds to the group delay.
FIG. 4. �Color online� QD SOA spectral density at measured injectioncurrents.
211907-2 Bagnell et al. Appl. Phys. Lett. 96, 211907 �2010�
Downloaded 20 Jul 2012 to 132.170.95.49. Redistribution subject to AIP license or copyright; see http://apl.aip.org/about/rights_and_permissions
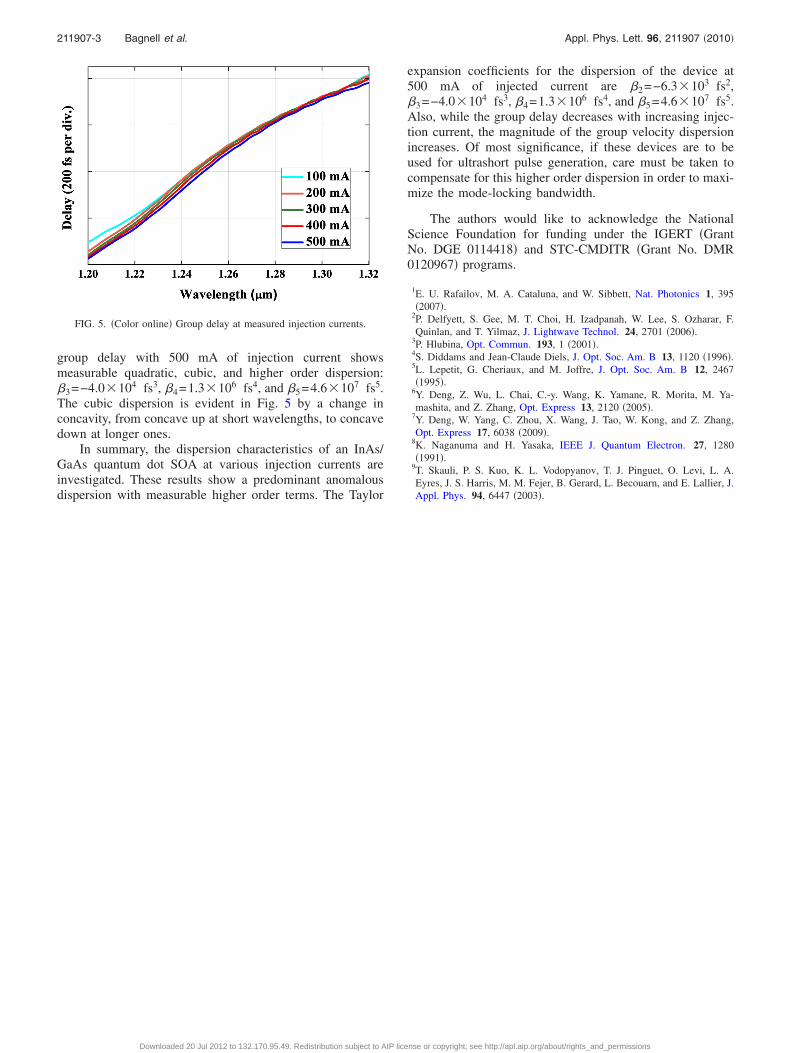
group delay with 500 mA of injection current showsmeasurable quadratic, cubic, and higher order dispersion:�3=−4.0�104 fs3, �4=1.3�106 fs4, and �5=4.6�107 fs5.The cubic dispersion is evident in Fig. 5 by a change inconcavity, from concave up at short wavelengths, to concavedown at longer ones.
In summary, the dispersion characteristics of an InAs/GaAs quantum dot SOA at various injection currents areinvestigated. These results show a predominant anomalousdispersion with measurable higher order terms. The Taylor
expansion coefficients for the dispersion of the device at500 mA of injected current are �2=−6.3�103 fs2,�3=−4.0�104 fs3, �4=1.3�106 fs4, and �5=4.6�107 fs5.Also, while the group delay decreases with increasing injec-tion current, the magnitude of the group velocity dispersionincreases. Of most significance, if these devices are to beused for ultrashort pulse generation, care must be taken tocompensate for this higher order dispersion in order to maxi-mize the mode-locking bandwidth.
The authors would like to acknowledge the NationalScience Foundation for funding under the IGERT �GrantNo. DGE 0114418� and STC-CMDITR �Grant No. DMR0120967� programs.
1E. U. Rafailov, M. A. Cataluna, and W. Sibbett, Nat. Photonics 1, 395�2007�.
2P. Delfyett, S. Gee, M. T. Choi, H. Izadpanah, W. Lee, S. Ozharar, F.Quinlan, and T. Yilmaz, J. Lightwave Technol. 24, 2701 �2006�.
3P. Hlubina, Opt. Commun. 193, 1 �2001�.4S. Diddams and Jean-Claude Diels, J. Opt. Soc. Am. B 13, 1120 �1996�.5L. Lepetit, G. Cheriaux, and M. Joffre, J. Opt. Soc. Am. B 12, 2467�1995�.
6Y. Deng, Z. Wu, L. Chai, C.-y. Wang, K. Yamane, R. Morita, M. Ya-mashita, and Z. Zhang, Opt. Express 13, 2120 �2005�.
7Y. Deng, W. Yang, C. Zhou, X. Wang, J. Tao, W. Kong, and Z. Zhang,Opt. Express 17, 6038 �2009�.
8K. Naganuma and H. Yasaka, IEEE J. Quantum Electron. 27, 1280�1991�.
9T. Skauli, P. S. Kuo, K. L. Vodopyanov, T. J. Pinguet, O. Levi, L. A.Eyres, J. S. Harris, M. M. Fejer, B. Gerard, L. Becouarn, and E. Lallier, J.Appl. Phys. 94, 6447 �2003�.
FIG. 5. �Color online� Group delay at measured injection currents.
211907-3 Bagnell et al. Appl. Phys. Lett. 96, 211907 �2010�
Downloaded 20 Jul 2012 to 132.170.95.49. Redistribution subject to AIP license or copyright; see http://apl.aip.org/about/rights_and_permissions