Discovery of multiple pulsations in a new δ Scuti star HD ...Discovery of multiple pulsations in a...
38
Discovery of multiple pulsations in a new δ Scuti star HD 92277: asteroseismology from Dome A, Antarctica Weikai Zong 1,2,3 1. Department of Astronomy, Beijing Normal University, Beijing 100875, China 2. Universit´ e de Toulouse, UPS-OMP, IRAP, Toulouse F-31400, France 3. CNRS, IRAP, 14 av. E. Belin, F-31400 Toulouse, France Jian-Ning Fu 1,4,† 4. Visiting astronomer at Xinjiang Astronomical Observatory, Chinese Academy of Science, Urumqi 830011, China † Corresponding author: [email protected] Jia-Shu Niu 1 S. Charpinet 2,3 G. Vauclair 2,3 Michael C. B. Ashley 5 5. School of Physics, University of New South Wales, NSW 2052, Australia Xiangqun Cui 6 6. Nanjing Institute of Astronomical Optics and Technology, Nanjing 210042, China Longlong Feng 7 7. Purple Mountain Observatory, Chinese Academy of Sciences, Nanjing 210008, China Xuefei Gong 6 Jon S. Lawrence 5,8 8. Australian Astronomical Observatory, NSW 1710, Australia
Transcript of Discovery of multiple pulsations in a new δ Scuti star HD ...Discovery of multiple pulsations in a...
Discovery of multiple pulsations in a new δ Scuti star HD 92277:
asteroseismology from Dome A, Antarctica
Weikai Zong1,2,3
1. Department of Astronomy, Beijing Normal University, Beijing 100875, China
2. Universite de Toulouse, UPS-OMP, IRAP, Toulouse F-31400, France
3. CNRS, IRAP, 14 av. E. Belin, F-31400 Toulouse, France
Jian-Ning Fu1,4,†
4. Visiting astronomer at Xinjiang Astronomical Observatory, Chinese Academy of
Science, Urumqi 830011, China
† Corresponding author: [email protected]
Jia-Shu Niu1
S. Charpinet2,3
G. Vauclair2,3
Michael C. B. Ashley5
5. School of Physics, University of New South Wales, NSW 2052, Australia
Xiangqun Cui6
6. Nanjing Institute of Astronomical Optics and Technology, Nanjing 210042, China
Longlong Feng7
7. Purple Mountain Observatory, Chinese Academy of Sciences, Nanjing 210008, China
Xuefei Gong6
Jon S. Lawrence5,8
8. Australian Astronomical Observatory, NSW 1710, Australia
– 2 –
Daniel Luong-Van5
Qiang Liu9
9. National Astronomical Observatories, Chinese Academy of Sciences, Beijing 100012,
China
Carl R. Pennypacker10
10. Center for Astrophysics, Lawrence Berkeley National Laboratory, Berkeley, CA, USA
Lingzhi Wang9
Lifan Wang7,11
11. Department of Physics & Astronomy, Texas A&M University, College Station, TX
77843, USA
Xiangyan Yuan7,12
12. Chinese Center for Antarctic Astronomy, Nanjing 210008, China
Donald G. York13
13. Department of Astronomy and Astrophysics and Enrico Fermi Institute, University of
Chicago, Chicago, IL 60637, USA
Xu Zhou9
Zhenxi Zhu7
Zonghong Zhu1
Received ; accepted
– 3 –
ABSTRACT
We report the discovery of low amplitude oscillations in the star HD 92277
from long, continuous observations in the r and g-bands using the CSTAR tele-
scopes in Antarctica. A total of more than 1,950 hours of high quality light curves
were used to categorize HD 92277 as a new member of the δ Scuti class. We have
detected 21 (20 frequencies are independent and one is the linear combination)
and 14 (13 frequencies are independent and one is the linear combination) pul-
sation frequencies in the r and g-bands, respectively, indicating a multi-periodic
pulsation behaviour. The primary frequency f1 = 10.810 d−1, corresponds to a
period of 0.0925 d, and is an l = 1 mode. We estimate a B−V index of 0.39 and
derive an effective temperature of 6800K for HD 92277. We conclude that long,
continuous and uninterrupted time-series photometry can be performed from
Dome A, Antarctica, and that this is especially valuable for asteroseismology
where multi-color observations (often not available from space-based telescopes)
assist with mode identification.
Subject headings: techniques: photometric – stars: variables (δ Scuti) – stars:
individual (HD 92277)
– 4 –
1. Introduction
Asteroseismology is a powerful method to probe the interior of pulsating stars.
Different oscillation modes penetrate to different depths inside the pulsating stars, providing
important information about their otherwise unobservable interiors. To detect as many
oscillation modes as possible, astronomers have employed telescope networks in temperate
sites around the earth to obtain long periods of continuous photometric data without diurnal
aliasing. Examples of such networks include the “Whole Earth Telescope” (WET, Nather
et al. 1990), the “STEllar PHotometry International” (STEPHI, Michel et al. 1992) and
the “Global Oscillation Network Group” (GONG, Harvey et al. 1996). In this new century,
two possibilities have emerged for uninterrupted time-series photometry. The first one is
using space telescopes such as MOST (Matthews 2007), CoRoT (e.g., Baglin et al. 2006)
and Kepler (Borucki et al. 2010). While the main aim of the Kepler mission was to search
for exoplanets using the transit method, the resultant high precision photometric data are
suitable for studying variable stars, including pulsating stars, using asteroseismology. The
second possibility is conducting observations from polar sites where there is continuous
darkness for months, and many stars are circumpolar. Examples of studies where polar
sites have advantages include searching for exoplanets (e.g., Pont & Bouchy 2005; Deeg et
al. 2005), stellar rotation and activity (e.g., Strassmeier & Olah 2004), and asteroseismology
(e.g., Fossat 2005; Mosser & Aristidi 2007). The excellent atmospheric conditions above
the Antarctic plateau have triggered the enthusiasm of astronomers and astrophysicists
worldwide in recent decades (Ashley 2013, and references therein). For asteroseismology,
the main advantages of Antarctica are the high fraction of clear weather, the low noise from
atmospheric scintillation, the long periods of darkness, no diurnal aliasing, and low airmass
variations as a result of the extreme southern latitude.
In 2008, China established Kunlun Station, its first astronomical site in Antarctica, at
– 5 –
Dome A at longitude 77◦06′57′′ E, latitude 80◦25′08′′ S. It is the highest point on the high
Antarctic plateau with an elevation of 4013m. Dome A is expected to have astronomical
conditions similar to or better than those at Concordia Station at Dome C, based on their
topographic similarities and comparison of altitudes (Saunders et al. 2009). Dome C has a
median seeing of 0.23 arcsec at 500 nm—and correspondingly low scintillation noise—when
observations are made from above the turbulent boundary layer 33m above the ice
(Lawrence et al. 2004). The median boundary layer height at Dome A is 14m (Bonner et
al. 2010), making the free atmosphere more easily accessible than it is at Dome C. Dome
Fuji is another potentially excellent site on the Antarctic plateau (Okita et al. 2013).
The first-generation optical telescopes at Dome A were those of the Chinese Small
Telescope ARray (CSTAR, Liu & Yuan 2009) and were deployed in January 2008, supported
by the PLATO observatory (Lawrence et al. 2009; Yang et al. 2009). CSTAR consisted of
four co-mounted 14.5 cm telescopes pointed without tracking at the South Celestial Pole.
One telescope was unfiltered, the other three had fixed Sloan g, r, and i filters. CSTAR
collected data autonomously for four winters, with no humans on site. Various issues
resulted in CSTAR’s i-band telescope being the only one working at peak performance
and able to collect a mass of scientific data. With the first year’s data, Zou et al. (2010)
investigated the statistics of sky brightness and transparency, and Zhou et al. (2010a)
published a catalog of about 10,000 stars. Using the i-band data from 2008 and 2010,
Wang et al. (2011, 2013) reported observations of 222 variable stars, about four times the
number of variables known from previous surveys of this region. In January 2012 CSTAR
was replaced by the first of three second-generation Chinese Antarctic Survey Telescopes
(AST3, Yuan et al. 2010) at Kunlun Station, Dome A.
δ Scuti stars are variable stars of spectral type A or F with pulsation periods between
0.02 d and 0.25 d. They are situated either in the classical Cepheid instability strip on the
– 6 –
main sequence, or are moving towards the giant branch on the H-R diagram (Breger 2000).
Long and continuous photometric time series observations improve the frequency resolution,
enabling one to detect more closely-spaced pulsations. For example, Strassmeier et al.
(2008) investigated the low amplitude δ Scuti star V1034 Centauri using data collected
over 10.15 days in July 2007 with a duty cycle of 98% using the 25-cm sIRAIT telescope
at Dome C. They confirmed the known fundamental period of 0.2 d and detected 23 new
periods with a photometric precision of 3 and 4mmag in V and R, respectively, over a
period of 2.4 hours.
The CSTAR telescopes observed thousands of stars simultaneously in an excellent
stable atmosphere and with long time coverage. The photometric precision for bright
stars reached the few mmag range (Wang et al. 2011, 2013), similar to the results from
Dome C. One of the bright stars in CSTAR’s field-of-view (FOV, see Section 2), HD 92277
= HIP 49368 = CSTAR 55150 (α = 10h04m40.365s, δ = −88◦40′25.56′′, 2000.0, B − V =
0.375 (van Leeuwen 2007), B = 9.m49 and V = 9.m10 (Høg et al. 2000)), has a proper motion
of −21.64 ± 0.84 mas/yr in R. A., 14.22 ± 0.82 mas/yr in Dec. and a parallax of 2.12 ±
0.91 mas (van Leeuwen 2007). It is known to be a multiple-star system in the Constellation
Octans (Fabricius & Makarov 2000) and a white subgiant star with a spectral type of
F0IV/V (Houck & Cowley 1975). Up till now, it has not been classified as a variable star.
Using CSTAR data from 2009 we categorize this star as a δ Scuti variable, and have used it
to test the potential of asteroseismology at Dome A.
We present the analysis of data collected with two CSTAR telescopes, those with g
and r filters, obtained in the winter of 2009 from April to July for the newly discovered δ
Scuti star HD 92277. We describe the 2009 observations from CSTAR in Section 2 and the
data reduction process in Section 3. Section 4 reports the pulsation analysis while Section 5
presents discussion. In the last section, we give our summary, conclusions and prospects
– 7 –
for future work. It is shown that time-series photometry can be conducted very well from
Dome A, Antarctica, which has some potential for the field of asteroseismology.
2. Observations
CSTAR operated for four consecutive winters from January 2008. CSTAR is composed
of four identical 14.5 cm telescopes each of which has a FOV of 4.5× 4.5 deg2 on a common
mount, all pointed at a fixed position very near to the South Celestial Pole. Each telescope
is equipped with an ANDOR DV435 1K × 1K frame-transfer CCD, with 13µm pixels,
operating at ambient temperature. The frame-transfer CCD was chosen since it allowed
shutterless operation, which was a priority for the prototype instrument to avoid mechanical
failures, but also meant that bias and dark frames could not be taken. Three different fixed
filters (Sloan g, r, i) were mounted on three of the telescopes, while the fourth telescope
had no filter. Due to the deliberate lack of a tracking mount, the stars traced circles on
the CCD frames over a sidereal day, but only moved a small fraction of a pixel during
an exposure time, typically 20 s. There are no moving parts used in normal telescope
operations and there is not human attendant during the observing season. The CSTAR
telescopes worked at weather conditions of sky brightness below 10,000 ADU/pixel. A more
detailed description of CSTAR can be found in Zhou et al. (2010a) and Liu & Yuan (2009).
The two CSTAR telescopes equipped with the r and g filters collected a large amount
of valuable data. The observations in r -band began on February 2 and ended on July 30,
2009, while the observations in g-band covered the period March 7 to June 1, 2009. In
r-band, we obtained 536,383 images for a total exposure time of 2,348 hours, with exposure
times from 5 to 30 s. In g-band, we collected 231,310 images for a total exposure time of
968.7 hours, using the same exposure times. The number of images obtained and the total
exposure time per month are listed in Table 1. Table 2 gives the details of the exposure
– 8 –
time used during the observations in both bands for the 2009 Antarctic winter. The duty
cycle of our observations of HD 92277 in 2009 were 54% and 70% in the r and g-bands
respectively. The duty cycle defined here is the total integral exposure time of scientific
data over the whole exposure time in the Antarctic winter. The sky brightness in the two
bands was investigated by Zong et al. (2014), and the effect of airglow and aurorae on
observations at Dome A by Sims et al. (2012). The sky brightness (normal or auroral)
was never high enough or rapidly changing enough to adversely affect the measurements of
variability for the scientific data, due to the differential measurement technique described
in the next section.
3. Data reduction
3.1. Preliminary data reduction and photometry
Bias subtraction and flat-field correction were applied to the raw CCD images without
dark subtraction, which was negligible. The CCD was operated, without cooling Dewars,
at the ambient Dome A temperature around -80 ◦C over the whole Antarctic winter. Two
bias frames were acquired during the instrument test at Xinglong Station in China prior
to deployment to Antarctica. We combined two super-flats, one in each band, by taking
median frames of carefully selected samples of 320 and 267 images with relatively high sky
brightnesses, 7,000–7,600 ADU in g-band and 5,000–5,800 ADU in r -band, obtained from
March 20 to 22, and from March 15 to 22, 2009, respectively.
We used the images with 20 s exposure time for aperture photometry. In good weather
conditions, more than 6,000 stars up to 14.5mag and about 5,000 stars up to 14mag were
detected on each frame in r and g respectively. The telescopes were not perfectly focused,
which limited the number of stars, but probably improved our photometric accuracy due to
– 9 –
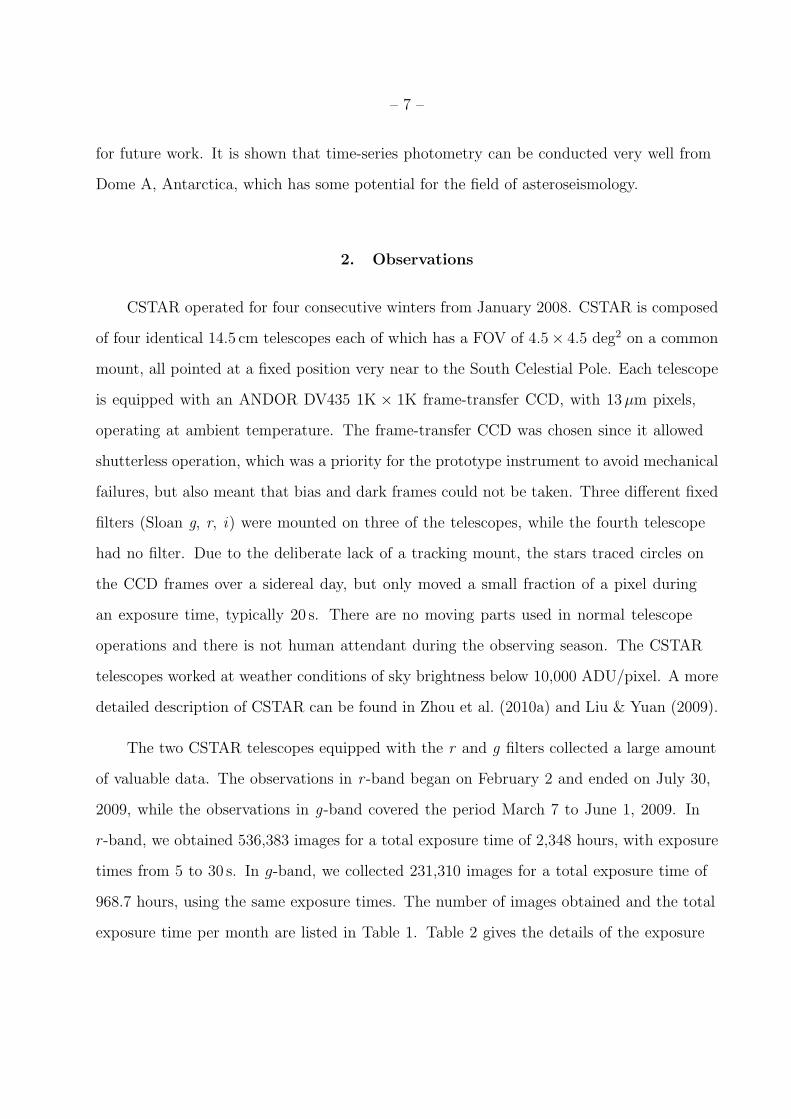
Table 1: Log of observations of CSTAR in 2009
Month # of images exposure time # of images exposure time
g-band [hr] r-band [hr]
Mar. 35843 50.7 94877 203.7
Apr. 105026 304.5 115408 334.6
May 106802 593.3 106646 592.5
June 3639 20.2 112446 624.7
July 106480 591.6
Total 251310 968.7 536383 2348.6
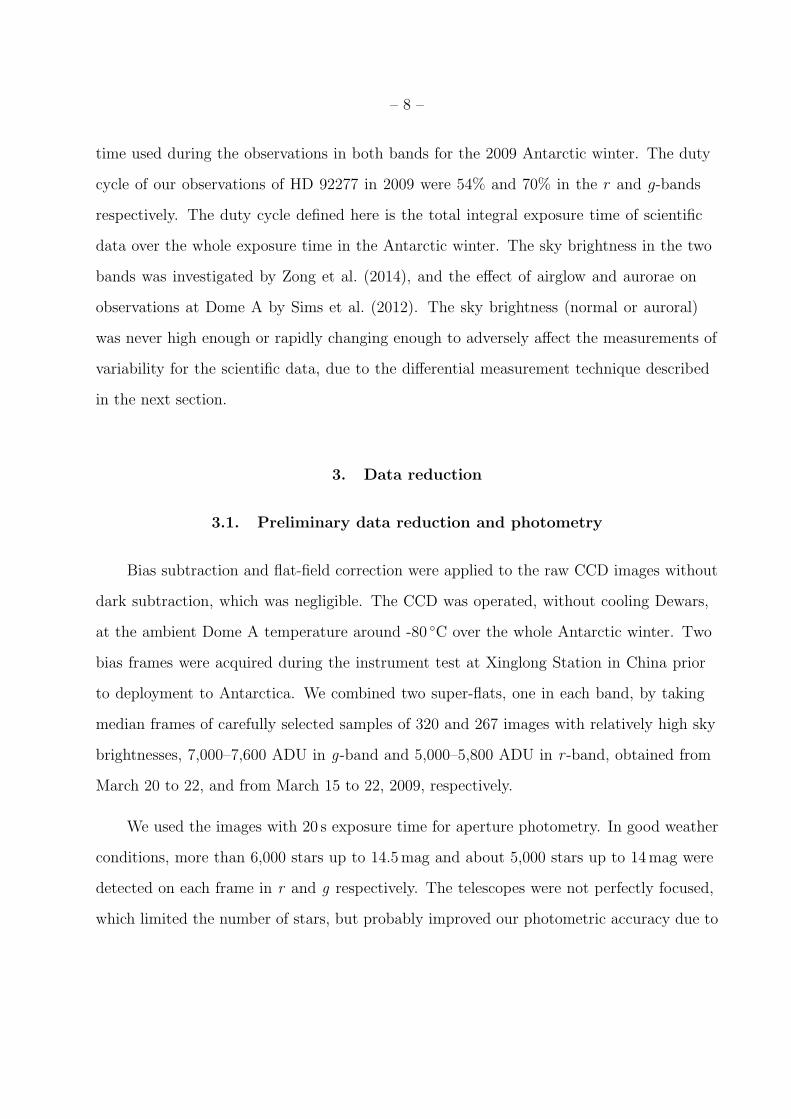
Table 2: Exposure time and number of images during the observations in 2009
Exp. g-band r-band
[s] Start End # of images Start End # of images
30 March 7 March 12 8
10 March 12 March 20 620 Feb. 2 March 20 53060
5 March 20 April 14 102170 March 20 April 14 115922
20 April 14 June 1 148512 April 14 July 30 367401
– 10 –
less influence from intrapixel sensitivity variations. The r frames with exposure time of 20 s
were discarded when the number of stars on these images totalled less than 2,000 when the
sky brightness was very low, as shown in both the g and r-band telescopes. Those discarded
images were collected from April 14 to 23, 2009. We presume that some technical problem
(perhaps icing on the telescope optics) had affected the r-band telescope during this period.
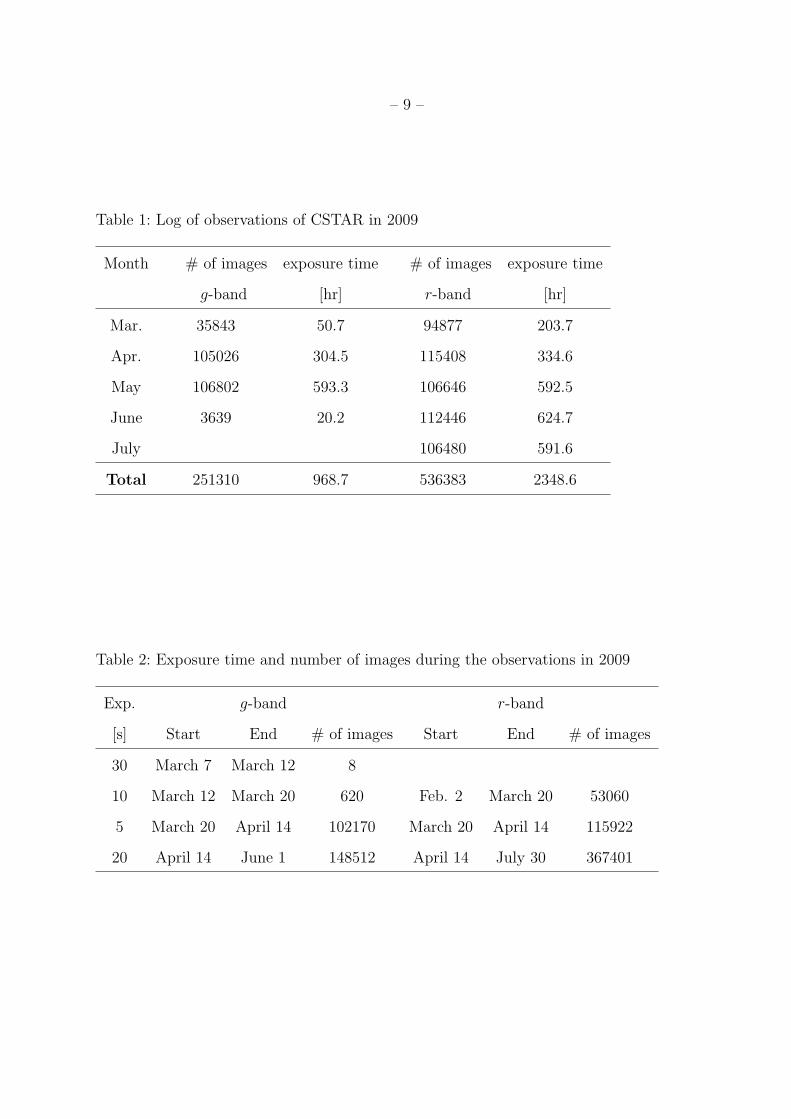
Table 3 lists the basic information of the comparison star HD 93426 and the two
check stars HD 98784 and HD 99685. After the initial reduction, the resulting 326,115 and
148,512 images in r-band and g-band underwent aperture photometry using the DAOPHOT
routine within IRAF1. About 99,000 abnormal data points in r-band and 35,000 in g-band
were discarded since these points were affected by either large atmospheric extinction, high
sky level, or contamination from satellite trails on the images. There were still a few data
points that differed significantly from the local standard deviation in the light curves. We
discarded these data points by applying a five-pass 3σ clipping filter using a 3rd order
polynomial fit to 100 nearby data points.
1IRAF is distributed by the National Optical Astronomy Observatory, which is oper-
ated by the Association of Universities for Research in Astronomy, Inc., under cooperative
agreement with the National Science Foundation.
Table 3: Basic properties of the comparison star and check stars
Object R.A. Decl. B V
(2000.0) (2000.0) [mag] [mag]
C=HD 93426 10h15m20.205s −88◦42′00.96′′ 10.97(6) 9.62(2)
CH1=HD 98784 08h58m34.424s −89◦49′52.42′′ 9.85(3) 8.75(1)
CH2=HD 99685 09h56m37.829s −89◦46′56.74′′ 7.93(-) 7.84(-)
– 11 –
3.2. Photometric and time calibration
3.2.1. Photometric calibration
We used the catalog of calibrated g,r,i,z magnitudes of Tycho stars (Ofek 2008) for
our photometric calibration, the same method used by Wang et al. (2011). The selected
stars in the range 7 < [g, r] < 12 mag and δ < −88◦ in Vizier2 were matched to objects on
the frames in good weather conditions recorded in the first quarter of May 17, 2009. Our
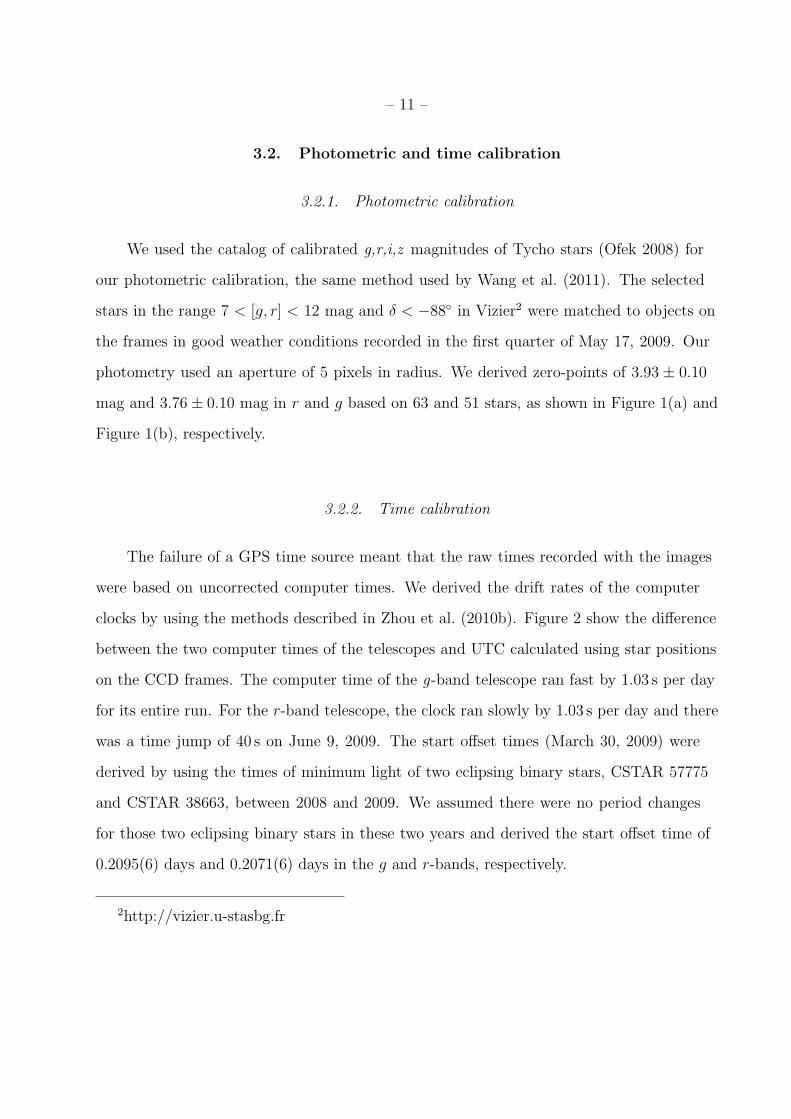
photometry used an aperture of 5 pixels in radius. We derived zero-points of 3.93 ± 0.10
mag and 3.76± 0.10 mag in r and g based on 63 and 51 stars, as shown in Figure 1(a) and
Figure 1(b), respectively.
3.2.2. Time calibration
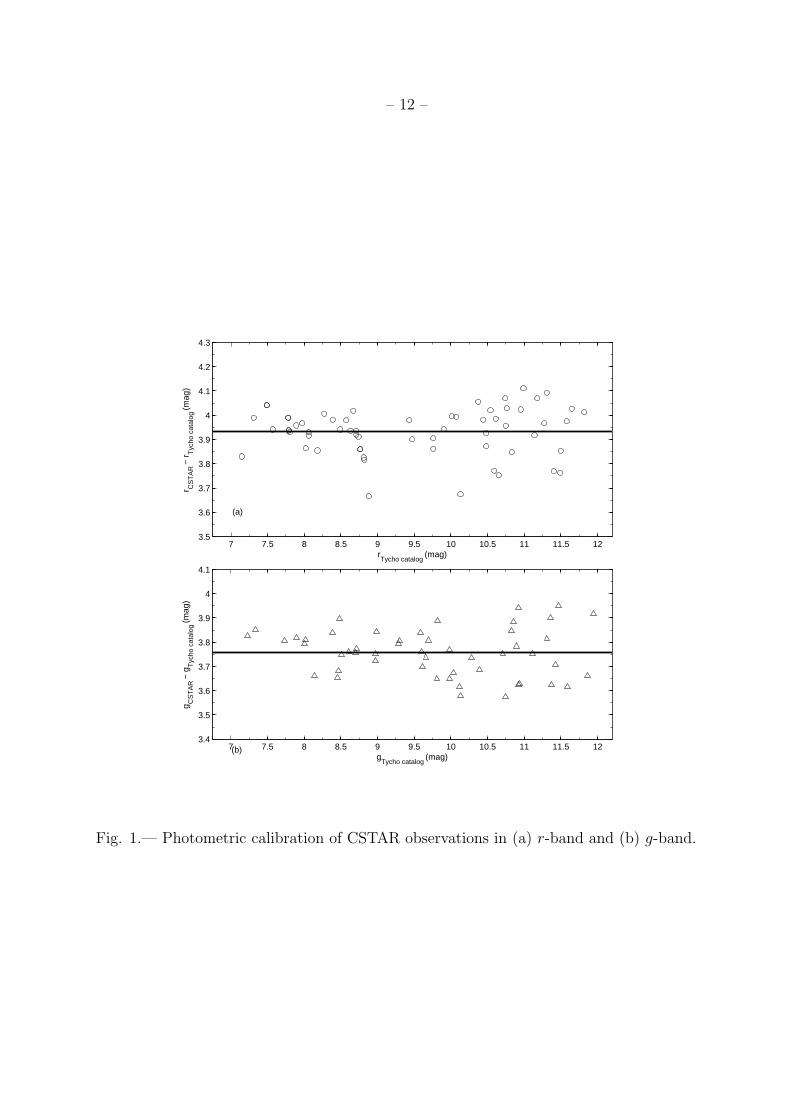
The failure of a GPS time source meant that the raw times recorded with the images
were based on uncorrected computer times. We derived the drift rates of the computer
clocks by using the methods described in Zhou et al. (2010b). Figure 2 show the difference
between the two computer times of the telescopes and UTC calculated using star positions
on the CCD frames. The computer time of the g-band telescope ran fast by 1.03 s per day
for its entire run. For the r-band telescope, the clock ran slowly by 1.03 s per day and there
was a time jump of 40 s on June 9, 2009. The start offset times (March 30, 2009) were
derived by using the times of minimum light of two eclipsing binary stars, CSTAR 57775
and CSTAR 38663, between 2008 and 2009. We assumed there were no period changes
for those two eclipsing binary stars in these two years and derived the start offset time of
0.2095(6) days and 0.2071(6) days in the g and r-bands, respectively.
2http://vizier.u-stasbg.fr
– 12 –
7 7.5 8 8.5 9 9.5 10 10.5 11 11.5 123.4
3.5
3.6
3.7
3.8
3.9
4
4.1
gTycho catalog
(mag)
g CS
TA
R −
gT
ycho
cat
alog
(m
ag)
7 7.5 8 8.5 9 9.5 10 10.5 11 11.5 123.5
3.6
3.7
3.8
3.9
4
4.1
4.2
4.3
rTycho catalog
(mag)
r CS
TA
R −
rT
ycho
cat
alog
(m
ag)
(a)
(b)
Fig. 1.— Photometric calibration of CSTAR observations in (a) r-band and (b) g-band.
– 13 –
Fig. 2.— The difference between computer time and UTC in (a) r-band and (b) g-band over
the period of observation. The spikes in time residuals are caused by bad weather or high
sky brightness. UTC was obtained from the star positions on the images, and the start time
offsets were deduced by using the method described in Section 3. 2. 2. Linear fits are plotted
as solid lines.
– 14 –
3.3. Time-series photometry
3.3.1. Photometric precision
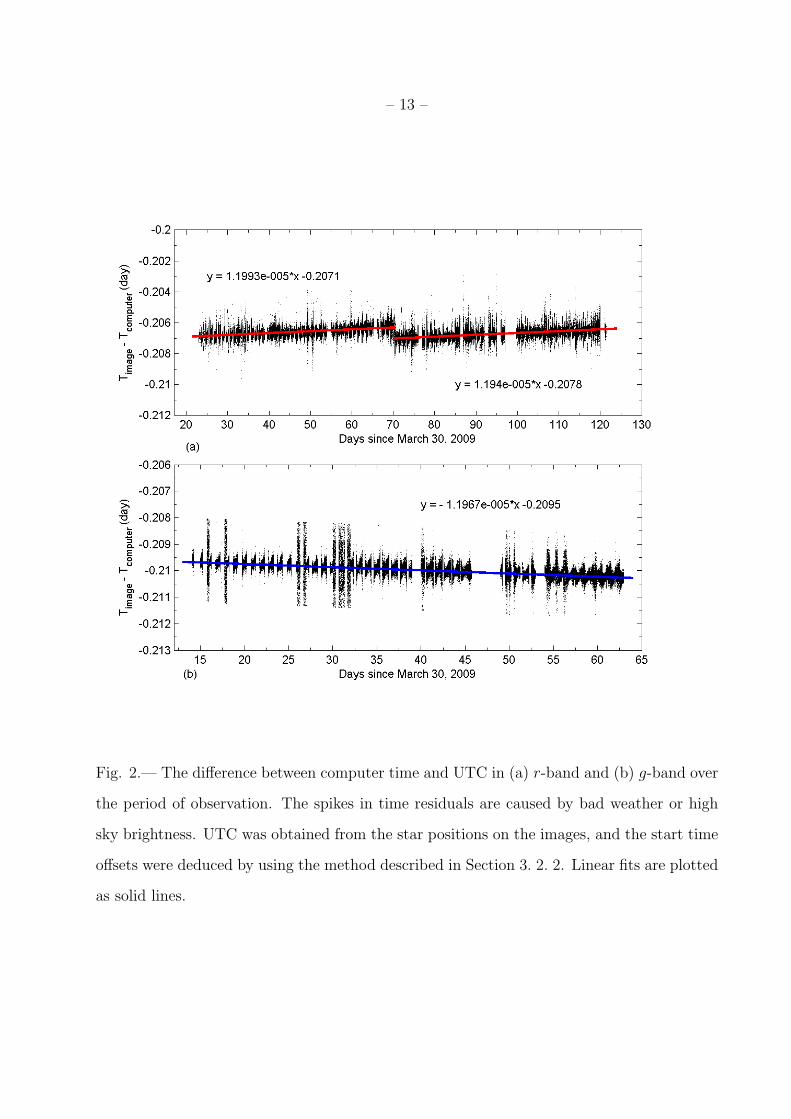
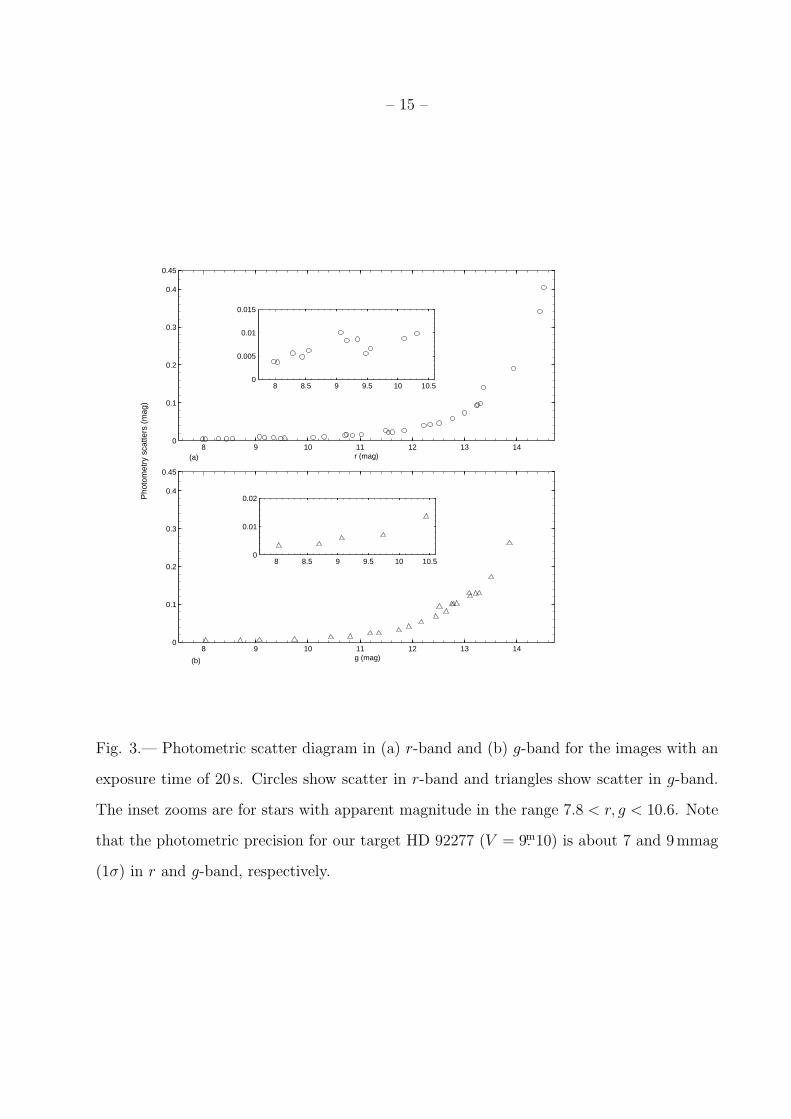
We conducted photometry in a series of apertures (radii of 2.5, 3.0, ..., 5.5 pixels).
The optimized aperture for the stars depended on their minimum photometric scatters
in magnitude. Figure 3 shows photometric scatters for the bright stars (< 10 mag) with
the optimized aperture over a period of 6 hours of the first quarter on May 17, 2009. As
can be seen from Figure 3, the system can be used to determine relative magnitudes with
a precision of several milli-mag on these short time scales. This enables one to study
pulsators with amplitudes from ∼0.01 to 0.1 mag, e.g., δ Scuti stars, β Cephei (Stankov &
Handler 2005) and γ Doradus (Kaye et al. 1999) variables. For stars with magnitudes in the
range 10 < [r, g] < 13, the photometric precision is 0.1mag or better, which is suitable for
studying pulsating variables such as high amplitude δ Scuti stars, Cepheids and RR Lyrae
stars. Stars with magnitudes [r, g] > 13 were observed with less precision, but, in principle,
longer term pulsations for such stars can be determined by averaging over many short
exposures.
3.3.2. HD 92277
The photometric scatter is typically 6 mmag in the best observation conditions for
our target HD 92277 in r-band, and near 8 mmag in g-band. Note that the comparison
star HD 93426 is nearly one mag fainter than the target HD 92277 in g-band while their
magnitudes are very similar in r-band.
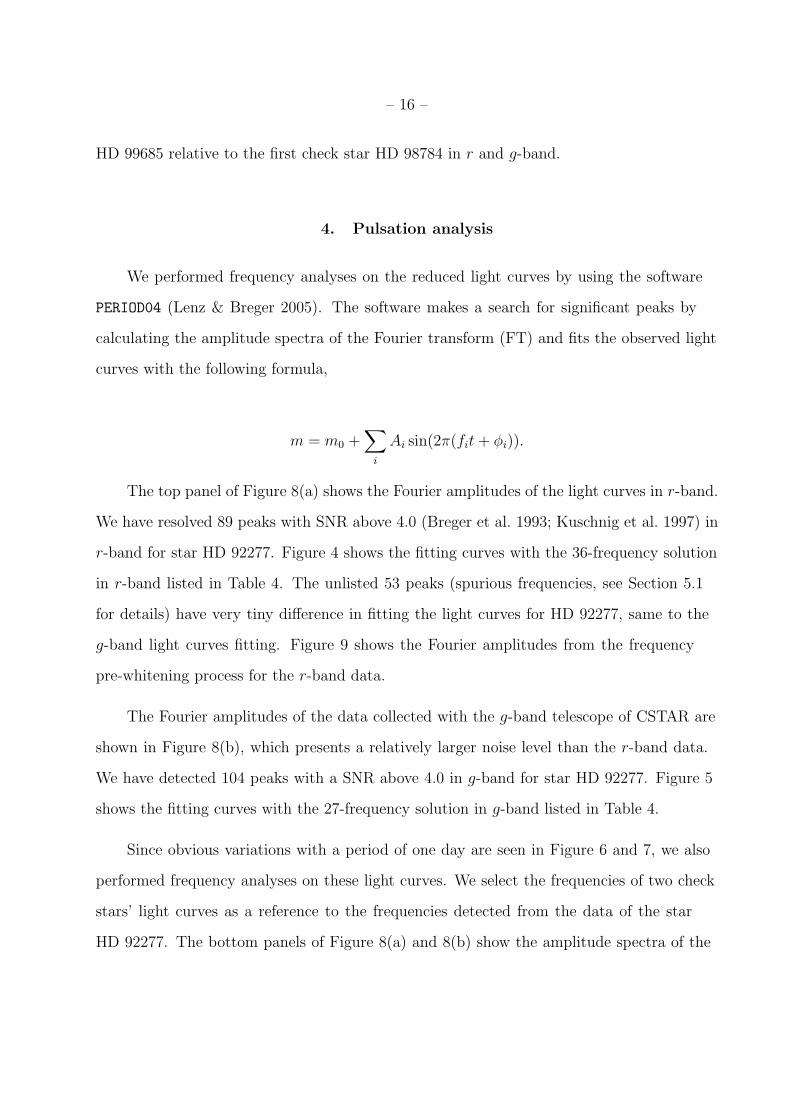
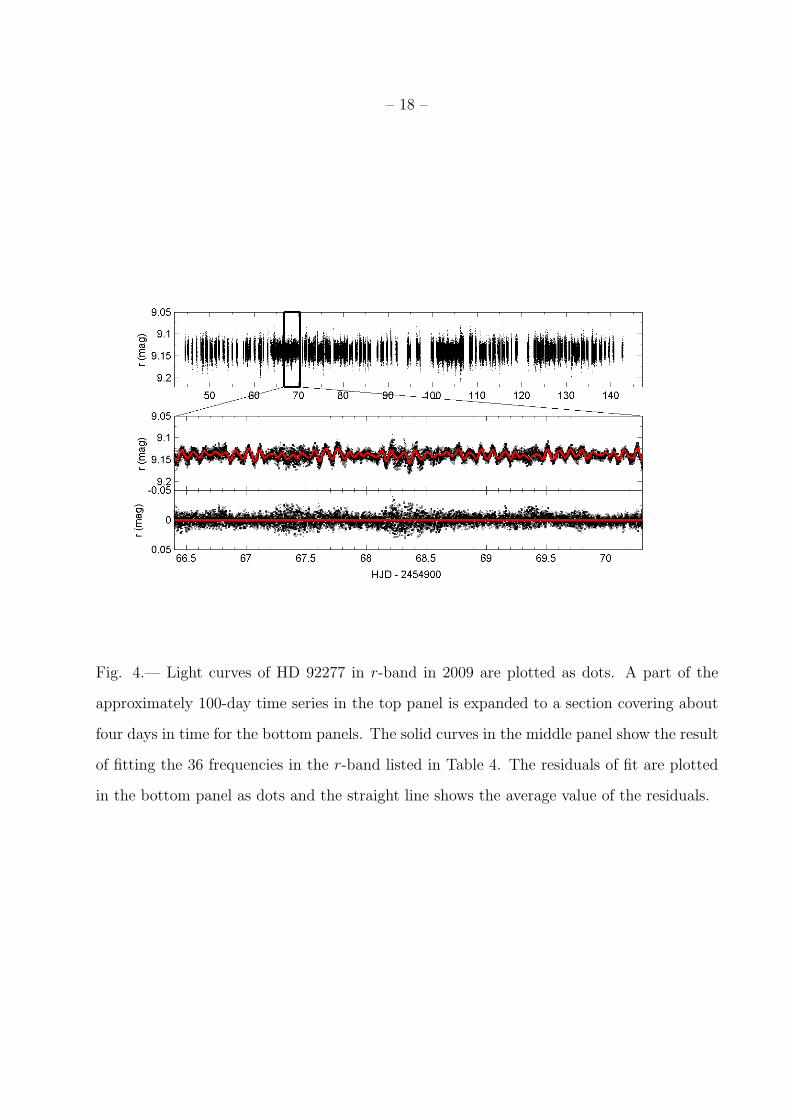
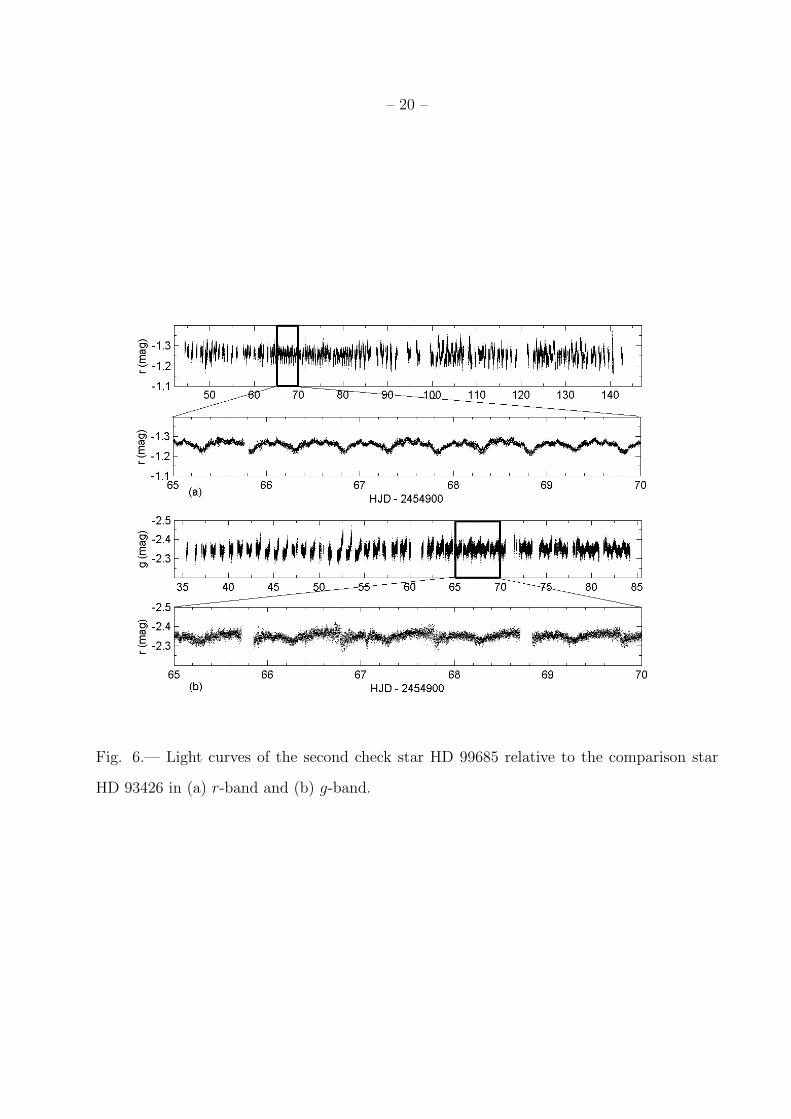
Figures 4 and 5 show the reduced light curves of HD 92277 in r and g-band, respectively.
The light curves of the second check star HD 99685 relative to the comparison star are
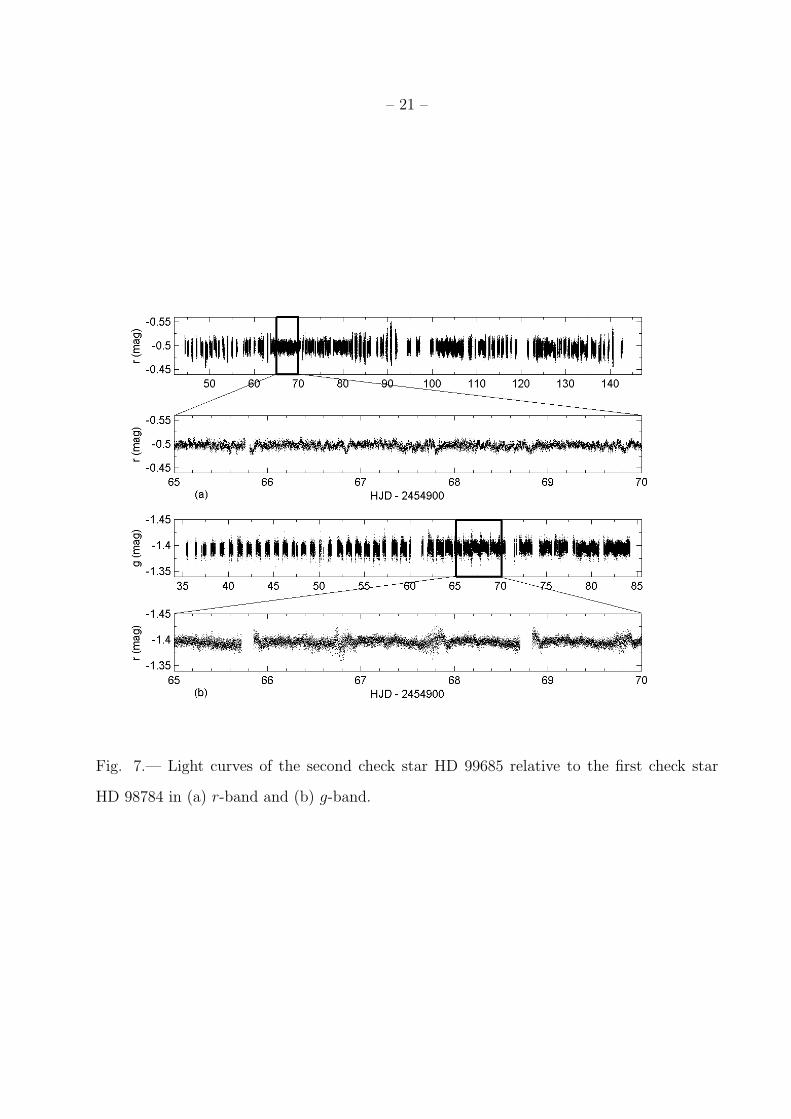
derived in r and g-band shown in Figure 6 (a) and (b). Figure 7 shows the light curves of
– 15 –
8 9 10 11 12 13 140
0.1
0.2
0.3
0.4
0.45
r (mag)
8 9 10 11 12 13 140
0.1
0.2
0.3
0.4
0.45
g (mag)
Pho
tom
etry
sca
tters
(m
ag)
8 8.5 9 9.5 10 10.50
0.005
0.01
0.015
8 8.5 9 9.5 10 10.50
0.01
0.02
(a)
(b)
Fig. 3.— Photometric scatter diagram in (a) r-band and (b) g-band for the images with an
exposure time of 20 s. Circles show scatter in r-band and triangles show scatter in g-band.
The inset zooms are for stars with apparent magnitude in the range 7.8 < r, g < 10.6. Note
that the photometric precision for our target HD 92277 (V = 9.m10) is about 7 and 9mmag
(1σ) in r and g-band, respectively.
– 16 –
HD 99685 relative to the first check star HD 98784 in r and g-band.
4. Pulsation analysis
We performed frequency analyses on the reduced light curves by using the software
PERIOD04 (Lenz & Breger 2005). The software makes a search for significant peaks by
calculating the amplitude spectra of the Fourier transform (FT) and fits the observed light
curves with the following formula,
m = m0 +∑
i
Ai sin(2π(fit+ φi)).
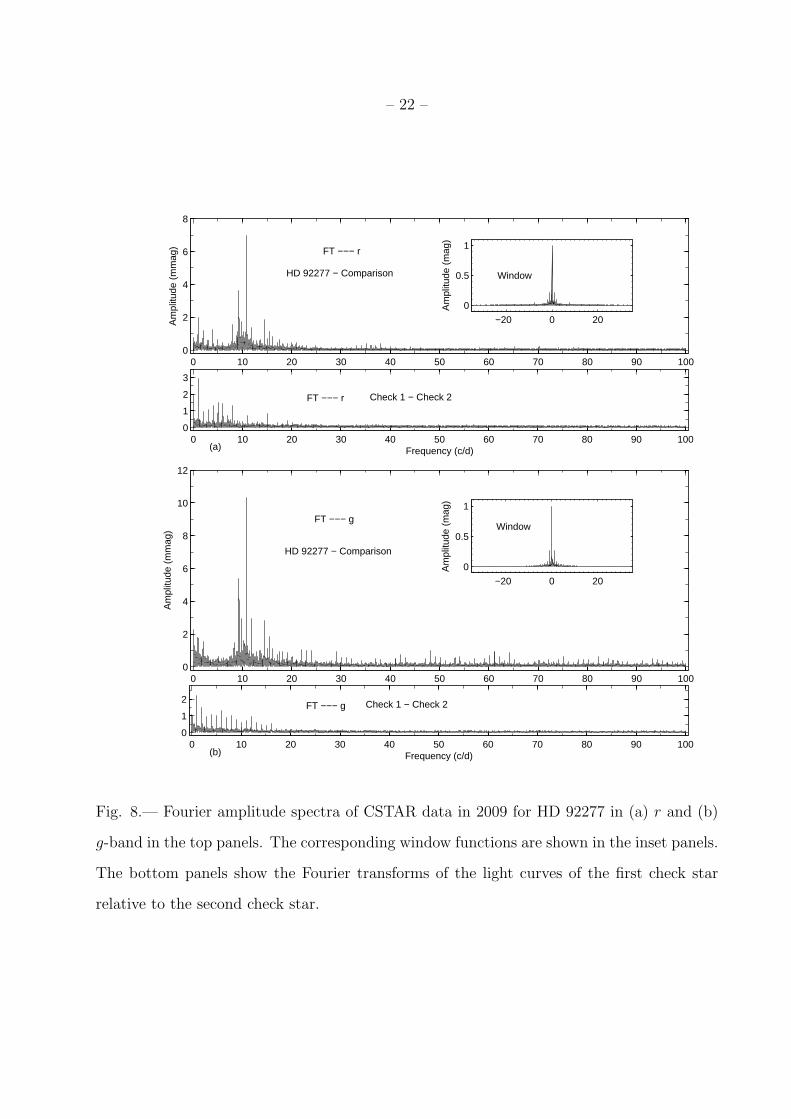
The top panel of Figure 8(a) shows the Fourier amplitudes of the light curves in r-band.
We have resolved 89 peaks with SNR above 4.0 (Breger et al. 1993; Kuschnig et al. 1997) in
r-band for star HD 92277. Figure 4 shows the fitting curves with the 36-frequency solution
in r-band listed in Table 4. The unlisted 53 peaks (spurious frequencies, see Section 5.1
for details) have very tiny difference in fitting the light curves for HD 92277, same to the
g-band light curves fitting. Figure 9 shows the Fourier amplitudes from the frequency
pre-whitening process for the r-band data.
The Fourier amplitudes of the data collected with the g-band telescope of CSTAR are
shown in Figure 8(b), which presents a relatively larger noise level than the r-band data.
We have detected 104 peaks with a SNR above 4.0 in g-band for star HD 92277. Figure 5
shows the fitting curves with the 27-frequency solution in g-band listed in Table 4.
Since obvious variations with a period of one day are seen in Figure 6 and 7, we also
performed frequency analyses on these light curves. We select the frequencies of two check
stars’ light curves as a reference to the frequencies detected from the data of the star
HD 92277. The bottom panels of Figure 8(a) and 8(b) show the amplitude spectra of the

– 17 –
check stars in r and g-band, respectively.
– 18 –
Fig. 4.— Light curves of HD 92277 in r-band in 2009 are plotted as dots. A part of the
approximately 100-day time series in the top panel is expanded to a section covering about
four days in time for the bottom panels. The solid curves in the middle panel show the result
of fitting the 36 frequencies in the r-band listed in Table 4. The residuals of fit are plotted
in the bottom panel as dots and the straight line shows the average value of the residuals.
– 19 –
35 40 45 50 55 60 65 70 75 80 85
9.25
9.3
9.35
9.4
g (m
ag)
66.5 67 67.5 68 68.5 69 69.5 70
9.25
9.3
9.35
9.4
g (m
ag)
66.5 67 67.5 68 68.5 69 69.5 70
−0.05
0
0.05
HJD − 2454900
O −
F (
mag
)
Fig. 5.— Light curves of HD 92277 in g-band in 2009 are plotted as dots. A part of the
approximately 50-day time series in the top panel is expanded to a section covering about
four days in time for the bottom panels. The solid curves in the middle panel show the result
of fitting the 27 frequencies in the g-band listed in Table 4. The residuals of fit are plotted
in the bottom panel as dots and the straight line shows the average value of the residuals.
– 20 –
Fig. 6.— Light curves of the second check star HD 99685 relative to the comparison star
HD 93426 in (a) r-band and (b) g-band.
– 21 –
Fig. 7.— Light curves of the second check star HD 99685 relative to the first check star
HD 98784 in (a) r-band and (b) g-band.
– 22 –
0 10 20 30 40 50 60 70 80 90 1000
2
4
6
8
Am
plitu
de (
mm
ag)
0 10 20 30 40 50 60 70 80 90 1000
1
2
3
Frequency (c/d)
−20 0 20
0
0.5
1
Am
plitu
de (
mag
)
0 10 20 30 40 50 60 70 80 90 1000
2
4
6
8
10
12
Am
plitu
de (
mm
ag)
0 10 20 30 40 50 60 70 80 90 1000
1
2
Frequency (c/d)
−20 0 20
0
0.5
1
Am
plitu
de (
mag
)
Window
(b)
(a)
FT −−− r
FT −−− g
Window
Check 1 − Check 2
HD 92277 − Comparison
Check 1 − Check 2
HD 92277 − Comparison
FT −−− r
FT −−− g
Fig. 8.— Fourier amplitude spectra of CSTAR data in 2009 for HD 92277 in (a) r and (b)
g-band in the top panels. The corresponding window functions are shown in the inset panels.
The bottom panels show the Fourier transforms of the light curves of the first check star
relative to the second check star.
– 23 –
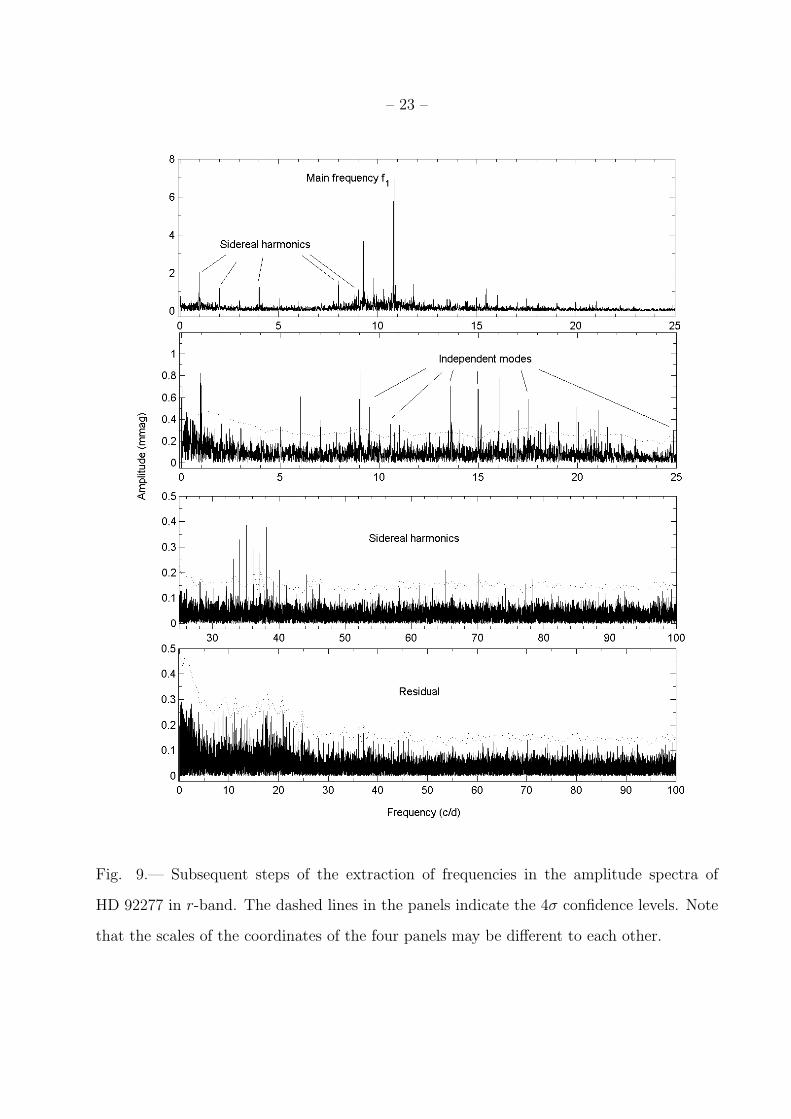
Fig. 9.— Subsequent steps of the extraction of frequencies in the amplitude spectra of
HD 92277 in r-band. The dashed lines in the panels indicate the 4σ confidence levels. Note
that the scales of the coordinates of the four panels may be different to each other.
– 24 –
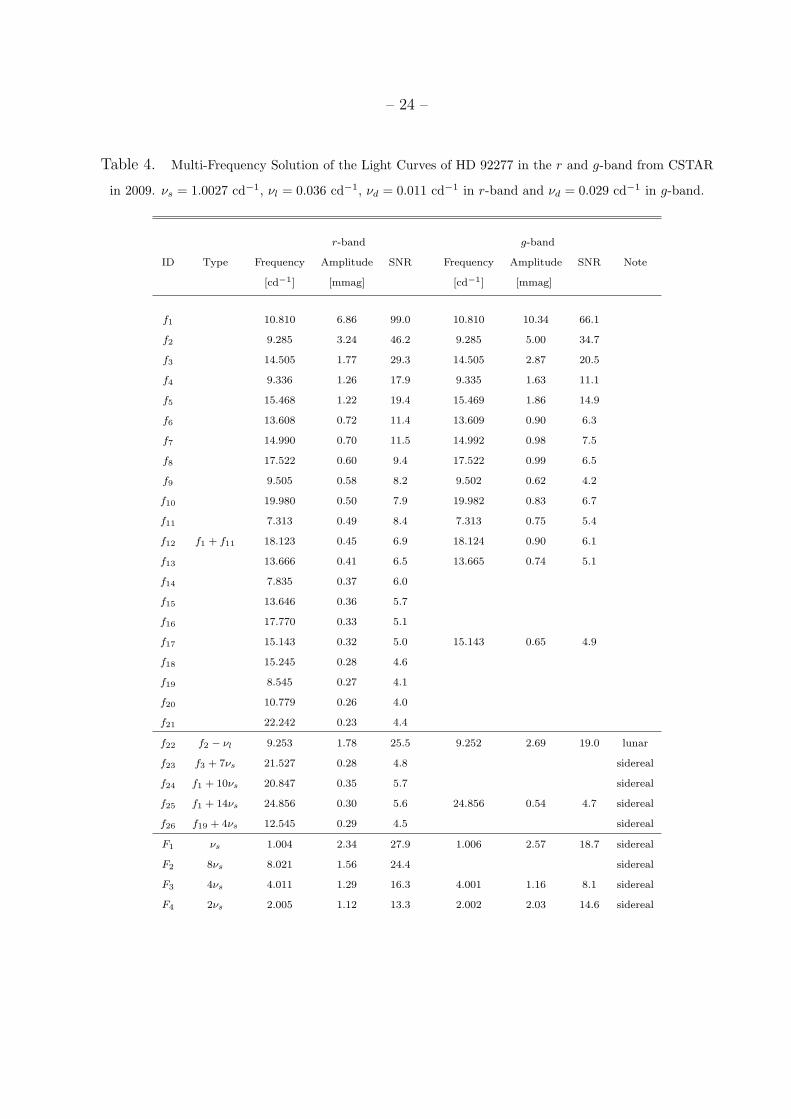
Table 4. Multi-Frequency Solution of the Light Curves of HD 92277 in the r and g-band from CSTAR
in 2009. νs = 1.0027 cd−1, νl = 0.036 cd−1, νd = 0.011 cd−1 in r-band and νd = 0.029 cd−1 in g-band.
r-band g-band
ID Type Frequency Amplitude SNR Frequency Amplitude SNR Note
[cd−1] [mmag] [cd−1] [mmag]
f1 10.810 6.86 99.0 10.810 10.34 66.1
f2 9.285 3.24 46.2 9.285 5.00 34.7
f3 14.505 1.77 29.3 14.505 2.87 20.5
f4 9.336 1.26 17.9 9.335 1.63 11.1
f5 15.468 1.22 19.4 15.469 1.86 14.9
f6 13.608 0.72 11.4 13.609 0.90 6.3
f7 14.990 0.70 11.5 14.992 0.98 7.5
f8 17.522 0.60 9.4 17.522 0.99 6.5
f9 9.505 0.58 8.2 9.502 0.62 4.2
f10 19.980 0.50 7.9 19.982 0.83 6.7
f11 7.313 0.49 8.4 7.313 0.75 5.4
f12 f1 + f11 18.123 0.45 6.9 18.124 0.90 6.1
f13 13.666 0.41 6.5 13.665 0.74 5.1
f14 7.835 0.37 6.0
f15 13.646 0.36 5.7
f16 17.770 0.33 5.1
f17 15.143 0.32 5.0 15.143 0.65 4.9
f18 15.245 0.28 4.6
f19 8.545 0.27 4.1
f20 10.779 0.26 4.0
f21 22.242 0.23 4.4
f22 f2 − νl 9.253 1.78 25.5 9.252 2.69 19.0 lunar
f23 f3 + 7νs 21.527 0.28 4.8 sidereal
f24 f1 + 10νs 20.847 0.35 5.7 sidereal
f25 f1 + 14νs 24.856 0.30 5.6 24.856 0.54 4.7 sidereal
f26 f19 + 4νs 12.545 0.29 4.5 sidereal
F1 νs 1.004 2.34 27.9 1.006 2.57 18.7 sidereal
F2 8νs 8.021 1.56 24.4 sidereal
F3 4νs 4.011 1.29 16.3 4.001 1.16 8.1 sidereal
F4 2νs 2.005 1.12 13.3 2.002 2.03 14.6 sidereal
– 25 –
5. Discussion
5.1. The pulsations
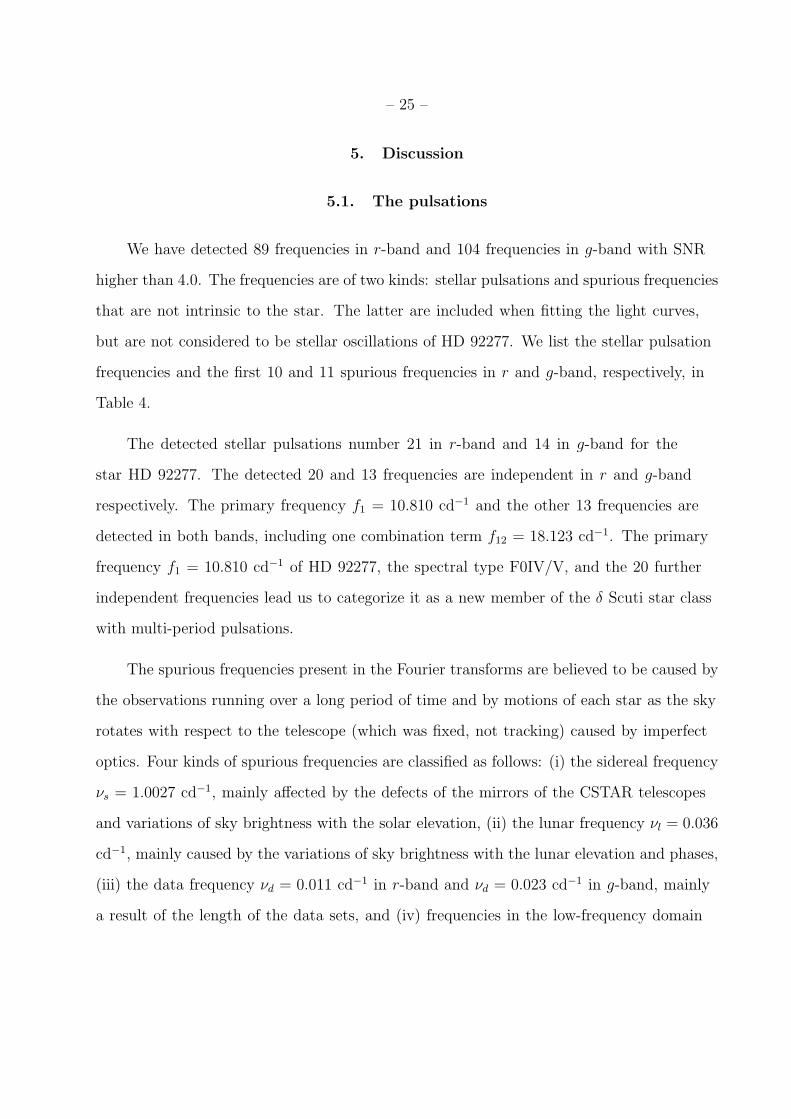
We have detected 89 frequencies in r-band and 104 frequencies in g-band with SNR
higher than 4.0. The frequencies are of two kinds: stellar pulsations and spurious frequencies
that are not intrinsic to the star. The latter are included when fitting the light curves,
but are not considered to be stellar oscillations of HD 92277. We list the stellar pulsation
frequencies and the first 10 and 11 spurious frequencies in r and g-band, respectively, in
Table 4.
The detected stellar pulsations number 21 in r-band and 14 in g-band for the
star HD 92277. The detected 20 and 13 frequencies are independent in r and g-band
respectively. The primary frequency f1 = 10.810 cd−1 and the other 13 frequencies are
detected in both bands, including one combination term f12 = 18.123 cd−1. The primary
frequency f1 = 10.810 cd−1 of HD 92277, the spectral type F0IV/V, and the 20 further
independent frequencies lead us to categorize it as a new member of the δ Scuti star class
with multi-period pulsations.
The spurious frequencies present in the Fourier transforms are believed to be caused by
the observations running over a long period of time and by motions of each star as the sky
rotates with respect to the telescope (which was fixed, not tracking) caused by imperfect
optics. Four kinds of spurious frequencies are classified as follows: (i) the sidereal frequency
νs = 1.0027 cd−1, mainly affected by the defects of the mirrors of the CSTAR telescopes
and variations of sky brightness with the solar elevation, (ii) the lunar frequency νl = 0.036
cd−1, mainly caused by the variations of sky brightness with the lunar elevation and phases,
(iii) the data frequency νd = 0.011 cd−1 in r-band and νd = 0.023 cd−1 in g-band, mainly
a result of the length of the data sets, and (iv) frequencies in the low-frequency domain
– 26 –
Table 4—Continued
r-band g-band
ID Type Frequency Amplitude SNR Frequency Amplitude SNR Note
[cd−1] [mmag] [cd−1] [mmag]
F5 9νs 9.020 0.79 11.5 9.008 0.85 6.1 sidereal
F6 νd 0.011 0.94 12.1 0.023 3.87 32.0 data
F7 0.965 0.70 8.6 0.966 0.68 4.9 ?
F8 0.572 0.61 7.8 ?
F9 0.144 0.61 7.7 0.141 1.06 8.5 ?
F10 νl(2νl) 0.034 0.41 5.2 0.067 1.45 11.9 lunar
F11 0.223 1.74 4.9 ?
F12 0.419 1.54 14.6 ?
F13 48νs 48.126 1.08 10.6 sidereal
Note. — The “Sidereal” flag means that the frequency is likely influenced by the earth rotation, the
“Lunar” flag means that the frequency may be related to the moon phase, the “?” flag means that the
frequency is in the low-frequency domain (<1.5 c/d), and the “data” flag means that the frequency
is likely influenced by the length of the data set. The spurious frequencies have subscripts s, l and d,
corresponding to the origin in the source indicated by the flags noted above (see rightmost column).
– 27 –
(< 1.5 cd−1), induced mainly by variations in the atmospheric transparency and in the
sensitivity of the CCD detectors. The frequencies from f22 to f26 are combinations of one
independent pulsation frequency with one spurious frequency, two of which, f22 = 9.252
cd−1 and f25 = 24.856 cd−1, are detected in both bands.
5.2. Steps toward mode identification
The oscillation amplitude of HD 92277 is 0.03 mag and 0.04 mag in the r and g-bands
respectively. The color index g − r = 0.2 was calculated from the data sets, and we used
the following equation (Jester et al. 2005),
B − V = 0.90× (g − r) + 0.21,
to derive B − V = 0.39 ± 0.03, which is in good agreement with the value B − V = 0.375
reported by van Leeuwen (2007). Using the parallax 2.12 ± 0.91 mas and V = 9.10 values
mentioned in Sect. 1, we derived an absolute magnitude MV = 0.73±0.781.22 in V -band. The
effective temperature Teff = 6800±170150 K can be estimated based on B − V = 0.39 ± 0.03
and the empirical formula (Swamy 1996),
Teff = 8540/[(B − V ) + 0.865],
where we adopted the bolometric correction BC = 0.022 from Table 3 of Flower (1996),
obtaining Mbol = 0.75±0.781.22.
The empirical mass-luminosity relation for a star of M ≥ 0.43M⊙ is approximately
as log(L/L⊙) = 4 log(M/M⊙). Using the relation of Mbol − Mbol,⊙ = 2.5 log(L⊙/L)
and adopting the following solar values taken from Sun Fact Sheet3: Teff,⊙ = 5778 K,
3http://nssdc.gsfc.nasa.gov
– 28 –
log g⊙ = 4.4378 and Mbol,⊙ = 4.83, one obtains
log g = 0.3Mbol + 4 log Teff − 12.035. (1)
The pulsation constant, Q, of a δ Scuti star is defined by the period-density relation:
P
√
ρ
ρ⊙= Q,
which can be rearranged in the form,
logQ = −6.454 + logP + 0.5 log g + 0.1Mbol + log Teff . (2)
From equations (1) and (2) we obtain the pulsation constant
logQ = logP + 0.25Mbol + 3 log Teff − 12.471.
Finally, using Teff = 6800±170150 K and Mbol = 0.75±0.78
1.22 in the above equation, we find
Q1 = 0.015± 0.007 d and Q2 = 0.018± 0.009 d for the primary and secondary frequencies,
respectively, indicating both the pulsations in the low overtone p modes. The lack of
observational parameters such as log g hinders our ability to obtain more precise pulsation
constants of these frequencies. Hence, it is impossible to make further mode identifications
based on the Q values of these frequencies alone.
An alternative method of mode identification is the examination of amplitude ratios
and phase variations of measurements at different wavelengths (Garrido et al. 1990; Watson
1988; Balona & Stobie 1980). The variations in two color bands observed at the same time
during the 2009 observational duty of CSTAR telescopes were used to derive phase shift
and amplitude ratio values for the first two frequencies. We firstly transformed g and r
magnitudes into B and V magnitudes by using the following equation (Jester et al. 2005),
V = g − 0.58× (g − r)− 0.01.
– 29 –
Then we made a series of Fourier transforms of the data sets in both bands observed at
the same time, changing the start offset time in a range with the uncertainty of 0.0006
days. The amplitude ratios of frequency f1 and f2 are AB−V /AV = 0.360 ± 0.004 and
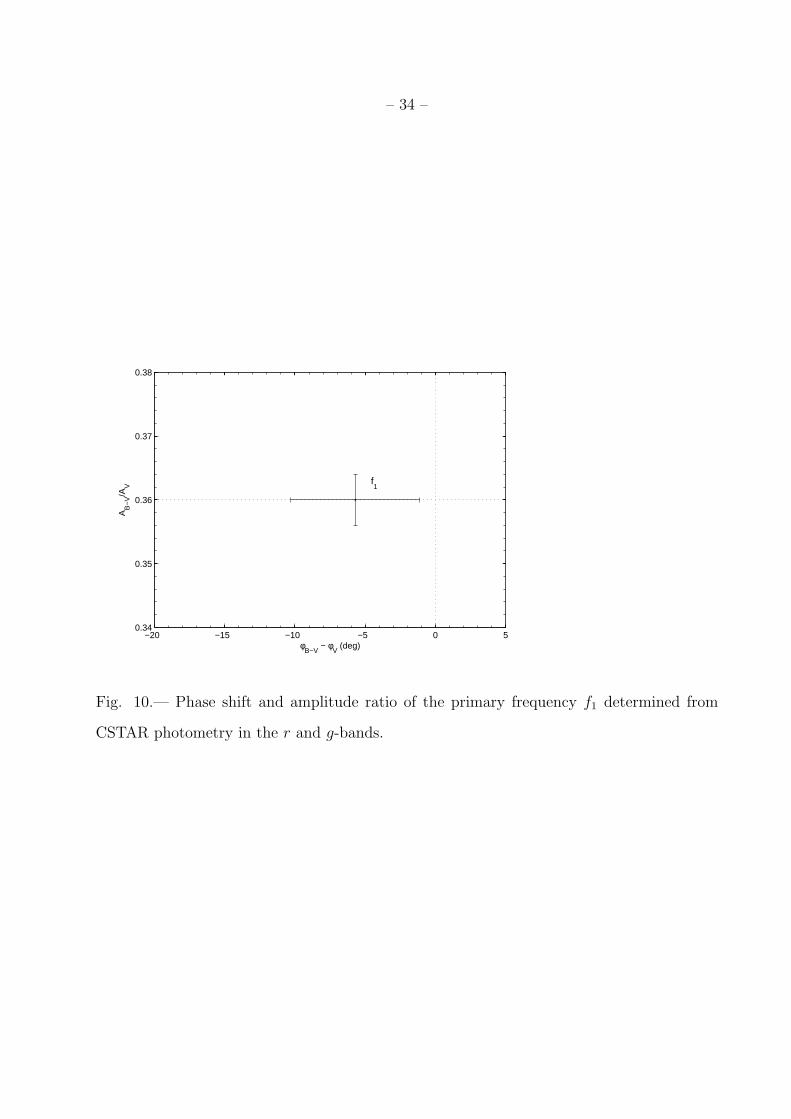
0.407 ± 0.005, respectively. The phase shift of frequency f1 is φB−V − φV = −5.7 ± 4.6◦.
The position of mode f1 is shown on Figure 10, which suggests that frequency f1 is more
likely to be an l = 1 mode (Watson 1988). However, the value of phase shift of frequency f2
has a very large uncertainty that prohibits any further attempt at mode identification. The
upgraded CTSAR telescopes, with the tracking mount and a working GPS time source,
will greatly reduce the number of spurious frequencies and would identify more oscillation
modes of HD 92277 based on their values of the amplitude ratio and the phase shift.
5.3. Limitations of CSTAR
The discovery of the new δ Scuti star HD 92277 with more than a dozen independent
frequencies of oscillation, shows some potential of conducting continuous multi-colour
photometry from Dome A, Antarctica. Apart from the frequencies intrinsic to the star,
dozens of spurious frequencies were seen in the light curves of HD 92277—these are believed
to be inevitable when using a small aperture telescopes with a wide FOV, without tracking,
and over a long period of time (so, e.g., changes in the sky background with the phase
of the moon have an effect). We should be able to reduce the amplitude of the spurious
frequencies by using an ensemble of reference stars close in declination to HD 92277, so that
they trace the same circles on the CCD frame over a sidereal day. Such methods had been
employed with data from the i-band telescope (Meng et al. 2013) in order to increase the
photometric precision of the CSTAR catalog, but this is beyond the scope of the present
paper.
Space missions can, of course, obtain much higher precision photometry than any
– 30 –
ground-based telescope, although usually unfiltered or monochrome. For example, the very
precise photometry from the CoRoT mission makes it possible to study several δ Scuti
stars at the noise level of a few hundredths of mmag, resolving hundreds of frequencies in
δ Scuti stars such as HD 50844 (Poretti et al. 2009) and HD 174836 (Garcıa Hernandez
et al. 2009), and to discover modulation effects such as those found in the light curve of
the high-amplitude δ Scuti star CoRoT 101155310 (Poretti et al. 2011). The Kepler space
mission continuously monitored hundreds of δ Scuti stars with > 90% duty circles for 4
years up to May 2013 with µmag precision. These data are of unprecedented quality and
give several striking results such as the regularity seen in the frequencies of the δ Scuti star
KIC 8054146 (Breger et al. 2012), the discovery of solar-like oscillations in the δ Scuti star
HD 187547 (Antoci et al. 2011), and ∼ 23% δ Scu/γ Dor hybrids in pulsating A–F type
stars (Uytterhoeven et al. 2011).
6. Summaries, conclusions and prospects
We have reported high quality time-series photometry for HD 92277 in two bands, g
and r, from the CSTAR telescopes during the winter of 2009 from Dome A, Antarctica. The
total exposure times were 694 and 1,264 hours in g and r-band respectively. We detected
21 frequencies in r-band and 14 frequencies in g-band, 14 of which were detected in both
bands. The primary frequency f1 is more likely an l = 1 p-mode, based on the amplitude
ratios and phase variations of the modes. HD 92277 is classified as a new δ Scuti star based
on its spectral type and the primary frequency corresponding to a period of 0.0925 d. The
pulsation constant values Q for the first two frequencies were estimated by using empirical
formulae.
HD 92277 is the first asteroseismic target observed from Dome A, and shows
multi-period oscillations. Our work shows that multi-color observations bring valuable
– 31 –
information to help with the mode identification of the pulsations, and show how ground-
based multi-color asteroseismology has some advantages over monochrome data from
space missions. Unfortunately, since very few observations have been made of HD 92277
before, the star lacks precise physical parameters such as log g, metallicity [M/H], and
projected rotational velocity v sin i. Spectroscopic observations are particularly needed for
further investigations, such as testing the detected frequencies by using seismic models
and determining the evolutionary status and mass of HD 92277 by using stellar evolution
models such as the MESA code (Paxton et al. 2011).
CSTAR, the prototype instrument for photometry deployed at Dome A, has been
operated since 2008 for four winters, and will be re-deployed in January 2015 with
improvements, including a tracking mount and a working GPS time source. The upgraded
CTSAR telescopes will greatly reduce the number of spurious frequencies and would identify
more oscillation modes in pulsating stars, including HD 92277, based on their values of
the amplitude ratio and the phase shift. The scientific results from CSTAR, together with
those from other instruments deployed at Dome A, show that the observational conditions
are better in many respects than temperate sites. Dome A offers well in excess of 1000 hrs
of photometric time with a > 60% duty cycle every year, with low scintillation noise, long
periods (weeks) of continuously good conditions, no diurnal aliasing in winter, and low
airmass variations as a result of the extreme southern latitude. These factors all make
precision photometry possible, and are especially important for asteroseismology. The
14.5 cm CSTAR telescopes can effectively monitor bright targets around the South Celestial
Pole. The weather is the fundamental limitation for CSTAR as it is for all ground-based
telescopes. Other limitations include low frequency drifts in CCD sensitivity and small
focus changes.
The first of three AST3 telescopes, the successor of CSTAR, was installed at Dome
– 32 –
A in January 2012 and a second AST3 is planned to be installed there in January 2015.
The AST3 telescopes will monitor parts of the southern sky in one month time blocks, and
will offer high-quality photometric data in three different bands, G, R and I, to provide
important information for mode identification for pulsating stars, which monochrome space
missions such as CoRoT and Kepler cannot do. Obviously, pulsators in the FOV of AST3
will spread over the entire H-R diagram since the targets can be as faint as I = 19.5 mag.
KDUST, the third-generation Chinese Antarctic telescope, with a 2.5m aperture is now
being designed (Yuan et al. 2013), and could make follow-up observations of interesting
pulsating targets. Time-series spectroscopic observations conducted by KDUST would
be very valuable for asteroseismology. By comparing the spectroscopic and photometric
observations with stellar models, it would assist with a precise determination of oscillation
modes from which one could learn more details of the internal structure of the stars.
Acknowledgements
WKZ acknowledges the financial support from the China Scholarship Council. WKZ,
JNF and JSN acknowledge the support from the Joint Fund of Astronomy of National
Natural Science Foundation of China (NSFC) and Chinese Academy of Sciences through
the Grant U1231202, and the support from the National Basic Research Program of China
(973 Program 2014CB845700 and 2013CB834900). LZW acknowledges the support from
NSFC 11303041. This project is supported by the Commonwealth of Australia under the
Australia-China Science and Research Fund, and by the Australian Research Council and
the Australian Antarctic Division. This research has made use of the Simbad database,
operated at CDS, Strasbourg, France. The authors wish to thank the referee for valuable
comments that were helpful in improving the manuscript. The authors gratefully appreciate
the great efforts made by the 24–29th Dome A expedition teams for assistance to the

– 33 –
astronomers that set up and provide annual maintenance for the CSTAR telescopes and
other facilities.
– 34 –
−20 −15 −10 −5 0 50.34
0.35
0.36
0.37
0.38
φB−V
− φV (deg)
AB
−V/A
V
f1
Fig. 10.— Phase shift and amplitude ratio of the primary frequency f1 determined from
CSTAR photometry in the r and g-bands.
– 35 –
REFERENCES
Antoci, V., Handler, G., Campante, T. L., et al. 2011, Nature, 477, 570
Ashley, M. C. B. 2013, IAU Symposium 288, doi 10.1017/S1743921312016614
Baglin, A., Auvergne, M., Boisnard, L., et al. 2006, in 36th COSPAR Scientific Assembly,
36, 3749
Balona, L. A., Stobie, R. S. 1980, MNRAS, 190, 931
Bonner, C. S., Ashley, M. C. B., Lawrence, J. S., Luong-Van, D. M., & Storey, J. W. V.
2010, PASP, 122, 1122
Borucki, W. J., Koch, D., Basri, G., et al. 2010, Science, 327, 977
Breger, M. 2000, in Astronomical Society of the Pacific Conference Series, Vol. 210, Delta
Scuti and Related Stars, ed. M. Breger & M. Montgomery, 3
Breger, M., Fossati, L., Balona, L., et al. 2012, A&A, 759, 62
Breger, M., Stich, J., Garrido, R., et al. 1993, A&A, 271, 482
Deeg, H. J., Belmonte, J. A., Alonso, R., et al. 2005, in Dome C, ed. M. Giard et al ., EAS
Publ. Ser., 14, 303
Fabricius, C., & Makarov, V. V. 2000, A&A, 356, 141
Flower, P. J. 1996, ApJ, 469, 355
Fossat, E. 2005, in Dome C, Astronomy, and Astrophysics Meeting, ed. M. Giard et al.,
EDP Publ. Ser., 14, 121
Garcıa Hernandez, A., Moya, A., Michel, E., et al. 2009, A&A, 506,79
– 36 –
Garrido, R., Garcia-Lobo, E., & Rodriguez, E. 1990, A&A, 234, 262
Harvey, J. W., Hill, F., Hubbard, R., et al. 1996, Science, 272, 1284
Høg, E., Fabricius, C., Makarov, V. V., et al. 2000, A&A, 355, L27
Houck, N., & Cowley, A. P. 1975, University of Michigan, Catalogue of two-dimensional
spectral types for the HD stars, Unvi. of Michigan Ann. Arbor, Vol.1, Stellar Data
Center, Strasbourg
Jester, S., Schneider, D. P., Richards, G. T., et al. 2005, AJ, 130, 873
Kaye, A. B., Handler, G., Krisciunas, K., et al. 1999, PASP, 111, 840
Kuschnig, R., Weiss, W.W., Gruber, R., et al. 1997, A&A, 328, 544
Lawrence, J. S., Ashley, M. C. B., Tokovinin, A., & Travouillon, T. 2004, Nature, 431, 378
Lawrence, J. S., Ashley, M. C. B., Hengst, S., et al. 2009, Rev. Sci. Inst., 80, 064501
Lenz, P., & Breger, M. 2005, Comm. in Asteroseismology, 146, 53
Liu G., Yuan X. 2009 Acta Astron. Sinica, 50, 224
Matthews, J. M. 2007, CoAst, 150, 333
Meng, Z., Zhou, X., Zhang, H., et al. 2013, PASP, 125, 1015
Michel, E., Belmonte, J. A., Alvarez, M., et al. 1992, A&A, 255, 139
Mosser, B., & Aristidi, E. 2007, PASP, 119, 127
Nather, R. E., Winget, D. E., Clemens, J. C., Hansen, C. J., & Hine, B. P. 1990, ApJ, 361,
309
Ofek, E. O. 2008, PASP, 120, 1128
– 37 –
Okita, H., Ichikawa, T., Ashley, M. C. B., Takato, N. & Motoyama, H. 2013, A&A, 554, L5.
Paxton, B., Bildsten, L., Dotter, A., et al. 2011, ApJS, 192, 3
Pont, F., & Bouchy, F. 2005, in Dome C, Astronomy, and Astrophysics Meeting, ed. M.
Giard et al., EDP Publ. Ser., 14, 155
Poretti, E., Michel, E., Garrido, R., et al. 2009, A&A, 506, 85
Poretti, E., Rainer, M., Weiss, W. W., et al. 2011, A&A, 528, 147
Stankov, A., & Handler, G. 2005, ApJS, 158, 193
Saunders, W., Lawrence, J. S., Storey, J.W.V., et al. 2009, PASP, 121, 976
Sims, G., Ashley, M. C. B., Cui, X., et al., 2012, PASP, 124, 637
Strassmeier, K. G., & Olah, K. 2004, ESA SP-583, 149
Strassmeier, K. G., Briguglio, R., Granzer, T., et al. 2008, A&A, 490, 287
Swamy, K. 1996, Astrophysics: A Modern Prospective, New Age International Publishers,
P11
Uytterhoeven, K., Moya, A., Grigahcene, A., et al. 2011, A&A, 534, A135
van Leeuwen, F. 2007, A&A, 474, 653
Wang, L., Macri, L. M., Krisciunas, K., et al. 2011, AJ, 142, 155
Wang, L., Macri, L. M., Wang, L., et al. 2013, AJ, 146, 139
Watson, R. D. 1988, Ap&SS, 140, 255
Yang, H., Allen, G., Ashley, M. C. B., et al. 2009, PASP, 121, 174
– 38 –
Yuan, X., Cui, X., Gong, X., et al. 2010, in Stepp L.M., Gilmozzi R., Hall H. J., eds, Proc.
SPIE Conf. Ser. Vol. 7733, Ground-Based and Airborne Telescopes III. p. 77331V
Yuan, X., Cui, X., Su, D., et al. 2013, IAUS, 288, 271Y
Zhou, X., Fan, Z., Jiang, Z., et al. 2010a, PASP, 122, 347
Zhou, X., Wu, Z., Jiang, Z., et al. 2010b, RAA, 10, 279
Zong, W., Fu, J., Niu, J., et al. 2014, Astronomical Research and Technology, 11, 89
Zou, H., Zhou, X., Jiang, Z., et al. 2010, AJ, 140, 602
This manuscript was prepared with the AAS LATEX macros v5.2.


![TUSSO | Espresso v4 [HD] - EL](https://static.fdocument.org/doc/165x107/544fd122af7959e1108b9656/tusso-espresso-v4-hd-el.jpg)