Discovery of a Primitive Damped Lyman Absorber Near an X-ray
49
Submitted to The Astrophysical Journal Discovery of a Primitive Damped Lyman α Absorber Near an X-ray Bright Galaxy Group in the Virgo Cluster 1 Todd M. Tripp, 2 Edward B. Jenkins, 3 David V. Bowen, 3 Jason X. Prochaska, 4 Bastien Aracil, 2 and Rajib Ganguly 5 ABSTRACT We report the discovery of a low-redshift, sub-damped Lyα absorber (DLA) in the outer periphery of the Virgo cluster near the X-ray bright NGC4261 galaxy group, in the direction of PG1216+069. We have obtained a new spectrum of PG1216+069 (z QSO = 0.3313) with the E140M echelle mode of the Space Telescope Imaging Spectrograph (STIS), and this spectrum reveals damped Lyα absorption as well as O I,C II, Si II, and Fe II absorption lines at z abs = 0.00632. Notably, the absorber shows no evidence of highly-ionized gas: Si IV,C IV, and O VI are not significantly detected at this redshift. The lack of highly-ionized gas associated with the absorber places constraints on “warm-hot” missing baryons in the NGC4261 group at ρ & 400h -1 75 kpc from the group center. The well-developed damping wings of the Lyα line tightly constrain the H I column density; we find log N (H I) = 19.32±0.03. The metallicity of this sub- DLA is remarkably low, [O/H] = -1.60 +0.09 -0.11 , which is comparable to (or less than) the metallicity of many analogous high-redshift systems. The iron abundance indicates that this absorber contains little or no dust. Nitrogen is underabundant; we detect neither N I or N II, and we show that the absence of N I is not due to ionization effects but rather indicates a significant underabundance, [N/O] ≤-0.28 at the 3σ level. Despite the proximity of the sight line to the Virgo cluster and the NGC4261 group, there are no bright galaxies particularly close to the sight line at the absorption redshift. The nearest known galaxy in projection is a sub-L* galaxy with a projected distance ρ = 86h -1 75 1 Based on observations with (1) the NASA/ESA Hubble Space Telescope, obtained at the Space Telescope Science Institute, which is operated by the Association of Universities for Research in Astronomy, Inc., under NASA contract NAS 5-26555, and (2) the NASA-CNES/ESA Far Ultraoviolet Spectroscopic Explorer mission, operated by Johns Hopkins University, supported by NASA contract NAS 5-32985. 2 Department of Astronomy, University of Massachusetts, Amherst, MA 01003, Electronic mail: [email protected] 3 Princeton University Observatory, Peyton Hall, Princeton, NJ 08544 4 University of California Observatories, Natural Sciences II Annex, UC-Santa Cruz, Santa Cruz, CA 95064 5 Space Telescope Science Institute, 3700 San Martin Drive, Baltimore, MD 21218
Transcript of Discovery of a Primitive Damped Lyman Absorber Near an X-ray
Submitted to The Astrophysical Journal
Discovery of a Primitive Damped Lyman α Absorber Near an X-ray Bright
Galaxy Group in the Virgo Cluster1
Todd M. Tripp,2 Edward B. Jenkins,3 David V. Bowen,3 Jason X. Prochaska,4 Bastien Aracil,2
and Rajib Ganguly5
ABSTRACT
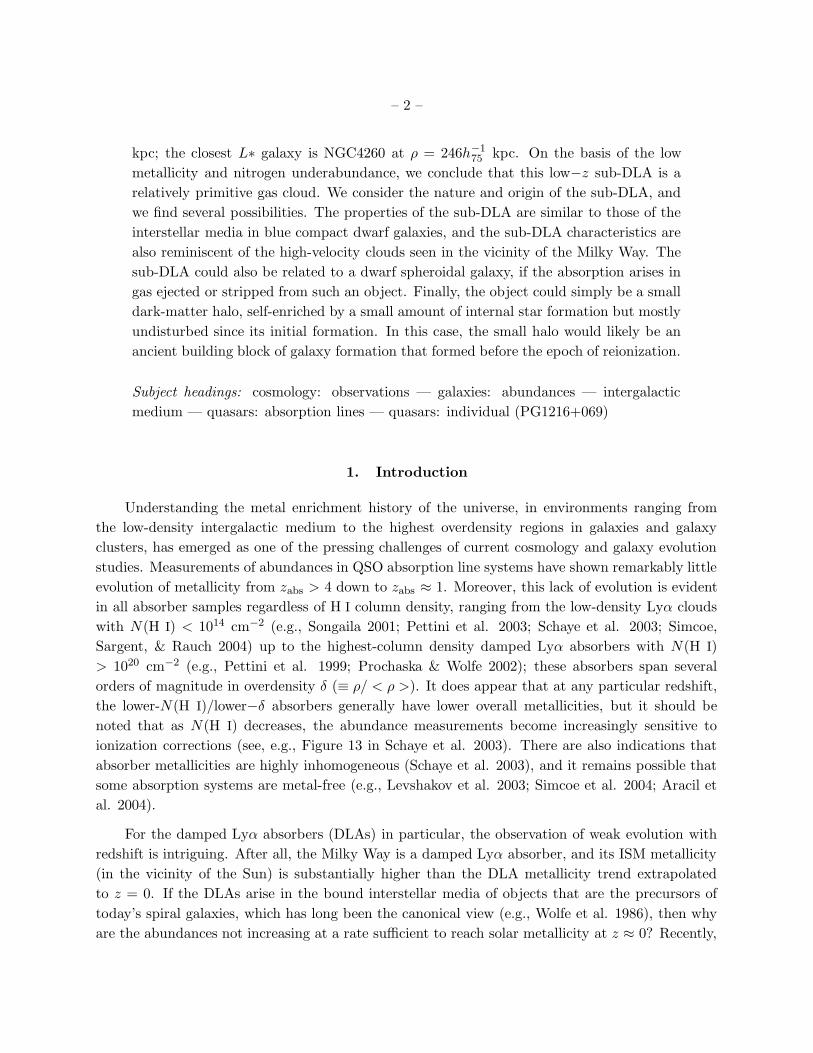
We report the discovery of a low-redshift, sub-damped Lyα absorber (DLA) in the
outer periphery of the Virgo cluster near the X-ray bright NGC4261 galaxy group, in
the direction of PG1216+069. We have obtained a new spectrum of PG1216+069 (zQSO
= 0.3313) with the E140M echelle mode of the Space Telescope Imaging Spectrograph
(STIS), and this spectrum reveals damped Lyα absorption as well as O I, C II, Si II,
and Fe II absorption lines at zabs = 0.00632. Notably, the absorber shows no evidence
of highly-ionized gas: Si IV, C IV, and O VI are not significantly detected at this
redshift. The lack of highly-ionized gas associated with the absorber places constraints
on “warm-hot” missing baryons in the NGC4261 group at ρ & 400h−175 kpc from the
group center. The well-developed damping wings of the Lyα line tightly constrain the
H I column density; we find log N(H I) = 19.32±0.03. The metallicity of this sub-
DLA is remarkably low, [O/H] = −1.60+0.09−0.11, which is comparable to (or less than) the
metallicity of many analogous high-redshift systems. The iron abundance indicates that
this absorber contains little or no dust. Nitrogen is underabundant; we detect neither
N I or N II, and we show that the absence of N I is not due to ionization effects but
rather indicates a significant underabundance, [N/O] ≤ −0.28 at the 3σ level. Despite
the proximity of the sight line to the Virgo cluster and the NGC4261 group, there are no
bright galaxies particularly close to the sight line at the absorption redshift. The nearest
known galaxy in projection is a sub−L∗ galaxy with a projected distance ρ = 86h−175
1Based on observations with (1) the NASA/ESA Hubble Space Telescope, obtained at the Space Telescope Science
Institute, which is operated by the Association of Universities for Research in Astronomy, Inc., under NASA contract
NAS 5-26555, and (2) the NASA-CNES/ESA Far Ultraoviolet Spectroscopic Explorer mission, operated by Johns
Hopkins University, supported by NASA contract NAS 5-32985.
2Department of Astronomy, University of Massachusetts, Amherst, MA 01003, Electronic mail:
3Princeton University Observatory, Peyton Hall, Princeton, NJ 08544
4University of California Observatories, Natural Sciences II Annex, UC-Santa Cruz, Santa Cruz, CA 95064
5Space Telescope Science Institute, 3700 San Martin Drive, Baltimore, MD 21218
– 2 –
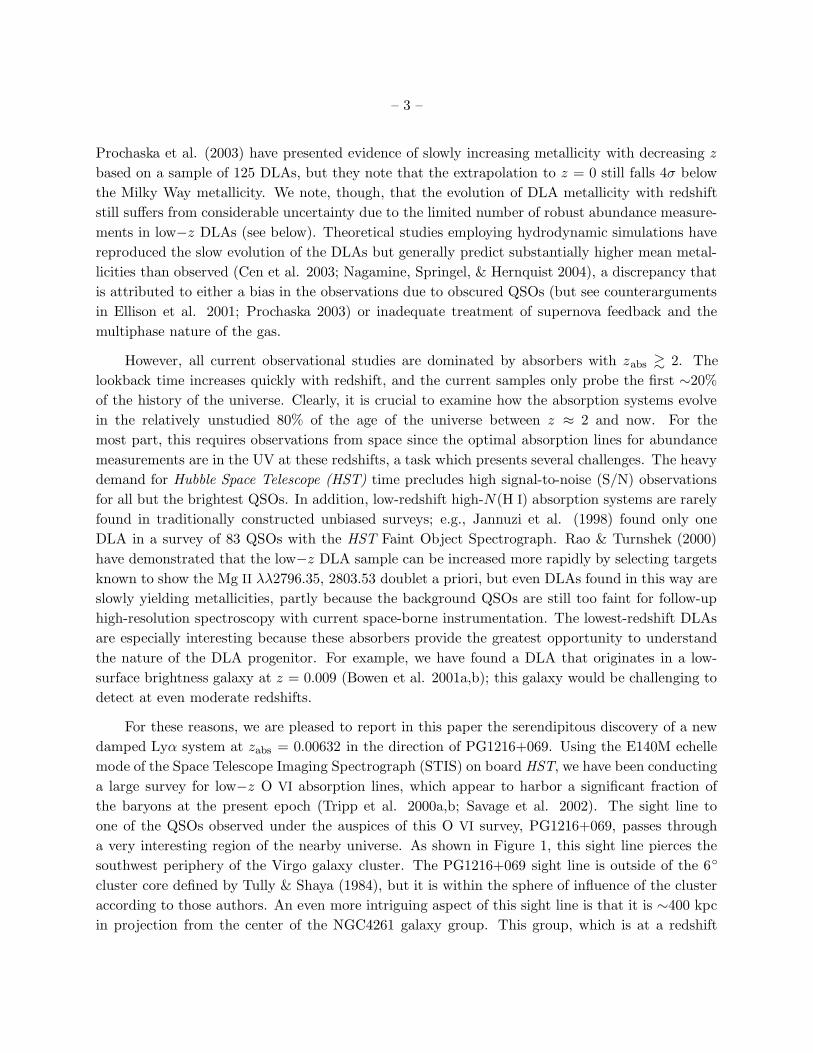
kpc; the closest L∗ galaxy is NGC4260 at ρ = 246h−175 kpc. On the basis of the low
metallicity and nitrogen underabundance, we conclude that this low−z sub-DLA is a
relatively primitive gas cloud. We consider the nature and origin of the sub-DLA, and
we find several possibilities. The properties of the sub-DLA are similar to those of the
interstellar media in blue compact dwarf galaxies, and the sub-DLA characteristics are
also reminiscent of the high-velocity clouds seen in the vicinity of the Milky Way. The
sub-DLA could also be related to a dwarf spheroidal galaxy, if the absorption arises in
gas ejected or stripped from such an object. Finally, the object could simply be a small
dark-matter halo, self-enriched by a small amount of internal star formation but mostly
undisturbed since its initial formation. In this case, the small halo would likely be an
ancient building block of galaxy formation that formed before the epoch of reionization.
Subject headings: cosmology: observations — galaxies: abundances — intergalactic
medium — quasars: absorption lines — quasars: individual (PG1216+069)
1. Introduction
Understanding the metal enrichment history of the universe, in environments ranging from
the low-density intergalactic medium to the highest overdensity regions in galaxies and galaxy
clusters, has emerged as one of the pressing challenges of current cosmology and galaxy evolution
studies. Measurements of abundances in QSO absorption line systems have shown remarkably little
evolution of metallicity from zabs > 4 down to zabs ≈ 1. Moreover, this lack of evolution is evident
in all absorber samples regardless of H I column density, ranging from the low-density Lyα clouds
with N(H I) < 1014 cm−2 (e.g., Songaila 2001; Pettini et al. 2003; Schaye et al. 2003; Simcoe,
Sargent, & Rauch 2004) up to the highest-column density damped Lyα absorbers with N(H I)
> 1020 cm−2 (e.g., Pettini et al. 1999; Prochaska & Wolfe 2002); these absorbers span several
orders of magnitude in overdensity δ (≡ ρ/ < ρ >). It does appear that at any particular redshift,
the lower-N(H I)/lower−δ absorbers generally have lower overall metallicities, but it should be
noted that as N(H I) decreases, the abundance measurements become increasingly sensitive to
ionization corrections (see, e.g., Figure 13 in Schaye et al. 2003). There are also indications that
absorber metallicities are highly inhomogeneous (Schaye et al. 2003), and it remains possible that
some absorption systems are metal-free (e.g., Levshakov et al. 2003; Simcoe et al. 2004; Aracil et
al. 2004).
For the damped Lyα absorbers (DLAs) in particular, the observation of weak evolution with
redshift is intriguing. After all, the Milky Way is a damped Lyα absorber, and its ISM metallicity
(in the vicinity of the Sun) is substantially higher than the DLA metallicity trend extrapolated
to z = 0. If the DLAs arise in the bound interstellar media of objects that are the precursors of
today’s spiral galaxies, which has long been the canonical view (e.g., Wolfe et al. 1986), then why
are the abundances not increasing at a rate sufficient to reach solar metallicity at z ≈ 0? Recently,
– 3 –
Prochaska et al. (2003) have presented evidence of slowly increasing metallicity with decreasing z
based on a sample of 125 DLAs, but they note that the extrapolation to z = 0 still falls 4σ below
the Milky Way metallicity. We note, though, that the evolution of DLA metallicity with redshift
still suffers from considerable uncertainty due to the limited number of robust abundance measure-
ments in low−z DLAs (see below). Theoretical studies employing hydrodynamic simulations have
reproduced the slow evolution of the DLAs but generally predict substantially higher mean metal-
licities than observed (Cen et al. 2003; Nagamine, Springel, & Hernquist 2004), a discrepancy that
is attributed to either a bias in the observations due to obscured QSOs (but see counterarguments
in Ellison et al. 2001; Prochaska 2003) or inadequate treatment of supernova feedback and the
multiphase nature of the gas.
However, all current observational studies are dominated by absorbers with zabs & 2. The
lookback time increases quickly with redshift, and the current samples only probe the first ∼20%
of the history of the universe. Clearly, it is crucial to examine how the absorption systems evolve
in the relatively unstudied 80% of the age of the universe between z ≈ 2 and now. For the
most part, this requires observations from space since the optimal absorption lines for abundance
measurements are in the UV at these redshifts, a task which presents several challenges. The heavy
demand for Hubble Space Telescope (HST) time precludes high signal-to-noise (S/N) observations
for all but the brightest QSOs. In addition, low-redshift high-N(H I) absorption systems are rarely
found in traditionally constructed unbiased surveys; e.g., Jannuzi et al. (1998) found only one
DLA in a survey of 83 QSOs with the HST Faint Object Spectrograph. Rao & Turnshek (2000)
have demonstrated that the low−z DLA sample can be increased more rapidly by selecting targets
known to show the Mg II λλ2796.35, 2803.53 doublet a priori, but even DLAs found in this way are
slowly yielding metallicities, partly because the background QSOs are still too faint for follow-up
high-resolution spectroscopy with current space-borne instrumentation. The lowest-redshift DLAs
are especially interesting because these absorbers provide the greatest opportunity to understand
the nature of the DLA progenitor. For example, we have found a DLA that originates in a low-
surface brightness galaxy at z = 0.009 (Bowen et al. 2001a,b); this galaxy would be challenging to
detect at even moderate redshifts.
For these reasons, we are pleased to report in this paper the serendipitous discovery of a new
damped Lyα system at zabs = 0.00632 in the direction of PG1216+069. Using the E140M echelle
mode of the Space Telescope Imaging Spectrograph (STIS) on board HST, we have been conducting
a large survey for low−z O VI absorption lines, which appear to harbor a significant fraction of
the baryons at the present epoch (Tripp et al. 2000a,b; Savage et al. 2002). The sight line to
one of the QSOs observed under the auspices of this O VI survey, PG1216+069, passes through
a very interesting region of the nearby universe. As shown in Figure 1, this sight line pierces the
southwest periphery of the Virgo galaxy cluster. The PG1216+069 sight line is outside of the 6
cluster core defined by Tully & Shaya (1984), but it is within the sphere of influence of the cluster
according to those authors. An even more intriguing aspect of this sight line is that it is ∼400 kpc
in projection from the center of the NGC4261 galaxy group. This group, which is at a redshift
– 4 –
close to (but slightly higher than) the redshift of the Virgo cluster proper, is known to have a hot
intragroup medium from ROSAT detection of diffuse X-ray emission (Davis et al. 1995).
While observations of PG1216+069 made with the first-generation HST spectrographs had
revealed a strong Lyα line at zabs ≈ 0.006, i.e., near the redshift of the Virgo cluster (Bowen
et al. 1996; Impey, Petry, & Flint 1999), the low spectral resolution of the early HST spectra
precluded recognition of the damped nature of this absorption system. A portion of the new STIS
spectrum of this QSO covering the Lyα line in Virgo is shown in Figure 2. This Lyα line has
well-developed damping wings. Technically, even though the damping wings are quite obvious, the
H I column density of the zabs = 0.00632 system is too low to qualify as a “damped” Lyα absorber
according to the standard definition, which requires log N(H I) ≥ 20.3. Hence, we will refer to this
system as a “sub-DLA”. However, the standard DLA definition was originally just an observational
convenience for early low-resolution spectroscopic studies and has little physical basis. In many
respects, sub-DLAs can have physical characteristics that are similar to the higher N(H I) official
DLAs.
In this paper we present the remarkable properties of this new, nearby sub-DLA in the im-
mediate vicinity of the Virgo cluster. The manuscript is organized as follows: after presenting the
observations and absorption line measurements in § 2 and § 3, respectively, we derive the absolute
and relative metal abundances of the absorber in § 4, including analyses of potentially important
sources of systematic errors such as unresolved line saturation and ionization corrections. In § 5,
we briefly discuss the physical conditions in the absorbing gas. We then provide information on
the environment in which the system is found (§ 6) and limits on O VI absorption associated with
the NGC4261 group (§ 7) before offering some comments on the nature and implications of the
absorber properies in § 8. We close with a summary of the main results in § 9, and the appendix
briefly discusses STIS wavelength calibration errors.
2. Observations
PG1216+069 was observed with the E140M spectroscopic mode of STIS on 7 occasions in 2003
May-June; the total integration time was 69.8 ksec. This echelle spectrograph provides a resolution
of 7 km s−1 (FWHM) with ∼2 pixels per resolution element and covers the 1150−1700 A range with
only a few small gaps between orders at λ > 1630 A (Woodgate et al. 1998; Kimble et al. 1998).
The observations employed the 0.′′2 × 0.′′06 slit in order to minimize the wings in the line-spread
function (see Figure 13.91 in the STIS Instrument Handbook, Kim Quijano et al. 2003). The data
were reduced as described in Tripp et al. (2001) using the STIS Team version of CALSTIS at the
Goddard Space Flight Center.
We encountered three minor calibration issues when we reduced these data. First, there are a
significant number of warm/hot pixels on the detector. Some of these were successfully fixed with
an automatic identification and interpolation algorithm using pixels adjacent to the hot pixels, but
– 5 –
many of the warm pixels are not easily identified and corrected in the individual exposures due
to low count rates, and these remained in the data after the hot pixel cleaning procedure. When
the individual exposures were combined into a single final spectrum, these pixels became more
evident. Fortunately, there is no clear evidence that the important absorption lines in this paper
are significantly affected by warm/hot pixels. Second, after flux calibration, overlapping regions
of adjacent orders showed slight flux discrepancies, mainly very close to order edges. We used the
recently improved ripple correction (as of 2003 July), but nevertheless these small discrepanices
are likely due to residual imperfections in the ripple correction. To avoid spurious features at
order edges, when we coadded the overlapping regions of adjacent orders, we smoothly decreased
the weight given to the 50 pixels approaching the order edges with the last 10 pixels thrown out
all together. Third, we noticed and corrected small errors (. 1 pixel) in the relative wavelength
calibration. These wavelength calibration errors are larger than expected, and indeed are larger
than we have seen in many other observations with this mode of STIS, so we have summarized
the evidence of this problem in the Appendix. Nevertheless, the relative wavelength calibration is
still excellent, and these small shifts would have very little effect on our measurements and science
conclusions even if they were neglected.
PG1216+069 was also observed with the Far Ultraviolet Spectroscopic Explorer (FUSE) in a
single visit on 2001 February 6 for 12.4 ksec (dataset root P10721).6 This is a short exposure
compared to typical FUSE observations of extragalactic objects, and indeed the final FUSE spec-
trum of PG1216+069 is relatively noisy. Nevertheless, we shall see that by virtue of its unique
wavelength coverage, this FUSE spectrum provides useful constraints for our analysis of the Virgo
sub-DLA. To reduce the FUSE data, we first calibrated the raw time-tagged data frames using
the CALFUSE pipeline reduction (version 2.4.0). The calibrated datasets comprised six individual
sub-exposures for each FUSE channel. The signal-to-noise of each subexposure was too low to
permit us to derive any shifts between sub-exposures, so we simply summed the total number of
counts in each pixel from all six sub-exposures. However, our experience with FUSE observations
of substantially brighter targets indicates that shifts between sub-exposures are small or negligible
in a single visit, so our procedure for coaddition of the PG1216+069 data should result in little or
no degradation of spectral resolution. We binned the final coadded FUSE spectrum to ∼ 10 km
s−1 pixels, which provides ∼2 pixels per resolution element. The usual strong ISM lines (e.g., Si II
λ1020.70, O VI λλ1031.93,1037.62, C II λ1036.34, Fe II λ1144.94) are readily apparent in the final
FUSE spectrum along with several extragalactic absorption lines. In this paper, we will make use
of the FUSE data for two purposes. First, we will use the LiF2a segment to search for N II λ1083.99
absorption at the redshift of the Virgo sub-DLA. Second, we will use the LiF1a and LiF2b segments
to place constraints on O VI associated with the NGC4261 group and the sub-DLA. To calibrate
the zero point of the LiF2a wavelength scale, we aligned the Fe II λ1144.94 absorption profile with
the profile of the Fe II λ1608.45 line in the STIS spectrum. For the LiF1a and LiF2b spectra, we
compared the C II λ1036.34 and C II λ1334.53 lines from the FUSE and STIS spectra, respectively.
6For information on the design and performance of FUSE, see §3 in Moos et al. (2002) and references therein.
– 6 –
These Fe II and C II transitions have similar strengths, and this procedure results in a zero-point
velocity uncertainty of 5−10 km s−1. Due to the low S/N ratios of the individual spectra, we
aligned and coadded the LiF1a and LiF2b segments for the O VI measurements. This may degrade
the spectral resolution, but examination of the coadded spectrum indicates that the degradation is
minimal. In the case of the N II line, only the LiF2a spectrum had the right wavelength coverage
and sufficient S/N to place useful constraints.
3. Absorption Line Measurements
A selected portion of the final, coadded STIS spectrum is shown in Figure 2. The strong
Lyα absorption line at zabs = 0.00632 is readily apparent along with adjacent lines from various
redshifts including the damped Lyα line due to Galactic H I, Lyδ at zabs = 0.28228, and Lyα at
zabs = 0.00375. The Lyδ line is recorded at low signal-to-noise ratio (S/N) due to its location in
the pit of the Milky Way Lyα absorption. Nevertheless, the Lyδ identification is secure because 11
other Lyman series lines are detected at zabs = 0.28228. Only Lyα is detected at zabs = 0.00375.
We note that Lyα absorbers are frequently detected at 0.003 . zabs . 0.008 in the spectra of QSOs
in the general direction of the Virgo cluster (e.g., Bowen et al. 1996; Impey, Petry, & Flint 1999;
Tripp et al. 2002; Rosenberg et al. 2003).
The well-developed Lorentzian wings of the Lyα line at zabs = 0.00632 tightly constrain the
H I column density. Since the zabs = 0.00632 Lyα line is positioned in the red wing of the Milky
Way damped Lyα profile (see Figure 2), we fitted the Milky Way H I line as well as the zabs =
0.00632 absorber. We used the method and software described in Jenkins et al. (1999) to fit the
damped Lyα profiles and measure N(H I).7 The resulting fit is shown with a solid line in Figure 2,
and the absorber H I column densities and uncertainties are summarized in Table 1, including the
weak Lyα line at zabs = 0.00375. The H I column derived from the Milky Way Lyα profile is in
good agreement with the N(H I) reported by Lockman & Savage (1995) based on 21cm emission
in the direction of PG1216+069.
Absorption lines of O I, C II, Si II, and Fe II are detected at zabs = 0.00632 in the STIS
E140M spectrum. N I, Si IV, and C IV are not apparent at the 3σ significance level. The strong
Si III λ1206.50 line is redshifted into the core of the Galactic Lyα line and consequently cannot
be reliably measured.8 Selected absorption-line profiles of detected species are shown in Figure 3;
non-detections are plotted in Figure 4. We have measured the rest-frame equivalent widths using
7Inspection of the black cores of strongly saturated lines in STIS echelle spectra occasionally reveals small errors
in the STIS flux zero point (usually . 2% of the continuum level). Consequently, the flux zero level was allowed
to vary as a free parameter during the fitting process, and the saturated cores of the lines were included in the χ2
calculation.
8The region of the spectrum that would encompass the Si III feature was excluded from the H I fitting discussed
in the previous paragraph.
– 7 –
the techniques of Sembach & Savage (1992), which include continuum placement uncertainty as
well as a 2% uncertainty in the STIS flux zero level. These equivalent widths are listed in Table 2
along with upper limits on undetected species of interest.
We have used two techniques to estimate the column densities of metals in the sub-DLA.
First, we used standard Voigt-profile fitting with the program of Fitzpatrick & Spitzer (1997) and
the line-spread functions from the STIS Handbook (Kim Quijano et al. 2003). Inspection of the
absorption profiles (see Figure 3) reveals two well-detected components at v ≈ 0 and 28 km s−1
in the absorber velocity frame. The strongest lines show marginal evidence of additional, barely
detectable components at −125 . v . 0 km s−1. These possible components are too poorly defined
to justify any attempts to fit them with Voigt profiles. Thus, we have elected to only fit the two
well-detected components; we discuss below how inclusion of the additional weak features at v . 0
km s−1 could affect our conclusions. Results from Voigt-profile fitting are summarized in Table 3
including the velocity centroid, b−value, and column density for the two primary components.
For our second approach, we use the more generalized technique of directly integrating the
“apparent column density” profiles (see Savage & Sembach 1991; Jenkins 1996 and references
therein). This method does not incorporate any assumption that the velocity profile is inherently
Gaussian. Instead, each pixel is used to calculate the apparent optical depth as a function of velocity,
τa(v) = ln[Ic(v)/I(v)], where I(v) is the observed intensity and Ic(v) is the estimated continuum
intensity at velocity v. In turn, τa(v) is used to calculate the apparent column density, Na(v) =
(mec/πe2)(fλ)−1τa(v). If the profiles do not contain narrow, saturated structures that are degraded
by instrumental smoothing, then Na(v) can be directly integrated to obtain a good measurement of
the total column density, Ntot =∫
Na(v)dv. As in the equivalent width measurements, we used the
methods of Sembach & Savage (1992) to incorporate the uncertainties due to continuum placement
and the flux zero point in the overall Na(v) error bars. The column densities from direct integration
of Na(v) profiles are given in Table 2. We list both the total column densities (integrated across
both components) and the integrated columns for the strongest component (at v = 0 km s−1) only.
We will make use of the measurements for the strongest component only when we examine relative
abundances in § 4.2.
It is important to note that several of the metal lines are strong and narrow (see Figure 3), and
we should be concerned about whether unresolved saturation could cause the column densities to
be underestimated. Voigt profile fitting can adequately correct for unresolved saturation to some
extent by adjusting the line width, but it has been shown that when lines are significantly affected
by unresolved saturation, profile fitting can produce erroneous results (e.g., Shull et al. 2000;
Sembach et al. 2001b). The apparent column density technique can also be used to check (and
correct) for unresolved saturation given two or more transitions of a particular ion with significantly
differing fλ values. If the lines are not affected by saturation, then the Na(v) profiles of weaker and
stronger transitions will agree. Conversely, if the profiles are affected by saturated components,
then weaker transitions will yield significantly higher apparent column densities than corresponding
stronger transitions.
– 8 –
To check for saturation in the metal lines of the sub-DLA of this paper, we made use of the
fact that Si II exhibits a generous array of transitions within our spectral coverage. We detected
the Si II λλ 1190.42, 1260.42, 1304.37, and 1526.71 transitions (the 1193.29 A line could not be
used due to strong blending with Galactic absorption); the weakest and strongest lines in this set
differ by a factor of 12 in fλ (see Table 2). When we compared the apparent optical depths of
the different Si II lines, it was clear that they did not scale in proportion to the values of fλ,
indicating the presence of unresolved saturation. A method to correct Na(v) profiles for unresolved
saturation has been outlined by Jenkins (1996). The discussion in Jenkins (1996) applies to the
analysis of doublets, but the arguments can be generalized to include simultaneously many lines
of differing strength. We have applied this method to the sub-DLA Si II lines in order to correct
for the unresolved saturation. At each velocity, we solved for the minimum values of the χ2 in
all of the recorded intensities by allowing two parameters to vary: the true column density per
unit velocity N(v) and a saturation parameter, one that is directly analogous to the b−value in
a classical application of a curve of growth to measurements of equivalent widths. Much of the
detail in the final outcome is governed by the strongest line, since it has the greatest sensitivity
to small changes in N(v). Nevertheless, the weaker lines are able to influence the shape of the
profile where the stronger lines are affected by saturation, creating an outcome that corrects for the
distortion caused by unresolved, saturated structures. This method also automatically gives the
greatest weight to the most useful transition for each velocity element. That is, moderate optical
depths prevail over the weak ones buried in the noise or the very strong ones that are more subject
to systematic errors.
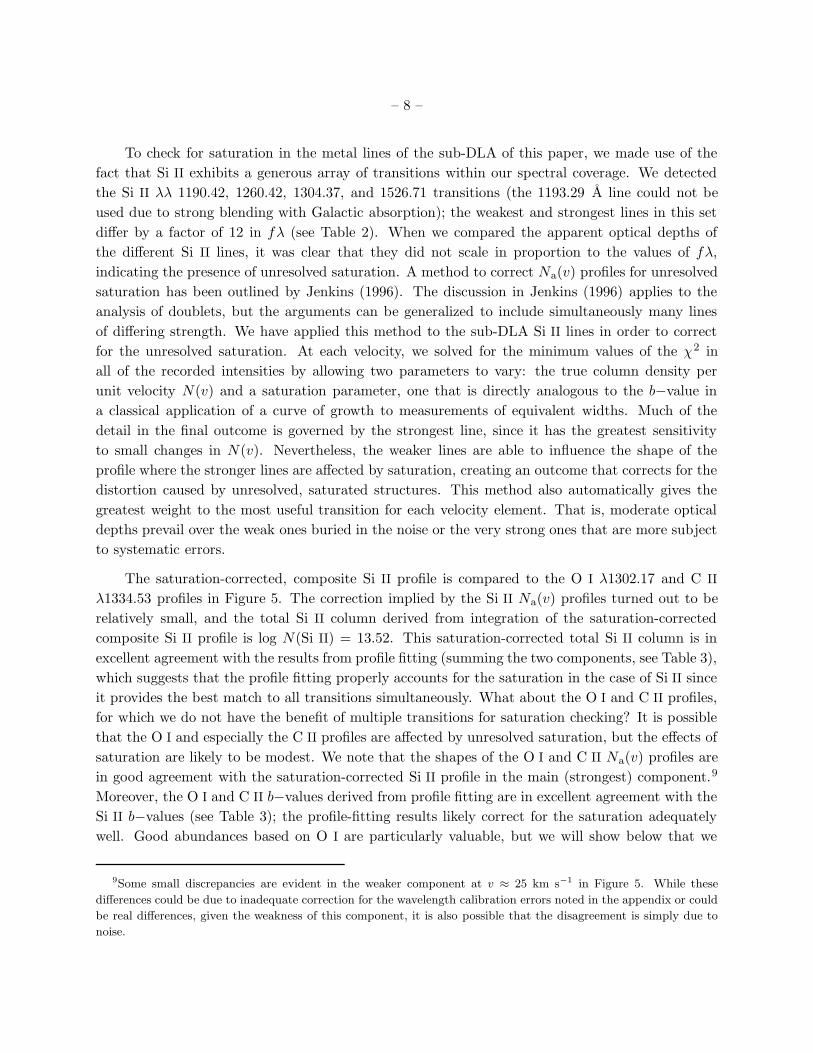
The saturation-corrected, composite Si II profile is compared to the O I λ1302.17 and C II
λ1334.53 profiles in Figure 5. The correction implied by the Si II Na(v) profiles turned out to be
relatively small, and the total Si II column derived from integration of the saturation-corrected
composite Si II profile is log N(Si II) = 13.52. This saturation-corrected total Si II column is in
excellent agreement with the results from profile fitting (summing the two components, see Table 3),
which suggests that the profile fitting properly accounts for the saturation in the case of Si II since
it provides the best match to all transitions simultaneously. What about the O I and C II profiles,
for which we do not have the benefit of multiple transitions for saturation checking? It is possible
that the O I and especially the C II profiles are affected by unresolved saturation, but the effects of
saturation are likely to be modest. We note that the shapes of the O I and C II Na(v) profiles are
in good agreement with the saturation-corrected Si II profile in the main (strongest) component.9
Moreover, the O I and C II b−values derived from profile fitting are in excellent agreement with the
Si II b−values (see Table 3); the profile-fitting results likely correct for the saturation adequately
well. Good abundances based on O I are particularly valuable, but we will show below that we
9Some small discrepancies are evident in the weaker component at v ≈ 25 km s−1 in Figure 5. While these
differences could be due to inadequate correction for the wavelength calibration errors noted in the appendix or could
be real differences, given the weakness of this component, it is also possible that the disagreement is simply due to
noise.
– 9 –
reach the same essential conclusions for the abundances of the sub-DLA if we build our analysis
mainly on the saturation-corrected Si II measurements, which are robust against this source of
systematic error. We note that the Fe II column densities from profile fitting and Na(v) integration
differ by 0.2 dex. However, the Fe II measurements are the noisiest in the set of detected lines, and
in fact the Fe II columns from the two techniques agree within their 1σ uncertainties.
4. Abundances and Dust Content
We now turn to the abundances implied by the column densities contained in Tables 1-3. We
begin with the absolute metallicity of the absorber (§ 4.1), and then we examine the patterns of
relative abundances from element to element and explore their implications regarding the dust
content and nucleosynthetic history of the sub-DLA (§ 4.2). Throughout this paper, we use the
solar oxygen and carbon abundances from Allende Prieto et al. (2001,2002), and we take the N,
Si, and Fe solar abundances from Holweger (2001).
4.1. Absolute Abundance
Abundance measurements in DLAs and sub-DLAs can suffer from uncertain corrections for
ionization (e.g., Howk & Sembach 1999; Prochaska et al. 2002a) and depletion by dust (Prochaska
2003). It is well known that these problems can be largely avoided by using O I to determine the
absolute metallicity of an absorber because (1) the ionization potentials of O I and H I are very
similar, and O I is strongly tied to H I by resonant charge exchange (Field & Steigman 1971);
consequently, the ionization correction is so small that it can largely be neglected for O I, and (2)
evidence from the local region of our Galaxy indicates that oxygen is only lightly depleted by dust
(Meyer et al. 1998; Moos et al. 2002; Andre et al. 2003). Our measurement of N(O I) is therefore
particularly advantageous for constraining the metallicity of the zabs = 0.00632 absorber. Using
the summed O I column from Voigt-profile fitting for the two main components (see Table 3) and
N(H I) from the Lyα fit, we obtain
[O/H] = −1.60+0.09−0.11 (1)
where we have used the usual logarithmic notation.10
There are some additional sources of uncertainty that are not incorporated into the error bar
in eqn. 1. We noted in § 3 that additional weak components may be present at v ≤ 0 km s−1.
These components are unlikely to be saturated by virtue of their weakness. Integrating these extra
features in the O I λ1302.17 and Si II λ1260.42 profiles out to v = −125km s−1, we find that the O I
10[X/Y] = log (X/Y) - log (X/Y).
– 10 –
column increases by 0.11 dex and N(Si II) increases by 0.09 dex. Therefore these extra components
have only a small effect; inclusion of these components increases the metallicity by ∼0.1 dex.
Another possible source of uncertainty in the oxygen abundance is the possibility that satura-
tion has led to a substantial underestimate of N(O I). We have argued that saturation is unlikely to
be a major problem (§ 3), but we can alternatively constrain the metallicity using the saturation-
corrected Si II measurements. However, Si II can require significant ionization corrections (see, e.g.,
§5 in Tripp et al. 2003). To evaluate the ionization correction required for Si II, we have employed
CLOUDY photoionization models (v94, Ferland et al. 1998) as described in Tripp et al. (2003). In
these models, the gas is photoionized by the UV background from quasars at z ≈ 0. The intensity
of the UV background at 1 Rydberg is taken to be Jν = 1×10⁻²³ ergs s−1 cm−2 Hz−1 sr−1 based on
observational constraints (Weymann et al. 2001; Dave & Tripp 2001, and references therein) with
the radiation field shape computed by Haardt & Madau (1996). The absorber is approximated as
a constant-density, plane-parallel slab, and the thickness of the slab is adjusted to reproduce the
observed H I column.
For our modeling of the ionization, we focus our attention on the main, strong component
at v = 0. Figure 6 shows the column densities of O I, N I, C II, Si II, Fe II, C IV, and Si IV
predicted by the photoionization model as a function of the ionization parameter U (≡ ionizing
photon density/total H number density = nγ/nH) compared to the observed column densities and
upper limits (for the v = 0 km s−1 component only). To fit the observed column densities, we
adjusted the overall metallicity of the model, with the relative abundances fixed to the solar values
according to the references at the beginning of this section. The model predictions are shown
by solid curves with small symbols, and the observed column densities are indicated with large
symbols with 1σ error bars or limit arrows. With the exceptions of N I and Fe II, we see that the
model is in good agreement with all detections and upper limits at log U ≈ −3.7 and an overall
metallicity [M/H] = −1.69 (slightly lower than −1.60 because we are only fitting the stronger
main component). The model agrees with the Fe II column from direct integration at this U as
well, but N(Fe II) from profile-fitting is 0.2 dex higher than predicted. The Fe II line is narrow
and marginally detected, and consequently this discrepancy could easily be due to noise. We will
discuss the origin of the discrepancy between the model and the observations in the case of N I
below. For the assumed UV background shape and Jν value, this ionization parameter corresponds
to log nH = −2.9 (however, nH is not well-constrained because it depends on the assumed intensity
of the radiation field, which is only loosely constrained; see § 5). The absence of C IV and Si IV
provide upper limits on the ionization parameter, and these upper limits translate to lower limits
on the Si abundance because the implied metallicity decreases as U increases. At the left edge of
Figure 6, the curves each approach an asymptote for a simple reason: as U decreases, the ionization
corrections become negligible, and for ions that are dominant in neutral gas, the abundance is then
equal to the ion/H I ratio, e.g., [Si/H] = [Si II/H I]. This condition places the upper limit on [Si/H].
Using the upper limit on U required by the Si IV constraint, we find
−1.77 ≤ [Si/H] ≤ −1.35. (2)
– 11 –
The range in eqn. 2 only reflects the uncertainty in the ionization correction; the additional uncer-
tainty due to the error bars in the column densities and solar Si abundance amounts to ±0.08 dex.
The metallicity implied by the Si II measurements is therefore similar to the absolute abundance
derived from O I.
The low absolute abundances derived from the oxygen and silicon measurements are notable
given the redshift of the absorber and its location in the outskirts of the Virgo cluster region
and NGC4261 group (see Figure 1). As we show in Figure 7, this sub-DLA has an absolute
metallicity that is similar to comparable sub-DLAs and DLAs at high redshifts. Figure 7 compares
the oxygen abundance of the PG1216+069 sub-DLA (large filled circle) to the mean metallicities
derived from 125 DLAs at 0.5 < zabs < 5 in six redshift bins (open squares; Prochaska et al. 2003)
and individual measurements of oxygen abundances in sub-DLAs at zabs > 1.7 (small filled circles;
Dessauges-Zavadsky et al. 2003).11 Evidently the Virgo sub-DLA metallicity is equal to or less
than the metallicity of many of the high-redshift absorbers. This suggests that this low-z absorber
is a relatively primitive gas cloud.
On the other hand, the Virgo sub-DLA metallicity is significantly higher than the typical
metallicities derived in studies of low−δ Lyα forest clouds at zabs& 2 (e.g., Schaye et al. 2003;
Simcoe et al. 2004). This suggests that the PG1216+069 sub-DLA has somehow received at
least some subsequent injection of metals above and beyond the first wave of enrichment that
produced the widespread distribution of carbon and oxygen seen in the high-z forest. There are
few constraints available on the metallicity of Lyα forest clouds at the present epoch. However,
some low−z absorbers with H I column densities in the range expected for Lyα forest clouds have
metallicities that are considerably higher (e.g., Tripp & Savage 2000; Savage et al. 2002) than
that of the Virgo sub-DLA. Therefore while the Virgo absorber is apparently not as pristine as the
high−z Lyα forest, it nevertheless is relatively metal-poor compared to analogous objects in the
nearby universe.
4.2. Relative Abundances and Dust
Beyond the overall metallicity, we have two motivations for scrutinizing the detailed pattern
of element-to-element abundances in the sub-DLA. First, relative abundances can provide valuable
constraints on the nucleosynthetic history of the object, as has been widely discussed in the stellar
abundance and QSO absorption line literature (e.g., Lauroesch et al. 1996; McWilliam 1997).
Second, relative abundances can reveal the presence of dust through the patterns of differential
depletion (e.g., Savage & Sembach 1996; Jenkins 2003). Unfortunately, for many elements the
11For the reasons outlined at the beginning of §4.1, we have restricted our comparison to [O/H] measurements for
high−z sub-DLAs, such as those from Dessauges-Zavadsky et al. (2003). In the higher-N(H I) DLAs, the oxygen
lines are often badly saturated and/or difficult to measure due to blending with Lyα forest lines. Consequently, the
DLA abundances are based on Si, S, O, or Zn measurements; see Prochaska et al. (2003) for further information.
– 12 –
nucleosynthesis signatures and dust depletion patterns can be degenerate (Prochaska 2003). For
this reason, nitrogen abundances are particularly valuable. Nitrogen nucleosynthesis depends on
the initial metallicity of the gas, and consequently in “chemically young” gas, nitrogen is expected
(and observed) to be significantly underabundant (e.g. Vila Costas & Edmunds 1993; Pettini et al.
1995; Henry et al. 2000). Nitrogen is only lightly depleted by dust (Meyer et al. 1997), so N/O
provides a probe of the nucleosynthetic history that is not highly confused by dust depletion. Good
iron abundances are also particularly useful because Fe is highly prone to depletion by dust, even
in low-density, halo gas clouds (e.g., Savage & Sembach 1996). Consequently, iron can reveal the
presence of dust when many other elements show no depletion (see further discussion in Jenkins
2003). Since relative abundances could vary from one component to the next, we concentrate on
the strongest component only in this section.
We begin our examination of the relative abundances with iron. We have only detected a
single Fe II line, and moreover the line is weak and narrow. The Fe II column densities from direct
integration and profile fitting agree to within their 1σ uncertainties, but the best values from the
two techniques differ by 0.2 dex. If we neglect ionization corrections, we find [Fe/O] = 0.15+0.15−0.25
or [Fe/O] = 0.35+0.15−0.23 using the columns from direct integration and profile fitting, respectively.
Dust depletion would lead to iron underabundance, but in this case the opposite trend is seen:
Fe is marginally overabundant with respect to oxygen. Therefore, the iron measurements indicate
that this absorption system contains very little dust. In principle, Fe II can also require substantial
ionization corrections. However, it can be seen from Figure 6 that with the upper limit on U
imposed by the high ions, the Fe II ionization correction is small. Indeed, the ionization model in
Figure 6 adequately reproduces the column densities of all detections and limits (except the N I
limit), without requiring any depletion, at log U ≈ −3.7.
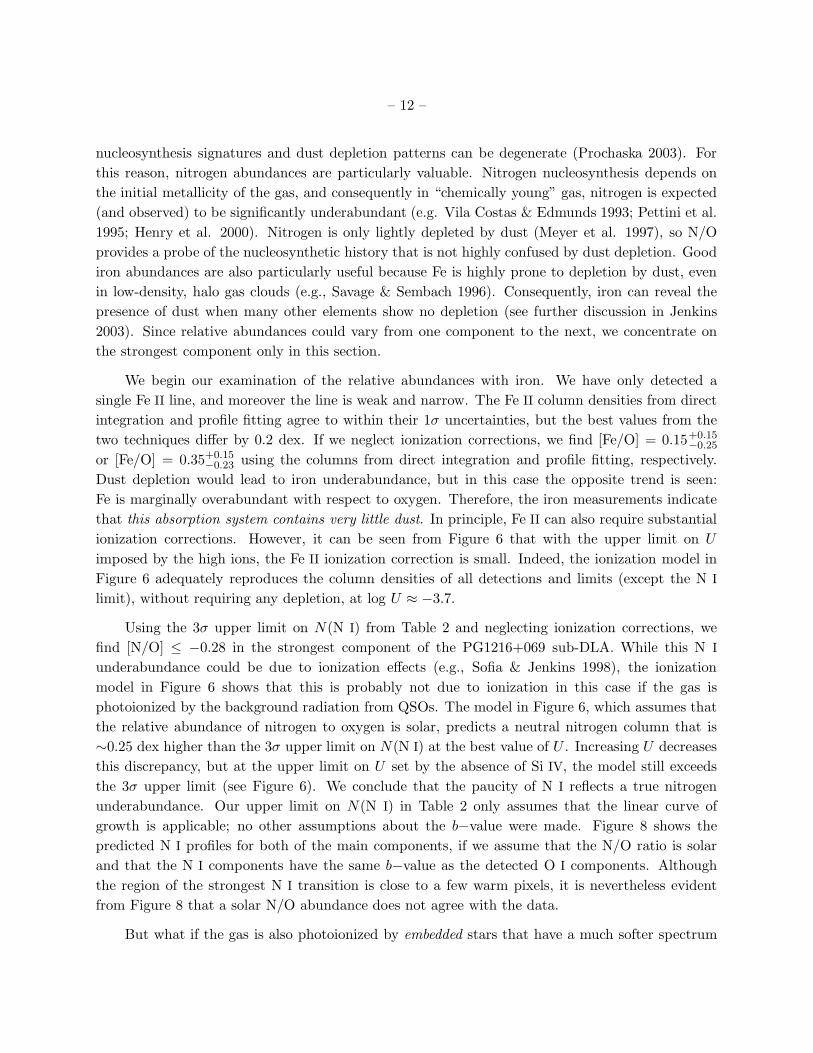
Using the 3σ upper limit on N(N I) from Table 2 and neglecting ionization corrections, we
find [N/O] ≤ −0.28 in the strongest component of the PG1216+069 sub-DLA. While this N I
underabundance could be due to ionization effects (e.g., Sofia & Jenkins 1998), the ionization
model in Figure 6 shows that this is probably not due to ionization in this case if the gas is
photoionized by the background radiation from QSOs. The model in Figure 6, which assumes that
the relative abundance of nitrogen to oxygen is solar, predicts a neutral nitrogen column that is
∼0.25 dex higher than the 3σ upper limit on N(N I) at the best value of U . Increasing U decreases
this discrepancy, but at the upper limit on U set by the absence of Si IV, the model still exceeds
the 3σ upper limit (see Figure 6). We conclude that the paucity of N I reflects a true nitrogen
underabundance. Our upper limit on N(N I) in Table 2 only assumes that the linear curve of
growth is applicable; no other assumptions about the b−value were made. Figure 8 shows the
predicted N I profiles for both of the main components, if we assume that the N/O ratio is solar
and that the N I components have the same b−value as the detected O I components. Although
the region of the strongest N I transition is close to a few warm pixels, it is nevertheless evident
from Figure 8 that a solar N/O abundance does not agree with the data.
But what if the gas is also photoionized by embedded stars that have a much softer spectrum
– 13 –
than the background flux employed in Figure 6? It is conceivable that the outer envelope of H I
could provide enough shielding to prevent penetration of the absorber by photons with appropriate
energy12 to produce significant amounts of Si IV and C IV, thereby satisfying the observational
upper limits on these species, but lower-energy photons from internal stars could still ionize the
nitrogen leading to a deficit of N I. In high-redshift DLAs, a striking correspondence between
the absorption-profile structure of Al III and lower-ionization stages13 has been noted; this could
indicate that soft stellar spectra play a role in the ionization of the high−z DLAs (e.g., Howk &
Sembach 1999). Also, in the Milky Way ISM within the “Local Bubble” in the immediate vicinity
of the Sun, a deficit of N I has been observed (Jenkins et al. 2000; Lehner et al. 2003); in this
context, the low N I columns are quite probably due to ionization effects since other observations
of sight lines extending beyond the Local Bubble boundaries suggest that the interstellar nitrogen
abundance is rather uniform in the solar neighborhood, and moreover nitrogen in this region is not
underabundant (e.g., Meyer et al. 1997).
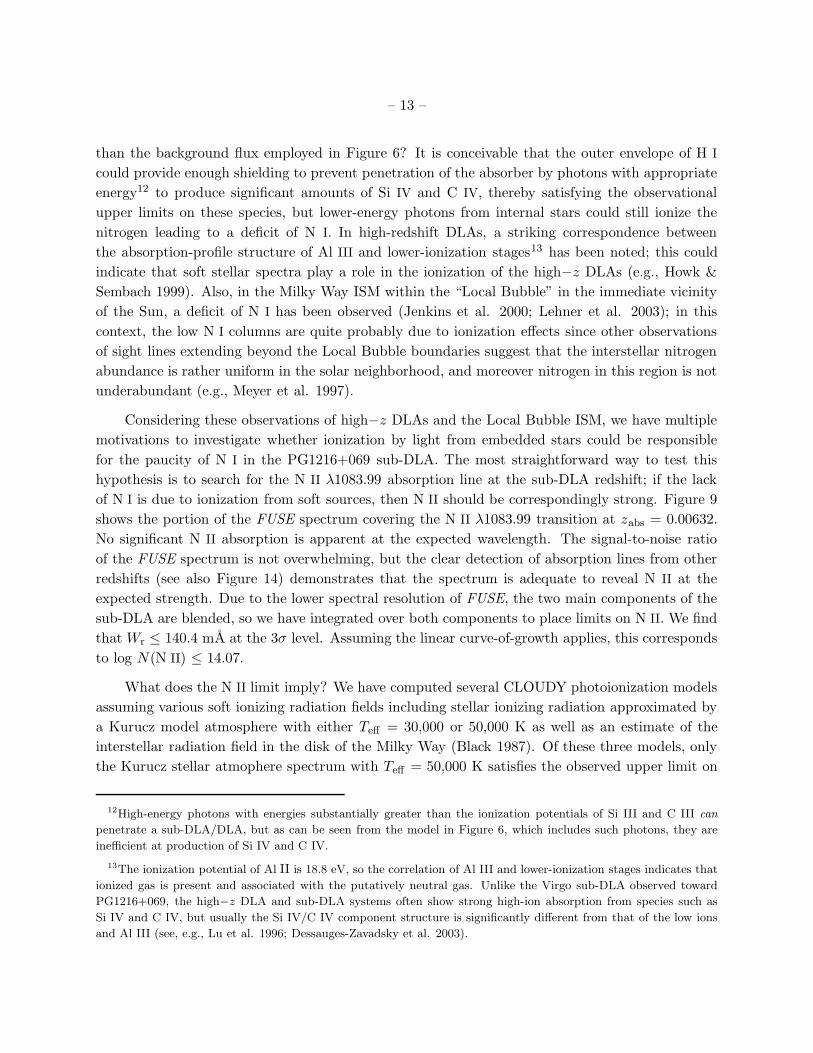
Considering these observations of high−z DLAs and the Local Bubble ISM, we have multiple
motivations to investigate whether ionization by light from embedded stars could be responsible
for the paucity of N I in the PG1216+069 sub-DLA. The most straightforward way to test this
hypothesis is to search for the N II λ1083.99 absorption line at the sub-DLA redshift; if the lack
of N I is due to ionization from soft sources, then N II should be correspondingly strong. Figure 9
shows the portion of the FUSE spectrum covering the N II λ1083.99 transition at zabs = 0.00632.
No significant N II absorption is apparent at the expected wavelength. The signal-to-noise ratio
of the FUSE spectrum is not overwhelming, but the clear detection of absorption lines from other
redshifts (see also Figure 14) demonstrates that the spectrum is adequate to reveal N II at the
expected strength. Due to the lower spectral resolution of FUSE, the two main components of the
sub-DLA are blended, so we have integrated over both components to place limits on N II. We find
that Wr ≤ 140.4 mA at the 3σ level. Assuming the linear curve-of-growth applies, this corresponds
to log N(N II) ≤ 14.07.
What does the N II limit imply? We have computed several CLOUDY photoionization models
assuming various soft ionizing radiation fields including stellar ionizing radiation approximated by
a Kurucz model atmosphere with either Teff = 30,000 or 50,000 K as well as an estimate of the
interstellar radiation field in the disk of the Milky Way (Black 1987). Of these three models, only
the Kurucz stellar atmophere spectrum with Teff = 50,000 K satisfies the observed upper limit on
12High-energy photons with energies substantially greater than the ionization potentials of Si III and C III can
penetrate a sub-DLA/DLA, but as can be seen from the model in Figure 6, which includes such photons, they are
inefficient at production of Si IV and C IV.
13The ionization potential of Al II is 18.8 eV, so the correlation of Al III and lower-ionization stages indicates that
ionized gas is present and associated with the putatively neutral gas. Unlike the Virgo sub-DLA observed toward
PG1216+069, the high−z DLA and sub-DLA systems often show strong high-ion absorption from species such as
Si IV and C IV, but usually the Si IV/C IV component structure is significantly different from that of the low ions
and Al III (see, e.g., Lu et al. 1996; Dessauges-Zavadsky et al. 2003).
– 14 –
N I/O I in the Virgo sub-DLA (the other two models cannot produce a low enough N I/O I ratio).
However, when the N I/O I limit is satisfied, the 50,000 K stellar spectrum produces an N II column
density that exceeds our 3σ upper limit. Based on these models and the N II limit, we conclude
that internal ionization by soft sources is also an unlikely explanation of the absence of nitrogen
absorption in the PG1216+069 sub-DLA.
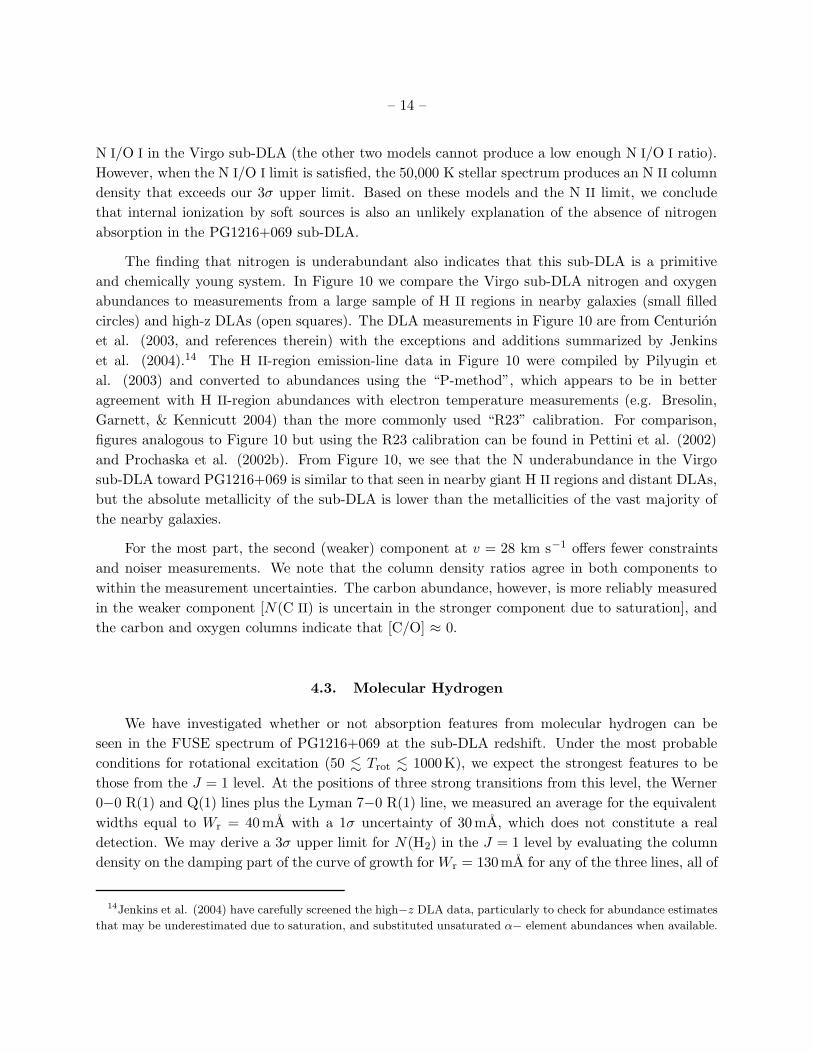
The finding that nitrogen is underabundant also indicates that this sub-DLA is a primitive
and chemically young system. In Figure 10 we compare the Virgo sub-DLA nitrogen and oxygen
abundances to measurements from a large sample of H II regions in nearby galaxies (small filled
circles) and high-z DLAs (open squares). The DLA measurements in Figure 10 are from Centurion
et al. (2003, and references therein) with the exceptions and additions summarized by Jenkins
et al. (2004).14 The H II-region emission-line data in Figure 10 were compiled by Pilyugin et
al. (2003) and converted to abundances using the “P-method”, which appears to be in better
agreement with H II-region abundances with electron temperature measurements (e.g. Bresolin,
Garnett, & Kennicutt 2004) than the more commonly used “R23” calibration. For comparison,
figures analogous to Figure 10 but using the R23 calibration can be found in Pettini et al. (2002)
and Prochaska et al. (2002b). From Figure 10, we see that the N underabundance in the Virgo
sub-DLA toward PG1216+069 is similar to that seen in nearby giant H II regions and distant DLAs,
but the absolute metallicity of the sub-DLA is lower than the metallicities of the vast majority of
the nearby galaxies.
For the most part, the second (weaker) component at v = 28 km s−1 offers fewer constraints
and noiser measurements. We note that the column density ratios agree in both components to
within the measurement uncertainties. The carbon abundance, however, is more reliably measured
in the weaker component [N(C II) is uncertain in the stronger component due to saturation], and
the carbon and oxygen columns indicate that [C/O] ≈ 0.
4.3. Molecular Hydrogen
We have investigated whether or not absorption features from molecular hydrogen can be
seen in the FUSE spectrum of PG1216+069 at the sub-DLA redshift. Under the most probable
conditions for rotational excitation (50 . Trot . 1000K), we expect the strongest features to be
those from the J = 1 level. At the positions of three strong transitions from this level, the Werner
0−0 R(1) and Q(1) lines plus the Lyman 7−0 R(1) line, we measured an average for the equivalent
widths equal to Wr = 40mA with a 1σ uncertainty of 30mA, which does not constitute a real
detection. We may derive a 3σ upper limit for N(H2) in the J = 1 level by evaluating the column
density on the damping part of the curve of growth for Wr = 130mA for any of the three lines, all of
14Jenkins et al. (2004) have carefully screened the high−z DLA data, particularly to check for abundance estimates
that may be underestimated due to saturation, and substituted unsaturated α− element abundances when available.
– 15 –
which have nearly the same wavelengths, f−values (Abgrall & Roueff 1989) and lifetimes (Morton
& Dinerstein 1976). Our upper limit is N(H2) = 7 × 1017cm−2. The limit for H2 in all rotational
states should be about triple this value if Trot ≈ 1000K. Under this condition, our limit for the
fraction of hydrogen atoms in molecular form f(H2) ≡ N(H2)/[2N(H2)+N(H I)] < 8.4×10⁻². This
limit is somewhat above values found for some high−z DLAs (Curran et al. 2004 and references
therein) and the Magellanic Clouds (Tumlinson et al. 2002), but is below a large number of the
measurements toward only moderately reddened stars in our Galaxy (Savage et al. 1977). Since H2
forms primarily on the surface of dust grains, a low H2 fraction is expected in the Virgo sub-DLA
given the low metallicity and dust content derived in the previous sections.
5. Physical Conditions and Neutral Gas Content
In addition to abundance constraints, the ionization models provide information on physical
conditions of the gas such as the particle number density, temperature, thermal pressure, and
neutral fraction of the gas. The gas ion fractions and therefore the neutral gas content of the
absorber are generally well-constrained by the models. Other physical quantities suffer greater
uncertainties. For example, in principle nH is directly related to the ionization parameter U , but
there is a caveat: since U = nγ/nH, the derived nH depends on the intensity taken for the ionizing
radiation field. For the model shown in Figure 6, we have assumed Jν = 10−23 ergs cm−2 s−1
Hz−1 sr−1, a value in good agreement with current observational bounds on the UV background
from QSOs at z ≈ 0. However, Jν is still only loosely bracketed by observations (see, e.g., Shull
et al. 1999; Dave & Tripp 2001; Weymann et al. 2001). Moreover, given the high N(H I) of the
PG1216+069 sub-DLA, it is possible that stars are located in or near the gas. We have constructed
photoionization models for the Virgo sub-DLA assuming that nearby hot stars contribute to the
ionizing radiation in addition to the flux from background quasars, and we reach generally similar
conclusions regarding the ionization corrections and neutral gas fraction based on the stars+QSOs
model. However, adding stars increases nγ , and therefore a stars+QSOs model at the same value of
U has to have a higher nH than the analogous QSOs-only model. For this reason, the nH constraints
from the QSOs-only model are most conservatively treated as lower limits. In turn, the implied
gas pressure is also a lower limit, and the line-of-sight absorber size is an upper limit. The mean
gas temperature also depends on the model parameters, but less sensitively.
With this caveat, we show in Figures 6 and 11 some of the physical conditions implied by the
photoionization modeling. The top axis of Figure 6 shows the particle density for the QSOs-only
ionizing radiation field for the assumed value of Jν at 1Ryd; we treat these densities as lower limits.
Figure 11 presents the H I ion fraction (left axis) and mean gas temperature (right axis) for the
same model as a function of log U . The upper limit on N(Si IV) requires log nH ≥ −3.4, log f(H I)
≥ −0.8, T ≤ 13,000 K, and thermal pressure P/k ≥ 10 K cm−3. In this model, the line-of-sight
absorber size is less than ∼100 kpc. We see from Figure 11 that even though high ions such as
Si IV and C IV are not detected in the Virgo sub-DLA, it could still contain a substantial amount of
– 16 –
ionized gas. At the best-fitting ionization parameter (log U ≈ −3.7, shown with a thick vertical line
in Figure 11), ∼50% of the hydrogen is ionized. While the particle number density and absorber
size are uncertain, it is interesting to note that the gas could be self-gravitating with the physical
conditions indicated by the model in Figure 6 at log U ≈ −3.7, assuming the baryon-to-dark matter
ratio Ωb/Ωm ≈ 0.15 (see, e.g., Schaye 2001).
6. Absorber Environment
As noted in §1 and shown in Figure 1, the sight line to PG1216+069 pierces the outskirts of the
Virgo cluster and the X-ray bright NGC4261 galaxy group (Davis et al. 1995). Although the sight
line does not penetrate the Virgo cluster 6 core, it does pass within the cluster’s maximum angle of
influence according to the model of Tully & Shaya (1984). The QSO is also in the general direction
of the Virgo W and W′ structures south of the cluster proper (e.g., de Vaucouleurs 1961; Binggeli
et al. 1993). Compared to most low−z Lyα absorbers, the PG1216+069 sub-DLA is certainly
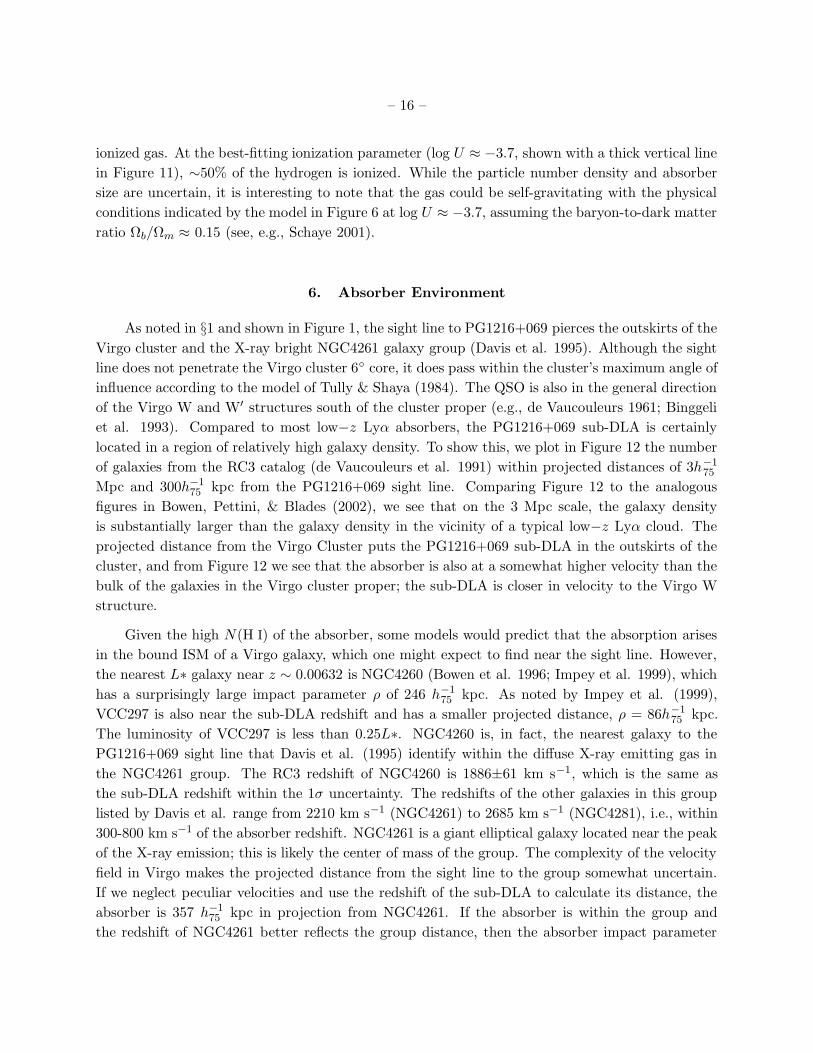
located in a region of relatively high galaxy density. To show this, we plot in Figure 12 the number
of galaxies from the RC3 catalog (de Vaucouleurs et al. 1991) within projected distances of 3h−175
Mpc and 300h−175 kpc from the PG1216+069 sight line. Comparing Figure 12 to the analogous
figures in Bowen, Pettini, & Blades (2002), we see that on the 3 Mpc scale, the galaxy density
is substantially larger than the galaxy density in the vicinity of a typical low−z Lyα cloud. The
projected distance from the Virgo Cluster puts the PG1216+069 sub-DLA in the outskirts of the
cluster, and from Figure 12 we see that the absorber is also at a somewhat higher velocity than the
bulk of the galaxies in the Virgo cluster proper; the sub-DLA is closer in velocity to the Virgo W
structure.
Given the high N(H I) of the absorber, some models would predict that the absorption arises
in the bound ISM of a Virgo galaxy, which one might expect to find near the sight line. However,
the nearest L∗ galaxy near z ∼ 0.00632 is NGC4260 (Bowen et al. 1996; Impey et al. 1999), which
has a surprisingly large impact parameter ρ of 246 h−175 kpc. As noted by Impey et al. (1999),
VCC297 is also near the sub-DLA redshift and has a smaller projected distance, ρ = 86h−175 kpc.
The luminosity of VCC297 is less than 0.25L∗. NGC4260 is, in fact, the nearest galaxy to the
PG1216+069 sight line that Davis et al. (1995) identify within the diffuse X-ray emitting gas in
the NGC4261 group. The RC3 redshift of NGC4260 is 1886±61 km s−1, which is the same as
the sub-DLA redshift within the 1σ uncertainty. The redshifts of the other galaxies in this group
listed by Davis et al. range from 2210 km s−1 (NGC4261) to 2685 km s−1 (NGC4281), i.e., within
300-800 km s−1 of the absorber redshift. NGC4261 is a giant elliptical galaxy located near the peak
of the X-ray emission; this is likely the center of mass of the group. The complexity of the velocity
field in Virgo makes the projected distance from the sight line to the group somewhat uncertain.
If we neglect peculiar velocities and use the redshift of the sub-DLA to calculate its distance, the
absorber is 357 h−175 kpc in projection from NGC4261. If the absorber is within the group and
the redshift of NGC4261 better reflects the group distance, then the absorber impact parameter
– 17 –
to NGC4261 increases to ∼400 h−175 kpc. Of course, these impact parameters are only lower limits
on the distance from the absorber to the group center since they do not include the line-of-sight
distance between the group and the absorbing gas. Since the sub-DLA redshift is a few hundred
km s−1 less than the bulk of the galaxy redshifts, it is possible that the true distance is substantial.
We note that the metal abundance in the diffuse X-ray emitting gas derived by Davis et al. (1995)
is consistent with the abundance we have derived for the PG1216+069 sub-DLA, but the ROSAT
data evidently allow a substantial range of metallicities.
Chen et al. (2001) have obtained high-resolution HST/WFPC2 imaging and spectroscopic
galaxy redshifts in order to study the relationship between the galaxies and Lyα clouds in the
direction of PG1216+069, and they have not found any close galaxies at Virgo redshifts either.
Figure 13 shows a portion of a WFPC2 image of the QSO with the redshifts from Chen et al.
labeled. While a number of galaxies with unknown redshifts are readily apparent in Figure 13,
based on their angular sizes, these galaxies are likely to be distant background galaxies beyond
Virgo. The galaxies with unknown redshifts are also quite faint; apart from the extended spiral at
z = 0.1242, most of the galaxies near the sight line in Figure 13 have m 21 in the WFPC2 F702W
filter. We note that a bright foreground star is present near PG1216+069, and while unlikely, a
Virgo galaxy could be masked by this foreground object. It would be valuable to search for Virgo
galaxies near PG1216+069 using H I 21 cm and/or Hα imaging.
7. Warm-Hot Gas in the NGC4261 Galaxy Group
The proximity of the sight line to the X-ray bright NGC4261 group provides an opportunity to
test ideas regarding the location of the “missing baryons” at the present epoch. As has been widely
discussed by various authors (e.g., Persic & Salucci 1992; Fukugita, Hogan, & Peebles 1998) the
combined masses in well-observed baryonic components of the nearby universe do not add up to
the expected mass in baryons predicted by D/H measurements and cosmic microwave background
observations (e.g., Spergel et al. 2003; Sembach et al. 2004), the so-called missing-baryons problem.
Hydrodynamic simulations of cosmological structure evolution suggest that these missing baryons
are located in “warm-hot” shock-heated gas at 105 − 107 K in regions of the intergalactic medium
at modest overdensities (e.g., Cen & Ostriker et al. 1999; Dave et al. 2001). In contrast, Fukugita
et al. (1998) have hypothesized that the missing baryons are predominantly found in similarly-hot
gas, but in higher overdensity regions near galaxy groups. In either case, the O VI doublet provides
a sensitive means to search for the warm-hot gas since the O VI ion fraction peaks at T ∼ 105.5
K. Observations of low-z QSOs have frequently revealed redshifted O VI absorption lines that are
clearly correlated with galaxies (e.g., Tripp & Savage 2000; Chen & Prochaska 2000; Tripp et al.
2001; Savage et al. 2002), but so far these studies have not had sufficient information regarding
the nearby galaxies to establish if they form a bound group with the overdensity expected in the
Fukugita et al. hypothesis or if they are situated in lower overdensity unvirialized environments as
expected from the cosmological simulations.
– 18 –
A few preliminary searches for O VI associated with well-defined galaxy groups have been
attempted (e.g., Wakker et al. 2003; Pisano et al. 2004), but no definitive detections of O VI have
yet been reported. The PG1216+069 sight line through the NGC4261 group is appealing for this
purpose because the diffuse X-ray emission establishes that the group certainly contains intragroup
gas, at least in its inner regions, and because the sight line impact parameter is relatively small
(compared to available QSO/group pairs bright enough for high-resolution UV spectroscopy with
current facilities). Figure 14 shows the portion of the FUSE spectrum of PG1216+069 covering
the O VI doublet at the redshifts of the NGC4261 group (the expected wavelengths of O VI at
the redshift of the sub-DLA are also marked). No O VI absorption is evident at the NGC4261 or
sub-DLA redshifts. Unfortunately, the stronger O VI λ1031.93 line falls in a messy region affected
by the Galactic O I λ1039.23 absorption, a Lyβ line at zabs = 0.01258, and terrestrial O I airglow
emission lines (Feldman et al. 2001).15 Consequently, we must rely on the weaker line to place
upper limits on the O VI column density. Integrating over the velocity range of the detected
low-ionization lines in the sub-DLA, we obtain a 3σ upper limit of log N(O VI) ≤ 14.26; limits
at the slightly higher redshift of the NGC4261 group are similar assuming a comparable velocity
integration range.
This constraint is limited by the modest signal-to-noise ratio of the data and the need to use
the weaker line. Nevertheless, the upper limit is comparable to the column densities of the stronger
O VI absorbers detected in other directions (e.g., Tripp et al. 2000a; Chen & Prochaska 2000;
Savage et al. 2002; Howk, Prochaska, & Chen 2004). Given the detection of X-ray emitting gas
with ROSAT (Davis et al. 1995), it seems possible that the intragroup gas is too hot to show
O VI (i.e., the oxygen is predominantly in higher ionization stages). However, in this case the
sub-DLA might be expected to show, e.g., C IV from the interface between the hot X-ray gas and
the low-ionization gas. It is possible that the sub-DLA is too far from the NGC4261 group to be
affected by the hot gas. It would be valuable to obtain a higher S/N observation, but this will be
difficult with current FUSE pointing constraints.
8. Discussion
The absorber properties derived above for the PG1216+069 sub-DLA are, in some regards,
surprising. The gas metallicity is extremely low given the location of the gas in a region of relatively
high galaxy density near the Virgo cluster and an X-ray bright galaxy group. In fact, the absolute
abundance of this sub-DLA is comparable to the lowest gas-phase metallicities known in the nearby
universe (see Figure 10). For example, the blue compact dwarf (BCD) galaxies I Zw 18 and
SBS0335-052 are among the most metal-poor galaxies so far found at low redshifts. Analysis of
H II region emission lines indicates that these BCD galaxies have gas-phase metallicities Z ≈ 0.02Z
15Based on the strength of the O I λ1302.17 transition in the STIS spectrum, O I λ1039.23 should be detectable
in the FUSE data. Evidently the 1039.23 line is largely filled in by terrestrial O I λ1039.23 emission.
– 19 –
(Izotov et al. 1999). Measurement of absorption lines in I Zw 18 yield similar low metallicities;
possibly the abundances in the diffuse H I regions probed by the absorption lines are a few tenths of
a dex lower than the H II region abundances (Aloisi et al. 2003; Lecavelier des Etangs et al. 2004).
Even lower metallcities have been observed in high−z QSO absorption systems and some Galactic
stars, but high−z absorbers and low-metallcity stars both probe earlier epochs in the history of
the universe; the DLA discussed in this paper provides information about the current metallicity
of the absorbing entity.
But what is the nature of the absorbing entity? The absorber has similarites to some well-
studied low−z objects. The PG1216+069 sub-DLA is reminiscent of the BCD galaxy I Zw 18 in
many ways. As already noted, both objects have extremely low gas-phase metallicities. Like the
PG1216+069 sub-DLA, I Zw 18 contains a lot of neutral gas (van Zee et al. 1998b; Aloisi et al. 2003;
Lecavelier des Etangs et al. 2004). However, the most intriguing similarities of the sub-DLA and
the BCD galaxy are the relative metal abundances. Aloisi et al. (2003) find that nitrogen is highly
underabundant in I Zw 18, and yet they find no clear indication of α−element overabundances.
On the contrary, they report that the α−elements O and Si are marginally underabundant with
respect to iron. The abundance pattern in I Zw 18 is apparently similar to the abundance pattern
that we find in the Virgo sub-DLA (see § 4). The apparent lack of an identified counterpart for
the PG1216+069 sub-DLA could be used to argue against the hypothesis that the sub-DLA is
somehow related to a BCD galaxy. One might expect to see evidence of a I Zw 18-like galaxy in
the image shown in Figure 13. However, the QSO itself as well as the bright foreground star could
mask a faint galaxy close to the sight line. A search for Hα and/or 21 cm emission near the sight
line would be useful for testing the possibility that the sub-DLA is associated with a BCD galaxy.
The high-velocity clouds (HVCs) in the vicinity of the Milky Way are also similar to the
PG1216+069 sub-DLA in several respects. The HVCs have comparable H I column densities
(Wakker & van Woerden 1997; Wakker 2001), and when HVC metallicities have been measured,
they have showed similar abundance patterns. For example, HVC Complex C has a sub-solar
absolute abundance, [O/H] ≈ −0.8, it shows a significant nitrogen underabundance, and Complex
C iron abundances indicate that there is little or no dust depletion (Murphy et al. 2000; Richter
et al. 2001; Gibson et al. 2001; Collins et al 2003; Tripp et al. 2003; Sembach et al. 2004). In
all of these respects, the PG1216+069 Virgo sub-DLA is analogous to Complex C, although the
sub-DLA has a substanially lower overall metallicity than Complex C. Some redshifted gas clouds
analogous to the Milky Way HVCs have been detected in 21 cm emission studies of extragalactic
targets, e.g., the Leo ring in the M96 group (Schneider 1989) or the large H I cloud near 3C 273
(Giovanelli & Haynes 1989). Usually these 21 cm clouds have been shown to be closely associated
with some type of galaxy, albeit faint in some cases (e.g., Salzer et al. 1991).
It is worth noting that a lack of α−element enhancement (with respect to Fe) at low absolute
metallicity has been also been observed in stars in several nearby dwarf spheroidal (dSph) galaxies
(Shetrone, Cote, & Sargent 2001; Tolstoy et al. 2003). There are vast differences between some
properties of dSph galaxies and those of the PG1216+069 sub-DLA. For example, while the sub-
– 20 –
DLA is rich in neutral gas, dSph’s have only small amounts of associated neutral interstellar gas, at
least in the main galaxy where the stars are found (e.g., Carignan 1999). Nevertheless, there may
be a connection between high-N(H I) absorbers and dSph’s. Consider the Sculptor dSph galaxy. In
this galaxy, 21cm observations show little emission centered on the stars in the galaxy, but two lobes
of 21cm emission are detected at offsets of 15 − 20’ from the optical (stellar) galaxy (Carignan et
al. 1998). The symmetric morphology of the 21cm emission is suggestive of a bipolar outflow. The
velocities of the 21cm emission lobes are quite similar to the systemic velocity of the optical galaxy
of Sculptor, but the outflow could be transverse to the line of sight. Removal of interstellar gas
from dSph’s, either by supernovae-driven winds or by dynamical processes (tidal or ram-pressure
stripping), would help to explain the paradoxical indications of extended periods of star-formation
in dSph galaxies, which is difficult to reconcile with their current lack of interstellar gas (Blitz &
Robishaw 2000; Grebel, Gallagher, & Harbeck 2003). Once the gas has been removed from the
dSph galaxy, it could then give rise to a DLA. If a QSO sight line happened to pass through one
of the 21cm emission lobes near Sculptor, for example, the resulting absorber properties would
likely be very similar to the PG1216+069 sub-DLA: the absorber would have a similar H I column
density, similar overall low-metallicity, and based on the stellar abundances currently seen in dSph’s
(Tolstoy et al. 2003), similar relative abundance patterns.
Bowen et al. (1997) have searched for absorption lines in the vicinity of the dSph galaxy Leo
I using three background QSOs/AGNs at projected distances ranging from 2-8 kpc. One of their
spectra has insufficient signal-to-noise to place interesting limits, but the spectra of the other two
QSOs show no absorption at the velocity of Leo I, and Bowen et al. argue that N(H I) . 1017
cm−2 within 2-4 kpc of that dSph. Leo I therefore presents an interesting contrast to the Sculptor
dSph, and the Bowen et al. study argues against the hypothesis that dSph’s are a source of high-
N(H I) absorption systems. There are various possible explanations for the differences between
Sculptor, which shows high-N(H I) in its immediate vicinity, and Leo I, which apparently does not.
Sculptor is one of the nearest of the satellite galaxies of the Milky Way; Leo I is at least twice
as far away. Perhaps gas is only stripped when the dSph’s pass close to the Milky Way (Blitz &
Robishaw 2000; Grebel et al. 2003) and then dissapates relatively quickly (see Bowen et al. 1997).
However, there are no known luminous, large galaxies near the PG1216+069 sight line, so if this
is the correct explanation for the difference between Sculptor and Leo I, it then seems unlikely
that the PG1216+069 sub-DLA is related to a dSph. Another possibility is that Sculptor and its
associated clouds are related to the Magellanic Stream, which is located in the Sculptor direction
and has similar velocities (Putman et al. 2003).
Indeed, a unified hypothesis involving HVCs and dwarf satellite galaxies has some appeal.
Many of the HVCs near the Milky Way are probably due to material that has been ejected or
stripped out of satellite galaxies near the galaxy, in which case the comparisons of the PG1216+069
sub-DLA to dwarf galaxies and HVCs in the previous paragraphs may both be right. Certainly
the HVCs in the Magellanic Stream proper are stripped gas that was once in the Small Magellanic
Cloud. As noted, in the case of the dSph galaxies, the star-formation histories implied by the
– 21 –
observed stellar populations provide an independent motivation for considering scenarios that could
evacuate gas from the galaxies. However, if the sub-DLA gas was transported to its current location
in a supernova-driven wind or by ram-pressure stripping, considerable shock heating might be
expected to occur, leading to highly-ionized gas associated with the neutral gas. In contrast, there
are indications that tidal stripping could be a more gentle process. For example, in the direction of
NGC3783, the Galactic HVC at v = 247 km s−1 is now recognized to be tidally-stripped debris
from the SMC. While this tidally stripped material shows a wide array of low-ionization absorption
lines, it has little or no associated high-ion absorption (Lu et al. 1994; Sembach et al. 2001a).
Moreover, the tidally-stripped HVC contains molecular hydrogen, which Sembach et al. argue
formed in the SMC and survived the rigors of tidal stripping (as opposed to forming in situ in the
stream). Both the absence of high ions and the survival of H2 suggest that the stripping process
did not subject the gas to hearty shock heating in the NGC3783 HVC. Perhaps a similar process
led to the location of the PG1216+069 sub-DLA at a substantial distance from the nearest galaxy
without producing detectable associated high-ion absorption.
A final possibility is that the PG1216+069 sub-DLA arises in a small, ancient dark-matter
minihalo that formed before the epoch of reionization and subsequently evolved largely undistrubed.
Abel & Mo (1998) have argued that minihalos formed before reionization could accumlate and
retain substantial quanities of H I, and moreover their densities would likely be high enough so
that the objects would remain neutral after the substantial increase in background UV flux at the
reionization epoch. Minihalos formed after reionization would, in contrast, be more highly ionized,
hotter, and less able to accrete and retain gas (e.g., Bullock, Kravtsov, & Weinberg 2000). Maller
et al. (2003) have recently revisited this idea, and they conclude that while minihalos are unlikely
to give rise to Lyman limit absorbers, they could be a significant source of sub-DLA systems.
The simple kinematical structure of the PG1216+069 sub-DLA is consistent with expectations
for minihalos, which would have circular velocities vc . 30 km s−1. Kepner et al. (1999) have mod-
eled the absorption-line signatures of photoionized gas in dark-matter minihalos, and their column
density predictions, including the H I column density, the upper limit on molecular hydrogen, and
the low ion/high ion column density ratios of the metals, are consistent with the observed properties
of the Virgo sub-DLA if the diameter of the minihalo is ∼ 1 kpc (see Figures 2 and 5 in Kepner
et al). Bearing in mind the caveats of § 5, it is interesting to note that the line-of-sight diameter
of the best-fitting CLOUDY model shown in Figure 6 would be consistent with the size implied by
the Kepner et al. model if log U . −4.0. Given that there could be some starlight that contributes
to the ionizing flux (which makes the absorber thickness smaller), the Kepner et al. size can be
reconciled with the photoionization models for the PG1216+069 sub-DLA. The sub-DLA metallic-
ity is larger than metallicities typically derived for diffuse Lyα forest gas at high redshifts, so this
hypothesis would require some self-enrichment from internal stars in the minihalo. Very low-level
star formation and self enrichment are plausible, e.g., triggered by occassional perturbations of the
gas, but one weakness of this idea is that a small number of supernovae could blow away the gas
in the minihalo.
– 22 –
9. Summary
Using a new high-resolution observation of PG1216+069 obtained with the E140M echelle mode
of STIS, we have identified a nearby sub-damped Lyα absorber at zabs = 0.00632 with log N(H I)
= 19.32±0.03. This absorption system has several remarkable properties. First, the overall metal
abundance is surprisingly low; we find [O/H] = −1.60+0.09−0.11 and −1.77 ≤ [Si/H] ≤ −1.35. These are
among the lowest metallicity measurements in the gas phase known in the nearby universe (stars can
have much lower abundances, but low stellar abundances are fossils that mainly provide information
about earlier epochs). Second, the iron abundance indicates that this absorber harbors very little
dust. Third, nitrogen is significantly underabundant, which indicates that the gas is “chemically
young”. However, comparison of the oxygen, silicon, and iron abundances shows no significant
evidence of α−element overabundances. Fourth, although the gas is situated in the outer reaches
of the Virgo galaxy cluster and the NGC4261 galaxy group, there are no known luminous galaxies
within the projected distance that might be expected for such a high-N(H I) absorber. The nearest
L∗ galaxy is NGC4260 at a projected distance of 246 h−175 kpc, and even the closest known sub-
luminous galaxy is at a substantial projected distance, ρ = 86h−175 kpc. We place limits on O VI
absorption associated with the NGC4261 galaxy group, which is known to have hot intragroup gas
from detection for diffuse X-ray emission.
The abundance patterns in the sub-DLA are reminiscent of abundances in nearby dwarf galax-
ies and of gas-phase abundances in high-velocity clouds near the Milky Way. We discuss the
possibility that this absorber is related to a dwarf galaxy and/or a high-velocity cloud in the outer
region of the Virgo galaxy cluster. It is also possible that the PG1216+069 sub-DLA arises in
a small dark-matter halo. In this case, it is likely that the halo formed and accumlated gas in
the early universe before reionization occurred, and since that time has only undergone meager
self-enrichment from internal star formation. Several future measurements would be helpful for
understanding the nature of this absorber. Better measurements of the Fe abundance would be
valuable for learning about relative abundance patterns in the sub-DLA; in addition, the strong
Fe II lines and higher signal-to-noise achievable with the far-UV mode of STIS would enable detec-
tion of weaker absorption components. We have shown that weak components will not affect the
derived total abundances much, but the kinematics implied by the presence (or absence) of higher
velocity features would be useful for testing the small dark-matter halo interpretation. A minihalo
should have a low circular velocity and simple kinematics, and high-velocity weak components are
not expected in this model. A deep 21 cm emission map with high spatial resolution at Virgo
redshifts would test several of the possible interpretations we have presented for the sub-DLA.
For example, if the sub-DLA is part of a tidally-stripped gas structure or is analogous to the H I
ring in the M96 group or the Giovanelli & Haynes cloud, this would be revealed by deep 21 cm
observations. Moreover, such structures would have clearly different morphologies from a minihalo
or compact high-velocity cloud. Narrow-band Hα imaging could also provide useful clues about
the nature of the sub-DLA, e.g., to search for evidence of a faint star-forming galaxy near the sight
line. Regardless of the detailed nature of the absorber, this observation unambiguously shows that
– 23 –
relatively primitive gas that has undergone little chemical enrichment (compared to metallicities in
high-redshift gases) is still found at the present epoch.
This paper benefitted from valuable discussions with Ari Maller, Blair Savage, and Ken Sem-
bach. The STIS observations were obtained under the auspices of HST program 9148, with financial
support through NASA grant HST-GO-9184.08-A from the Space Telescope Science Institute. We
also appreciate and acknowledge support from NASA LTSA grant NNG04GG73G. The FUSE data
were obtained by the PI team of the NASA-CNES-CSA FUSE project, which is operated by Johns
Hopkins University with financial support through NASA contract NAS 5-32985. This research
has made use of the NASA/IPAC Extragalactic Database (NED), which is operated by the Jet
Propulsion Laboratory, California Institute of Technology, under contract with NASA.
A. STIS Wavelength Calibration Errors
According to the Cycle 13 STIS Handbook, the relative wavelength calibration of STIS spectra
recorded with the MAMA detectors is accurate to 0.25-0.5 pixels across an exposure, and the
absolute wavelength calibration (i.e., the zero point) is good to 0.5−1.0 pixels (Kim Quijano et
al. 2003). We have examined many spectra obtained with the STIS echelle modes (which use the
MAMA detectors), and in general we have found the wavelength calibration to be excellent. Jenkins
& Tripp (2001) noticed small wavelength calibration errors in a particular order of a set of E230H
spectra, but in various projects using STIS E140M spectra of a large number of targets, we have
usually found that absorption lines (that are appropriate for comparison) are well-aligned across
the full wavelength range of STIS echelle spectra, in agreement with the accuracies reported in the
STIS Handbook. Consequently, we were surprised to find evidence of somewhat larger wavelength
calibration errors in the STIS E140M echelle spectrum of PG1216+069. We find indications that
the relative wavelength calibration errors are as large as ∼1 pixel. Some of this evidence is shown
in Figures 15-17. Figures 15 and 16 compare Na(v) profiles of several of the absorption lines in the
zabs = 0.00632 absorption system. In the left panels in these figures, no shifts have been applied to
the wavelength scale in the final reduced spectrum. Differences in the velocity centroids of these
lines are readily apparent. In the right panels in Figures 15-16, shifts of ∼1 pixel have been applied
to several of the lines, as described in the captions. Clearly, the ∼1 pixel corrections improve the
alignment of the various lines observed in this absorber.
Do we expect the transitions in Figures 15-16 to be well aligned? Could some multiphase/multicomponent
aspect of the absorber cause real differences in the kinematics of the various species compared in
these figures? The Si II transitions in Figure 16 should all show the same kinematical behavior.
Multiple components that are blended and unresolved could lead to confusing line profile differ-
ences in comparisons of strong and weak transitions of a particular species (because column density
components can be detectable in the strong lines but not the weak ones). However, comparisons
the weaker Si II transitions (e.g., 1304.37 vs. 1526.71) as well as weak vs. strong transitions (e.g.,
– 24 –
1260.42 and 1526.71) consistently require the same shifts, which suggests that this not a compo-
nent structure effect. Moreover, several other line comparisions consistently indicate that the same
wavelength scale corrections are needed. We find that lines at λ > 1330 A and λ < 1200 A must
be shifted compared to lines within the 1200-1330 A range. For example, Figure 15 shows several
species that are the dominant ionization stage in H I regions; these lines require the same shifts seen
in the Si II lines in Figure 16. In principle, dominant ions such as C II, Si II, and Fe II could arise
in ionized gas as well as the neutral gas, and this could cause profile differences, but the fact that
the same shifts are indicated by the data in Figure 15 argues that this is not an ionization effect.
Similarly, Figure 17 overplots the Milky Way S II λ1259.52 and Fe II λ1608.45 Na(v) profiles, and
the same shift leads to significantly improved alignment of these Galactic lines. The S II and Fe II
lines in Figure 17 are expected to have very similar strengths based on the abundances of these
species in the ISM and their atomic data, and these lines are expected to be well-aligned. In this
case, greater depletion of Fe by dust might generate profile differences, but since the same velocity
shift is again mandated, we believe that the difference in the left panel of Figure 17 is more likely
due to wavelength calibration errors.
We have also reduced the PG1216+069 E140M spectrum using the STScI pipeline, and we
find that the final pipeline spectrum is very similar to our spectrum (which was reduced with the
STIS Team software) and shows the same evidence of wavelength scale errors. We conclude that
the PG1216+069 shows unusually large relative wavelength errors compared to most STIS echelle
spectra that we have studied. However, even with these larger errors, the wavelength calibration
is still very good.
REFERENCES
Abel, T., & Mo, H. J. 1998, ApJ, 494, L151
Abgrall, H. & Roueff, E. 1989, A&AS, 79, 313
Allende Prieto, C., Lambert, D. L., & Asplund, A. 2001, ApJ, 556, L63
Allende Prieto, C., Lambert, D. L., & Asplund, A. 2002, ApJ, 573, L137
Aloisi, A., Savaglio, S., Heckman, T. M., Hoopes, C. G., Leitherer, C., & Sembach, K. R. 2003,
ApJ, 595, 760
Andre, M. K., et al. 2003, ApJ, 591, 1000
Aracil, B., Petitjean, P., Pichon, C., & Bergeron, J. 2004, A&A, 419, 811
Binggeli, B., Popescu, C. C., & Tammann, G. A. 1993, A&AS, 98, 275
Black, J. H. 1987, in Interstellar Processes, eds. D. J. Hollenbach & H. A. Thronson, (Dordrecht:
Reidel), 731
Blitz, L., & Robishaw, T. 2000, ApJ, 358, 375
– 25 –
Bohringer, H., Briel, U. G., Schwarz, R. A., Voges, W., Hartner, G., & Trumper, J. 1994, Nature,
368, 828
Bowen, D. V., Blades, J. C., Pettini, M. 1996, ApJ, 464, 141
Bowen, D. V., Huchtmeier, W., Brinks, E., Tripp, T. M., & Jenkins, E. B. 2001a, A&A, 372, 820
Bowen, D. V., Pettini, M., & Blades, J. C. 2002, ApJ, 580, 169
Bowen, D. V., Tolstoy, E., Ferrara, A., Blades, J. C., & Brinks, E. 1997, ApJ, 478, 530
Bowen, D. V., Tripp, T. M., & Jenkins, E. B., 2001b, AJ, 121, 1456
Bresolin, F., Garnett, D. R., & Kennicutt, R. C. 2004, ApJ, in press (astro-ph/0407065)
Bullock, J. S., Kravtsov, A. V., & Weinberg, D. H. 2000, ApJ, 539, 517
Carignan, C. 1999, PASA, 16, 18
Carignan, C., Beaulieu, S., Cote, S., Demers, S., & Mateo, M. AJ, 116, 1690
Cen, R., & Ostriker, J. P. 1999, ApJ, 514, 1
Cen, R., Ostriker, J. P., Prochaska, J. X., & Wolfe, A. M. 2003, ApJ, 598, 741
Centurion, M., Molaro, P., Vladilo, G., Peroux, C., Levshakov, S. A., & D’Odorico, V. 2003, A&A,
403, 55
Chen, H.-W., Lanzetta, K. M., Webb, J. K., & Barcons, X. 2001, ApJ, 559, 654
Chen, H.-W., & Prochaska, J. X. 2000, ApJ, 543, L9
Collins, J. A., Shull, J. M., & Giroux, M. L. 2003, ApJ, 585, 336
Curran, S. J., Webb, J. K., Murphy, M. T. & Carswell, R. F. 2004, MNRAS, 351, L24
Dave, R. et al. 2001, ApJ, 552, 473
Dave, R., & Tripp, T. M. 2001, ApJ, 553, 528
Davis, D. S., Mushotzky, R. F., Mulchaey, J. S., Worrall, D. M., Birkinshaw, M., & Burstein, D.
1995, ApJ, 444, 582
Dessauges-Zavadsky, M., Peroux, C., Kim, T.-S., D’Odorico, S., & McMahon, R. G. 2003, MNRAS,
345, 447
de Vaucouleurs, G. 1961, ApJS, 6, 213
de Vaucouleurs, G., de Vaucouleurs, A., Corwin, J. R., Buta, R. J., Paturel, G., & Fouque, P. 1991,
Third Reference Catalog of Bright Galaxies (New York: Springer)
Ellison, S. L., Yan, L., Hook, I. M., Pettini, M., Wall, J. V., & Shaver, P. 2001, A&A, 379, 393
Feldman, P. D., Sahnow, D. J., Kruk, J. W., Murphy, E. M., & Moos, H. W. 2001, JGR, 106, 8119
Ferland, G. J., Korista, K. T., Verner, D. A., Ferguson, J. W., Kingdon, J. B., & Verner, E. M.
1998, PASP, 110, 761
Field, G. B., & Steigman, G. 1971, 166, 59
– 26 –
Fitzpatrick, E. L., & Spitzer, L. 1997, ApJ, 475, 623
Fukugita, M., Hogan, C. J., & Peebles, P. J. E. 1998, ApJ, 503, 518
Gibson, B. K., Giroux, M. L., Penton, S. V., Stocke, J. T., Shull, J. M., & Tumlinson, J. 2001, AJ,
122, 3280
Giovanelli, R., & Haynes, M. P. 1989, ApJ, 346, L5
Grebel, E. K., Gallagher, J. S., & Harbeck, D. 2003, AJ, 125, 1926
Haardt, F., & Madau, P. 1996, ApJ, 461, 20
Henry, R. B. C., Edmunds, M. G., & Koppen, J. 2000, ApJ, 541, 660
Holweger, H. 2001, in AIP Conf. Proc. 598, Solar and Galactic Composition, ed. R. F. Wimmer-
Schweingruber (New York: AIP), 23
Howk, J. C., Prochaska, J. X., & Chen, H.-W. 2004, ApJ, submitted
Howk, J. C., & Sembach, K. R. 1999, ApJ, 523, L141
Impey, C. D., Petry, C. E., & Flint, K. P. 1999, ApJ, 524, 536
Izotov, Y. I., Chaffee, F. H., Foltz, C. B., Green, R. F., Guseva, N. G., & Thuan, T. X. 1999, ApJ,
527, 757
Jannuzi, B. T. et al. 1998, ApJS, 118, 1
Jenkins, E. B. 1996, ApJ, 471, 292
Jenkins, E. B. 2003, in Carnegie Observatories Astrophysics Series, Vol. 4: Origin and Evolution
of the Elements, eds. A. McWilliam & M. Rauch 2003 (Cambridge: Cambridge University
Press), in press (astro-ph/0309651)
Jenkins, E. B., Bowen, D. V., Tripp, T. M., & Sembach, K. R. 2004, in preparation
Jenkins, E. B., et al. 2000, ApJ, 538, L81
Jenkins, E. B., & Tripp, T. M. 2001, ApJS, 137, 297
Jenkins, E. B., Tripp, T. M., Wozniak, P. R., Sofia, U. J., & Sonneborn, G. 1999, ApJ, 520, 182
Kepner, J., Tripp, T. M., Abel, T., & Spergel, D. 1999, AJ, 117, 2063
Kimble, R. A., et al. 1998, ApJ, 492, L83
Kim Quijano, J. et al. 2003, “STIS Instrument Handbook”, (Baltimore: STScI)
Lauroesch, J. T., Truran, J. W., Welty, D. E., & York, D. G. 1996, PASP, 108, 641
Lecavelier des Etangs, A., Desert, J. M., Kunth, D., Vidal-Madjar, A., Callejo, G., Ferlet, R.,
Hebrard, G., & Lebouteiller, V. 2004, A&A, 413, 131
Lehner, N., Jenkins, E. B., Gry, C., Moos, H. W., Chayer, P., Lacour, S. 2003, ApJ, 595, 858
Levshakov, S. A., Agafonova, I. I., Reimers, D., & Baade, R. 2003, A&A, 404, 449
Lu, L., Sargent, W. L. W., Barlow, T. A., Churchill, C. W., & Vogt, S. 1996, ApJS, 107, 475
– 27 –
Lu, L., Savage, B. D., & Sembach, K. R. 1994, ApJ, 426, 563
Lockman, F. J., & Savage, B. D. 1995, ApJS, 97, 1
Maller, A. H., Prochaska, J. X., Somerville, R. S., & Primack, J. R. 2003, 343, 268
McWilliam, A. 1997, ARA&A, 35, 503
Meyer, D. M., Cardelli, J. A., & Sofia, U. J. 1997, ApJ, 490, L103
Meyer, D. M., Jura, M., & Cardelli, J. A. 1998, 493, 222
Moos, H. W., et al. 2002, ApJS, 140, 3
Morton, D. C. 1991, ApJS, 77, 119
Morton, D. C., 1999, private communication to the FUSE Team
Morton, D. C. & Dinerstein H. L. 1976, ApJ, 204, 1
Murphy, E. M., et al. 2000, ApJ, 538, L35
Nagamine, K., Springel, V., & Hernquist, L. 2004, MNRAS, 348, 435
Persic, M., & Salucci, P. 1992, MNRAS, 258, 14P
Pettini, M., Ellison, S. L., Bergeron, J., & Petitjean, P. 2002, A&A, 391, 21
Pettini, M., Ellison, S. L., Steidel, C. C., & Bowen, D. V. 1999, ApJ, 510, 576
Pettini, M., Lipman, K., & Hunstead, R. W. 1995, ApJ, 451, 100
Pettini, M., Madau, P., Bolte, M., Prochaska, J. X., Ellison, S. L., & Fan, X. 2003, ApJ, 594, 695
Pilyugin, L. S., Thuan, T. X., & Vılchez, J. M. 2003, A&A, 397, 487
Pisano, D. J., Wakker, B. P., Wilcots, E. M., & Fabian, D. 2004, AJ, 127, 199
Prochaska, J. X. 2003, in Carnegie Observatories Astrophysics Series, Vol. 4: Origin and Evolution
of the Elements, eds. A. McWilliam & M. Rauch 2003, in press (astro-ph/0310814)
Prochaska, J. X., Gawiser, E., Wolfe, A. M., Castro, S., & Djorgovski, S. G. 2003, ApJ, 595, L9
Prochaska, J. X., Henry, R. B. C., O’Meara, J. M., Tytler, D., Wolfe, A. M., Kirkman, D., Lubin,
D., & Suzuki, N. 2002b, PASP, 114, 933
Prochaska, J. X., Howk, J. C., O’Meara, J. M., Tytler, D., Wolfe, A. M., Kirkman, D., Lubin, D.,
& Suzuki, N. 2002a, ApJ, 571, 693
Prochaska, J. X., & Wolfe, A. M. 2002, ApJ, 566, 68
Putman, M. E., Staveley-Smith, L., Freeman, K. C., Gibson, B. K., & Barnes, D. G. 2003, ApJ,
586, 170
Rao, S., & Turnshek, D. A. 2000, ApJS, 130, 1
Richter, P., Sembach, K. R., Wakker, B. P., Savage, B. D., Tripp, T. M., Murphy, E. B., Kalberla,
P. M. W., & Jenkins, E. B. 2001, ApJ, 559, 318
Rosenberg, J. L., Ganguly, R., Giroux, M. L., & Stocke, J. T. 2003, ApJ, 591, 677
– 28 –
Salzer, J. J., di Serego Alighieri, S., Matteucci, F., Giovanelli, R., & Haynes, M. P. 1991, AJ, 101,
1258
Savage, B. D., Bohlin, R. C., Drake, J. F., & Budich, W. 1977, ApJ, 216, 291
Savage, B. D., & Sembach, K. R. 1991, ApJ, 379, 245
Savage, B. D., & Sembach, K. R. 1996, ARA&A, 34, 279
Savage, B. D., Sembach, K. R., Tripp, T. M., & Richter, P. 2002, ApJ, 564, 631
Schaye, J. 2001, ApJ, 559, 507
Schaye, J., Aguirre, A., Kim, T.-S., Theuns, T., Rauch, M., & Sargent, W. L. W. 2003, ApJ, 596,
768
Schindler, S., Binggeli, B., & Bohringer, H. 1999, A&A, 343, 420
Schneider, S. E. 1989, ApJ, 343, 94
Sembach, K. R., Howk, J. C., Savage, B. D., Shull, J. M. 2001a, AJ, 121, 992
Sembach, K. R., Howk, J. C., Savage, B. D., Shull, J. M., & Oegerle, W. R. 2001b, ApJ, 561, 573
Sembach, K. R., & Savage, B. D. 1992, ApJS, 83, 147
Sembach, K. R., et al. 2004, ApJS, 150, 387
Shetrone, M. D., Cote, P., & Sargent, W. L. W. 2001, ApJ, 548, 592
Simcoe, R. A., Sargent, W. L. W., & Rauch, M. 2004, ApJ, 606, 92
Shull, J. M., et al. 2000, ApJ, 538, L13
Shull, J. M., Roberts, D., Giroux, M. L., Penton, S. V., & Fardal, M. A. 1999, AJ, 118, 1450
Sofia, U. J., & Jenkins, E. B. 1998, ApJ, 499, 951
Songaila, A. 2001, ApJ, 561, L153
Spergel, D. N. et al. 2003, ApJS, 148, 175
Tolstoy, E., Venn, K. A., Shetrone, M., Primas, F., Hill, V., Kaufer, A., & Szeifert, T. 2003, AJ,
125, 707
Tripp, T. M., et al. 2002, ApJ, 575, 697
Tripp, T. M., et al. 2003, AJ, 125, 3122
Tripp, T. M., Giroux, M. L., Stocke, J. T., Tumlinson, J., & Oegerle, W. R. 2001, ApJ, 563, 724
Tripp, T. M., Savage, B. D., & Jenkins, E. B. 2000a, ApJ, 534, L1
Tripp, T. M., & Savage, B. D. 2000b, ApJ, 542, 42
Tully, R. B., & Shaya, E. J. 1984, ApJ, 281, 31
Tumlinson, J. et al. 2002, ApJ, 566, 857
van Zee, L., Westpfahl, D., Haynes, M., & Salzer, J. 1998, AJ, 115, 1000
– 29 –
Vila-Costas, M. B., & Edmunds, M. G. 1993, MNRAS, 265, 199
Wakker, B. P. 2001, ApJS, 136, 463
Wakker, B. P., et al. 2003, ApJS, 146, 1
Wakker, B. P., & van Woerden, H. 1997, ARA&A, 35, 217
Weymann, R. J., Vogel, S. N., Veilleux, S., & H. W. Epps 2001, ApJ, 561, 559
Wolfe, A. M., Turnshek, D. A., Smith, H. E., & Cohen, R. D. 1986, ApJS, 61, 249
Woodgate, B. E., et al. 1998, PASP, 110, 1183
This preprint was prepared with the AAS LATEX macros v5.0.
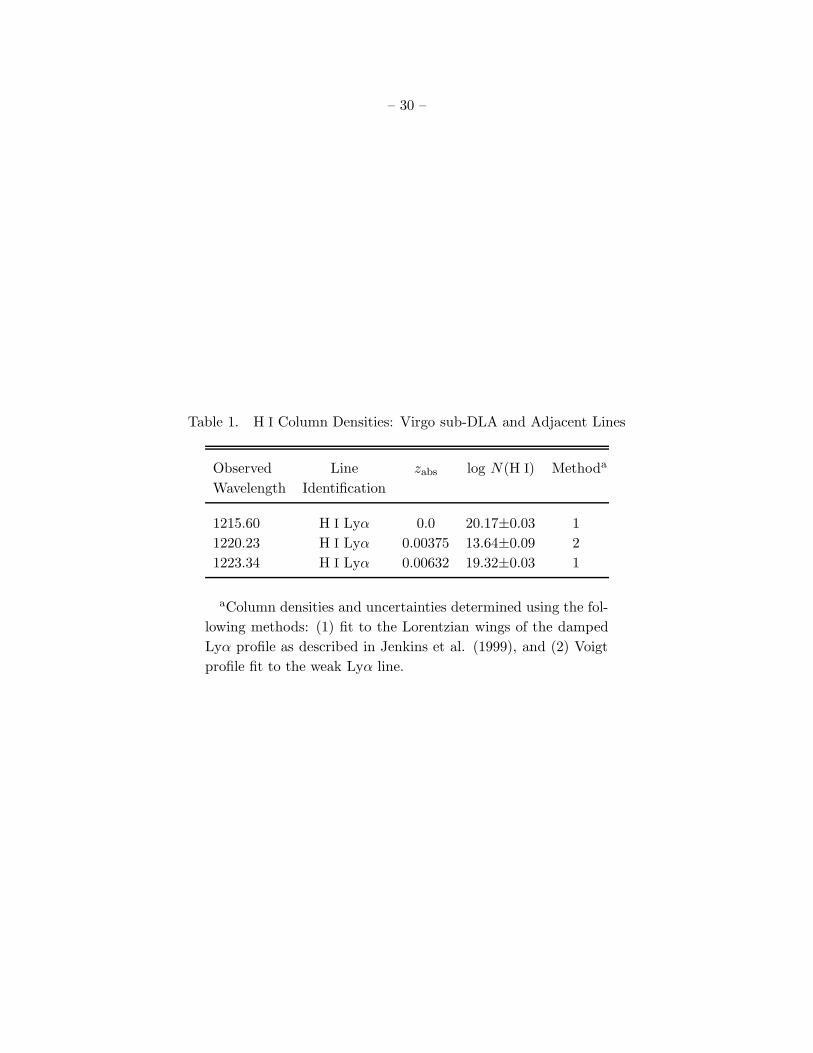
– 30 –
Table 1. H I Column Densities: Virgo sub-DLA and Adjacent Lines
Observed Line zabs log N(H I) Methoda
Wavelength Identification
1215.60 H I Lyα 0.0 20.17±0.03 1
1220.23 H I Lyα 0.00375 13.64±0.09 2
1223.34 H I Lyα 0.00632 19.32±0.03 1
aColumn densities and uncertainties determined using the fol-
lowing methods: (1) fit to the Lorentzian wings of the damped
Lyα profile as described in Jenkins et al. (1999), and (2) Voigt
profile fit to the weak Lyα line.
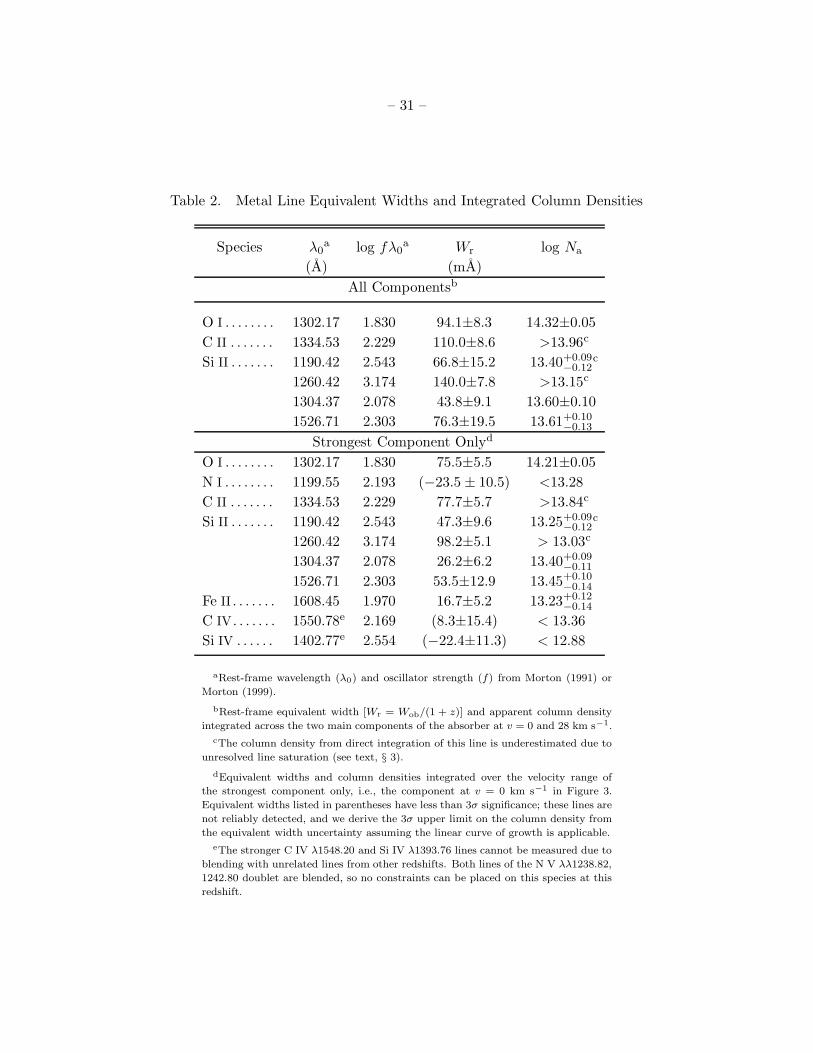
– 31 –
Table 2. Metal Line Equivalent Widths and Integrated Column Densities
Species λ0a log fλ0
a Wr log Na
(A) (mA)
All Componentsb
O I . . . . . . . . 1302.17 1.830 94.1±8.3 14.32±0.05
C II . . . . . . . 1334.53 2.229 110.0±8.6 >13.96c
Si II . . . . . . . 1190.42 2.543 66.8±15.2 13.40+0.09−0.12
c
1260.42 3.174 140.0±7.8 >13.15c
1304.37 2.078 43.8±9.1 13.60±0.10
1526.71 2.303 76.3±19.5 13.61+0.10−0.13
Strongest Component Onlyd
O I . . . . . . . . 1302.17 1.830 75.5±5.5 14.21±0.05
N I . . . . . . . . 1199.55 2.193 (−23.5 ± 10.5) <13.28
C II . . . . . . . 1334.53 2.229 77.7±5.7 >13.84c
Si II . . . . . . . 1190.42 2.543 47.3±9.6 13.25+0.09−0.12
c
1260.42 3.174 98.2±5.1 > 13.03c
1304.37 2.078 26.2±6.2 13.40+0.09−0.11
1526.71 2.303 53.5±12.9 13.45+0.10−0.14
Fe II . . . . . . . 1608.45 1.970 16.7±5.2 13.23+0.12−0.14
C IV . . . . . . . 1550.78e 2.169 (8.3±15.4) < 13.36
Si IV . . . . . . 1402.77e 2.554 (−22.4±11.3) < 12.88
aRest-frame wavelength (λ0) and oscillator strength (f) from Morton (1991) or
Morton (1999).
bRest-frame equivalent width [Wr = Wob/(1 + z)] and apparent column density
integrated across the two main components of the absorber at v = 0 and 28 km s−1.
cThe column density from direct integration of this line is underestimated due to
unresolved line saturation (see text, § 3).
dEquivalent widths and column densities integrated over the velocity range of
the strongest component only, i.e., the component at v = 0 km s−1 in Figure 3.
Equivalent widths listed in parentheses have less than 3σ significance; these lines are
not reliably detected, and we derive the 3σ upper limit on the column density from
the equivalent width uncertainty assuming the linear curve of growth is applicable.
eThe stronger C IV λ1548.20 and Si IV λ1393.76 lines cannot be measured due to
blending with unrelated lines from other redshifts. Both lines of the N V λλ1238.82,
1242.80 doublet are blended, so no constraints can be placed on this species at this
redshift.
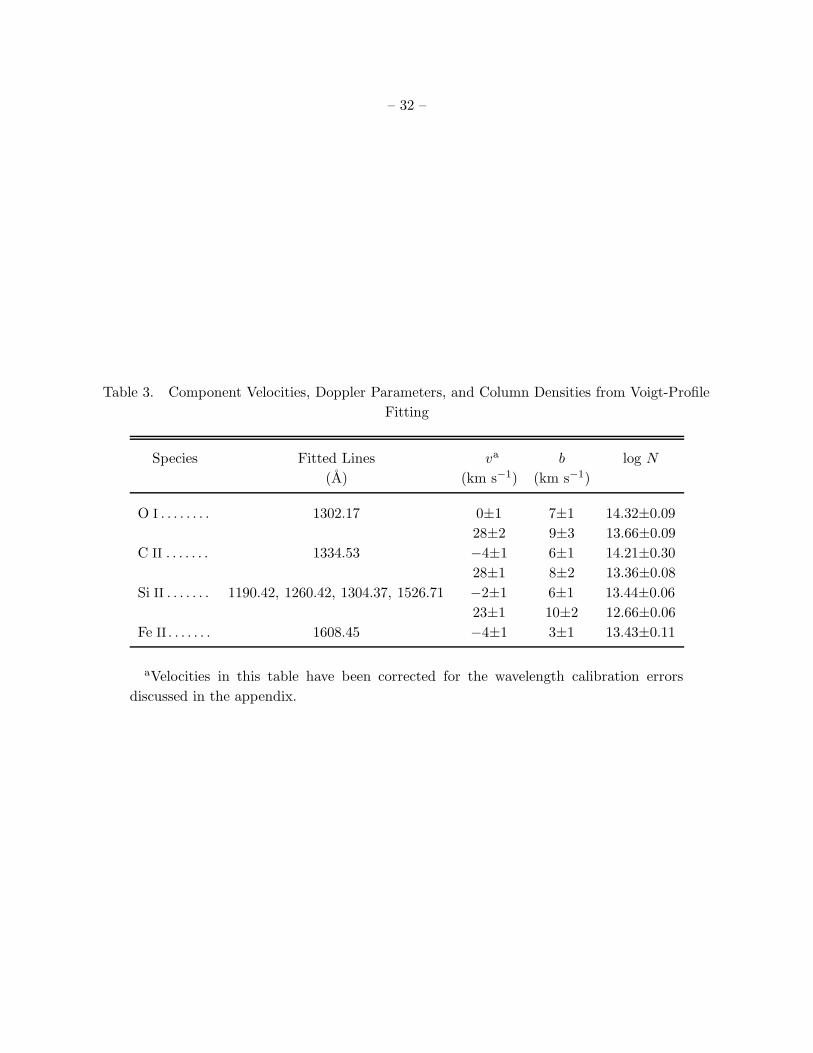
– 32 –
Table 3. Component Velocities, Doppler Parameters, and Column Densities from Voigt-Profile
Fitting
Species Fitted Lines va b log N
(A) (km s−1) (km s−1)
O I . . . . . . . . 1302.17 0±1 7±1 14.32±0.09
28±2 9±3 13.66±0.09
C II . . . . . . . 1334.53 −4±1 6±1 14.21±0.30
28±1 8±2 13.36±0.08
Si II . . . . . . . 1190.42, 1260.42, 1304.37, 1526.71 −2±1 6±1 13.44±0.06
23±1 10±2 12.66±0.06
Fe II . . . . . . . 1608.45 −4±1 3±1 13.43±0.11
aVelocities in this table have been corrected for the wavelength calibration errors
discussed in the appendix.
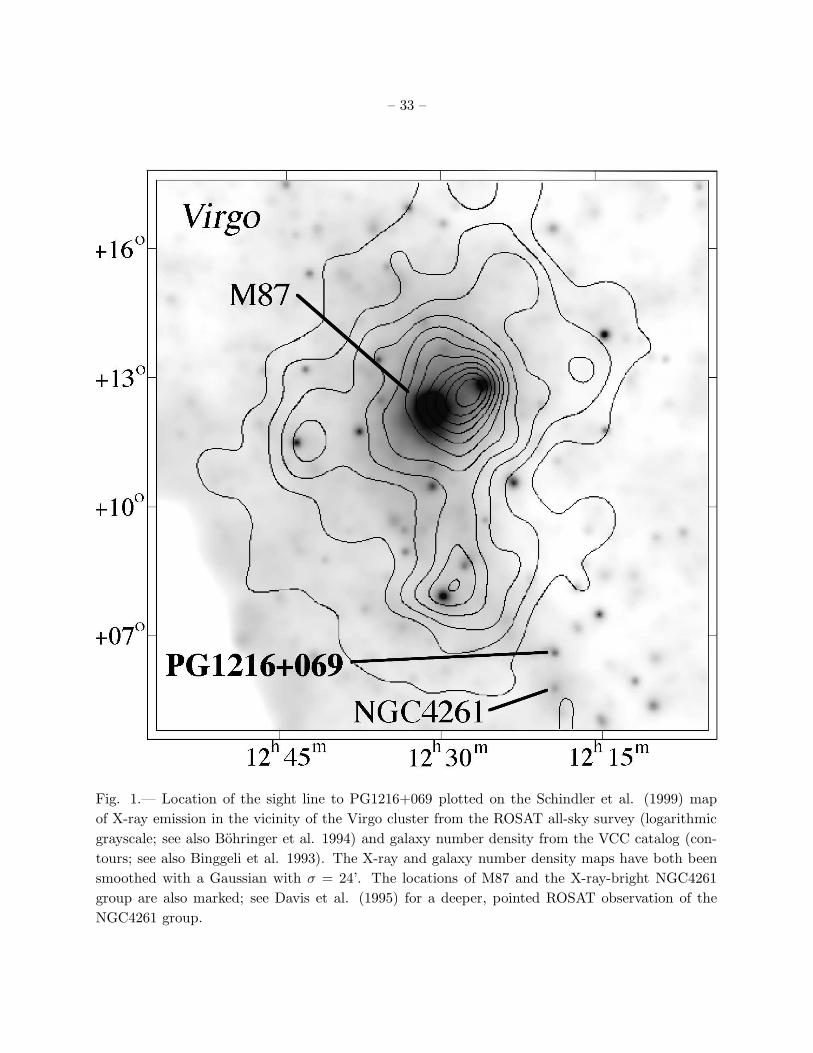
– 33 –
Fig. 1.— Location of the sight line to PG1216+069 plotted on the Schindler et al. (1999) map
of X-ray emission in the vicinity of the Virgo cluster from the ROSAT all-sky survey (logarithmic
grayscale; see also Bohringer et al. 1994) and galaxy number density from the VCC catalog (con-
tours; see also Binggeli et al. 1993). The X-ray and galaxy number density maps have both been
smoothed with a Gaussian with σ = 24’. The locations of M87 and the X-ray-bright NGC4261
group are also marked; see Davis et al. (1995) for a deeper, pointed ROSAT observation of the
NGC4261 group.
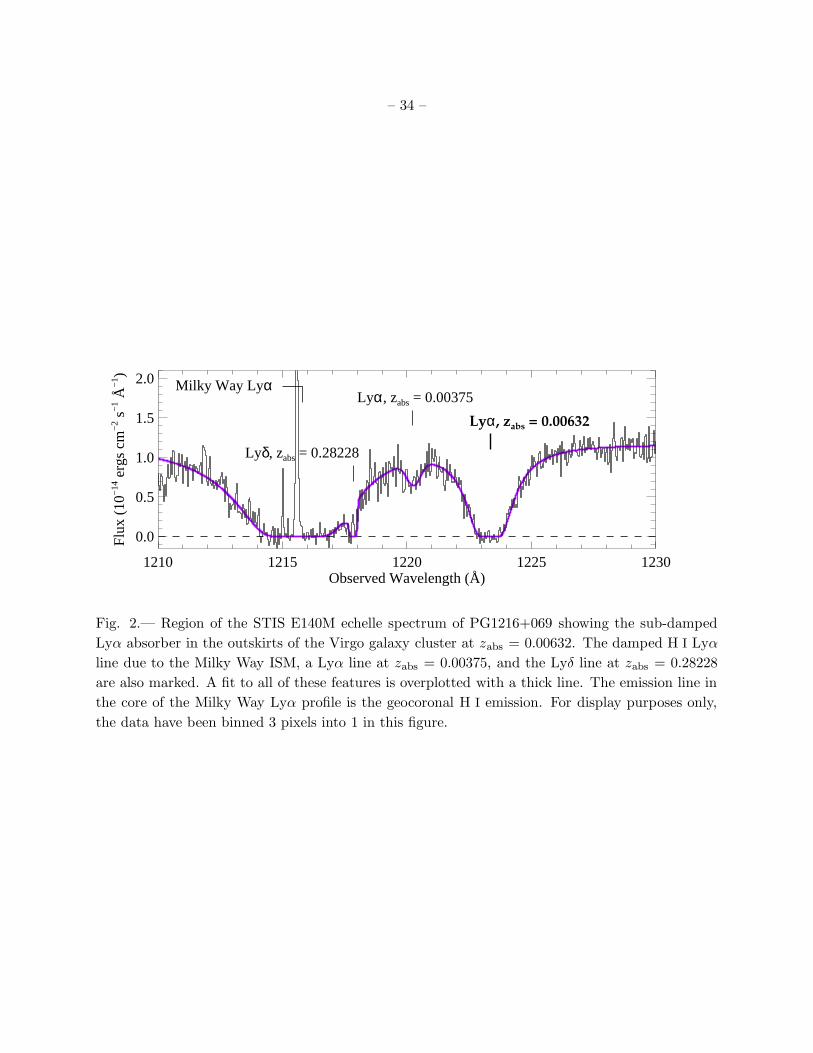
– 34 –
1210 1215 1220 1225 1230Observed Wavelength (Å)
0.0
0.5
1.0
1.5
2.0
Flu
x (1
0−14
erg
s cm
−2 s
−1 Å
−1 )
Lyα, zabs = 0.00632
Lyα, zabs = 0.00375
Lyδ, zabs = 0.28228
Milky Way Lyα
Fig. 2.— Region of the STIS E140M echelle spectrum of PG1216+069 showing the sub-damped
Lyα absorber in the outskirts of the Virgo galaxy cluster at zabs = 0.00632. The damped H I Lyα
line due to the Milky Way ISM, a Lyα line at zabs = 0.00375, and the Lyδ line at zabs = 0.28228
are also marked. A fit to all of these features is overplotted with a thick line. The emission line in
the core of the Milky Way Lyα profile is the geocoronal H I emission. For display purposes only,
the data have been binned 3 pixels into 1 in this figure.
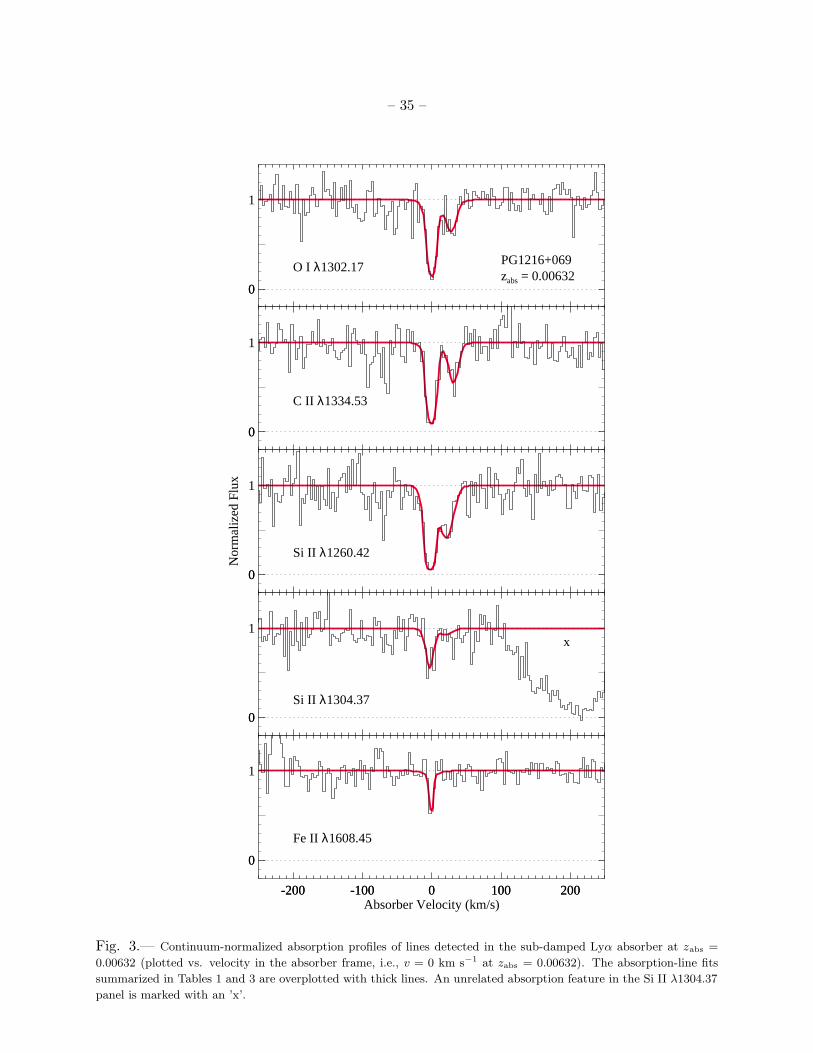
– 35 –
0
1
0
O I λ1302.17 PG1216+069zabs = 0.00632
0.0
0.5
1.0
0
1
0
C II λ1334.53
0.0
0.5
1.0
0
1
0
Nor
mal
ized
Flu
x
Si II λ1260.42
0.0
0.5
1.0
0
1
0Si II λ1304.37
x
0.0
0.5
1.0
-200 -100 0 100 200
0
1
0
Fe II λ1608.45
-200 -100 0 100 200Absorber Velocity (km/s)
0.0
0.5
1.0
Fig. 3.— Continuum-normalized absorption profiles of lines detected in the sub-damped Lyα absorber at zabs =
0.00632 (plotted vs. velocity in the absorber frame, i.e., v = 0 km s−1 at zabs = 0.00632). The absorption-line fits
summarized in Tables 1 and 3 are overplotted with thick lines. An unrelated absorption feature in the Si II λ1304.37
panel is marked with an ’x’.
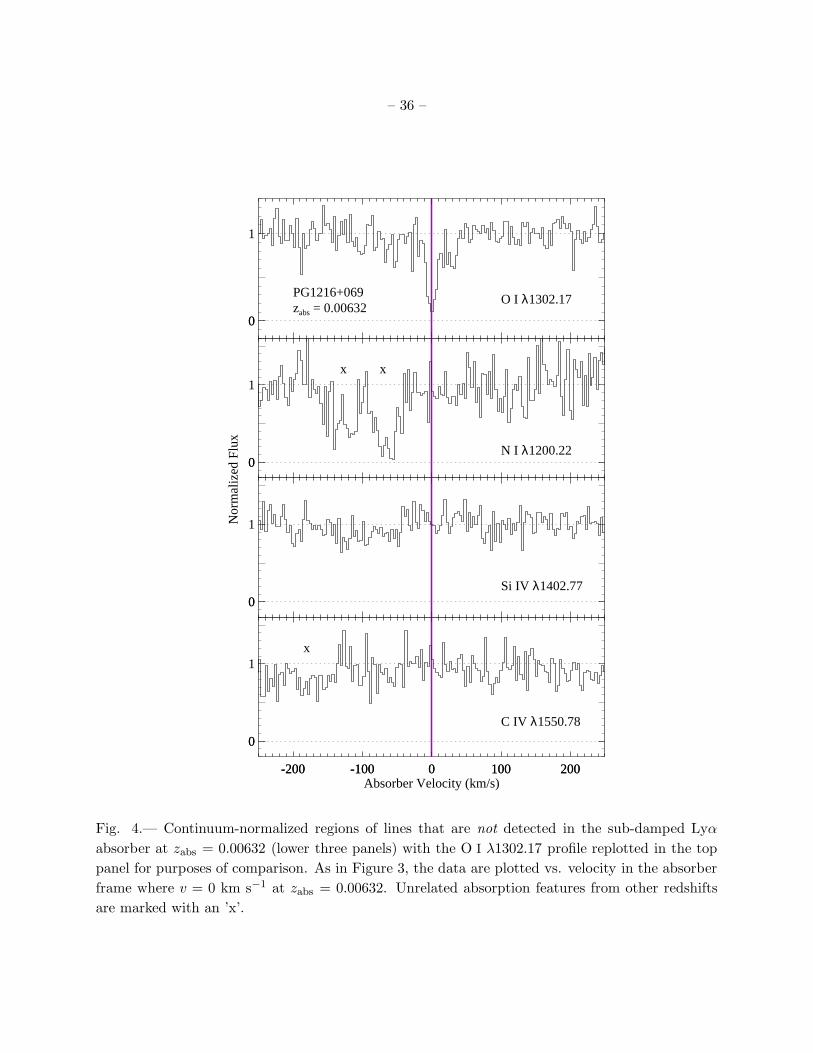
– 36 –
0
1
0
O I λ1302.17PG1216+069zabs = 0.00632
0.0
0.5
1.0
0
1
0N I λ1200.22
x x
0.0
0.5
1.0
1.5
0
1
0Si IV λ1402.77
Nor
mal
ized
Flu
x
0.0
0.5
1.0
1.5
-200 -100 0 100 200
0
1
0
C IV λ1550.78
x
-200 -100 0 100 200Absorber Velocity (km/s)
0.0
0.5
1.0
1.5
Fig. 4.— Continuum-normalized regions of lines that are not detected in the sub-damped Lyα
absorber at zabs = 0.00632 (lower three panels) with the O I λ1302.17 profile replotted in the top
panel for purposes of comparison. As in Figure 3, the data are plotted vs. velocity in the absorber
frame where v = 0 km s−1 at zabs = 0.00632. Unrelated absorption features from other redshifts
are marked with an ’x’.
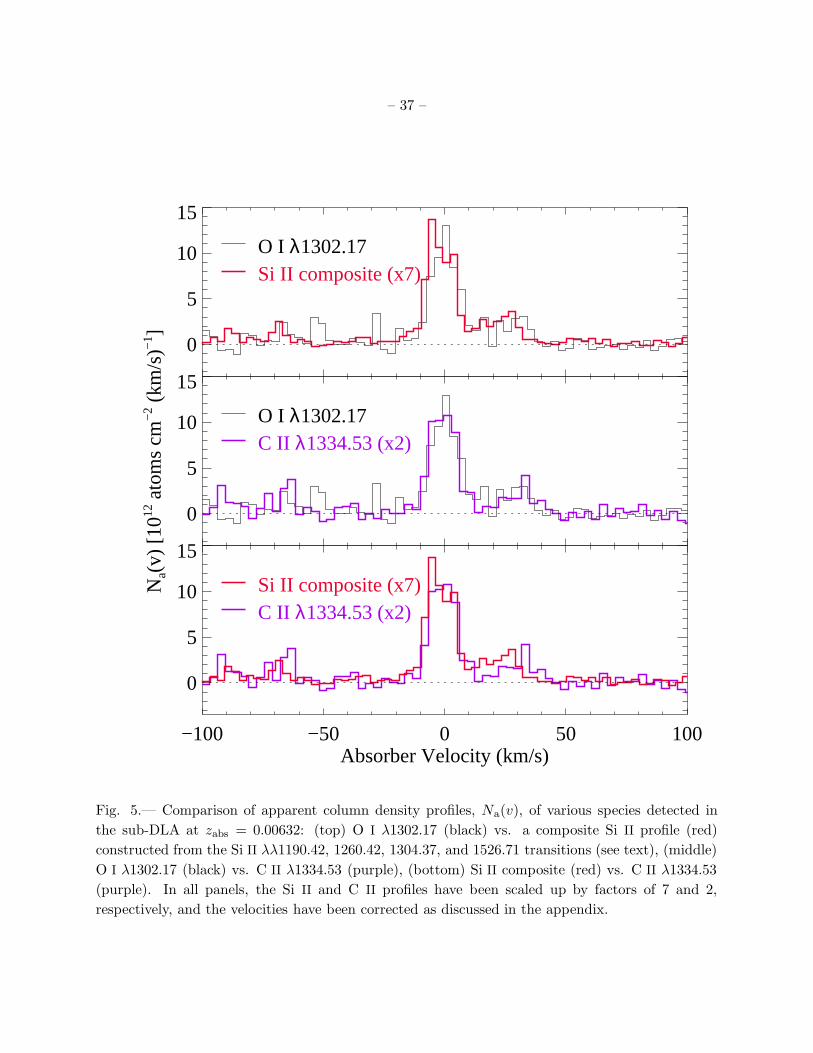
– 37 –
0
5
10
15
O I λ1302.17Si II composite (x7)
0
5
10
15
Na(
v) [
1012
ato
ms
cm−
2 (km
/s)−
1 ]
O I λ1302.17C II λ1334.53 (x2)
−100 −50 0 50 100Absorber Velocity (km/s)
0
5
10
15
Si II composite (x7)C II λ1334.53 (x2)
Fig. 5.— Comparison of apparent column density profiles, Na(v), of various species detected in
the sub-DLA at zabs = 0.00632: (top) O I λ1302.17 (black) vs. a composite Si II profile (red)
constructed from the Si II λλ1190.42, 1260.42, 1304.37, and 1526.71 transitions (see text), (middle)
O I λ1302.17 (black) vs. C II λ1334.53 (purple), (bottom) Si II composite (red) vs. C II λ1334.53
(purple). In all panels, the Si II and C II profiles have been scaled up by factors of 7 and 2,
respectively, and the velocities have been corrected as discussed in the appendix.
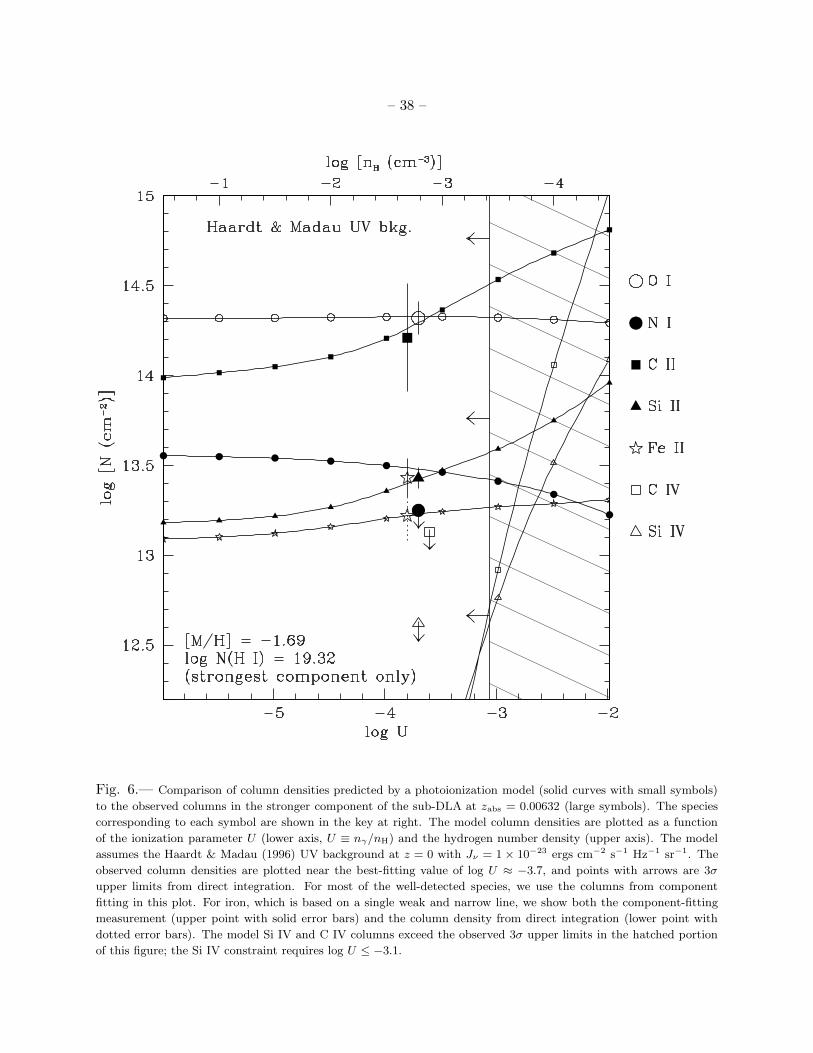
– 38 –
Fig. 6.— Comparison of column densities predicted by a photoionization model (solid curves with small symbols)
to the observed columns in the stronger component of the sub-DLA at zabs = 0.00632 (large symbols). The species
corresponding to each symbol are shown in the key at right. The model column densities are plotted as a function
of the ionization parameter U (lower axis, U ≡ nγ/nH) and the hydrogen number density (upper axis). The model
assumes the Haardt & Madau (1996) UV background at z = 0 with Jν = 1 × 10⁻²³ ergs cm−2 s−1 Hz−1 sr−1. The
observed column densities are plotted near the best-fitting value of log U ≈ −3.7, and points with arrows are 3σ
upper limits from direct integration. For most of the well-detected species, we use the columns from component
fitting in this plot. For iron, which is based on a single weak and narrow line, we show both the component-fitting
measurement (upper point with solid error bars) and the column density from direct integration (lower point with
dotted error bars). The model Si IV and C IV columns exceed the observed 3σ upper limits in the hatched portion
of this figure; the Si IV constraint requires log U ≤ −3.1.
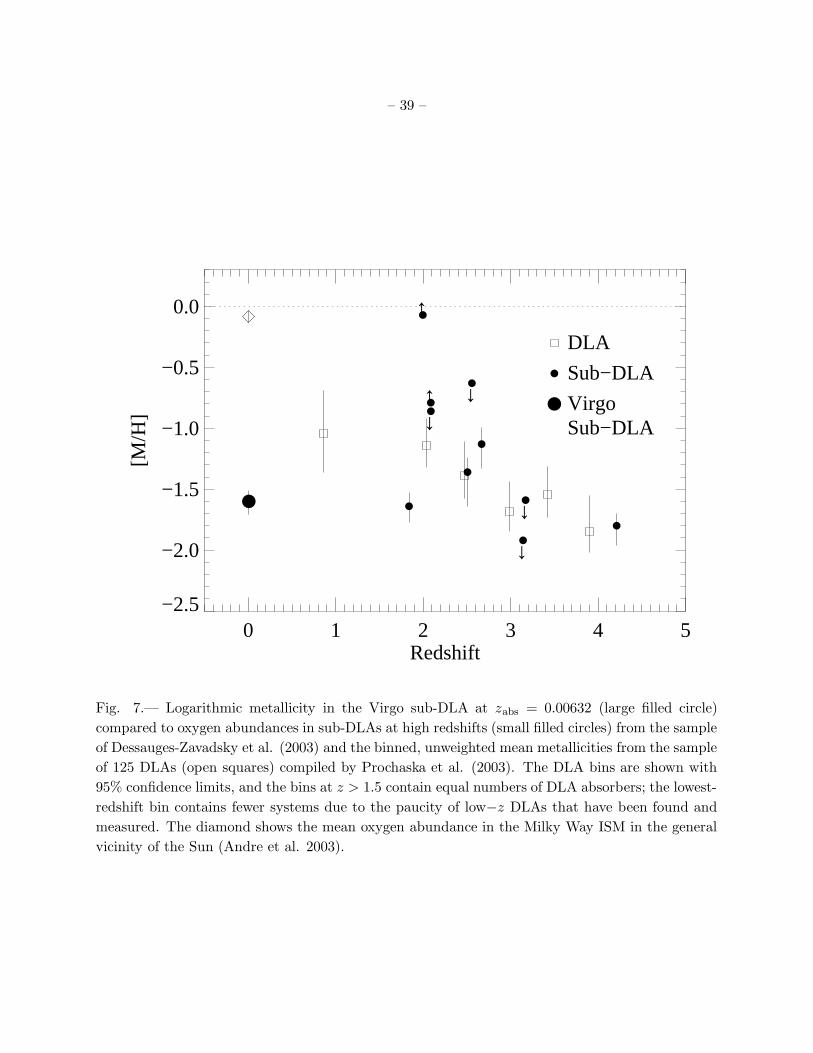
– 39 –
0 1 2 3 4 5Redshift
−2.5
−2.0
−1.5
−1.0
−0.5
0.0
[M/H
]
DLA
Sub−DLA
VirgoSub−DLA
↓
↓
↓
↓
↑
↑
Fig. 7.— Logarithmic metallicity in the Virgo sub-DLA at zabs = 0.00632 (large filled circle)
compared to oxygen abundances in sub-DLAs at high redshifts (small filled circles) from the sample
of Dessauges-Zavadsky et al. (2003) and the binned, unweighted mean metallicities from the sample
of 125 DLAs (open squares) compiled by Prochaska et al. (2003). The DLA bins are shown with
95% confidence limits, and the bins at z > 1.5 contain equal numbers of DLA absorbers; the lowest-
redshift bin contains fewer systems due to the paucity of low−z DLAs that have been found and
measured. The diamond shows the mean oxygen abundance in the Milky Way ISM in the general
vicinity of the Sun (Andre et al. 2003).
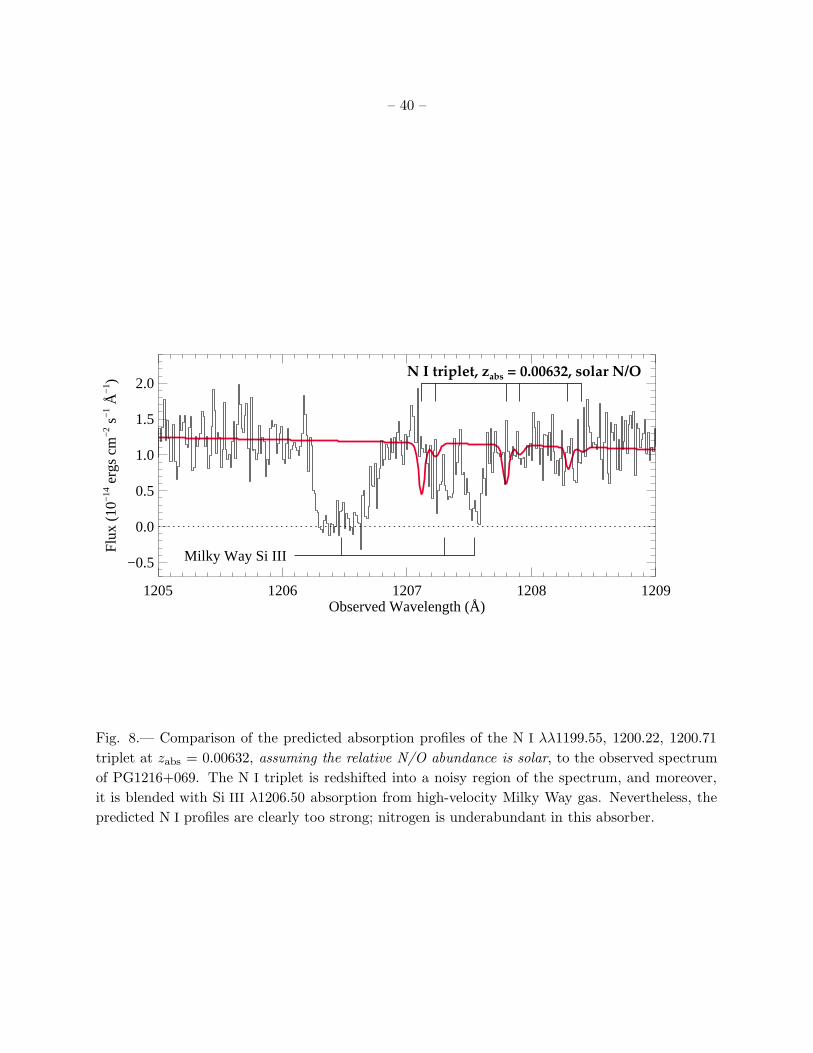
– 40 –
1205 1206 1207 1208 1209Observed Wavelength (Å)
−0.5
0.0
0.5
1.0
1.5
2.0
Flu
x (1
0−14
erg
s cm
−2 s
−1 Å
−1 ) N I triplet, zabs = 0.00632, solar N/O
Milky Way Si III
Fig. 8.— Comparison of the predicted absorption profiles of the N I λλ1199.55, 1200.22, 1200.71
triplet at zabs = 0.00632, assuming the relative N/O abundance is solar, to the observed spectrum
of PG1216+069. The N I triplet is redshifted into a noisy region of the spectrum, and moreover,
it is blended with Si III λ1206.50 absorption from high-velocity Milky Way gas. Nevertheless, the
predicted N I profiles are clearly too strong; nitrogen is underabundant in this absorber.
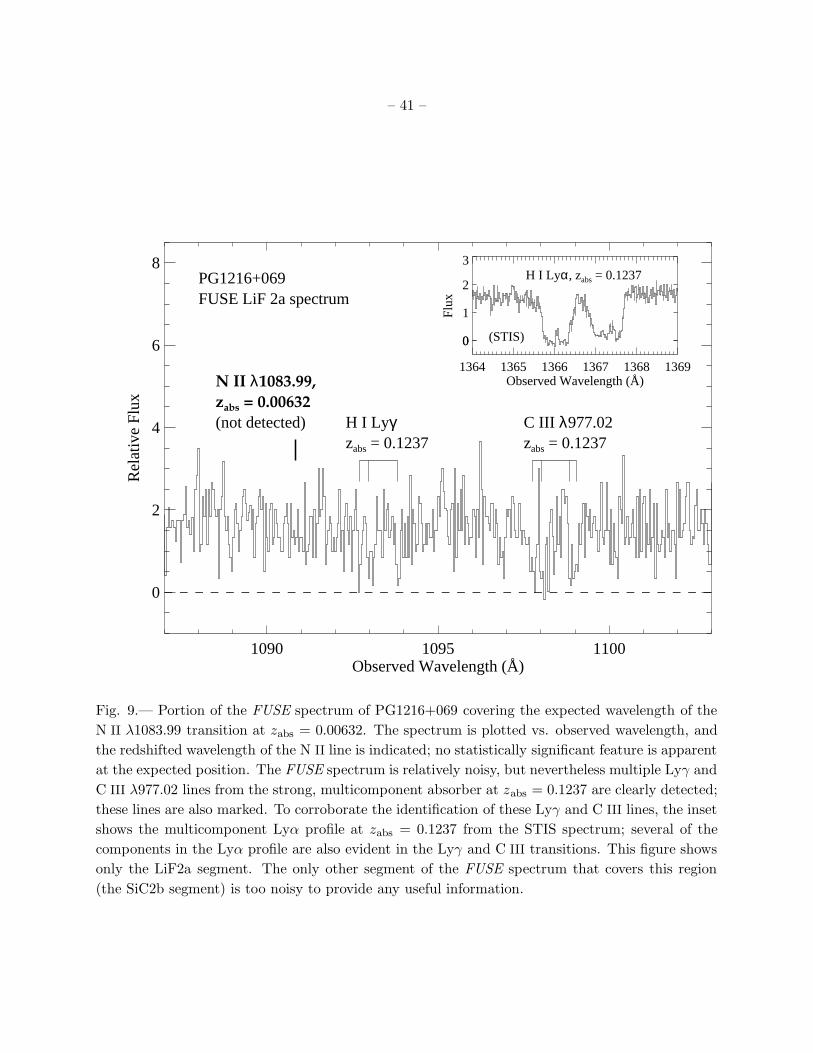
– 41 –
1090 1095 1100Observed Wavelength (Å)
0
2
4
6
8
Rel
ativ
e F
lux
N II λ1083.99,zabs = 0.00632(not detected) C III λ977.02
zabs = 0.1237H I Lyγzabs = 0.1237
PG1216+069FUSE LiF 2a spectrum
1364 1365 1366 1367 1368 1369Observed Wavelength (Å)
0
1
2
3
0
Flu
x
H I Lyα, zabs = 0.1237
(STIS)
Fig. 9.— Portion of the FUSE spectrum of PG1216+069 covering the expected wavelength of the
N II λ1083.99 transition at zabs = 0.00632. The spectrum is plotted vs. observed wavelength, and
the redshifted wavelength of the N II line is indicated; no statistically significant feature is apparent
at the expected position. The FUSE spectrum is relatively noisy, but nevertheless multiple Lyγ and
C III λ977.02 lines from the strong, multicomponent absorber at zabs = 0.1237 are clearly detected;
these lines are also marked. To corroborate the identification of these Lyγ and C III lines, the inset
shows the multicomponent Lyα profile at zabs = 0.1237 from the STIS spectrum; several of the
components in the Lyα profile are also evident in the Lyγ and C III transitions. This figure shows
only the LiF2a segment. The only other segment of the FUSE spectrum that covers this region
(the SiC2b segment) is too noisy to provide any useful information.
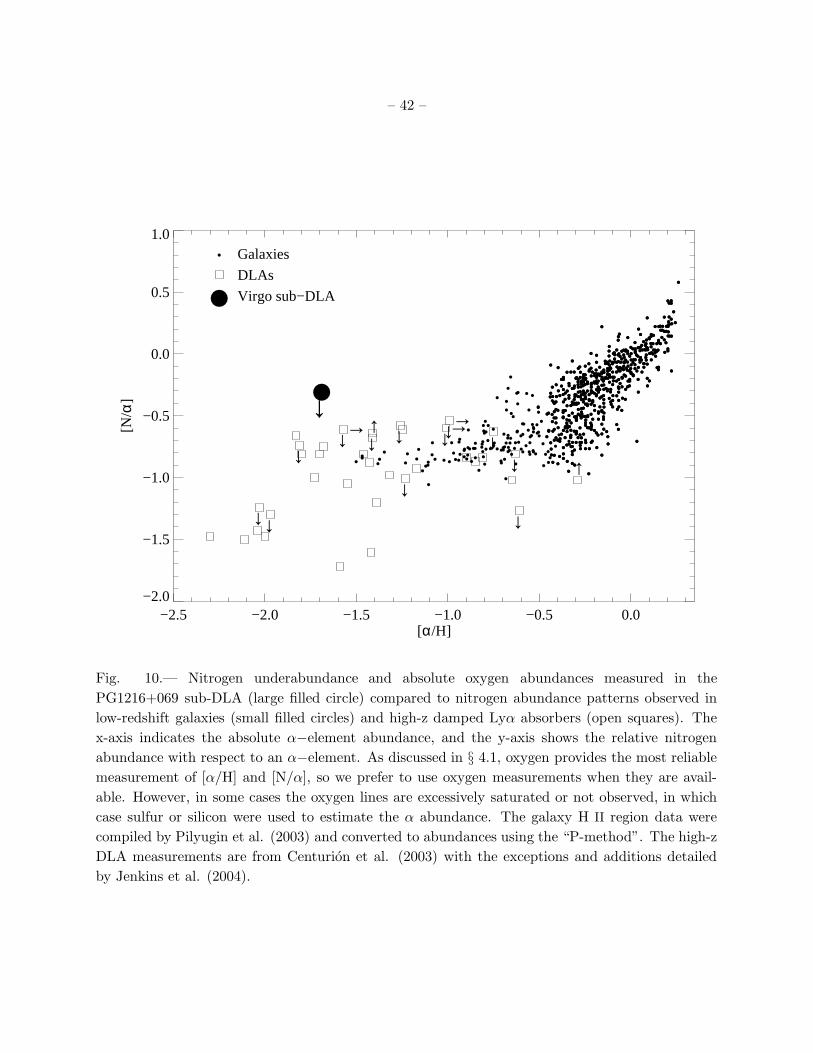
– 42 –
−2.5 −2.0 −1.5 −1.0 −0.5 0.0[α/H]
−2.0
−1.5
−1.0
−0.5
0.0
0.5
1.0
[N/α
] ↓
↓
↓
↓↓
↓↓↓
↓↓
↓
↓
↓↓
↓
↓ ↓↓
Galaxies
DLAs
Virgo sub−DLA
Fig. 10.— Nitrogen underabundance and absolute oxygen abundances measured in the
PG1216+069 sub-DLA (large filled circle) compared to nitrogen abundance patterns observed in
low-redshift galaxies (small filled circles) and high-z damped Lyα absorbers (open squares). The
x-axis indicates the absolute α−element abundance, and the y-axis shows the relative nitrogen
abundance with respect to an α−element. As discussed in § 4.1, oxygen provides the most reliable
measurement of [α/H] and [N/α], so we prefer to use oxygen measurements when they are avail-
able. However, in some cases the oxygen lines are excessively saturated or not observed, in which
case sulfur or silicon were used to estimate the α abundance. The galaxy H II region data were
compiled by Pilyugin et al. (2003) and converted to abundances using the “P-method”. The high-z
DLA measurements are from Centurion et al. (2003) with the exceptions and additions detailed
by Jenkins et al. (2004).

– 43 –
−6 −5 −4 −3 −2−2.0
−1.5
−1.0
−0.5
0.0
3.6
3.8
4.0
4.2
4.4
4.6
log [T (K
)]
−6 −5 −4 −3 −2log U
−2.0
−1.5
−1.0
−0.5
0.0
log
f(H
I)
↓↓
↓
Fig. 11.— Neutral-gas content and mean temperature of the sub-DLA according to the photoion-
ization model shown in Figure 6. The H I ion fraction is plotted with a solid line using the scale on
the left axis, and the temperature is indicated with a dashed line using the scale on the right axis;
both quantities are plotted vs. the ionization parameter U . The upper limits on C IV and Si IV
require log U . −3.1, as shown by the gray region. The thick vertical line is drawn at the value of
U that provides the best fit to the observed column densities (see Figure 6).
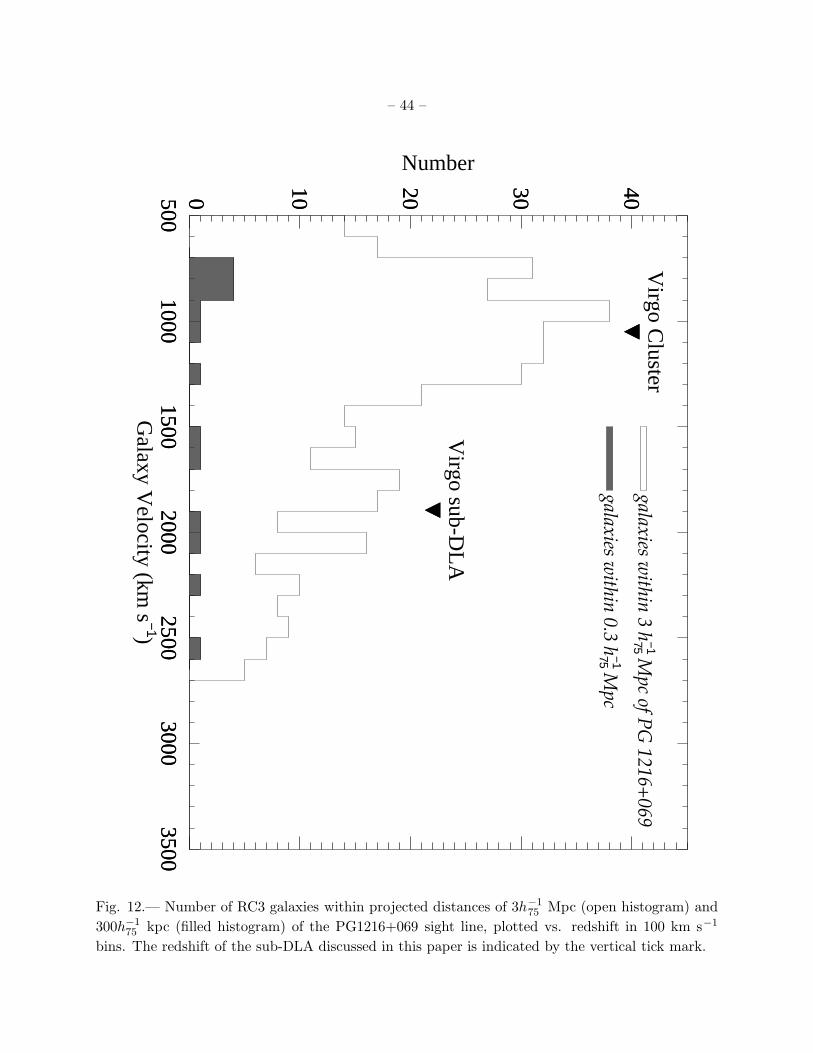
– 44 –
5001000
15002000
25003000
3500G
alaxy Velocity (km
s −1)
0 10 20 30 40Number
5001000
15002000
25003000
35000 10 20 30 40
galaxies within 3 h
−175 Mpc of PG
1216+069
galaxies within 0.3 h
−175 Mpc
Virgo sub-D
LA
Virgo C
luster
Fig. 12.— Number of RC3 galaxies within projected distances of 3h−175 Mpc (open histogram) and
300h−175 kpc (filled histogram) of the PG1216+069 sight line, plotted vs. redshift in 100 km s−1
bins. The redshift of the sub-DLA discussed in this paper is indicated by the vertical tick mark.
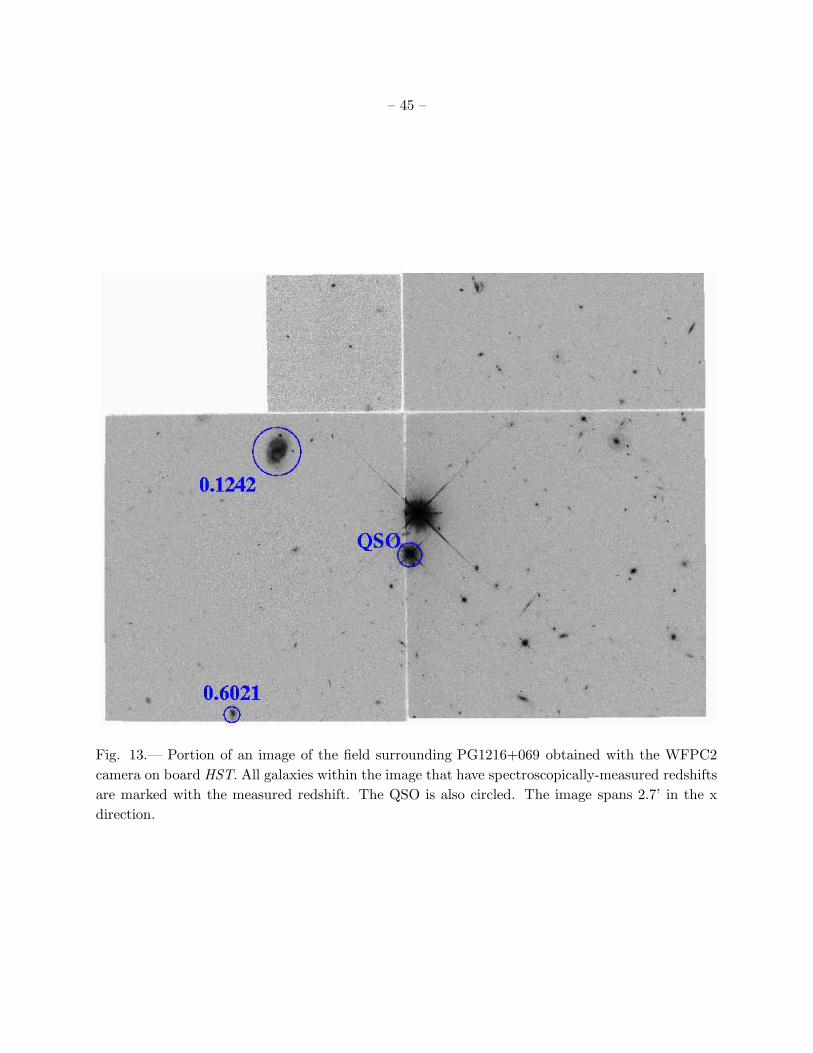
– 45 –
Fig. 13.— Portion of an image of the field surrounding PG1216+069 obtained with the WFPC2
camera on board HST. All galaxies within the image that have spectroscopically-measured redshifts
are marked with the measured redshift. The QSO is also circled. The image spans 2.7’ in the x
direction.
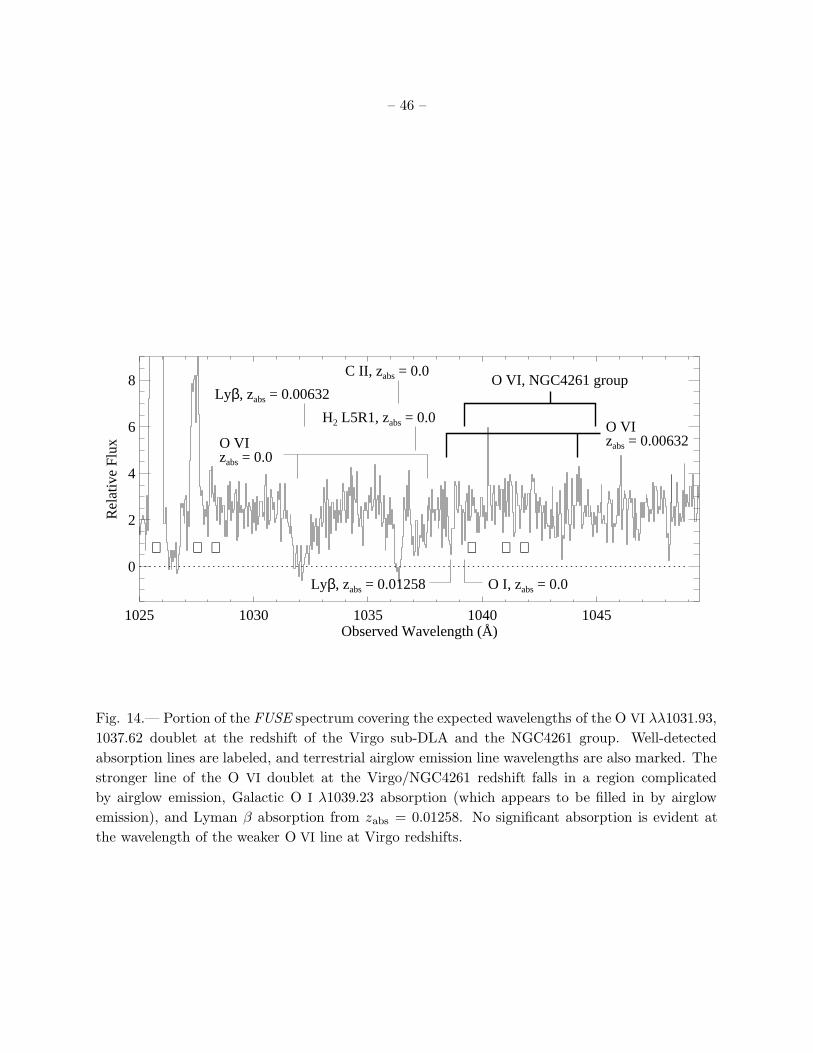
– 46 –
1025 1030 1035 1040 1045Observed Wavelength (Å)
0
2
4
6
8
Rel
ativ
e F
lux
O I, zabs = 0.0Lyβ, zabs = 0.01258
H2 L5R1, zabs = 0.0
C II, zabs = 0.0
Lyβ, zabs = 0.00632
O VIzabs = 0.0
O VIzabs = 0.00632
O VI, NGC4261 group
⊕ ⊕ ⊕ ⊕ ⊕ ⊕
Fig. 14.— Portion of the FUSE spectrum covering the expected wavelengths of the O VI λλ1031.93,
1037.62 doublet at the redshift of the Virgo sub-DLA and the NGC4261 group. Well-detected
absorption lines are labeled, and terrestrial airglow emission line wavelengths are also marked. The
stronger line of the O VI doublet at the Virgo/NGC4261 redshift falls in a region complicated
by airglow emission, Galactic O I λ1039.23 absorption (which appears to be filled in by airglow
emission), and Lyman β absorption from zabs = 0.01258. No significant absorption is evident at
the wavelength of the weaker O VI line at Virgo redshifts.
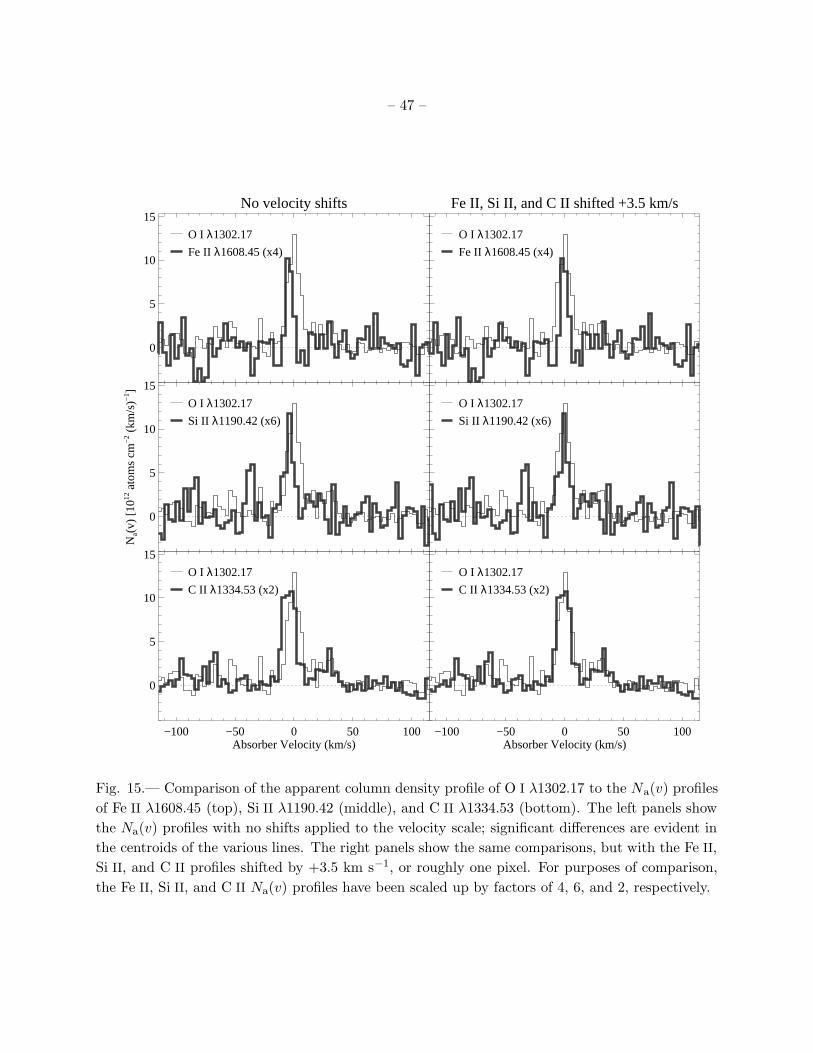
– 47 –
No velocity shifts
0
5
10
15
O I λ1302.17
Fe II λ1608.45 (x4)
0
5
10
15
Na(
v) [
1012
ato
ms
cm−
2 (km
/s)−
1 ]
O I λ1302.17
Si II λ1190.42 (x6)
−100 −50 0 50 100Absorber Velocity (km/s)
0
5
10
15
O I λ1302.17
C II λ1334.53 (x2)
Fe II, Si II, and C II shifted +3.5 km/s
O I λ1302.17
Fe II λ1608.45 (x4)
O I λ1302.17
Si II λ1190.42 (x6)
−100 −50 0 50 100Absorber Velocity (km/s)
O I λ1302.17
C II λ1334.53 (x2)
Fig. 15.— Comparison of the apparent column density profile of O I λ1302.17 to the Na(v) profiles
of Fe II λ1608.45 (top), Si II λ1190.42 (middle), and C II λ1334.53 (bottom). The left panels show
the Na(v) profiles with no shifts applied to the velocity scale; significant differences are evident in
the centroids of the various lines. The right panels show the same comparisons, but with the Fe II,
Si II, and C II profiles shifted by +3.5 km s−1, or roughly one pixel. For purposes of comparison,
the Fe II, Si II, and C II Na(v) profiles have been scaled up by factors of 4, 6, and 2, respectively.
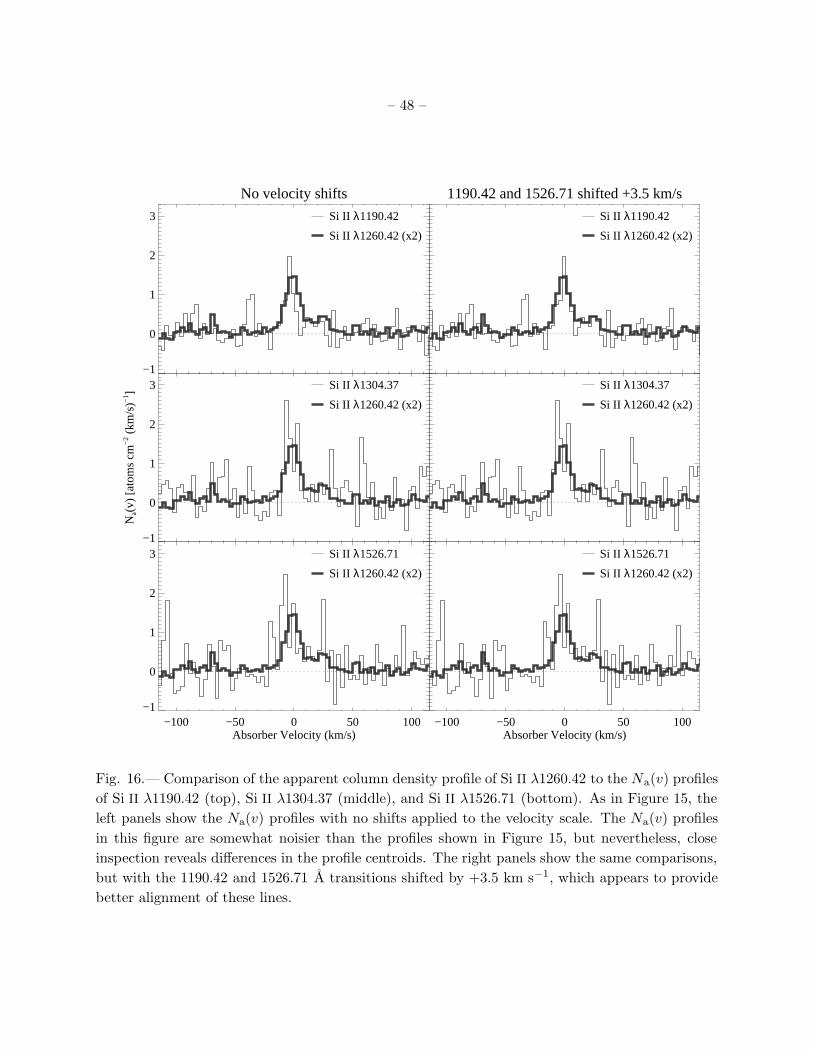
– 48 –
No velocity shifts
−1
0
1
2
3 Si II λ1190.42
Si II λ1260.42 (x2)
−1
0
1
2
3
Na(
v) [
atom
s cm
−2 (
km/s
)−1 ] Si II λ1304.37
Si II λ1260.42 (x2)
−100 −50 0 50 100Absorber Velocity (km/s)
−1
0
1
2
3 Si II λ1526.71
Si II λ1260.42 (x2)
1190.42 and 1526.71 shifted +3.5 km/s
Si II λ1190.42
Si II λ1260.42 (x2)
Si II λ1304.37
Si II λ1260.42 (x2)
−100 −50 0 50 100Absorber Velocity (km/s)
Si II λ1526.71
Si II λ1260.42 (x2)
Fig. 16.— Comparison of the apparent column density profile of Si II λ1260.42 to the Na(v) profiles
of Si II λ1190.42 (top), Si II λ1304.37 (middle), and Si II λ1526.71 (bottom). As in Figure 15, the
left panels show the Na(v) profiles with no shifts applied to the velocity scale. The Na(v) profiles
in this figure are somewhat noisier than the profiles shown in Figure 15, but nevertheless, close
inspection reveals differences in the profile centroids. The right panels show the same comparisons,
but with the 1190.42 and 1526.71 A transitions shifted by +3.5 km s−1, which appears to provide
better alignment of these lines.
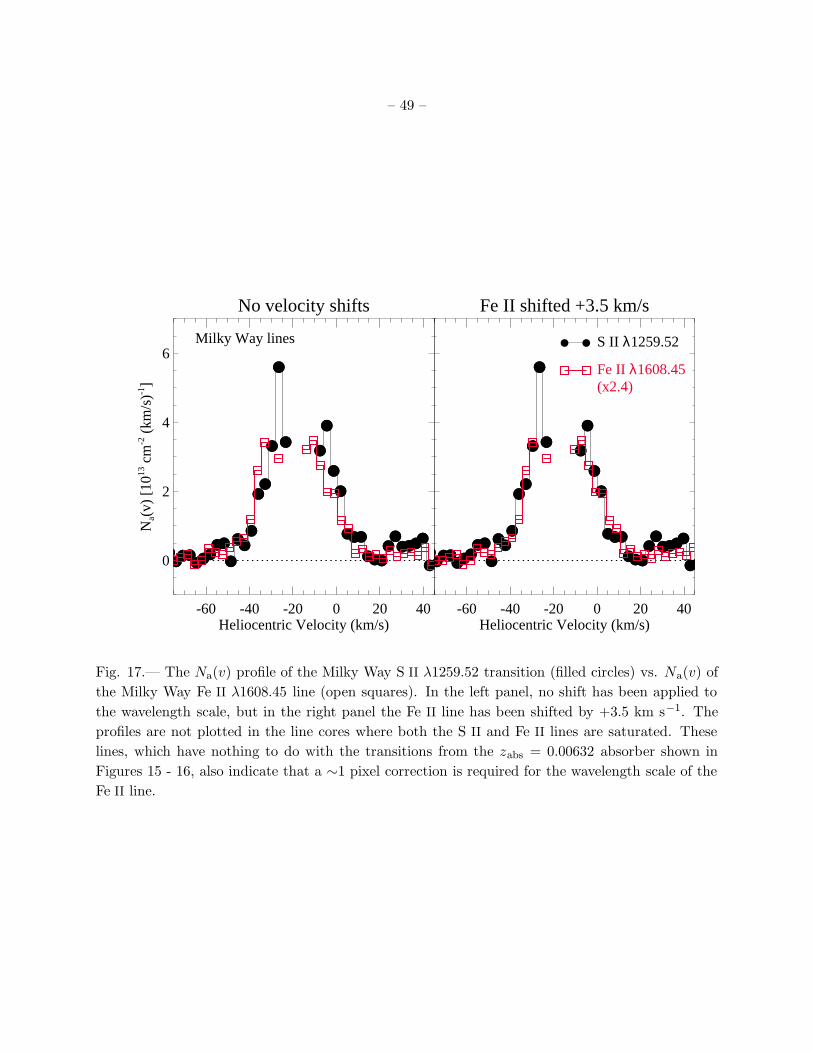
– 49 –
No velocity shifts
-60 -40 -20 0 20 40Heliocentric Velocity (km/s)
0
2
4
6
Na(
v) [
1013
cm
-2 (
km/s
)-1]
Milky Way lines
Fe II shifted +3.5 km/s
-60 -40 -20 0 20 40Heliocentric Velocity (km/s)
S II λ1259.52
Fe II λ1608.45(x2.4)
Fig. 17.— The Na(v) profile of the Milky Way S II λ1259.52 transition (filled circles) vs. Na(v) of
the Milky Way Fe II λ1608.45 line (open squares). In the left panel, no shift has been applied to
the wavelength scale, but in the right panel the Fe II line has been shifted by +3.5 km s−1. The
profiles are not plotted in the line cores where both the S II and Fe II lines are saturated. These
lines, which have nothing to do with the transitions from the zabs = 0.00632 absorber shown in
Figures 15 - 16, also indicate that a ∼1 pixel correction is required for the wavelength scale of the
Fe II line.