Diplomarbeit - othes.univie.ac.atothes.univie.ac.at/16520/1/2011-10-18_0505268.pdf ·...
139
Diplomarbeit Titel der Diplomarbeit Deletion of the tail fibre protein of φCh1 and further characterization of the inversion within its gene locus Verfasserin Petra Till, BSc angestrebter akademischer Grad Magistra der Naturwissenschaften (Mag. rer. nat.) Wien, 2011 Studienkennzahl (lt. Studienblatt): A 490 Studienrichtung (lt. Studienblatt): Diplomstudium Molekulare Biologie Betreuerin: Ao. Univ.-Prof. Dipl.-Biol. Dr. Angela Witte
Transcript of Diplomarbeit - othes.univie.ac.atothes.univie.ac.at/16520/1/2011-10-18_0505268.pdf ·...
Diplomarbeit
Titel der Diplomarbeit
Deletion of the tail fibre protein of φCh1 and
further characterization of the inversion within its gene locus
Verfasserin
Petra Till, BSc
angestrebter akademischer Grad
Magistra der Naturwissenschaften (Mag. rer. nat.)
Wien, 2011
Studienkennzahl (lt. Studienblatt): A 490
Studienrichtung (lt. Studienblatt): Diplomstudium Molekulare Biologie
Betreuerin: Ao. Univ.-Prof. Dipl.-Biol. Dr. Angela Witte


Table of contents
1. Introduction ............................................................................................ 11
1.1. Archaea ............................................................................................................ 11
1.1.1. Classification of the living world – a historical overview ...................................................... 11
1.1.2. Properties of the Archaea ..................................................................................................... 12
1.1.2.1. Archaea vs. Bacteria – differences and common characteristics .............................. 13
1.1.2.2. Archaea vs. Eucarya – differences and common characteristics .............................. 14
1.1.2.3. Unique characteristics of Archaea ............................................................................ 17
1.1.3. Evolution of the Archaea ....................................................................................................... 18
1.1.4. Phylogeny and diversity ........................................................................................................ 20
1.1.5. Halophilic and haloalkaliphilic Archaea ................................................................................. 22
1.1.5.1. Adaptions to hypersaline conditions ......................................................................... 23
1.1.5.2. Adaptations to high pH .............................................................................................. 25
1.1.6. Natrialba magadii.................................................................................................................. 26
1.1.6.1. Characteristics of Nab. magadii ................................................................................ 26
1.1.6.2. Two laboratory strains: L11 and L13 ......................................................................... 27
1.1.6.3. Nab. magadii in the lab – transformation, vectors, genetic markers ....................... 27
1.2. Archaeal viruses ................................................................................................ 29
1.2.1. Morphotypes – classification of archaeal viruses ................................................................. 30
1.2.2. Haloarchaeal viruses.............................................................................................................. 32
1.2.3. φCh1 – a haloalkaliphilic virus ............................................................................................... 33
1.2.3.1. Morphology and structural proteins of φCh1 ........................................................... 34
1.2.3.2. Life cycle of φCh1 ...................................................................................................... 36
1.2.3.3. Genomic organization of φCh1 ................................................................................. 37
1.2.3.4. The invertible region of φCh1 ................................................................................... 39
1.2.3.5. Gp3452 – the putative tail fibre protein ..................................................................... 44
2. Material and Methods ............................................................................. 46
2.1. Material ............................................................................................................ 46
2.1.1. Strains .................................................................................................................................... 46
2.1.2. Growth media ........................................................................................................................ 46
2.1.3. Antibiotics and additives ....................................................................................................... 47
2.1.4. Vectors ................................................................................................................................... 48
2.1.5. Primer .................................................................................................................................... 51
2.1.6. Marker ................................................................................................................................... 52
2.1.6.1. DNA ladders ............................................................................................................... 52
2.1.6.2. Protein ladders .......................................................................................................... 53
2.1.7. Enzymes ................................................................................................................................. 54
2.1.8. Antibodies.............................................................................................................................. 55
2.1.8.1. Primary antibodies .................................................................................................... 55
2.1.8.2. Secondary antibodies ................................................................................................ 55
2.1.9. KITs ........................................................................................................................................ 55
2.1.10. Buffers and solutions ............................................................................................................. 56
2.1.10.1. DNA Gel electrophoresis ........................................................................................... 56
2.1.10.2. Southern blot ............................................................................................................. 57
2.1.10.3. SDS-PAGE and Western blot analysis ........................................................................ 58
2.1.10.4. Protein purification (denaturing) .............................................................................. 59
2.1.10.5. Transformation of E. coli and Nab. magadii .............................................................. 59
2.1.10.6. Buffers and solution for Archaea methods ............................................................... 60
2.1.10.7. Buffers and solution for phage methods ................................................................... 61
2.2. Methods ........................................................................................................... 61
2.2.1. DNA cloning methods – cloning in E. coli .............................................................................. 61
2.2.1.1. Gel electrophoresis .................................................................................................... 61
2.2.1.2. Polymerase chain reaction (PCR) .............................................................................. 62
2.2.1.3. DNA purification ........................................................................................................ 64
2.2.1.4. Restriction of DNA ..................................................................................................... 65
2.2.1.5. Removal of 3’ overhangs ........................................................................................... 65
2.2.1.6. Ligation ...................................................................................................................... 65
2.2.1.7. Transformation of E. coli ........................................................................................... 66
2.2.1.8. Quick Apply – screening for positive clones .............................................................. 67
2.2.1.9. Plasmid preparation from E. coli ............................................................................... 67
2.2.1.10. Quantification of DNA and lyophilization .................................................................. 67
2.2.1.11. Alpha complementation ............................................................................................ 67
2.2.2. Cloning strategies of current projects ................................................................................... 68
2.2.2.1. Strategies for the deletion of φCh1 ORF34 ............................................................... 68
2.2.2.2. Complementation of φCh1-ΔORF34.......................................................................... 68
2.2.2.3. Construction of eight int1 clones comprising variations in single repeats ............... 69
2.2.2.4. Cloning of a putative activator of int1 expression (ORF43/44) ................................. 70
2.2.2.5. Deletion of the start codon of int1 (ΔAUG-int1) ....................................................... 70
2.2.3. Methods for Archaea ............................................................................................................ 71
2.2.3.1. Transformation of Nab. magadii and screening for positive clones ......................... 71
2.2.3.2. Generation and verification of a homozygous deletion mutant ............................... 72
2.2.3.3. Isolation of Nab. magadii chromosomal DNA ........................................................... 73
2.2.3.4. Time course experiments .......................................................................................... 74
2.2.3.5. Extraction of (plasmid) DNA from Nab. magadii ....................................................... 74
2.2.4. Phage methods ...................................................................................................................... 75
2.2.4.1. Isolation of phage particles ....................................................................................... 75
2.2.4.2. Isolation of phage DNA .............................................................................................. 76
2.2.4.3. Precipitation of viral capsid proteins ......................................................................... 77
2.2.4.4. Phage titre analysis and some applications .............................................................. 77
2.2.5. Protein methods .................................................................................................................... 78
2.2.5.1. Preparation of crude protein extracts ....................................................................... 78
2.2.5.2. Protein expression in E. coli ....................................................................................... 78
2.2.5.3. Protein purification under denaturing conditions .................................................... 79
2.2.5.4. Dialysis of proteins .................................................................................................... 79
2.2.5.5. SDS-PAGE ................................................................................................................... 79
2.2.5.6. Coomassie staining .................................................................................................... 80
2.2.5.7. Western blot analysis ................................................................................................ 81
2.2.6. Southern blot analysis ........................................................................................................... 82
2.2.6.1. Preparation of biotinylated DNA probes ................................................................... 82
2.2.6.2. Separation and blotting of DNA samples to a membrane ........................................ 83
2.2.6.3. Blocking and hybridisation ........................................................................................ 83
2.2.6.4. Developing of a southern blot ................................................................................... 83
3. Results and Discussion ............................................................................ 85
3.1. Deletion of φCh1 ORF34 .................................................................................... 85
3.1.1. Aim of the study and prognosis ............................................................................................. 86
3.1.2. Production of a homozygous ORF34 deletion mutant .......................................................... 86
3.1.3. Isolation and quantification of phage particles ..................................................................... 89
3.1.4. Characteristics of φCh1-ΔORF34 particles and the lysogenic culture ................................... 90
3.1.4.1. Growth and lysis behaviour of L11-ΔORF34 .............................................................. 90
3.1.4.2. Expression of ORF34 in L11-ΔORF34 – Western blot analysis................................... 91
3.1.4.3. Infectivity of φCh1-ΔORF34 – phage titre analysis .................................................... 92
3.1.4.4. Visualization of φCh1-ΔORF34 – electron microscopy .............................................. 93
3.1.4.5. Detection of flagella (protein FlaB1) in fractions of purified φCh1-ΔORF34 ............. 96
3.1.5. Complementation of φCh1-ΔORF34 ..................................................................................... 98
3.1.5.1. Retransformation with pRR007-ORF341/52 and pNB102-ORF341/52 ........................... 98
3.1.5.2. Quick test – investigation of ΔORF3452 complementation ........................................ 98
3.1.6. Discussion ............................................................................................................................ 101
3.2. Int1-mediated Inversion of φCh1 ORF34 and ORF36 ......................................... 103
3.2.1. Analysis of eight int1 clones comprising variations in single repeats ................................. 103
3.2.1.1. Aim of the study and prognosis ............................................................................... 103
3.2.1.2. Construction of the eight int1 clones ...................................................................... 104
3.2.1.3. Inversion – time course experiment........................................................................ 106
3.2.1.4. Discussion ................................................................................................................ 109
3.2.2. Investigation of a possible activator of int1 expression ...................................................... 109
3.2.2.1. Aim of the study and prognosis ............................................................................... 109
3.2.2.2. Cloning of the putative activator (ORF43/44) ......................................................... 110
3.2.2.3. Inversion – time course experiment........................................................................ 110
3.2.2.4. Discussion ................................................................................................................ 113
3.2.3. Deletion of the start codon of int1 (ΔAUG-int1) ................................................................. 114
3.2.3.1. Aim of the study and prognosis ............................................................................... 114
3.2.3.2. Cloning of Nab. magadii L13 ΔAUG-int1 ................................................................. 114
3.2.3.3. Inversion – time course experiment........................................................................ 114
3.2.3.4. Discussion ................................................................................................................ 116
3.3. Binding of gp34 to Nab. magadii P3 .................................................................. 116
3.3.1. Aim of the study and prognosis ........................................................................................... 116
3.3.2. Purification of gp3452/gp3652 and quantification ................................................................ 117
3.3.3. Phage titre analysis .............................................................................................................. 117
3.3.4. Discussion ............................................................................................................................ 120
4. References ............................................................................................ 123
5. Appendix ............................................................................................... 131
Index of Figures and Tables ............................................................................................................. 131

Acknowledgements ......................................................................................................................... 133
Abstract ........................................................................................................................................... 135
Zusammenfassung ........................................................................................................................... 137
Curriculum Vitae .............................................................................................................................. 139

11
1. Introduction
1.1. Archaea
1.1.1. Classification of the living world – a historical overview
Nowadays, phylogenetic distinction of the living world and the understanding of evolutionary
relationships are mainly based on the comparative analysis of molecular sequences, rather than on
phenotypic criteria. Especially the small subunit of ribosomal RNA is widely used for this approach as
it is essential and therefore present in all self-replicating organisms while the sequence of this
molecule is changed slowly during evolution (Woese and Fox, 1977; Fox et al., 1977). Moreover, also
unicellular species which cannot be cultivated in the laboratory so far can be categorized by
detection of rRNA in samples from their natural habitats (Pace et al., 1986; Allers and Mevarech,
2005). As a result characterization of molecular sequences leads to an expansion of the phylogenetic
diversity (Barns et al., 1996). On the other hand it enables comparison of even far distant relative
organisms and reveals the true relationship of already classified living systems. Hence, the
establishment of this approach also caused a dramatically reorganization of the basis of the
conventional phylogenetic system (Woese and Fox., 1977).
Previously, it was only distinguished between plant and animal. This view first changed in
1866, when Ernst Haeckel defined the protists as a new category (Haeckel, 1866). Later two more
kingdoms were recognized, the bacteria (Copeland, 1938) and the fungi (Whittaker, 1959), thereby
dividing all organisms into Animalia, Plantae, Fungi, Protista and Monera (prokaryotes) according to
their apparent phenotypic characteristics (Whittaker and Margulis, 1987). This concept, called the
five-kingdom scheme, was then more and more replaced by the primary grouping of the living world
into prokaryotes and eukaryotes, based on the level of their cellular organization (Chatton, 1938). In
contrast to the former model, this dichotomy considers the differences within the four kingdoms
Animalia, Plantae, Fungi and Protista (summarized as eukaryotes) as less significant than those to the
Monera (prokaryotes) and therefore places them on the same taxonomic rank (Woese et al., 1990).
Further findings strongly supported this view. Yet analysis on a molecular level finally revealed that
the primary categorization into eukaryotes and prokaryotes is not completely correct, as the latter do
not form a monophyletic group (Woese et al., 1990).
Introduction
12
In 1977 Carl Woese published that the ribosomal RNA of a small group of methanogene
microorganisms (assigned to the prokaryotes up to that point) is considerable different to the one of
both categories, suggesting that these organisms form an additional, distinct domain: the
Archaebacteria (Woese and Fox, 1977). Subsequently, comparative genomics confirmed this theory
and finally the division of the living world in three domains of life, the Eucarya, the Bacteria and the
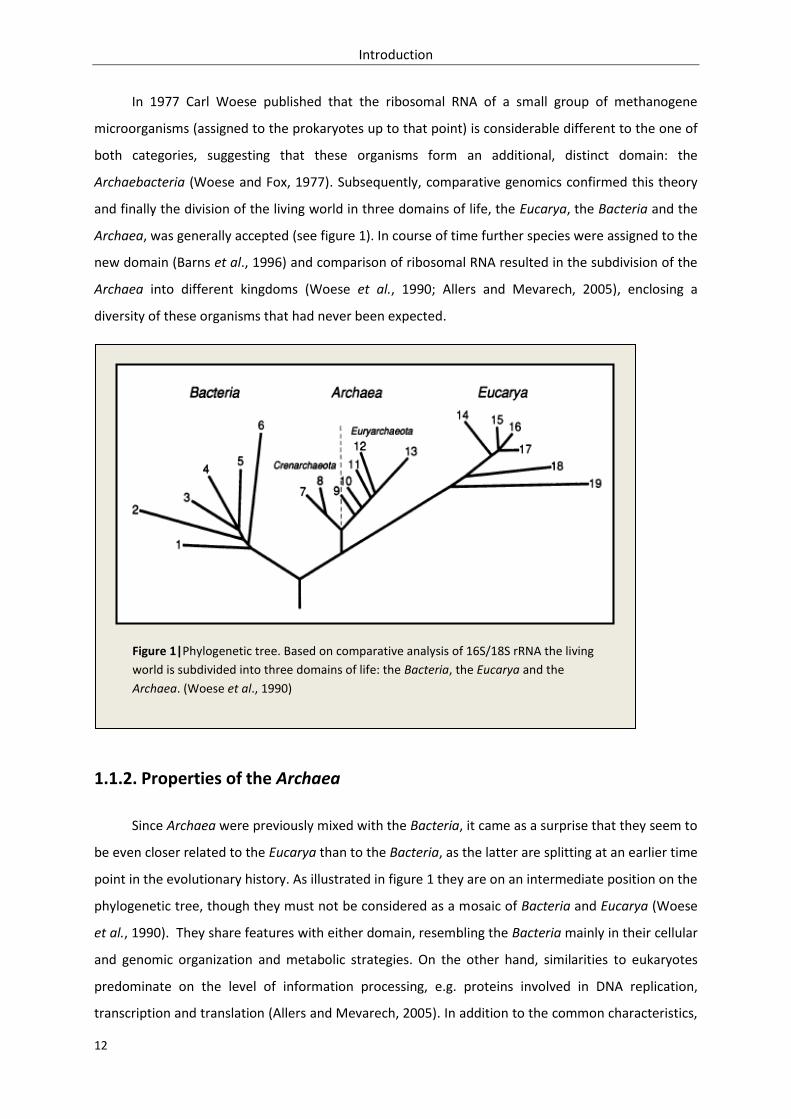
Archaea, was generally accepted (see figure 1). In course of time further species were assigned to the
new domain (Barns et al., 1996) and comparison of ribosomal RNA resulted in the subdivision of the
Archaea into different kingdoms (Woese et al., 1990; Allers and Mevarech, 2005), enclosing a
diversity of these organisms that had never been expected.
1.1.2. Properties of the Archaea
Since Archaea were previously mixed with the Bacteria, it came as a surprise that they seem to
be even closer related to the Eucarya than to the Bacteria, as the latter are splitting at an earlier time
point in the evolutionary history. As illustrated in figure 1 they are on an intermediate position on the
phylogenetic tree, though they must not be considered as a mosaic of Bacteria and Eucarya (Woese
et al., 1990). They share features with either domain, resembling the Bacteria mainly in their cellular
and genomic organization and metabolic strategies. On the other hand, similarities to eukaryotes
predominate on the level of information processing, e.g. proteins involved in DNA replication,
transcription and translation (Allers and Mevarech, 2005). In addition to the common characteristics,
Figure 1|Phylogenetic tree. Based on comparative analysis of 16S/18S rRNA the living
world is subdivided into three domains of life: the Bacteria, the Eucarya and the
Archaea. (Woese et al., 1990)
Introduction
13
the Archaea are also represented by peculiar features which are found in neither organism of the
two other domains.
1.1.2.1. Archaea vs. Bacteria – differences and common characteristics
The main reason for the initial misclassification of Archaea is buried in their cellular and
genomic similarity to Bacteria. In contrast to eukaryotes, cells of these two domains are of a
comparable size and lack a cellular nucleus as well as organelles (Brown and Doolittle, 1997).
Nevertheless, they are significantly different as peptidoglycan is completely missing in the Archaea, a
property which was originally attributed to Eucarya exclusively (Forterre et al., 2002). Instead of the
bacterial cell wall, a multitude of other, partly very unique cell-bordering structures are found in this
domain (also including pseudopeptidoglycan). For that reason, in contrast to Bacteria, Archaea are
not sensitive to most antibiotics like fosfomycin, vancomycin or the ß-lactams (e.g. penicillin) which
prevent synthesis of bacterial cell wall structures (Kandler and König, 1998). As a result, though the
both domains share some basic features differing significantly to the eukaryotes, the Archaea can
easily be distinguished from the Bacteria on a cellular level as well.
Another important common characteristic of the two prokaryotic groups is the structure of
their genome. Both possess one large, circular chromosome comprising genes which are typically
organized in an operon-like fashion. Beside, as many examples demonstrate, the genes of these
clusters are often arranged in a similar order (Brown and Doolittle, 1997). In addition to the
chromosome, prokaryotic cells frequently contain supplementary informations in the form of circular
plasmids persisting in the cell (Brown and Doolittle, 1997). However, differences in the genomic
context are rare. Though it may be mentioned that, in contrast to the bacterial genome, the
chromosome of thermophilic Archaea is mainly present in a relaxed or positively supercoiled, rather
than in a negatively supercoiled conformation due to the lack of a bacterial-like gyrase (Charbonnier
and Forterre, 1994).
Despite most proteins involved in informational processes (DNA replication, transcription and
translation) are generally closer related to the Eucarya, there are also some homologies to the
Bacteria. Surprisingly taking into account that the archaeal and the bacterial genome are quite
similar, the most unlike mechanism is the replication of the DNA. Initial studies suggested the
presence of only one origin of replication in Archaea, resembling the situation in the Bacteria (Lopez
et al., 1999). But this assumption turned out to be wrong, as subsequently two ore even more origins
were localized in several archaeal species, e.g. Halobacterium spec. NRC-1 (Zhang and Zhang, 2003)
and Sulfulobus solfatatricus (Robinson et al., 2004). However, more homologies between Archaea
Introduction
14
and Bacteria are known in transcription and translation. Although the archaeal main proteins
involved in this processes strongly resemble those of the eukaryotes, some transcription regulators
showed to have bacterial homologues (Aravind and Koonin, 1999). One example is the similarity of
archaeal elongation factors to the bacterial NusA and NusG working on elongation control and anti-
termination (Bell and Jackson, 1998; 1996; Klenk et al., 1997). Moreover, both, Archaea and Bacteria,
use polycistronic mRNAs lacking 5’-end caps which are characteristic elements of eukaryotic mRNAs.
Like in Bacteria, purine-rich Shine Dalgarno sequences are present upstream of the start codon on
archaeal mRNAs, mediating recognition of the translation start site (Dennis, 1997; Allers and
Mevarech, 2005).
In contrast to the informational proteins described above, probably due to extensive
horizontal gene transfer operational proteins seem to share a high level of identity in Archaea and
Bacteria. Mainly enzymes involved in central metabolic processes and maintenance of energy are
well conserved, resulting in high similarity of the corresponding pathways (Rivera et al., 1998; Jain
et al., 1999). Archaea, as well as Bacteria comprise both, heterotrophic and autotrophic species
using either light or organic compounds as energy source (Huber et al., 2000). Thus, they possess a
variety of different metabolic and energetic pathways, most of them existing in both domains. One
exception is the generation of methane which is restricted to the archaeal domain (Forterre et al.,
2002; Allers and Mevarech, 2005). Other operational proteins conserved among the Archaea and the
Bacteria are cellular transporter, receptors and proteins involved in cell division. An example for the
latter is an archaeal cell division protein homolog to the bacterial FtsZ. Later studies indicate that this
protein also shows similarities to the eukaryotic tubulins, but yet is closer related to the bacterial
version (Baumann and Jackson, 1996).
1.1.2.2. Archaea vs. Eucarya – differences and common characteristics
As discussed above the cellular and genomic features of Archaea are rather similar to Bacteria
than to Eucarya. Nevertheless some characteristics generally assigned to the eukaryotes are also
present in the third domain of life. First of all, in comparison to Bacteria, Archaea completely lack
peptidoglycan, the main component of the bacterial cell wall. However, this structure is not found in
any eukaryote either (Forterre et al., 2002). For that reason Archaea, like members of the Eucarya,
are not sensible to antibiotics directed against the synthesis of bacterial cell walls. In addition, also
antibiotics inhibiting the large subunit of the ribosomes do not work in either of the two domains
(Brown and Doolittle, 1997).
Introduction
15
On the genomic level, many Archaea strongly resemble Eucarya both in the sequence and the
structure of proteins mediating genome compaction. In both domains four types of such proteins,
designated as histones, are present: H2A, H2B, H3 and H4 (White and Bell, 2002; Allers and
Mevarech, 2005). In eukaryotes two copies of each of these chromatic proteins are combined,
assembling to an octameric nucleosome wrapped by the DNA. Archaeal histones in contrast can also
form homotetramers composed of two H3-H4 dimers, rather than only heteropolymeric structures
(Brown and Doolittle, 1997; White and Bell, 2002). Moreover they lack C-terminal and N-terminal
tails, the targets of posttranslational modification in eukaryotic histones, suggesting that they may
not be involved in the regulation of gene expression. Anyway, although homologues of eukaryotic
histones are widespread among the phylum Euryarchaeota, none have been discovered in members
of the Crenarchaeota so far. Yet, other nucleic acid binding proteins like Alba are present at a wide
range of both archaeal groups (White and Bell, 2002).
However, although it is not clear whether modulation of gene expression can be performed on
the level of genome compaction like in the eukaryotes, most features of transcription, translation
and DNA replication seem to be well conserved between Archaea and Eucarya. The most similar
process is the genome replication, as nearly all archaeal proteins involved in this procedure have a
eukaryotic homologue. Though, it has to be noted that in many cases several eukaryotic proteins
working on the same mechanism are represented by only one equivalent in the Archaea. Thus, the
latter seem to posses a more simplified version of the replication machinery (Edgell and Doolittle,
1997; Barry and Bell, 2006). One well described example is the archaeal homologue to the eukaryotic
origin recognition complex (ORC). In Eucarya the ORC comprises six proteins, Orc1-6, binding to the
origin and, as a result, recruiting many proteins which are needed for the initiation of replication like
for example Cdc6 (Machida et al., 2005). On the archaeal genome one to nine gens with significant
similarities to both, orc1 and cdc6 are present. The numerous proteins in some species are suspected
to fulfill different functions in replication; however, each Orc1/Cdc6 protein performs the work of
both eukaryal proteins, Orc1 and Cdc6. Orc1/Cdc6 is highly conserved across the archaeal domain
and only resembles the eukaryal version, in the sequence as well as on the structural level. To date,
no homologies to the bacterial origin binding protein DnaA are known (Barry and Bell, 2006). Other
proteins involved in DNA replication, which are supposed to be closer related to eukaryotic rather
than to bacterial equivalents are e.g. replicative helicases, single strand binding proteins and
primases (Edgell & Doolittle, 1997; Barry and Bell, 2006). For example eukaryotic primases are
composed of a large (PriL) and a small (PriS) subunit forming a dimer in contrast to the monomeric
DnaG of Bacteria. In Archaea homologues to both subunits are present resembling the eukaryotic
protein in its structure including the existence of a Zn-binding site on the PriS-subunit (Barry and Bell,
Introduction
16
2006). Moreover, both, Archaea and Eucarya posses a family B polymerase responsible for
elongation of replicating nucleic acid strands. Bacteria in contrast, apart from Escherichia coli,
completely lack this type of DNA replicating enzyme (Brown and Doolittle, 1997). In addition another
sort of DNA polymerase which is supposed to be involved in discrimination between leading- and
lagging-strand has been discovered in Archaea (Brown and Doolittle, 1997; Barry and Bell, 2006).
Just like the DNA replicating polymerase, the archaeal RNA polymerase (RNAP) working on
transcription of DNA into RNA was shown to be homolog to the RNA polymerase II of eukaryotes
(Huet et al., 1983). In comparison to the much simpler bacterial enzyme, the RNAPs of both other
domains are assembled of at least seven subunits (Brown and Doolittle, 1997). Yet, the archaeal
protein does not only resemble the eukaryotic one in its complexity, but also in the sequence of most
subunits (Bell and Jackson, 1998). Nevertheless there are significant differences to the eukaryotes, as
only one RNAP is present in the Archaea while Eucarya posses three different polymerases, RNAP I-III
(Brown and Doolittle, 1997).
However, in both, Archaea and Eucarya, the recruitment of the RNA polymerase to the
transcription start site requires a subset of components and transcription factors (TF) (Allers and
Mevarech, 2005). The first step in transcription initiation is the binding of TBP (TATA-box-binding
protein) to a sequence element near the transcription start site on the DNA, namely the TATA-box.
Both features are found in Archaea, as well as in eukaryotes. The archaeal TATA-box-binding protein
resembles the eukaryal one in both, its sequence and in its structure, albeit the variable amino-
terminal domain of the latter is missing (Bell and Jackson, 1998). In the Eucarya TBP is part of a large
complex, TFIID, which is attached to the promotor region and leads to the recruitment of further
transcription factors involved in transcription initiation, e.g. TFIIB (Brown and Doolittle, 1997). A
protein showing structural homologies to TFIIB, termed TFB, is also present in Archaea.
Crystallization of the archaeal transcription factor B in complex with TBP and the TATA-element
revealed that the proteins are bound to the DNA in inverse orientation compared to the eukaryal
TFIIB. This raises the question whether and how the archaeal initiator proteins are able to determine
the polarity of transcription (Bell and Jackson, 1998). Anyway, in Archaea TBP and TFB seem to be
sufficient for the initiation of transcription, while the eukaryotic system is apparently much more
complex including a multitude of transcription factors (Allers and Mevarech, 2005). However, less is
known about the similarities to eukaryotes concerning regulation and transcription elongation.
Initially a homologue to the eukaryotic elongation factor TFIIS was discovered in Archaea, but further
studies indicated that this element may only be a subunit of the RNA polymerase (Bell and Jackson,
1998). As mentioned above several archaeal elongation factors are supposed to be closer related to
the Bacteria, rather than to the Eucarya.
Introduction
17
Also proteins mediating archaeal translation share high similarity with their eukaryal
counterparts. Compared to the simplified system in the Bacteria composed of only three translation
initiation factors, more than ten proteins fulfilling different roles exist in Archaea and eukaryotes
(Allers and Mevarech, 2005). For example an archaeal homologue to the eukaryotic initiation factor
eIF-1A avoids assembling of the two ribosomal subunits previously to association of the small subunit
with the aminoacyl-tRNA, GTP and the mRNA (Brown and Doolittle, 1997; Bell and Jackson, 1998).
Moreover counterparts to the eukaryotic eIF-4A helicase and the eIF-2 complex mediating
recruitment of the tRNA and GTP to the small ribosomal subunit are found in Archaea. In contrast, no
archaeal equivalent to eIF-4 exists, as archaeal mRNAs lack the 5’-cap which is normally recognized
by this protein (Bell and Jackson, 1998). Beside, also factors mediating elongation and termination of
translation like eEF-1α, eEF-2 or eRF are found in both domains. They are involved in charging
aminoacyl tRNAs to the A-site of the ribosome, translocation of the ribosome during growing of the
polypeptide strand and finally recognition of the stop codon (Bell and Jackson, 1998). In addition it
has to be noted that in Archaea as well as in Eucarya the first amino acid recruited to the ribosome is
a methionine, rather than N-formylmethionine like in Bacteria (Keeling and Doolittle, 1995).
However, aminoacyl-tRNA synthetases as well as the ribosomes seem to be equally related to both
other domains. Detailed studies indicate, that some ribosomal proteins are closer related to the
Bacteria (RP L11) while others resemble eukaryotic counterparts (RP L10) (Brown and Doolittle,
1997). So it can be concluded that similarities concerning archaeal and eukaryal translation are
reflected by many features, but mainly by the translational factors.
Mentionable homologies between Archaea and Eucarya are also found in systems responsible
for DNA recombination and repair. In Archaea this processes are essential as many of these
organisms are exposed to a harsh environment frequently causing genomic damage. For example the
archaeal enzyme RadA mediating repair of damaged DNA by performing strand exchange strongly
resembles the eukaryotic equivalent, a protein of the RecA family. Moreover counterparts to
enzymes involved in excision repair exchanging bases in pyrimidine dimers are also found in some
archaeal species (Allers and Mevarech, 2005).
1.1.2.3. Unique characteristics of Archaea
As already described in detail Archaea share properties with both, Eucarya and Bacteria, but
they are also represented by features exclusively found in this domain. The most striking
characteristic is the certain composition of the phospholipids within the archaeal cell membrane. In
bacterial, as well as in eukaryotic lipids, fatty acids are connected with a glycerolphosphat backbone
via ester linkages (Forterre et al., 2002). Archaeal phospholipids in contrast comprise methyl
Introduction
18
branched ether linked isoprene site chains. Moreover the hydrocarbon chains replace different
phosphate groups of the glycerol, generating glycerol-1-phopsphate (G1P) in Archaea and glycerol-3-
phosphate (G3P) in the other domains, respectively. Beside, the archaeal lipid (L-glycerol) is reverse
in its enantiomeric conformation compared to bacterial and eukaryal glycerolphosphates (D-glycerol)
(Brown and Doolittle, 1997; Kandler and König, 1998). The unique composition of the lipids
(especially the ether-linkages) as well as the presence of tetraether lipids in the cytoplasmic
membrane, are supposed to be involved in maintaining stability and impermeability of the
membrane even at high temperatures and under rough conditions, reflecting the hyperthermophilic
nature of the archaeal ancestor (Forterre et al., 2002). However, not only the membrane but the cell
bordering structure of the Archaea as a whole is significantly different to the other domains. As
mentioned above, Archaea completely lack peptidoglycan, the main compound of bacterial cell walls.
Instead some species have cell walls composed of other elements like heteropolysaccharides or
pseudopeptidoglycan. Members of the Thermoplasmatales in contrast do not posses any additional
structures and are only bordered by the cell membrane containing glycoproteins. The majority of
Archaea however is surrounded by a glycoproteinaceous envelope, termed the S-layer (Kandler and
König, 1998; Forterre et al., 2002). As both, the cell wall and the RNA polymerase are completely
different among Bacteria and Archaea, another specific set of antibiotics is active in the latter (Brown
and Doolittle, 1997). Anyway, in addition to the unique structural features, one metabolic capability
is found in Archaea exclusively: methanogenesis (Forterre et al., 2002).
1.1.3. Evolution of the Archaea
The discovery of the Archaea as the third domain of life changed the view on phylogenetic
relationships and considerably supported reconstruction of the evolutionary history. The first
classical phylogenetic tree comprising all three domains was created by Woese and colleagues based
on the comparative analysis of small subunit ribosomal RNA (ss rRNA). It shows all life emerging from
one common ancestor early splitting into the bacterial domain and the eukaryal-archaeal linage
which subsequently gave rise to the Archaea and the Eucarya by branching into two domains. This
concept considers the latter two as sister groups, while the Bacteria are supposed to be the eldest
domain, closest related to the common ancestor of all life (Woese et al., 1990). However, this
scheme can neither give a deeper insight in phylogenetic development of the Archaea since the
groups within this domain are poorly resolute by rRNA analysis, nor does it describe the nature and
origin of the common ancestor. Today the identity and characteristics of this progenitor, designated
as last common ancestor (LCA) or last universal common ancestor (LUCA), are still unclear and a
Introduction
19
controversial issue (Glansdorff et al., 2008). In 1998 Carl Woese described the origin of extant life as
a community of primitive cell, evolving as a diverse unit, in course of time becoming more complex
until exchange between the different groups was not possible any more, thereby giving rise to the
individual ancestors of the three certain domains (Woese, 1998). To a large extent this concept was
based on the idea of high mutation rates and frequently occurring lateral gene transfer (LGT) within
the simple ancestor cells. In contrast to this, theses events were supposed to happen only rarely
when cellular functions become more specific and, as a result, certain proteins cannot simply be
replaced any more. Hence, both, the development of the common ancestor from progenotes
(rudimentary self replicating units) as well as the similarities between Archaea and Bacteria in
operational proteins can be explained by LGT in early stages of development (Woese, 1998). Further
publications supported this view and highlighted the importance of LGT on evolutionary processes
(Wolf et al., 2001; Forterre et al., 2002; Gribaldo and Brochier-Armanet, 2006). For example
homologies between archaeal and eukaryal enzymes involved in informational processes were also
traced back to early transferring events (Gribaldo and Brochier-Armanet, 2006). Yet, neither of these
concepts of evolutionary processes clearly defines which domain is the closest related to the last
common ancestor, only speculating about the chronologic order and relationships of Archaea,
Eucarya and Bacteria in the phylogenetic tree. The most traditional model however is the classical
rooting in the bacterial branch, implying that eukaryotes arose from the combination of early
bacterial cells by endosymbiosis developing to a more complex system (Woese, 1998; Rivera and
Lake, 2004). Moreover also the possibility that none of the three domains could be traced back to
LUCA was not excluded and even a eukaryal basis was discussed (Gribaldo and Brochier-Armanet,
2006). Anyway, Woese clearly pointed out that the common ancestor of all life has had to be a quite
primitive cell with limited functions, giving rise to more complex mechanisms, indicating a more
prokaryote-like nature of LUCA (Woese and Fox, 1977; Woese, 1998). Recent studies in contrast
define the common ancestor as a more complex system with eukaryal features but, so far, lacking
cellular organelles (Glansdorff et al., 2008). In this model the evolutionary development of the three
domains of life is traced back to reductive evolution of LUCA giving rise to the Bacteria and the
Archaea, whereas the Eucarya are supposed to be emerged from reception of primitive bacteria by
the protoeukaryotic LUCA. Hence, similarities among two domains can be explained by the complex
and diverse characteristics of the common ancestor, rather than by lateral gene transfer. Beside
LUCA is described in more details as “a complex community of protoeukaryotes with a RNA genome,
adapted to a broad range of moderate temperatures, genetically redundant, morphologically and
metabolically diverse”, also mentioning certain features like e.g. the presence of sn1,2 fatty acid
lipids (Glansdorff et al., 2008).
Introduction
20
Despite this view is inconsistent with previous models in most aspects, it conforms to a
hyperthermophilic origin of the archaeal domain (Glansdorff et al., 2008). This assumption is also
reflected by the adaption to high temperatures found in all lineages primary branching from the
archaeal ancestor (Gribaldo and Brochier-Armanet, 2006). Though methanogenesis also occurred
early in the evolution of Archaea, it is probably no characteristic of the individual ancestor as initially
assumed (Forterre et al., 2002; Gribaldo and Brochier-Armanet, 2006). Yet, all present-day Archaea
are supposed to originate in an anaerobic but maybe oxygen tolerant, chemolithotrophic or possibly
heterotrophic precursor cell (Forterre et al., 2002). However, the probably most striking feature of
the archaeal ancestor is the presence of sn2,3 isoprenyl ether lipids, a characteristic which enabled
the establishment at high temperatures and had apparently been remained in all archaeal groups
(Glansdorff et al., 2008).
1.1.4. Phylogeny and diversity
According to comparative analysis of small subunit rRNA as well as Bergey’s manual definition,
the Archaea are subdivided into two main phyla: the Crenarchaeota and the Euryarchaeota (Woese
et al., 1990; Boone and Castenholz, 2001). In addition the Nanoarchaeota and the Korarchaeota, two
smaller, probably very deeply branching lineages, were assigned to this domain later on, splitting the
Archaea into four distinct phyla. The latter comprise a couple of uncultivated species which have only
been postulated by the detection of DNA sequences in environmental samples (Barns et al., 1996).
The Nanoarchaeota however are represented by only few members, e.g. Nanoarchaeum equitans,
small cocci colonizing rocks in hot submarine vents. They grow attached to large spherical
Crenarchaeota of the genus Ignococcus, completely depending on these symbiotic associations. This
certain life style can be traced back to their strongly reduced genome (less than 500 kilobases)
lacking many important genes which are conserved among other archaeal groups (Huber et al., 2002;
Huber et al., 2003). Thus, the Nanoarchaeota have to be clearly differentiated from the other
archaeal phyla such as the Crenarchaeota, another more basal lineage. Based on ss rRNA analysis the
latter is subdivided into three orders, the Desulfurococcales, the Sulfolobales and the
Thermoproteales, all of them inhabiting mainly hot environments (Forterre et al., 2002).
Nevertheless, also uncultivated crenarchaeal species living at moderate or even low temperatures
have been detected in marine water samples (Forterre et al., 2002; Barns et al., 1996). The
Euryarchaeota however also contain hyperthermophiles, but are much more phenotypic diverse,
including also methanogene, psycrophilic, halophilic, alkaliphilic, thermoacidiophilic and other
multiple extremophilic species. It can be distinguished between nine euryarchaeal orders:
Archaeoglobales, Halobacteriales, Methanobacteriales, Methanococcales, Methanomicrobiales,
Methanosarcinales, Methanopyrales, Thermococcales and Thermoplasmatales (Forterre et al., 2002).
Introduction
21
Despite their poor phylogenetic presence compared to other domains (only 4 phyla compared to p.e.
23 within the Bacteria, Boone and Castenholz, 2001), the Archaea are a group of “metabolically
diverse organisms coexisting with Bacteria and Eucarya in the majority of Earth environments, both
terrestrial and aquatic, including also extreme ones, such as high or low pH, low temperature, high
salinity or pressure” (Gribaldo and Brochier-Armanet, 2006). The initial view that this domain is
composed of only a few methanogene members was quickly replaced as further species were
discovered, but though the idea that Archaea are original organisms inhabiting hostile environments
exclusively persisted for a very long time (Olsen, 1994). Yet, nowadays it is known that the Archaea
are not limited to extreme habitats, as well as conversely not all extremophiles necessarily have to be
members of the archaeal branch. In fact, all three domains are found side by side, colonizing the
same environments all over the world (Rothschild and Mancinelli, 2001). So the Archaea are widely
distributed, especially in the oceans as they constitute up to 30 % of the entire picoplanctonic cell
population (DeLong, 2001). Hence, they have to be considered as significant components of the
global ecological system, both, because of their substantial contribution to total biomass, but also
due to their presence at a variety of hostile environments. Adaption to high temperatures for
example is common within the Archaea, since all archaeal phyla include hyperthermophilic species
(Gribaldo and Brochier-Armanet, 2006). However, though they are also found within the bacterial
branch, hyperthermophiles are clearly dominated by the Archaea. Exposed to temperatures above
80°C these organisms are mainly challenged to prevent denaturation of their proteins and nucleic
acids as well as maintaining stability of their cytoplasmic membrane. Psycrophilic Archaea in
contrast, living at low temperatures, run the risk of getting damaged due to the formation of ice
crystals (Rothschild and Mancinelli, 2001). However, Archaea can also be adapted to other tasking
conditions such as radiation, high pressure e.g. at deep aquatic environments (barophily) or
extensive desiccation (xerophily) (Marteinsson et al., 1999; Rothschild and Mancinelli, 2001;
Zivanovic et al., 2009). Cellular desiccation can be achieved simply by reduced availability of water,
but also by the presence of high salt concentrations in the external environment (Rothschild and
Mancinelli, 2001). Organisms living under such conditions, the so called halophiles, have to cope with
osmotic stress due to a continuous efflux of water from the cytoplasm to the surrounding medium,
resulting in cellular dehydration. Thus, they have to make use of certain strategies to keep their
osmotic balance (Oren, 1999). Moreover in many cases adaption to high salinity implies the absolute
requirement of extracellular ions in order to maintain cellular stability. Yet, there are also
halotolerant microbes which are able to live under high salt concentrations for a certain period of
time, but are not addicted to it (Rothschild and Mancinelli, 2001). Within the archaeal lineage
halotolerant and halophilic species are members of the euryarchaeal order Halobacteriales and the
class Methanothermea, respectively (Oren, 2008a). The former order also includes a certain group of
Introduction
22
organisms adapted to both, high salinity and high pH values: the haloalkaliphiles (Kamekura et al.,
1997). In addition to osmotic demands, these Archaea are energetically challenged due to the
limitation of H+-ions in the surrounding medium. As well as acidophilic organisms living at low pH,
alkaliphiles are capable of extruding the external milieu by active and passive mechanisms,
maintaining a neutral cytoplasmic pH, thereby preventing denaturation of internal biological
structures. Anyway, strategies enhancing stability of the genome, proteins and membranes as well as
efficient repair mechanisms reducing cellular damage are essential in microbes exposed to rough
environmental conditions in general (Rothschild and Mancinelli, 2001). Those approaches enabling
life at high salt concentrations and elevated pH values will be discussed in the next chapter in detail.
1.1.5. Halophilic and haloalkaliphilic Archaea
Halotolerant and halophilic representatives are found in all three domains: the Eucarya, the
Bacteria and the Archaea (Oren 2002). Usually they are phylogenetically mixed with non-halophilic
relatives, forming inhomogeneous taxonomic lineages. Yet, there are three groups comprising
halophilic organisms almost exclusively. Two of them belong to the bacterial lineage: the aerobic,
heterotrophic Bacteria of the family Halomonadaceae (Gammaproteobacteria) and anaerobic,
fermentative Bacteria of the order Halanaerobiales (Firmicutes). The third group however is an
archaeal family branching from the euryarchaeal order Halobacteriales: the Halobacteriaceae (Oren,
2008a). Beside, a methanogene class of the Euryarchaeota, the Methanothermea, also contains
species living at hypersaline environments, yet this group mainly consists of moderate halophiles.
Anyway, no halotolerant or halophilic members are known within the other three archaeal phyla
(Oren 2002; Oren, 2008a).
However, in the course of this work only halophilic Archaea assigned to the Halobacteriaceae
are on the focus of closer consideration. This family is composed of 26 genera known to date:
Halobacterium, Haloadaptus, Halalkalicoccus, Haloarcula, Halobaculum, Halobiforma, Halococcus,
Haloferax, Halogeometricum, Halomicrobium, Halopiger, Haloplanus, Haloquadratum, Halorhabdus,
Halorubrum, Halosimplex, Halostagnicola, Haloterrigena, Halovivax, Natrialba, Natrinema,
Natronobacterium, Natronococcus, Natronolimnobius, Natronomonas, and Natronorubrum (Oren,
2008b). All of them are strictly aerobic organisms, mainly extreme halophiles which totally require
salt concentrations of more than 20 % for optimal growth (Lanyi, 1974). They are widespread over a
broad range of hypersaline habitats, including marine water (e.g. the Dead Sea), soda lakes and
saltern crystallizer ponds as well as environments resulting from evaporation of seawater (Oren
2002). In addition to the high concentrations of NaCl, some hypersaline lakes like Lake Magadi
Introduction
23
(Kenya) or Wadi Natrun (Egypt) exhibit especially high pH values ranging from 10.5 to 12. The
haloalkaliphilic Archaea populating these habitats, e.g. members of the genera Natrialba,
Natronobacterium or Natronomonas, are well established at the predominating conditions, reaching
titres up to 108 cells per ml of water (Horikoshi, 1999). Hence, they have to be highly adapted to
both, high salt concentrations and high pH values.
1.1.5.1. Adaptions to hypersaline conditions
As already mentioned above, the main challenge for organisms living in hypersaline habitats is
the regulation of their osmotic state since high concentrations of salt in the external medium usually
result in rapid loss of water to the environment (Oren, 1999). In the microbial world two
fundamentally different tactics have evolved to overcome this problem. The so called “high-salt-in
strategy” implies the compensation of the high external NaCl concentrations by the accumulation of
salt (usually KCl) inside the cell. As a result both, intracellular and extracellular proteins are exposed
to high salinity; hence specific adaptations are required to maintain their function (Oren, 1999; Oren,
2008a). The strategy used by most halophilic organisms in contrast, the “compatible solute strategy”,
does neither include a change in intracellular salt concentrations nor general proteomic adaptations.
Instead of this it is based on the biosynthesis and/or uptake of low-molecular-weight compounds
working as organic osmotic solutes such as polyols (e.g. glycerol), sugars, amino acids and derivates
as well as glycine betaine (Oren, 1999; Oren, 2008a). These organic compatible solutes are known to
interact with cellular enzymes, protecting them from harmful effects, thereby supporting their
functionality at stressful conditions. However, the production of these molecules requires high
energetical investment, hence this mechanism is much more expensive than the “high-salt-in
strategy” (Oren, 1999). So it can be concluded that both strategies involve advantages for halophilic
cells: while using organic compatible solutes for osmoregulation does not require adaptations of the
entire proteomic machinery, intercellular accumulation of potassium chloride is less costly.
Nevertheless, the “high-salt-in strategy” is much less widespread in nature than the “compatible
solute strategy” as it is not applied by halophilic Eucarya at all and limited to one bacterial order, the
Haloanaerobiales. Within the archaeal domain however, this approach is of central importance as it
is commonly used by the extreme halophilic members of the family Halobacteriaceae (Oren, 1999;
Oren, 2008a). On one hand haloarchaea, like halophiles in general, have to be able to totally exclude
sodium chloride from the interior of the cells which is mainly achieved by Na+/H+-antiporters (Oren
2002). Yet, in addition they have to show significant alterations in their cellular membranes, as well
as in both, intracellular and extracellular proteins in order to enable stability in contact with external
and internal hypersaline conditions.
Introduction
24
Cellular membranes: As already discussed in detail archaeal membranes are highly stable in
general as they possess sn2,3 isoprenyl ether lipids (Glansdorff et al., 2008). In addition the
membranes of extreme halophilic Archaea like the Halobacteriaceae share some unique structural
and compositional characteristics which are found within these group of organisms exclusively. For
example the lipids completely lack inositol, serin and ethanolamine head groups (Technov et al.,
2006). The most striking feature however is the common presence of archaetidylglycerol
methylphosphate (PGP-Me), an archaeal analogue of phosphatidylglycerol methylphosphate. This
certain phospholipid is limited to haloadapted membranes where it amounts to 50-80 % of the polar
membrane lipids, suggesting a function in enhancing membrane stability at high salt concentrations.
Indeed the relevance of PGP-Me to prevent aggregation of membranes under these conditions could
be demonstrated (Technov et al., 2006).
Proteomic adaptations: Most importantly, the proteins adapted to high salt concentrations are
characterized by a large proportion of acidic amino acids like glutamic and aspartic acid. For example
in Halobacterium species these residues were determined to contribute more than 10 mole percent
of the total content, resulting in very low isoelectric points around 4.2. In cell envelope proteins they
were even stated to account for about 20 mole- % (Reistadt, 1970; Fendrihan, 2006). Yet, this high
excess of negative charges within haloadapted proteins leads to repulsive electrostatic forces which
can be compensated by additional linkages preventing protein unfolding, e.g. residue interactions or
disulfide bridges (Lanyi, 1974). Further effects crucial for the stability of the proteins are hydrophobic
interactions. Exposed to high salt concentrations proteins get tightly packaged. Hence, some residues
which use to get in contact with the aqueous phase at low salinity may preferentially be buried in the
interior of the protein at hypersaline conditions, resulting in the formation of new hydrophobic
bonds (Lanyi, 1974). Although they are reduced in their number, these interactions are highly
important since hydrophobic amino acids were found to be rare in haloadapted proteins (Lanyi,
1974; Fendrihan, 2006). Yet, other studies indicated that only the content of aliphatic amino acids
with longer side chains is low, while the number of small residues such as glycine, alanine or valine is
increased (Madern et al., 1995). However, to maintain the hydrophobic interactions stabilizing
halophilic proteins, high amounts of salt in the surrounding solutes are absolutely necessary
(Fendrihan, 2006). Moreover especially cations were shown to be of crucial importance for the
stability, as they interact with the highly negatively charged haloadapted biological structures (Lanyi,
1974). Yet, due to these proteomic adaptations, members of the Halobacteriaceae totally depend on
the presence of high salt concentrations. Thus, compared to some organisms applying the
“compatible solute”, they are not able to tolerate a low salt content in the external environment and
hence are limited to hypersaline habitats exclusively (Oren, 1999; Oren, 2008a).
Introduction
25
1.1.5.2. Adaptations to high pH
Although alkaliphilic organisms are exposed to high pH values in their natural habitats (above
pH 9), estimation of the internal pH revealed that their cytoplasm is in a neutral rather than in an
alkaline range. For example the internal pH of one alkaliphilic bacterial member, the Micrococcus sp.
strain 31-2, was determined to be around pH 7.5 based on the catalytic pH optimum of the
intracellular enzyme ß-galactosidase. Furthermore also approaches implying the detection of weak
bases distributed inside and outside of the cells supported the assumption of an almost neutral
intracellular pH (Horikoshi, 1999). As a result, in contrast to cell walls and membranes, intracellular
proteins do not have to be adapted to alkaline conditions. Nevertheless, concerning proteins which
are segregated to the extracellular medium, specific alterations are absolutely required in order to
enable stability at high pH. However, all approaches enhancing these adaptations imply a modulation
of the amino acid composition. One strategy is based on the variation of amino acids which are
involved in the formation of hydrogen bonds, resulting in a shift of the pKa towards higher values.
Another possibility, like in haloadapted proteins, is an increased content of acidic amino acids
(aspartic and glutamic acid) resulting in highly negative net charge of the proteins (Shirai et al., 2008).
The latter phenomenon however is also found in alkaline cell bordering structures like cell walls and
membranes which are often characterized by a large excess of acidic polymers. Studies on Bacillus
species for example indicate that polymers such as gluconic, galacturonic, glutamic and aspartic acid
are common in cell walls of alkaliphilic members, while they are absent in those of the neutrophilic
Bacillus subtilis. The function of these additional negative charges is supposed to be the adsorption
of the positively charged Na+ and H3O+ ions while hydroxide ions (dominating at high pH) are
repulsed, hence reducing the pH at the immediate cell surface (Horikoshi, 1999).
However, in addition to its adaptations to alkaline conditions, the certain role of the cellular
membrane in extruding the basic milieu from the interior of the cell has to be highlighted (Horikoshi,
1999). On one hand of course the membrane has to be completely impermeable for certain ions in
order to separate the external and internal conditions. On the other hand active transporters are
needed to maintain the optimal intracellular milieu and generate electrochemical gradients
(Horikoshi, 1999; (van de Vossenberg et al., 1999). The major transport systems used by
haloalkaliphilic Archaea are Na+/H+-antiporters combined with H+-coupled respiration in order to
regulate the pH within the cell. These Na+/H+-antiporters drive both, the uptake of H+ and the
extrusion of Na+ at the same time, establishing an optimal system under haloalkaline conditions as
sodium ions are abundant in hypersaline environments while protons are rare at high pH (van de
Vossenberg et al., 1999). However, the formation of an electrochemical gradient due to H+ transport
results in the generation a proton motive force (pmf) composed of two factors: the transmembrane
Introduction
26
electric potential (ΔΨ) and the transmembrane pH gradient (ΔpH) (van de Vossenberg et al., 1999).
This energetic storage is finally able to drive endogenous processes in haloalkaliphilic cells.
1.1.6. Natrialba magadii
A typical representative of haloalkaliphilic Archaea belonging to the euryarchaeal family
Halobacteriaceae is Natrialba magadii. Together with other prokaryotes this rod shaped archaeon
populates one of the highly alkaline soda lakes of the east African Rift valley, the Lake Magadi in
Kenya (Jones et al., 1998). When Nab. magadii was first isolated from its natural habitat in 1984, it
was assigned to the genus Natronobacterium according to its morphology. By that time the
discovered microorganisms were divided into two groups: rods forming the genus Natronobacterium
and cocci, combined to the genus Natronococcus (Tindall et al., 1984). In 1997 however comparative
analysis of 16S rRNA highlighted the close phylogenetic relationship of the former Natronobacterium
magadii to two Natrialba asiatica strains (93.3 and 93.7 % sequence similarity, respectively),
resulting in the transfer of Natronobacterium magadii to the genus Natrialba (Kamekura et al., 1997).
Although this classification is not supported by analysis of membrane lipids, it is still accepted today.
1.1.6.1. Characteristics of Nab. magadii
The cells of Nab. magadii are motile rods with a length of 0.5 – 0.7µm (Tindall et al., 1984).
Like other members of the Halobacteriaceae they have an orange to red color due to the presence of
carotinoids (e.g. α-bacterioruberin) stored in their membrane, leading to reddish coloration of the
water they inhabit (Oren, 2002). Cultivated in the laboratory, optimal growth of Nab. magadii was
observed at 4M sodium chloride and pH values of 8.5 – 10.5. However, to avoid lysis of the cells
concentrations of at least 2M NaCl are absolutely required. In addition, reflecting the lack of these
ions in its natural environment, low concentrations of Mg2+ (below 10mM) are needed. Moreover
Nab. magadii is sensible to low temperatures while optimal growth is achieved at 37 – 42°C (Tindall
et al., 1984). However, even at ideal conditions one generation cycle takes about nine hours in the
logarithmic growth phase; hence Nab. magadii grows very slowly compared to other, more popular
microorganisms, e.g. E. coli (generation time: 20 minutes).
Introduction
27
1.1.6.2. Two laboratory strains: L11 and L13
In 1997, spontaneous lysis of the Nab. magadii wild type strain isolated from its natural habitat
gave rise to the discovery of a temperate virus persisting in this archaeon during its lysogenic cycle:
the halophage φCh1 (Witte et al., 1997). However, repeated subculturing and testing of single
colonies of the original organism revealed a non-lysogenic Nab. magadii strain, termed L13. In
contrast to the wild type strain carrying φCh1 as a prophage, this cured strain can be re-infected with
the virus, hence serving as an indicator strain. In addition, for laboratory work a Nab. magadii strain
resembling the wild type was isolated from plaques resulting from re-infection of L13. This strain,
named L11, of course contains the virus φCh1 which is integrated into the host chromosome until it
enters the lytic cycle during stationary growth of the Nab. magadii culture (Witte et al., 1997). Both
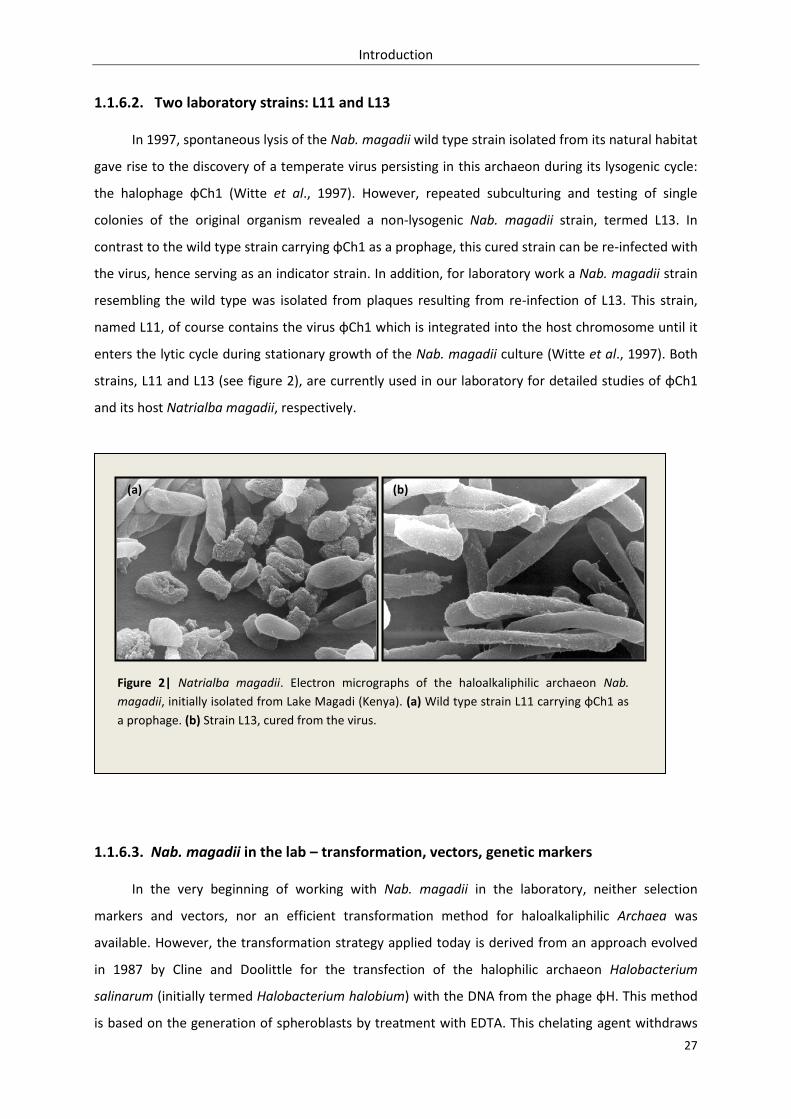
strains, L11 and L13 (see figure 2), are currently used in our laboratory for detailed studies of φCh1
and its host Natrialba magadii, respectively.
1.1.6.3. Nab. magadii in the lab – transformation, vectors, genetic markers
In the very beginning of working with Nab. magadii in the laboratory, neither selection
markers and vectors, nor an efficient transformation method for haloalkaliphilic Archaea was
available. However, the transformation strategy applied today is derived from an approach evolved
in 1987 by Cline and Doolittle for the transfection of the halophilic archaeon Halobacterium
salinarum (initially termed Halobacterium halobium) with the DNA from the phage φH. This method
is based on the generation of spheroblasts by treatment with EDTA. This chelating agent withdraws
Figure 2| Natrialba magadii. Electron micrographs of the haloalkaliphilic archaeon Nab.
magadii, initially isolated from Lake Magadi (Kenya). (a) Wild type strain L11 carrying φCh1 as
a prophage. (b) Strain L13, cured from the virus.
(a) (b)
Introduction
28
Mg2+ ions stabilizing the S-layer, thereby resulting in the removal of this glycoproteinaceous envelope
and, thus, enables transfection of the competent cells. The uptake of foreign DNA however was
mediated by coupling to polyethylene glycol 600 (PEG 600) (Cline and Doolittle, 1987). Later on,
based on this principle, methods for the transformation of several archaeal species were developed
and summarized in a manuscript termed “The Halohandbook” (Dyall-Smith, 2008). In alkaliphilic
Archaea like Nab. magadii however the S-layer is not stabilized by divalent cations, thus it cannot be
affected by the addition of EDTA. Instead of this, spheroblast cells of Nab. magadii can be generated
by primary treatment with bacitracin, an agent interfering with the glycosylation of the S-layer
proteins, followed by partially enzymatic digestion performed by proteinase K. Immediately
afterwards, introduction of foreign DNA by PEG mediated transformation is possible (Iro et al., in
prep). This method evolved in the laboratory of Angela Witte is still successfully used today.
Anyway, for the transformation of Natrialba magadii shuttle vectors for E. coli and
Nab. magadii had to be constructed. The first vector working efficiently in both organisms was
developed by Iro and co-workers (Iro et al., in prep). This plasmid is based on the construct of a pKSII+
vector, hence possessing an origin of replication active in E.coli as well as an ampicillin resistance
(bla) for cloning in the bacterium. This system was supplemented with the gyrB gene of Haloferax
alicantei, providing a novobiocin resistance for selection in Nab. magadii, yielding the vector pNov-1.
Moreover, to enable amplification in the archaeon, different constructs of the region comprising the
putative origin of replication of the Nab. magadii specific phage φCh1 were cloned onto this vector.
This region, ranging from ORF53 to ORF54, shows remarkable sequence homologies to the repH gene
of pNRC100, a plasmid found in Haloarcula marismortui (Iro et al., in prep). In general, RepH is
known to be a part of the replicons of plasmids persisting in halophilic Archaea (Ng and DasSarma,
1993; Klein et al., 2002). Hence, this region of φCh1 was supposed to enable the replication of the
new shuttle vector in Nab. magadii too. Indeed, incorporation of three different fragments into
pNov-1 yielded high transformation efficiencies of the corresponding plasmids, termed pRo-3, pRo-5
and pRo-6. The best results however were achieved with the vector pRo-5, which has successfully
been employed for transformation of Nab. magadii up to date (Iro et al., in prep).
Only few other plasmids of haloarchaea, e.g. pNB102, can be used in Nab. magadii. However,
the production of different shuttle systems is constricted by the poor presence of genetic markers, as
most antibiotics working in Bacteria are not active in Archaea. However, two selectable markers are
commonly used in Nab. magadii: resistances against novobiocin (nov) and mevinolin (mev),
respectively. In Bacteria the antibiotic novobiocin is known to prevent the binding of ATP to the B
subunit of the DNA gyrase, an enzyme working on the introduction of negative supercoils into the
bacterial genome. As a result the function of this enzyme is blocked, causing inhibition of bacterial
Introduction
29
growth (Holmes and Dyall-Smith, 1991). The same effect was observed in Archaea, suggesting a
similar mechanism in targeting the DNA gyrase of this domain. The resistance to novobiocin however
was discovered in a spontaneous mutated strain of the genus Haloferax. Comparative analysis of this
mutant and the wild type genome revealed the presence of three base exchanges in the ATP binding
region of the DNA gyrase, probably resulting in a reduced affinity of the archaeal enzyme to the drug
in the resistant cells (Holmes and Dyall-Smith, 1991).
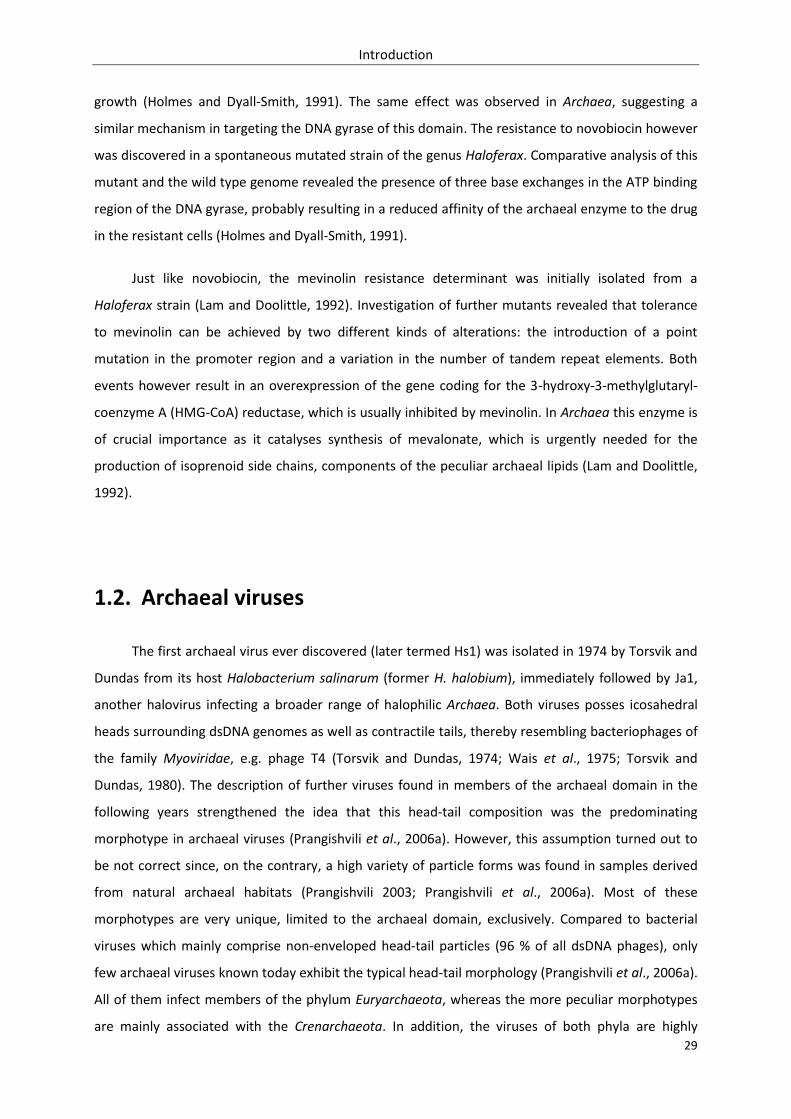
Just like novobiocin, the mevinolin resistance determinant was initially isolated from a
Haloferax strain (Lam and Doolittle, 1992). Investigation of further mutants revealed that tolerance
to mevinolin can be achieved by two different kinds of alterations: the introduction of a point
mutation in the promoter region and a variation in the number of tandem repeat elements. Both
events however result in an overexpression of the gene coding for the 3-hydroxy-3-methylglutaryl-
coenzyme A (HMG-CoA) reductase, which is usually inhibited by mevinolin. In Archaea this enzyme is
of crucial importance as it catalyses synthesis of mevalonate, which is urgently needed for the
production of isoprenoid side chains, components of the peculiar archaeal lipids (Lam and Doolittle,
1992).
1.2. Archaeal viruses
The first archaeal virus ever discovered (later termed Hs1) was isolated in 1974 by Torsvik and
Dundas from its host Halobacterium salinarum (former H. halobium), immediately followed by Ja1,
another halovirus infecting a broader range of halophilic Archaea. Both viruses posses icosahedral
heads surrounding dsDNA genomes as well as contractile tails, thereby resembling bacteriophages of
the family Myoviridae, e.g. phage T4 (Torsvik and Dundas, 1974; Wais et al., 1975; Torsvik and
Dundas, 1980). The description of further viruses found in members of the archaeal domain in the
following years strengthened the idea that this head-tail composition was the predominating
morphotype in archaeal viruses (Prangishvili et al., 2006a). However, this assumption turned out to
be not correct since, on the contrary, a high variety of particle forms was found in samples derived
from natural archaeal habitats (Prangishvili 2003; Prangishvili et al., 2006a). Most of these
morphotypes are very unique, limited to the archaeal domain, exclusively. Compared to bacterial
viruses which mainly comprise non-enveloped head-tail particles (96 % of all dsDNA phages), only
few archaeal viruses known today exhibit the typical head-tail morphology (Prangishvili et al., 2006a).
All of them infect members of the phylum Euryarchaeota, whereas the more peculiar morphotypes
are mainly associated with the Crenarchaeota. In addition, the viruses of both phyla are highly
Introduction
30
different in terms of their life styles. While euryarchaeal viruses grow lytically or lysogenic, often
integrating into the host-chromosome, crenarchaeal viruses are characterized by stable relationships
to their mainly hyperthermophilic hosts without bursting the cells, thereby avoiding contact with the
almost harsh environments (Prangishvili et al., 2006b). Anyway, despite these differences, in fact all
of them possess either a linear or a circular double stranded DNA genome (Prangishvili et al., 2006a).
Surprisingly however, primary categorization of archaeal viruses is neither based on the nature of
their hosts nor on genomic features, but rather on morphological criteria. As a result the archaeal
head-tail viruses are assigned to two families predominated by bacterial head-tail phages: the
Myoviridae and the Siphonoviridae (Prangishvili et al., 2006). In contrast many new families arise
from the highly variable morphotypes found in the crenarchaeal lineage, including fusiform, bottle
and droplet shaped, linear as well as spherical virions (Prangishvili et al., 2006a).
1.2.1. Morphotypes – classification of archaeal viruses
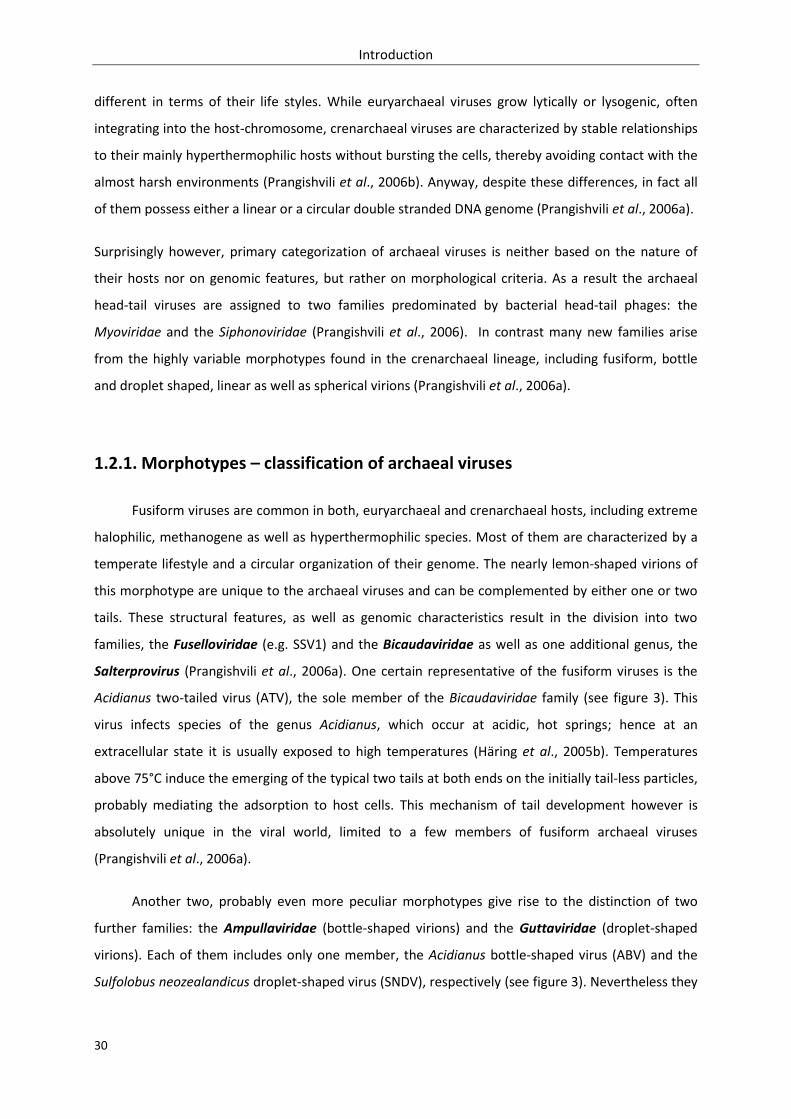
Fusiform viruses are common in both, euryarchaeal and crenarchaeal hosts, including extreme
halophilic, methanogene as well as hyperthermophilic species. Most of them are characterized by a
temperate lifestyle and a circular organization of their genome. The nearly lemon-shaped virions of
this morphotype are unique to the archaeal viruses and can be complemented by either one or two
tails. These structural features, as well as genomic characteristics result in the division into two
families, the Fuselloviridae (e.g. SSV1) and the Bicaudaviridae as well as one additional genus, the
Salterprovirus (Prangishvili et al., 2006a). One certain representative of the fusiform viruses is the
Acidianus two-tailed virus (ATV), the sole member of the Bicaudaviridae family (see figure 3). This
virus infects species of the genus Acidianus, which occur at acidic, hot springs; hence at an
extracellular state it is usually exposed to high temperatures (Häring et al., 2005b). Temperatures
above 75°C induce the emerging of the typical two tails at both ends on the initially tail-less particles,
probably mediating the adsorption to host cells. This mechanism of tail development however is
absolutely unique in the viral world, limited to a few members of fusiform archaeal viruses
(Prangishvili et al., 2006a).
Another two, probably even more peculiar morphotypes give rise to the distinction of two
further families: the Ampullaviridae (bottle-shaped virions) and the Guttaviridae (droplet-shaped
virions). Each of them includes only one member, the Acidianus bottle-shaped virus (ABV) and the
Sulfolobus neozealandicus droplet-shaped virus (SNDV), respectively (see figure 3). Nevertheless they
Introduction
31
represent own families due to the inimitability of their particle forms (Häring et al., 2005a; Arnold
et al., 2000a).
The linear viruses are also subdivided into two groups causing classification of two new
families, the Rudiviridae (e.g. SIRV1) and the Lipothrixiviridae (e.g. SIFV, see figure 3), respectively.
Both possess tube-shaped particles, but the Rudiviridae are stiff and straight including short polar tail
fibre structures, while the Lipothrixiviridae are flexible and usually enveloped (Prangishvili et al.,
1999; Arnold et al., 2000b; Prangishvili et al., 2006a). They are highly dispersed at hot, terrestrial
environments, infecting members of the crenarchaeal phylum such as Acidianus, Sulfulobus and
Thermoproteus species (Prangishvili et al., 2006a).
Compared to other morphotypes, the number of spherical viruses is generally low. Like linear
viruses however some of them are associated with the Crenarchaeaota, infecting hyperthermophilic
species of the genera Thermoproteus and Pyrobaculum. These viruses, such as Pyrobaculum spherical
virus (PSV) are taxonomically pooled together due to their genomic properties, forming the family
Globuloviridae (Häring et al., 2004). The other sort of spherical viruses found in both, Crenarchaeota
and Euryarchaeota, is assigned to the bacterial family Tectiviridae (Prangishvili et al., 2006a).
However, apart from a few spherical and fusiform members, most viruses infecting
Euryarchaeota are head-tail viruses (see figure 3). Their host range comprises mesophilic and
moderately thermophilic methane producing Archaea as well as extreme halophiles. As already
mentioned they resemble bacterial head-tail phages in their composition, hence they are assigned to
two families of bacteriophages: the Myoviridae, including particles with contractile tail and the
Siphonoviridae, implying non-contractile tails. Though they are highly different concerning the size of
their head and tails, all of them contain genomes consisting of linear dsDNA (Prangishvili et al.,
2006a; Prangishvili et al., 2006b). Anyway, as this morphotype is most common in halophages, it is in
the centre of focus in further discussions.
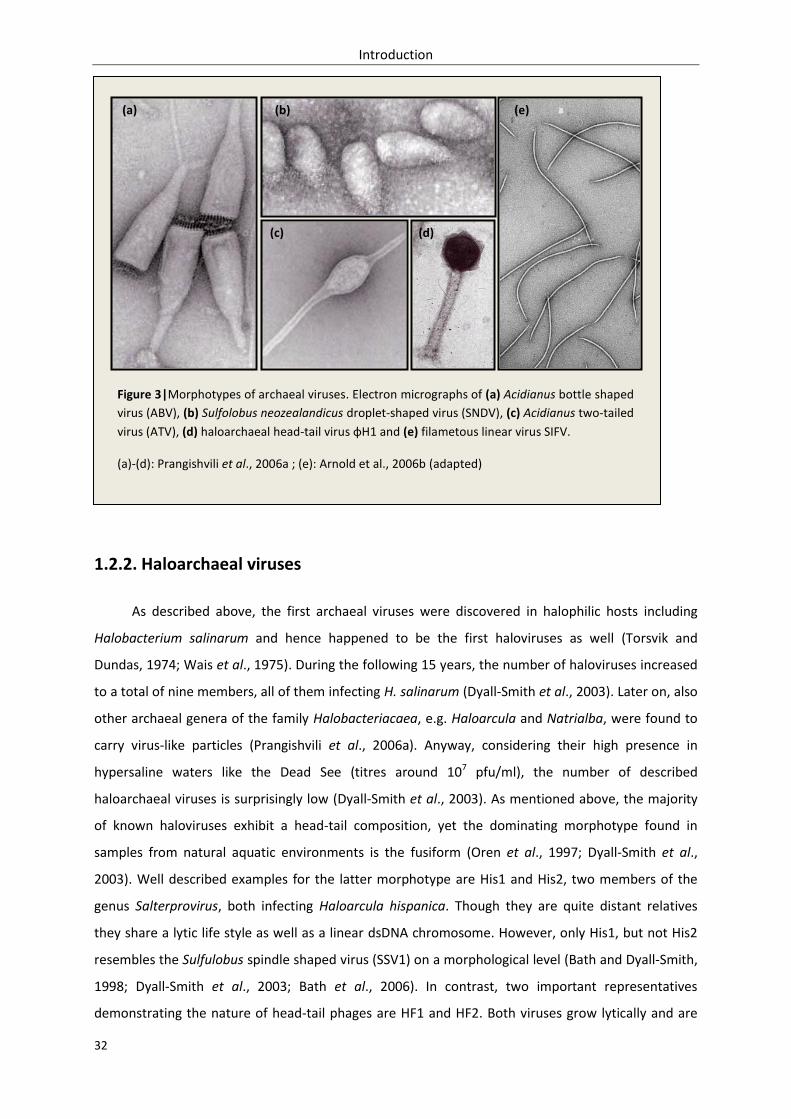
Introduction
32
1.2.2. Haloarchaeal viruses
As described above, the first archaeal viruses were discovered in halophilic hosts including
Halobacterium salinarum and hence happened to be the first haloviruses as well (Torsvik and
Dundas, 1974; Wais et al., 1975). During the following 15 years, the number of haloviruses increased
to a total of nine members, all of them infecting H. salinarum (Dyall-Smith et al., 2003). Later on, also
other archaeal genera of the family Halobacteriacaea, e.g. Haloarcula and Natrialba, were found to
carry virus-like particles (Prangishvili et al., 2006a). Anyway, considering their high presence in
hypersaline waters like the Dead See (titres around 107 pfu/ml), the number of described
haloarchaeal viruses is surprisingly low (Dyall-Smith et al., 2003). As mentioned above, the majority
of known haloviruses exhibit a head-tail composition, yet the dominating morphotype found in
samples from natural aquatic environments is the fusiform (Oren et al., 1997; Dyall-Smith et al.,
2003). Well described examples for the latter morphotype are His1 and His2, two members of the
genus Salterprovirus, both infecting Haloarcula hispanica. Though they are quite distant relatives
they share a lytic life style as well as a linear dsDNA chromosome. However, only His1, but not His2
resembles the Sulfulobus spindle shaped virus (SSV1) on a morphological level (Bath and Dyall-Smith,
1998; Dyall-Smith et al., 2003; Bath et al., 2006). In contrast, two important representatives
demonstrating the nature of head-tail phages are HF1 and HF2. Both viruses grow lytically and are
Figure 3|Morphotypes of archaeal viruses. Electron micrographs of (a) Acidianus bottle shaped
virus (ABV), (b) Sulfolobus neozealandicus droplet-shaped virus (SNDV), (c) Acidianus two-tailed
virus (ATV), (d) haloarchaeal head-tail virus φH1 and (e) filametous linear virus SIFV.
(a)-(d): Prangishvili et al., 2006a ; (e): Arnold et al., 2006b (adapted)
(a) (b)
(d)
(e)
(c)
Introduction
33
not integrating into the host genome. They were isolated from the same lake and are highly identical
in terms of their virion shape and genome (80 % sequence identity), yet they infect a completely
different range of hosts, including Haloarcula, Halobacterium, Haloferax and Natrialba (Nuttall and
Dyall-Smith, 1993). However, there are numerous viruses showing this morphotype, e.g. ΨM2
(Pfister et al., 1998) and ΨM199 (Luo et al., 2001), yet only few of them are well described. Anyway,
the best studied haloarchaeal head-tail virus is φH. Like other phages possessing icosahedral heads
and contractile tails, it is assigned to the family Myovirdae, resembling bacteriophage P1 in terms of
morphology as well as replication strategies and control of lysogeny (Dyall-Smith et al., 2003). To
maintain structural stability it requires concentrations of at least 3M sodium or potassium chloride,
reflecting the halophilic nature of its host, Halobacterium salinarum. The 59 kb genome of φH
consists of linear dsDNA and is characterized by an excess of guanine and cytosine (65 %). Moreover,
it is terminally redundant and partially circularly permuted, mediating a headful packaging
mechanism. Like one close relative, the halophage φCh1 infecting Nab. magadii, φH is a temperate
virus, switching between a stable lysogenic and a lytic cycle. Yet, in contrast to the φCh1-DNA which
integrates into the host genome, φH exists as circular prophage DNA in the host cell during its
lysogenic state (Schnabel et al., 1982). In addition, due to insertion elements flanking a certain part
of the φH genome, the so called L-segment, an inversion event can lead to the exclusion of this
region as a circular plasmid. This plasmid, termed pφHL, can persist stably in the host cells, resulting
in resistance to further φH infections, independently from the presence of the virus itself (Schnabel
et al., 1984). Interestingly the L-segment strongly resembles the central part of the genome of its
relative φCh1 (50 – 97 % sequence identity). Nevertheless, due to the lack of insertion elements in
φCh1, this special mechanism is unique to φH (Gropp et al., 1992; Klein et al., 2002).
1.2.3. φCh1 – a haloalkaliphilic virus
As already mentioned above, φCh1 was discovered in 1997 as a consequence of spontaneous
lysis of the haloalkaliphilic archaeon Nab. magadii. Up to date, no other host of this virus has been
found. Like Nab. magadii, φCh1 is adapted to high salt concentrations as well as elevated pH values
and, thus, has to be considered as the first (and so far only) haloalkaliphilic virus ever described
infecting a member of the archaeal branch (Witte et al., 1997). Yet, even though it is used to another
pH range, φCh1 is very similar to the halophilic virus φH with respect to several genomic and
structural features. Like the latter, it belongs to the family of Myovirdae, hence possessing contractile
tails and icosahedral heads (Schnabel et al., 1982; Witte et al., 1997). Both particles contain a linear
dsDNA genome of almost equal size, which is terminally redundant. As a result, a similar packaging
Introduction
34
mechanism based on circular permutation can be suggested (Schnabel et al., 1982; Klein et al., 2002).
Moreover the two viruses share a temperate life style, albeit φCh1 integrates into the host
chromosome, whereas φH persists in the cell in an episomal state (Schnabel et al., 1984; Witte et al.,
1997). However, already in 2002 when the complete DNA sequence of φCh1 was established, it was
stated that the genome sequences of these two viruses are highly similar. Especially the central part
of the φCh1 genome was found to resemble the L-segment of φH since comparative analysis
revealed a nucleotide identity of 50-97 % (Klein et al., 2002). Yet, by that time only about 60 % of the
φH genome were sequenced (Dyall-Smith et al., 2003). Recently, however, the complete sequence of
the φH DNA has been determined too (Dyall-Smith, personal communication), hence enabling the
observation of further crucial similarities between φH and φCh1 in prospective studies.
All this correlations of φCh1 and φH suggest a close relationship of these two viruses, though
their hosts are phylogenetically distant, inhabiting different environments with varying conditions.
Nevertheless, the presence of pH gradients in saline lakes may have enabled a quite near localization
of Nab. magadii and H. salinarum and, thus, the exchange of certain genetic modules between φCh1
and φH in course of evolution (Klein et al., 2002; Dyall-Smith et al., 2003).
Anyway, today, both viruses belong to the best studied viruses infecting haloarchaeal hosts.
Though φH was the first of them to be discovered and in the centre of extensive research from 1982
to 1994 (Dyall-Smith et al., 2003), φCh1 established a certain role as the only known virus of
haloalkaliphilic Archaea. Due to detailed investigations of φCh1 highlighting general properties of this
virus and the function of several gene products involved in certain mechanisms, the knowledge
about φCh1 can not be considered as minor important compared to φH. Moreover past projects
yielded several methods and supporting tools (e.g. shuttle vectors) enabling work with this virus and
its haloalkaliphilic host Nab. magadii, respectively (Witte et al., 1997; Baranyi et al., 2000; Klein et al.,
2000; Klein et al., 2002; Rössler et al., 2004; Iro et al., 2007).
1.2.3.1. Morphology and structural proteins of φCh1
As a member of the family Myoviridae, φCh1 is characterized by a typical head-tail morphology
(illustrated in figure 4). The particles are composed of icosahedral heads which are 70nm in diameter
and contractile tails 130nm in length, assembling to virions with a total length of 200nm. The
contractile tails cover an internal shaft, yielding structures with a width of approx. 20nm. Moreover,
on electron micrographs certain structural elements are visible at the ends of the tails: the tail fibres
(Witte et al., 1997). Like most haloadapted proteins, the tail fibre protein of φCh1 has a low
isoelectric point (pI = 3.7) due to an excess of acidic amino acids. This however results in a mobility
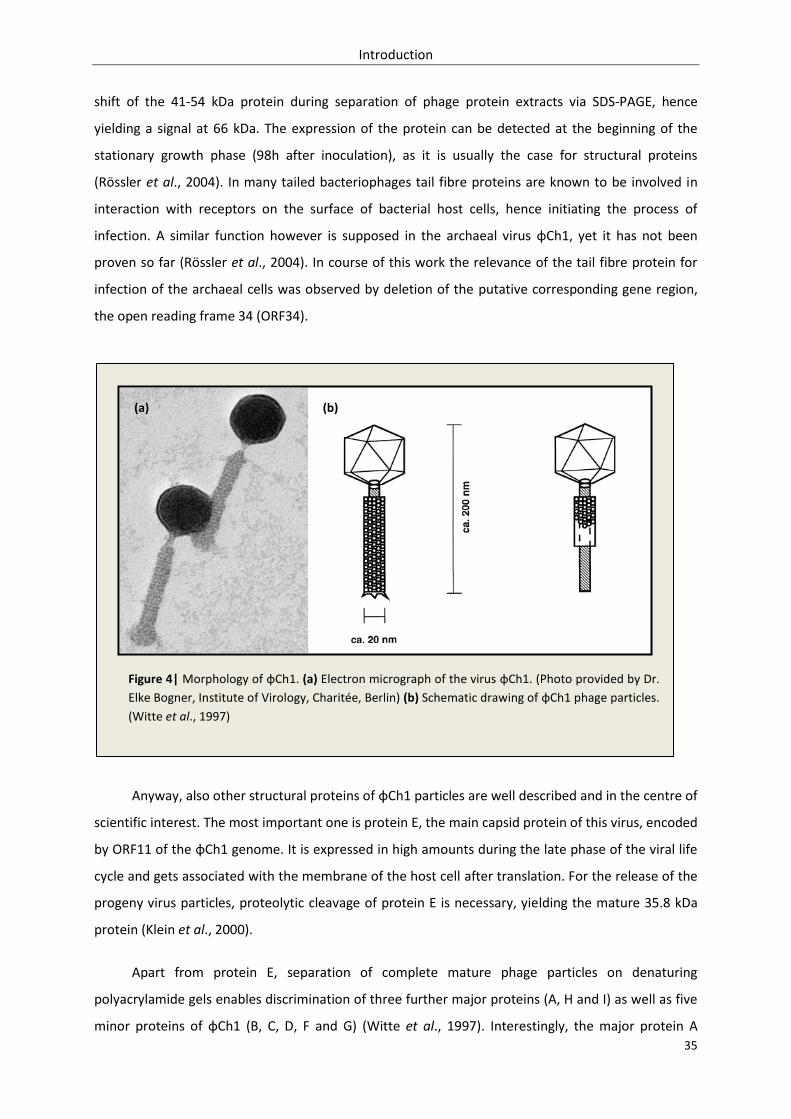
Introduction
35
shift of the 41-54 kDa protein during separation of phage protein extracts via SDS-PAGE, hence
yielding a signal at 66 kDa. The expression of the protein can be detected at the beginning of the
stationary growth phase (98h after inoculation), as it is usually the case for structural proteins
(Rössler et al., 2004). In many tailed bacteriophages tail fibre proteins are known to be involved in
interaction with receptors on the surface of bacterial host cells, hence initiating the process of
infection. A similar function however is supposed in the archaeal virus φCh1, yet it has not been
proven so far (Rössler et al., 2004). In course of this work the relevance of the tail fibre protein for
infection of the archaeal cells was observed by deletion of the putative corresponding gene region,
the open reading frame 34 (ORF34).
Anyway, also other structural proteins of φCh1 particles are well described and in the centre of
scientific interest. The most important one is protein E, the main capsid protein of this virus, encoded
by ORF11 of the φCh1 genome. It is expressed in high amounts during the late phase of the viral life
cycle and gets associated with the membrane of the host cell after translation. For the release of the
progeny virus particles, proteolytic cleavage of protein E is necessary, yielding the mature 35.8 kDa
protein (Klein et al., 2000).
Apart from protein E, separation of complete mature phage particles on denaturing
polyacrylamide gels enables discrimination of three further major proteins (A, H and I) as well as five
minor proteins of φCh1 (B, C, D, F and G) (Witte et al., 1997). Interestingly, the major protein A
Figure 4| Morphology of φCh1. (a) Electron micrograph of the virus φCh1. (Photo provided by Dr.
Elke Bogner, Institute of Virology, Charitée, Berlin) (b) Schematic drawing of φCh1 phage particles.
(Witte et al., 1997)
(a) (b)
Introduction
36
(80 kDa) shows the same N-terminal amino acid composition as the 14.4 kDa protein H, which is
encoded by ORF19. Hence it is supposed that protein A is either a homo- or a heteromultimer of the
gene product of ORF19 as well. Compared to the major structural proteins, minor proteins such as
protein B, C and D (encoded by ORFs 9, 7 and 8, respectively) are present in much lower quantities in
mature viral particles (Klein et al., 2002). Though they are visible on protein gels as separate bands
and can be detected by an antibody raised against the surface of φCh1.
Furthermore all structural proteins of this halovirus in general are characterized by low
isoelectric points, thus enabling exposure to high salinity and pH. As a result of these adaptations of
viral proteins, φCh1 particles are highly sensitive to low salt concentrations. Experiments based on
dialysis of virions revealed that concentrations below 2M NaCl cause a loss of infectivity of φCh1,
either because of complete dissociation of the proteins, or due to dramatic changes in their
conformation (Witte et al., 1997).
1.2.3.2. Life cycle of φCh1
Spontaneous lysis of the wild type strain L11 occurs at the beginning of the stationary growth
phase, releasing mature particles of φCh1. The delay in the onset of lysis suggests a lysogenic phase
in addition to the lytic phase in the life cycle of the virus; hence φCh1 is considered as a temperate
phage. This means that previously to the formation of the phage particles, the virus exists in a
prophage state, either by persisting in the host cell in an episomal state, or by integration into the
host chromosome. The latter strategy was confirmed by hybridisation of the Nab. magadii
chromosome with a φCh1-specific DNA probe. This method also enabled mapping of the concrete
position on the host-DNA where the phage is integrated (Witte et al., 1997).
This temperate lifestyle however requires precise regulation. Past studies show the presence
of two putative repressor genes probably involved in preventing early onset of the lytic cycle during
the lysogenic state: ORF48 and ORF49 (Klein et al., 2002). ORF48 resembles the sequence of the φH
repressor, but yet is expressed constitutively during the whole life cycle of φCh1. Thus it cannot be
the control element defining the time point of lysis, albeit a function of ORF49 is assumed (Iro et al.,
2007). ORF49 in contrast is upregulated in the logarithmic and/or stationary growth phase and the
corresponding gene product is supposed to inhibit another repressor which avoids the onset of lysis.
This protein had already been suspected to be involved in regulation of the φCh1 status since a
spontaneous duplication of the gene region resulted in an earlier onset of lysis (Iro et al., 2007).
However in recent studies its function as a repressor of the lytic phase was investigated in detail and
further confirmed.
Introduction
37
1.2.3.3. Genomic organization of φCh1
The halovirus φCh1 comprises a linear dsDNA genome with a size of 58 498 base pairs (Klein
et al., 2002). In addition mature particles contain several RNA species, yet they were confirmed to be
completely host derived (Witte et al., 1997). The DNA genome is terminally redundant and circularly
permuted, indicating a “headful” mechanism of DNA-packaging similar to that observed in φH (Klein
et al., 2002). Its total nucleotide sequence was determined in 2002 by Klein et al., thus enabling
prediction of 98 open reading frames (ORFs) and their organization into functional genetic modules.
All ORFs of the φCh1 genome, except for four starting with GTG (ORFs 3, 41, 79 and 83, respectively),
have an ATG as a start codon. They are arranged as transcriptional units as they are tightly packaged,
predominately facing the same reading directions (Klein et al., 2002). Moreover, the entire
nucleotide sequence is characterized by an overproportional content of the bases guanine and
cytosine (61.9 %), reflecting the constitution of the host genome (Witte et al., 1997; Klein et al.,
2002). This feature is typical for members of the initially defined haloarchaeal group Natronobacteria
in general (Tindall et al., 1984).
Surprisingly however, in contrast to the genome of Nab. magadii, the DNA of φCh1 was found
to be partially methylated (Witte et al., 1997). Restriction analysis revealed a Dam-like methylation of
adenine residues within certain recognition sites (5’-GATC-3’), while modifications were not observed
at any cytosine residues. Furthermore it was confirmed that methylation is restricted to some parts
of the viral genome population and occurs on both DNA strands, whereas the rest of the genome
completely lacks these modifications (Witte et al., 1997). The reason for this phenomenon was found
when the virus encoded enzyme performing these modifications, the methyltransferase M.φCh1-I,
was identified. This enzyme is not expressed until far advanced φCh1 development; hence not the
whole viral DNA can be methylated before packaging of the DNA is finished (Baranyi et al., 2000).
Anyway, the purpose of these modifications on the φCh1 genome is not clear, since the genome of
the only known host, Natrialba magadii, lacks adenine methylation. Hence, an adaption to this host
in order to avoid cellular defense mechanisms can be excluded (Baranyi et al., 2000).
However, later on M.φCh1-I was shown to be encoded by ORF94 of the φCh1 genome.
Moreover two additional methyltransferases were discovered: M.NmaφCh1-II and M.NmaφCh1-III.
The genes coding for all these enzymes involved in DNA modification were shown to be clustered on
the virus chromosome (Klein et al., 2002). Their organization can be seen in figure 5.
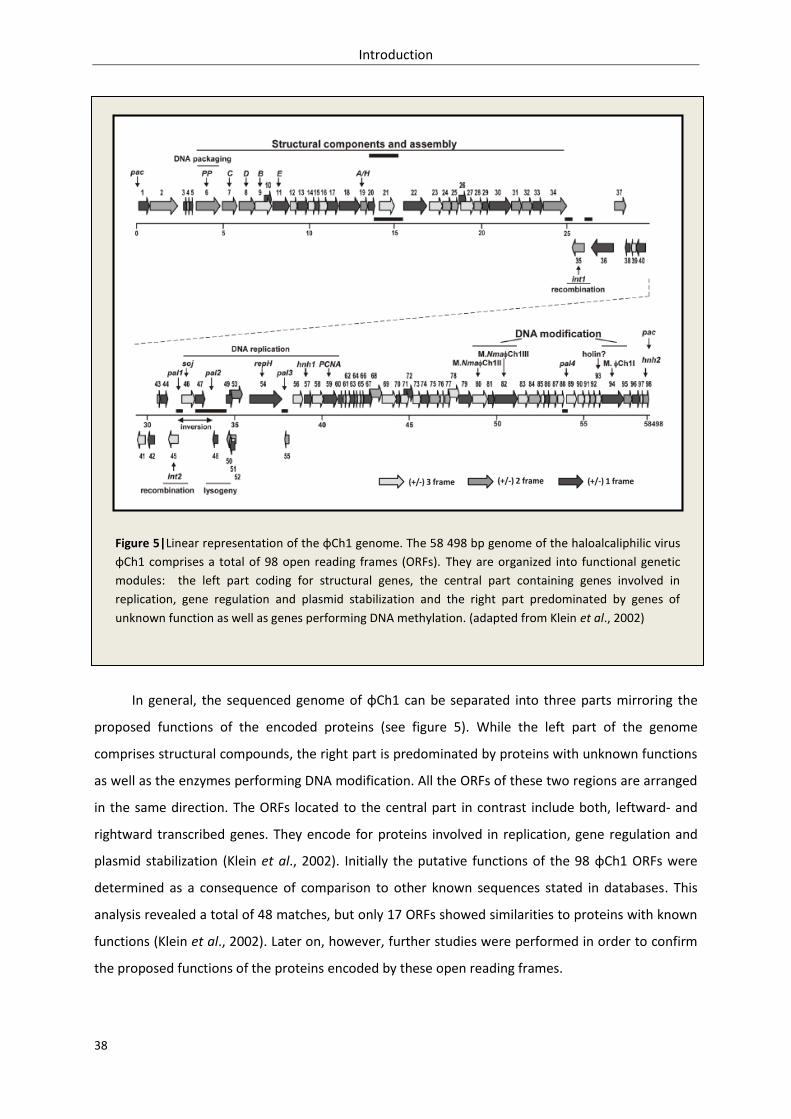
Introduction
38
In general, the sequenced genome of φCh1 can be separated into three parts mirroring the
proposed functions of the encoded proteins (see figure 5). While the left part of the genome
comprises structural compounds, the right part is predominated by proteins with unknown functions
as well as the enzymes performing DNA modification. All the ORFs of these two regions are arranged
in the same direction. The ORFs located to the central part in contrast include both, leftward- and
rightward transcribed genes. They encode for proteins involved in replication, gene regulation and
plasmid stabilization (Klein et al., 2002). Initially the putative functions of the 98 φCh1 ORFs were
determined as a consequence of comparison to other known sequences stated in databases. This
analysis revealed a total of 48 matches, but only 17 ORFs showed similarities to proteins with known
functions (Klein et al., 2002). Later on, however, further studies were performed in order to confirm
the proposed functions of the proteins encoded by these open reading frames.
Figure 5|Linear representation of the φCh1 genome. The 58 498 bp genome of the haloalcaliphilic virus
φCh1 comprises a total of 98 open reading frames (ORFs). They are organized into functional genetic
modules: the left part coding for structural genes, the central part containing genes involved in
replication, gene regulation and plasmid stabilization and the right part predominated by genes of
unknown function as well as genes performing DNA methylation. (adapted from Klein et al., 2002)
Introduction
39
In this way also the origin of replication of φCh1 could be identified. It is located to the central
part of the genome, at the region ranging from ORF53 to ORF54. Both ORFs share significant
sequence similarities with repH of the Haloarcula marismortui plasmid pNRC100, encoding for the
replication protein RepH. While the most striking homologies of ORF54 are present at the C-terminal
part of the corresponding protein, similarities of ORF53 are less significant and restricted to the
N-terminal end (Klein et al., 2002; Iro et al., in prep). Moreover ORF54 resembles other sequences
required for plasmids replication in different archaeal representatives, e.g. Halobacterium salinarum
and Haloferax volcanii (Ng and DasSarma, 1993; Klein et al., 2002). In addition AT-rich promotor
regions (typical for replication starts) were identified upstream of ORF53 and downstream of ORF54,
respectively. All these facts indicate that the whole region comprising both ORFs and their
surrounding sequences represent the origin of replication in φCh1 (Klein et al., 2002; Iro et al., in
prep). As discussed above this DNA sector was successfully used for the construction of a shuttle
vector working in E. coli and Nab. magadii (Iro et al., in prep).
Another crucial region of the φCh1 DNA comprises ORF34 located to the left part, as well as
ORF35 and ORF36 assigned to the central part of the genome (Klein et al., 2002). ORF35 encodes for
the site-specific recombinase Int1 which is known to perform inversion reactions resulting in an
exchange of the 3’-ends of the neighboring ORF34 and ORF36, respectively. This event however gives
rise to the production of the protein gp3452 carrying the C-terminus of gp36, which is supposed to be
the tail-fibre protein of the virus φCh1 enabling interaction with its host Nab. magadii (Rössler et al.,
2004). The function of this protein as well as the mechanism of the inversion within its gene locus will
be discussed in the next chapter.
1.2.3.4. The invertible region of φCh1
The invertible region on the φCh1 genome consists of three open reading frames: ORF34,
ORF35 and ORF36, respectively. Based on comparative analysis of its sequence, ORF35, also
designated as int1, was shown to code for a site-specific recombinase of the λ integrase family, the
Integrase 1 (Int1). Another site-specific recombinase of the same integrase type is present in the
halophage φCh1: Int2, encoded by ORF45 (Klein et al., 2002). In general it can be distinguished
between two families of site-specific recombinases: the resolvase/invertase family and the λ
integrase family. In comparison to the former, the λ integrase family represents a highly divergent
group, involved in numerous processes such as transposition, integration of viral or plasmid DNA into
the cellular genome, resolution of circular DNA forms as well as DNA excision or inversion, thereby
effecting gene expression (Hallet and Sherratt, 1997). The only striking common characteristic of
these enzymes is the presence four conserved amino acid residues, Arg-His-Arg-Tyr (RHRY) forming a
Introduction
40
tetrad at the C-terminal region (Argos et al., 1986; Abremski and Hoess, 1992; Blakely and Sherrat,
1996). This motive is also found in Int1 of the halophage φCh1. It is composed of three separate
regions on the polypeptide strand, BoxA, BoxB and BoxC which come close together during folding of
the protein, providing the four certain amino acids RHRY (Rössler et al., 2004). The catalytic tyrosine
of this recombinase is supposed to mediate strand cleavage and delocalization, thus resulting in the
formation of an intermediate holliday junction which then is resolved by rejoining of the DNA strands
(Hallet and Sherrate, 1997; Rössler et al., 2004).
Initially, the exact effect of this process on the life cycle of φCh1 was not clear. A possible
influence of either Int1 or Int2 on the integration of the viral DNA into the chromosome of its host
was suggested, but also other functions were discussed (Klein et al., 2002). Later on however it was
confirmed, that Int1 is required and sufficient in order to perform inversion reactions within the
neighboring ORFs flanking its gene locus: ORF34 and ORF36 (Rössler et al., 2004; Ladurner, 2008).
These two ORFs both encode for structural proteins and are oriented in opposite directions; so in
contrast to ORF34, which is rightward transcribed, ORF36, just like int1, points leftwards (Klein et al.,
2002). Yet, only ORF34 possesses a functional promoter (Rössler et al., in prep). However, both,
ORF34 and ORF36, contain clusters composed of numerous 30bp direct repeats and one final
inverted repeat: IR-L (within ORF34) and IR-R (within ORF36) (Klein et al., 2002). These two repeat
clusters are oriented in an inverted direction with respect to each other (Klein et al., 2002). Hence,
recombination events within these two ORFs performed by Int1, result in inversion of this gene
region, thus leading to an exchange of the 3’ ends of ORF34 and ORF36. For that reason φCh1 DNA
isolated from mature phage particles includes two kinds of this gene region differing in their
orientation: the non-inverted segment (+ orientation) and the inverted segment (- orientation)
(Rössler et al., 2004).
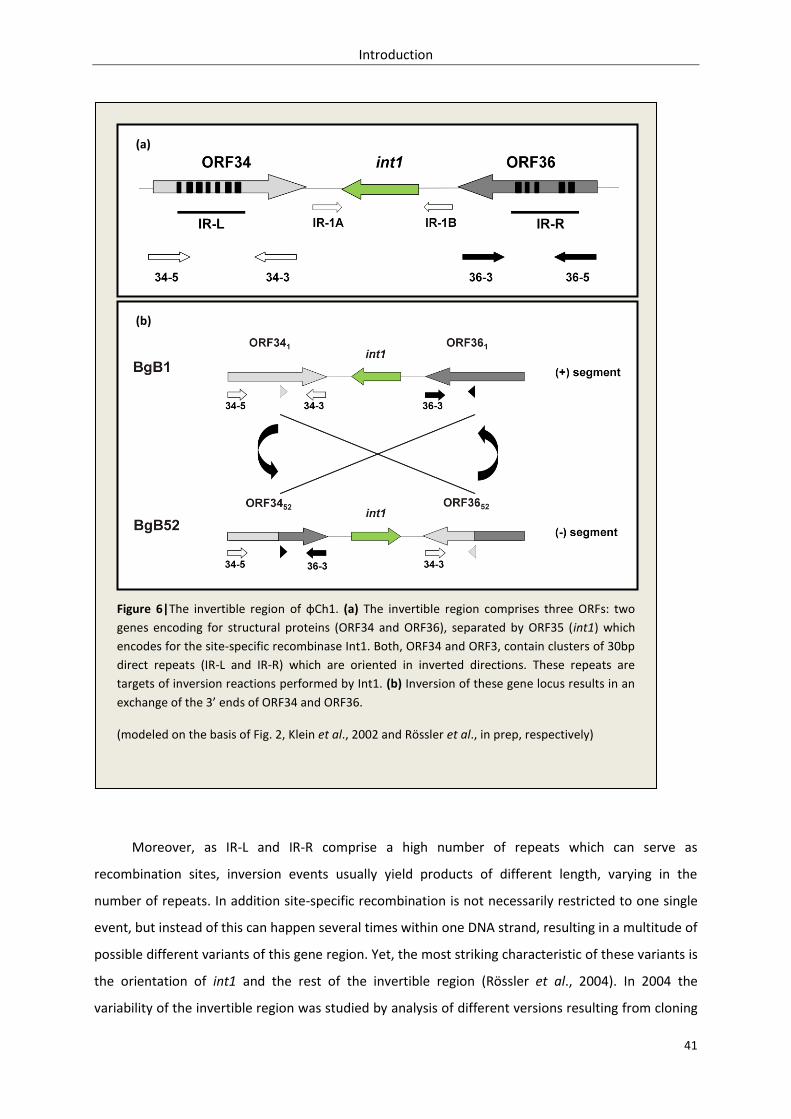
Introduction
41
Moreover, as IR-L and IR-R comprise a high number of repeats which can serve as
recombination sites, inversion events usually yield products of different length, varying in the
number of repeats. In addition site-specific recombination is not necessarily restricted to one single
event, but instead of this can happen several times within one DNA strand, resulting in a multitude of
possible different variants of this gene region. Yet, the most striking characteristic of these variants is
the orientation of int1 and the rest of the invertible region (Rössler et al., 2004). In 2004 the
variability of the invertible region was studied by analysis of different versions resulting from cloning
(a)
(b)
Figure 6|The invertible region of φCh1. (a) The invertible region comprises three ORFs: two
genes encoding for structural proteins (ORF34 and ORF36), separated by ORF35 (int1) which
encodes for the site-specific recombinase Int1. Both, ORF34 and ORF3, contain clusters of 30bp
direct repeats (IR-L and IR-R) which are oriented in inverted directions. These repeats are
targets of inversion reactions performed by Int1. (b) Inversion of these gene locus results in an
exchange of the 3’ ends of ORF34 and ORF36.
(modeled on the basis of Fig. 2, Klein et al., 2002 and Rössler et al., in prep, respectively)
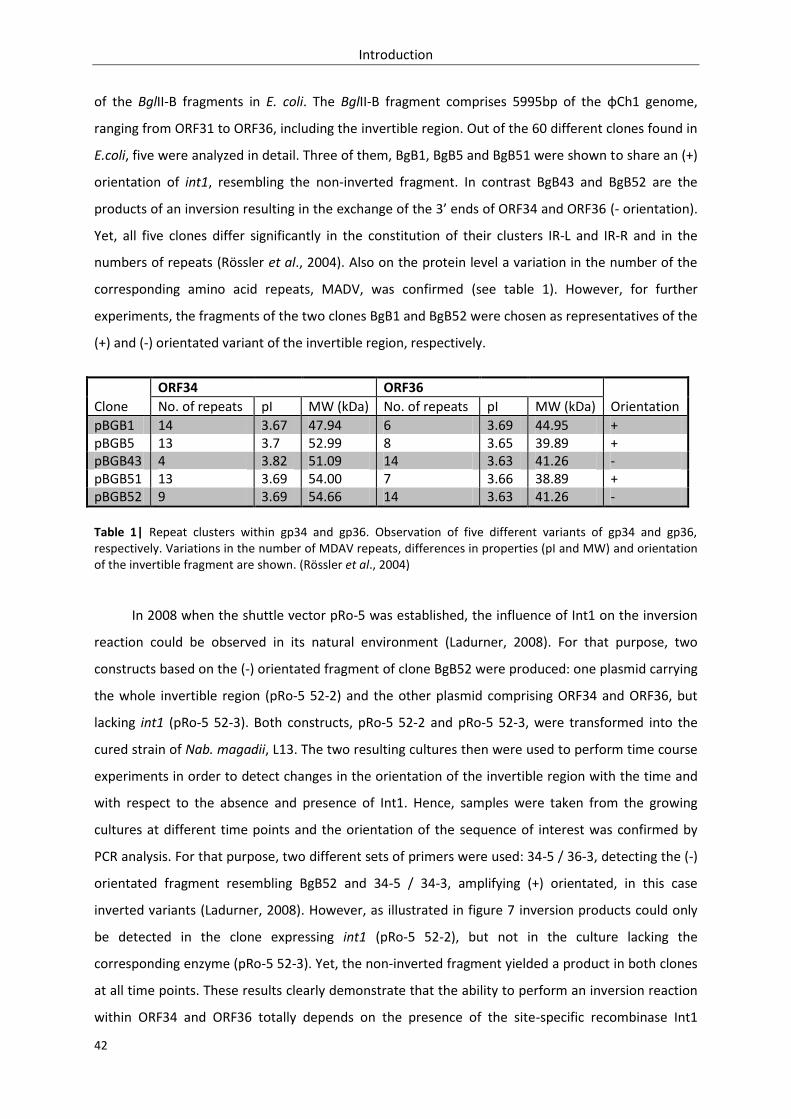
Introduction
42
of the BglII-B fragments in E. coli. The BglII-B fragment comprises 5995bp of the φCh1 genome,
ranging from ORF31 to ORF36, including the invertible region. Out of the 60 different clones found in
E.coli, five were analyzed in detail. Three of them, BgB1, BgB5 and BgB51 were shown to share an (+)
orientation of int1, resembling the non-inverted fragment. In contrast BgB43 and BgB52 are the
products of an inversion resulting in the exchange of the 3’ ends of ORF34 and ORF36 (- orientation).
Yet, all five clones differ significantly in the constitution of their clusters IR-L and IR-R and in the
numbers of repeats (Rössler et al., 2004). Also on the protein level a variation in the number of the
corresponding amino acid repeats, MADV, was confirmed (see table 1). However, for further
experiments, the fragments of the two clones BgB1 and BgB52 were chosen as representatives of the
(+) and (-) orientated variant of the invertible region, respectively.
ORF34 ORF36
Clone No. of repeats pI MW (kDa) No. of repeats pI MW (kDa) Orientation
pBGB1 14 3.67 47.94 6 3.69 44.95 + pBGB5 13 3.7 52.99 8 3.65 39.89 + pBGB43 4 3.82 51.09 14 3.63 41.26 - pBGB51 13 3.69 54.00 7 3.66 38.89 + pBGB52 9 3.69 54.66 14 3.63 41.26 -
Table 1| Repeat clusters within gp34 and gp36. Observation of five different variants of gp34 and gp36, respectively. Variations in the number of MDAV repeats, differences in properties (pI and MW) and orientation of the invertible fragment are shown. (Rössler et al., 2004)
In 2008 when the shuttle vector pRo-5 was established, the influence of Int1 on the inversion
reaction could be observed in its natural environment (Ladurner, 2008). For that purpose, two
constructs based on the (-) orientated fragment of clone BgB52 were produced: one plasmid carrying
the whole invertible region (pRo-5 52-2) and the other plasmid comprising ORF34 and ORF36, but
lacking int1 (pRo-5 52-3). Both constructs, pRo-5 52-2 and pRo-5 52-3, were transformed into the
cured strain of Nab. magadii, L13. The two resulting cultures then were used to perform time course
experiments in order to detect changes in the orientation of the invertible region with the time and
with respect to the absence and presence of Int1. Hence, samples were taken from the growing
cultures at different time points and the orientation of the sequence of interest was confirmed by
PCR analysis. For that purpose, two different sets of primers were used: 34-5 / 36-3, detecting the (-)
orientated fragment resembling BgB52 and 34-5 / 34-3, amplifying (+) orientated, in this case
inverted variants (Ladurner, 2008). However, as illustrated in figure 7 inversion products could only
be detected in the clone expressing int1 (pRo-5 52-2), but not in the culture lacking the
corresponding enzyme (pRo-5 52-3). Yet, the non-inverted fragment yielded a product in both clones
at all time points. These results clearly demonstrate that the ability to perform an inversion reaction
within ORF34 and ORF36 totally depends on the presence of the site-specific recombinase Int1
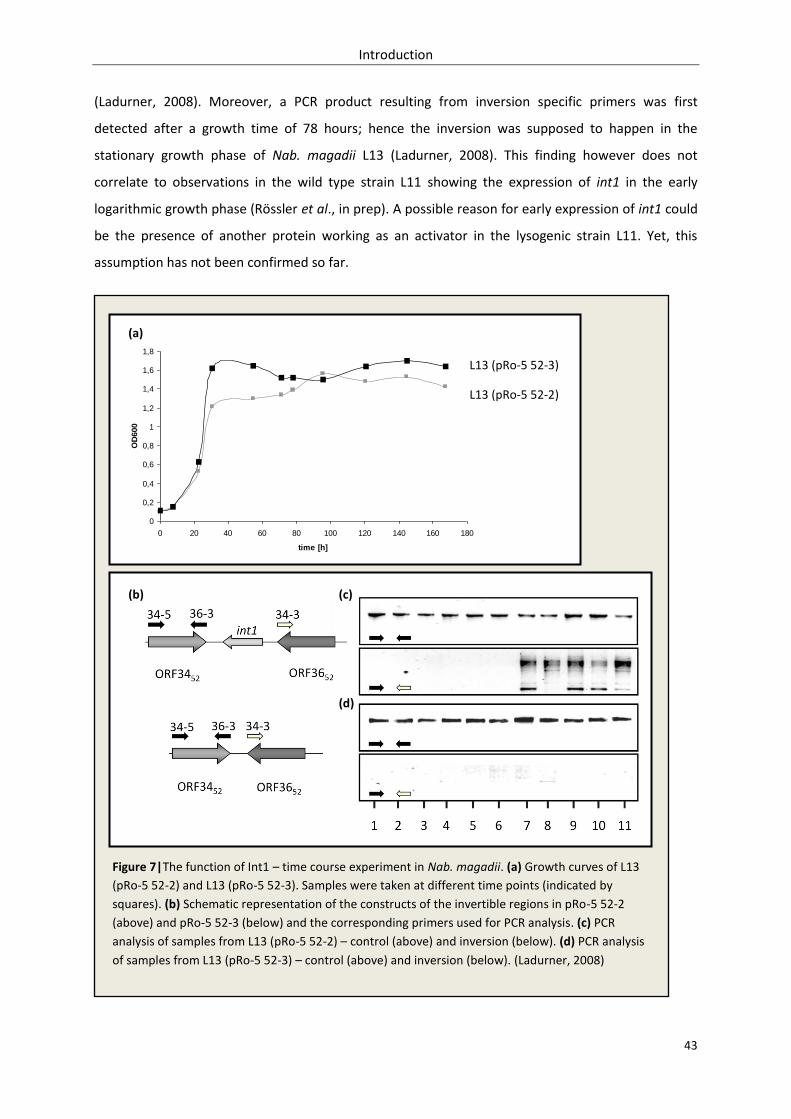
Introduction
43
(Ladurner, 2008). Moreover, a PCR product resulting from inversion specific primers was first
detected after a growth time of 78 hours; hence the inversion was supposed to happen in the
stationary growth phase of Nab. magadii L13 (Ladurner, 2008). This finding however does not
correlate to observations in the wild type strain L11 showing the expression of int1 in the early
logarithmic growth phase (Rössler et al., in prep). A possible reason for early expression of int1 could
be the presence of another protein working as an activator in the lysogenic strain L11. Yet, this
assumption has not been confirmed so far.
0
0,2
0,4
0,6
0,8
1
1,2
1,4
1,6
1,8
0 20 40 60 80 100 120 140 160 180
time [h]
OD
600
Figure 7|The function of Int1 – time course experiment in Nab. magadii. (a) Growth curves of L13
(pRo-5 52-2) and L13 (pRo-5 52-3). Samples were taken at different time points (indicated by
squares). (b) Schematic representation of the constructs of the invertible regions in pRo-5 52-2
(above) and pRo-5 52-3 (below) and the corresponding primers used for PCR analysis. (c) PCR
analysis of samples from L13 (pRo-5 52-2) – control (above) and inversion (below). (d) PCR analysis
of samples from L13 (pRo-5 52-3) – control (above) and inversion (below). (Ladurner, 2008)
(a)
(b)
L13 (pRo-5 52-3)
L13 (pRo-5 52-2)
(d)
(c)
Introduction
44
1.2.3.5. Gp3452 – the putative tail fibre protein
The expression of ORF34 starts 98h after inoculation, at the beginning of the stationary growth
phase, so after inversion within its gene region (Rössler et al., 2004). The resulting product can be
detected by western blot analysis using an antiserum directed against structural components of the
mature φCh1 particles (α-φCh1) and an antibody specifically raised against gp36 (α-gp36),
respectively. The latter was shown to give signals at 66 kDa with the gene product of both, ORF34
and ORF36 due to the high number of repetitive elements found in both proteins, resulting in
sequence similarities of 33 % (Rössler et al., 2004). Hence based on this method it can neither be
distinguished between gp34 and gp36, nor between non-inverted and inverted gene products.
However, the variability of gp34 and gp36 on the protein level has already been demonstrated
by investigation of some gene products resulting from cloning of the BglII-B fragment in E. coli (see
table 1) (Rössler et al., 2004). As inversion of the invertible region leads to an exchange of the 3’ ends
of ORF34 and ORF36, it also gives rise to the production of two different variants of gp34: the
unmodified gp341 and one version carrying the C-terminus of gp36, namely gp3452. Both, gp341 and
gp3452 represent different versions of the putative tail-fibre protein of φCh1 (Rössler et al., in prep).
In bacteriophages structural components such as tail fibres are widely used targets for interaction
with the host cell receptors in order to initiate the process of infection (Rössler et al., 2004). Hence,
alterations of these proteins can result in an increase of the host range, as varying tail fibre proteins
enable attachment to different hosts. Such effects are well described in phages P1 and Mu
(Sandmeier, 1994). In both cases the production of tail-fibre proteins with alternative C-terminal
ends is caused by inversion events within the corresponding gene regions (Glasgow et al., 1989).
The components of the invertible region as well as the encoded proteins are supposed to be
quite similar to those found in φCh1 (Rössler et al., 2004). Yet, in φCh1 the function of expression of
alternative tail fibre proteins is not clear, since Nab. magadii represents the only known host infected
by this virus (Witte et al., 1997). However, recently the ability of both gp341 and gp3452 to bind to the
surface of Natrialba magadii was observed (Rössler et al., in prep). For that purpose, in a first
experiment both proteins were produced in Haloferax volcanii. After incubation of the resulting cell
extract with Nab. magadii, the components bound to the cell surface and the unattached proteins
were separated by centrifugation. Finally the presence of gp341 and gp3452 in the supernatants and
cell fractions was detected by western blot analysis using the antibody α-gp36 (Rössler et al., in
prep). The results clearly indicate that only gp3452, but not gp341 is attached to the cell surface of
Nab. magadii. Binding assays of the same proteins produced in and purified from E. coli cells further
supported this finding. Moreover further experiments indicated that the C-terminal part of the
Introduction
45
protein is involved in interaction with the host cell, while the N-terminal part is supposed to be
associated with the viral capsid and the shaft of the tail, an arrangement which is common in other
head-tail phages, e.g. T4 (Markhof et al., 1993; Rössler et al., in prep). This view also correlates with
the fact that the C-terminus of gp34 comprises a galactose-binding site, which is suspected to
interact with glycosylated structures on the archaeal host cell, e.g. flagella or S-layer proteins (Rössler
et al., in prep).
Finally it can be concluded, that gp3452, the gene product of ORF34 carrying the C-terminus of
gp36 is supposed to be the tail fibre protein of φCh1, probably involved in binding to the cells of its
host Natrialba magadii via interaction of its C-terminal part. Thus, a crucial role of this viral protein in
infection of the archaeal cell is very likely, but yet has to be confirmed. For that purpose a φCh1
mutant lacking this protein was constructed in the course of this diploma work.
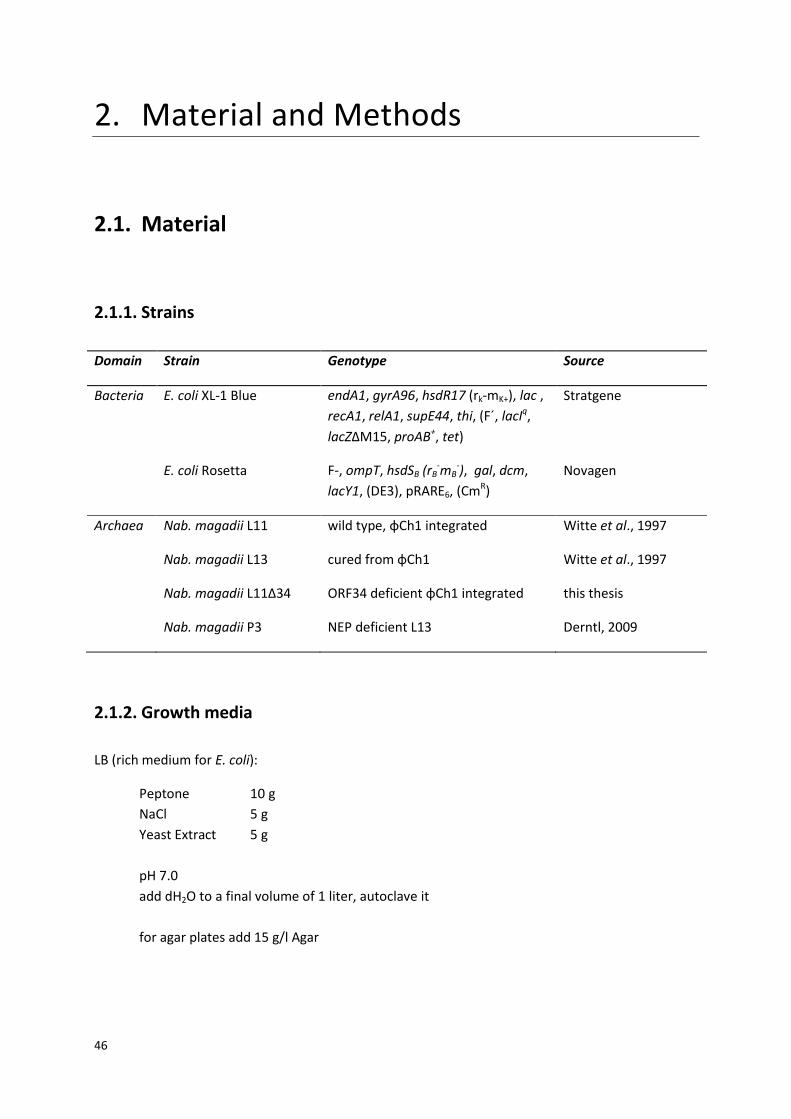
46
2. Material and Methods
2.1. Material
2.1.1. Strains
Domain Strain Genotype Source
Bacteria E. coli XL-1 Blue endA1, gyrA96, hsdR17 (rk-mK+), lac ,
recA1, relA1, supE44, thi, (F´, lacIq,
lacZ∆M15, proAB+, tet)
Stratgene
E. coli Rosetta F-, ompT, hsdSB (rB-mB
-), gal, dcm,
lacY1, (DE3), pRARE6, (CmR)
Novagen
Archaea Nab. magadii L11 wild type, φCh1 integrated Witte et al., 1997
Nab. magadii L13 cured from φCh1 Witte et al., 1997
Nab. magadii L11Δ34 ORF34 deficient φCh1 integrated this thesis
Nab. magadii P3 NEP deficient L13 Derntl, 2009
2.1.2. Growth media
LB (rich medium for E. coli):
Peptone
NaCl
Yeast Extract
10 g
5 g
5 g
pH 7.0
add dH2O to a final volume of 1 liter, autoclave it
for agar plates add 15 g/l Agar
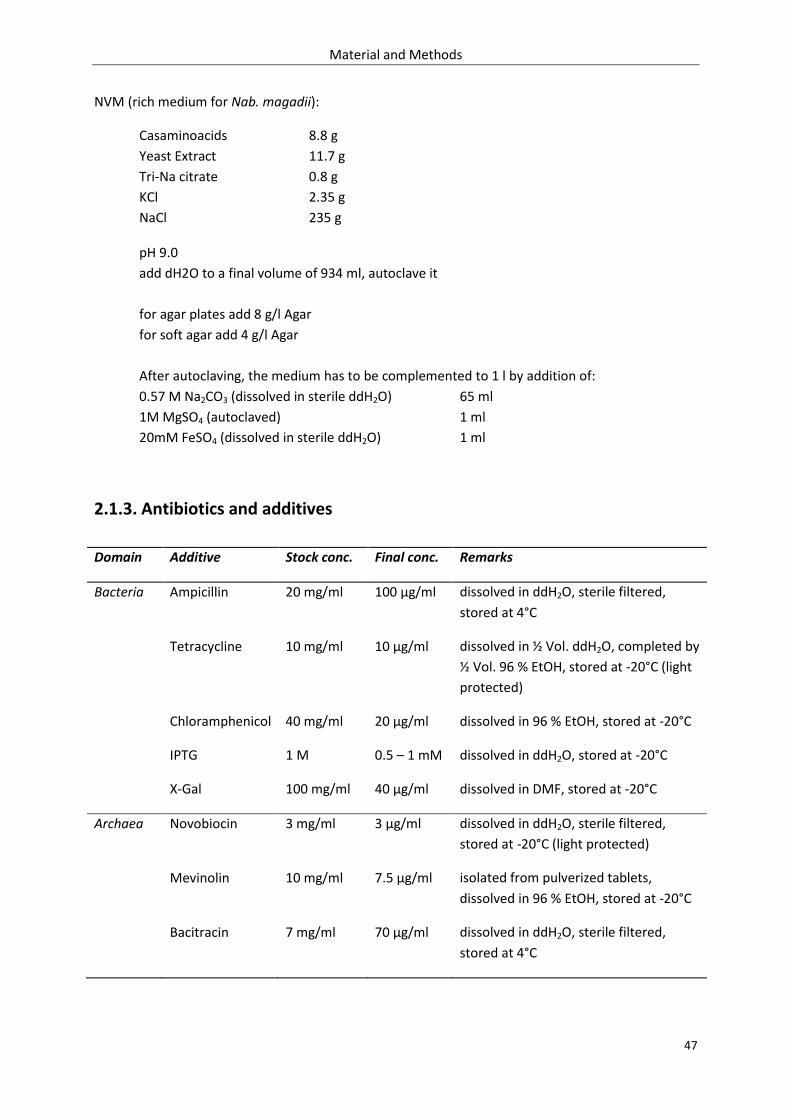
Material and Methods
47
NVM (rich medium for Nab. magadii):
Casaminoacids
Yeast Extract
Tri-Na citrate
KCl
NaCl
8.8 g
11.7 g
0.8 g
2.35 g
235 g
pH 9.0
add dH2O to a final volume of 934 ml, autoclave it
for agar plates add 8 g/l Agar
for soft agar add 4 g/l Agar
After autoclaving, the medium has to be complemented to 1 l by addition of:
0.57 M Na2CO3 (dissolved in sterile ddH2O)
1M MgSO4 (autoclaved)
20mM FeSO4 (dissolved in sterile ddH2O)
65 ml
1 ml
1 ml
2.1.3. Antibiotics and additives
Domain Additive Stock conc. Final conc. Remarks
Bacteria Ampicillin 20 mg/ml 100 µg/ml dissolved in ddH2O, sterile filtered,
stored at 4°C
Tetracycline 10 mg/ml 10 µg/ml dissolved in ½ Vol. ddH2O, completed by
½ Vol. 96 % EtOH, stored at -20°C (light
protected)
Chloramphenicol 40 mg/ml 20 µg/ml dissolved in 96 % EtOH, stored at -20°C
IPTG 1 M 0.5 – 1 mM dissolved in ddH2O, stored at -20°C
X-Gal 100 mg/ml 40 µg/ml dissolved in DMF, stored at -20°C
Archaea Novobiocin 3 mg/ml 3 µg/ml dissolved in ddH2O, sterile filtered,
stored at -20°C (light protected)
Mevinolin 10 mg/ml 7.5 µg/ml isolated from pulverized tablets,
dissolved in 96 % EtOH, stored at -20°C
Bacitracin 7 mg/ml 70 µg/ml dissolved in ddH2O, sterile filtered,
stored at 4°C
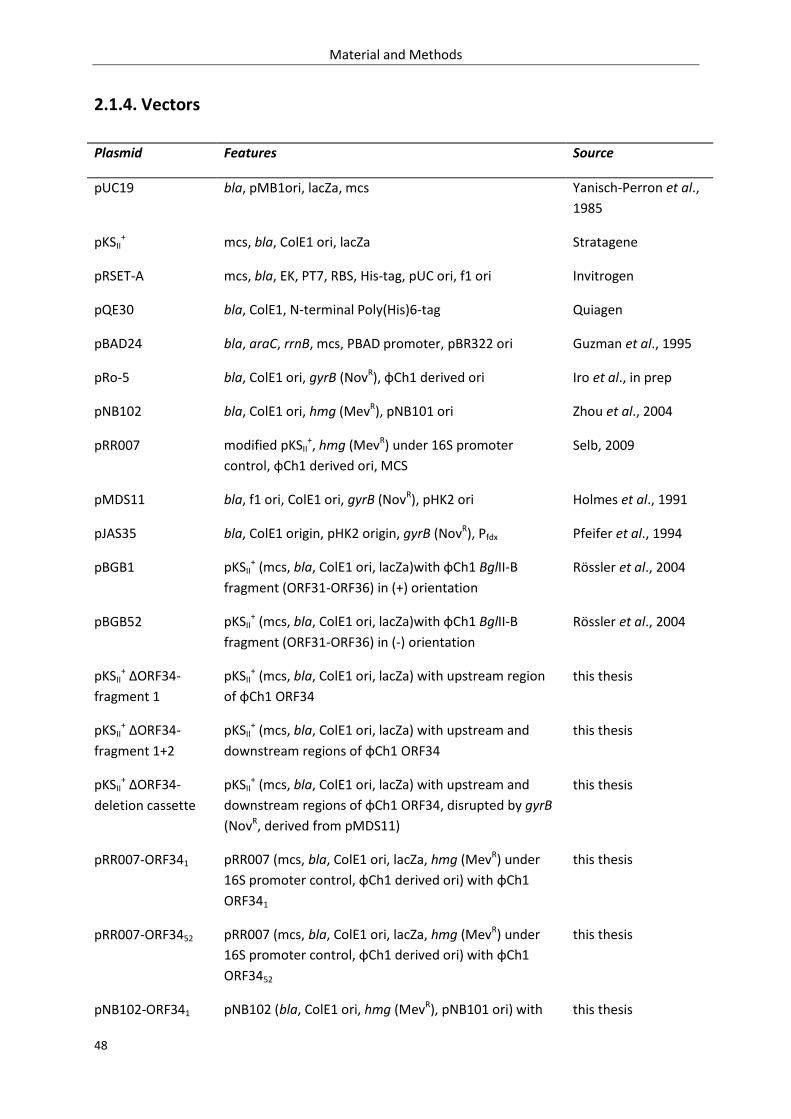
Material and Methods
48
2.1.4. Vectors
Plasmid Features Source
pUC19 bla, pMB1ori, lacZa, mcs Yanisch-Perron et al.,
1985
pKSII+ mcs, bla, ColE1 ori, lacZa Stratagene
pRSET-A mcs, bla, EK, PT7, RBS, His-tag, pUC ori, f1 ori Invitrogen
pQE30 bla, ColE1, N-terminal Poly(His)6-tag Quiagen
pBAD24 bla, araC, rrnB, mcs, PBAD promoter, pBR322 ori Guzman et al., 1995
pRo-5 bla, ColE1 ori, gyrB (NovR), φCh1 derived ori Iro et al., in prep
pNB102 bla, ColE1 ori, hmg (MevR), pNB101 ori Zhou et al., 2004
pRR007 modified pKSII+, hmg (MevR) under 16S promoter
control, φCh1 derived ori, MCS
Selb, 2009
pMDS11 bla, f1 ori, ColE1 ori, gyrB (NovR), pHK2 ori Holmes et al., 1991
pJAS35 bla, ColE1 origin, pHK2 origin, gyrB (NovR), Pfdx Pfeifer et al., 1994
pBGB1 pKSII+ (mcs, bla, ColE1 ori, lacZa)with φCh1 BglII-B
fragment (ORF31-ORF36) in (+) orientation
Rössler et al., 2004
pBGB52 pKSII+ (mcs, bla, ColE1 ori, lacZa)with φCh1 BglII-B
fragment (ORF31-ORF36) in (-) orientation
Rössler et al., 2004
pKSII+ ΔORF34-
fragment 1
pKSII+ (mcs, bla, ColE1 ori, lacZa) with upstream region
of φCh1 ORF34
this thesis
pKSII+ ΔORF34-
fragment 1+2
pKSII+ (mcs, bla, ColE1 ori, lacZa) with upstream and
downstream regions of φCh1 ORF34
this thesis
pKSII+ ΔORF34-
deletion cassette
pKSII+ (mcs, bla, ColE1 ori, lacZa) with upstream and
downstream regions of φCh1 ORF34, disrupted by gyrB
(NovR, derived from pMDS11)
this thesis
pRR007-ORF341 pRR007 (mcs, bla, ColE1 ori, lacZa, hmg (MevR) under
16S promoter control, φCh1 derived ori) with φCh1
ORF341
this thesis
pRR007-ORF3452 pRR007 (mcs, bla, ColE1 ori, lacZa, hmg (MevR) under
16S promoter control, φCh1 derived ori) with φCh1
ORF3452
this thesis
pNB102-ORF341 pNB102 (bla, ColE1 ori, hmg (MevR), pNB101 ori) with this thesis
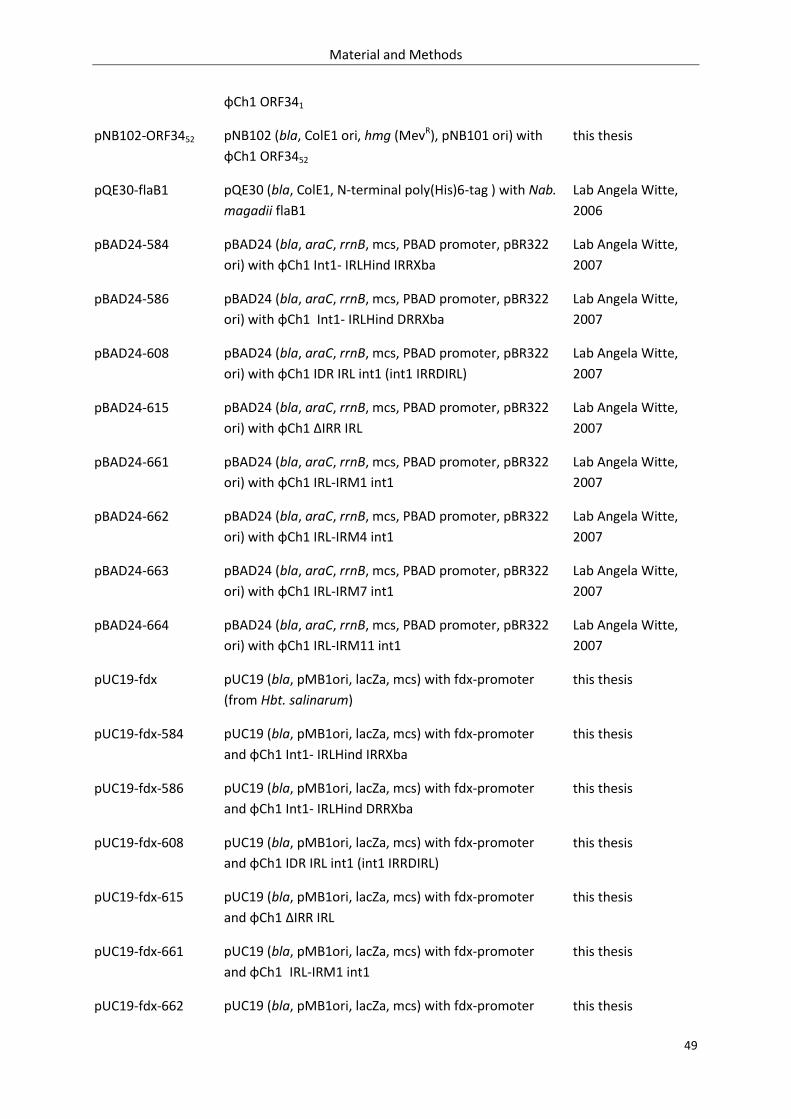
Material and Methods
49
φCh1 ORF341
pNB102-ORF3452 pNB102 (bla, ColE1 ori, hmg (MevR), pNB101 ori) with
φCh1 ORF3452
this thesis
pQE30-flaB1 pQE30 (bla, ColE1, N-terminal poly(His)6-tag ) with Nab.
magadii flaB1
Lab Angela Witte,
2006
pBAD24-584 pBAD24 (bla, araC, rrnB, mcs, PBAD promoter, pBR322
ori) with φCh1 Int1- IRLHind IRRXba
Lab Angela Witte,
2007
pBAD24-586 pBAD24 (bla, araC, rrnB, mcs, PBAD promoter, pBR322
ori) with φCh1 Int1- IRLHind DRRXba
Lab Angela Witte,
2007
pBAD24-608 pBAD24 (bla, araC, rrnB, mcs, PBAD promoter, pBR322
ori) with φCh1 IDR IRL int1 (int1 IRRDIRL)
Lab Angela Witte,
2007
pBAD24-615 pBAD24 (bla, araC, rrnB, mcs, PBAD promoter, pBR322
ori) with φCh1 ΔIRR IRL
Lab Angela Witte,
2007
pBAD24-661 pBAD24 (bla, araC, rrnB, mcs, PBAD promoter, pBR322
ori) with φCh1 IRL-IRM1 int1
Lab Angela Witte,
2007
pBAD24-662 pBAD24 (bla, araC, rrnB, mcs, PBAD promoter, pBR322
ori) with φCh1 IRL-IRM4 int1
Lab Angela Witte,
2007
pBAD24-663 pBAD24 (bla, araC, rrnB, mcs, PBAD promoter, pBR322
ori) with φCh1 IRL-IRM7 int1
Lab Angela Witte,
2007
pBAD24-664 pBAD24 (bla, araC, rrnB, mcs, PBAD promoter, pBR322
ori) with φCh1 IRL-IRM11 int1
Lab Angela Witte,
2007
pUC19-fdx pUC19 (bla, pMB1ori, lacZa, mcs) with fdx-promoter
(from Hbt. salinarum)
this thesis
pUC19-fdx-584 pUC19 (bla, pMB1ori, lacZa, mcs) with fdx-promoter
and φCh1 Int1- IRLHind IRRXba
this thesis
pUC19-fdx-586 pUC19 (bla, pMB1ori, lacZa, mcs) with fdx-promoter
and φCh1 Int1- IRLHind DRRXba
this thesis
pUC19-fdx-608 pUC19 (bla, pMB1ori, lacZa, mcs) with fdx-promoter
and φCh1 IDR IRL int1 (int1 IRRDIRL)
this thesis
pUC19-fdx-615 pUC19 (bla, pMB1ori, lacZa, mcs) with fdx-promoter
and φCh1 ΔIRR IRL
this thesis
pUC19-fdx-661 pUC19 (bla, pMB1ori, lacZa, mcs) with fdx-promoter
and φCh1 IRL-IRM1 int1
this thesis
pUC19-fdx-662 pUC19 (bla, pMB1ori, lacZa, mcs) with fdx-promoter this thesis
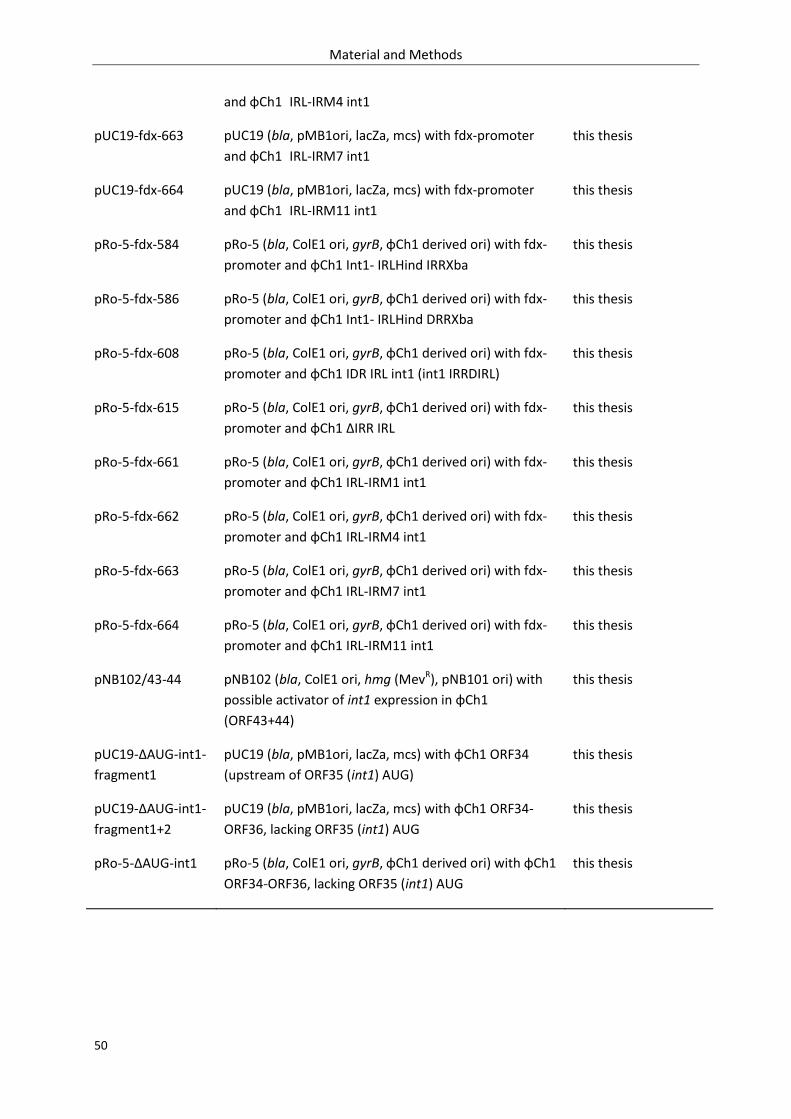
Material and Methods
50
and φCh1 IRL-IRM4 int1
pUC19-fdx-663 pUC19 (bla, pMB1ori, lacZa, mcs) with fdx-promoter
and φCh1 IRL-IRM7 int1
this thesis
pUC19-fdx-664 pUC19 (bla, pMB1ori, lacZa, mcs) with fdx-promoter
and φCh1 IRL-IRM11 int1
this thesis
pRo-5-fdx-584 pRo-5 (bla, ColE1 ori, gyrB, φCh1 derived ori) with fdx-
promoter and φCh1 Int1- IRLHind IRRXba
this thesis
pRo-5-fdx-586 pRo-5 (bla, ColE1 ori, gyrB, φCh1 derived ori) with fdx-
promoter and φCh1 Int1- IRLHind DRRXba
this thesis
pRo-5-fdx-608 pRo-5 (bla, ColE1 ori, gyrB, φCh1 derived ori) with fdx-
promoter and φCh1 IDR IRL int1 (int1 IRRDIRL)
this thesis
pRo-5-fdx-615 pRo-5 (bla, ColE1 ori, gyrB, φCh1 derived ori) with fdx-
promoter and φCh1 ΔIRR IRL
this thesis
pRo-5-fdx-661 pRo-5 (bla, ColE1 ori, gyrB, φCh1 derived ori) with fdx-
promoter and φCh1 IRL-IRM1 int1
this thesis
pRo-5-fdx-662 pRo-5 (bla, ColE1 ori, gyrB, φCh1 derived ori) with fdx-
promoter and φCh1 IRL-IRM4 int1
this thesis
pRo-5-fdx-663 pRo-5 (bla, ColE1 ori, gyrB, φCh1 derived ori) with fdx-
promoter and φCh1 IRL-IRM7 int1
this thesis
pRo-5-fdx-664 pRo-5 (bla, ColE1 ori, gyrB, φCh1 derived ori) with fdx-
promoter and φCh1 IRL-IRM11 int1
this thesis
pNB102/43-44 pNB102 (bla, ColE1 ori, hmg (MevR), pNB101 ori) with
possible activator of int1 expression in φCh1
(ORF43+44)
this thesis
pUC19-ΔAUG-int1-
fragment1
pUC19 (bla, pMB1ori, lacZa, mcs) with φCh1 ORF34
(upstream of ORF35 (int1) AUG)
this thesis
pUC19-ΔAUG-int1-
fragment1+2
pUC19 (bla, pMB1ori, lacZa, mcs) with φCh1 ORF34-
ORF36, lacking ORF35 (int1) AUG
this thesis
pRo-5-ΔAUG-int1 pRo-5 (bla, ColE1 ori, gyrB, φCh1 derived ori) with φCh1
ORF34-ORF36, lacking ORF35 (int1) AUG
this thesis
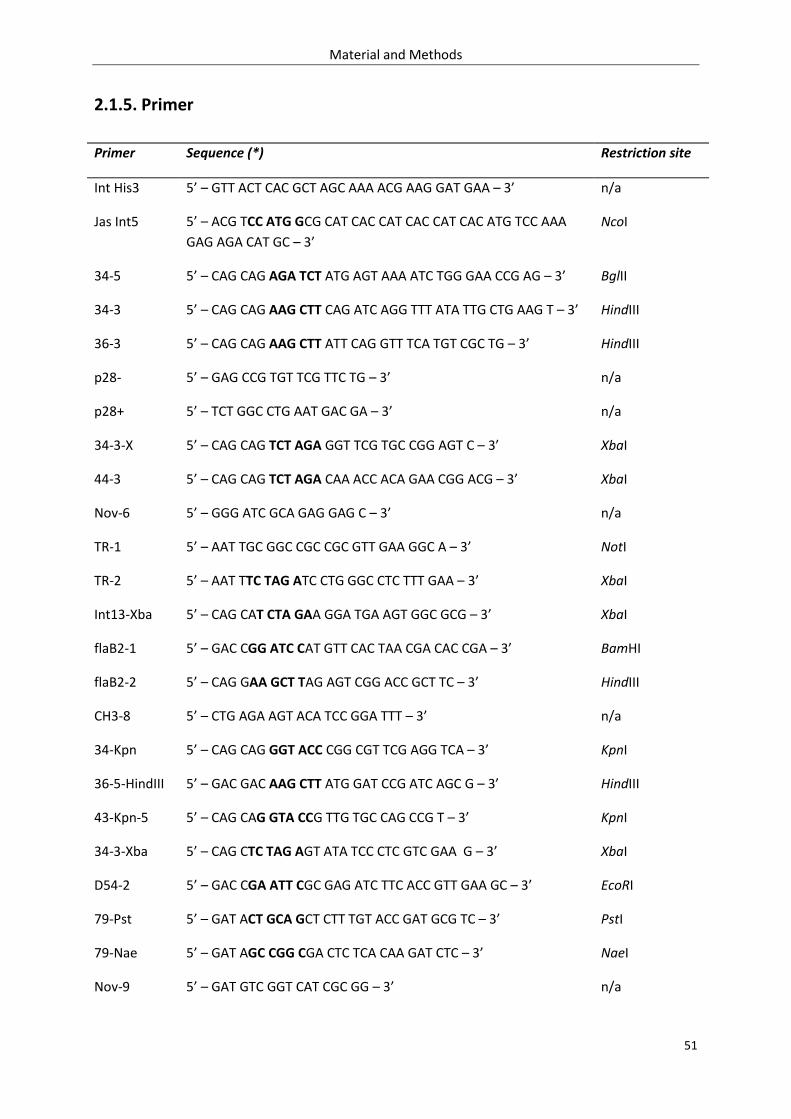
Material and Methods
51
2.1.5. Primer
Primer Sequence (*) Restriction site
Int His3 5’ – GTT ACT CAC GCT AGC AAA ACG AAG GAT GAA – 3’ n/a
Jas Int5 5’ – ACG TCC ATG GCG CAT CAC CAT CAC CAT CAC ATG TCC AAA
GAG AGA CAT GC – 3’
NcoI
34-5 5’ – CAG CAG AGA TCT ATG AGT AAA ATC TGG GAA CCG AG – 3’ BglII
34-3 5’ – CAG CAG AAG CTT CAG ATC AGG TTT ATA TTG CTG AAG T – 3’ HindIII
36-3 5’ – CAG CAG AAG CTT ATT CAG GTT TCA TGT CGC TG – 3’ HindIII
p28- 5’ – GAG CCG TGT TCG TTC TG – 3’ n/a
p28+ 5’ – TCT GGC CTG AAT GAC GA – 3’ n/a
34-3-X 5’ – CAG CAG TCT AGA GGT TCG TGC CGG AGT C – 3’ XbaI
44-3 5’ – CAG CAG TCT AGA CAA ACC ACA GAA CGG ACG – 3’ XbaI
Nov-6 5’ – GGG ATC GCA GAG GAG C – 3’ n/a
TR-1 5’ – AAT TGC GGC CGC CGC GTT GAA GGC A – 3’ NotI
TR-2 5’ – AAT TTC TAG ATC CTG GGC CTC TTT GAA – 3’ XbaI
Int13-Xba 5’ – CAG CAT CTA GAA GGA TGA AGT GGC GCG – 3’ XbaI
flaB2-1 5’ – GAC CGG ATC CAT GTT CAC TAA CGA CAC CGA – 3’ BamHI
flaB2-2 5’ – CAG GAA GCT TAG AGT CGG ACC GCT TC – 3’ HindIII
CH3-8 5’ – CTG AGA AGT ACA TCC GGA TTT – 3’ n/a
34-Kpn 5’ – CAG CAG GGT ACC CGG CGT TCG AGG TCA – 3’ KpnI
36-5-HindIII 5’ – GAC GAC AAG CTT ATG GAT CCG ATC AGC G – 3’ HindIII
43-Kpn-5 5’ – CAG CAG GTA CCG TTG TGC CAG CCG T – 3’ KpnI
34-3-Xba 5’ – CAG CTC TAG AGT ATA TCC CTC GTC GAA G – 3’ XbaI
D54-2 5’ – GAC CGA ATT CGC GAG ATC TTC ACC GTT GAA GC – 3’ EcoRI
79-Pst 5’ – GAT ACT GCA GCT CTT TGT ACC GAT GCG TC – 3’ PstI
79-Nae 5’ – GAT AGC CGG CGA CTC TCA CAA GAT CTC – 3’ NaeI
Nov-9 5’ – GAT GTC GGT CAT CGC GG – 3’ n/a
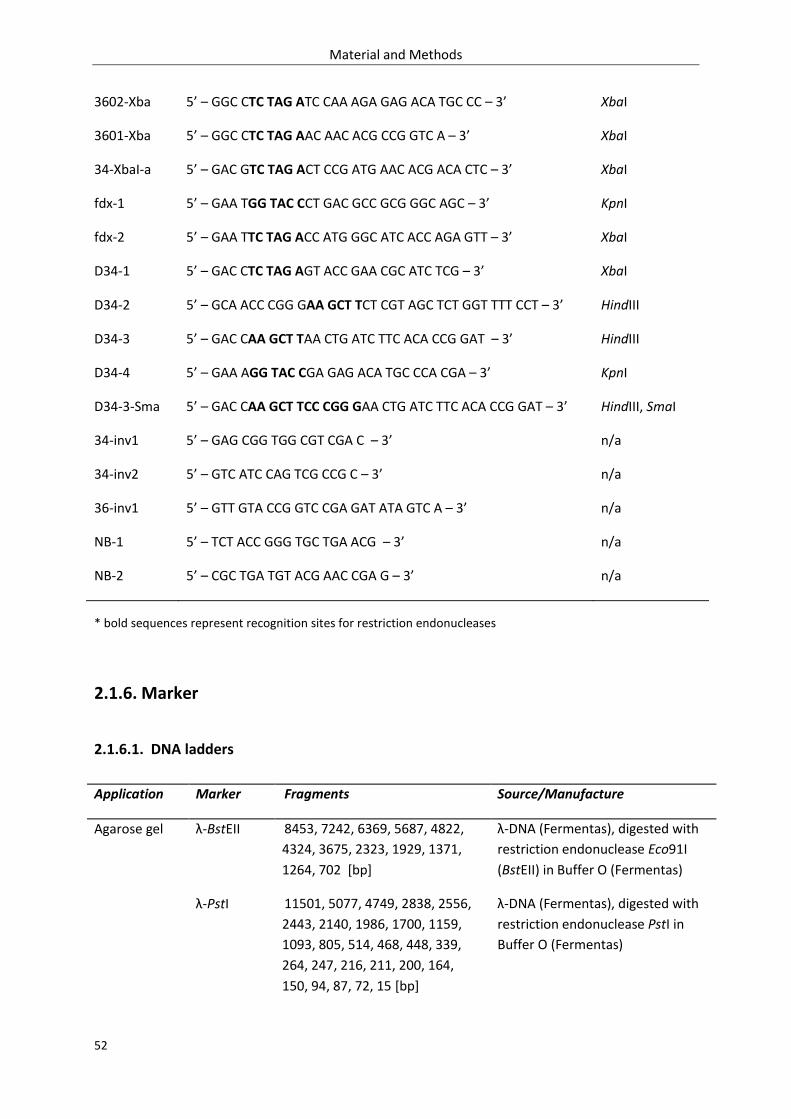
Material and Methods
52
3602-Xba 5’ – GGC CTC TAG ATC CAA AGA GAG ACA TGC CC – 3’ XbaI
3601-Xba 5’ – GGC CTC TAG AAC AAC ACG CCG GTC A – 3’ XbaI
34-XbaI-a 5’ – GAC GTC TAG ACT CCG ATG AAC ACG ACA CTC – 3’ XbaI
fdx-1 5’ – GAA TGG TAC CCT GAC GCC GCG GGC AGC – 3’ KpnI
fdx-2 5’ – GAA TTC TAG ACC ATG GGC ATC ACC AGA GTT – 3’ XbaI
D34-1 5’ – GAC CTC TAG AGT ACC GAA CGC ATC TCG – 3’ XbaI
D34-2 5’ – GCA ACC CGG GAA GCT TCT CGT AGC TCT GGT TTT CCT – 3’ HindIII
D34-3 5’ – GAC CAA GCT TAA CTG ATC TTC ACA CCG GAT – 3’ HindIII
D34-4 5’ – GAA AGG TAC CGA GAG ACA TGC CCA CGA – 3’ KpnI
D34-3-Sma 5’ – GAC CAA GCT TCC CGG GAA CTG ATC TTC ACA CCG GAT – 3’ HindIII, SmaI
34-inv1 5’ – GAG CGG TGG CGT CGA C – 3’ n/a
34-inv2 5’ – GTC ATC CAG TCG CCG C – 3’ n/a
36-inv1 5’ – GTT GTA CCG GTC CGA GAT ATA GTC A – 3’ n/a
NB-1 5’ – TCT ACC GGG TGC TGA ACG – 3’ n/a
NB-2 5’ – CGC TGA TGT ACG AAC CGA G – 3’ n/a
* bold sequences represent recognition sites for restriction endonucleases
2.1.6. Marker
2.1.6.1. DNA ladders
Application Marker Fragments Source/Manufacture
Agarose gel λ-BstEII 8453, 7242, 6369, 5687, 4822,
4324, 3675, 2323, 1929, 1371,
1264, 702 [bp]
λ-DNA (Fermentas), digested with
restriction endonuclease Eco91I
(BstEII) in Buffer O (Fermentas)
λ-PstI 11501, 5077, 4749, 2838, 2556,
2443, 2140, 1986, 1700, 1159,
1093, 805, 514, 468, 448, 339,
264, 247, 216, 211, 200, 164,
150, 94, 87, 72, 15 [bp]
λ-DNA (Fermentas), digested with
restriction endonuclease PstI in
Buffer O (Fermentas)
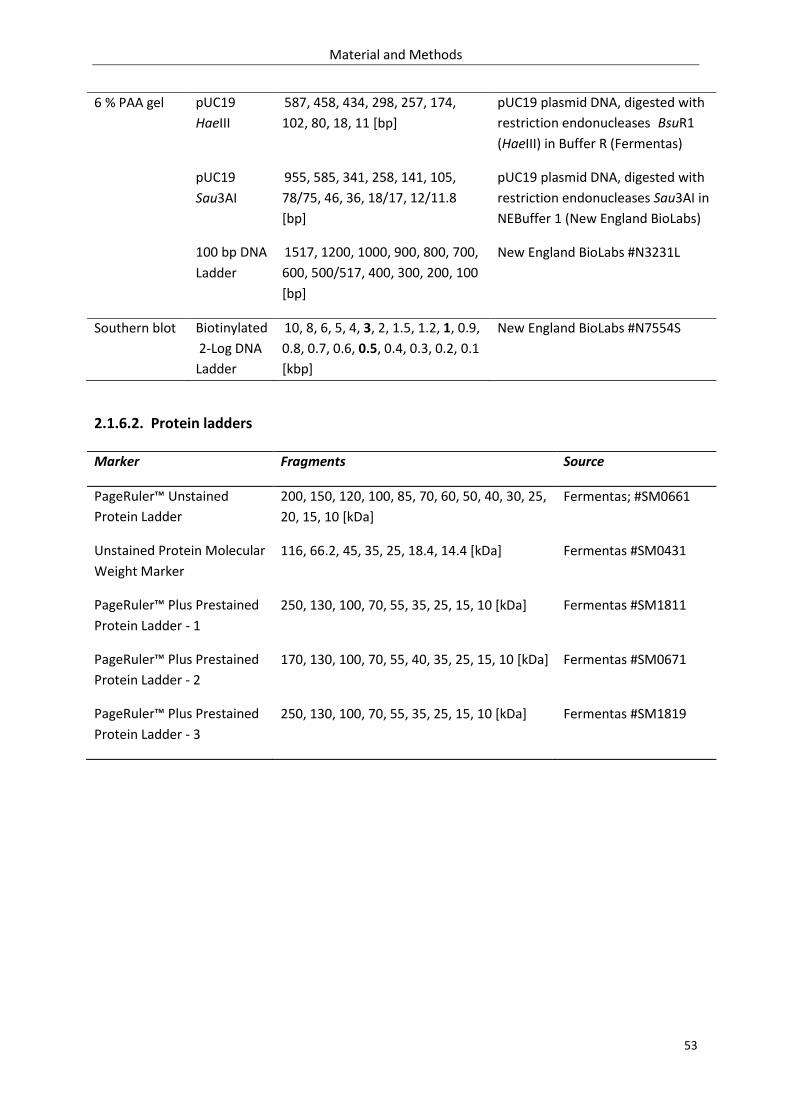
Material and Methods
53
2.1.6.2. Protein ladders
Marker Fragments Source
PageRuler™ Unstained
Protein Ladder
200, 150, 120, 100, 85, 70, 60, 50, 40, 30, 25,
20, 15, 10 [kDa]
Fermentas; #SM0661
Unstained Protein Molecular
Weight Marker
116, 66.2, 45, 35, 25, 18.4, 14.4 [kDa] Fermentas #SM0431
PageRuler™ Plus Prestained
Protein Ladder - 1
250, 130, 100, 70, 55, 35, 25, 15, 10 [kDa] Fermentas #SM1811
PageRuler™ Plus Prestained
Protein Ladder - 2
170, 130, 100, 70, 55, 40, 35, 25, 15, 10 [kDa] Fermentas #SM0671
PageRuler™ Plus Prestained
Protein Ladder - 3
250, 130, 100, 70, 55, 35, 25, 15, 10 [kDa] Fermentas #SM1819
6 % PAA gel pUC19
HaeIII
587, 458, 434, 298, 257, 174,
102, 80, 18, 11 [bp]
pUC19 plasmid DNA, digested with
restriction endonucleases BsuR1
(HaeIII) in Buffer R (Fermentas)
pUC19
Sau3AI
955, 585, 341, 258, 141, 105,
78/75, 46, 36, 18/17, 12/11.8
[bp]
pUC19 plasmid DNA, digested with
restriction endonucleases Sau3AI in
NEBuffer 1 (New England BioLabs)
100 bp DNA
Ladder
1517, 1200, 1000, 900, 800, 700,
600, 500/517, 400, 300, 200, 100
[bp]
New England BioLabs #N3231L
Southern blot Biotinylated
2-Log DNA
Ladder
10, 8, 6, 5, 4, 3, 2, 1.5, 1.2, 1, 0.9,
0.8, 0.7, 0.6, 0.5, 0.4, 0.3, 0.2, 0.1
[kbp]
New England BioLabs #N7554S
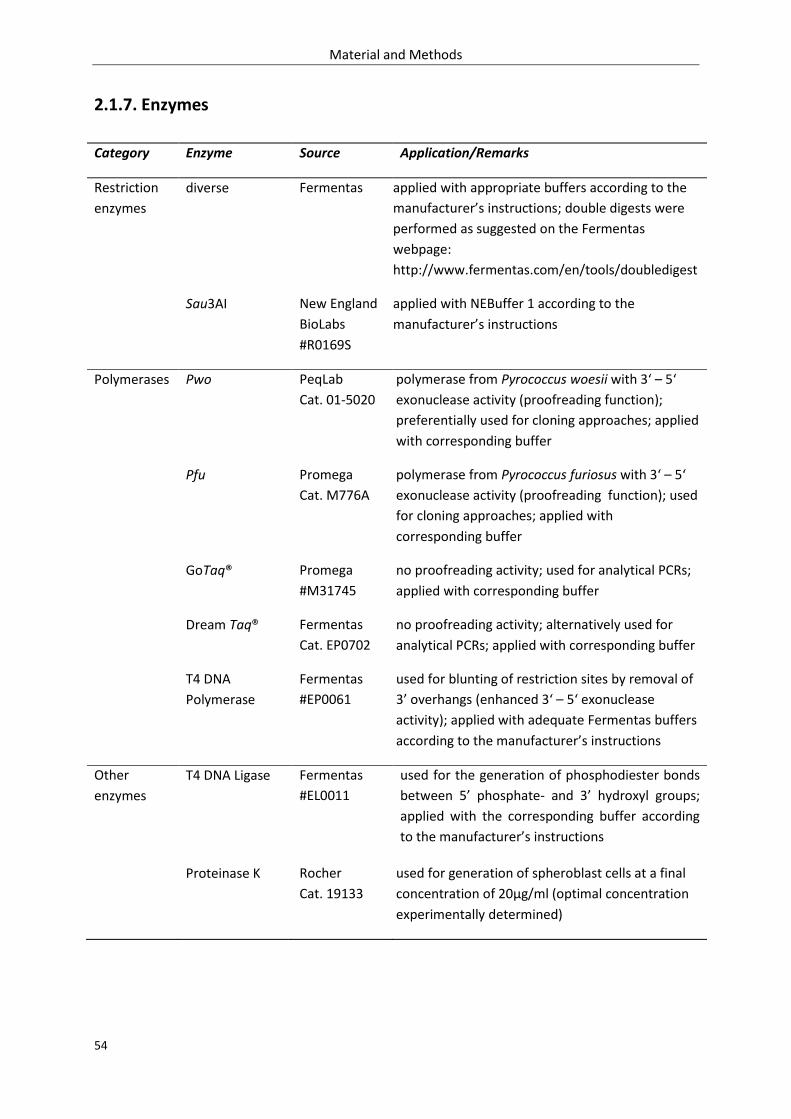
Material and Methods
54
2.1.7. Enzymes
Category Enzyme Source Application/Remarks
Restriction
enzymes
diverse Fermentas
applied with appropriate buffers according to the
manufacturer’s instructions; double digests were
performed as suggested on the Fermentas
webpage:
http://www.fermentas.com/en/tools/doubledigest
Sau3AI New England
BioLabs
#R0169S
applied with NEBuffer 1 according to the
manufacturer’s instructions
Polymerases Pwo PeqLab
Cat. 01-5020
polymerase from Pyrococcus woesii with 3‘ – 5‘
exonuclease activity (proofreading function);
preferentially used for cloning approaches; applied
with corresponding buffer
Pfu Promega
Cat. M776A
polymerase from Pyrococcus furiosus with 3‘ – 5‘
exonuclease activity (proofreading function); used
for cloning approaches; applied with
corresponding buffer
GoTaq® Promega
#M31745
no proofreading activity; used for analytical PCRs;
applied with corresponding buffer
Dream Taq® Fermentas
Cat. EP0702
no proofreading activity; alternatively used for
analytical PCRs; applied with corresponding buffer
T4 DNA
Polymerase
Fermentas
#EP0061
used for blunting of restriction sites by removal of
3’ overhangs (enhanced 3‘ – 5‘ exonuclease
activity); applied with adequate Fermentas buffers
according to the manufacturer’s instructions
Other
enzymes
T4 DNA Ligase Fermentas
#EL0011
used for the generation of phosphodiester bonds
between 5’ phosphate- and 3’ hydroxyl groups;
applied with the corresponding buffer according
to the manufacturer’s instructions
Proteinase K Rocher
Cat. 19133
used for generation of spheroblast cells at a final
concentration of 20µg/ml (optimal concentration
experimentally determined)
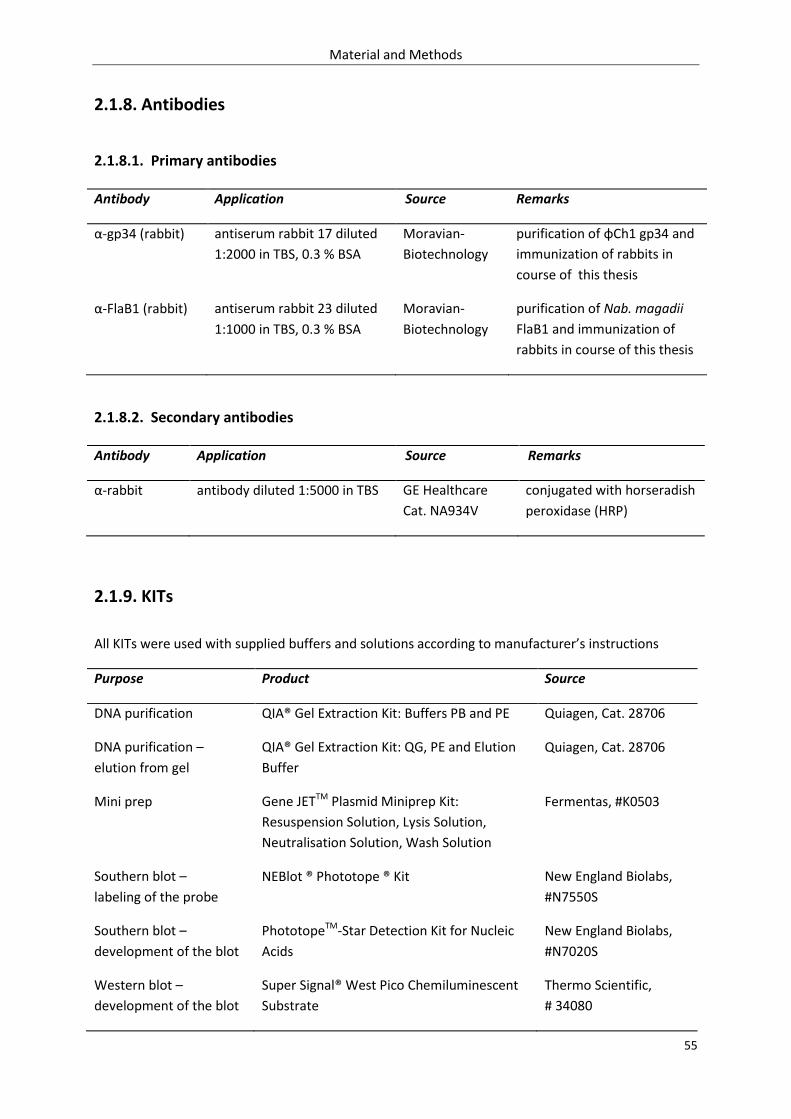
Material and Methods
55
2.1.8. Antibodies
2.1.8.1. Primary antibodies
Antibody Application Source Remarks
α-gp34 (rabbit) antiserum rabbit 17 diluted
1:2000 in TBS, 0.3 % BSA
Moravian-
Biotechnology
purification of φCh1 gp34 and
immunization of rabbits in
course of this thesis
α-FlaB1 (rabbit) antiserum rabbit 23 diluted
1:1000 in TBS, 0.3 % BSA
Moravian-
Biotechnology
purification of Nab. magadii
FlaB1 and immunization of
rabbits in course of this thesis
2.1.8.2. Secondary antibodies
Antibody Application Source Remarks
α-rabbit antibody diluted 1:5000 in TBS GE Healthcare
Cat. NA934V
conjugated with horseradish
peroxidase (HRP)
2.1.9. KITs
All KITs were used with supplied buffers and solutions according to manufacturer’s instructions
Purpose Product Source
DNA purification QIA® Gel Extraction Kit: Buffers PB and PE Quiagen, Cat. 28706
DNA purification –
elution from gel
QIA® Gel Extraction Kit: QG, PE and Elution
Buffer
Quiagen, Cat. 28706
Mini prep Gene JETTM Plasmid Miniprep Kit:
Resuspension Solution, Lysis Solution,
Neutralisation Solution, Wash Solution
Fermentas, #K0503
Southern blot –
labeling of the probe
NEBlot ® Phototope ® Kit New England Biolabs,
#N7550S
Southern blot –
development of the blot
PhototopeTM-Star Detection Kit for Nucleic
Acids
New England Biolabs,
#N7020S
Western blot –
development of the blot
Super Signal® West Pico Chemiluminescent
Substrate
Thermo Scientific,
# 34080
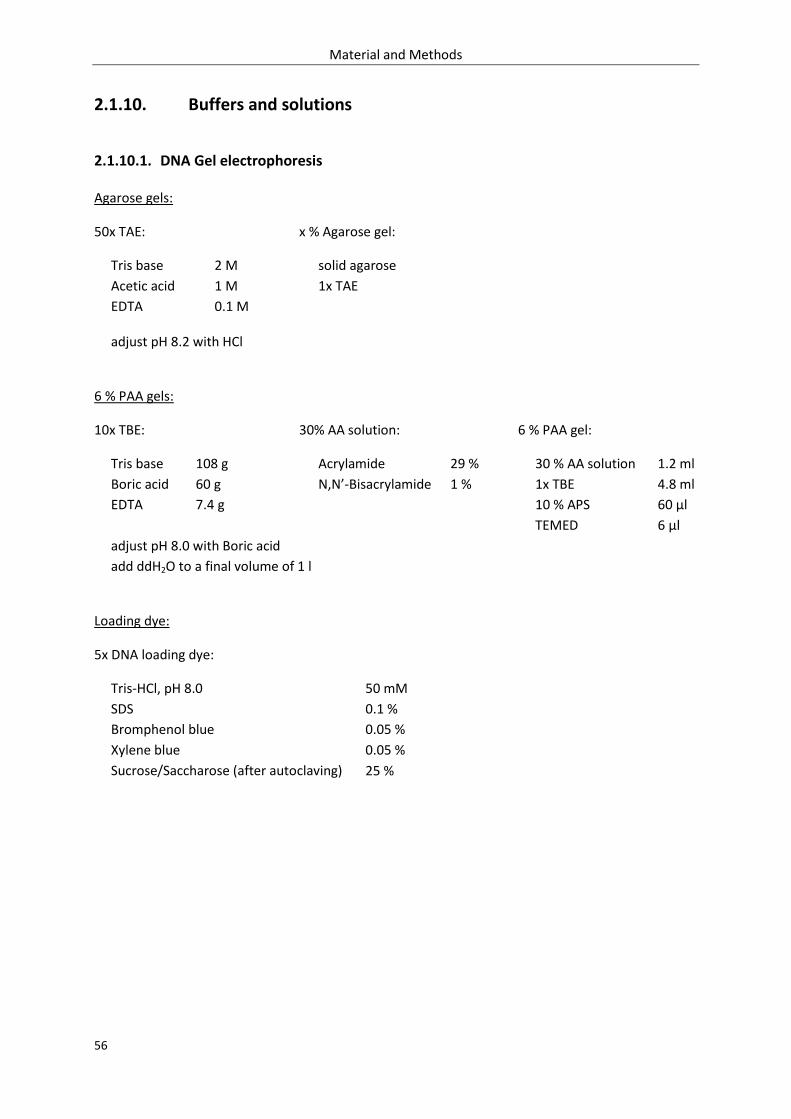
Material and Methods
56
2.1.10. Buffers and solutions
2.1.10.1. DNA Gel electrophoresis
Agarose gels:
50x TAE: x % Agarose gel:
Tris base
Acetic acid
EDTA
2 M
1 M
0.1 M
solid agarose
1x TAE
adjust pH 8.2 with HCl
6 % PAA gels:
10x TBE: 30% AA solution: 6 % PAA gel:
Tris base
Boric acid
EDTA
108 g
60 g
7.4 g
Acrylamide
N,N’-Bisacrylamide
29 %
1 %
30 % AA solution
1x TBE
10 % APS
TEMED
1.2 ml
4.8 ml
60 µl
6 µl
adjust pH 8.0 with Boric acid
add ddH2O to a final volume of 1 l
Loading dye:
5x DNA loading dye:
Tris-HCl, pH 8.0
SDS
Bromphenol blue
Xylene blue
50 mM
0.1 %
0.05 %
0.05 %
Sucrose/Saccharose (after autoclaving) 25 %
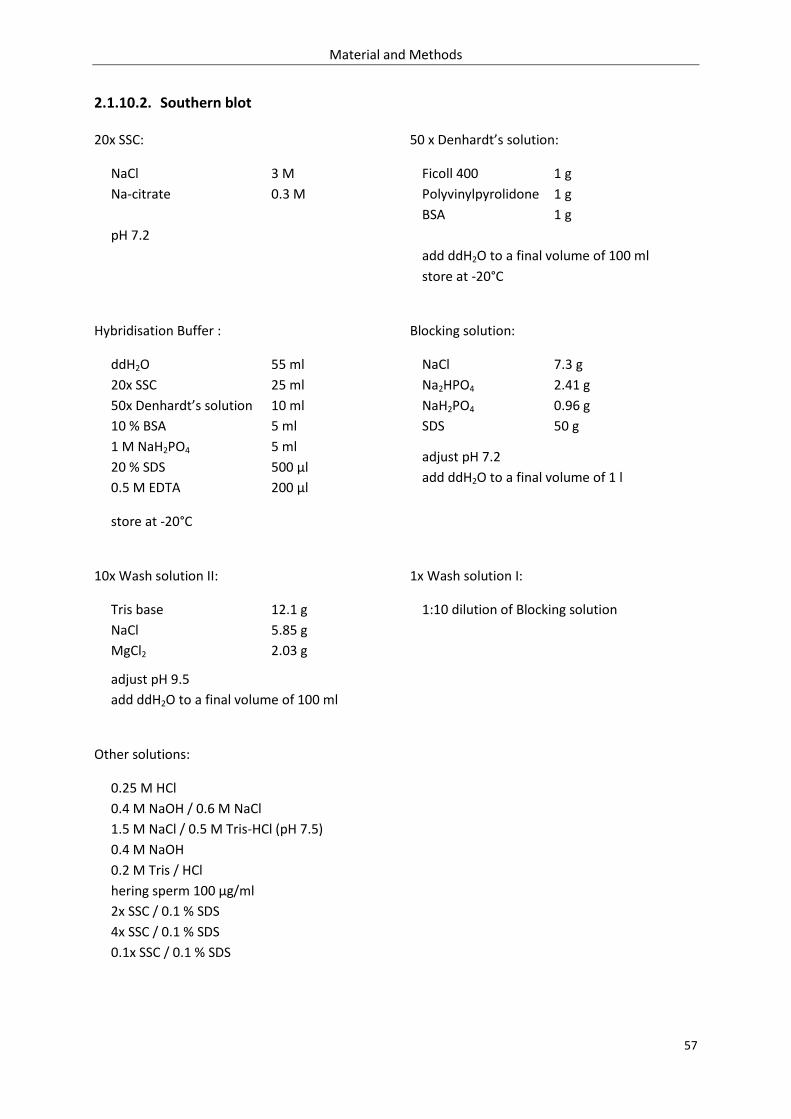
Material and Methods
57
2.1.10.2. Southern blot
20x SSC: 50 x Denhardt’s solution:
NaCl
Na-citrate
3 M
0.3 M
Ficoll 400
Polyvinylpyrolidone
BSA
1 g
1 g
1 g
pH 7.2
add ddH2O to a final volume of 100 ml
store at -20°C
Hybridisation Buffer : Blocking solution:
ddH2O
20x SSC
50x Denhardt’s solution
10 % BSA
1 M NaH2PO4
20 % SDS
0.5 M EDTA
55 ml
25 ml
10 ml
5 ml
5 ml
500 µl
200 µl
NaCl
Na2HPO4
NaH2PO4
SDS
7.3 g
2.41 g
0.96 g
50 g
adjust pH 7.2
add ddH2O to a final volume of 1 l
store at -20°C
10x Wash solution II: 1x Wash solution I:
Tris base
NaCl
MgCl2
12.1 g
5.85 g
2.03 g
1:10 dilution of Blocking solution
adjust pH 9.5
add ddH2O to a final volume of 100 ml
Other solutions:
0.25 M HCl
0.4 M NaOH / 0.6 M NaCl
1.5 M NaCl / 0.5 M Tris-HCl (pH 7.5)
0.4 M NaOH
0.2 M Tris / HCl
hering sperm 100 µg/ml
2x SSC / 0.1 % SDS
4x SSC / 0.1 % SDS
0.1x SSC / 0.1 % SDS
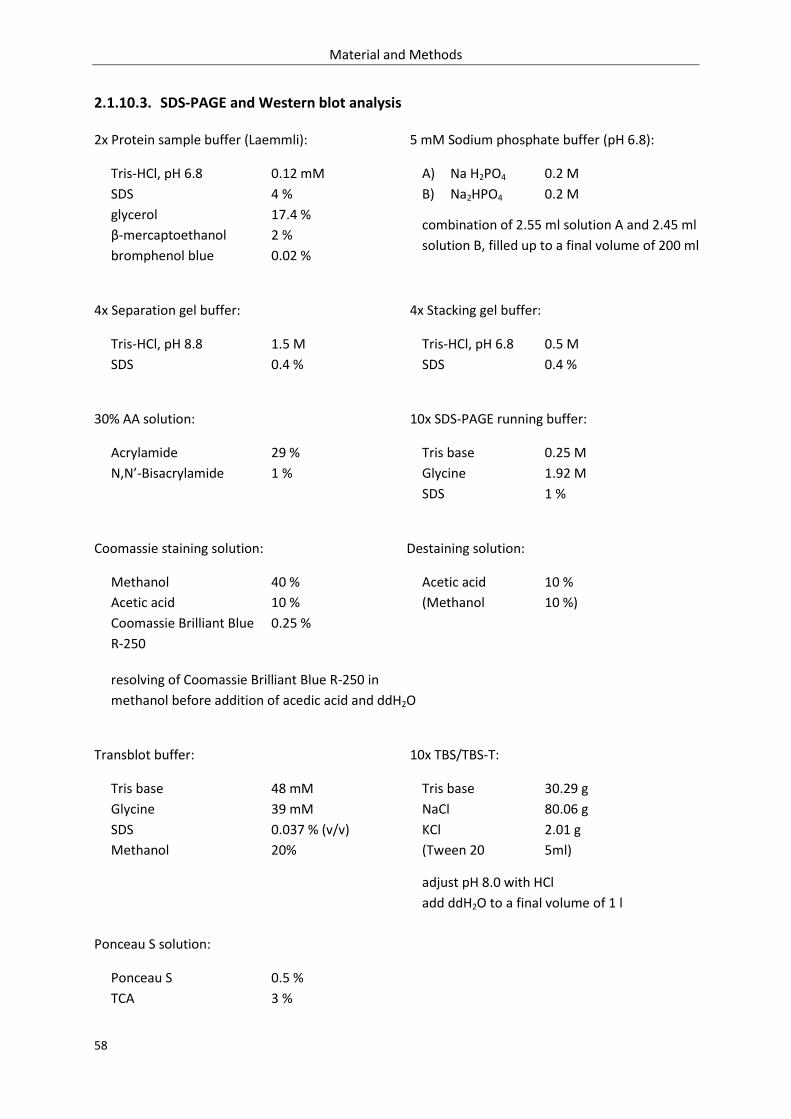
Material and Methods
58
2.1.10.3. SDS-PAGE and Western blot analysis
2x Protein sample buffer (Laemmli): 5 mM Sodium phosphate buffer (pH 6.8):
Tris-HCl, pH 6.8
SDS
glycerol
β-mercaptoethanol
bromphenol blue
0.12 mM
4 %
17.4 %
2 %
0.02 %
A)
B)
Na H2PO4
Na2HPO4
0.2 M
0.2 M
combination of 2.55 ml solution A and 2.45 ml
solution B, filled up to a final volume of 200 ml
4x Separation gel buffer: 4x Stacking gel buffer:
Tris-HCl, pH 8.8
SDS
1.5 M
0.4 %
Tris-HCl, pH 6.8
SDS
0.5 M
0.4 %
30% AA solution: 10x SDS-PAGE running buffer:
Acrylamide
N,N’-Bisacrylamide
29 %
1 %
Tris base
Glycine
SDS
0.25 M
1.92 M
1 %
Coomassie staining solution: Destaining solution:
Methanol
Acetic acid
Coomassie Brilliant Blue
R-250
40 %
10 %
0.25 %
Acetic acid
(Methanol
10 %
10 %)
resolving of Coomassie Brilliant Blue R-250 in
methanol before addition of acedic acid and ddH2O
Transblot buffer: 10x TBS/TBS-T:
Tris base
Glycine
SDS
Methanol
48 mM
39 mM
0.037 % (v/v)
20%
Tris base
NaCl
KCl
(Tween 20
30.29 g
80.06 g
2.01 g
5ml)
adjust pH 8.0 with HCl
add ddH2O to a final volume of 1 l
Ponceau S solution:
Ponceau S
TCA
0.5 %
3 %
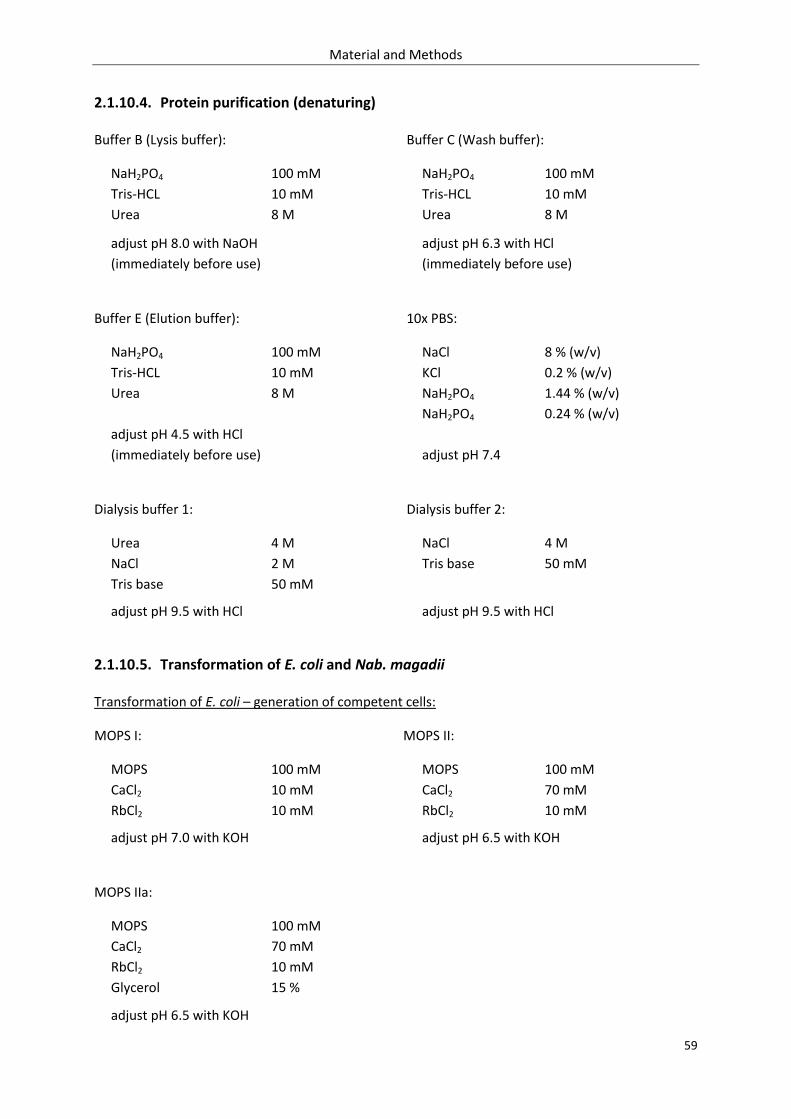
Material and Methods
59
2.1.10.4. Protein purification (denaturing)
Buffer B (Lysis buffer): Buffer C (Wash buffer):
NaH2PO4
Tris-HCL
Urea
100 mM
10 mM
8 M
NaH2PO4
Tris-HCL
Urea
100 mM
10 mM
8 M
adjust pH 8.0 with NaOH
(immediately before use)
adjust pH 6.3 with HCl
(immediately before use)
Buffer E (Elution buffer): 10x PBS:
NaH2PO4
Tris-HCL
Urea
100 mM
10 mM
8 M
NaCl
KCl
NaH2PO4
NaH2PO4
8 % (w/v)
0.2 % (w/v)
1.44 % (w/v)
0.24 % (w/v)
adjust pH 4.5 with HCl
(immediately before use)
adjust pH 7.4
Dialysis buffer 1: Dialysis buffer 2:
Urea
NaCl
Tris base
4 M
2 M
50 mM
NaCl
Tris base
4 M
50 mM
adjust pH 9.5 with HCl adjust pH 9.5 with HCl
2.1.10.5. Transformation of E. coli and Nab. magadii
Transformation of E. coli – generation of competent cells:
MOPS I: MOPS II:
MOPS
CaCl2
RbCl2
100 mM
10 mM
10 mM
MOPS
CaCl2
RbCl2
100 mM
70 mM
10 mM
adjust pH 7.0 with KOH adjust pH 6.5 with KOH
MOPS IIa:
MOPS
CaCl2
RbCl2
Glycerol
100 mM
70 mM
10 mM
15 %
adjust pH 6.5 with KOH
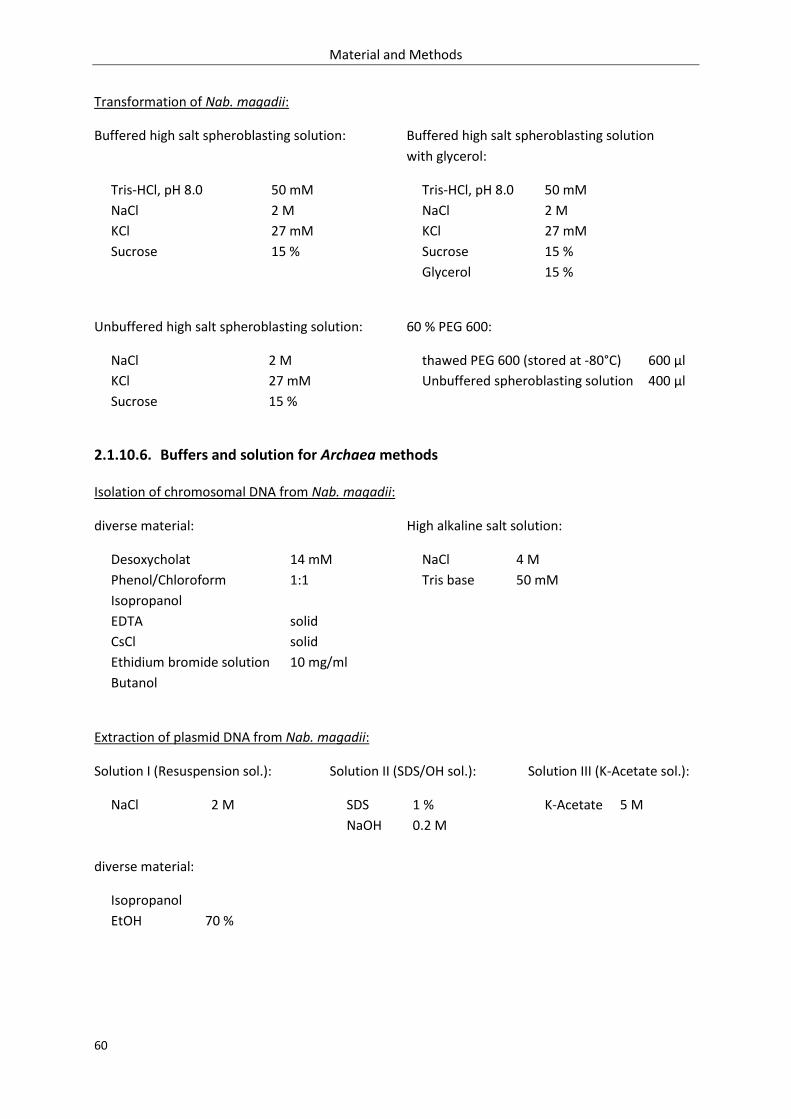
Material and Methods
60
Transformation of Nab. magadii:
Buffered high salt spheroblasting solution: Buffered high salt spheroblasting solution
with glycerol:
Tris-HCl, pH 8.0
NaCl
KCl
Sucrose
50 mM
2 M
27 mM
15 %
Tris-HCl, pH 8.0
NaCl
KCl
Sucrose
Glycerol
50 mM
2 M
27 mM
15 %
15 %
Unbuffered high salt spheroblasting solution: 60 % PEG 600:
NaCl
KCl
Sucrose
2 M
27 mM
15 %
thawed PEG 600 (stored at -80°C)
Unbuffered spheroblasting solution
600 µl
400 µl
2.1.10.6. Buffers and solution for Archaea methods
Isolation of chromosomal DNA from Nab. magadii:
diverse material: High alkaline salt solution:
Desoxycholat
Phenol/Chloroform
Isopropanol
EDTA
CsCl
Ethidium bromide solution
Butanol
14 mM
1:1
solid
solid
10 mg/ml
NaCl
Tris base
4 M
50 mM
Extraction of plasmid DNA from Nab. magadii:
Solution I (Resuspension sol.): Solution II (SDS/OH sol.): Solution III (K-Acetate sol.):
NaCl 2 M SDS
NaOH
1 %
0.2 M
K-Acetate 5 M
diverse material:
Isopropanol
EtOH
70 %
Material and Methods
61
2.1.10.7. Buffers and solution for phage methods
Isolation of phage particles:
High alkaline salt solution: Buffer Solution 1.1, 1.3, 1.5: PEG 6000
NaCl
Tris base
4 M
50 mM
NaCl
Tris base
2 M
50 mM
adjust pH 8.5 – 9
Solution 1.1: Solution 1.3: Solution 1.5:
CsCl
Buffer
20 g
200 ml
CsCl
Buffer
90 g
200 ml
CsCl
Buffer
135 g
200 ml
Precipitation of phage proteins:
diverse material:
TCA
Ammoniac
50 %
2.2. Methods
2.2.1. DNA cloning methods – cloning in E. coli
2.2.1.1. Gel electrophoresis
In general for observation of DNA probes, small aliquots were mixed with 5 µl 5x DNA loading
dye, loaded onto DNA gels and separated in electric fields according to their size. Afterwards the DNA
was stained by incubation of the gel in an ethidium bromide bath (10 µg/ml) and visualized under a
UV-transilluminator.
The nature of the gels used for this purpose was depending on the size of the DNA-fragment:
small fragments (> 1000 bp) were usually separated on a 6 % PAA gel, whereas DNA fragments larger
than 1000 bp were observed on a 0.8% agarose gel. In some cases however, e.g. for southern blots,
agarose gels with a higher percentage of agarose were used for analysis of small DNA fragments.
Material and Methods
62
Agarose gels:
For preparation of an agarose gel the required amount of agarose was filled up with 1x TAE
buffer and completely melted by heating in the microwave. After cooling down, the clear solution
was poured in the provided gel tray of the desired size (large gel tray: 300 ml; medium gel tray:
100 ml; small gel tray: 50 ml gel). For final use, the solidified gel was put into an electrophoresis
apparatus and covered with 1x TAE buffer. The prepared DNA samples were loaded onto the gel
and separated by setting an electric potential of usually about 10 V/cm. The duration of the run
was adapted to the fragment size and the purposes of electrophoresis, respectively.
6% PAA gel:
For casting of a 6 % PAA gel the components were mixed as described in section 2.1.10.1.
Immediately after adding APS and TEMED the gel was poured between two glass plates fixed in a
casting system provided by Biorad (Mini – Protean® 3 system). The completely polymerized gel
was set into the corresponding running apparatus and covered with 1x TBE buffer. After carefully
removing the comb, the gel was ready for loading and separation of DNA samples. The
electrophoretic separation within a 6 % PAA gel was performed for 26 minutes, applying a power
of 20 mA/gel.
2.2.1.2. Polymerase chain reaction (PCR)
Polymerase chain reaction (PCR) was performed in order to amplify DNA, either for increasing
the material used for cloning strategies (preparative PCR), or for detection of certain DNA fragments
in probes isolated from living cells (analytical PCR). Depending on the purpose, different templates
and polymerases were used. Anyway, the primers applied for all PCR approaches were obtained from
VBC genomics. Delivered in a lyophilized form they were solved in ddH2O, yielding 1 µg/µl stocks,
which were diluted 1:10 for final use. Based on the G-C content of the primers the melting
temperatures (TM) were calculated using the program Gene Runner from Hastings Software (Version
3.01). The primer annealing temperature applied during PCR progression was usually set 4° C lower
than the melting temperature of the primer with a lower TM. Other PCR conditions, the elongation
temperature and elongation time, were adapted to the activity and efficiency of the used
polymerases and the length of the amplified fragments, respectively.
Preparative PCR:
For preparative PCRs polymerases with proofreading activity, preferentially Pwo,
alternatively Pfu, were applied as they achieve lower error rates than Taq polymerases. As a
Material and Methods
63
template either φCh1-DNA or plasmid preparations from E. coli, both usually diluted 1:30, were
used.
Analytical PCR:
Analytical PCRs were often performed to screen for positive clones resulting from
transformation of certain plasmids in Nab. magadii. For this purpose no proofreading activity was
necessary, hence Taq polymerases (usually GoTaq®, alternatively Dream Taq®) were used. As PCR
templates crude extracts were prepared from archaeal cells by centrifugation of 20 µl culture
(3 min, 10 krpm) and solution of the pellet in 100 µl ddH2O. In addition, preparations of the
transformed plasmids (1:30) and crude extracts from the original culture were tested as positive
and negative controls, respectively. Furthermore, in course of this diploma work inversion events
on plasmids transformed in Nab. magadii were detected by PCR analysis. Since Taq polymerases
are able to cause inversion of DNA fragments on their own, Pwo polymerase was used for these
experiments. For preparation of PCR templates, plasmid DNA was isolated from the archaeal cells
according to the instructions in section 2.2.3.5.
PCR batch GoTaq® (50 µl): PCR batch Dream Taq® (50 µl):
28.5 µl
10 µl
5 µl
2.5 µl
2.5 µl
1 µl
0.5 µl
ddH2O
5x GoTaq® buffer
2 mM dNTPs
primer forward (0.1 µg/µl)
primer reverse(0.1 µg/µl)
template DNA
polymerase (GoTaq®)
33.5 µl
5 µl
5 µl
2.5 µl
2.5 µl
1 µl
0.5 µl
ddH2O
10x Dream Taq buffer
2 mM dNTPs
primer forward (0.1 µg/µl)
primer reverse(0.1 µg/µl)
template DNA
polymerase (Dream Taq®)
PCR batch Pwo/Pfu (100 µl): PCR program:
68 µl
10 µl
10 µl
5 µl
5 µl
1 µl
2 µl
ddH2O
10x Pwo/Pfu buffer
2 mM dNTPs
primer forward (0.1 µg/µl)
primer reverse (0.1 µg/µl)
template DNA
polymerase (Pwo/Pfu)
33 cycles
94° C
94° C
x° C *
y° C *
y° C *
4° C
5 min
1 min
1 min
z min *
5 min
infinite
denaturation
primer annealing
elongation
* x: The annealing temperature was calculated based on the G-C content of the primers used for the approach
y: The elongation temperature was chosen corresponding to the optimal activity of the polymerase
(Pwo: 68° C; Pfu: 72° C)
z: The elongation time was adapted to the efficiency of the polymerase (Pwo/Pfu: 500 bp/min) and the length
of the amplified DNA fragment, respectively
Material and Methods
64
PCR batch Pwo (50 µl): PCR program:
33 µl
5 µl
5 µl
2.5 µl
2.5 µl
1 µl
1 µl
ddH2O
10x Pwo buffer
2 mM dNTPs
primer forward (0.1 µg/µl)
primer reverse (0.1 µg/µl)
template DNA
polymerase (Pwo)
33 cycles
94° C
94° C
x° C *
y° C *
y° C *
4° C
5 min
1 min
1 min
z min *
5 min
infinite
denaturation
primer annealing
elongation
* x: The annealing temperature was calculated based on the G-C content of the primers used for the approach
y: The elongation temperature was chosen corresponding to the optimal activity of the polymerase
(Pwo: 68° C; GoTaq®/Dream Taq®: 72° C)
z: The elongation time was adapted to the efficiency of the polymerase (Pwo: 500 bp/min; GoTaq®/Dream
Taq®: 1000 bp/min) and the length of the amplified DNA fragment, respectively
The results of both, preparative and analytical PCRs were controlled by analysis of DNA probes on
agarose and 6 % PAA gels, respectively.
2.2.1.3. DNA purification
Simple purification:
In general DNA was purified after PCR and some restriction reactions to get rid of small
DNA species (dNTPs, primers, etc.) and chemical components possibly disturbing further
reactions. This was performed using the QIAquick PCR purification kit (QIAGEN) according to
manufacturer’s instructions. Instead of elution buffer, an appropriate volume of ddH2O (usually
50 µl) was applied for elution of the purified DNA.
Elution from agarose and 6 % PAA gels:
In the presence of large unwanted PCR or restriction site products, specific DNA fragments
could be isolated by extraction from agarose gels and 6 % PAA gels, respectively. The nature of
the gel was chosen depending on the size of the fragments (see section 2.2.1.1.). Anyway, for gel
elution the whole DNA sample was mixed with 5x DNA loading dye, loaded onto the gel (up to
20 µl per slot) and separated in an electric field as described in section 2.2.1.1. After short staining
in an ethidium bromide bath, the bands of interest were cut out of the gel under 70 % UV light
and transferred in Eppendorf tubes. DNA isolated from agarose gels was simply purified using the
QIAquick Gel Extraction kit (QIAGEN) following the supplied protocol. For extraction from 6 % PAA
gels however the gel slices first had to be minced and incubated in 300 µl elution buffer (same
kit), shaking at 37° C over night. Finally the DNA was isolated by centrifugation (13.2 krpm, 5 min)
and purified from the resulting supernatant, also using the QIAquick Gel Extraction kit (QIAGEN)
according to manufacturer’s instructions.
Material and Methods
65
Anyway, the purified DNA was eluted from the column with an appropriate volume of
ddH2O (usually 50 µl). The result of the purification procedure was controlled by analysis of a DNA
probe on an agarose or 6 % PAA gel.
2.2.1.4. Restriction of DNA
Almost all DNA restrictions were performed using restriction enzymes and the appropriate
buffers provided by Fermentas. Only for digestion of pUC19 DNA with Sau3AI in order to produce a
DNA marker, an endonuclease of the company New England BioLabs was applied. For restrictions
involved in cloning procedures usually batches with a total volume of 50 µl were mixed, whereas for
analytical digests (verifying of positive transformants) smaller batches (20 µl) were sufficient. For
cloning approaches the amount of DNA added to the restriction batch was adapted to the estimated
DNA concentration in the original probe. The amounts of buffer and enzymes, as well as the sort of
buffer, were chosen according to the optimal conditions recommended by the manufacturer. Double
digests were performed using the buffers suggested on the Fermentas DoubleDigestTM website
(http://www.fermentas.com/en/tools/doubledigest). To achieve best restriction results for cloning
purpose, the DNA was digested for 3 hours or over night at the appropriate temperature (usually
37° C), whereas analytical restriction batches were incubated for only 1 hour. Anyway, the result of
the restriction procedure was analyzed on an agarose gel.
2.2.1.5. Removal of 3’ overhangs
Removal of 3’ overhangs was achieved using T4 DNA polymerase from Fermentas in the
absence of dNTPs. However, to avoid changing of the buffer system, 1 µl enzyme was added directly
to the 50 µl restriction mix after inactivation of the restriction endonucleases (10 min, 65° C) instead
of using the supplied buffer. The activity of T4 DNA polymerase in the KpnI-buffer was ensured by
checking the enzyme informations on the Fermentas website. The blunting reaction was done by
incubation at 37° C for 30 min, followed by inactivation of T4 DNA polymerase by heating at 75° C for
10 min.
2.2.1.6. Ligation
For ligation both, the linearized vector and the DNA fragment to be ligated (insert) were
analyzed on an agarose gel in order to estimate the DNA concentration. The ligation reaction was
performed using the T4 DNA ligase (Fermentas) in combination with the supplied buffer. The amount
Material and Methods
66
of vector used for ligation was varied by dilution in order to achieve a vector / insert ration of 3 / 1.
The batch was mixed as follows:
11.5 µl
1.5 µl
1 µl
1 µl
insert DNA
ligase buffer
T4 DNA ligase (Fermentas)
linearized vector (diluted)
Ligation was performed by incubation for 3 h at room temperature or overnight in a 16° C water
bath.
2.2.1.7. Transformation of E. coli
Generation of CaCl2 competent E. coli cells:
For generation of competent E. coli cells, 400 ml LB * supplemented with the respective
antibiotic were inoculated with an overnight culture of the desired strain (XL-1 Blue and Rosetta,
respectively) to an initial optical density (OD600) of 0.1. Shaking at 37° C the culture was grown
until an OD600 of approximately 0.6 was reached. The logarithmic growing cells were harvested by
centrifugation (15 min, 6000 rpm, 4° C), resuspended in 160 ml MOPS I and incubated on ice for
10 min. Once more, it was centrifuged (15 min, 6000 rpm, 4° C), yielding a pellet which was
resuspended in 160 ml MOPS II. This time it was incubated on ice for 30 min and pelletised by
centrifugation again. Finally the pellet was solved in 8 ml MOPS IIa, aliqoted to 100 µl per
Eppendorf tube and stored at -80° C until final use. To achieve optimal results, all steps were
carried out as quickly as possible keeping the cells cooled during the whole procedure and using
ice cold solutions.
* alternatively competent cells were generated from 100 ml culture, using ¼ vol. of the described buffers
Heat shock transformation:
For transformation of a ligation product, the whole 15 µl ligation batch was pipetted to the
100 µl competent E. coli cells (thawed on ice). Transformation of plasmid preparations in contrast
was performed using 10-200 ng DNA. Anyway, after adding the DNA, the bacterial cells were
incubated on ice for 30 min. To enhance the intake of foreign DNA the cells were heat shocked by
keeping them on 42° C for 2 min. After short incubation on ice, 300 µl LB were added and the cells
were regenerated at 37° C for another 30 min. Finally they were plated on LB agar plates
containing the respective antibiotics (120 µl per plate) and incubated at 37° C overnight. The next
day single colonies were inoculated in order to screen for positive clones.
Material and Methods
67
2.2.1.8. Quick Apply – screening for positive clones
For quick screening of transformants, numerous single colonies (usually 30) were picked from
selective agar plates, inoculated in 5 ml LB medium supplemented with the respective antibiotics and
grown at 37° C overnight. The next day 300 µl were taken from each liquid culture and centrifuged at
13.2 krpm for 3 min. The supernatant was removed and the resulting cell pellet was resuspended in
30 µl 5x DNA loading dye. Afterwards the batch was mixed with 14 µl of phenol/chloroform (1:1) by
thorough vortexing (approx. 30 sec) and centrifuged again (13.2 krpm, 5 min). 12 µl of the aqueous
phase were loaded onto a 0.8 % agarose gel in order to analyze the crude extracted nucleic acids in
the probes. The run of the gel and staining were performed as described in section 2.2.1.1. According
to the positions of the plasmid bands on the gel, clones containing the religated vector without insert
could be distinguished from putative positive clones (containing the vector carrying the insert). The
latter were verified by analytical restriction (see section 2.2.1.4.) of prepared plasmids and, if
necessary, by analytical PCRs (see section 2.2.1.2.).
2.2.1.9. Plasmid preparation from E. coli
Plasmid DNA from E. coli was prepared from 3 ml liquid culture (2 x 1.5 ml) using the
GeneJETTM Plasmid Miniprep Kit from Fermentas according to manufacturer’s instructions. However,
instead of elution buffer, 50 µl ddH2O were used for elution of the plasmid DNA from the silica
column.
2.2.1.10. Quantification of DNA and lyophilization
DNA concentrations were calculated based on OD260/280 using the UV/Vis-Spectrophotometer
NanoDrop ND-1000 from PeqLab. Semiquantitative determinations of DNA concentrations were
performed by analysis of DNA probes on agarose and 6 % PAA gels, respectively. To increase DNA
concentrations by reducing the volume (necessary for some procedures), the speed vac UNIVAPO
100H (UniEquip) was used for lyophilization.
2.2.1.11. Alpha complementation
If an insert was cloned into a vector disrupting the α-fragment of the lacZ gene, this method
could be used to facilitate the first step of cloning. For that purpose E. coli cells (lacZ-α deficient
E. coli strain) transformed with the ligated plasmids were plated on LB agar plates containing 1 mM
IPTG and 40 µg/ml X-Gal. As a result, due to the activity of ß-galactosidase, two types of colonies
Material and Methods
68
could be distinguished: blue colonies (carrying a functional lacZ-α-fragment) and white colonies
(containing plasmids carrying the insert). This way, pre-selection of positive clones was enabled.
2.2.2. Cloning strategies of current projects
2.2.2.1. Strategies for the deletion of φCh1 ORF34
For construction of a φCh1 deletion mutant lacking the putative tail fibre protein, the regions
upstream and downstream of ORF34, interrupted by a novobiocin resistance cassette, were cloned
on the suicide vector pKSII+. In a first cloning step the upstream region (nu. 22252 – 23235 of the
genome of φCh1) was amplified by PCR using the primers D34-1 and D34-2. The resulting 1006 bp
fragment was digested with XbaI and KpnI and ligated with the vector pKSII+ (restricted with the same
enzymes). After verification of a positive clone, the resulting plasmid (pKSII+ ΔORF34-fragment 1) was
digested with the restriction endonucleases KpnI and HindIII. For cloning of the region downstream
of ORF34 (fragment 2, nu. 24625 – 25584 of the genome of φCh1) another preparative PCR was
performed, using the primers D34-3-Sma and D34-4, respectively. However, for amplification of both,
fragment 1 and 2, φCh1 DNA (diluted 1:30) was used as a PCR template. Anyway, just like the vector,
the 985 bp product of PCR 2 was restricted with KpnI and HindIII and ligated with pKSII+ ΔORF34-
fragment 1, yielding the plasmid pKSII+ ΔORF34-fragment 1+2. Finally, the novobiocin restriction
cassette was cloned between fragment 1 and fragment 2. For that purpose the 2453 bp gyrB (coding
for NovR) was cut out of the plasmid pMDS11 using SmaI and HindIII and isolated by extraction from
a 0.8 % agarose gel. After restriction of pKSII+ ΔORF34-fragment 1+2 with SmaI and HindIII (both
restriction sites introduced by primer D34-3-Sma), vector and template were ligated and cloned in
E. coli. The final construct (pKSII+ ΔORF34-deletion cassette) was then used for replacing of ORF34 in
the φCh1 genome by transformation into Nab. magadii L11 and screening for positive clones
resulting from chromosomal integration.
2.2.2.2. Complementation of φCh1-ΔORF34
In order to verify the effect caused by deletion of φCh1 ORF34, the mutation was
complemented by introduction of a functional ORF34 on a plasmid. For this purpose, two different
variants were tested: the non-inverted fragment ORF341 and the inversion product ORF3452, carrying
the 3’ end of ORF36. However, only gene products of constructs comprising ORF3452 were supposed
to complement the function of the putative tail fibre protein gp34, enabling infection of the host cell
by the virus φCh1.
Material and Methods
69
For cloning both variants, ORF341 and ORF3452, were amplified by preparative PCR and
introduced into the vector pRR007. The PCR of ORF341 was performed applying the primers 34-3 and
34-Kpn, whereas for the amplification of ORF3452 the primers 34-Kpn and 36-3 were employed. As
templates, the plasmids pBGB1 and pBGB52 respectively, both prepared from E. coli, were used. The
product of each PCR was restricted with KpnI and HindIII and ligated with the shuttle vector pRR007
(digested with the same enzymes). The two resulting plasmids, pRR007-ORF341 and pRR007-ORF3452,
were transformed in the Nab. magadii strain L11 ΔORF34, yet screening did not yield any positive
clones. Hence, two further constructs using another shuttle vector (pNB102) were prepared. Again
ORF341 and ORF3452 were amplified by preparative PCRs, this time using the primer-sets 34-Kpn /
34-3-Xba and 34-Kpn / 34-3-X, respectively. Both fragments, as well as the vector pNB102 were
digested with KpnI and XbaI. Ligation of pNB102 with ORF341 and ORF3452 respectively yielded two
plasmids, pNB102-ORF341 and pNB102-ORF3452, which were successfully transformed in archaeal
strains and used for complementation experiments.
2.2.2.3. Construction of eight int1 clones comprising variations in single repeats
In course of this diploma work, different constructs for further investigation of the inversion
reaction were made. All of them were composed of int1 as well as single repeats of the clusters IR-R
and IR-L found within ORF34 and ORF36 of the φCh1 genome. These repeats were flanking a spacer
region resembling the invertible region in its size and G-C content. However, three of the eight clones
(#584, #586, #608) were differing in the orientation of the repeats, whereas four clones (#661, #662,
#663, #664) were characterized by exchanges of certain nucleotides. The last clone (#615) was used
as a negative control as int1 was lacking, excluding the possibility of inversion of the spacer region.
The eight constructs are listed in the table below.
For investigation of the effect of the single repeat variations on the possibility to perform
inversion events, all eight int1-constructs were cloned on the shuttle vector pRo-5, controlled by the
putative strong promoter fdx from H. salinarum. Hence, as an initial step a cloning vector (pUC19)
containing fdx had to be produced. For this purpose the 100 bp fragment was amplified by PCR, using
the primers fdx-1 and fdx-2 and pJAS35 (plasmid preparation from E.coli) as a template. Both, the
produced fdx-fragment and the pUC19 vector were digested with KpnI and XbaI, ligated and
transformed into the E.coli strain XL-1 Blue. Screening for clones containing the small insert was
enhanced by alpha complementation (see section 2.2.1.11.). Positive clones were verified by
digestion with NcoI (additional restriction site introduced by fdx). However, for introduction of the
int1-contructs, pUC19-fdx was digested with NcoI and HindIII. The eight inserts were isolated by
restriction of pBAD24 vectors containing the constructs (pBAD24-584, pBAD24-586, pBAD24-608,
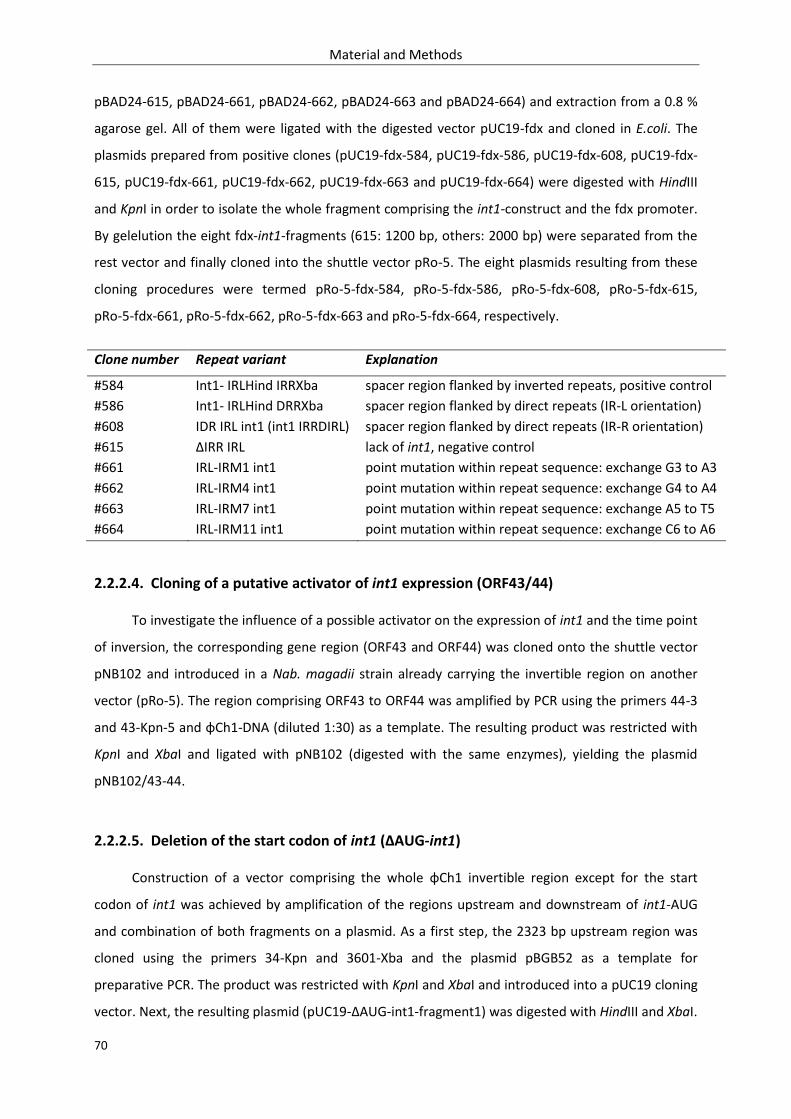
Material and Methods
70
pBAD24-615, pBAD24-661, pBAD24-662, pBAD24-663 and pBAD24-664) and extraction from a 0.8 %
agarose gel. All of them were ligated with the digested vector pUC19-fdx and cloned in E.coli. The
plasmids prepared from positive clones (pUC19-fdx-584, pUC19-fdx-586, pUC19-fdx-608, pUC19-fdx-
615, pUC19-fdx-661, pUC19-fdx-662, pUC19-fdx-663 and pUC19-fdx-664) were digested with HindIII
and KpnI in order to isolate the whole fragment comprising the int1-construct and the fdx promoter.
By gelelution the eight fdx-int1-fragments (615: 1200 bp, others: 2000 bp) were separated from the
rest vector and finally cloned into the shuttle vector pRo-5. The eight plasmids resulting from these
cloning procedures were termed pRo-5-fdx-584, pRo-5-fdx-586, pRo-5-fdx-608, pRo-5-fdx-615,
pRo-5-fdx-661, pRo-5-fdx-662, pRo-5-fdx-663 and pRo-5-fdx-664, respectively.
Clone number Repeat variant Explanation
#584
#586
#608
#615
#661
#662
#663
#664
Int1- IRLHind IRRXba
Int1- IRLHind DRRXba
IDR IRL int1 (int1 IRRDIRL)
ΔIRR IRL
IRL-IRM1 int1
IRL-IRM4 int1
IRL-IRM7 int1
IRL-IRM11 int1
spacer region flanked by inverted repeats, positive control
spacer region flanked by direct repeats (IR-L orientation)
spacer region flanked by direct repeats (IR-R orientation)
lack of int1, negative control
point mutation within repeat sequence: exchange G3 to A3
point mutation within repeat sequence: exchange G4 to A4
point mutation within repeat sequence: exchange A5 to T5
point mutation within repeat sequence: exchange C6 to A6
2.2.2.4. Cloning of a putative activator of int1 expression (ORF43/44)
To investigate the influence of a possible activator on the expression of int1 and the time point
of inversion, the corresponding gene region (ORF43 and ORF44) was cloned onto the shuttle vector
pNB102 and introduced in a Nab. magadii strain already carrying the invertible region on another
vector (pRo-5). The region comprising ORF43 to ORF44 was amplified by PCR using the primers 44-3
and 43-Kpn-5 and φCh1-DNA (diluted 1:30) as a template. The resulting product was restricted with
KpnI and XbaI and ligated with pNB102 (digested with the same enzymes), yielding the plasmid
pNB102/43-44.
2.2.2.5. Deletion of the start codon of int1 (ΔAUG-int1)
Construction of a vector comprising the whole φCh1 invertible region except for the start
codon of int1 was achieved by amplification of the regions upstream and downstream of int1-AUG
and combination of both fragments on a plasmid. As a first step, the 2323 bp upstream region was
cloned using the primers 34-Kpn and 3601-Xba and the plasmid pBGB52 as a template for
preparative PCR. The product was restricted with KpnI and XbaI and introduced into a pUC19 cloning
vector. Next, the resulting plasmid (pUC19-ΔAUG-int1-fragment1) was digested with HindIII and XbaI.
Material and Methods
71
In order to prepare the second fragment (region downstream of AUG-int1), a PCR was performed
using the same template and 36-5-HindIII as well as 3602-Xba as primers. The resulting 2161 bp
fragment 2 was digested with HindIII and XbaI as well and ligated with the linearized vector, yielding
the plasmid pUC19-ΔAUG-int1-fragment1+2. As a third step, the whole ΔAUG-construct was
transferred to the shuttle vector pRo-5. For this purpose pUC19-ΔAUG-int1-fragment1+2 was
digested with FspI (NsbI) and HindIII, yielding one HindIII restriction site and one bunt end. The 4500
bp ΔAUG-fragment was isolated from the rest vector by extraction from a 0.8 % agarose gel. For
production of an appropriate pRo-5 vector, a 50 µl restriction batch was mixed, digesting with KpnI
first. Afterwards the enzyme was inactivated and the 3’ overhang on the restriction site was removed
employing T4 DNA polymerase in the absence of dNTPs (see section 2.2.1.5.), yielding the blunt end.
Finally, the DNA was purified in order to remove chemical components of the old buffer-system and
pRo-5 was digested with HindIII for creation of the appropriate sticky end. To get the plasmid pRo-5-
ΔAUG-int1 which was finally transformed in Nab. magadii L13, the resulting pRo-5 vector was ligated
with the prepared ΔAUG-fragment and cloned in E. coli.
2.2.3. Methods for Archaea
2.2.3.1. Transformation of Nab. magadii and screening for positive clones
Generation of Nab. magadii sheroblast cells:
For generation of competent Nab. magadii cells (spheroblasts), a fresh pre-culture was
used for inoculation of three baffled 500 ml flasks, each containing 60 ml NVM+ supplemented
with bacitracin (70 µg/ml). Usually the batches were completed by the addition of 4 ml, 6 ml, and
8 ml pre-culture, respectively. The cells were grown at 37°C, shaking with a speed of 160 rpm in
order to reach an OD600 of 0.5-0.6 (usually at least after 24h). The culture with the optical density
closest to the aimed value was centrifuged at 6000 rpm for 15 min (room temperature), yielding a
cell pellet which was resuspended in ½ volume (30 ml) buffered spheroblasting solution with
glycerol. After addition of proteinase K to a final concentration of 20 µg/ml, the batch was
incubated on a 42° C shaker for 1-2 days. When formation of spheroblast cells could be observed
by light microscopy, the Archaea were supposed to be competent for transformation of foreign
DNA.
Transformation of competent Nab. magadii cells:
For each transformation batch (incl. neg. control) , spheroblast cells from 1.5 ml culture
were harvested by centrifugation (10 krpm, 3 min, room temperature) and resuspended in 150 µl
Material and Methods
72
buffered spheroblasting solution (without glycerol). After addition of 15 µl 0.5 M EDTA the cells
were incubated at room temperature for 10 min. Subsequently the DNA to be transformed
(approx. 5 µg) was added. To prevent dramatically changes of the NaCl concentrations in the
transformation batches, a maximal volume of 10 µl DNA was used. Hence, if necessary, the
concentration in the DNA solution had to be increased to approx. 500 ng/µl (at least 300 ng/µl) by
lyophilization. After addition of the DNA followed by incubation for 5 min, each batch was mixed
with 150 µl 60 % PEG 600 (see section 2.1.10.5.) and left at room temperature for 30 min.
Subsequently 1 ml NVM+ was added and the cells were harvested by centrifugation at 10 krpm
for 5 min (room temperature). For regeneration, the pellet was resuspended in 1 ml fresh
medium and incubated, shaking at 37° C for 1-2 days. Finally, the transformation batch was plated
on agar plates supplemented with the respective antibiotic (120 µl per plate). In addition, a 1:10
dilution was prepared with fresh NVM medium and plated on selective plates too. Single colonies
could be observed on the agar plates after incubation at 37° C for at least two weeks.
Screening for positive clones:
To achieve quick screening for transformants, single colonies were picked from agar plates
and inoculated in 1ml NVM+ supplemented with the antibiotic needed for selection. Growing in
Eppendorf tubes, they had to be aired once a day in order to generate aerobic conditions. After
incubation on a 42° C shaker for approx. one week, crude extracts could be prepared as described
in section 2.2.1.2. To identify positive transformants, they were used as templates for analytical
PCRs. If these test PCRs did not give clear results, southern blot analysis was performed in order
to verify putative positive clones.
2.2.3.2. Generation and verification of a homozygous deletion mutant
As described above, a φCh1 ORF34 deletion mutant was produced by cloning of the
neighboring genomic regions as well as the selection marker NovR on a suicide vector and
transformation into Nab. magadii L11. Clones showing integration of the deletion cassette into the
host chromosome were identified by analytical PCR using the primers D34-1 and Nov-9. However, as
Nab. magadii is known to contain up to 50 genome copies, the described procedure does probably
not yield a homozygous clone completely lacking ORF34. To overcome this problem, wild type
variants of ORF34 had to be eliminated by persistent growing, keeping the culture in a logarithmic
growth phase, continuously selecting on the antibiotic resistance provided by the deletion cassette.
For that purpose the culture was grown until a late logarithmic phase was reached, followed by
transfer of 50-500 µl to 20 ml fresh medium containing the selective antibiotic. This procedure,
termed passaging was repeated several times. Every fifth passaging cycle, the culture was tested for
Material and Methods
73
both, the presence of the mutant-variant and the wild type gene by analytical PCR. In the case of
ΔORF34, the wild type ORF34 was eliminated after a total of 20 passaging cycles (detected by PCR
using the primers 34-5 and 36-3).
In addition to PCR analysis, a southern blot was performed in order to verify the homozygous
deletion of ORF34. For this purpose chromosomal DNA was isolated from the putative Nab. magadii
L11-ΔORF34 according to the protocol in section 2.2.3.3. and digested with the restriction
endonucleases BamHI. As a control, wild type L11 DNA digested with the same enzyme (batches
listed below). The fragments resulting from restriction of the mutant DNA on one hand and from the
wild type version on the other hand were calculated in theory (listed below). Then their occurrence
in the mutant and wild type culture was detected by hybridisation of the separated restriction
batches blotted to a membrane with a biotinylated specific DNA probe. However, the absence of wild
type fragments in the mutant culture represented a further evidence for the homozygous deletion of
ORF34.
Digestion of chr. DNA (batch): Southern blot – expected fragment lengths:
L11 ΔORF34 material strain fragments (BamHI-digest)
10 µl
10 µl
4 µl
26 µl
5 µl
10 µl
4 µl
31 µl
chr. DNA
Tango Buffer
BamHI
ddH2O
Nab. magadii L11
Nab. magadii L11-ΔORF34
1847, 586, 361 [bp]
3825, 1847, 361 [bp]
2.2.3.3. Isolation of Nab. magadii chromosomal DNA
500 ml of a culture grown to an OD600 of >0.6 were centrifuged at 8 krpm and 20° C for 20 min.
The collected cells (pellet) were resuspended in 5 ml high alkaline salt solution and shared between
two SS34 centrifugation tubes. To each tube 2.5 ml 14 mM Desoxycholat were added and carefully
mixed with the cell solution by twisting or rolling the tubes in the hands, yielding a slimy liquid. Both
batches were supplemented with 7.5 ml ddH2O (sterile), thorough mixed as described before and
incubated on ice for 30 min. Subsequently 12.5 ml phenol/chloroform (1:1) per tube were added and
mixed gently by inverting the tubes. To extract the chromosomal DNA, both batches were
centrifuged at 10 krpm for 30 min at 4° C. The supernatant (upper phase) was carefully transferred to
a 100 ml flask and overlaid with 0.6x volume Isopropanol. The precipitated DNA was gathered using a
bended Pasteur pipette and solved in 5 ml ddH2O. Afterwards sterile EDTA was added to a final
concentration of 10 mM, followed by supplementation with 1.5 g/ml rigid CsCl and approx. 15 µl
ethidium bromide (EtBr) solution (10 mg/ml). The rosé-colored liquid was transferred to a Quick-Seal
ultracentrifugation tube, sealed and centrifuged at 60 krpm and 20° C for at least 16h. The next day
Material and Methods
74
the resulting DNA bande was collected and transferred to an Eppendorf tube. The EtBr was
completely removed by extraction with water saturated butyl alcohol until the solution was
completely destained. Finally, the DNA sample was dialyzed against sterile ddH2O: first for 4h, then
over night, changing the water in between. The result of the chromosomal DNA isolation procedure
was controlled by analysis of a small aliquot (2 µl) on a 0.8 % agarose gel.
2.2.3.4. Time course experiments
Time course experiments were performed for the eight int1 clones comprising variations in
single repeats, L13 cultures containing the invertible region as well as a putative activator of int1
expression and, moreover, Nab. magadii L13 carrying the invertible region but lacking the start
codon of int1 (ΔAUG-int1). In all three cases the possibility to perform inversion reactions was
investigated depending on the time point in Nab. magdii life cycle.
For these experiments rich medium (approx. 150 ml) completed with the respective antibiotics
was inoculated to an OD600 of 0.05 – 0.1 and grown at 37° C until the late stationary phase was
reached (7-10 days). Every day the optical density was measured and samples were taken for crude
extraction of plasmid DNA according to the procedure described in section 2.2.3.5. Appropriate
dilutions of these samples were used as templates of analytical PCRs, detecting the non-inverted
version on one hand and the inverted fragment on the other hand. In addition, if necessary, southern
blot analysis was performed in order to further investigate the presence of the respective fragments
in the various samples. For observation of the eight int1 clones, the primers CH3-8 and p28+ were
used for amplification of the non-inverted fragment, whereas the inverted fragment was detected
applying CH3-8 and p28-. The negative control lacking int1 (#615) however was investigated using
fdx1/p28+ and fdx1/p28-, respectively. For the other two experiments (ΔAUG-int1 and
supplementation of a possible activator) primers detecting the respective ORF34-variant (1369 bp)
were used. In a first approach 34-5 and 34-3 were applied for amplification of ORF341 (inversion
product) and 34-5/36-3 for detection of ORF3452 (non-inverted fragment on pBGB52). Later
34-inv1/34-inv2 and 34-inv1/36-inv1 as well as 34-Kpn/34-3 and 34-Kpn/36-3 were tried.
Furthermore in some cases crude protein extracts were prepared from samples taken from the
growing cultures and analyzed by western blot using an antibody raised against the His-tag.
2.2.3.5. Extraction of (plasmid) DNA from Nab. magadii
3 ml (2 x 1.5 ml) of a growing culture with an OD600 = 1* were centrifuged at 13.000 x g for
2 min. The supernatant was removed and the harvested cells were resuspended in 50 µl Solution I
Material and Methods
75
(Resuspension solution). Afterwards they were lysed by addition of 200 µl Solution II (SDS/OH
solution) and gently mixing by inversion. The batch was incubated at room temperature for 5 min
and supplemented with 150 µl Solution III (K-Acetate solution). Again it was mixed by inversion and
centrifuged at 13.000 x g for 3 min. The resulting supernatant was carefully transferred to a new
Eppendorf tube without disturbing the pellet. Next the DNA was precipitated by addition of 0.6-1x
volume isopropanol, incubation for 2 min and centrifugation at 13.000 x g for 30 min. Immediately
after centrifugation had stopped, the supernatant was removed and the DNA-pellet was washed
twice with 70 % EtOH (1 ml). After drying, the DNA was solved in 30 µl ddH2O. For analyzation, 10 µl
of each DNA sample were applied to a 0.8 % agarosegel.
* For lower optical densities, the volume taken for DNA isolation was adapted
2.2.4. Phage methods
2.2.4.1. Isolation of phage particles
Phage particles were isolated from the supernatant of a lysated culture, precipitated with
PEG 6000 and further purified and concentrated by ultracentrifugation, applying a discontinuous as
well as a continuous CsCl gradient.
As a first step, a dense pre-culture of the Nab. magadii culture carrying φCh1 as a prophage
(approx. 250 ml) was used for inoculation of at least 5 l NVM+ to an OD600 of 0.05-0.1. If
necessary, the cultures were supplemented with the appropriate antibiotics. Growth and lysis of
the cultures shaking at 37° C was reported by daily determination of the optical density. When
complete lysis was observed (stop in decrease of OD600), the phage particles were separated from
the cell components by centrifugation (20 min, 8 krpm, 20°C).
The supernatant was poured in fresh flasks, supplemented with 10 % (w/v) PEG 6000 and stirred
over night. After precipitation, the phage particles could by collected by centrifugation (20 min,
8 krpm, 20°C) and solved in a reduced volume of high alkaline salt solution (approx. 10 ml / 1 l
culture).
For further purification and concentration, the phage suspension was set on a CsCl gradient and
separated by ultracentrifugation. In a first approach, a discontinuous gradient was generated by
carefully overlaying of 4 ml Solution 1.5 with 4 ml Solution 1.3, followed by approx. 5 ml phage
suspension filling up the tubes (Beckman Ultracentrifuge tubes). After exact balancing,
Material and Methods
76
ultracentrifugation was performed at 30 krpm and 20° C for 20 h using the swinging bucket rotor
SW40Ti. The phage particles, usually visible as a defined band located to a certain density, were
carefully harvested. After mixing with an equal volume of Solution 1.3., thereby applying a
continuous gradient, centrifugation was performed under the same conditions as before. Again
the phages particles were collected.
Finally the resulting fractions were dialyzed against high alkaline salt solution over night and
stored at room temperature.
2.2.4.2. Isolation of phage DNA
Quick approach:
Initially, 100 µl purified phages (section 2.2.4.1.) were mixed with 300 µl ddH2O. For
extraction of the DNA, 200 µl phenol/chloroform (1:1) were added, followed by thoroughly
vortexing and centrifugation at 13.2 krmp for 3 min. Subsequently, the upper (aqueous) phase
was carefully transferred to a new Eppendorf tube. The DNA was precipitated by addition of
2x vol. 96 % EtOH and centrifugation at 16.4 krpm and 4° C for 20 min. After removing the
supernatant, the pellet was washed twice with 70 % EtOH (1 ml) and dried at 65 ° C. Finally it was
solved in 10 µl ddH2O and analyzed on an agarose gel.
Long approach:
100 µl phage fraction (section 2.2.4.1.) were combined with 400 µl ddH2O as well as 500 µl
phenol/chloroform (1:1) and mixed by thoroughly vortexing (approx. 30 sec). Afterwards, the
batch was centrifuged (13.2 krpm, 5 min) and the upper (aqueous) phase was transferred to a
new Eppendorf tube. If slimy, white junk-elements were observed in the border phase, an
additional extraction step had to be performed. For this purpose, like before, the batch was
supplemented with 500 µl phenol/chloroform (1:1), vortexed and centrifuged, yielding separation
in two phases. However, the isolated aqueous phase was combined with 500 µl chloroform,
mixed by vortexing and centrifuged (13.2 krpm, 5 min). Again the upper phase was transferred to
a fresh Eppendorf tube and mixed with 2x vol. 96 % EtOH. In order to isolate the precipitated
DNA, the batch was centrifuged at 16.4 krpm for 30 min (4° C). The supernatant was removed and
the pellet was washed with 70 % EtOH. After drying at 65° C, the viral DNA was solved in 10 µl
ddH2O. Finally, the result of phage DNA isolation was controlled by analysis of a small aliquot on
an agarose gel.
Material and Methods
77
2.2.4.3. Precipitation of viral capsid proteins
Capsid proteins were isolated from 200 µl purified phage fractions (section 2.2.4.1.) by
precipitation with 5 % TCA. After addition of the TCA, the batch was incubated on ice for 30 min,
followed by centrifugation (13 krpm, 30 min, 4° C). The resulting pellet was resuspended in 25 µl
5 mM sodium phosphate buffer and supplemented with 25 µl 2x protein sample buffer (Laemmli).
Since precipitation with TCA caused a decrease in pH, the samples had to be neutralized by
treatment with gaseous ammoniac until the color turned blue again.
2.2.4.4. Phage titre analysis and some applications
For determination of phage titres, a culture of the Nab. magadii strain to be infected was
grown to the stationary phase. Moreover, different dilutions were prepared from the phage samples
to be tested (usually 10-2, 10-4, 10-6, 10-8 and 10-10). For titre analysis, each dilution as well as the
undiluted phage fraction was plated twice. For each batch 5 ml soft agar were prepared in a test tube
and kept on a heater at 55° C until titre analysis was started. The procedure itself was performed by
supplementation of the 5 ml soft agar with 100 µl phages, 300 ml culture and, if necessary, further
additives. Quickly the batch was mixed by short vortexing and plated on NVM agar plates
(supplemented with antibiotics according to resistances of the infected culture). After one day the
rigid plates were put on 37° C and incubated for 7-10 days. Finally, the titre was evaluated by
counting the plaques on the respective plates and calculation of an average value.
In general, phage titres are performed in order to determine the concentration of phage
particles in fractions resulting from isolation. In course of this diploma work however they were
mainly applied as a part of certain experiments:
1) Testing the ability of φCh1 particles lacking gp3452 (putative tail fibre) to infect their host:
To enable comparison, titre analysis was performed with both, φCh1-ΔORF34 and the wild
type virus. The procedure was carried out according to the protocol described above.
2) Binding assay of purified gp3452 and gp3652 to Nab. magadii P3:
This experiment was performed in order to investigate a supposed reduction of the titre by
binding of gp3452. As a result, a Nab. magadii strain lacking NEP (Nab. magadii P3) had to
be used in order to prevent host-regulated digestion of external proteins. Moreover, in
addition to the 400 µl culture, different amounts of the purified proteins gp3452 and gp3652
(up to 400 µg) were added to the soft agar. 10 µl of the phage fractions in different
dilutions (10-2 – 10-8) were spotted on the respective plates (differing in the amounts of
Material and Methods
78
protein) afterwards. To achieve the required firmness of the soft agar, the amount of agar
added to the NVM was adapted if more than 2 ml protein was applied.
3) Quick test to investigate complementation of ΔORF3452:
In order to test the complementation of the deletion of ORF3452, Nab. magadii L13 cultures
carrying the plasmids pNB102-ORF341, pNB102-ORF3452 and pNB102 as well as Nab.
magadii L13 (control) were transformed with phage DNA isolated from φCh1-ΔORF34.
100 µl of the regenerated cells (undiluted, dilutions 10-2 and 10-4) as well as 300 µl of the
respective culture were added to the 5 ml soft agar and plated on NVM agar / Mev as
described above.
2.2.5. Protein methods
2.2.5.1. Preparation of crude protein extracts
For preparation of crude protein extracts from a growing culture, 1.5 ml were centrifuged at
13.2 krpm for 3 min. The supernatant was removed and the pellet was resuspended in OD600 x 75 µl
5 mM sodium phosphate buffer. Subsequently the same volume of 2x protein sample buffer
(Laemmli) was added. Before applying a sample to a protein gel, the extracts were heated at 95° C
for 10 min.
2.2.5.2. Protein expression in E. coli
For production of recombinant proteins in E. coli, 4-5 l LB supplemented with the respective
antibiotics were inoculated to an OD600 of approx. 0.1 using an overnight culture of the strain carrying
the desired gene region on a plasmid. The culture was grown, shaking at 37° C. When an OD600 of
approx. 0.3 was reached, expression was induced by addition of IPTG to a final concentration of
0.5 mM (stock: 1 M) and the culture was incubated at 37° C for another 3h. Afterwards the cells were
harvested by centrifugation (6000 rpm, 15 min, 4° C) and the supernatant was removed. The pellet
could be stored at -20° C until final use.
In order to observe the process of protein expression, crude extracts were prepared from the
culture before and after induction with IPTG as described in section 2.2.5.1 and analyzed via
SDS-PAGE.
Material and Methods
79
2.2.5.3. Protein purification under denaturing conditions
First of all, the cell pellet resulting from protein expression was solved in an appropriate
volume of buffer B (100-150 ml for cells resulting from 4-5 l culture) and stirred gently for at least 4h.
For complete lysis, the samples were sonicated approx. 5 x 2min (Power 90 %, Cycle 72). Afterwards
the lysates were centrifuged at 9000 rpm and 4° C for 20 min and the supernatant containing the
proteins was combined with 500 µl – 1 ml Ni-NTA (Quiagen)*. In order to enable binding of the
His-tagged proteins to the Ni2+ ions, the suspension was stirred over night. For purification of the
proteins, the whole lysate was applied to a column provided by Quiagen (QIAexpressionist™ Kit),
collecting the flowthrough in an Erlenmeyer flask, whereas the nickel-beads were accumulated on
the filter of the column. After washing twice with 4 ml buffer C, the proteins bound to the Ni-NTA
were eluted by addition of 6 x 500 µl buffer E. The respective fractions (2 x wash, 6 x elution) were
collected in Falcons and Eppendorf tubes, respectively. For analyzation, a small aliquot of each
fraction was mixed with an equal volume of 2x protein sample buffer (Laemmli), heated at 95° C for
10 min and applied to a protein gel as described in section 2.2.5.5.
* The exact conditions were adapted with respect to the results obtained from former attempts
2.2.5.4. Dialysis of proteins
For final use, purified proteins were dialyzed in order to remove the urea. Proteins isolated for
combination with living Nab. magadii cells (e.g. binding assays) were adjusted to high salt
concentrations and high pH by dialysis against dialysis buffer 1 and dialysis buffer 2 over night. To
achieve better results, both buffers were changed after a few hours. Proteins purified for the
production of antibodies in contrast were dialyzed against 1 x PBS, also changing the buffer after one
hour, followed by incubation over night.
2.2.5.5. SDS-PAGE
For analyzation of protein probes, they were applied to protein gels and separated in electric
fields by sodiumdodecylsulfat polyacrylamide gel electrophoresis (SDS-PAGE). This method is based
on denaturation of proteins and masking of their net charge by SDS. Hence, they are separated
according to their size exclusively.
Preparation of protein gels:
Discontinuous polyacrylamide gels (protein gels) are composed of two parts: a stacking gel
and a separation gel. They were cast using the Mini Protean 3 system provided by BioRad
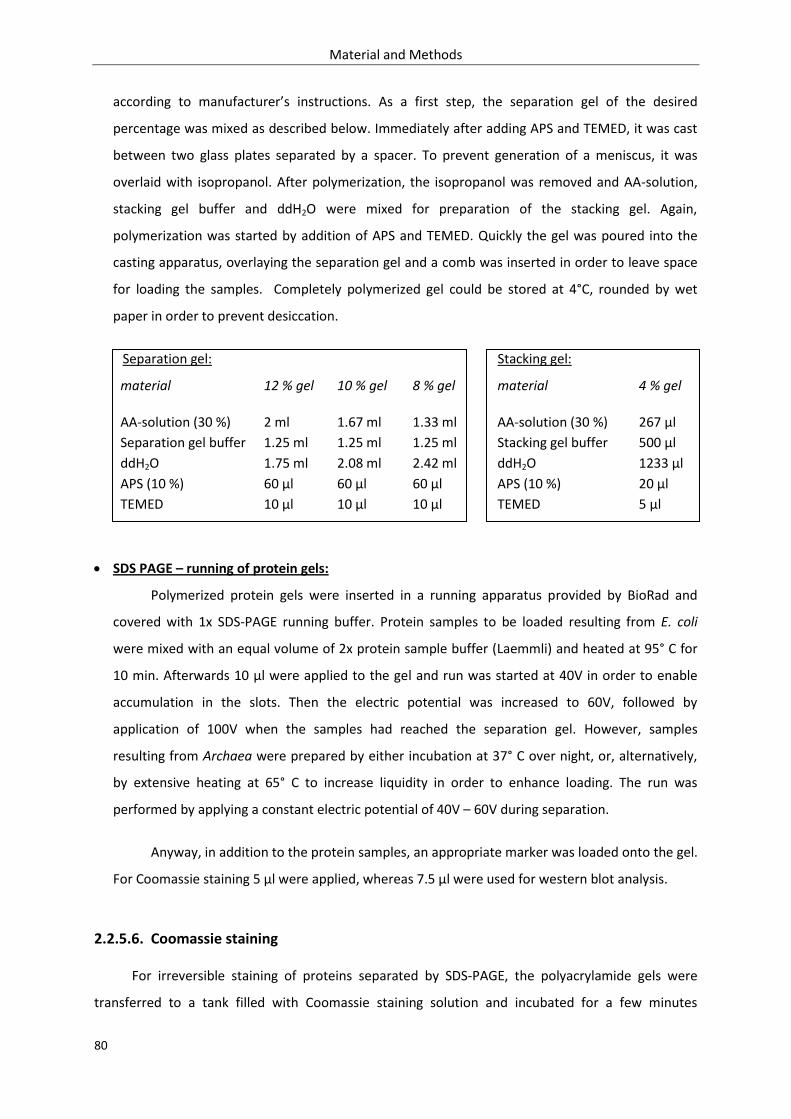
Material and Methods
80
according to manufacturer’s instructions. As a first step, the separation gel of the desired
percentage was mixed as described below. Immediately after adding APS and TEMED, it was cast
between two glass plates separated by a spacer. To prevent generation of a meniscus, it was
overlaid with isopropanol. After polymerization, the isopropanol was removed and AA-solution,
stacking gel buffer and ddH2O were mixed for preparation of the stacking gel. Again,
polymerization was started by addition of APS and TEMED. Quickly the gel was poured into the
casting apparatus, overlaying the separation gel and a comb was inserted in order to leave space
for loading the samples. Completely polymerized gel could be stored at 4°C, rounded by wet
paper in order to prevent desiccation.
Separation gel: Stacking gel:
material 12 % gel 10 % gel 8 % gel material 4 % gel
AA-solution (30 %)
Separation gel buffer
ddH2O
APS (10 %)
TEMED
2 ml
1.25 ml
1.75 ml
60 µl
10 µl
1.67 ml
1.25 ml
2.08 ml
60 µl
10 µl
1.33 ml
1.25 ml
2.42 ml
60 µl
10 µl
AA-solution (30 %)
Stacking gel buffer
ddH2O
APS (10 %)
TEMED
267 µl
500 µl
1233 µl
20 µl
5 µl
SDS PAGE – running of protein gels:
Polymerized protein gels were inserted in a running apparatus provided by BioRad and
covered with 1x SDS-PAGE running buffer. Protein samples to be loaded resulting from E. coli
were mixed with an equal volume of 2x protein sample buffer (Laemmli) and heated at 95° C for
10 min. Afterwards 10 µl were applied to the gel and run was started at 40V in order to enable
accumulation in the slots. Then the electric potential was increased to 60V, followed by
application of 100V when the samples had reached the separation gel. However, samples
resulting from Archaea were prepared by either incubation at 37° C over night, or, alternatively,
by extensive heating at 65° C to increase liquidity in order to enhance loading. The run was
performed by applying a constant electric potential of 40V – 60V during separation.
Anyway, in addition to the protein samples, an appropriate marker was loaded onto the gel.
For Coomassie staining 5 µl were applied, whereas 7.5 µl were used for western blot analysis.
2.2.5.6. Coomassie staining
For irreversible staining of proteins separated by SDS-PAGE, the polyacrylamide gels were
transferred to a tank filled with Coomassie staining solution and incubated for a few minutes
Material and Methods
81
(depending on the quality of the staining solution). Destaining was performed either in water (o/n) or
in destaining solution until the background was removed as well as possible.
2.2.5.7. Western blot analysis
Western blot analysis is based on the recognition of proteins transferred to a nitrocellulose
membrane by a specific antibody or antiserum. Usually this primary antibody is bound by a
secondary antibody coupled to a horseradish peroxidase (HRP) which can be detected as it causes
emission of light quants in the presence of H2O2 and luminol.
Transfer to a nitrocellulose membrane (blotting):
Proteins to be analyzed by western blot were loaded onto a polyacrylamide gel and
separated via SDS-PAGE as described in section 2.2.5.5. If crude extracts prepared from Archaea
were applied, the corresponding gel was incubated in water for 5 min after running in order to
remove sodium chloride. For the transfer procedure one Protran nitrocellulose membrane
(Whatman) and six pieces of Whatman paper were cut corresponding to the size of the gel (6.5 x
9 cm). Each of them was rinsed in transblot buffer and the blot was built up in a semi-dry blotting
apparatus as follows: 3 layers Whatman paper – nitrocellulose membrane – polyacrylamide gel –
further 3 layers Wathman paper. Transfer was performed at 20V for 20 min (one gel) or 30 min
(two gels), respectively. To ensure successful blotting, the membrane was shortly incubated in
Ponceau S solution, causing reversible staining. After marking visible protein ladder bands, the
blot was completely destained again with water.
Blocking:
After blotting, nitrocellulose membranes were blocked by incubation in 1x TBS/TBS-T
containing 5 % milk powder at 4° C over night (shaking), in order to prevent unspecific binding of
the antibodies.
Development of a Western blot:
The solutions and conditions applied for the development of western blots were adapted to
the properties of the antibodies. In course of this diploma work, mainly the primary antibodies α-
gp34 and α-FlaB1 were used. In both cases, western blot analysis was performed under the same
conditions. After blocking, the membrane was washed once by shaking in 1x TBS for 10 min,
followed by incubation with the first antibody solution (see section 2.1.8.1.) for 1h. Again, the blot
was washed 3 x 10 min with 1x TBS. Subsequently, the second antibody solution (α-rabbit, 1:5000
in TBS) was applied and the blot was exposed for 1h, shaking at room temperature. Finally the
Material and Methods
82
antibody solution was removed and the blot was washed three times by incubation in 1x TBS for
10 min. For detection of HRP-coupled proteins, the SuperSignal® West Pico Chemiluminescent
Substrate kit from Thermo Scientific was applied according to manufacturer’s instructions.
Immediately afterwards the blot was put in a developing cassette and X-ray hyper films provided
by Amersham Biosciences were exposed for different periods of time in the darkroom.
2.2.6. Southern blot analysis
In course of this diploma work, southern blot analysis was performed for different purposes:
1) Identification of positive clones resulting from transformation of Nab. magadii
2) Further investigation of inversion events under certain conditions
3) Verification of a homozygous φCh1- ΔORF34 deletion mutant
Anyway, this method was carried out by separation of the respective DNA samples on an
agarose gel and blotting to a nylon membrane based on capillary forces. Then the membrane was
blocked and the DNA was labeled by hybridisation with a biotinylated DNA probe. This signal was
recognized by streptavidine which was bound by another biotin molecule coupled to a horseradish
peroxidase (HRP). Hence, finally DNA bands could be visualized by the emission of light quants based
on HRP reactions in the presence of H2O2 and luminol, causing blackening of hyperfilms.
2.2.6.1. Preparation of biotinylated DNA probes
First of all a biotinylated DNA probe had to be prepared. The respective DNA was amplified by
preparative PCR and usually purified by extraction from a gel. For labeling of the probes 34 µl DNA
were denatured by heating at 95° C for 10 min, followed by incubation on ice for 5 min. Subsequently
10 µl 5x labeling mix, 5 µl dNTP mix (containing biotinylated ATP) and 1 µl Klenow fragments, all of
them representing components of the NEBlot® Phototope® Kit provided by New England BioLabs,
were added. The labeling reaction was carried out at 37° C for 3h and stopped by the addition of
0.5 µl 0.2 M EDTA (pH 8.0). Then the DNA was precipitated by mixing with 10 µl 4 M LiCl and 150 µl
96 % EtOH, incubation at -20° C for 20 min and centrifugation at 16.4 krpm for 30 min (4° C). The
resulting pellet was washed with 1 ml 70 % EtOH and dried at 65° C. Finally it was resolved in 20 µl
ddH2O.
Before adding to the membrane, the DNA probe was denatured for 5 min at 95° C.
Material and Methods
83
2.2.6.2. Separation and blotting of DNA samples to a membrane
Usually the DNA probes to be blotted were mixed with 5 µl 5x DNA loading dye containing
1 mg/ml ethidium bromide (stock: 10 mg/ml). All samples were loaded onto an agarose gel of the
desired percentage of agarose (0.8-1.5 %) and separated in an electric field as described in section
2.2.1.1. In addition, 0.5-1 µl biotinylated 2-log DNA Ladder from New England BioLabs was applied.
After separation, the DNA was analyzed under UV light and denatured by incubation of the gel in
0.4 M NaOH / 0.5 M NaCl for 30 min. Subsequently, the gel was switched to 1.5 M NaCl / 0.5 M
Tris-HCl (pH 7.5) and neutralized for 30 min. Then the DNA was transferred to an Amersham
HybondTM nylon membrane (GE Healthcare) by capillary blotting over night. For this purpose, a piece
of membrane corresponding to the size of the gel was rinsed in water and equilibrated in 10x SSC.
The blot was built up on a potest placed inside a tank as follows: 3 layers Whatman paper (the lowest
extended to the ground of the tank) – gel – membrane – further 3 layers Whatman paper – one stack
of adsorbent paper of an appropriate size. Finally the tank was filled with 10x SSC and the whole blot
was stably weighted in order to enhance transfer to the membrane. The next day successful blotting
was ensured by staining of the gel with ethidium bromide. Finally the membrane was shortly
incubated in 0.4 M NaOH and 0.2 M Tris/HCl (1 min each) and the DNA was fixed by UV-cross linking
using the Stratalink cross-linker provided by Stratagene.
2.2.6.3. Blocking and hybridisation
For blocking, the membrane was transferred to a southern blot tube which was filled with
12 ml hybridisation buffer and 120 salmon sperm DNA (100 µg/ml), placed to a hybridisation oven
and incubated at 65° C for at least 3h (rotating). Afterwards the labeled DNA probe (20 µl) was added
and incubation was continued over night.
2.2.6.4. Developing of a southern blot
Left in the southern blot tube, the membrane was washed 2 x 5 min at room temperature
using either 4x SSC / 0.1 % SDS (PCR samples) or 2x SSC / 0.1 % SDS (chromosomal DNA samples).
Then it was incubated with 0.1x SSC / 0.1 % SDS at 65° C for 2 x 15 min.
Afterwards the membrane was transferred to a small basin and developed using the
Phototope®-Star detection Kit provided by New England BioLabs. As a first step, the membrane was
washed 1 x 5 min in blocking solution (shaking), followed by 5 min incubation with a streptavidin
solution (7 ml blocking solution supplemented with 7 µl streptavidin) . Afterwards it was washed 3 x
5 min with 1x Wash solution I and exposed to biotinylated alkaline phosphatase solution (7ml

Material and Methods
84
blocking solution supplemented with 7 µl alkaline phosphatase) for 5 min. Finally the blot was
washed 1 x 5 min with blocking solution and 3 x 5 min with 1x Wash solution II. For detection,
peroxidase reaction was started by mixing of 3 ml 1x CDP-Star® dilution buffer with 6µl CDP-Star®
reagent and pipetting over the membrane for 5 min. Immediately afterwards the blot was put in a
developing cassette and X-ray hyper films provided by Amersham Biosciences were exposed for
different periods of time in the darkroom.
85
3. Results and Discussion
3.1. Deletion of φCh1 ORF34
Deletion mutants had already successfully been constructed of both, φCh1 and its host Nab
magadii. The method applied for this purpose was established in 2009 in the laboratory of Angela
Witte when Christian Derntl managed to delete the extracellular protease (NEP) of Nab. magadii L13
(Derntl, 2009). It was based on transformation of a suicide vector carrying a deletion cassette
composed of the upstream and downstream regions of the desired open reading frame as well as a
selection marker working in Nab. magadii. Integration of this deletion cassette into the archaeal
genome yielded a Nab. magadii strain lacking NEP, termed P3, representing the first ever deletion
mutant of a haloalcaliphilic archaeon (Derntl, 2009). In 2010 the same method was successfully
applied for the construction of different deletion mutants of the virus φCh1, namely ΔORF79,
ΔORF11 (structural protein E) and ΔORF93 (holin) (Selb, 2010). For this purpose the Nab. magadii
strain L11 carrying φCh1 as a prophage was used, enabling recombination events between the
deletion cassette and the corresponding regions on the phage DNA integrated into the host
chromosome. In order to eliminate the wild type variants of the desired genes in the resulting clones,
the phage particles were harvested from lysated cultures and used for reinfection of a cured
Nab. magadii strain L13. Grown on agar plates containing novobiocin, it was selected for archaeal
cells infected by mutant viruses exclusively, yielding a homozygous lysogenic Nab. magadii culture.
The corresponding phage particles could then be isolated and purified from the supernatant of
lysated cultures.
Within the course of this diploma work a deletion mutant of φCh1 ORF34 was constructed
according to the well-tried strategy described above. Yet, since a φCh1 strain lacking ORF34 and thus
the putative tail fibre protein was supposed to be characterized by a loss of infectivity, production of
a homozygous lysogenic strain could not be achieved by reinfection with a mixture of wild type and
mutant phage particles. Instead of this, wild type variants of ORF34 were removed by passaging of
the heterozygous culture and selection for the mutant version.
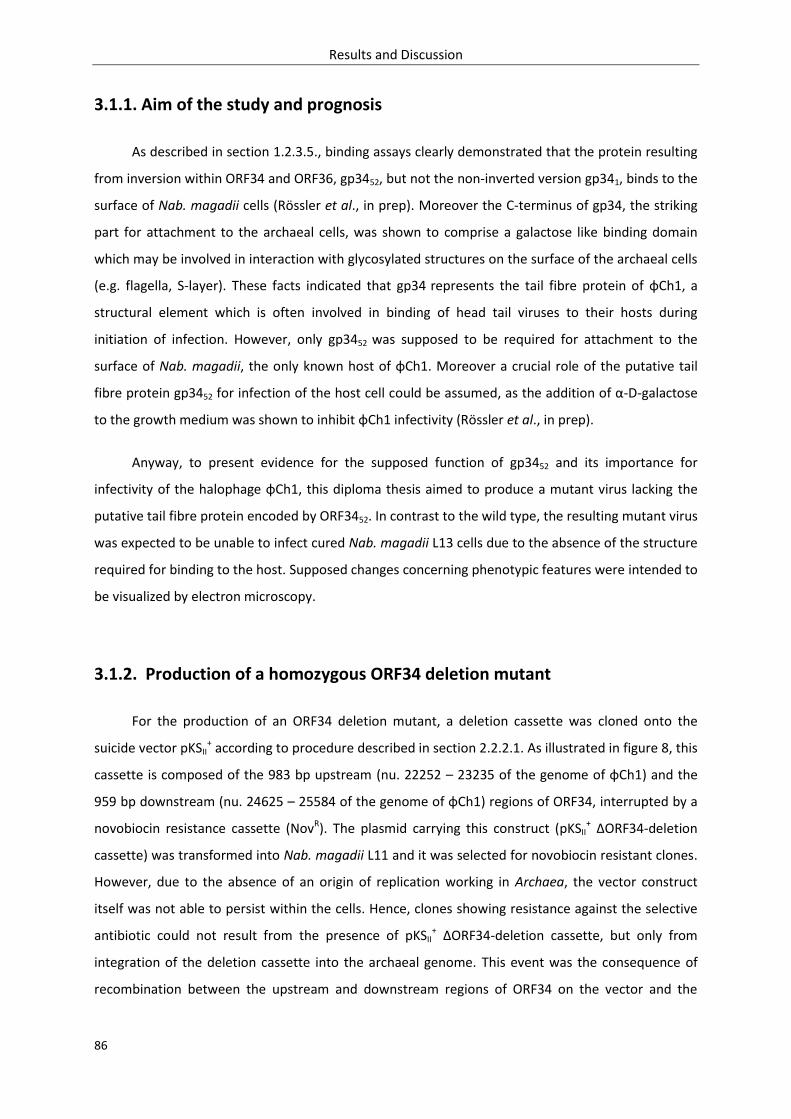
Results and Discussion
86
3.1.1. Aim of the study and prognosis
As described in section 1.2.3.5., binding assays clearly demonstrated that the protein resulting
from inversion within ORF34 and ORF36, gp3452, but not the non-inverted version gp341, binds to the
surface of Nab. magadii cells (Rössler et al., in prep). Moreover the C-terminus of gp34, the striking
part for attachment to the archaeal cells, was shown to comprise a galactose like binding domain
which may be involved in interaction with glycosylated structures on the surface of the archaeal cells
(e.g. flagella, S-layer). These facts indicated that gp34 represents the tail fibre protein of φCh1, a
structural element which is often involved in binding of head tail viruses to their hosts during
initiation of infection. However, only gp3452 was supposed to be required for attachment to the
surface of Nab. magadii, the only known host of φCh1. Moreover a crucial role of the putative tail
fibre protein gp3452 for infection of the host cell could be assumed, as the addition of α-D-galactose
to the growth medium was shown to inhibit φCh1 infectivity (Rössler et al., in prep).
Anyway, to present evidence for the supposed function of gp3452 and its importance for
infectivity of the halophage φCh1, this diploma thesis aimed to produce a mutant virus lacking the
putative tail fibre protein encoded by ORF3452. In contrast to the wild type, the resulting mutant virus
was expected to be unable to infect cured Nab. magadii L13 cells due to the absence of the structure
required for binding to the host. Supposed changes concerning phenotypic features were intended to
be visualized by electron microscopy.
3.1.2. Production of a homozygous ORF34 deletion mutant
For the production of an ORF34 deletion mutant, a deletion cassette was cloned onto the
suicide vector pKSII+ according to procedure described in section 2.2.2.1. As illustrated in figure 8, this
cassette is composed of the 983 bp upstream (nu. 22252 – 23235 of the genome of φCh1) and the
959 bp downstream (nu. 24625 – 25584 of the genome of φCh1) regions of ORF34, interrupted by a
novobiocin resistance cassette (NovR). The plasmid carrying this construct (pKSII+ ΔORF34-deletion
cassette) was transformed into Nab. magadii L11 and it was selected for novobiocin resistant clones.
However, due to the absence of an origin of replication working in Archaea, the vector construct
itself was not able to persist within the cells. Hence, clones showing resistance against the selective
antibiotic could not result from the presence of pKSII+ ΔORF34-deletion cassette, but only from
integration of the deletion cassette into the archaeal genome. This event was the consequence of
recombination between the upstream and downstream regions of ORF34 on the vector and the
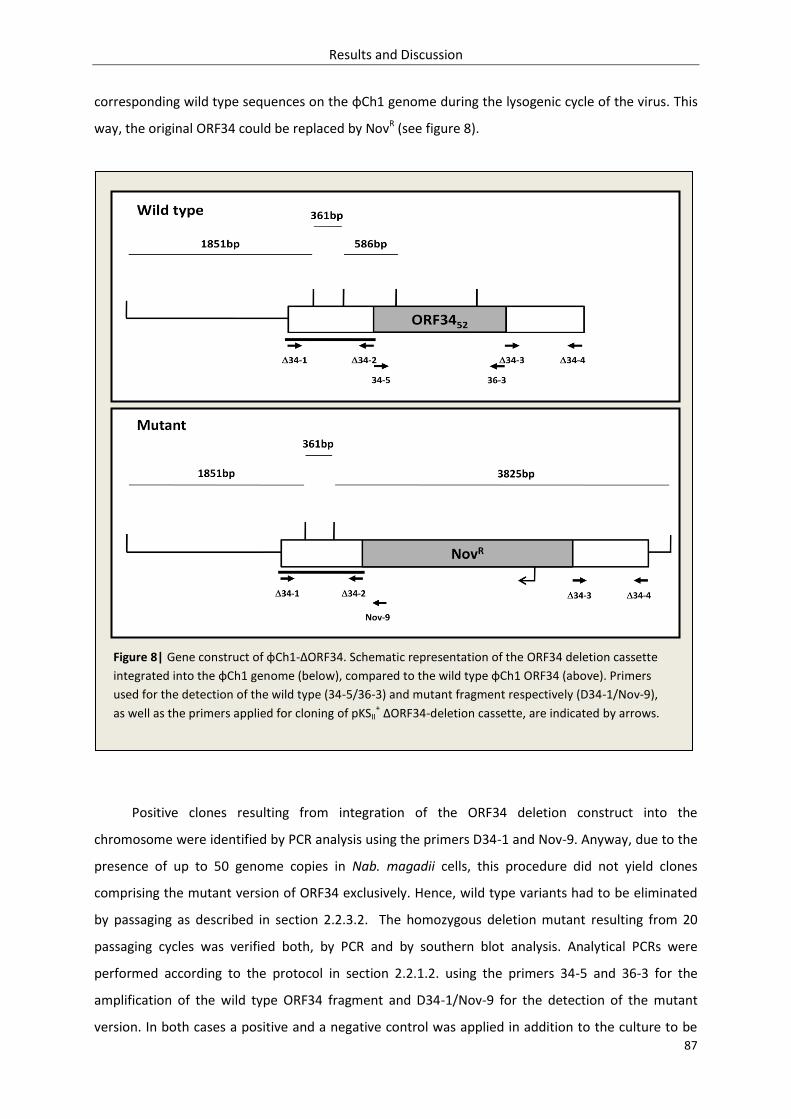
Results and Discussion
87
corresponding wild type sequences on the φCh1 genome during the lysogenic cycle of the virus. This
way, the original ORF34 could be replaced by NovR (see figure 8).
Positive clones resulting from integration of the ORF34 deletion construct into the
chromosome were identified by PCR analysis using the primers D34-1 and Nov-9. Anyway, due to the
presence of up to 50 genome copies in Nab. magadii cells, this procedure did not yield clones
comprising the mutant version of ORF34 exclusively. Hence, wild type variants had to be eliminated
by passaging as described in section 2.2.3.2. The homozygous deletion mutant resulting from 20
passaging cycles was verified both, by PCR and by southern blot analysis. Analytical PCRs were
performed according to the protocol in section 2.2.1.2. using the primers 34-5 and 36-3 for the
amplification of the wild type ORF34 fragment and D34-1/Nov-9 for the detection of the mutant
version. In both cases a positive and a negative control was applied in addition to the culture to be
Figure 8| Gene construct of φCh1-ΔORF34. Schematic representation of the ORF34 deletion cassette
integrated into the φCh1 genome (below), compared to the wild type φCh1 ORF34 (above). Primers
used for the detection of the wild type (34-5/36-3) and mutant fragment respectively (D34-1/Nov-9),
as well as the primers applied for cloning of pKSII+ ΔORF34-deletion cassette, are indicated by arrows.
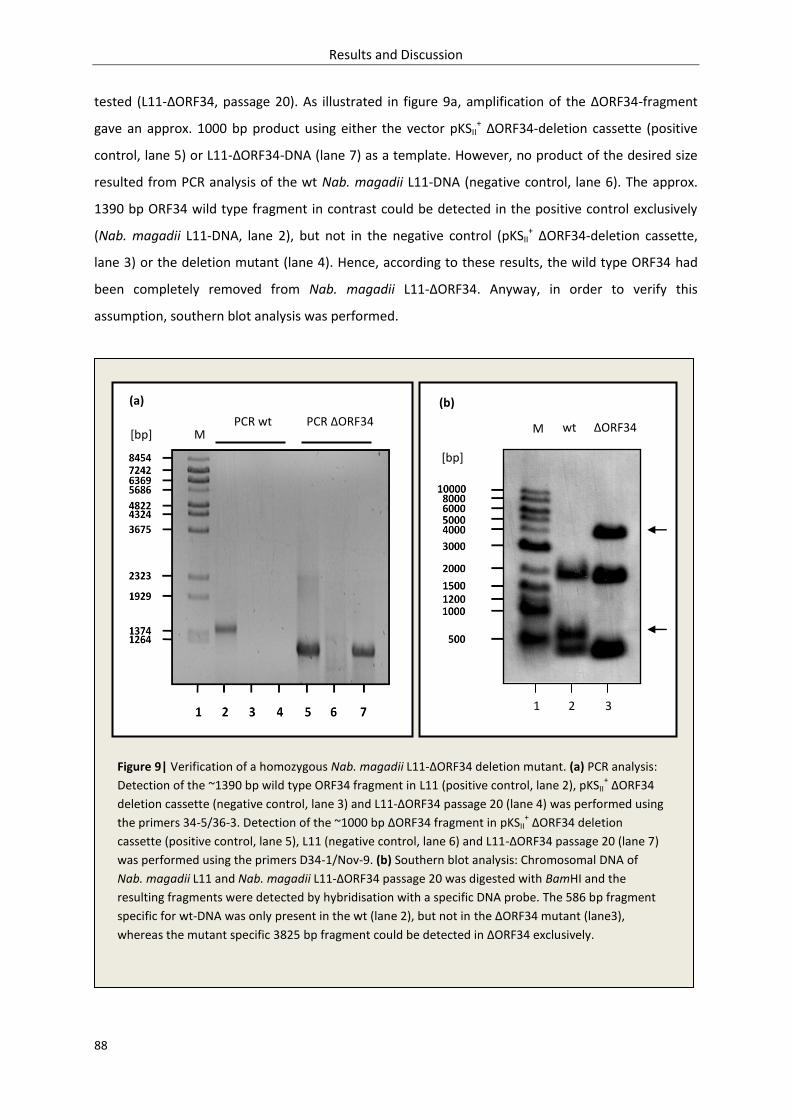
Results and Discussion
88
tested (L11-ΔORF34, passage 20). As illustrated in figure 9a, amplification of the ΔORF34-fragment
gave an approx. 1000 bp product using either the vector pKSII+ ΔORF34-deletion cassette (positive
control, lane 5) or L11-ΔORF34-DNA (lane 7) as a template. However, no product of the desired size
resulted from PCR analysis of the wt Nab. magadii L11-DNA (negative control, lane 6). The approx.
1390 bp ORF34 wild type fragment in contrast could be detected in the positive control exclusively
(Nab. magadii L11-DNA, lane 2), but not in the negative control (pKSII+ ΔORF34-deletion cassette,
lane 3) or the deletion mutant (lane 4). Hence, according to these results, the wild type ORF34 had
been completely removed from Nab. magadii L11-ΔORF34. Anyway, in order to verify this
assumption, southern blot analysis was performed.
Figure 9| Verification of a homozygous Nab. magadii L11-ΔORF34 deletion mutant. (a) PCR analysis:
Detection of the ~1390 bp wild type ORF34 fragment in L11 (positive control, lane 2), pKSII+ ΔORF34
deletion cassette (negative control, lane 3) and L11-ΔORF34 passage 20 (lane 4) was performed using
the primers 34-5/36-3. Detection of the ~1000 bp ΔORF34 fragment in pKSII+ ΔORF34 deletion
cassette (positive control, lane 5), L11 (negative control, lane 6) and L11-ΔORF34 passage 20 (lane 7)
was performed using the primers D34-1/Nov-9. (b) Southern blot analysis: Chromosomal DNA of
Nab. magadii L11 and Nab. magadii L11-ΔORF34 passage 20 was digested with BamHI and the
resulting fragments were detected by hybridisation with a specific DNA probe. The 586 bp fragment
specific for wt-DNA was only present in the wt (lane 2), but not in the ΔORF34 mutant (lane3),
whereas the mutant specific 3825 bp fragment could be detected in ΔORF34 exclusively.
(a) (b)
[bp] PCR wt PCR ΔORF34
[bp]
wt ΔORF34
1 2 3
M M
Results and Discussion
89
For southern blot analysis, chromosomal DNA was isolated from Nab. magadii L11 and Nab.
magadii L11-ΔORF34 passage 20 (see section 2.2.3.3.) and digested with BamHI as stated in section
2.2.3.2. Aliquots of both batches were separated on a 0.8 % agarose gel, blotted to a nylon
membrane (see section 2.2.6.) and hybridized with a biotinylated DNA probe specific for the 983 bp
upstream region of ORF34. The restriction pattern of Nab. magadii L11-ΔORF34 passage 20
completely correlated with the expected fragment lengths calculated for a homozygous deletion
mutant (see section 2.2.3.2), since the 361 bp, 1847 bp as well as the mutant specific 3825 bp
fragments could be detected, whereas the wt-specific 586 bp fragment was not visible (see
figure 9b). Hence, it was concluded that a homozygous Nab. magadii L11 strain lacking any wt ORF34
variants had been prepared.
3.1.3. Isolation and quantification of phage particles
In a first attempt, mutant phage particles were isolated from the corresponding culture
(Nab. magadii L11-ΔORF34) according to the protocol in section 2.2.4.1. However, in contrast to the
wild type, purification of φCh1-ΔORF34 via CsCl gradients yielded several fractions of different
densities. None of them was correlating with the usual position of the wild type phages. In order to
exclude that this fact was due to long time passaging of the culture used for purification of phage
particles, phage DNA was isolated from one fraction according to the instructions in section 2.2.4.2.
and retransformed in the cured Nab. magadii strain L13. Again a positive clone was identified by PCR
analysis using the primers D34-1 and Nov-9. The resulting culture apparently carrying φCh1-ΔORF34
as a prophage was grown to a pre-culture and used for isolation of phage particles. Again
ultracentrifugation yielded different fractions, yet application of a continuous gradient gave rise to
one fraction correlating to the position of wild type φCh1 (buoyont density n = 1.4).
Since φCh1-ΔORF34 was supposed to be characterized by a loss of infectivity, the phage
particles isolated from this deletion mutant could not be quantified by determination of the phage
titre. Hence, the presence of phage particles in the respective purification fractions was observed by
loading of an aliquot (5 µl) on an agarose gel in order to detect viral DNA (data not shown). Moreover
capsid proteins could be precipitated with TCA and analyzed by SDS-PAGE and Coomassie staining
(see section 2.2.4.3.). It has to be noted, that the numerous fractions resulting from phage isolation
yielded quite different protein patterns. Compared to the wild type φCh1, some fractions were
characterized by a reduced amount or complete lack of certain structural proteins, whereas on the
other hand in some cases additional bands were present. For example the fraction illustrated in
figure 10 seemed to lack protein H, whereas all other structural proteins were present, albeit varying
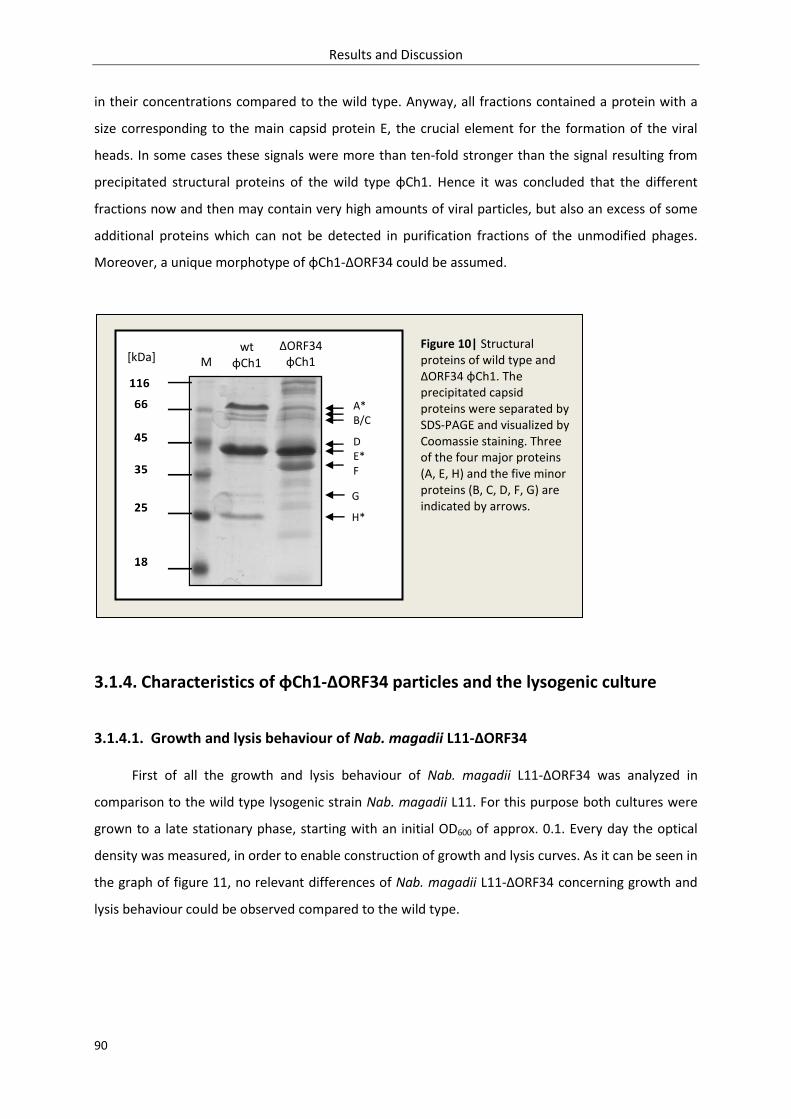
Results and Discussion
90
in their concentrations compared to the wild type. Anyway, all fractions contained a protein with a
size corresponding to the main capsid protein E, the crucial element for the formation of the viral
heads. In some cases these signals were more than ten-fold stronger than the signal resulting from
precipitated structural proteins of the wild type φCh1. Hence it was concluded that the different
fractions now and then may contain very high amounts of viral particles, but also an excess of some
additional proteins which can not be detected in purification fractions of the unmodified phages.
Moreover, a unique morphotype of φCh1-ΔORF34 could be assumed.
F
3.1.4. Characteristics of φCh1-ΔORF34 particles and the lysogenic culture
3.1.4.1. Growth and lysis behaviour of Nab. magadii L11-ΔORF34
First of all the growth and lysis behaviour of Nab. magadii L11-ΔORF34 was analyzed in
comparison to the wild type lysogenic strain Nab. magadii L11. For this purpose both cultures were
grown to a late stationary phase, starting with an initial OD600 of approx. 0.1. Every day the optical
density was measured, in order to enable construction of growth and lysis curves. As it can be seen in
the graph of figure 11, no relevant differences of Nab. magadii L11-ΔORF34 concerning growth and
lysis behaviour could be observed compared to the wild type.
Figure 10| Structural proteins of wild type and ΔORF34 φCh1. The precipitated capsid proteins were separated by SDS-PAGE and visualized by Coomassie staining. Three of the four major proteins (A, E, H) and the five minor proteins (B, C, D, F, G) are indicated by arrows.
[kDa] wt
φCh1
ΔORF34 φCh1
A* B/C
D E* F
G
H*
M
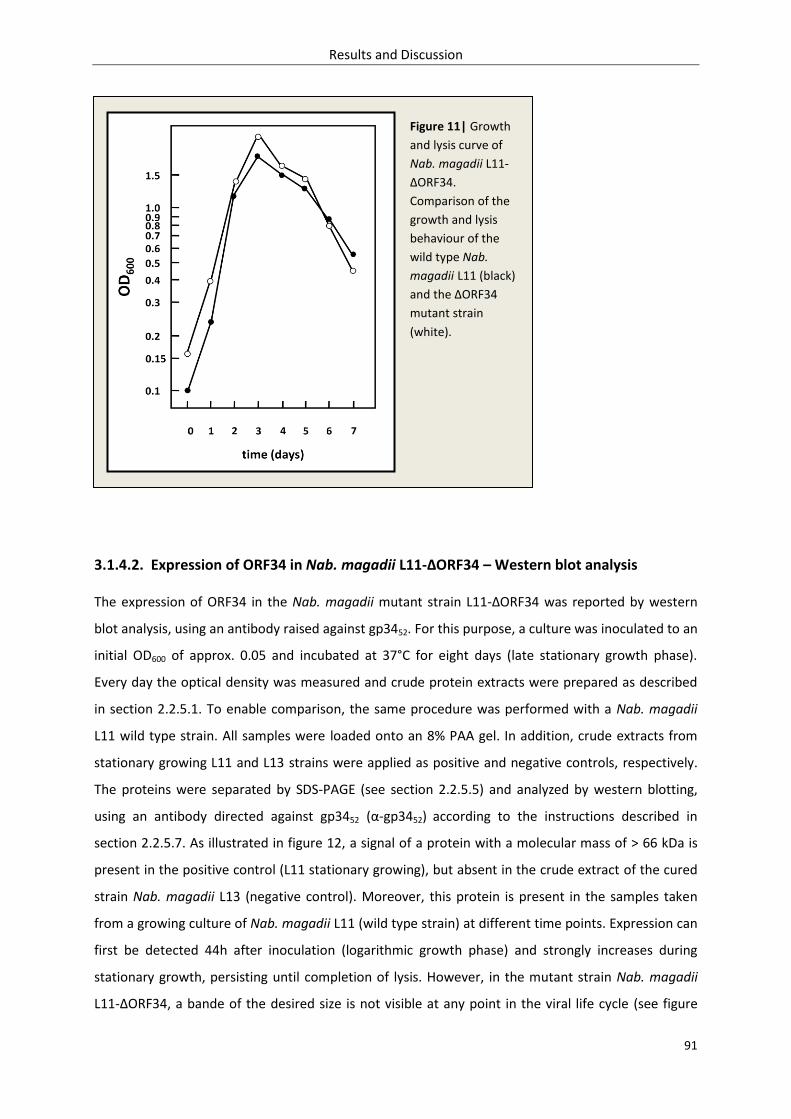
Results and Discussion
91
3.1.4.2. Expression of ORF34 in Nab. magadii L11-ΔORF34 – Western blot analysis
The expression of ORF34 in the Nab. magadii mutant strain L11-ΔORF34 was reported by western
blot analysis, using an antibody raised against gp3452. For this purpose, a culture was inoculated to an
initial OD600 of approx. 0.05 and incubated at 37°C for eight days (late stationary growth phase).
Every day the optical density was measured and crude protein extracts were prepared as described
in section 2.2.5.1. To enable comparison, the same procedure was performed with a Nab. magadii
L11 wild type strain. All samples were loaded onto an 8% PAA gel. In addition, crude extracts from
stationary growing L11 and L13 strains were applied as positive and negative controls, respectively.
The proteins were separated by SDS-PAGE (see section 2.2.5.5) and analyzed by western blotting,
using an antibody directed against gp3452 (α-gp3452) according to the instructions described in
section 2.2.5.7. As illustrated in figure 12, a signal of a protein with a molecular mass of > 66 kDa is
present in the positive control (L11 stationary growing), but absent in the crude extract of the cured
strain Nab. magadii L13 (negative control). Moreover, this protein is present in the samples taken
from a growing culture of Nab. magadii L11 (wild type strain) at different time points. Expression can
first be detected 44h after inoculation (logarithmic growth phase) and strongly increases during
stationary growth, persisting until completion of lysis. However, in the mutant strain Nab. magadii
L11-ΔORF34, a bande of the desired size is not visible at any point in the viral life cycle (see figure
Figure 11| Growth
and lysis curve of
Nab. magadii L11-
ΔORF34.
Comparison of the
growth and lysis
behaviour of the
wild type Nab.
magadii L11 (black)
and the ΔORF34
mutant strain
(white).
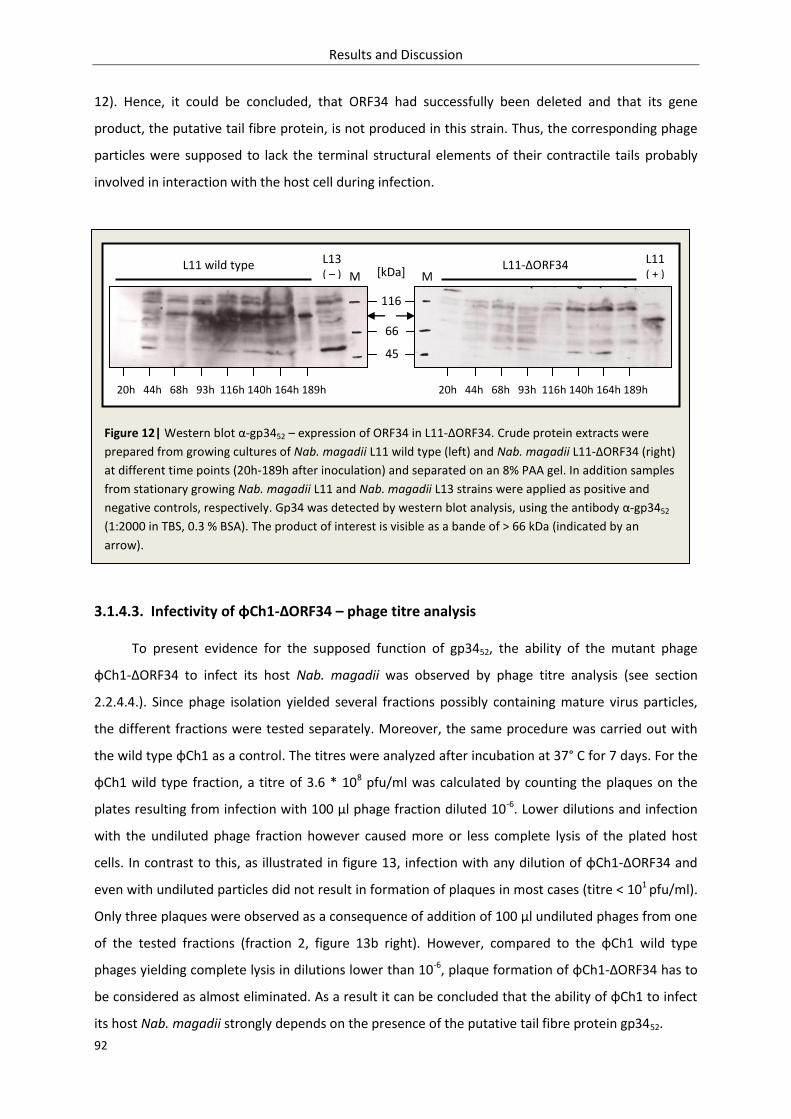
Results and Discussion
92
12). Hence, it could be concluded, that ORF34 had successfully been deleted and that its gene
product, the putative tail fibre protein, is not produced in this strain. Thus, the corresponding phage
particles were supposed to lack the terminal structural elements of their contractile tails probably
involved in interaction with the host cell during infection.
3.1.4.3. Infectivity of φCh1-ΔORF34 – phage titre analysis
To present evidence for the supposed function of gp3452, the ability of the mutant phage
φCh1-ΔORF34 to infect its host Nab. magadii was observed by phage titre analysis (see section
2.2.4.4.). Since phage isolation yielded several fractions possibly containing mature virus particles,
the different fractions were tested separately. Moreover, the same procedure was carried out with
the wild type φCh1 as a control. The titres were analyzed after incubation at 37° C for 7 days. For the
φCh1 wild type fraction, a titre of 3.6 * 108 pfu/ml was calculated by counting the plaques on the
plates resulting from infection with 100 µl phage fraction diluted 10-6. Lower dilutions and infection
with the undiluted phage fraction however caused more or less complete lysis of the plated host
cells. In contrast to this, as illustrated in figure 13, infection with any dilution of φCh1-ΔORF34 and
even with undiluted particles did not result in formation of plaques in most cases (titre < 101 pfu/ml).
Only three plaques were observed as a consequence of addition of 100 µl undiluted phages from one
of the tested fractions (fraction 2, figure 13b right). However, compared to the φCh1 wild type
phages yielding complete lysis in dilutions lower than 10-6, plaque formation of φCh1-ΔORF34 has to
be considered as almost eliminated. As a result it can be concluded that the ability of φCh1 to infect
its host Nab. magadii strongly depends on the presence of the putative tail fibre protein gp3452.
L11 wild type L11-ΔORF34 L13 ( – )
116
66
45
[kDa]
20h 44h 68h 93h 116h 140h 164h 189h 20h 44h 68h 93h 116h 140h 164h 189h
Figure 12| Western blot α-gp3452 – expression of ORF34 in L11-ΔORF34. Crude protein extracts were
prepared from growing cultures of Nab. magadii L11 wild type (left) and Nab. magadii L11-ΔORF34 (right)
at different time points (20h-189h after inoculation) and separated on an 8% PAA gel. In addition samples
from stationary growing Nab. magadii L11 and Nab. magadii L13 strains were applied as positive and
negative controls, respectively. Gp34 was detected by western blot analysis, using the antibody α-gp3452
(1:2000 in TBS, 0.3 % BSA). The product of interest is visible as a bande of > 66 kDa (indicated by an
arrow).
L11 ( + ) M M
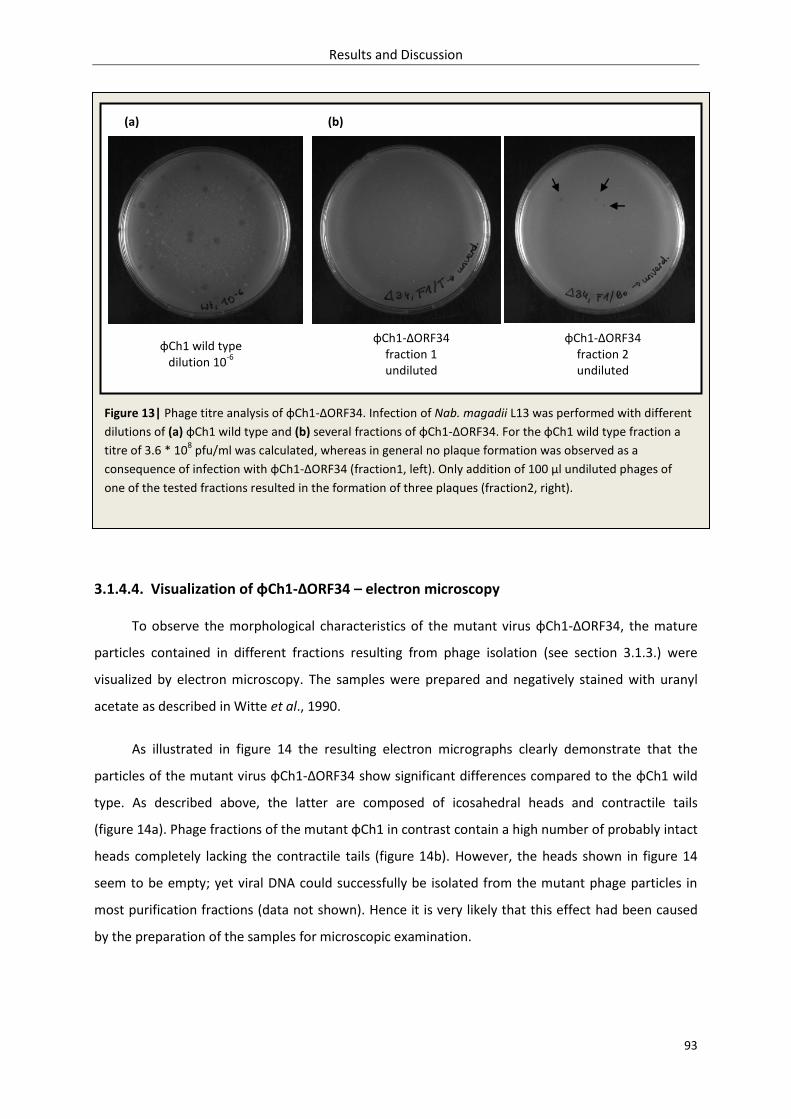
Results and Discussion
93
3.1.4.4. Visualization of φCh1-ΔORF34 – electron microscopy
To observe the morphological characteristics of the mutant virus φCh1-ΔORF34, the mature
particles contained in different fractions resulting from phage isolation (see section 3.1.3.) were
visualized by electron microscopy. The samples were prepared and negatively stained with uranyl
acetate as described in Witte et al., 1990.
As illustrated in figure 14 the resulting electron micrographs clearly demonstrate that the
particles of the mutant virus φCh1-ΔORF34 show significant differences compared to the φCh1 wild
type. As described above, the latter are composed of icosahedral heads and contractile tails
(figure 14a). Phage fractions of the mutant φCh1 in contrast contain a high number of probably intact
heads completely lacking the contractile tails (figure 14b). However, the heads shown in figure 14
seem to be empty; yet viral DNA could successfully be isolated from the mutant phage particles in
most purification fractions (data not shown). Hence it is very likely that this effect had been caused
by the preparation of the samples for microscopic examination.
Figure 13| Phage titre analysis of φCh1-ΔORF34. Infection of Nab. magadii L13 was performed with different
dilutions of (a) φCh1 wild type and (b) several fractions of φCh1-ΔORF34. For the φCh1 wild type fraction a
titre of 3.6 * 108 pfu/ml was calculated, whereas in general no plaque formation was observed as a
consequence of infection with φCh1-ΔORF34 (fraction1, left). Only addition of 100 µl undiluted phages of
one of the tested fractions resulted in the formation of three plaques (fraction2, right).
φCh1 wild type dilution 10
-6
φCh1-ΔORF34 fraction 1 undiluted
φCh1-ΔORF34 fraction 2 undiluted
(a) (b)
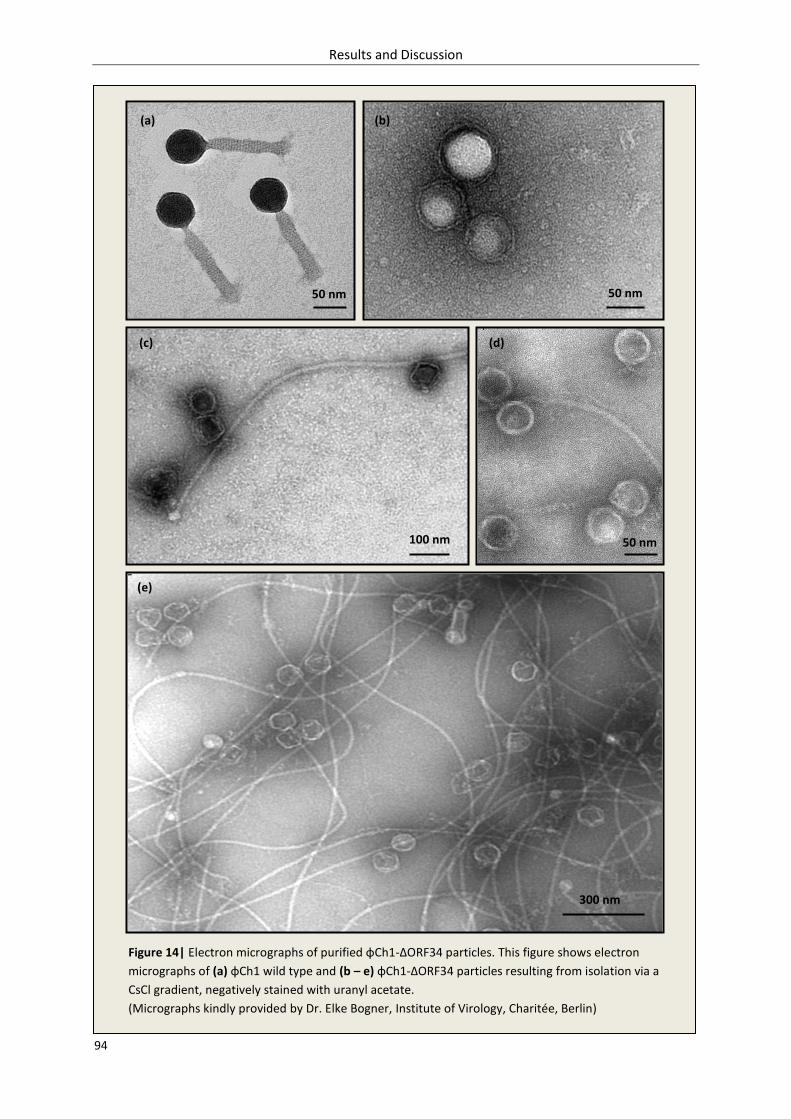
Results and Discussion
94
Figure 14| Electron micrographs of purified φCh1-ΔORF34 particles. This figure shows electron
micrographs of (a) φCh1 wild type and (b – e) φCh1-ΔORF34 particles resulting from isolation via a
CsCl gradient, negatively stained with uranyl acetate.
(Micrographs kindly provided by Dr. Elke Bogner, Institute of Virology, Charitée, Berlin)
(a)
(c) (d)
(e)
300 nm
50 nm
(b)
50 nm
50 nm 100 nm
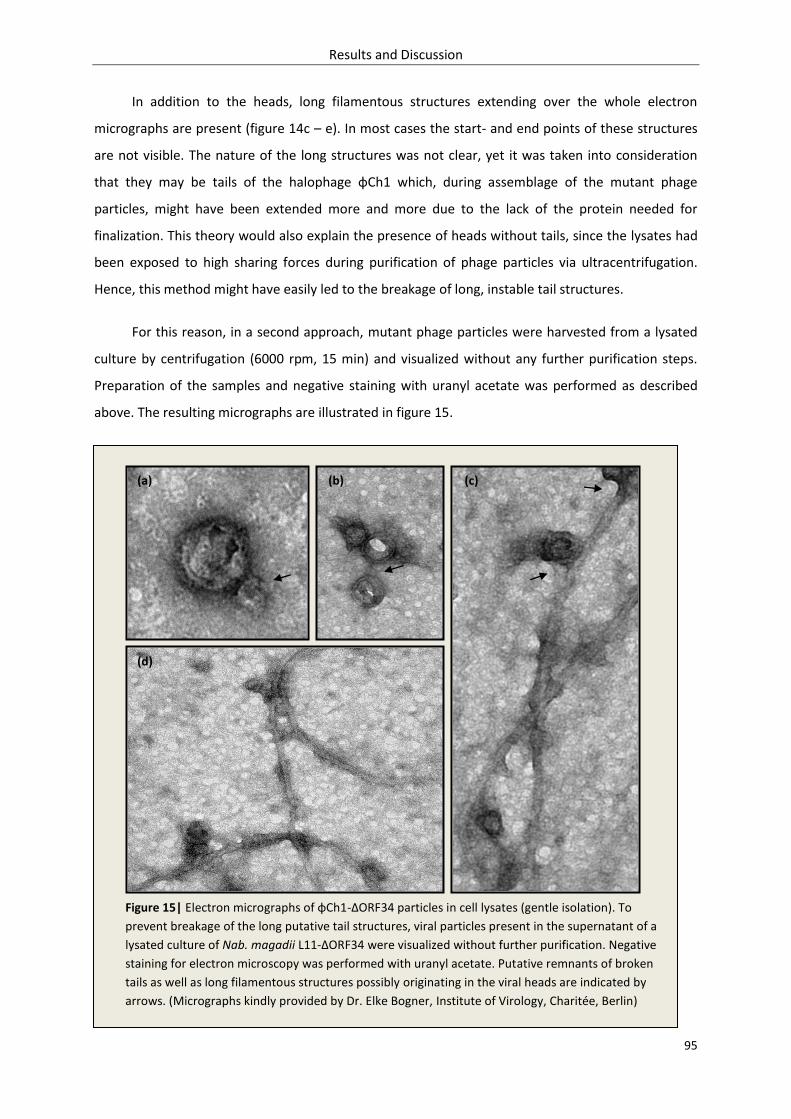
Results and Discussion
95
In addition to the heads, long filamentous structures extending over the whole electron
micrographs are present (figure 14c – e). In most cases the start- and end points of these structures
are not visible. The nature of the long structures was not clear, yet it was taken into consideration
that they may be tails of the halophage φCh1 which, during assemblage of the mutant phage
particles, might have been extended more and more due to the lack of the protein needed for
finalization. This theory would also explain the presence of heads without tails, since the lysates had
been exposed to high sharing forces during purification of phage particles via ultracentrifugation.
Hence, this method might have easily led to the breakage of long, instable tail structures.
For this reason, in a second approach, mutant phage particles were harvested from a lysated
culture by centrifugation (6000 rpm, 15 min) and visualized without any further purification steps.
Preparation of the samples and negative staining with uranyl acetate was performed as described
above. The resulting micrographs are illustrated in figure 15.
Figure 15| Electron micrographs of φCh1-ΔORF34 particles in cell lysates (gentle isolation). To
prevent breakage of the long putative tail structures, viral particles present in the supernatant of a
lysated culture of Nab. magadii L11-ΔORF34 were visualized without further purification. Negative
staining for electron microscopy was performed with uranyl acetate. Putative remnants of broken
tails as well as long filamentous structures possibly originating in the viral heads are indicated by
arrows. (Micrographs kindly provided by Dr. Elke Bogner, Institute of Virology, Charitée, Berlin)
(d)
(c) (b) (a)
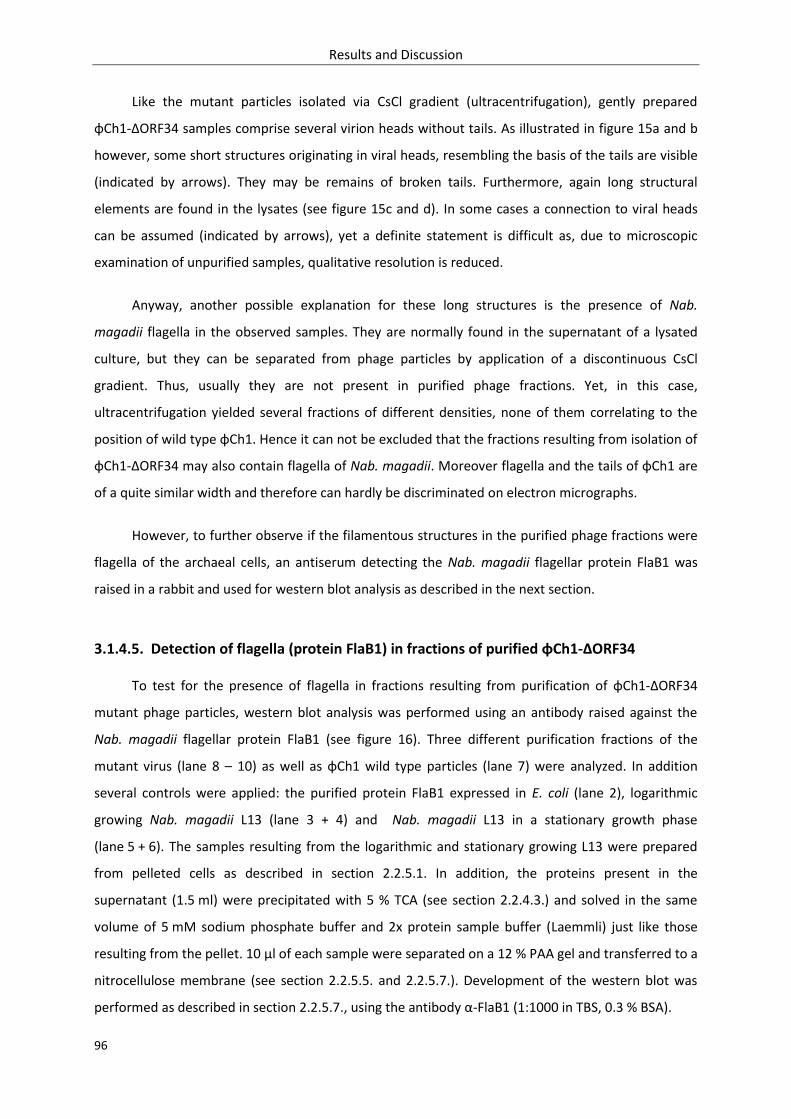
Results and Discussion
96
Like the mutant particles isolated via CsCl gradient (ultracentrifugation), gently prepared
φCh1-ΔORF34 samples comprise several virion heads without tails. As illustrated in figure 15a and b
however, some short structures originating in viral heads, resembling the basis of the tails are visible
(indicated by arrows). They may be remains of broken tails. Furthermore, again long structural
elements are found in the lysates (see figure 15c and d). In some cases a connection to viral heads
can be assumed (indicated by arrows), yet a definite statement is difficult as, due to microscopic
examination of unpurified samples, qualitative resolution is reduced.
Anyway, another possible explanation for these long structures is the presence of Nab.
magadii flagella in the observed samples. They are normally found in the supernatant of a lysated
culture, but they can be separated from phage particles by application of a discontinuous CsCl
gradient. Thus, usually they are not present in purified phage fractions. Yet, in this case,
ultracentrifugation yielded several fractions of different densities, none of them correlating to the
position of wild type φCh1. Hence it can not be excluded that the fractions resulting from isolation of
φCh1-ΔORF34 may also contain flagella of Nab. magadii. Moreover flagella and the tails of φCh1 are
of a quite similar width and therefore can hardly be discriminated on electron micrographs.
However, to further observe if the filamentous structures in the purified phage fractions were
flagella of the archaeal cells, an antiserum detecting the Nab. magadii flagellar protein FlaB1 was
raised in a rabbit and used for western blot analysis as described in the next section.
3.1.4.5. Detection of flagella (protein FlaB1) in fractions of purified φCh1-ΔORF34
To test for the presence of flagella in fractions resulting from purification of φCh1-ΔORF34
mutant phage particles, western blot analysis was performed using an antibody raised against the
Nab. magadii flagellar protein FlaB1 (see figure 16). Three different purification fractions of the
mutant virus (lane 8 – 10) as well as φCh1 wild type particles (lane 7) were analyzed. In addition
several controls were applied: the purified protein FlaB1 expressed in E. coli (lane 2), logarithmic
growing Nab. magadii L13 (lane 3 + 4) and Nab. magadii L13 in a stationary growth phase
(lane 5 + 6). The samples resulting from the logarithmic and stationary growing L13 were prepared
from pelleted cells as described in section 2.2.5.1. In addition, the proteins present in the
supernatant (1.5 ml) were precipitated with 5 % TCA (see section 2.2.4.3.) and solved in the same
volume of 5 mM sodium phosphate buffer and 2x protein sample buffer (Laemmli) just like those
resulting from the pellet. 10 µl of each sample were separated on a 12 % PAA gel and transferred to a
nitrocellulose membrane (see section 2.2.5.5. and 2.2.5.7.). Development of the western blot was
performed as described in section 2.2.5.7., using the antibody α-FlaB1 (1:1000 in TBS, 0.3 % BSA).
Results and Discussion
97
As illustrated in figure 16, a bande corresponding to the approx. 30 kDa protein FlaB1 is caused
by the sample resulting from expression in E. coli (lane 2). No signal of this size can be found in the
phage fractions, yet it is also missing in archaeal protein extracts, both, the ones resulting from the
pellets (lanes 3 + 5), and those from the supernatants (lanes 4 + 6). Hence, it has to be assumed that
the FlaB1 expressed in Archaea differs in its properties and thus is changed in its mobility. As the
flagella are supposed to predominate in the supernatant, rather than in the pellet after
centrifugation, they are probably represented by the approx. 43 kDa bande visible in the samples
from Nab. magadii L13 (lane 4 + 6). A product of an equal size is also found in samples resulting from
purification of φCh1-ΔORF34 particles (lane 8 – 10). Yet, also separation of wild type φCh1 particles
yields a signal at a similar position (lane 7). As a result, based on this approach the presence of
Nab. magadii flagella in purification fractions of φCh1-ΔORF34 particles can neither be excluded nor
definitely verified. However, further studies are necessary to present evidence for the nature of the
long filamentous structures visible on the electron micrographs.
45
66
[kDa]
116
25
35
Figure 16| Western blot α-FlaB1 – analysis of phage fractions. To detect flagella of Nab.
magadii in fractions of purified φCh1-ΔORF34 particles, western blot analysis was
performed using the antibody α-FlaB1 (1:1000 in TBS, 0.3 % BSA). 10 µl of the respective
samples were applied to a 12 % PAA gel: purified FlaB1 (lane 2); pellet (lane 3) and
supernatant (lane 4) of a logarithmic growing Nab. magadii L13; pellet (lane 5) and
supernatant (lane 6) of a stationary growing Nab. magadii L13; purified φCh1 wild type
particles (lane 7); different fractions of purified φCh1-ΔORF34 (lane 8 – 10).
L13 log. L13 stat.
pellet su. pellet su.
φCh1-ΔORF34
1 2 3 4 5 6 7 8 9 10
φCh1 wt
1 2 3
FlaB1 purif. M
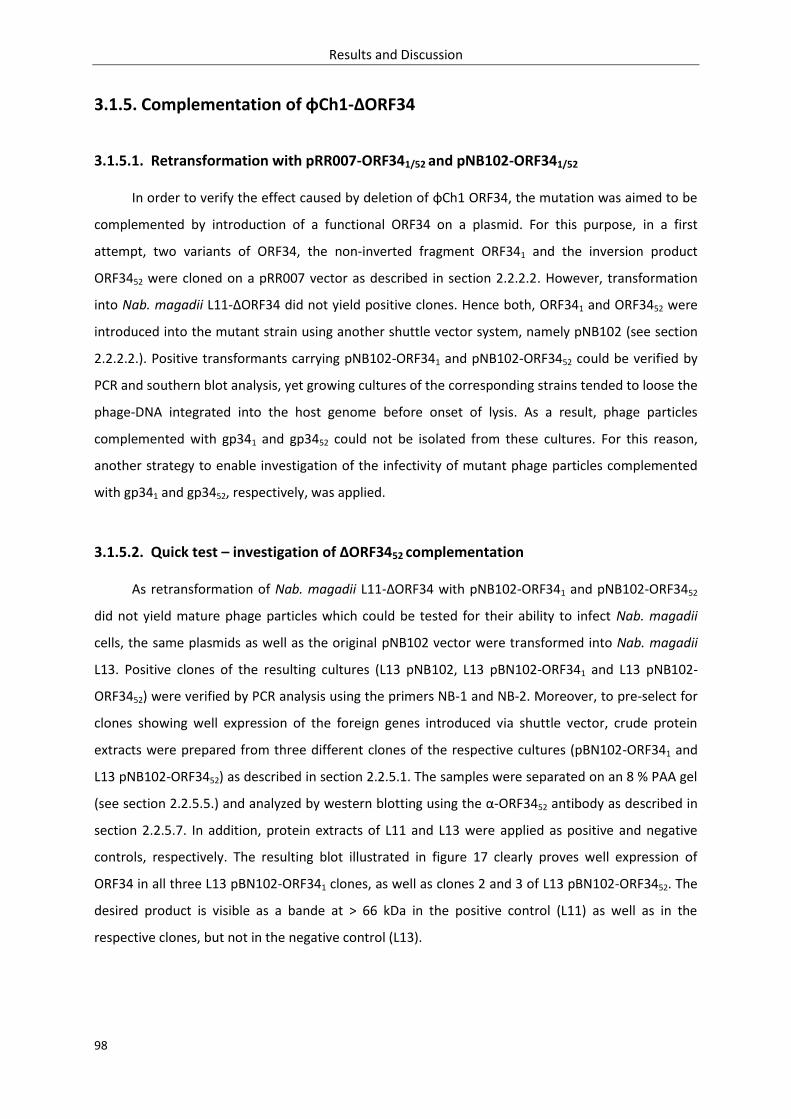
Results and Discussion
98
3.1.5. Complementation of φCh1-ΔORF34
3.1.5.1. Retransformation with pRR007-ORF341/52 and pNB102-ORF341/52
In order to verify the effect caused by deletion of φCh1 ORF34, the mutation was aimed to be
complemented by introduction of a functional ORF34 on a plasmid. For this purpose, in a first
attempt, two variants of ORF34, the non-inverted fragment ORF341 and the inversion product
ORF3452 were cloned on a pRR007 vector as described in section 2.2.2.2. However, transformation
into Nab. magadii L11-ΔORF34 did not yield positive clones. Hence both, ORF341 and ORF3452 were
introduced into the mutant strain using another shuttle vector system, namely pNB102 (see section
2.2.2.2.). Positive transformants carrying pNB102-ORF341 and pNB102-ORF3452 could be verified by
PCR and southern blot analysis, yet growing cultures of the corresponding strains tended to loose the
phage-DNA integrated into the host genome before onset of lysis. As a result, phage particles
complemented with gp341 and gp3452 could not be isolated from these cultures. For this reason,
another strategy to enable investigation of the infectivity of mutant phage particles complemented
with gp341 and gp3452, respectively, was applied.
3.1.5.2. Quick test – investigation of ΔORF3452 complementation
As retransformation of Nab. magadii L11-ΔORF34 with pNB102-ORF341 and pNB102-ORF3452
did not yield mature phage particles which could be tested for their ability to infect Nab. magadii
cells, the same plasmids as well as the original pNB102 vector were transformed into Nab. magadii
L13. Positive clones of the resulting cultures (L13 pNB102, L13 pBN102-ORF341 and L13 pNB102-
ORF3452) were verified by PCR analysis using the primers NB-1 and NB-2. Moreover, to pre-select for
clones showing well expression of the foreign genes introduced via shuttle vector, crude protein
extracts were prepared from three different clones of the respective cultures (pBN102-ORF341 and
L13 pNB102-ORF3452) as described in section 2.2.5.1. The samples were separated on an 8 % PAA gel
(see section 2.2.5.5.) and analyzed by western blotting using the α-ORF3452 antibody as described in
section 2.2.5.7. In addition, protein extracts of L11 and L13 were applied as positive and negative
controls, respectively. The resulting blot illustrated in figure 17 clearly proves well expression of
ORF34 in all three L13 pBN102-ORF341 clones, as well as clones 2 and 3 of L13 pBN102-ORF3452. The
desired product is visible as a bande at > 66 kDa in the positive control (L11) as well as in the
respective clones, but not in the negative control (L13).
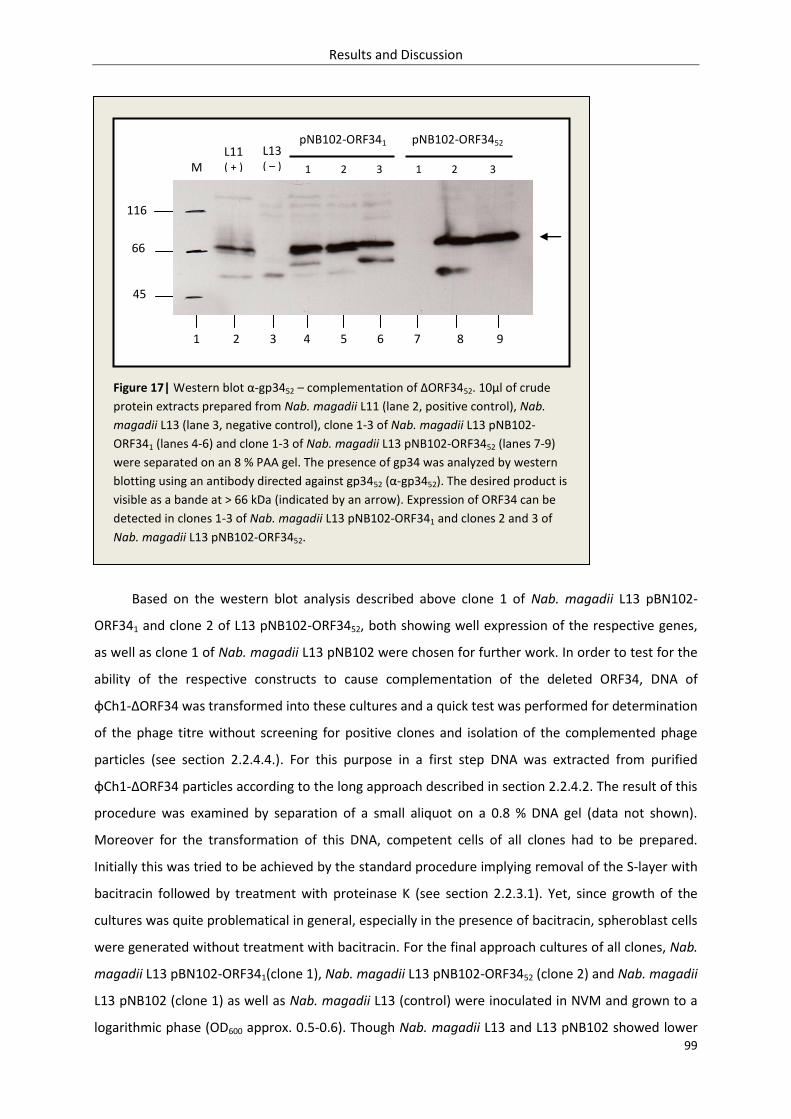
Results and Discussion
99
Based on the western blot analysis described above clone 1 of Nab. magadii L13 pBN102-
ORF341 and clone 2 of L13 pNB102-ORF3452, both showing well expression of the respective genes,
as well as clone 1 of Nab. magadii L13 pNB102 were chosen for further work. In order to test for the
ability of the respective constructs to cause complementation of the deleted ORF34, DNA of
φCh1-ΔORF34 was transformed into these cultures and a quick test was performed for determination
of the phage titre without screening for positive clones and isolation of the complemented phage
particles (see section 2.2.4.4.). For this purpose in a first step DNA was extracted from purified
φCh1-ΔORF34 particles according to the long approach described in section 2.2.4.2. The result of this
procedure was examined by separation of a small aliquot on a 0.8 % DNA gel (data not shown).
Moreover for the transformation of this DNA, competent cells of all clones had to be prepared.
Initially this was tried to be achieved by the standard procedure implying removal of the S-layer with
bacitracin followed by treatment with proteinase K (see section 2.2.3.1). Yet, since growth of the
cultures was quite problematical in general, especially in the presence of bacitracin, spheroblast cells
were generated without treatment with bacitracin. For the final approach cultures of all clones, Nab.
magadii L13 pBN102-ORF341(clone 1), Nab. magadii L13 pNB102-ORF3452 (clone 2) and Nab. magadii
L13 pNB102 (clone 1) as well as Nab. magadii L13 (control) were inoculated in NVM and grown to a
logarithmic phase (OD600 approx. 0.5-0.6). Though Nab. magadii L13 and L13 pNB102 showed lower
116
66
45
1 2 3 1 2 3
pNB102-ORF341 pNB102-ORF3452 L11 ( + )
L13 ( – )
Figure 17| Western blot α-gp3452 – complementation of ΔORF3452. 10µl of crude
protein extracts prepared from Nab. magadii L11 (lane 2, positive control), Nab.
magadii L13 (lane 3, negative control), clone 1-3 of Nab. magadii L13 pNB102-
ORF341 (lanes 4-6) and clone 1-3 of Nab. magadii L13 pNB102-ORF3452 (lanes 7-9)
were separated on an 8 % PAA gel. The presence of gp34 was analyzed by western
blotting using an antibody directed against gp3452 (α-gp3452). The desired product is
visible as a bande at > 66 kDa (indicated by an arrow). Expression of ORF34 can be
detected in clones 1-3 of Nab. magadii L13 pNB102-ORF341 and clones 2 and 3 of
Nab. magadii L13 pNB102-ORF3452.
1 2 3 4 5 6 7 8 9
M
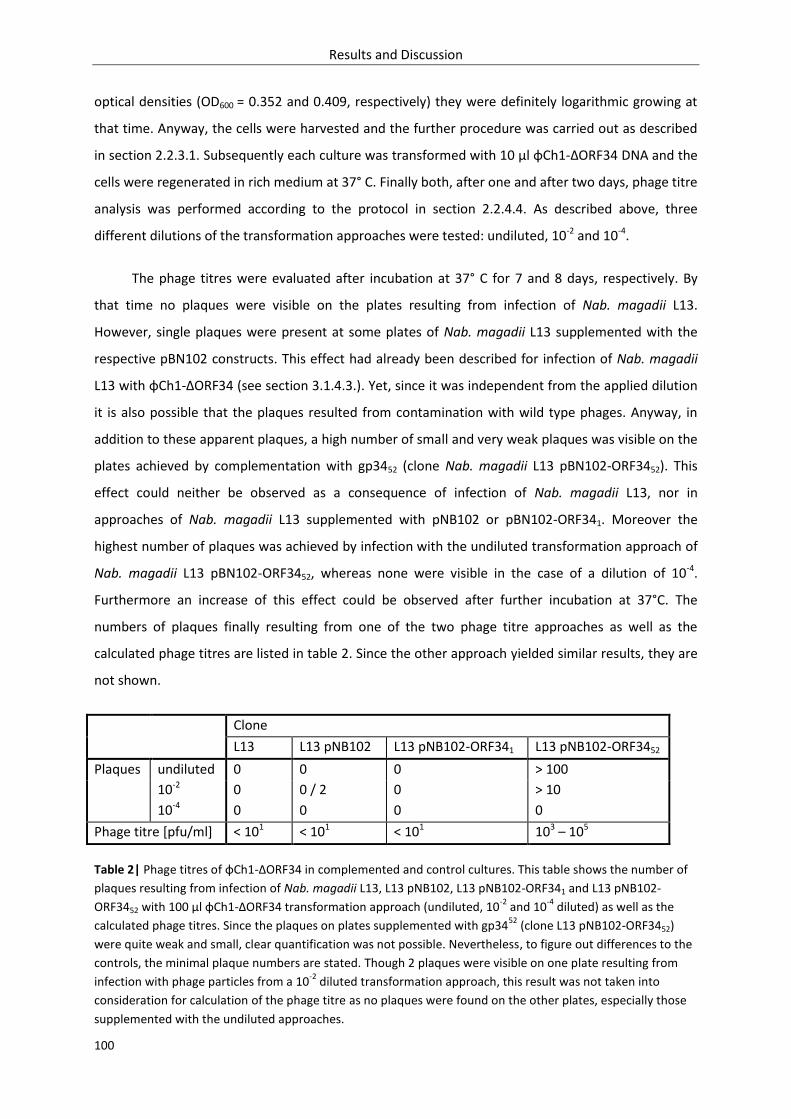
Results and Discussion
100
optical densities (OD600 = 0.352 and 0.409, respectively) they were definitely logarithmic growing at
that time. Anyway, the cells were harvested and the further procedure was carried out as described
in section 2.2.3.1. Subsequently each culture was transformed with 10 µl φCh1-ΔORF34 DNA and the
cells were regenerated in rich medium at 37° C. Finally both, after one and after two days, phage titre
analysis was performed according to the protocol in section 2.2.4.4. As described above, three
different dilutions of the transformation approaches were tested: undiluted, 10-2 and 10-4.
The phage titres were evaluated after incubation at 37° C for 7 and 8 days, respectively. By
that time no plaques were visible on the plates resulting from infection of Nab. magadii L13.
However, single plaques were present at some plates of Nab. magadii L13 supplemented with the
respective pBN102 constructs. This effect had already been described for infection of Nab. magadii
L13 with φCh1-ΔORF34 (see section 3.1.4.3.). Yet, since it was independent from the applied dilution
it is also possible that the plaques resulted from contamination with wild type phages. Anyway, in
addition to these apparent plaques, a high number of small and very weak plaques was visible on the
plates achieved by complementation with gp3452 (clone Nab. magadii L13 pBN102-ORF3452). This
effect could neither be observed as a consequence of infection of Nab. magadii L13, nor in
approaches of Nab. magadii L13 supplemented with pNB102 or pBN102-ORF341. Moreover the
highest number of plaques was achieved by infection with the undiluted transformation approach of
Nab. magadii L13 pBN102-ORF3452, whereas none were visible in the case of a dilution of 10-4.
Furthermore an increase of this effect could be observed after further incubation at 37°C. The
numbers of plaques finally resulting from one of the two phage titre approaches as well as the
calculated phage titres are listed in table 2. Since the other approach yielded similar results, they are
not shown.
Clone
L13 L13 pNB102 L13 pNB102-ORF341 L13 pNB102-ORF3452
Plaques undiluted 0 0 0 > 100
10-2 0 0 / 2 0 > 10
10-4 0 0 0 0
Phage titre [pfu/ml] < 101 < 101 < 101 103 – 105
Table 2| Phage titres of φCh1-ΔORF34 in complemented and control cultures. This table shows the number of
plaques resulting from infection of Nab. magadii L13, L13 pNB102, L13 pNB102-ORF341 and L13 pNB102-
ORF3452 with 100 µl φCh1-ΔORF34 transformation approach (undiluted, 10-2
and 10-4
diluted) as well as the
calculated phage titres. Since the plaques on plates supplemented with gp3452
(clone L13 pNB102-ORF3452)
were quite weak and small, clear quantification was not possible. Nevertheless, to figure out differences to the
controls, the minimal plaque numbers are stated. Though 2 plaques were visible on one plate resulting from
infection with phage particles from a 10-2
diluted transformation approach, this result was not taken into
consideration for calculation of the phage titre as no plaques were found on the other plates, especially those
supplemented with the undiluted approaches.
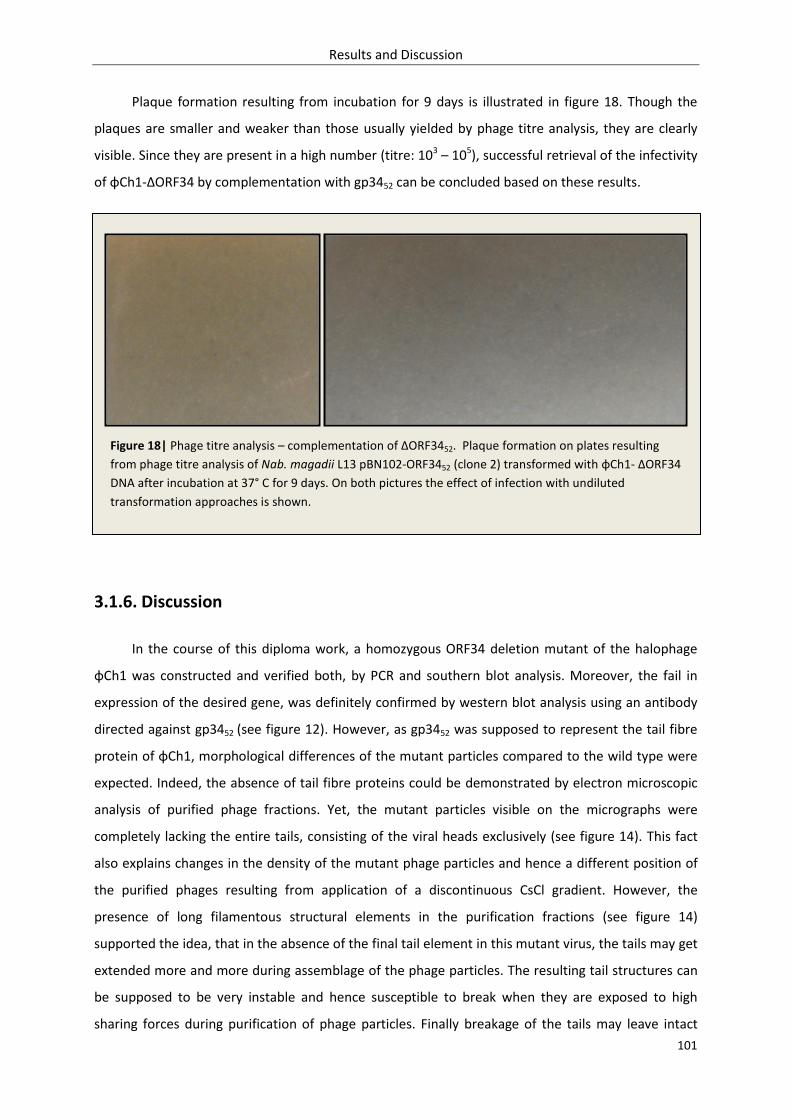
Results and Discussion
101
Plaque formation resulting from incubation for 9 days is illustrated in figure 18. Though the
plaques are smaller and weaker than those usually yielded by phage titre analysis, they are clearly
visible. Since they are present in a high number (titre: 103 – 105), successful retrieval of the infectivity
of φCh1-ΔORF34 by complementation with gp3452 can be concluded based on these results.
3.1.6. Discussion
In the course of this diploma work, a homozygous ORF34 deletion mutant of the halophage
φCh1 was constructed and verified both, by PCR and southern blot analysis. Moreover, the fail in
expression of the desired gene, was definitely confirmed by western blot analysis using an antibody
directed against gp3452 (see figure 12). However, as gp3452 was supposed to represent the tail fibre
protein of φCh1, morphological differences of the mutant particles compared to the wild type were
expected. Indeed, the absence of tail fibre proteins could be demonstrated by electron microscopic
analysis of purified phage fractions. Yet, the mutant particles visible on the micrographs were
completely lacking the entire tails, consisting of the viral heads exclusively (see figure 14). This fact
also explains changes in the density of the mutant phage particles and hence a different position of
the purified phages resulting from application of a discontinuous CsCl gradient. However, the
presence of long filamentous structural elements in the purification fractions (see figure 14)
supported the idea, that in the absence of the final tail element in this mutant virus, the tails may get
extended more and more during assemblage of the phage particles. The resulting tail structures can
be supposed to be very instable and hence susceptible to break when they are exposed to high
sharing forces during purification of phage particles. Finally breakage of the tails may leave intact
Figure 18| Phage titre analysis – complementation of ΔORF3452. Plaque formation on plates resulting
from phage titre analysis of Nab. magadii L13 pBN102-ORF3452 (clone 2) transformed with φCh1- ΔORF34
DNA after incubation at 37° C for 9 days. On both pictures the effect of infection with undiluted
transformation approaches is shown.
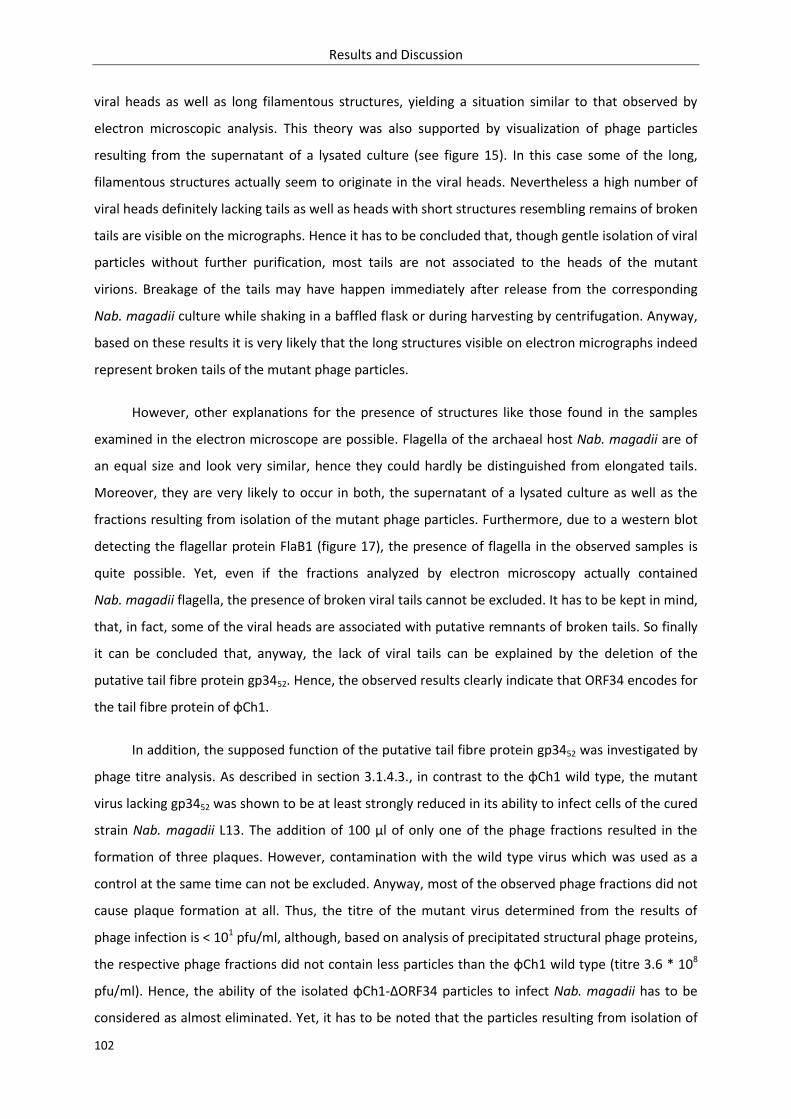
Results and Discussion
102
viral heads as well as long filamentous structures, yielding a situation similar to that observed by
electron microscopic analysis. This theory was also supported by visualization of phage particles
resulting from the supernatant of a lysated culture (see figure 15). In this case some of the long,
filamentous structures actually seem to originate in the viral heads. Nevertheless a high number of
viral heads definitely lacking tails as well as heads with short structures resembling remains of broken
tails are visible on the micrographs. Hence it has to be concluded that, though gentle isolation of viral
particles without further purification, most tails are not associated to the heads of the mutant
virions. Breakage of the tails may have happen immediately after release from the corresponding
Nab. magadii culture while shaking in a baffled flask or during harvesting by centrifugation. Anyway,
based on these results it is very likely that the long structures visible on electron micrographs indeed
represent broken tails of the mutant phage particles.
However, other explanations for the presence of structures like those found in the samples
examined in the electron microscope are possible. Flagella of the archaeal host Nab. magadii are of
an equal size and look very similar, hence they could hardly be distinguished from elongated tails.
Moreover, they are very likely to occur in both, the supernatant of a lysated culture as well as the
fractions resulting from isolation of the mutant phage particles. Furthermore, due to a western blot
detecting the flagellar protein FlaB1 (figure 17), the presence of flagella in the observed samples is
quite possible. Yet, even if the fractions analyzed by electron microscopy actually contained
Nab. magadii flagella, the presence of broken viral tails cannot be excluded. It has to be kept in mind,
that, in fact, some of the viral heads are associated with putative remnants of broken tails. So finally
it can be concluded that, anyway, the lack of viral tails can be explained by the deletion of the
putative tail fibre protein gp3452. Hence, the observed results clearly indicate that ORF34 encodes for
the tail fibre protein of φCh1.
In addition, the supposed function of the putative tail fibre protein gp3452 was investigated by
phage titre analysis. As described in section 3.1.4.3., in contrast to the φCh1 wild type, the mutant
virus lacking gp3452 was shown to be at least strongly reduced in its ability to infect cells of the cured
strain Nab. magadii L13. The addition of 100 µl of only one of the phage fractions resulted in the
formation of three plaques. However, contamination with the wild type virus which was used as a
control at the same time can not be excluded. Anyway, most of the observed phage fractions did not
cause plaque formation at all. Thus, the titre of the mutant virus determined from the results of
phage infection is < 101 pfu/ml, although, based on analysis of precipitated structural phage proteins,
the respective phage fractions did not contain less particles than the φCh1 wild type (titre 3.6 * 108
pfu/ml). Hence, the ability of the isolated φCh1-ΔORF34 particles to infect Nab. magadii has to be
considered as almost eliminated. Yet, it has to be noted that the particles resulting from isolation of
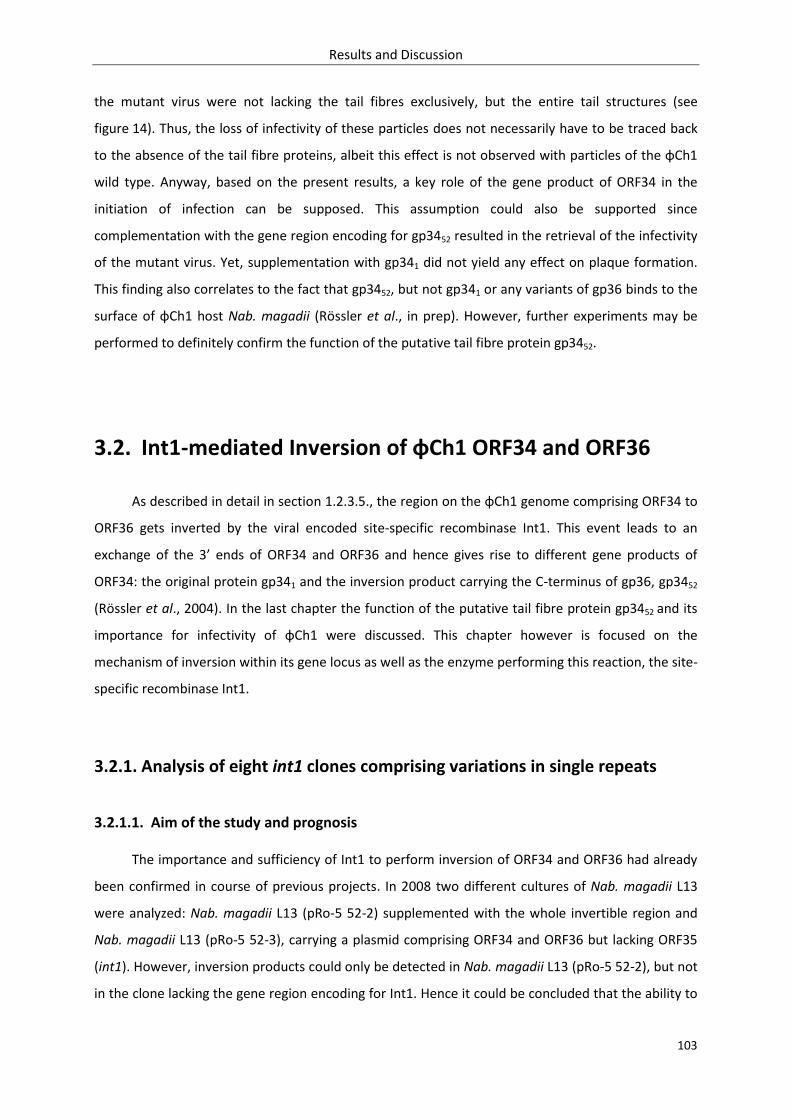
Results and Discussion
103
the mutant virus were not lacking the tail fibres exclusively, but the entire tail structures (see
figure 14). Thus, the loss of infectivity of these particles does not necessarily have to be traced back
to the absence of the tail fibre proteins, albeit this effect is not observed with particles of the φCh1
wild type. Anyway, based on the present results, a key role of the gene product of ORF34 in the
initiation of infection can be supposed. This assumption could also be supported since
complementation with the gene region encoding for gp3452 resulted in the retrieval of the infectivity
of the mutant virus. Yet, supplementation with gp341 did not yield any effect on plaque formation.
This finding also correlates to the fact that gp3452, but not gp341 or any variants of gp36 binds to the
surface of φCh1 host Nab. magadii (Rössler et al., in prep). However, further experiments may be
performed to definitely confirm the function of the putative tail fibre protein gp3452.
3.2. Int1-mediated Inversion of φCh1 ORF34 and ORF36
As described in detail in section 1.2.3.5., the region on the φCh1 genome comprising ORF34 to
ORF36 gets inverted by the viral encoded site-specific recombinase Int1. This event leads to an
exchange of the 3’ ends of ORF34 and ORF36 and hence gives rise to different gene products of
ORF34: the original protein gp341 and the inversion product carrying the C-terminus of gp36, gp3452
(Rössler et al., 2004). In the last chapter the function of the putative tail fibre protein gp3452 and its
importance for infectivity of φCh1 were discussed. This chapter however is focused on the
mechanism of inversion within its gene locus as well as the enzyme performing this reaction, the site-
specific recombinase Int1.
3.2.1. Analysis of eight int1 clones comprising variations in single repeats
3.2.1.1. Aim of the study and prognosis
The importance and sufficiency of Int1 to perform inversion of ORF34 and ORF36 had already
been confirmed in course of previous projects. In 2008 two different cultures of Nab. magadii L13
were analyzed: Nab. magadii L13 (pRo-5 52-2) supplemented with the whole invertible region and
Nab. magadii L13 (pRo-5 52-3), carrying a plasmid comprising ORF34 and ORF36 but lacking ORF35
(int1). However, inversion products could only be detected in Nab. magadii L13 (pRo-5 52-2), but not
in the clone lacking the gene region encoding for Int1. Hence it could be concluded that the ability to
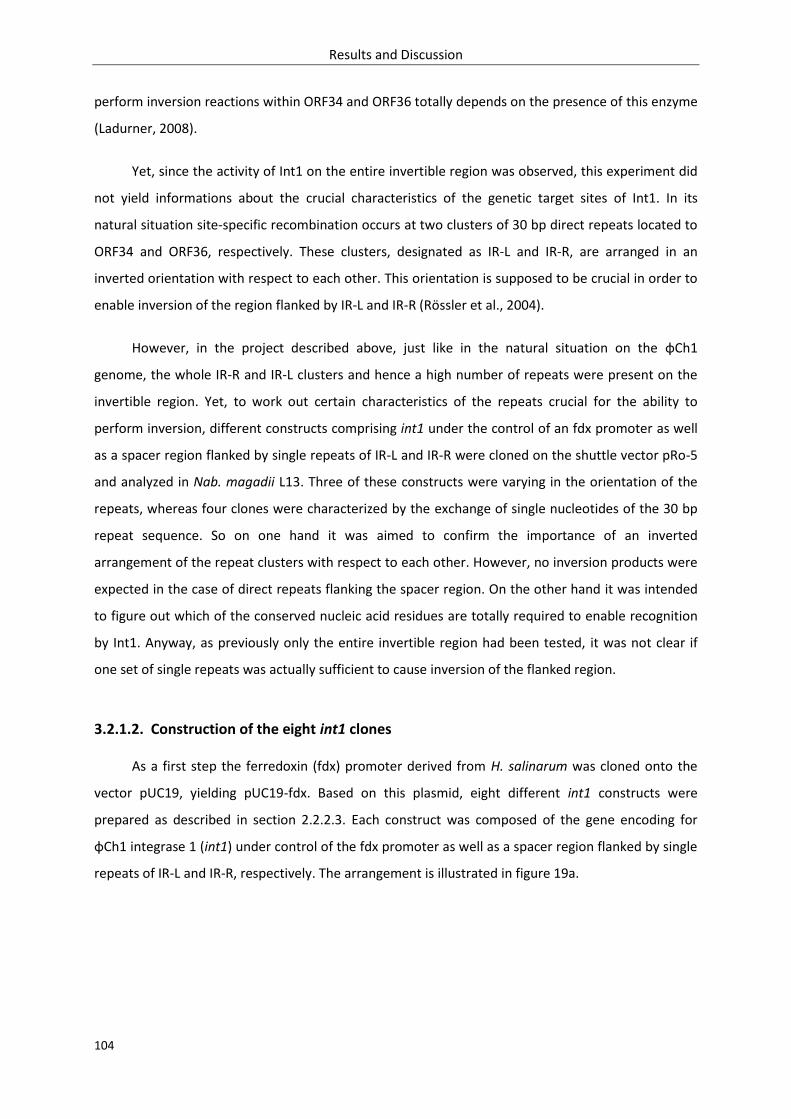
Results and Discussion
104
perform inversion reactions within ORF34 and ORF36 totally depends on the presence of this enzyme
(Ladurner, 2008).
Yet, since the activity of Int1 on the entire invertible region was observed, this experiment did
not yield informations about the crucial characteristics of the genetic target sites of Int1. In its
natural situation site-specific recombination occurs at two clusters of 30 bp direct repeats located to
ORF34 and ORF36, respectively. These clusters, designated as IR-L and IR-R, are arranged in an
inverted orientation with respect to each other. This orientation is supposed to be crucial in order to
enable inversion of the region flanked by IR-L and IR-R (Rössler et al., 2004).
However, in the project described above, just like in the natural situation on the φCh1
genome, the whole IR-R and IR-L clusters and hence a high number of repeats were present on the
invertible region. Yet, to work out certain characteristics of the repeats crucial for the ability to
perform inversion, different constructs comprising int1 under the control of an fdx promoter as well
as a spacer region flanked by single repeats of IR-L and IR-R were cloned on the shuttle vector pRo-5
and analyzed in Nab. magadii L13. Three of these constructs were varying in the orientation of the
repeats, whereas four clones were characterized by the exchange of single nucleotides of the 30 bp
repeat sequence. So on one hand it was aimed to confirm the importance of an inverted
arrangement of the repeat clusters with respect to each other. However, no inversion products were
expected in the case of direct repeats flanking the spacer region. On the other hand it was intended
to figure out which of the conserved nucleic acid residues are totally required to enable recognition
by Int1. Anyway, as previously only the entire invertible region had been tested, it was not clear if
one set of single repeats was actually sufficient to cause inversion of the flanked region.
3.2.1.2. Construction of the eight int1 clones
As a first step the ferredoxin (fdx) promoter derived from H. salinarum was cloned onto the
vector pUC19, yielding pUC19-fdx. Based on this plasmid, eight different int1 constructs were
prepared as described in section 2.2.2.3. Each construct was composed of the gene encoding for
φCh1 integrase 1 (int1) under control of the fdx promoter as well as a spacer region flanked by single
repeats of IR-L and IR-R, respectively. The arrangement is illustrated in figure 19a.
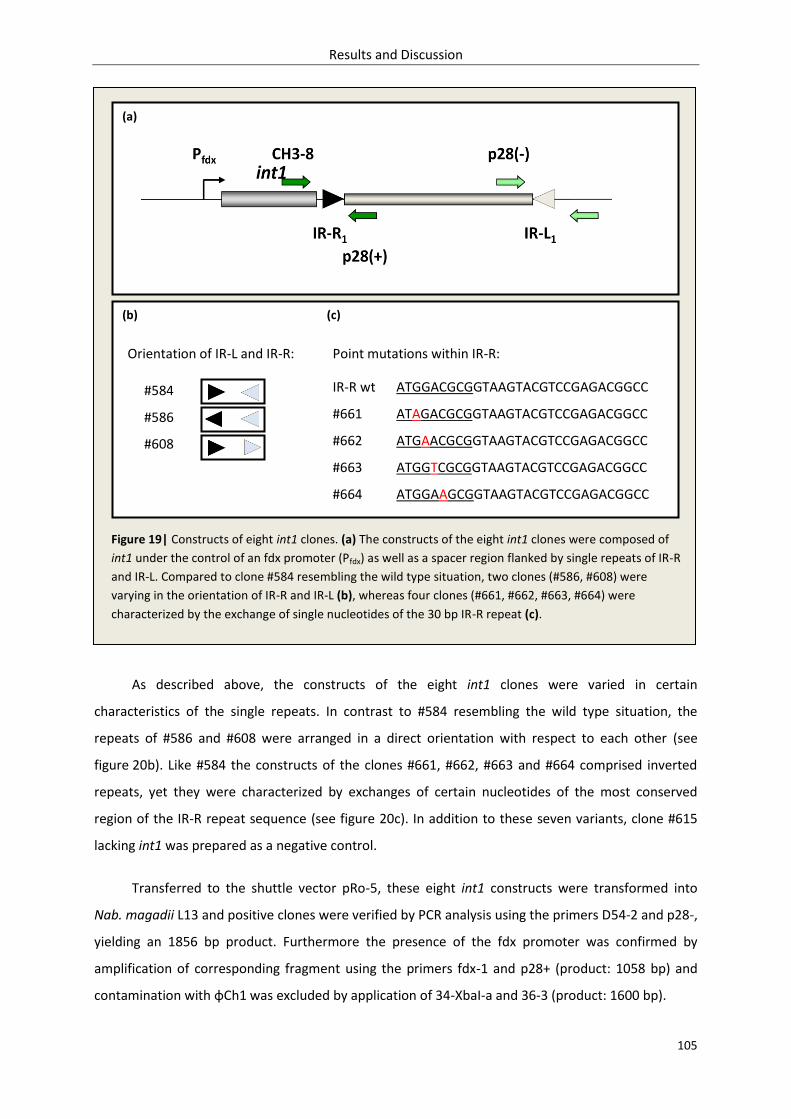
Results and Discussion
105
As described above, the constructs of the eight int1 clones were varied in certain
characteristics of the single repeats. In contrast to #584 resembling the wild type situation, the
repeats of #586 and #608 were arranged in a direct orientation with respect to each other (see
figure 20b). Like #584 the constructs of the clones #661, #662, #663 and #664 comprised inverted
repeats, yet they were characterized by exchanges of certain nucleotides of the most conserved
region of the IR-R repeat sequence (see figure 20c). In addition to these seven variants, clone #615
lacking int1 was prepared as a negative control.
Transferred to the shuttle vector pRo-5, these eight int1 constructs were transformed into
Nab. magadii L13 and positive clones were verified by PCR analysis using the primers D54-2 and p28-,
yielding an 1856 bp product. Furthermore the presence of the fdx promoter was confirmed by
amplification of corresponding fragment using the primers fdx-1 and p28+ (product: 1058 bp) and
contamination with φCh1 was excluded by application of 34-XbaI-a and 36-3 (product: 1600 bp).
Orientation of IR-L and IR-R:
#584
#586
#608
Point mutations within IR-R:
IR-R wt
#661
#662
#663
#664
ATGGACGCGGTAAGTACGTCCGAGACGGCC
ATAGACGCGGTAAGTACGTCCGAGACGGCC
ATGAACGCGGTAAGTACGTCCGAGACGGCC
ATGGTCGCGGTAAGTACGTCCGAGACGGCC
ATGGAAGCGGTAAGTACGTCCGAGACGGCC
Figure 19| Constructs of eight int1 clones. (a) The constructs of the eight int1 clones were composed of
int1 under the control of an fdx promoter (Pfdx) as well as a spacer region flanked by single repeats of IR-R
and IR-L. Compared to clone #584 resembling the wild type situation, two clones (#586, #608) were
varying in the orientation of IR-R and IR-L (b), whereas four clones (#661, #662, #663, #664) were
characterized by the exchange of single nucleotides of the 30 bp IR-R repeat (c).
(a)
(b) (c)
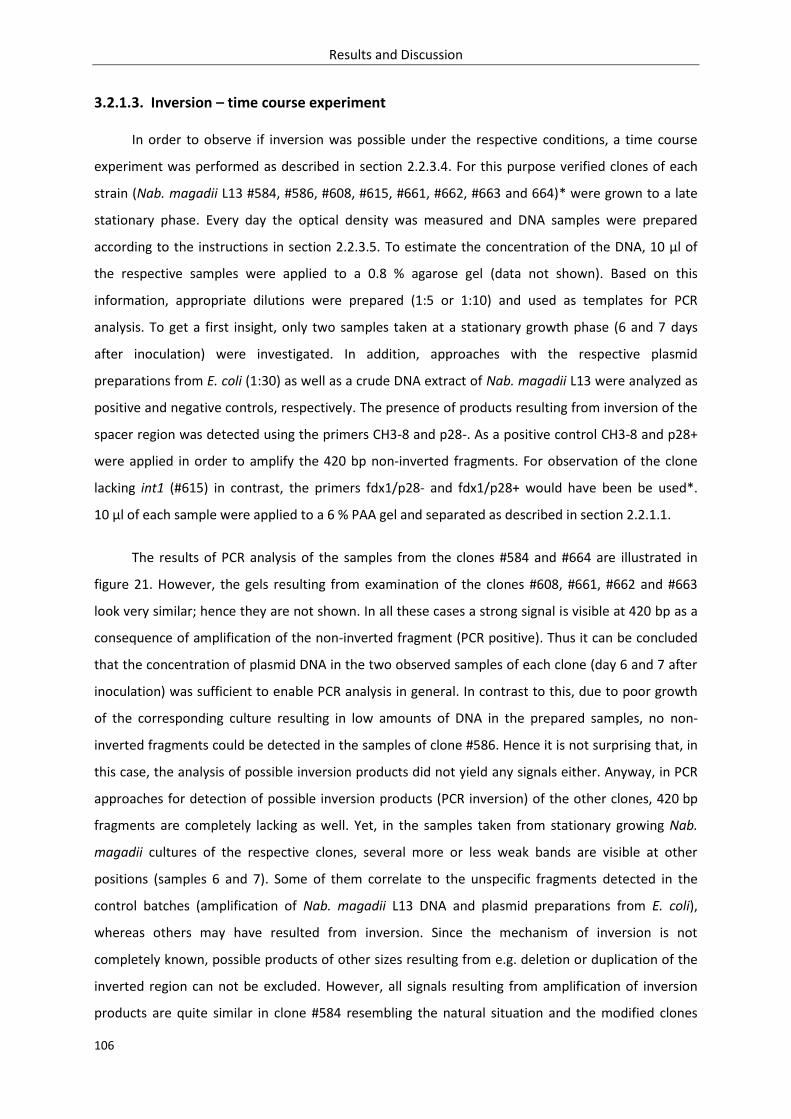
Results and Discussion
106
3.2.1.3. Inversion – time course experiment
In order to observe if inversion was possible under the respective conditions, a time course
experiment was performed as described in section 2.2.3.4. For this purpose verified clones of each
strain (Nab. magadii L13 #584, #586, #608, #615, #661, #662, #663 and 664)* were grown to a late
stationary phase. Every day the optical density was measured and DNA samples were prepared
according to the instructions in section 2.2.3.5. To estimate the concentration of the DNA, 10 µl of
the respective samples were applied to a 0.8 % agarose gel (data not shown). Based on this
information, appropriate dilutions were prepared (1:5 or 1:10) and used as templates for PCR
analysis. To get a first insight, only two samples taken at a stationary growth phase (6 and 7 days
after inoculation) were investigated. In addition, approaches with the respective plasmid
preparations from E. coli (1:30) as well as a crude DNA extract of Nab. magadii L13 were analyzed as
positive and negative controls, respectively. The presence of products resulting from inversion of the
spacer region was detected using the primers CH3-8 and p28-. As a positive control CH3-8 and p28+
were applied in order to amplify the 420 bp non-inverted fragments. For observation of the clone
lacking int1 (#615) in contrast, the primers fdx1/p28- and fdx1/p28+ would have been be used*.
10 µl of each sample were applied to a 6 % PAA gel and separated as described in section 2.2.1.1.
The results of PCR analysis of the samples from the clones #584 and #664 are illustrated in
figure 21. However, the gels resulting from examination of the clones #608, #661, #662 and #663
look very similar; hence they are not shown. In all these cases a strong signal is visible at 420 bp as a
consequence of amplification of the non-inverted fragment (PCR positive). Thus it can be concluded
that the concentration of plasmid DNA in the two observed samples of each clone (day 6 and 7 after
inoculation) was sufficient to enable PCR analysis in general. In contrast to this, due to poor growth
of the corresponding culture resulting in low amounts of DNA in the prepared samples, no non-
inverted fragments could be detected in the samples of clone #586. Hence it is not surprising that, in
this case, the analysis of possible inversion products did not yield any signals either. Anyway, in PCR
approaches for detection of possible inversion products (PCR inversion) of the other clones, 420 bp
fragments are completely lacking as well. Yet, in the samples taken from stationary growing Nab.
magadii cultures of the respective clones, several more or less weak bands are visible at other
positions (samples 6 and 7). Some of them correlate to the unspecific fragments detected in the
control batches (amplification of Nab. magadii L13 DNA and plasmid preparations from E. coli),
whereas others may have resulted from inversion. Since the mechanism of inversion is not
completely known, possible products of other sizes resulting from e.g. deletion or duplication of the
inverted region can not be excluded. However, all signals resulting from amplification of inversion
products are quite similar in clone #584 resembling the natural situation and the modified clones
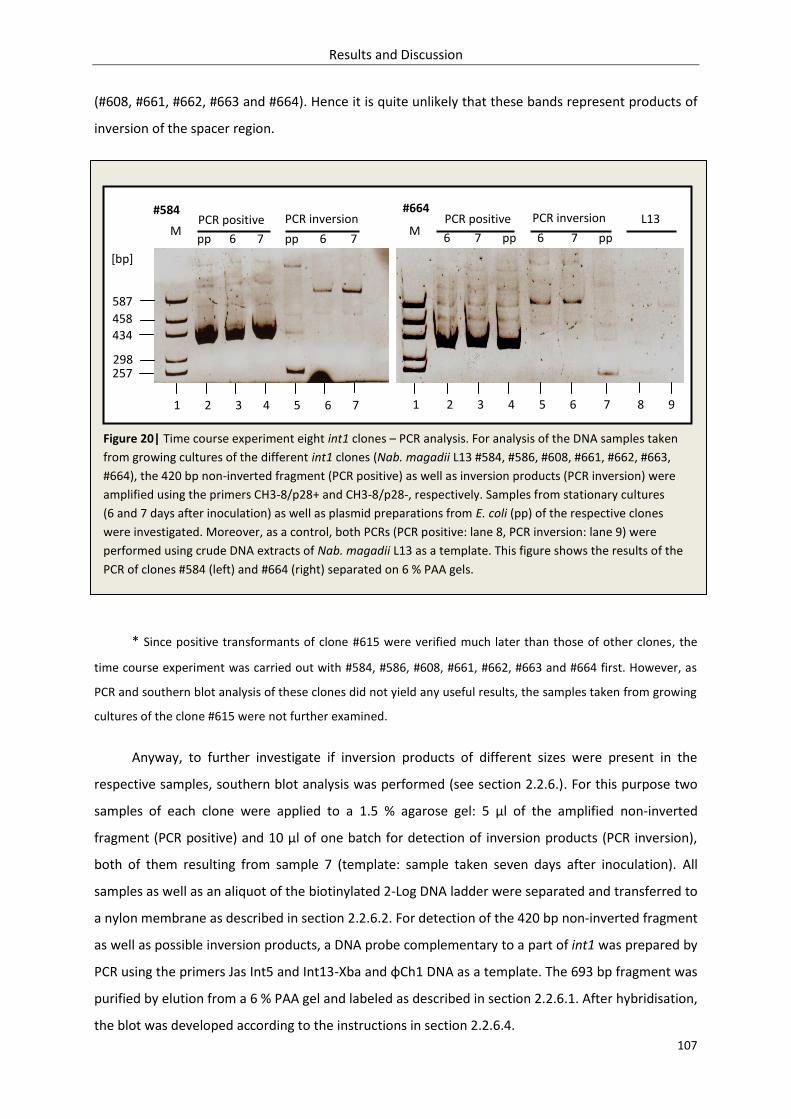
Results and Discussion
107
(#608, #661, #662, #663 and #664). Hence it is quite unlikely that these bands represent products of
inversion of the spacer region.
* Since positive transformants of clone #615 were verified much later than those of other clones, the
time course experiment was carried out with #584, #586, #608, #661, #662, #663 and #664 first. However, as
PCR and southern blot analysis of these clones did not yield any useful results, the samples taken from growing
cultures of the clone #615 were not further examined.
Anyway, to further investigate if inversion products of different sizes were present in the
respective samples, southern blot analysis was performed (see section 2.2.6.). For this purpose two
samples of each clone were applied to a 1.5 % agarose gel: 5 µl of the amplified non-inverted
fragment (PCR positive) and 10 µl of one batch for detection of inversion products (PCR inversion),
both of them resulting from sample 7 (template: sample taken seven days after inoculation). All
samples as well as an aliquot of the biotinylated 2-Log DNA ladder were separated and transferred to
a nylon membrane as described in section 2.2.6.2. For detection of the 420 bp non-inverted fragment
as well as possible inversion products, a DNA probe complementary to a part of int1 was prepared by
PCR using the primers Jas Int5 and Int13-Xba and φCh1 DNA as a template. The 693 bp fragment was
purified by elution from a 6 % PAA gel and labeled as described in section 2.2.6.1. After hybridisation,
the blot was developed according to the instructions in section 2.2.6.4.
[bp]
257 298
434
458
587
#664 #584 PCR positive PCR inversion PCR inversion PCR positive
Figure 20| Time course experiment eight int1 clones – PCR analysis. For analysis of the DNA samples taken
from growing cultures of the different int1 clones (Nab. magadii L13 #584, #586, #608, #661, #662, #663,
#664), the 420 bp non-inverted fragment (PCR positive) as well as inversion products (PCR inversion) were
amplified using the primers CH3-8/p28+ and CH3-8/p28-, respectively. Samples from stationary cultures
(6 and 7 days after inoculation) as well as plasmid preparations from E. coli (pp) of the respective clones
were investigated. Moreover, as a control, both PCRs (PCR positive: lane 8, PCR inversion: lane 9) were
performed using crude DNA extracts of Nab. magadii L13 as a template. This figure shows the results of the
PCR of clones #584 (left) and #664 (right) separated on 6 % PAA gels.
1 2 3 4 5 6 7 1 2 3 4 5 6 7 8 9
6 7 pp 6 7 pp pp 6 7 pp 6 7
L13 M M
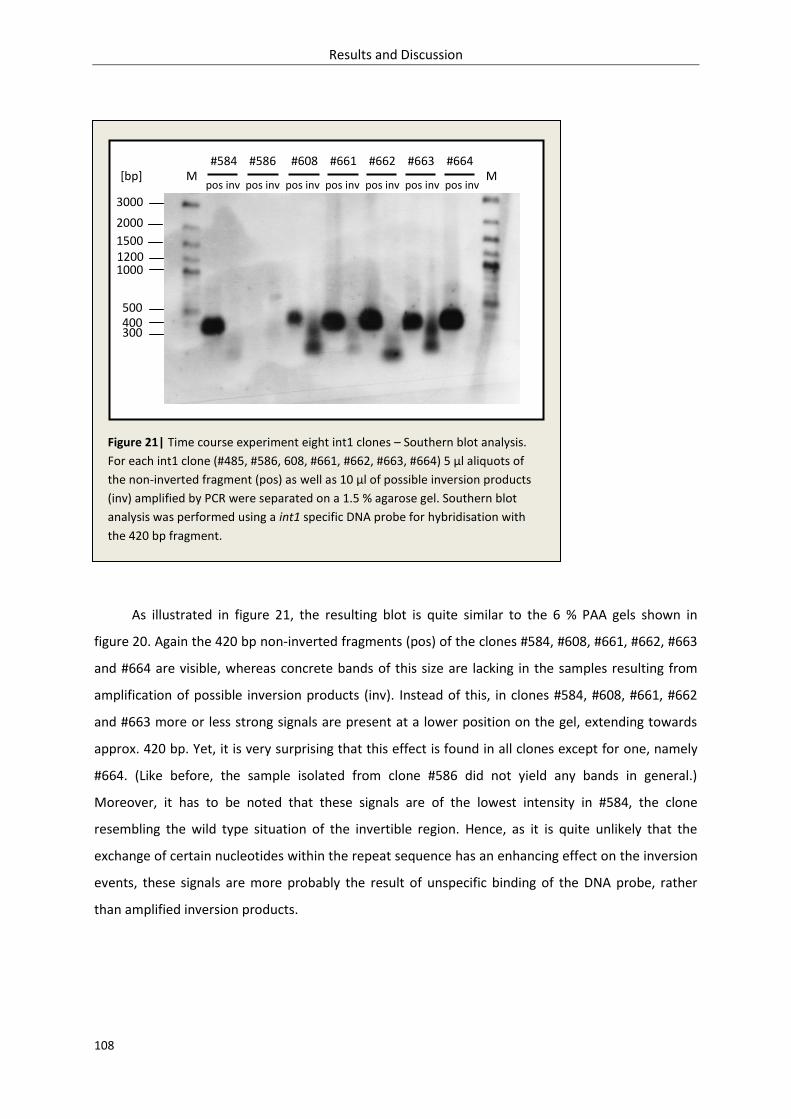
Results and Discussion
108
As illustrated in figure 21, the resulting blot is quite similar to the 6 % PAA gels shown in
figure 20. Again the 420 bp non-inverted fragments (pos) of the clones #584, #608, #661, #662, #663
and #664 are visible, whereas concrete bands of this size are lacking in the samples resulting from
amplification of possible inversion products (inv). Instead of this, in clones #584, #608, #661, #662
and #663 more or less strong signals are present at a lower position on the gel, extending towards
approx. 420 bp. Yet, it is very surprising that this effect is found in all clones except for one, namely
#664. (Like before, the sample isolated from clone #586 did not yield any bands in general.)
Moreover, it has to be noted that these signals are of the lowest intensity in #584, the clone
resembling the wild type situation of the invertible region. Hence, as it is quite unlikely that the
exchange of certain nucleotides within the repeat sequence has an enhancing effect on the inversion
events, these signals are more probably the result of unspecific binding of the DNA probe, rather
than amplified inversion products.
500
1000 1200 1500
2000
3000
[bp]
400 300
pos inv pos inv pos inv pos inv pos inv pos inv pos inv
#584 #586 #608 #661 #662 #663 #664
Figure 21| Time course experiment eight int1 clones – Southern blot analysis.
For each int1 clone (#485, #586, 608, #661, #662, #663, #664) 5 µl aliquots of
the non-inverted fragment (pos) as well as 10 µl of possible inversion products
(inv) amplified by PCR were separated on a 1.5 % agarose gel. Southern blot
analysis was performed using a int1 specific DNA probe for hybridisation with
the 420 bp fragment.
M M
Results and Discussion
109
3.2.1.4. Discussion
The results presented above raise the question if the amplified fragments differing in their size
compared to the 420 bp non-inverted version indeed were caused by inversion of the spacer region
in the respective clones. However, as mentioned above this is very unlikely, since it would imply that
inversion was possible or even enhanced by the changes in the orientation (#608) or sequence (#661,
#662 and #663) of the single repeats compared to natural situation resembled by clone #584. Yet, it
has to be noted that this effect was not observed in clone #664, comprising an exchange of cytosine6
to an adenine. Hence if the observed fragments in fact were inversion products it would lead to the
conclusion that only the nucleotide at position six, but not those at the positions three, four and five
is crucial to enable targeting by Int1.
Anyway, probably the observed signals were not the result of inversion performed by Int1, but
the consequence of unspecific binding of the primers CH3-8 and p28- as well as the DNA probe used
for southern blot analysis. In this case the failure of clone #584 to perform inversion of the spacer
region flanked by single repeats may be explained by the necessity of a high number of repeats.
Previously, inversion had only been investigated at the natural invertible region comprising large
clusters of the repeats within ORF34 and ORF36 (IR-R and IR-L), respectively. Hence, it can not be
excluded that this arrangement is crucial for the ability of Int1 to perform inversion and that, as a
result, targeting of the construct illustrated in figure 19 is not possible.
Another possible explanation for a general absence of inversion events is the failure of int1
expression due to the used promoter. However, though Pfdx represents a strong promoter for
ferredoxin in H. salinarum and is also expected to cause well expression of foreign genes introduced
into Nab. magadii, its function in the latter archaeon has not been confirmed so far. Hence to further
observe this possibility, this experiment may be repeated using another control element for the
expression of int1. Also the application of an inducible promoter constructed in course of recent
work (Alte, 2011) may open up new possibilities to shed light on this topic.
3.2.2. Investigation of a possible activator of int1 expression
3.2.2.1. Aim of the study and prognosis
As described in section 1.2.3.4. previous studies indicate that inversion happens in the late
stationary growth phase (78 h after inoculation) of a Nab. magadii L13 culture supplemented with
the φCh1 invertible region (Ladurner, 2008). Yet, in the wild type strain L11, expression of int1 was
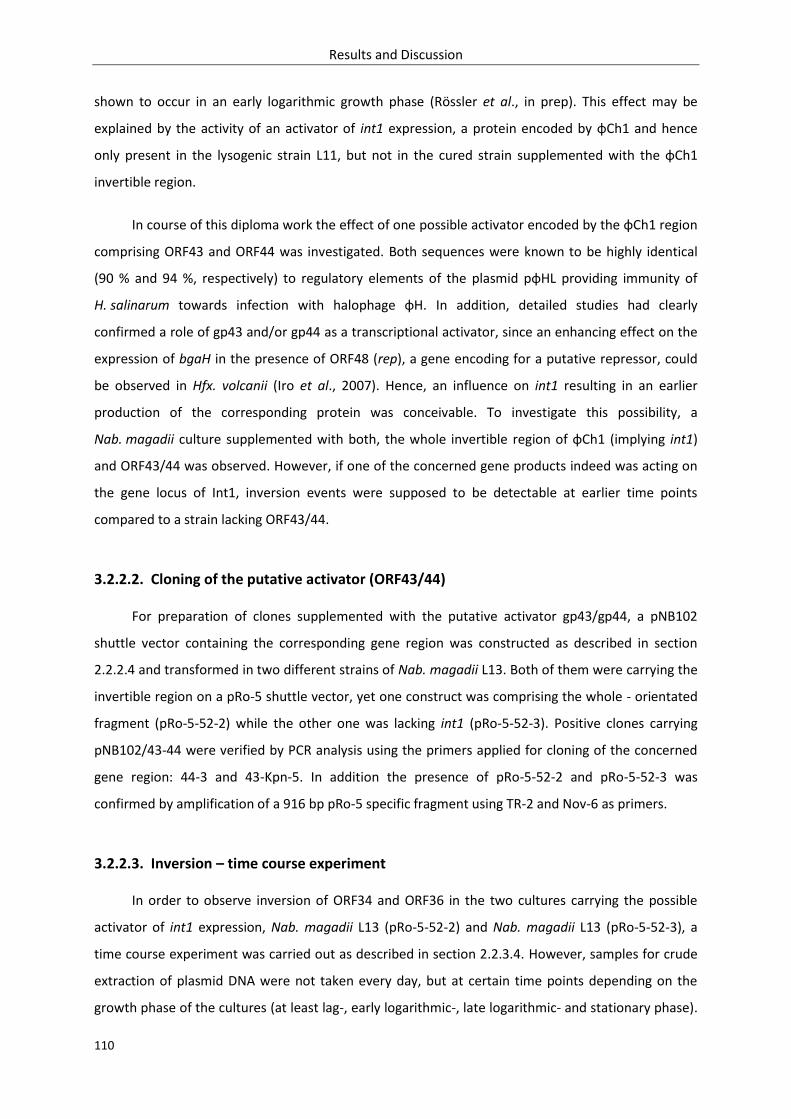
Results and Discussion
110
shown to occur in an early logarithmic growth phase (Rössler et al., in prep). This effect may be
explained by the activity of an activator of int1 expression, a protein encoded by φCh1 and hence
only present in the lysogenic strain L11, but not in the cured strain supplemented with the φCh1
invertible region.
In course of this diploma work the effect of one possible activator encoded by the φCh1 region
comprising ORF43 and ORF44 was investigated. Both sequences were known to be highly identical
(90 % and 94 %, respectively) to regulatory elements of the plasmid pφHL providing immunity of
H. salinarum towards infection with halophage φH. In addition, detailed studies had clearly
confirmed a role of gp43 and/or gp44 as a transcriptional activator, since an enhancing effect on the
expression of bgaH in the presence of ORF48 (rep), a gene encoding for a putative repressor, could
be observed in Hfx. volcanii (Iro et al., 2007). Hence, an influence on int1 resulting in an earlier
production of the corresponding protein was conceivable. To investigate this possibility, a
Nab. magadii culture supplemented with both, the whole invertible region of φCh1 (implying int1)
and ORF43/44 was observed. However, if one of the concerned gene products indeed was acting on
the gene locus of Int1, inversion events were supposed to be detectable at earlier time points
compared to a strain lacking ORF43/44.
3.2.2.2. Cloning of the putative activator (ORF43/44)
For preparation of clones supplemented with the putative activator gp43/gp44, a pNB102
shuttle vector containing the corresponding gene region was constructed as described in section
2.2.2.4 and transformed in two different strains of Nab. magadii L13. Both of them were carrying the
invertible region on a pRo-5 shuttle vector, yet one construct was comprising the whole - orientated
fragment (pRo-5-52-2) while the other one was lacking int1 (pRo-5-52-3). Positive clones carrying
pNB102/43-44 were verified by PCR analysis using the primers applied for cloning of the concerned
gene region: 44-3 and 43-Kpn-5. In addition the presence of pRo-5-52-2 and pRo-5-52-3 was
confirmed by amplification of a 916 bp pRo-5 specific fragment using TR-2 and Nov-6 as primers.
3.2.2.3. Inversion – time course experiment
In order to observe inversion of ORF34 and ORF36 in the two cultures carrying the possible
activator of int1 expression, Nab. magadii L13 (pRo-5-52-2) and Nab. magadii L13 (pRo-5-52-3), a
time course experiment was carried out as described in section 2.2.3.4. However, samples for crude
extraction of plasmid DNA were not taken every day, but at certain time points depending on the
growth phase of the cultures (at least lag-, early logarithmic-, late logarithmic- and stationary phase).
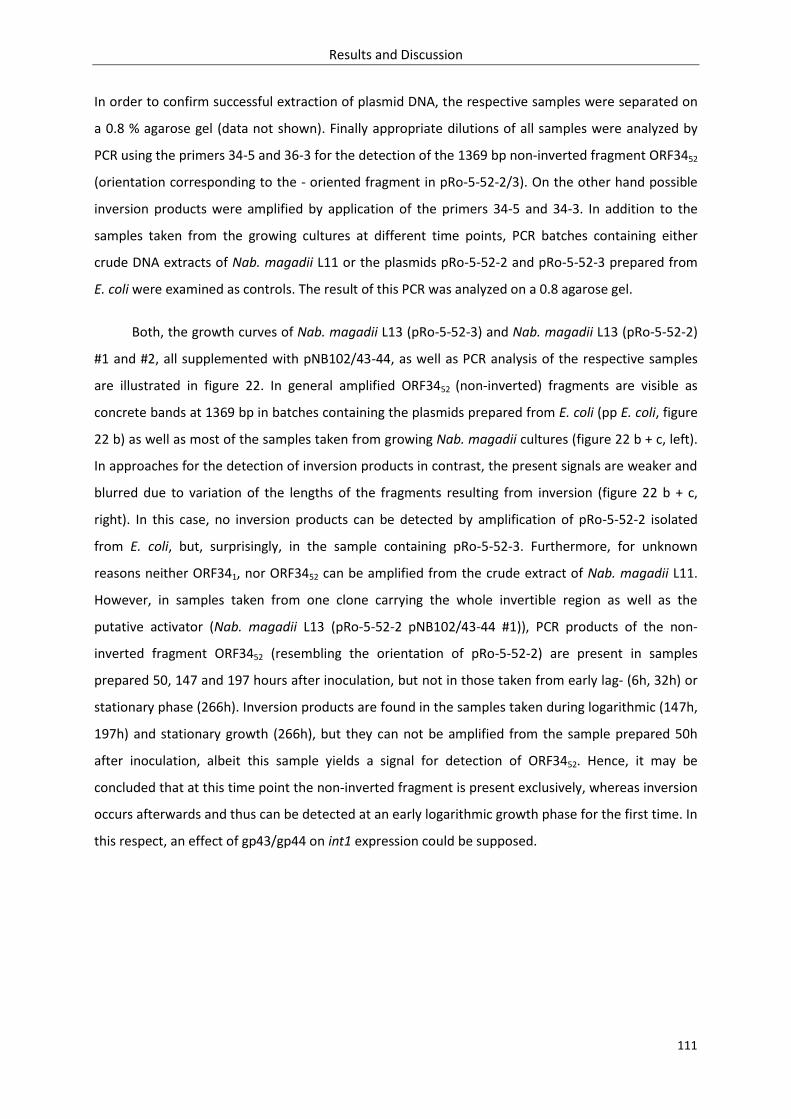
Results and Discussion
111
In order to confirm successful extraction of plasmid DNA, the respective samples were separated on
a 0.8 % agarose gel (data not shown). Finally appropriate dilutions of all samples were analyzed by
PCR using the primers 34-5 and 36-3 for the detection of the 1369 bp non-inverted fragment ORF3452
(orientation corresponding to the - oriented fragment in pRo-5-52-2/3). On the other hand possible
inversion products were amplified by application of the primers 34-5 and 34-3. In addition to the
samples taken from the growing cultures at different time points, PCR batches containing either
crude DNA extracts of Nab. magadii L11 or the plasmids pRo-5-52-2 and pRo-5-52-3 prepared from
E. coli were examined as controls. The result of this PCR was analyzed on a 0.8 agarose gel.
Both, the growth curves of Nab. magadii L13 (pRo-5-52-3) and Nab. magadii L13 (pRo-5-52-2)
#1 and #2, all supplemented with pNB102/43-44, as well as PCR analysis of the respective samples
are illustrated in figure 22. In general amplified ORF3452 (non-inverted) fragments are visible as
concrete bands at 1369 bp in batches containing the plasmids prepared from E. coli (pp E. coli, figure
22 b) as well as most of the samples taken from growing Nab. magadii cultures (figure 22 b + c, left).
In approaches for the detection of inversion products in contrast, the present signals are weaker and
blurred due to variation of the lengths of the fragments resulting from inversion (figure 22 b + c,
right). In this case, no inversion products can be detected by amplification of pRo-5-52-2 isolated
from E. coli, but, surprisingly, in the sample containing pRo-5-52-3. Furthermore, for unknown
reasons neither ORF341, nor ORF3452 can be amplified from the crude extract of Nab. magadii L11.
However, in samples taken from one clone carrying the whole invertible region as well as the
putative activator (Nab. magadii L13 (pRo-5-52-2 pNB102/43-44 #1)), PCR products of the non-
inverted fragment ORF3452 (resembling the orientation of pRo-5-52-2) are present in samples
prepared 50, 147 and 197 hours after inoculation, but not in those taken from early lag- (6h, 32h) or
stationary phase (266h). Inversion products are found in the samples taken during logarithmic (147h,
197h) and stationary growth (266h), but they can not be amplified from the sample prepared 50h
after inoculation, albeit this sample yields a signal for detection of ORF3452. Hence, it may be
concluded that at this time point the non-inverted fragment is present exclusively, whereas inversion
occurs afterwards and thus can be detected at an early logarithmic growth phase for the first time. In
this respect, an effect of gp43/gp44 on int1 expression could be supposed.
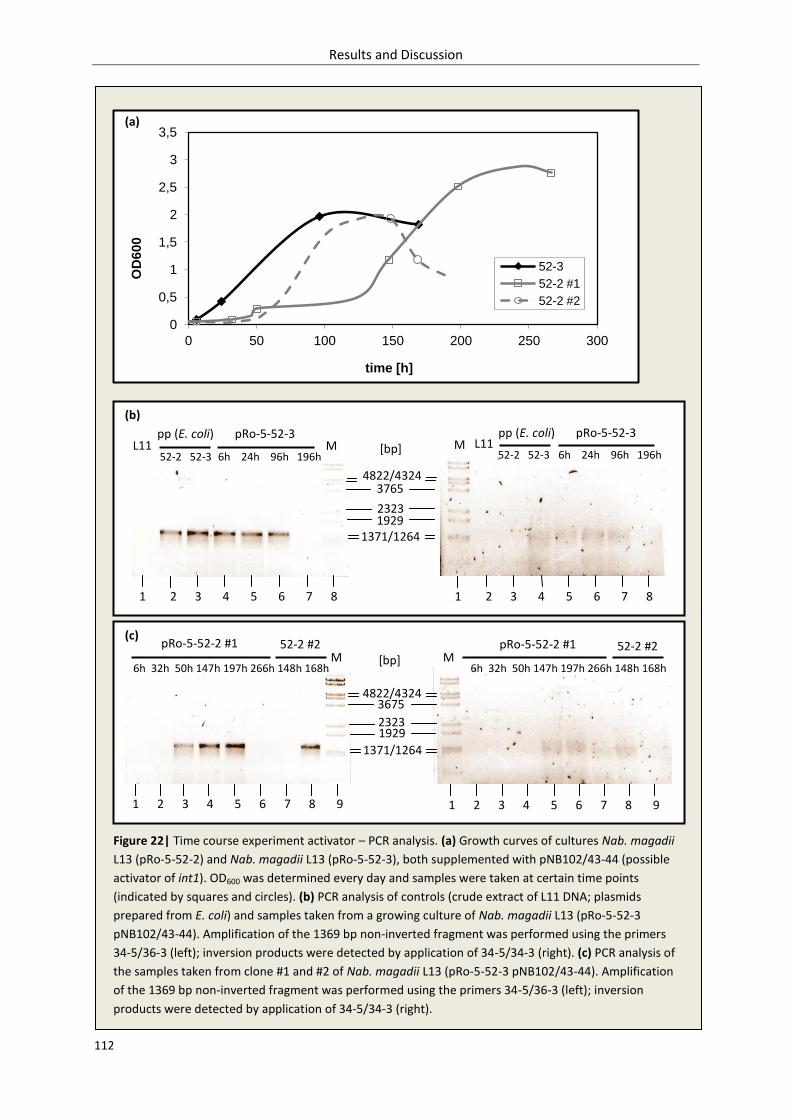
Results and Discussion
112
0
0,5
1
1,5
2
2,5
3
3,5
0 50 100 150 200 250 300
OD
600
time [h]
52-3
52-2 #1
52-2 #2
[bp]
1929
3765
2323
4822/4324
1371/1264
Figure 22| Time course experiment activator – PCR analysis. (a) Growth curves of cultures Nab. magadii
L13 (pRo-5-52-2) and Nab. magadii L13 (pRo-5-52-3), both supplemented with pNB102/43-44 (possible
activator of int1). OD600 was determined every day and samples were taken at certain time points
(indicated by squares and circles). (b) PCR analysis of controls (crude extract of L11 DNA; plasmids
prepared from E. coli) and samples taken from a growing culture of Nab. magadii L13 (pRo-5-52-3
pNB102/43-44). Amplification of the 1369 bp non-inverted fragment was performed using the primers
34-5/36-3 (left); inversion products were detected by application of 34-5/34-3 (right). (c) PCR analysis of
the samples taken from clone #1 and #2 of Nab. magadii L13 (pRo-5-52-3 pNB102/43-44). Amplification
of the 1369 bp non-inverted fragment was performed using the primers 34-5/36-3 (left); inversion
products were detected by application of 34-5/34-3 (right).
(a)
(b)
(c)
L11 6h 24h 96h 196h
4822/4324
52-2 52-3
1 2 3 4 5 6 7 8
pp (E. coli) pRo-5-52-3
1 2 3 4 5 6 7 8
52-2 52-3
pp (E. coli) pRo-5-52-3 L11
pRo-5-52-2 #1
6h 32h 50h 147h 197h 266h 148h 168h
52-2 #2 pRo-5-52-2 #1 52-2 #2
1371/1264
2323 1929
3675
[bp]
1 2 3 4 5 6 7 8 9 1 2 3 4 5 6 7 8 9
6h 24h 96h 196h
6h 32h 50h 147h 197h 266h 148h 168h M M
M M
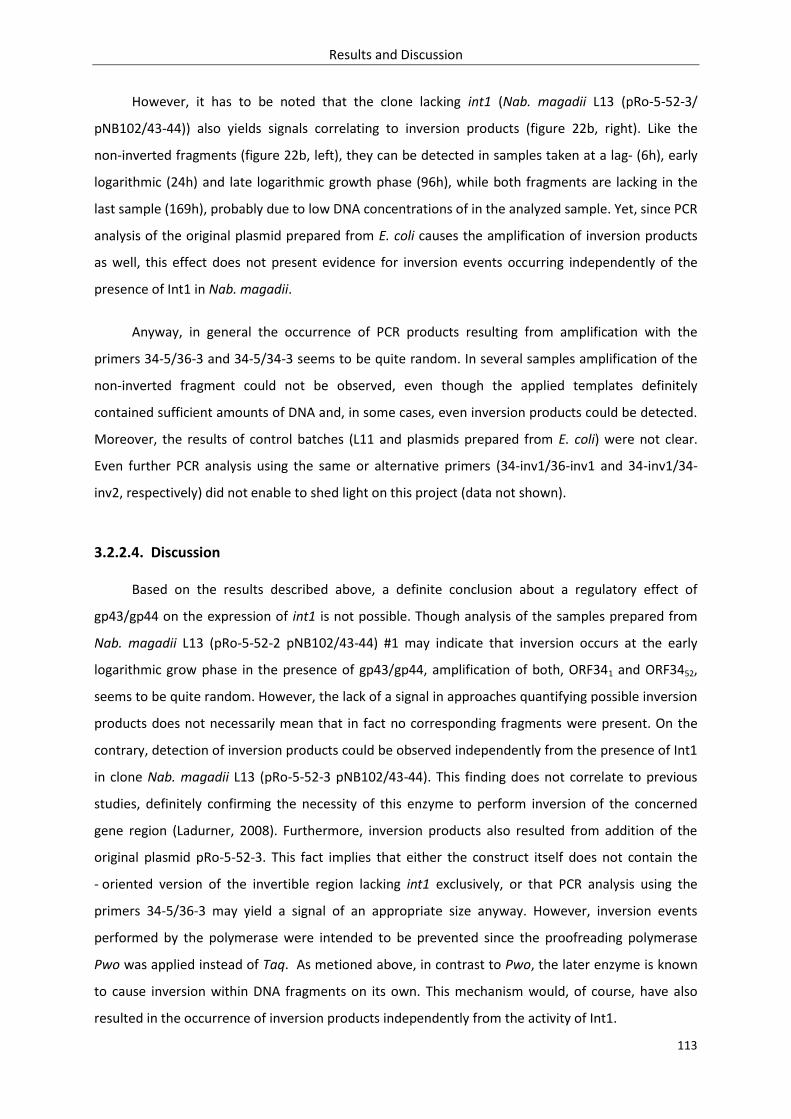
Results and Discussion
113
However, it has to be noted that the clone lacking int1 (Nab. magadii L13 (pRo-5-52-3/
pNB102/43-44)) also yields signals correlating to inversion products (figure 22b, right). Like the
non-inverted fragments (figure 22b, left), they can be detected in samples taken at a lag- (6h), early
logarithmic (24h) and late logarithmic growth phase (96h), while both fragments are lacking in the
last sample (169h), probably due to low DNA concentrations of in the analyzed sample. Yet, since PCR
analysis of the original plasmid prepared from E. coli causes the amplification of inversion products
as well, this effect does not present evidence for inversion events occurring independently of the
presence of Int1 in Nab. magadii.
Anyway, in general the occurrence of PCR products resulting from amplification with the
primers 34-5/36-3 and 34-5/34-3 seems to be quite random. In several samples amplification of the
non-inverted fragment could not be observed, even though the applied templates definitely
contained sufficient amounts of DNA and, in some cases, even inversion products could be detected.
Moreover, the results of control batches (L11 and plasmids prepared from E. coli) were not clear.
Even further PCR analysis using the same or alternative primers (34-inv1/36-inv1 and 34-inv1/34-
inv2, respectively) did not enable to shed light on this project (data not shown).
3.2.2.4. Discussion
Based on the results described above, a definite conclusion about a regulatory effect of
gp43/gp44 on the expression of int1 is not possible. Though analysis of the samples prepared from
Nab. magadii L13 (pRo-5-52-2 pNB102/43-44) #1 may indicate that inversion occurs at the early
logarithmic grow phase in the presence of gp43/gp44, amplification of both, ORF341 and ORF3452,
seems to be quite random. However, the lack of a signal in approaches quantifying possible inversion
products does not necessarily mean that in fact no corresponding fragments were present. On the
contrary, detection of inversion products could be observed independently from the presence of Int1
in clone Nab. magadii L13 (pRo-5-52-3 pNB102/43-44). This finding does not correlate to previous
studies, definitely confirming the necessity of this enzyme to perform inversion of the concerned
gene region (Ladurner, 2008). Furthermore, inversion products also resulted from addition of the
original plasmid pRo-5-52-3. This fact implies that either the construct itself does not contain the
- oriented version of the invertible region lacking int1 exclusively, or that PCR analysis using the
primers 34-5/36-3 may yield a signal of an appropriate size anyway. However, inversion events
performed by the polymerase were intended to be prevented since the proofreading polymerase
Pwo was applied instead of Taq. As metioned above, in contrast to Pwo, the later enzyme is known
to cause inversion within DNA fragments on its own. This mechanism would, of course, have also
resulted in the occurrence of inversion products independently from the activity of Int1.
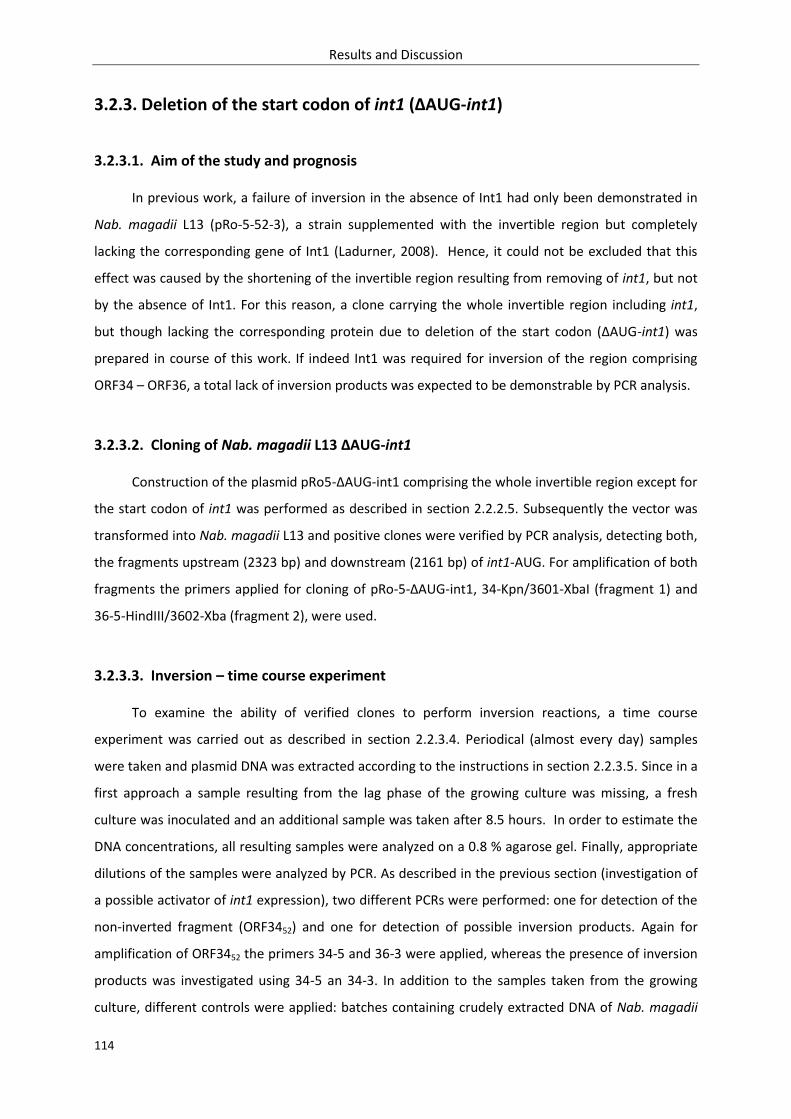
Results and Discussion
114
3.2.3. Deletion of the start codon of int1 (ΔAUG-int1)
3.2.3.1. Aim of the study and prognosis
In previous work, a failure of inversion in the absence of Int1 had only been demonstrated in
Nab. magadii L13 (pRo-5-52-3), a strain supplemented with the invertible region but completely
lacking the corresponding gene of Int1 (Ladurner, 2008). Hence, it could not be excluded that this
effect was caused by the shortening of the invertible region resulting from removing of int1, but not
by the absence of Int1. For this reason, a clone carrying the whole invertible region including int1,
but though lacking the corresponding protein due to deletion of the start codon (ΔAUG-int1) was
prepared in course of this work. If indeed Int1 was required for inversion of the region comprising
ORF34 – ORF36, a total lack of inversion products was expected to be demonstrable by PCR analysis.
3.2.3.2. Cloning of Nab. magadii L13 ΔAUG-int1
Construction of the plasmid pRo5-ΔAUG-int1 comprising the whole invertible region except for
the start codon of int1 was performed as described in section 2.2.2.5. Subsequently the vector was
transformed into Nab. magadii L13 and positive clones were verified by PCR analysis, detecting both,
the fragments upstream (2323 bp) and downstream (2161 bp) of int1-AUG. For amplification of both
fragments the primers applied for cloning of pRo-5-ΔAUG-int1, 34-Kpn/3601-XbaI (fragment 1) and
36-5-HindIII/3602-Xba (fragment 2), were used.
3.2.3.3. Inversion – time course experiment
To examine the ability of verified clones to perform inversion reactions, a time course
experiment was carried out as described in section 2.2.3.4. Periodical (almost every day) samples
were taken and plasmid DNA was extracted according to the instructions in section 2.2.3.5. Since in a
first approach a sample resulting from the lag phase of the growing culture was missing, a fresh
culture was inoculated and an additional sample was taken after 8.5 hours. In order to estimate the
DNA concentrations, all resulting samples were analyzed on a 0.8 % agarose gel. Finally, appropriate
dilutions of the samples were analyzed by PCR. As described in the previous section (investigation of
a possible activator of int1 expression), two different PCRs were performed: one for detection of the
non-inverted fragment (ORF3452) and one for detection of possible inversion products. Again for
amplification of ORF3452 the primers 34-5 and 36-3 were applied, whereas the presence of inversion
products was investigated using 34-5 an 34-3. In addition to the samples taken from the growing
culture, different controls were applied: batches containing crudely extracted DNA of Nab. magadii
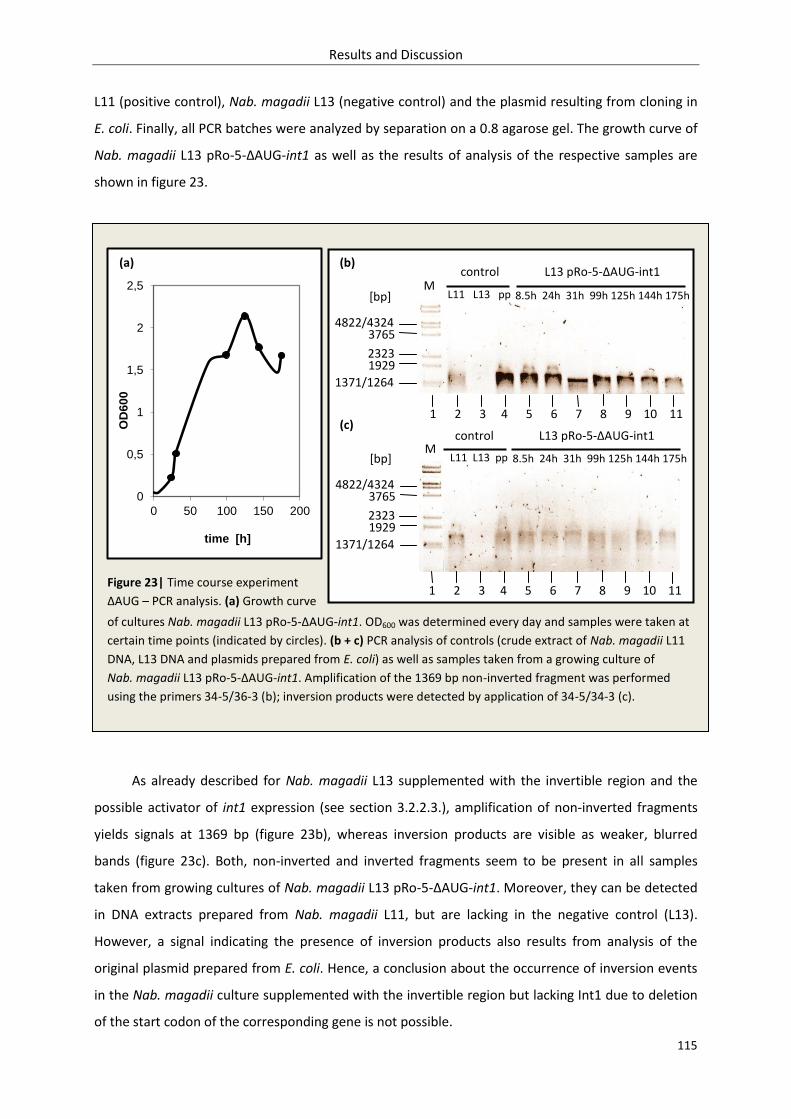
Results and Discussion
115
L11 (positive control), Nab. magadii L13 (negative control) and the plasmid resulting from cloning in
E. coli. Finally, all PCR batches were analyzed by separation on a 0.8 agarose gel. The growth curve of
Nab. magadii L13 pRo-5-ΔAUG-int1 as well as the results of analysis of the respective samples are
shown in figure 23.
As already described for Nab. magadii L13 supplemented with the invertible region and the
possible activator of int1 expression (see section 3.2.2.3.), amplification of non-inverted fragments
yields signals at 1369 bp (figure 23b), whereas inversion products are visible as weaker, blurred
bands (figure 23c). Both, non-inverted and inverted fragments seem to be present in all samples
taken from growing cultures of Nab. magadii L13 pRo-5-ΔAUG-int1. Moreover, they can be detected
in DNA extracts prepared from Nab. magadii L11, but are lacking in the negative control (L13).
However, a signal indicating the presence of inversion products also results from analysis of the
original plasmid prepared from E. coli. Hence, a conclusion about the occurrence of inversion events
in the Nab. magadii culture supplemented with the invertible region but lacking Int1 due to deletion
of the start codon of the corresponding gene is not possible.
0
0,5
1
1,5
2
2,5
0 50 100 150 200
OD
60
0
time [h]
[bp]
4822/4324 3765
2323 1929
1371/1264
(a) (b)
(c)
8.5h 24h 31h 99h 125h 144h 175h L11 L13 pp
control L13 pRo-5-ΔAUG-int1 M
8.5h 24h 31h 99h 125h 144h 175h L11 L13 pp
control L13 pRo-5-ΔAUG-int1 M
1 2 3 4 5 6 7 8 9 10 11
1 2 3 4 5 6 7 8 9 10 11
[bp]
4822/4324 3765
2323 1929
1371/1264
Figure 23| Time course experiment
ΔAUG – PCR analysis. (a) Growth curve
of cultures Nab. magadii L13 pRo-5-ΔAUG-int1. OD600 was determined every day and samples were taken at
certain time points (indicated by circles). (b + c) PCR analysis of controls (crude extract of Nab. magadii L11
DNA, L13 DNA and plasmids prepared from E. coli) as well as samples taken from a growing culture of
Nab. magadii L13 pRo-5-ΔAUG-int1. Amplification of the 1369 bp non-inverted fragment was performed
using the primers 34-5/36-3 (b); inversion products were detected by application of 34-5/34-3 (c).
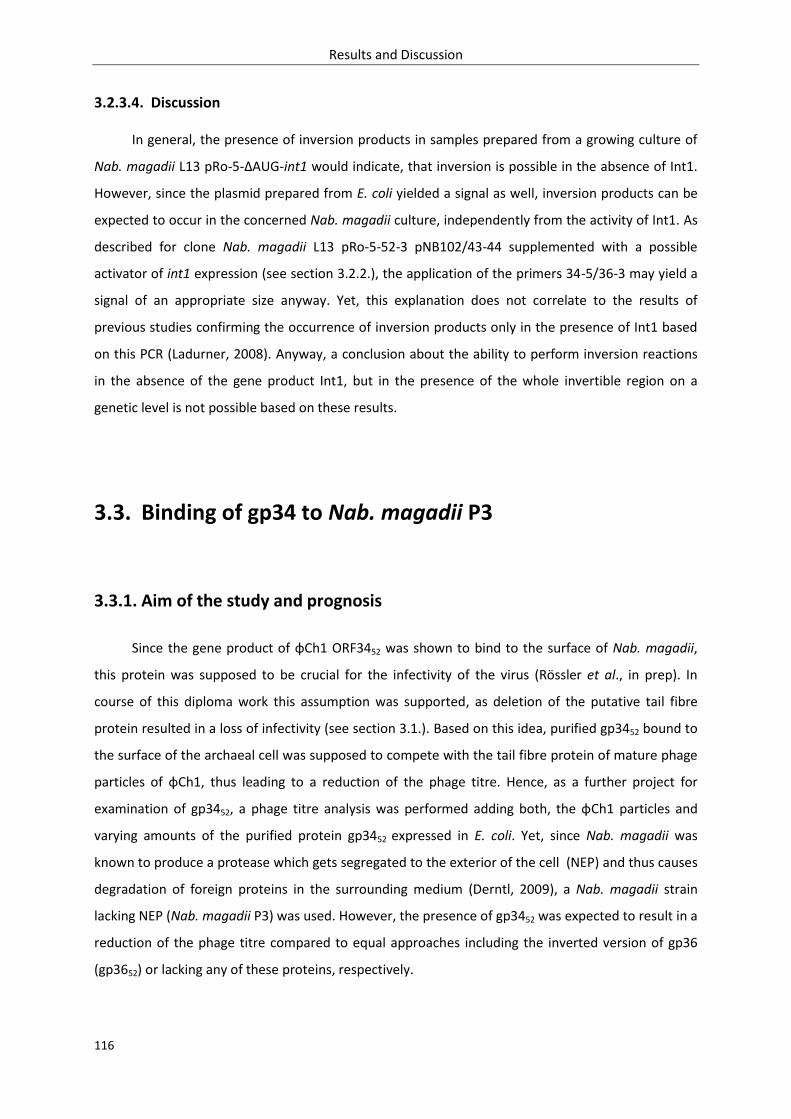
Results and Discussion
116
3.2.3.4. Discussion
In general, the presence of inversion products in samples prepared from a growing culture of
Nab. magadii L13 pRo-5-ΔAUG-int1 would indicate, that inversion is possible in the absence of Int1.
However, since the plasmid prepared from E. coli yielded a signal as well, inversion products can be
expected to occur in the concerned Nab. magadii culture, independently from the activity of Int1. As
described for clone Nab. magadii L13 pRo-5-52-3 pNB102/43-44 supplemented with a possible
activator of int1 expression (see section 3.2.2.), the application of the primers 34-5/36-3 may yield a
signal of an appropriate size anyway. Yet, this explanation does not correlate to the results of
previous studies confirming the occurrence of inversion products only in the presence of Int1 based
on this PCR (Ladurner, 2008). Anyway, a conclusion about the ability to perform inversion reactions
in the absence of the gene product Int1, but in the presence of the whole invertible region on a
genetic level is not possible based on these results.
3.3. Binding of gp34 to Nab. magadii P3
3.3.1. Aim of the study and prognosis
Since the gene product of φCh1 ORF3452 was shown to bind to the surface of Nab. magadii,
this protein was supposed to be crucial for the infectivity of the virus (Rössler et al., in prep). In
course of this diploma work this assumption was supported, as deletion of the putative tail fibre
protein resulted in a loss of infectivity (see section 3.1.). Based on this idea, purified gp3452 bound to
the surface of the archaeal cell was supposed to compete with the tail fibre protein of mature phage
particles of φCh1, thus leading to a reduction of the phage titre. Hence, as a further project for
examination of gp3452, a phage titre analysis was performed adding both, the φCh1 particles and
varying amounts of the purified protein gp3452 expressed in E. coli. Yet, since Nab. magadii was
known to produce a protease which gets segregated to the exterior of the cell (NEP) and thus causes
degradation of foreign proteins in the surrounding medium (Derntl, 2009), a Nab. magadii strain
lacking NEP (Nab. magadii P3) was used. However, the presence of gp3452 was expected to result in a
reduction of the phage titre compared to equal approaches including the inverted version of gp36
(gp3652) or lacking any of these proteins, respectively.
Results and Discussion
117
3.3.2. Purification of gp3452/gp3652 and quantification
In order to investigate the effect of gp3452 and gp3652 on the phage titre of φCh1, first of all
both proteins had to be purified. For this purpose the corresponding genes introduced via the cloning
vector pQE30 (pQE-3452 and pQE-3652) were expressed in the E. coli strain XL-1 Blue as described in
section 2.2.5.2. After expression for 3 hours, the cells were harvested and the pellet resulting from
5 liter culture was solved in 100 ml (gp3652) and 150 ml (gp3452) buffer B, respectively. After lysis of
the cells, the proteins were collected by centrifugation and incubated with 900µl (gp3652) / 1 ml
(gp3452) Ni-NTA in order to enable binding based on the affinity of the His-tag to the Ni2+ ions (see
section 2.1.10.4.). Finally they were purified under denaturing conditions according to the
instructions in section 2.1.10.4. The different fractions resulting from this procedure (flowthrough,
2 x wash, 6 x elution) as well as crude protein extracts prepared from the respective E.coli cultures
for and after induction of expression of the concerned genes were analyzed on protein gels as
described in section 2.2.5.5. (data not shown). For the binding assays, samples containing
appropriate amounts of quite pure gp3452 and gp3652 were dialyzed against buffer 1 and buffer 2 in
order to adapt them to high salt concentrations and hypersaline conditions (see section 2.2.5.4.).
Afterwards, an aliquot of each sample was mixed with an equal volume of 2 x Protein sample buffer
(Laemmli) and separated on a protein gel as described in section 2.2.5.5. In order to estimate the
protein concentration in the samples, BSA standards of certain concentrations (0.025, 0.05, 0.1, 0.2
and 0.4 µg/µl) were applied. Based on the resulting gel (see figure 24), a concentration of 0.075 µg/µl
was determined for the dialyzed fractions of both proteins.
3.3.3. Phage titre analysis
In order to investigate a possible reduction in the plaque formation caused by the addition of
gp3452 or gp3652, phage titre analysis was performed. As described in section 2.2.4.4., in addition to
400 µl stationary culture of Nab. magadii P3, varying amounts of the purified proteins gp3452 and
Figure 24| Quantification of purified
gp3452 and gp3652. 5 µl dialyzed
fractions of purified gp3452 (lane 7) and
gp3652 (lane 8) as well as BSA standards
of certain concentrations (0.4, 0.2, 0.1,
0.05 and 0.025 µg/µl), all of them mixed
with an equal volume of 2 x Protein
sample buffer were separated on a 12%
PAA gel. Estimated concentration of
gp3452 and gp3652: 0.075 µg/µl
[kDa]
116 66
45
35
25
M 0.4 0.2 0.1 0.05 0.025 gp3452 gp3652
BSA standards [µg/µl]
1 2 3 4 5 6 7 8
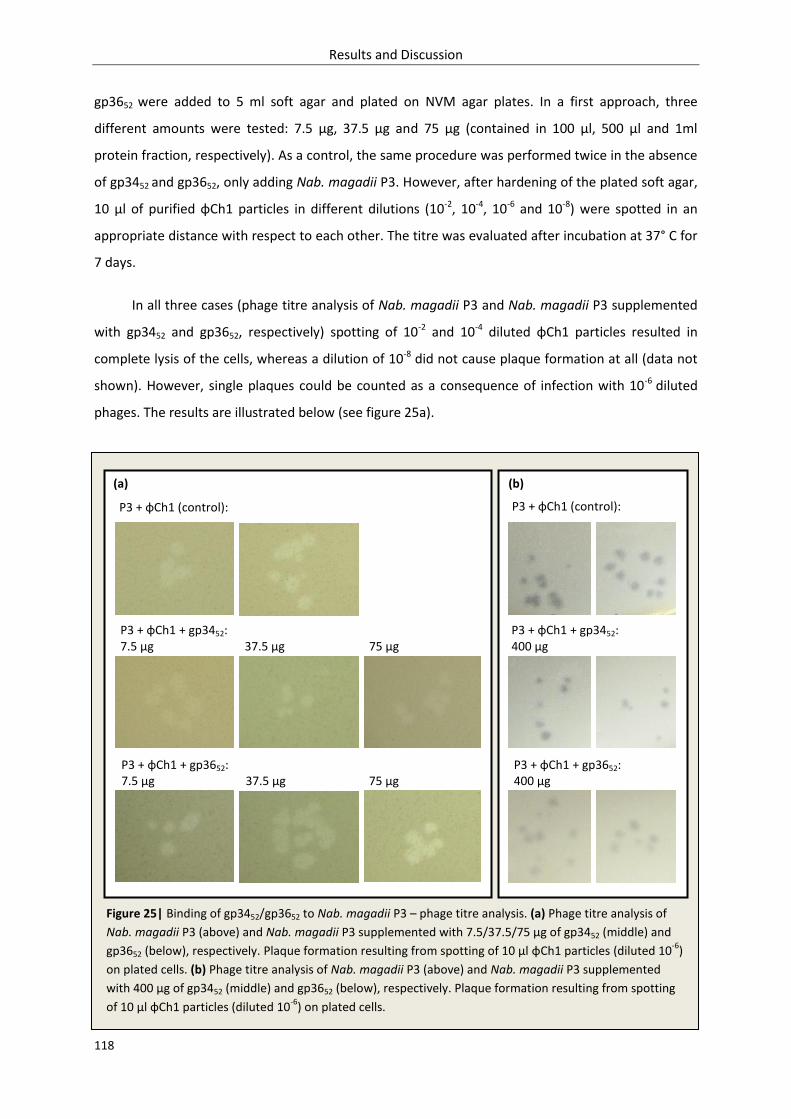
Results and Discussion
118
gp3652 were added to 5 ml soft agar and plated on NVM agar plates. In a first approach, three
different amounts were tested: 7.5 µg, 37.5 µg and 75 µg (contained in 100 µl, 500 µl and 1ml
protein fraction, respectively). As a control, the same procedure was performed twice in the absence
of gp3452 and gp3652, only adding Nab. magadii P3. However, after hardening of the plated soft agar,
10 µl of purified φCh1 particles in different dilutions (10-2, 10-4, 10-6 and 10-8) were spotted in an
appropriate distance with respect to each other. The titre was evaluated after incubation at 37° C for
7 days.
In all three cases (phage titre analysis of Nab. magadii P3 and Nab. magadii P3 supplemented
with gp3452 and gp3652, respectively) spotting of 10-2 and 10-4 diluted φCh1 particles resulted in
complete lysis of the cells, whereas a dilution of 10-8 did not cause plaque formation at all (data not
shown). However, single plaques could be counted as a consequence of infection with 10-6 diluted
phages. The results are illustrated below (see figure 25a).
Figure 25| Binding of gp3452/gp3652 to Nab. magadii P3 – phage titre analysis. (a) Phage titre analysis of
Nab. magadii P3 (above) and Nab. magadii P3 supplemented with 7.5/37.5/75 µg of gp3452 (middle) and
gp3652 (below), respectively. Plaque formation resulting from spotting of 10 µl φCh1 particles (diluted 10-6
)
on plated cells. (b) Phage titre analysis of Nab. magadii P3 (above) and Nab. magadii P3 supplemented
with 400 µg of gp3452 (middle) and gp3652 (below), respectively. Plaque formation resulting from spotting
of 10 µl φCh1 particles (diluted 10-6
) on plated cells.
(a)
P3 + φCh1 + gp3452: 7.5 µg 37.5 µg 75 µg
P3 + φCh1 (control):
P3 + φCh1 + gp3652: 7.5 µg 37.5 µg 75 µg
P3 + φCh1 + gp3452: 400 µg
P3 + φCh1 (control):
P3 + φCh1 + gp3652: 400 µg
(b)
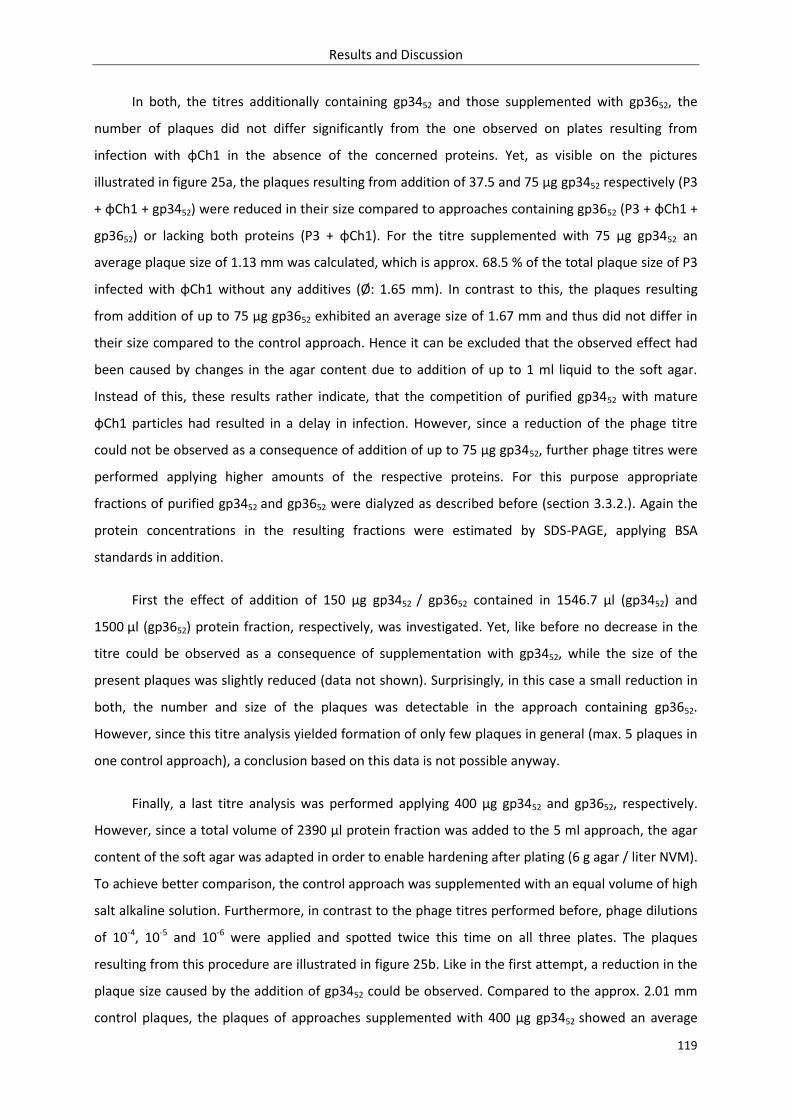
Results and Discussion
119
In both, the titres additionally containing gp3452 and those supplemented with gp3652, the
number of plaques did not differ significantly from the one observed on plates resulting from
infection with φCh1 in the absence of the concerned proteins. Yet, as visible on the pictures
illustrated in figure 25a, the plaques resulting from addition of 37.5 and 75 µg gp3452 respectively (P3
+ φCh1 + gp3452) were reduced in their size compared to approaches containing gp3652 (P3 + φCh1 +
gp3652) or lacking both proteins (P3 + φCh1). For the titre supplemented with 75 µg gp3452 an
average plaque size of 1.13 mm was calculated, which is approx. 68.5 % of the total plaque size of P3
infected with φCh1 without any additives (Ø: 1.65 mm). In contrast to this, the plaques resulting
from addition of up to 75 µg gp3652 exhibited an average size of 1.67 mm and thus did not differ in
their size compared to the control approach. Hence it can be excluded that the observed effect had
been caused by changes in the agar content due to addition of up to 1 ml liquid to the soft agar.
Instead of this, these results rather indicate, that the competition of purified gp3452 with mature
φCh1 particles had resulted in a delay in infection. However, since a reduction of the phage titre
could not be observed as a consequence of addition of up to 75 µg gp3452, further phage titres were
performed applying higher amounts of the respective proteins. For this purpose appropriate
fractions of purified gp3452 and gp3652 were dialyzed as described before (section 3.3.2.). Again the
protein concentrations in the resulting fractions were estimated by SDS-PAGE, applying BSA
standards in addition.
First the effect of addition of 150 µg gp3452 / gp3652 contained in 1546.7 µl (gp3452) and
1500 µl (gp3652) protein fraction, respectively, was investigated. Yet, like before no decrease in the
titre could be observed as a consequence of supplementation with gp3452, while the size of the
present plaques was slightly reduced (data not shown). Surprisingly, in this case a small reduction in
both, the number and size of the plaques was detectable in the approach containing gp3652.
However, since this titre analysis yielded formation of only few plaques in general (max. 5 plaques in
one control approach), a conclusion based on this data is not possible anyway.
Finally, a last titre analysis was performed applying 400 µg gp3452 and gp3652, respectively.
However, since a total volume of 2390 µl protein fraction was added to the 5 ml approach, the agar
content of the soft agar was adapted in order to enable hardening after plating (6 g agar / liter NVM).
To achieve better comparison, the control approach was supplemented with an equal volume of high
salt alkaline solution. Furthermore, in contrast to the phage titres performed before, phage dilutions
of 10-4, 10-5 and 10-6 were applied and spotted twice this time on all three plates. The plaques
resulting from this procedure are illustrated in figure 25b. Like in the first attempt, a reduction in the
plaque size caused by the addition of gp3452 could be observed. Compared to the approx. 2.01 mm
control plaques, the plaques of approaches supplemented with 400 µg gp3452 showed an average
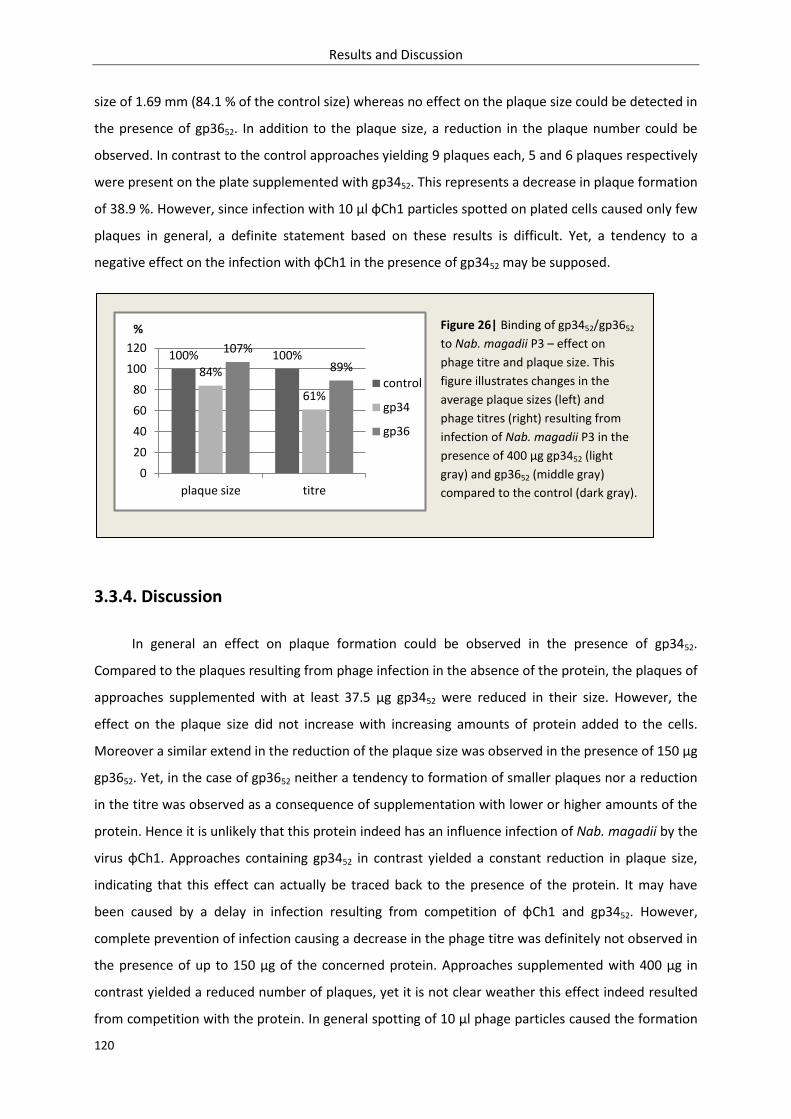
Results and Discussion
120
size of 1.69 mm (84.1 % of the control size) whereas no effect on the plaque size could be detected in
the presence of gp3652. In addition to the plaque size, a reduction in the plaque number could be
observed. In contrast to the control approaches yielding 9 plaques each, 5 and 6 plaques respectively
were present on the plate supplemented with gp3452. This represents a decrease in plaque formation
of 38.9 %. However, since infection with 10 µl φCh1 particles spotted on plated cells caused only few
plaques in general, a definite statement based on these results is difficult. Yet, a tendency to a
negative effect on the infection with φCh1 in the presence of gp3452 may be supposed.
3.3.4. Discussion
In general an effect on plaque formation could be observed in the presence of gp3452.
Compared to the plaques resulting from phage infection in the absence of the protein, the plaques of
approaches supplemented with at least 37.5 µg gp3452 were reduced in their size. However, the
effect on the plaque size did not increase with increasing amounts of protein added to the cells.
Moreover a similar extend in the reduction of the plaque size was observed in the presence of 150 µg
gp3652. Yet, in the case of gp3652 neither a tendency to formation of smaller plaques nor a reduction
in the titre was observed as a consequence of supplementation with lower or higher amounts of the
protein. Hence it is unlikely that this protein indeed has an influence infection of Nab. magadii by the
virus φCh1. Approaches containing gp3452 in contrast yielded a constant reduction in plaque size,
indicating that this effect can actually be traced back to the presence of the protein. It may have
been caused by a delay in infection resulting from competition of φCh1 and gp3452. However,
complete prevention of infection causing a decrease in the phage titre was definitely not observed in
the presence of up to 150 µg of the concerned protein. Approaches supplemented with 400 µg in
contrast yielded a reduced number of plaques, yet it is not clear weather this effect indeed resulted
from competition with the protein. In general spotting of 10 µl phage particles caused the formation
100% 100%
84%
61%
107%
89%
0
20
40
60
80
100
120
plaque size titre
%
control
gp34
gp36
Figure 26| Binding of gp3452/gp3652
to Nab. magadii P3 – effect on
phage titre and plaque size. This
figure illustrates changes in the
average plaque sizes (left) and
phage titres (right) resulting from
infection of Nab. magadii P3 in the
presence of 400 µg gp3452 (light
gray) and gp3652 (middle gray)
compared to the control (dark gray).

Results and Discussion
121
of only few plaques, varying in the number even under the same conditions. Anyway, a tendency to a
reduction in the tire resulting from competition with gp3452 may be supposed. To come to a definite
conclusion, determination of the phage titre may be performed applying 100 µl phage particles. Yet,
since in this case on one plate only one phage dilution could be tested, high amounts of gp3452 would
be required for extensive studies.
Finally, based on the data presented above, an effect of gp3452 on the ability of φCh1 to infect
its host Nab. magadii is quite likely, but still has to be confirmed in course of further work. For this
purpose, even higher amounts of gp3452 may be applied in order to increase the observed effect.

123
4. References Abremski, K.E. and Hoess, R.H. (1992) Evidence for a second conserved argenine residue in the integrase family of recombination proteins. Protein engineering 5: 87-91 Allers, T. and Mevarech, M. (2005) Archaeal genetics – the third way. Nature Reviews Genetics 6: 58-73 Alte, B. (2011) Konstruktion einer Flagellum-Deletionsmutante in Natrialba magdii und Charakterisierung bestehender Natrialba magadii Mutanten. Diploma thesis, University of Vienna Aravind, L. and Koonin, E.V. (1999) DNA-binding proteins and evolution of transcription regulation in the Archaea. Nucleic acids research 27: 4658-70 Argos, P. et al. (1986) The integrase family of site-specific recombinases: regional similarities and global diversity. The EMBO journal 5: 433-40 Arnold, H. P., Ziese, U. & Zillig, W. (2000a) SNDV, a novel virus of the extremely thermophilic and acidophilic archaeon Sulfolobus. Virology 272: 409-16 Arnold, H. P. et al. (2000b) A novel lipothrixvirus, SIFV, of the extremely thermophilic crenarchaeon Sulfolobus. Virology 267: 252-66 Barns, S.M., Delwiche, C.F., Palmer, J.D. and Pace, N.R. (1996) Perspectives on archaeal diversity, thermophily and monophyly from environmental rRNA sequences. Proceedings of the National Academy of Science of the United States of America 93: 9188-93 Baranyi, U., Klein, R., Lubitz, W., Krüger, D.H. and Witte, A. (2000) The archaeal halophilic virus encoded dam-like methyltransferase M.φCh1-I methylates adenine residues and complements dam mutants in the low salt environment of Escherichia coli. Molecular Microbiology 35: 1168-79 Bath, C., Cukalaca, T., Portera, K., Dyall-Smith, M.L. (2006) His1 and His2 are distantly related, spindle shaped haloviruses belonging to the novel virus group, Salterprovirus. Virology 350: 228-39 Bath, C. and Dyall-Smith, M.L. (1998) His1, an archaeal virus of the Fuselloviridae family that infects Haloarcula hispanica. Journal of Virology 72: 9392-5 Baumann, P. and Jackson , S.P. (1996) An archaebacterial homologue of the essential eubacterial cell division protein FtsZ. Proceedings of the National Academy of Science of the United States of America 93: 6726-30 Bell, S.D, Jackson, S.P. (1998) Transcription and translation in Archaea: a mosaic of eukaryal and bacterial features. Trends in Microbiology 6:222-8 Blakely, G.W. and Sherratt, D.J. (1996) Cis and trans in site-specific recombination. Molecular Microbiogy 20: 233-8
Boone, D. R. and Castenholz, R. W. (2001) Bergey’s manual of systematic bacteriology. New York: Springer
124
Brown, J.R., Doolittle, W.F. (1997) Archaea and the prokaryote-to-eukaryote transition. Microbiology And Molecular Biology Reviews 61: 456-502
Cline, S.W., Doolittle, W.F. (1987) Efficient transfection of the archaebacterium Halobacterium halobium. Journal of Bacteriology 169: 1341-4
Chatton, E. (1938) Titre et travaux scientifique (1906-1937) de Edouard Chatton. E. Sottano, Sète, France
Charbonnier, F. and Forterre, P. (1994) Comparison of plasmid DNA topology among mesophilic and thermophilic Eubacteria and archaebacteria. Journal of bacteriology 176: 1251-9
Copeland, H.F. (1938) The kingdoms of organisms. The Quarterly Review of Biology 13: 383-420
DeLong, E.F. and Pace, N.R. (2001) Environmental diversity of Bacteria and Archaea. Systematic biology 50: 470-8
Dennis, P.P. (1997) Ancient Ciphers: translation in Archaea. Cell 89: 1007-10
Derntl, C. (2009) Construction of the first deletion mutant of a haloalkaliphilic archaeon and analysis of gene expression of the methyltransferase M.NmaφCh1I of the halophage φCh1. Diploma thesis, University of Vienna
Dyall-Smith, M. (2009) The Halohandbook - protocols for haloarchaeal genetics (version 7).
http://www.haloarchaea.com/resources/halohandbook/Halohandbook_2008_v7.pdf.
Dyall-Smith, M., Tang, S.-L. and Bath, C. (2003) Haloarchaeal viruses: how diverse are they? Research in Microbiology 154: 309-13
Fendrihan, S., Legat, A., Pfaffenhuemer, M., Gruber ,C., Weidler, G., Gerbl, F., Stan- Lotter, H. (2006) Extremely halophilic Archaea and the issue of long-term microbial survival. Reviews in Environmental Science and Biotechnology 5: 203-18
Forterre, P., Brochier, C. and Philippe, H. (2002) Evolution of the Archaea. Theoretical Population
Biology 61: 409-22
Fox, G.E., Pechman, K.R. and Woese, C.R. (1977) Conservation of primary structure in 16S ribosomal RNA. International Journal of Systematic Bacteriology 27: 44-57
Glansdorff, N., Xu, Y. and Labedan, B. (2008) The last universal common ancestor: emergence,
constitution and genetic legacy of an elusive forerunner. Biology Direct 3: 29
Glasgow, A.C., Hughes, K.T., and Simon, M.I. (1989) Bacterial DNA inversion systems. In: Mobile DNA. Berg, D.E., and Howe, M.M. (eds). Washington, DC: American Society for Microbiology Press, pp. 637-659
125
Gribaldo, S. and Brochier-Armanet, C. (2006) The origin and evolution of Archaea: a state of the art. Philosophical Transactions of the Royal Society 361: 1007-22
Gropp, F., Grampp, B., Stolt, P., Palm, P. and Zillig, W. (1992) The immunity-conferring plasmid pφHL from the Halobacterium salinarium phage φH: nucleotide sequence and transcription. Virology 190: 45-54
Guzman, L.M., Belin, D., Carson M.J., Beckwith, J. (1995) Tight regulation, modulation, and high-level expression by vectors containing the arabinose PBAD promoter. Journal of Bacteriology 177: 4121-30
Haeckel, E. (1866) Generelle Morphologie der Organismen. Reimer, Berlin
Hallet, B., and Sherratt, D.J. (1997) Transposition and site-specific recombination: adapting. DNA cut-and-paste mechanisms to a variety of genetic rearrangements. FEMS microbiology reviews 21: 157-178
Häring, M., Xu, P., Brügger, K., Rachel, R., Stetter, K.O., Garrett, R.A., Prangishvili, D. (2004) Morphology and genome organization of the virus PSV of the hyperthermophilic archaeal genera Pyrobaculum and Thermoproteus: a novel virus family, the Globuloviridae. Virology 323: 233-42
Häring, M., Rachel, R., Peng, X., Garrett, R. and Pragishvili, D. (2005a) Viral diversity in hot springs of Pozzuoli, Italy, and characterization of a unique archaeal virus, Acidianus bottle-shaped virus, from a new family, the Ampullaviridae. Journal of Virology 79: 9904-11
Häring, M., Vestergaard, G., Rachel, R., Lanming, C. and Prangishvili, D. (2005b) Independent virus development outside a host Nature 436: 1101-2
Holmes, M.L. and Dyall-Smith, M.L. (1991) Mutations in DNA gyrase result in novobiocin resistance in halophilic archaebacteria. Journal of Bacteriology 173: 642-8
Holmes, M., Nuttall, S. and Dyall-Smith, M. (1991) Construction and use of halobacterial shuttle vectors and further studies on Haloferax DNA gyrase. Journal of Bacteriology 173: 3807-13
Horikoshi, K. (1999) Alkaliphiles: some applications of their products for biotechnology. Microbiology and Molecular Biology Reviews 63: 735-50
Huber, H., Hohn, M.J., Rachel, R., Fuchs, T., Wimmer, V.C. and Stetter, K.O. (2002) A new phylum of Archaea represented by a nanosized hyperthermophilic symbiont. Nature 417: 63-7
Huber, H., Hohn, M.J., Stetter, K.O., Rachel, R. (2003) The phylum Nanoarchaeota: present knowledge and future perspectives of a unique form of life. Research in Microbiology 154: 165-71
Huet, J., Schnabel, R., Sentenac, A. and Zillig, W. (1983) Archaebacteria and eukaryotes possess DNA dependent RNA polymerases of a common type. The EMBO journal 2: 1291-4
126
Iro, M., Klein, R., Gálos, B., Baranyi, U., Rössler, N., Witte, A. (2007) The lysogenic region of virus φCh1: identification of a repressor-operator system and determination of its activity in halophilic Archaea. Extremophiles 11: 383-96
Iro, M., Ladurner, A., Meissner, C., Derntl, C., Reiter, M., Haider, F., Rössler, N., Klein, R., Baranyi, U., H, S. and Witte, A. (in prep.) Transformation of Natrialba magadii: application of φCh1 elements for a shuttle vector system for haloalkaliphilic Archaea
Jain, R., Rivera, M.C. and Lake, J.A. (1999) Horizontal gene transfer among genomes: the complexity hypothesis. Proceedings of the National Academy of Science of the United States of America 96: 3801-6
Jones, B.E., Grant, W.D., Duckworth, A.W. and Owenson, G.G. (1998) Microbial diversity of soda
lakes. Extremophiles 2: 191-200
Kamekura, M., Dyall-Smith, M.L., Upasani, V., Ventosa, A., Kates, M. (1997) Diversity of alkaliphilic
halobacteria: proposals for transfer of Natronobacterium vacuolatum, Natronobacterium magadii,
and Natronobacterium pharaonis to Halorubrum, Natrialba, and Natronomonas gen. nov.,
Respectively, as Halorubrum vacuolatum comb. nov., Natrialba magadii comb. nov., and
Natronomonas pharaonis comb. nov., respectively. International Journal of Systematic Bacteriology
47: 853-7
Kandler, O. and König, H. (1998) Cell wall polymers in Archaea (archaebacteria). Cellular and
Molecular Life Science 54: 305-8
Keeling, P.J., Doolittle, W.F (1995) Archaea: narrowing the gap between prokaryotes and eukaryotes. Proceedings of the National Academy of Science of the United States of America 92: 5761-4
Klein, R., Baranyi, U., Rössler, N., Greineder, B., Scholz, H. and Witte, A. (2002) Natrialba magadii virus φCh1: first complete nucleotide sequence and functional organization of a virus infecting a haloalkaliphilic archaeon. Molecular Microbiology 45: 851-63
Klein, R., Greineder, B., Baranyi, U. and Witte, A. (2000) The structural protein E of the archaeal virus φCh1: evidence for processing in Natrialba magadii during virus maturation. Virology 276: 376-87
Klenk, H-P. et al. (1997) The complete genome sequence of the hyperthermophilic, sulphate-reducing archaeon Archaeoglobus fulgidus. Nature 390: 364-70
Lam, W.L. and Doolittle, W.F. (1992) Mevinolin-resistant mutations identify a promoter and the gene for a eukaryote-like 3-hydroxy-3-methylglutaryl-coenzymeA reductase in the archaebacterium Haloferax volcanii. The Journal of Biological Chemistry 267: 5829-34
Ladurner, A. (2008) Characterization of the inversion reaction of φCh1 and the establishment of a transformation system for Natrialba magadii. Diploma thesis, University of Vienna
127
Lanyi, J.K. (1974) Salt-dependent properties of proteins from extremely halophilic Bacteria. Bacteriological Reviews 38: 272-90
Lopez, P., Philippe, H., Myllykallio, H., and Forterre, P. (1999) Identification of putative chromosomal origins of replication in Archaea. Molecular microbiology 32: 883-6
Luo, Y., Pfister, P., Leisinger, T., and Wasserfallen, A. (2001) The genome of archaeal prophage ΨM100 encodes the lytic enzyme responsible for autolysis of Methanothermobacter wolfeii. Journal of bacteriology 183: 5788-92
Machida, Y.J., Hamlin, J.L. and Dutta, A. (2005) Right place, right time and only once: replication initiation in metazoans. Cell 123: 13-24
Madern, D., Pfister, C., Zaccai, G. (1995) A single acidic amino acid mutation enhances the halophilic behaviour of malate dehydrogenase from Haloarcula marismortui. European journal of biochemestry/ FEBS 230: 1088-95
Marteinsson, V.T., Birrien, J.-L., Reysenbach, A.-L., Vernet, M., Marie, D., Gambacorta, A., Messner, P., Sleytr, U.B. and Prieur, D. (1999) Thermococcus barophilus sp. nov., a new barophilic and hyperthermophilic archaeon isolated under high hydrostatic pressure from a deep-sea hydrothermal vent. lnternational Journal of Systematic Bacteriology 49: 351-9
Markhof, A.M., Trus, B.L., Conway, J.F., Simon, M.N., Zurabishvili, T.G., Mesyanzhinov, V.V. and Steven, A.C. (1993) The short tail-fibre of the bacteriophages T4: molecular structure and a mechanism for its conformational translation. Virology 194: 117-27
Ng, W.L., DasSarma, S. (1993) Minimal replication origin of the 200-kilobase Halobacterium plasmid pNRC100. Journal of Bacteriology 175: 4584-96
Nuttall, S.D., Dyall-Smith, M.L. (1993) HF1 and HF2: novel bacteriophages of halophilic Archaea. Virology 197: 678-84
Olsen, G.J. (1994) Archaea, Archaea, everywhere. Nature 371: 657-8
Oren, A. (1999) Bioenergetic aspects of halophilism. Microbiology and Molecular Biology Reviews 63: 334-48
Oren, A. (2002) Diversity of halophilic microorganisms: environments, phylogeny, physiology, and applications. Journal of Industrial Microbiology and Biotechnology 28: 56-63 Oren, A. (2008a) Microbial life at high salt concentrations: phylogenetic and metabolic diversity. Saline Systems 4 Oren A (2008b) Bergey's Manual of Systematic Bacteriology, 2nd edn, http://www.the-icsp.org/taxa/halobacterlist.htm
Oren, A., Bratbak, G., Heldal, M. (1997) Occurrence of virus-like particles in the Dead Sea. Extremophiles 1: 143-9
128
Pace, N.R., Stahl, D.A., Lane, D.J. and Olsen, G.J. (1986) The analysis of natural microbial populations by ribosomal RNA sequences. Advances in microbial Ecology 9: 1-55
Pfeifer, F., Offner, S., Krüger, K., Ghahraman, P. and Englert. C. (1994) Transformation of halophilic
Archaea and investigation of gas-vesicle synthesis. Systematic and Applied Microbiology 16: 569-77
Pfister, P., Wasserfallen, A., Stettler, R. and Leisinger, T. (1998) Molecular analysis of Methanobacterium phage ΨM2. Molecular microbiology 30: 233-44
Prangishvili, D., Arnold, H.B., Götz, D., Ziese, U., Holz, I., Kristjansson, J.K., Zillig, W. (1999) A novel virus family, the Rudiviridae: structure, virus-host interactions and genome variability of the Sulfolobus viruses SIRV1 and SIRV2. Genetics 152: 1387-96
Prangishvili, D. (2003) Evolutionary insights from studies on viruses of hyperthermophilic Archaea. Research in Microbiology 154: 289-94
Prangishvili, D., Forterre, P. and Garrett, R.A. (2006a) Viruses of the Archaea: a unifying view. Nature 4: 837-48
Prangishvili, D., Garrett, R.A. and Koonin, E.V. (2006b) Evolutionary genomics of archaeal viruses: unique viral genomes in the third domain of life. Virus Research 117: 52-67
Reistad, R. (1970) On the composition and nature of the bulk protein of the extremely halophilic Bacteria. Archiv für Microbiologie 71: 353-60
Rivera, M.C., Jain, R., Moore, J.E. and Lake, J.A. (1998) Genomic evidence for two functionally distinct gene classes. Proceedings of the National Academy of Science of the United States of America 95: 6239-44
Rivera, M.C., Lake, J.A. (2004) The ring of life provides evidence for a genome fusion origin of eukaryotes. Nature 431: 152-5
Robinson, N.P., Dionne, I., Lundgren, M., Marsh, V.L., Bernander, R. and Bell, S.D. (2004) Identification of two origin of replication in the single chromosome of the archaeon Sulfolobus solfataricus. Cell 116: 25-38
Rössler, N., Klein, R., Scholz, H., Witte, A. (2004) Inversion within the haloalkaliphilic virus φCh1 DNA results in differential expression of structural proteins. Molecular Microbiology 52: 413-26
Rössler, N., Kögl, K., Hofstätter, H., Iro, M., Scholz, H., Klein, R. and Witte, A. (in prep) ORF34 encodes the tail fibre protein of virus φCh1.
Rothschild, L.J. and Mancinelli, R.L. (2001) Life in extreme environments. Nature 409: 1092-101
Sandmeier, H. (1994) Acquisition and rearrangement of sequence motifs in the evolution of bacteriophage tail fibers. Molecular microbiology 12: 343-50
129
Schnabel, H. (1984) An immune strain of Halobacterium halobium carries the invertible L segment of phage φH as a plasmid. Proceedings of the National Academy of Sciences of the United States of America 81: 1017-20
Schnabel, H., Zillig, W., Pfaiffle, M., Schnabel, R., Michel, H. and Delius, H. (1982) Halobacterium halobium phage φH. EMBO Journal 1: 87-92
Selb, R. (2010) Construction of mutants of Natrialba magadii and φCh1. Diploma thesis, University of Vienna
Shirai, T., Kobayashi, T., Ito, S., Horikoshi, K. (2008) Alkaline adaptation of proteins. In: Protein adaptation in extremophiles (molecular anatomy and physiology of proteins). Siddiqui, K.S., Thomas, T., (eds). Nova Publishers, pp. 105-141
Svoboda, T. (2011) Characterization of putative repressors of the temperate phage φCh1 and analysis of the flagellum operon as a putative receptor of φCh1. Diploma thesis, University of Vienna
Tindall, B., Ross, H. and Grant, W. (1984) Natronobacterium gen. nov. and Natronococcus gen. nov., two new genera of haloalkaliphilic archaebacteria. Systematic and Applied Microbiology 5: 41-57
Torsvik, T. and Dundas, I.D. (1974) Bacteriophage of Halobacterium salinarium. Nature 248: 680-1
Torsvik, T. and Dundas, I.D. (1980) Persisting phage infection in Halobacterium salinarum str. 1. Journal of General Virology 47: 29-36
van de Vossenberg, J.L.C.M., Driessen, A.J.M., Grant, D., Konings, W.N. (1999) Lipid membranes from halophilic and alkali-halophilic Archaea have a low H+ and Na+ permeability at high salt concentration. Extremophiles 3: 253-7
Wais, A.C., Kon, M., MacDonald, R.E., Stollar, B.D. (1975) Salt-dependent bacteriophages infecting Halobacterium cutirubrum and H. halobium. Nature 256: 314-5
White, M.F., Bell, S.D. (2002) Holding it together: chromatin in the Archaea. Trends in Genetics 18: 621-6
Whittaker, R.H. (1959) On the broad classification of organisms. The Quarterly Review of Biology 34: 210-26
Whittaker, R.H. and Margulis, L. (1978) Protist classification and the kingdoms of organisms.
Biosystems 10: 3-18
Witte, A., Baranyi, U., Klein, R., Sulzner, M., Luo, C., Wanner, G., Krüger, D. and Lubitz, W. (1997)
Characterization of Natronobacterium magadii phage φCh1, a unique archaeal phage containing DNA
and RNA. Molecular Microbiology 23: 603-16
130
Witte, A., Wanner, G., Bläsi, U., Halfmann, G., Szostak, M. and Lubitz, W. (1990) Endogenous
transmembrane tunnel formation mediated by φX174 Lysis Protein E. Journal of Bacteriology 172:
4109-14
Woese, C.R. (1998) The universal ancestor. Proceedings of the National Academy of Science of the United States of America 95: 6854-9
Woese, C.R. and Fox, G.E . (1977) Phylogenetic structure of the prokaryotic domain: The primary kingdoms. Proceedings of the National Academy of Science of the United States of America 11: 5088-90
Woese, C.R., Kandler, O. and Wheelis, M. L. (1990) Towards a natural system of organisms: proposal for the domains Archaea, Bacteria, and Eucarya. Proceedings of the National Academy of Science of the United States of America 87: 4576-9
Wolf, Y.I., Aravind, L., Grishin, N.V., Koonin, E.V. (1999) Evolution of aminoacyl-tRNA-synthetase-
analysis of unique domain architectures and phylogeny trees reveals a complex history of horizontal
gene transfer events. Genome Research 9: 689-710
Yanisch-Perron, C., Vieira, J., Messing, J. (1985) Improved M13 phage cloning vectors and host strains: nucleotide sequences of the M13mp18 and pUC19 vectors. Gene 33: 103-19
Zhang, R. and Zhang, C.T. (2003) Multiple replication origins of the archaeon Halobacterium species
NRC-1. Biochemical and biophysical research communication 302: 728-34
Zhou, M., Xiang, H., Sun, C. and Tan, H. (2004) Construction of a novel shuttle vector based on an
RCR-plasmid from a haloalkaliphilic archaeon and transformation into other haloarchaea.
Biotechnology letters 26: 1107-13
Zivanovic, Y., Armengaud, J., Lagorce, A., Leplat, C., Guérin, P., Dutertre, M., Anthouard, V., Forterre, P., Wincker, P. and Confalonieri, F. (2009) Genome analysis and genome-wide proteomics of Thermococcus gammatolerans, the most radioresistant organism known amongst the Archaea. Genome Biology 10: R70
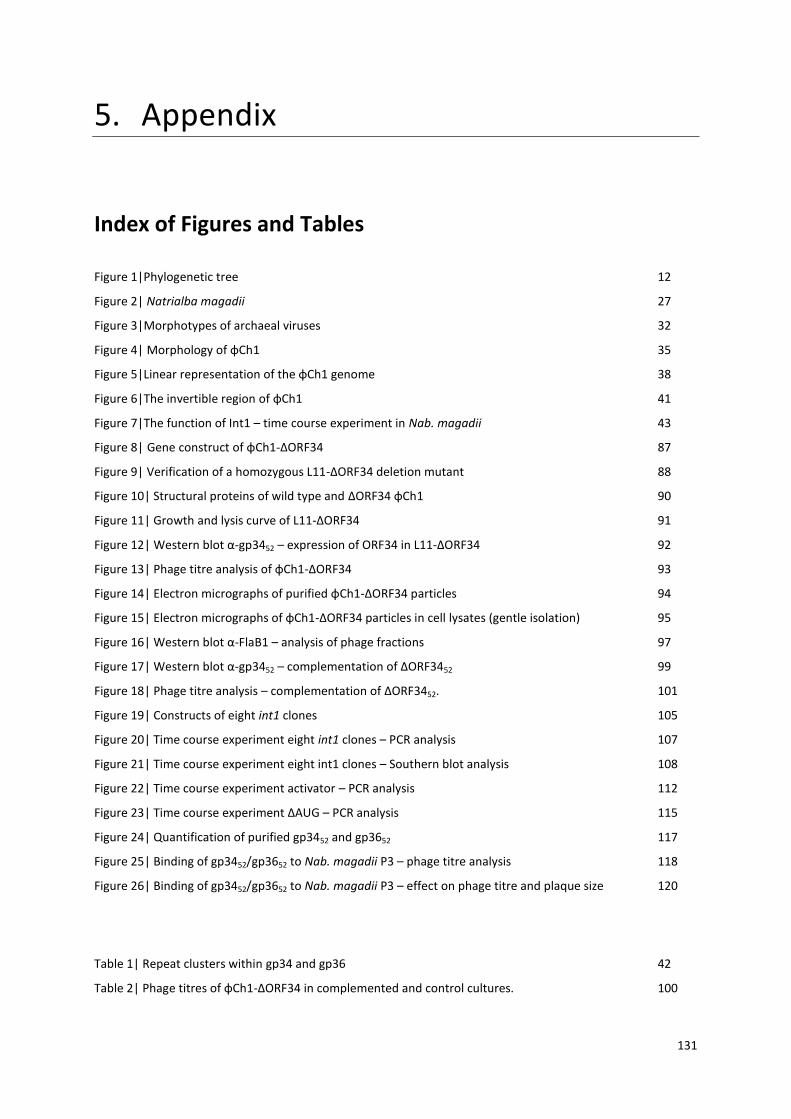
131
5. Appendix
Index of Figures and Tables
Figure 1|Phylogenetic tree
Figure 2| Natrialba magadii
Figure 3|Morphotypes of archaeal viruses
Figure 4| Morphology of φCh1
Figure 5|Linear representation of the φCh1 genome
Figure 6|The invertible region of φCh1
Figure 7|The function of Int1 – time course experiment in Nab. magadii
Figure 8| Gene construct of φCh1-ΔORF34
Figure 9| Verification of a homozygous L11-ΔORF34 deletion mutant
Figure 10| Structural proteins of wild type and ΔORF34 φCh1
Figure 11| Growth and lysis curve of L11-ΔORF34
Figure 12| Western blot α-gp3452 – expression of ORF34 in L11-ΔORF34
Figure 13| Phage titre analysis of φCh1-ΔORF34
Figure 14| Electron micrographs of purified φCh1-ΔORF34 particles
Figure 15| Electron micrographs of φCh1-ΔORF34 particles in cell lysates (gentle isolation)
Figure 16| Western blot α-FlaB1 – analysis of phage fractions
Figure 17| Western blot α-gp3452 – complementation of ΔORF3452
Figure 18| Phage titre analysis – complementation of ΔORF3452.
Figure 19| Constructs of eight int1 clones
Figure 20| Time course experiment eight int1 clones – PCR analysis
Figure 21| Time course experiment eight int1 clones – Southern blot analysis
Figure 22| Time course experiment activator – PCR analysis
Figure 23| Time course experiment ΔAUG – PCR analysis
Figure 24| Quantification of purified gp3452 and gp3652
Figure 25| Binding of gp3452/gp3652 to Nab. magadii P3 – phage titre analysis
Figure 26| Binding of gp3452/gp3652 to Nab. magadii P3 – effect on phage titre and plaque size
12
27
32
35
38
41
43
87
88
90
91
92
93
94
95
97
99
101
105
107
108
112
115
117
118
120
Table 1| Repeat clusters within gp34 and gp36
Table 2| Phage titres of φCh1-ΔORF34 in complemented and control cultures.
42
100


133
Acknowledgements
First of all I want to say that I really enjoyed working on my diploma thesis since social
intercourse of all members of the “halolab” generated a great atmosphere for both, scientific work
and relaxed conversation.
In this respect the first person I want to thank is Prof. Dr. Angela Witte. She gave me the
opportunity to work in her team and raised my enthusiasm for the fascinating world of Archaea. Her
impressive knowledge and working experience in several fields was a great help for the introduction
into scientific work. As a supervisor she always provided advises and support, not only for me, but for
all members of her team. All requests were treated with incredible composure and patience. In
addition, I want to express my especial appreciation for the help during my work as a tutor of student
practical trainings. This time was an important experience for me.
Furthermore I want to thank my colleagues of the “halolab”. During the last year they became
friends of mine rather than co-workers. Especial gratitude goes to my place mate Mag. Tatjana
Svoboda who provided “mental and creative support during my diploma thesis” (Svoboda, 2011), but
also to Beatrix Alte, my main contact person during the last months. In addition I want to thank
Daniel Kiesenhofer as well as our newcomers Katharina Dimmel and Judith Beraha who were very
helpful during the final period of my work. Further thank goes to all Bachelor students who assisted
my work, especially Alexander Leithner, Julia Biebl and Natascha Hruschka. Moreover I am deeply
grateful for the kind and patient introduction into scientific working by the former members of the
“halolab”, Mag. Michael Reiter and Mag. Regina Selb.
Gratitude goes also to all workers of the neighbouring labs as well as the group leaders Prof.
Dr. Udo Bläsi and Mag. Dr. Isabella Moll. Especially I want to thank Dr. Armin Resch and Dr. Elisabeth
Sonnleitner for providing technical support and helpful hints.
Furthermore, especial thank goes to my mother Mag. Renate Till and my father Hubert Till,
who supported me during the whole time of my study, both, financially and emotionally. Their help
was no matter of course, but a gift and enabled realization of my work. Moreover I am very grateful
for every scientific discussion with my mother. But gratitude goes also to all other members of my
family, in particular my sister Mirjam Till. Furthermore I want to thank my closest friends, especially
my best friend Inanna Palikrushew but also Tina Kern and Jan Navara. The contact to them was very
important for my inner balance and represented a good contrast to my scientific work.
Last but not least I want to thank Dr. Elke Bogner for providing the grate electron micrographs.

135
Abstract
One special characteristic of the haloalcaliphilic virus φCh1 is the presence of a genomic region
which gets inverted by the virus encoded site-specific recombinase Int1 during the lysogenic life cycle
of the temperate phage. Since this inversion event results in an exchange of the 3’ ends of ORF34 and
ORF36, this event gives rise to the formation of different gene products of ORF34: the non-inverted
variant (gp341) and the variant comprising the C-terminus of gp36 (gp3452). Both of them represent
putative tail fibre proteins of φCh1, structural elements which are often involved in interaction with
the host cell during initiation of infection. Yet, based on previous studies only gp3452 was supposed
to be crucial for infection of Natrialba magadii, the only known host of φCh1.
To confirm the putative function of gp3452, this work aimed to produce an ORF34 deletion
mutant by replacing of the concerned gene region with a novobiocin resistance cassette (NovR). The
absence of gp34 in the resulting lysogenic culture Nab. magadii L11-ΔORF34 was demonstrated by
western blot analysis. In addition certain phenotypic characteristics of the corresponding mutant
phage particles could be pointed out. On one hand morphological changes which can be explained by
the absence of tail fibre structure could be visualized by electron microscopy. On the other hand
φCh1-ΔORF34 was shown to be at least strongly reduced in its ability to infect Nab. magadii L13.
Based on these results, this work could present evidence for both, the function of gp3452 as the tail
fibre protein of φCh1 as well as its crucial role in infection of Nab. magadii.
In addition to deletion of the putative tail fibre protein gp34, this work describes an attempt to
cause a reduction in the phage titre by competition of φCh1 with different amounts of purified
gp3452 and gp3652. Indeed a tendency to an effect of gp3452 on the number and size of the plaques
resulting from phage infection could be demonstrated, yet to enable a definite conclusion, a larger
approach of titre analysis would be required.
The other part of this thesis contributes to characterization of the inversion process. On one
hand certain features of the Int1 target region were worked out by analysis of different clones
varying either in the orientation or in the nucleic acid composition of the repeats recognized by Int1.
On the other hand the role of the site-specific recombinase Int1 was investigated by deletion of its
start codon, yielding a clone failing expression of this protein. Moreover the effect of a possible
activator of int1 expression was examined. In all three cases time course experiments were
performed in order to analyze the occurrence of inversion events depending on the growth phase
under the respective conditions. However, none of these projects could yield further details about
the mechanism of inversion within ORF34 and ORF36.

137
Zusammenfassung
Ein Merkmal des haloalkaliphilen Virus φCh1 ist das Vorhandensein einer genomischen Region
welche während des lysogene Zyklus des temperenten Phagens durch die viral codierte Rekombinase
Int1 invertiert wird. Da dieses Ereignis einen Austausch der 3‘ Enden von ORF34 und ORF36 zur Folge
hat, ermöglicht es die Bildung verschiedener Genprodukte von ORF34: die uninvertierte Variante
(gp341) und jene Variante die den C-terminus von gp36 trägt (gp3452). Beide stellen mögliche „Tail-
fibre“ Proteine von φCh1 dar, Strukturelemente die häufig an der Interaktion mit der Wirtszelle zu
Beginn einer Infektion beteiligt sind. Aufgrund früherer Studien jedoch wurde eine Bedeutung für die
Infektion von Natrialba magadii, dem einzigen Wirten von φCh1, nur bei gp3452 vermutet.
Um die Funktion von gp3452 zu bestätigen, war es Ziel dieser Diplomarbeit durch Ersetzen der
fraglichen Region durch eine Novobiocinresistenz (NovR) eine ORF34 Deletionsmutante herzustellen.
Das Fehlen von gp34 in der lysogenen Kultur Nab. magadii L11-ΔORF34 wurde mittels Western Blot
nachgewiesen. Außerdem konnten bestimmte phänotypische Merkmale der entsprechenden
Phagenpartikel aufgezeigt werden. Einerseits konnten durch das Fehlen der „Tail-fibre“ Struktur
erklärbare morphologische Veränderungen unter dem Elektronenmikroskop beobachtet werden.
Andererseits wurde gezeigt, dass φCh1-ΔORF34 in seiner Fähigkeit Nab. magadii L13 zu infizieren
zumindest stark eingeschränkt ist. Aufgrund dieser Ergebnisse konnte sowohl die Funktion von
gp3452, als auch seine Bedeutung für die Infektion von Nab. magadii nachgewiesen werden.
Zusätzlich zu der Deletion des vermutlichen „Tail-fibre“ Proteins gp34, beschreibt diese Arbeit
den Versuch durch Konkurrenz zwischen φCh1 und verschiedenen Mengen von gp3452 und gp3652
eine Reduktion des Phagentiters zu bewirken. Tatsächlich konnte ein tendenzieller Einfluss von
gp3452 auf die Plaquezahl und Größe beobachtet werden, für eine eindeutige Schlussfolgerung
jedoch wäre ein größerer Ansatz erforderlich.
Der andere Teil dieser Diplomarbeit dient der Charakterisierung der Inversion. Zum Einen
wurden durch Analyse mehrerer Klone, die sich entweder in der Orientierung oder in der Sequenz
einzelner Repeats unterscheiden, möglicherweise entscheidende Eigenschaften der Zielregion von
Int1 untersucht. Zum Anderen wurde die Bedeutung der Rekombinase Int1 durch Deletion des
Startcodons geprüft. Außerdem wurde der Effekt eines möglichen Aktivators der Expression von int1
untersucht. In allen drei Fällen wurden Zeitreihen durchgeführt um das Auftreten möglicher
Inversionsereignisse in Abhängigkeit von der Zeit unter den jeweiligen Bedingungen zu beleuchten.
Schlussendlich konnte jedoch keines dieser Projekte weitere Einblicke in den Mechanismus der
Inversion zwischen ORF34 und ORF36 liefern.

139
Curriculum Vitae
Personal details:
Name: Petra Till
Date and place of birth: 25th of April, 1986 in Vienna, Austria
Nationality: Austria
Education:
1992 – 1996 Volksschule Perchtoldsdorf, Austria
1996 – 2000 Gymnasium Perchtoldsdorf, Austria
2000 – 2004 BORG Hegelgasse 12, Vienna, Austria (emphasis on arts)
GCE A-levels 2004 (excellent grades)
2005 – 2011 Study “Molecular Biology” (Diploma), University of Vienna, Austria
2010 – 2010 Study “Biology” (Bachelor), University of Vienna, Austria
Successful conclusion 2010: Bachelor of Science (BSc)
2010 – 2011 Diploma thesis “Molecular Biology”: Laboratory of Prof. Dr. Angela Witte;
Department of Microbiology, Immunobiology and Genetics;
University of Vienna; Austria
Working experience:
2004 – 2005 Anker Snack & Coffee Gastronomiebestriebs Gmbh Vienna: sales job
2010/2011 University of Vienna: Tutor of student practical trainings in “Übungen in
Molekulare Mikrobiologie” and “Übung III A - Molekularbiologische
Laborarbeiten”
2010/2011 FH Campus Vienna (University of Applied Sciences): Tutor of student
practical trainings in “Molekularbiologische Übungen I”