Different appendices to numerous material tests offered at Micom Laboratories
8
Page 1 of 8 This report shall not be reproduced except in full, without the written approval of the laboratory. The results herein relate only to the items tested. 556 Avenue Lépine, Dorval, Québec, Canada, H9P 2V6, e-mail : [email protected] Phone : 514-633-0078, fax : 514-633-7188 APPENDIX 1: Color & Δ E L*.a*.b* values: color measurement L*.a*.b*. coordinates refer to the coordinates of the color in the CIELAB 76 sphere. It is actually a three-dimensional space where the L* axis represents the “lightness” of the color (Black to white), a* is the green- red axis and b* is the blue-yellow axis. L* axis goes from 0 (darkest black) to 100 (brighter white), a* goes from -100 (green) to + 100 (red), b* goes from -100 (blue) to + 100 (yellow) 1 . Δ E (Delta E): Color difference measurement In order to quantify the difference between 2 colors, a formula that measures the distance between the 2 colors was established and called ΔE (Delta E). The formula used to determine the distance between color 1 (L 1 *, a 1 *, b 1 *) and color 2 (L 2 *, a 2 *, b 2 *) is: ΔE = [ (L 2 *- L 1 *) 2 + (a 2 *- a 1 *) 2 + (b 2 *- b 1 *) 2 ] 0.5 It was found that the Just Noticeable Difference (JND) 2 is, for most people, at ΔE = 2.3. That means that the magnitude of difference between 2 colors must be 2.3 or more to be noticed. Over the years, some industries came up with their own JND value based on specific needs and applications. The 2.3 value is, however, still widely used as the JND. Other rating scales can also be found in the litterature: Scale #1 3 : 0.0 < ΔE ≤ 0.5: No color difference 0.5 < ΔE ≤ 1.0: Difference only perceivable for experienced observers 1.0 < ΔE ≤ 2.0: Minimal color difference 2.0 < ΔE ≤ 4.0: Perceivable color difference 4.0 < ΔE ≤ 5.0: Significant color difference 5.0 < ΔE : Different colors Scale #2 4 : 0 < ΔE ≤ 1 : Observer does not notice the difference 1 < ΔE ≤ 2 : Only experienced observer can notice the difference 2 < ΔE ≤ 3.5 : Unexperienced observer can notice the difference 3.5 < ΔE ≤ 5 : Clear difference in color is noticed 5 < ΔE : Observer notices two different colors 1 a* and b* axis can technically go further than the usual ± 100 range but it never really happens in practice. 2 Mahy et al. (1994) 3 Published by Dr Bela Torok, M.D., Ph.D. (Ophthalmologist) on ResearchGate.net 4 From « colour difference ΔE – A survey » by Mokrzycki W.S., Tatol M., University of Warmia and Mazury, August 2012.
-
Upload
michel-comtois -
Category
Engineering
-
view
9.763 -
download
0
Transcript of Different appendices to numerous material tests offered at Micom Laboratories
Page 1 of 8
This report shall not be reproduced except in full, without the written approval of the laboratory. The results herein relate only to the items tested.
556 Avenue Lépine, Dorval, Québec, Canada, H9P 2V6, e-mail : [email protected] Phone : 514-633-0078, fax : 514-633-7188
APPENDIX 1: Color & ΔE L*.a*.b* values: color measurement L*.a*.b*. coordinates refer to the coordinates of the color in the CIELAB 76 sphere. It is actually a three-dimensional space where the L* axis represents the “lightness” of the color (Black to white), a* is the green-red axis and b* is the blue-yellow axis. L* axis goes from 0 (darkest black) to 100 (brighter white), a* goes from -100 (green) to + 100 (red), b* goes from -100 (blue) to + 100 (yellow)1.
ΔE (Delta E): Color difference measurement In order to quantify the difference between 2 colors, a formula that measures the distance between the 2 colors was established and called ΔE (Delta E). The formula used to determine the distance between color 1 (L1*, a1*, b1*) and color 2 (L2*, a2*, b2*) is: ΔE = [ (L2*- L1*)2 + (a2*- a1*)2 + (b2*- b1*)2 ] 0.5 It was found that the Just Noticeable Difference (JND)2 is, for most people, at ΔE = 2.3. That means that the magnitude of difference between 2 colors must be 2.3 or more to be noticed. Over the years, some industries came up with their own JND value based on specific needs and applications. The 2.3 value is, however, still widely used as the JND. Other rating scales can also be found in the litterature: Scale #13: 0.0 < ΔE ≤ 0.5: No color difference 0.5 < ΔE ≤ 1.0: Difference only perceivable for experienced observers 1.0 < ΔE ≤ 2.0: Minimal color difference 2.0 < ΔE ≤ 4.0: Perceivable color difference 4.0 < ΔE ≤ 5.0: Significant color difference 5.0 < ΔE : Different colors Scale #24: 0 < ΔE ≤ 1 : Observer does not notice the difference 1 < ΔE ≤ 2 : Only experienced observer can notice the difference 2 < ΔE ≤ 3.5 : Unexperienced observer can notice the difference 3.5 < ΔE ≤ 5 : Clear difference in color is noticed 5 < ΔE : Observer notices two different colors
1a*andb*axiscantechnicallygofurtherthantheusual±100rangebutitneverreallyhappensinpractice.2Mahyetal.(1994)3PublishedbyDrBelaTorok,M.D.,Ph.D.(Ophthalmologist)onResearchGate.net4 From « colour difference ΔE – A survey » by Mokrzycki W.S., Tatol M., University of Warmia and Mazury, August 2012.
Page 2 of 8 Report MI-17-9225-m Customer: Customer Name Date: 2017-04-10
This report shall not be reproduced except in full, without the written approval of the laboratory. The results herein relate only to the items tested.
556 Avenue Lépine, Dorval, Québec, Canada, H9P 2V6, e-mail : [email protected] Phone : 514-633-0078, fax : 514-633-7188
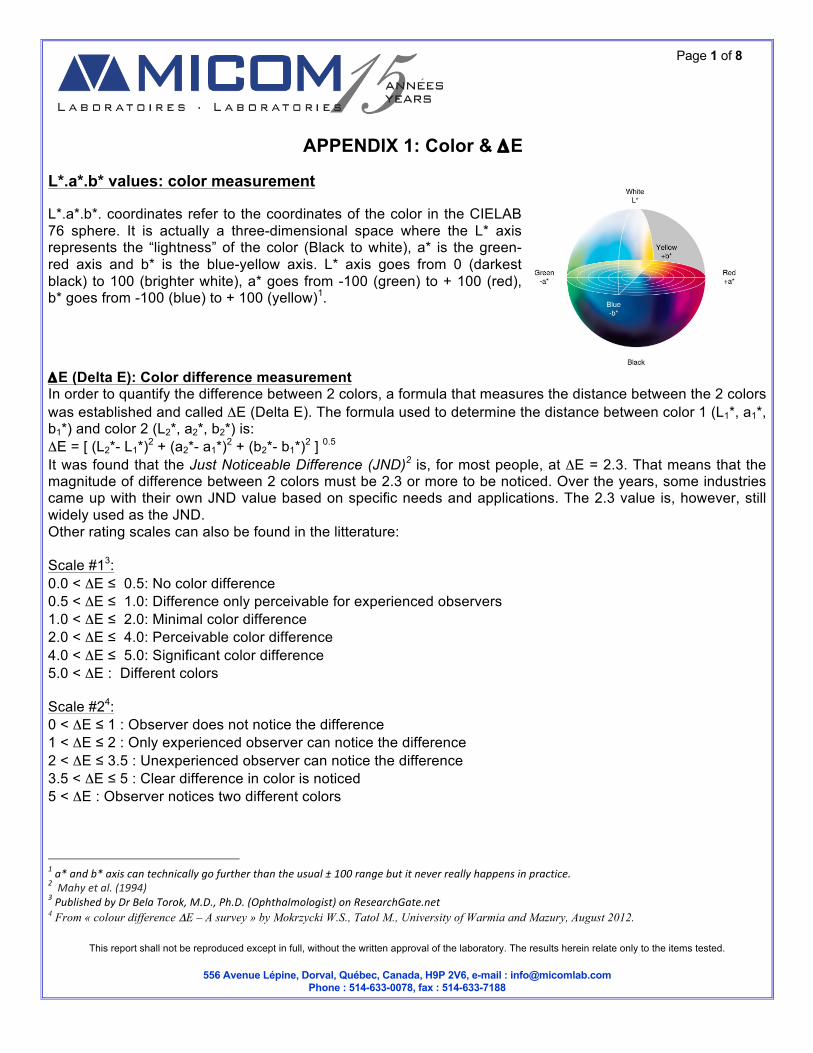
APPENDIX 2: Evaluation of blistering
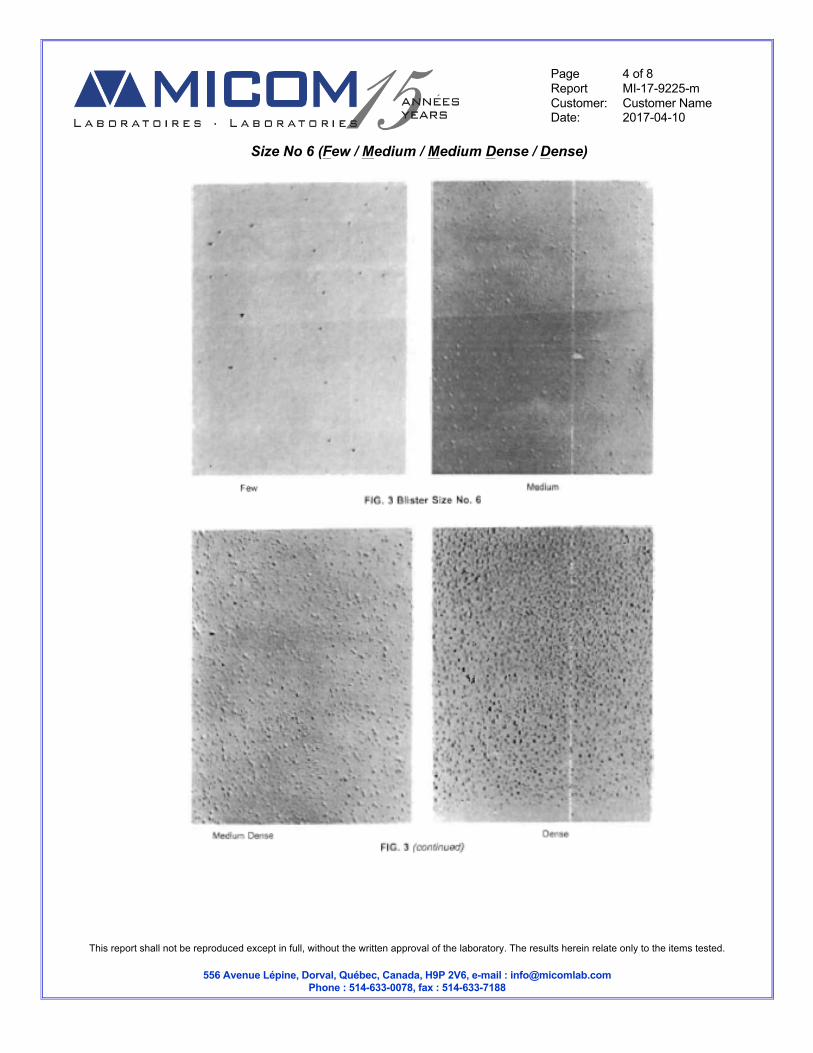
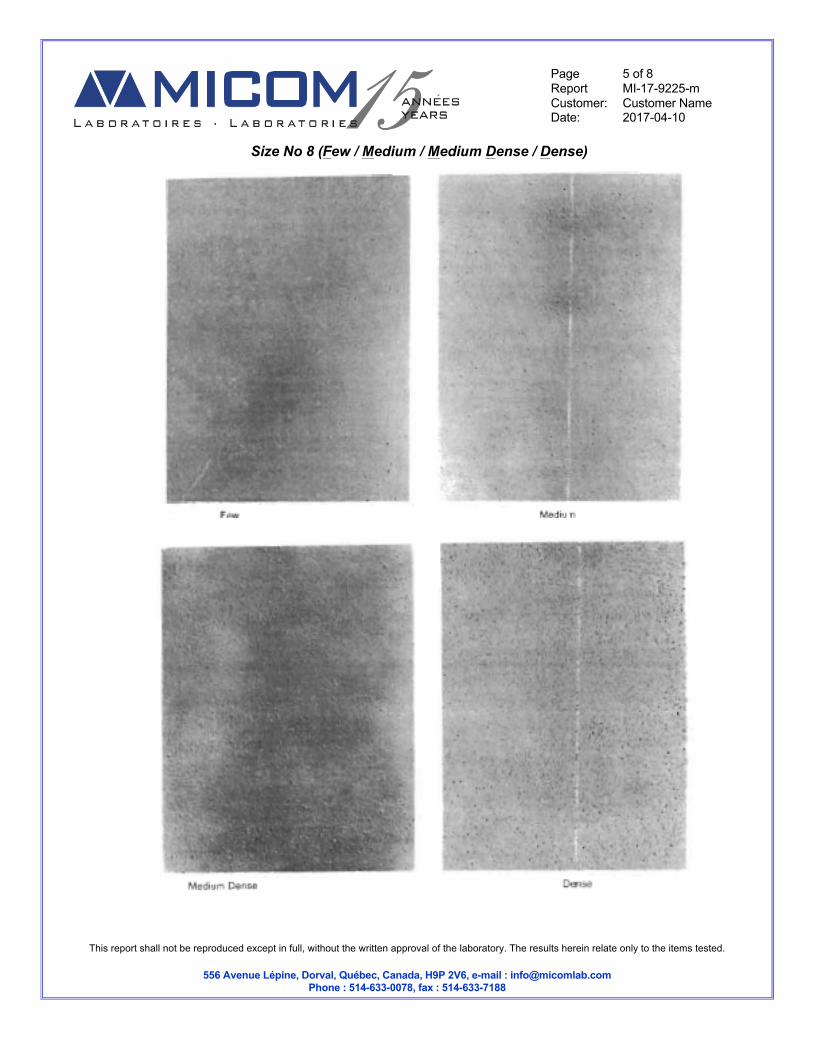
Classification of blistering test results according to ASTM D714 Pictures hereafter are from the current version of ASTM D714 (ASTM D714-02(2009))
Size No 2 (Few / Medium / Medium Dense / Dense)
Page 3 of 8 Report MI-17-9225-m Customer: Customer Name Date: 2017-04-10
This report shall not be reproduced except in full, without the written approval of the laboratory. The results herein relate only to the items tested.
556 Avenue Lépine, Dorval, Québec, Canada, H9P 2V6, e-mail : [email protected] Phone : 514-633-0078, fax : 514-633-7188
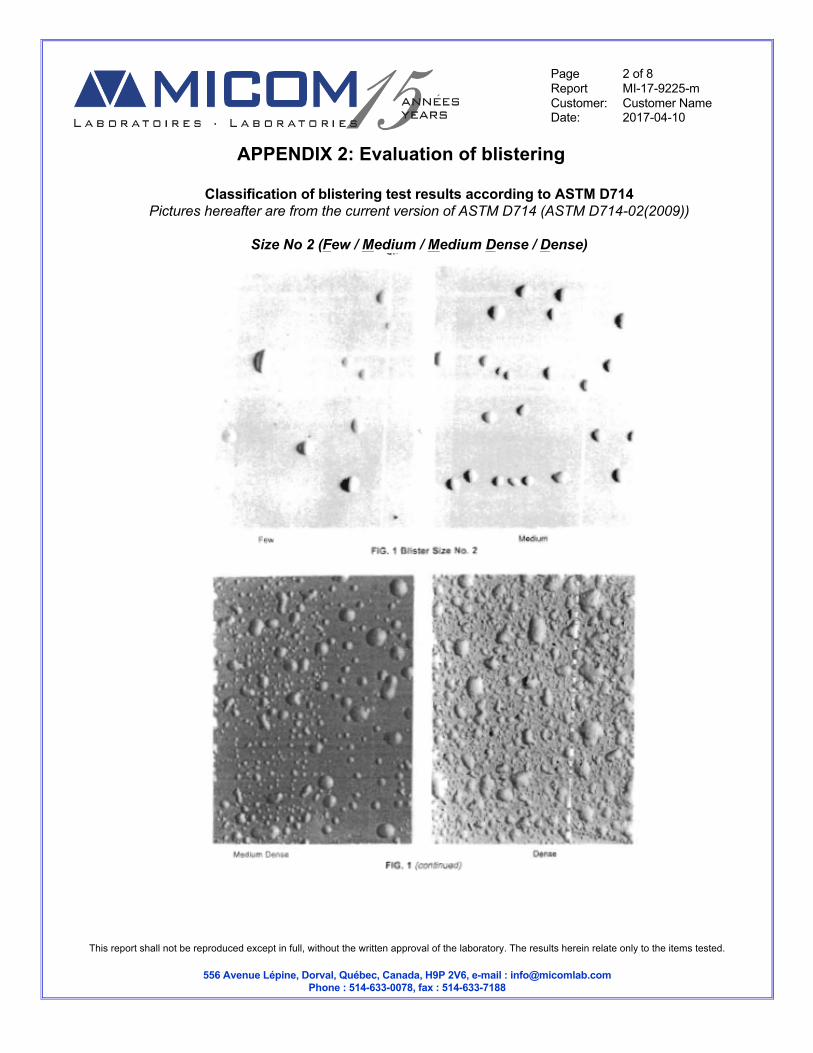
Size No 4 (Few / Medium / Medium Dense / Dense)
Page 4 of 8 Report MI-17-9225-m Customer: Customer Name Date: 2017-04-10
This report shall not be reproduced except in full, without the written approval of the laboratory. The results herein relate only to the items tested.
556 Avenue Lépine, Dorval, Québec, Canada, H9P 2V6, e-mail : [email protected] Phone : 514-633-0078, fax : 514-633-7188
Size No 6 (Few / Medium / Medium Dense / Dense)
Page 5 of 8 Report MI-17-9225-m Customer: Customer Name Date: 2017-04-10
This report shall not be reproduced except in full, without the written approval of the laboratory. The results herein relate only to the items tested.
556 Avenue Lépine, Dorval, Québec, Canada, H9P 2V6, e-mail : [email protected] Phone : 514-633-0078, fax : 514-633-7188
Size No 8 (Few / Medium / Medium Dense / Dense)
Page 6 of 8 Report MI-17-9225-m Customer: Customer Name Date: 2017-04-10
This report shall not be reproduced except in full, without the written approval of the laboratory. The results herein relate only to the items tested.
556 Avenue Lépine, Dorval, Québec, Canada, H9P 2V6, e-mail : [email protected] Phone : 514-633-0078, fax : 514-633-7188
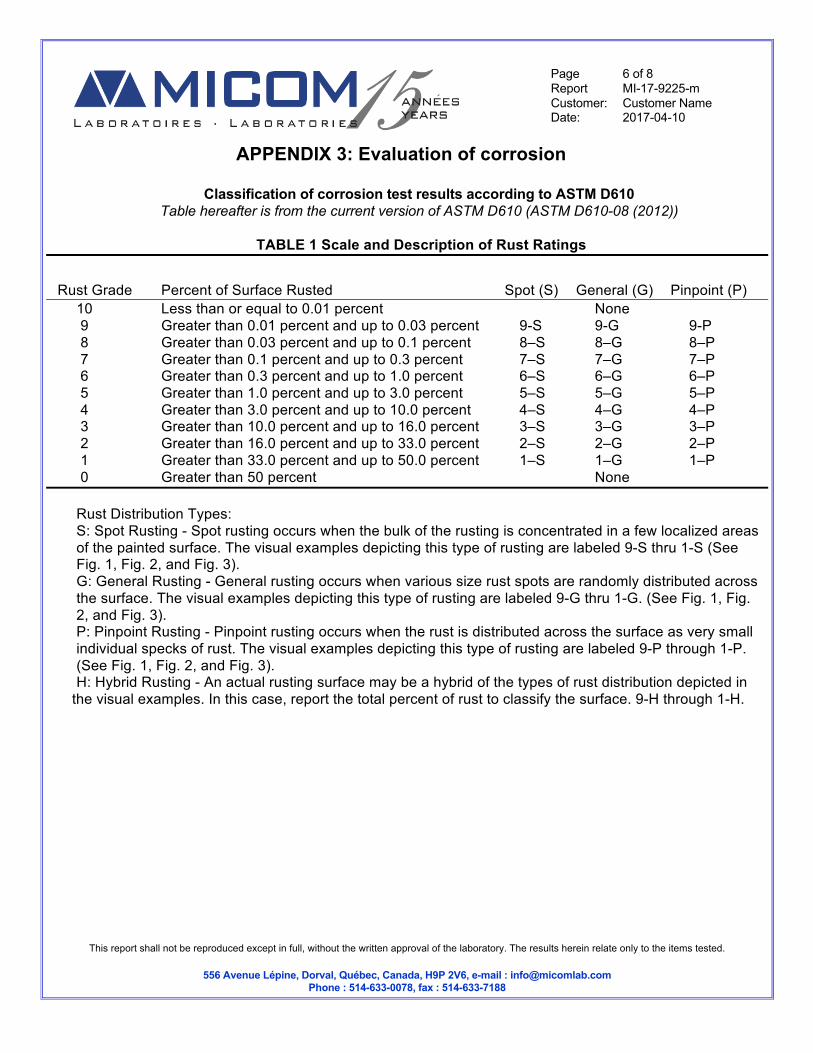
APPENDIX 3: Evaluation of corrosion
Classification of corrosion test results according to ASTM D610 Table hereafter is from the current version of ASTM D610 (ASTM D610-08 (2012))
TABLE 1 Scale and Description of Rust Ratings
Rust Grade Percent of Surface Rusted Spot (S) General (G) Pinpoint (P) 10 Less than or equal to 0.01 percent None 9 Greater than 0.01 percent and up to 0.03 percent 9-S 9-G 9-P 8 Greater than 0.03 percent and up to 0.1 percent 8–S 8–G 8–P 7 Greater than 0.1 percent and up to 0.3 percent 7–S 7–G 7–P 6 Greater than 0.3 percent and up to 1.0 percent 6–S 6–G 6–P 5 Greater than 1.0 percent and up to 3.0 percent 5–S 5–G 5–P 4 Greater than 3.0 percent and up to 10.0 percent 4–S 4–G 4–P 3 Greater than 10.0 percent and up to 16.0 percent 3–S 3–G 3–P 2 Greater than 16.0 percent and up to 33.0 percent 2–S 2–G 2–P 1 Greater than 33.0 percent and up to 50.0 percent 1–S 1–G 1–P 0 Greater than 50 percent None Rust Distribution Types: S: Spot Rusting - Spot rusting occurs when the bulk of the rusting is concentrated in a few localized areas of the painted surface. The visual examples depicting this type of rusting are labeled 9-S thru 1-S (See Fig. 1, Fig. 2, and Fig. 3). G: General Rusting - General rusting occurs when various size rust spots are randomly distributed across the surface. The visual examples depicting this type of rusting are labeled 9-G thru 1-G. (See Fig. 1, Fig. 2, and Fig. 3). P: Pinpoint Rusting - Pinpoint rusting occurs when the rust is distributed across the surface as very small individual specks of rust. The visual examples depicting this type of rusting are labeled 9-P through 1-P. (See Fig. 1, Fig. 2, and Fig. 3). H: Hybrid Rusting - An actual rusting surface may be a hybrid of the types of rust distribution depicted in
the visual examples. In this case, report the total percent of rust to classify the surface. 9-H through 1-H.
Page 7 of 8 Report MI-17-9225-m Customer: Customer Name Date: 2017-04-10
This report shall not be reproduced except in full, without the written approval of the laboratory. The results herein relate only to the items tested.
556 Avenue Lépine, Dorval, Québec, Canada, H9P 2V6, e-mail : [email protected] Phone : 514-633-0078, fax : 514-633-7188
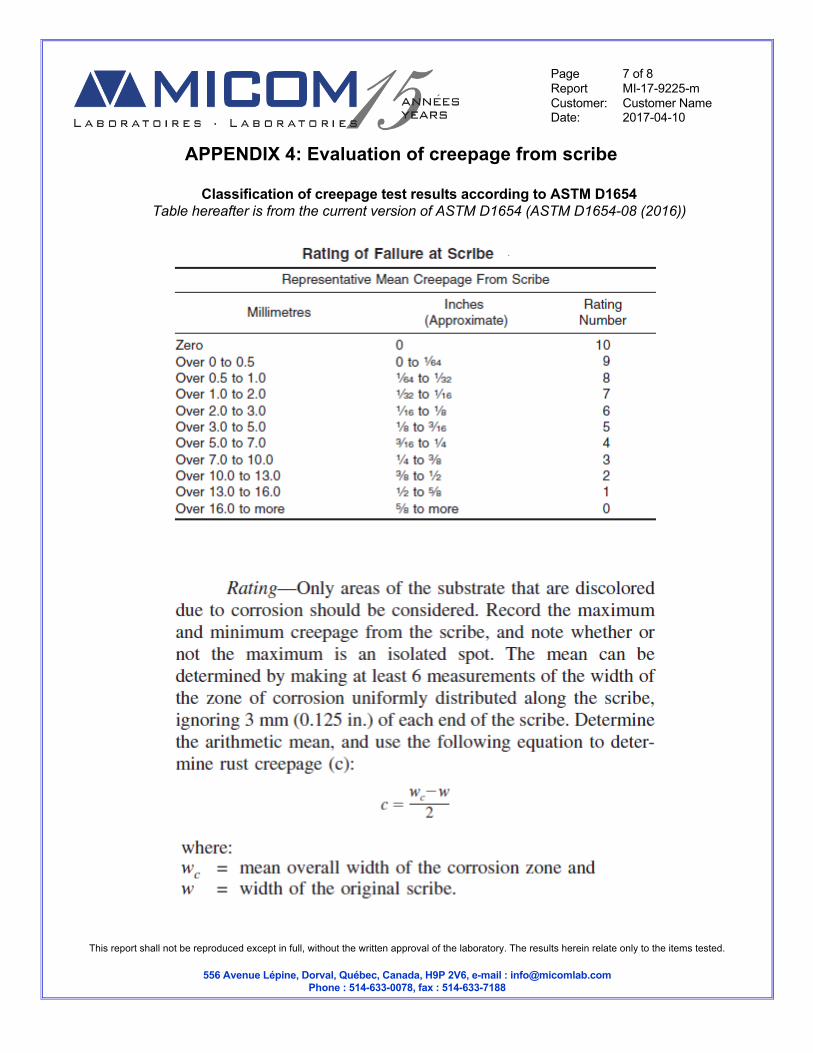
APPENDIX 4: Evaluation of creepage from scribe
Classification of creepage test results according to ASTM D1654 Table hereafter is from the current version of ASTM D1654 (ASTM D1654-08 (2016))
Page 8 of 8 Report MI-17-9225-m Customer: Customer Name Date: 2017-04-10
This report shall not be reproduced except in full, without the written approval of the laboratory. The results herein relate only to the items tested.
556 Avenue Lépine, Dorval, Québec, Canada, H9P 2V6, e-mail : [email protected] Phone : 514-633-0078, fax : 514-633-7188
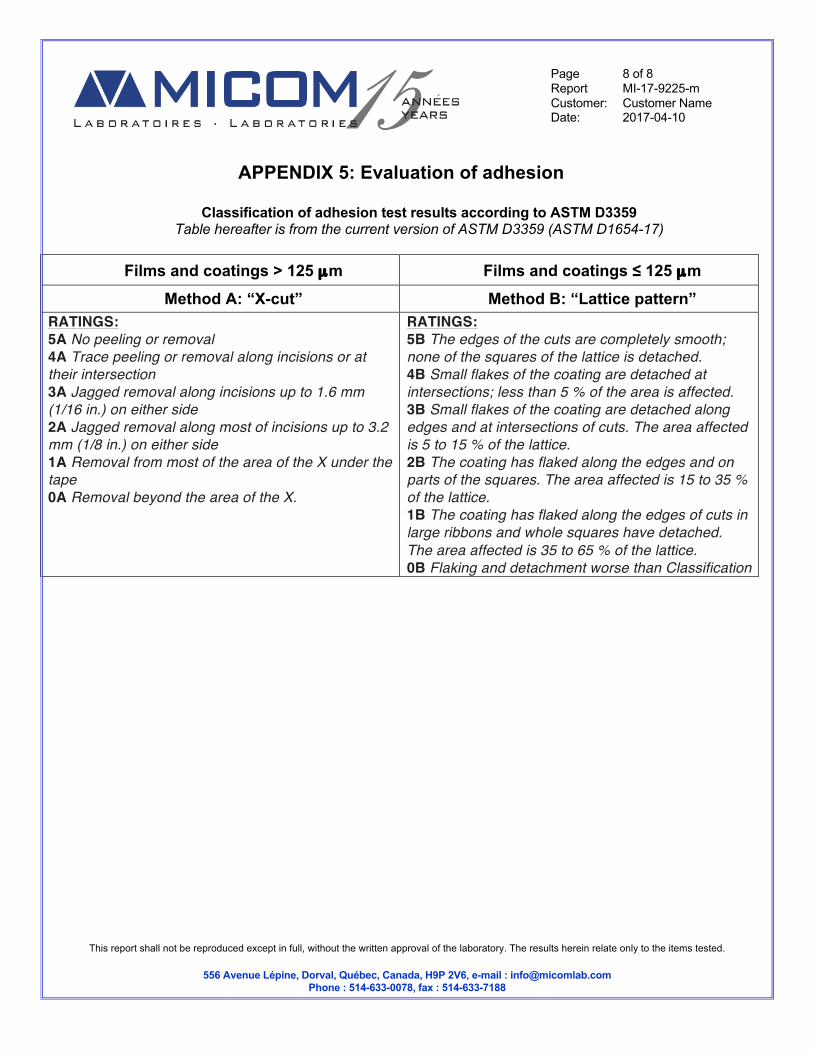
APPENDIX 5: Evaluation of adhesion
Classification of adhesion test results according to ASTM D3359
Table hereafter is from the current version of ASTM D3359 (ASTM D1654-17)
Films and coatings > 125 µm Films and coatings ≤ 125 µm
Method A: “X-cut” Method B: “Lattice pattern” RATINGS: 5A No peeling or removal 4A Trace peeling or removal along incisions or at their intersection 3A Jagged removal along incisions up to 1.6 mm (1/16 in.) on either side 2A Jagged removal along most of incisions up to 3.2 mm (1/8 in.) on either side 1A Removal from most of the area of the X under the tape 0A Removal beyond the area of the X.
RATINGS: 5B The edges of the cuts are completely smooth; none of the squares of the lattice is detached. 4B Small flakes of the coating are detached at intersections; less than 5 % of the area is affected. 3B Small flakes of the coating are detached along edges and at intersections of cuts. The area affected is 5 to 15 % of the lattice. 2B The coating has flaked along the edges and on parts of the squares. The area affected is 15 to 35 % of the lattice. 1B The coating has flaked along the edges of cuts in large ribbons and whole squares have detached. The area affected is 35 to 65 % of the lattice. 0B Flaking and detachment worse than Classification 1B.