Dietary Supplement Laboratory Quality Assurance Program: Exercise … · · 2017-01-10Dietary...
139
Dietary Supplement Laboratory Quality Assurance Program: Exercise G Final Report Melissa M. Phillips Catherine A. Rimmer Laura J. Wood This publication is available free of charge from: https://doi.org/10.6028/NIST.IR.8163 NIST IR 8163
-
Upload
vuongduong -
Category
Documents
-
view
224 -
download
3
Transcript of Dietary Supplement Laboratory Quality Assurance Program: Exercise … · · 2017-01-10Dietary...
Dietary Supplement Laboratory Quality Assurance Program:
Exercise G Final Report
Melissa M. Phillips Catherine A. Rimmer
Laura J. Wood
This publication is available free of charge from: https://doi.org/10.6028/NIST.IR.8163
NIST IR 8163
NIST IR 8163
Dietary Supplement Laboratory Quality Assurance Program:
Exercise G Final Report
Melissa M. Phillips Catherine A. Rimmer
Laura J. Wood Chemical Sciences Division
Material Measurement Laboratory
This publication is available free of charge from: https://doi.org/10.6028/NIST.IR.8163
January 2017
U.S. Department of Commerce Penny Pritzker, Secretary
National Institute of Standards and Technology
Kent Rochford, Acting NIST Director and Under Secretary of Commerce for Standards and Technology
i
This publication is available free of charge from: https://doi.org/10.6028/N
IST.IR.8163
TABLE OF CONTENTS ABSTRACT ....................................................................................................................................1 INTRODUCTION..........................................................................................................................1 OVERVIEW OF DATA TREATMENT AND REPRESENTATION .....................................2
Statistics ...............................................................................................................................2 Individualized Data Table ....................................................................................................3 Summary Data Table ...........................................................................................................4 Graphs ..................................................................................................................................4 Data Summary View (Method Comparison Data Summary View) ........................4 Sample/Sample Comparison View ..........................................................................5
NUTRITIONAL ELEMENTS (Na) IN POWDERED MATRICES ........................................6
Study Overview ...................................................................................................................6 Sample Information .............................................................................................................6 Tomato Leaves .........................................................................................................6 Cranberries ...............................................................................................................6 Study Results .......................................................................................................................6 Technical Recommendations ...............................................................................................7 Table 1. Individual data table (NIST) for sodium in foods and dietary supplements ........9 Table 2. Data summary table for sodium in foods and dietary supplements ...................10 Figure 1. Sodium in SRM 1573a Tomato Leaves (data summary view – digestion
method) ..................................................................................................................11 Figure 2. Sodium in SRM 3281 Cranberry (Fruit) (data summary view – digestion
method) ..................................................................................................................12 Figure 3. Sodium in SRM 1573a Tomato Leaves (data summary view – instrumental
methods) .................................................................................................................13 Figure 4. Sodium in SRM 3281 Cranberry (Fruit) (data summary view – instrumental
methods) .................................................................................................................14 Figure 5. Sodium in SRM 1573a Tomato Leaves and SRM 3281 Cranberry (Fruit)
(sample/sample comparison view) .........................................................................15 TOXIC ELEMENTS (Pb) IN DIETARY SUPPLEMENTS ...................................................16
Study Overview .................................................................................................................16 Sample Information ...........................................................................................................16 Ephedra-Containing Tablets ..................................................................................16 Multivitamin/Multielement Tablets .......................................................................16 Study Results .....................................................................................................................17 Technical Recommendations .............................................................................................17 Table 3. Individual data table (NIST) for lead in dietary supplements ............................19 Table 4. Data summary table for lead in dietary supplements .........................................20 Figure 6. Lead in SRM 3243 Ephedra-Containing Tablets (data summary view –
instrumental method) .............................................................................................22 Figure 7. Lead in SRM 3280 Multivitamin/Multielement Tablets (data summary view –
ii
This publication is available free of charge from: https://doi.org/10.6028/N
IST.IR.8163
instrumental method) .............................................................................................23 Figure 8. Lead in SRM 3243 Ephedra-Containing Tablets and SRM 3280
Multivitamin/Multielement Tablets (sample/control comparison view) ...............24 FOLIC ACID IN FOOD MATRICES .......................................................................................25
Study Overview .................................................................................................................25 Sample Information ...........................................................................................................25 Fortified Breakfast Cereal ......................................................................................25 Milk Powder...........................................................................................................25 Study Results .....................................................................................................................25 Technical Recommendations .............................................................................................26 Table 5. Individual data table (NIST) for folic acid in foods ...........................................27 Table 6. Data summary table for folic acid in dietary supplements .................................28 Figure 9. Folic acid in SRM 3233 Fortified Breakfast Cereal (data summary view –
sample preparation method) ...................................................................................29 Figure 10. Folic acid in Fortified Milk Powder (data summary view – sample
preparation method) ...............................................................................................30 Figure 11. Folic acid in SRM 3233 Fortified Breakfast Cereal (data summary view –
instrumental method) .............................................................................................31 Figure 12. Folic acid in Fortified Milk Powder (data summary view – instrumental
method) ..................................................................................................................32 Figure 13. Folic acid in SRM 3233 Fortified Breakfast Cereal and Fortified Milk
Powder (sample/sample comparison view) ...........................................................33 β-CAROTENE IN SOLUTIONS AND DIETARY SUPPLEMENTS ....................................34
Study Overview .................................................................................................................34 Sample Information ...........................................................................................................34 β-carotene Solution 1 .............................................................................................34 β-carotene Solution 2 .............................................................................................34 Saw Palmetto Extract .............................................................................................34 Study Results .....................................................................................................................35 Technical Recommendations .............................................................................................35 Table 7. Individual data table (NIST) for β-carotene in solutions and dietary
supplements............................................................................................................37 Table 8. Data summary table for trans-β-carotene in solutions and dietary
supplements............................................................................................................38 Table 9. Data summary table for 9-cis-β-carotene in solutions and dietary
supplements............................................................................................................39 Table 10. Data summary table for 13-cis-β-carotene in solutions and dietary
supplements............................................................................................................40 Table 11. Data summary table for 15-cis-β-carotene in solutions and dietary
supplements............................................................................................................41 Table 12. Data summary table for total β-carotene in solutions and dietary
supplements............................................................................................................42 Figure 14. Total β-carotene in Solution 1 (data summary view – sample preparation
method) ..................................................................................................................43
iii
This publication is available free of charge from: https://doi.org/10.6028/N
IST.IR.8163
Figure 15. Total β-carotene in Solution 2 (data summary view – sample preparation method) ..................................................................................................................44
Figure 16. Total β-carotene in SRM 3251 Serenoa repens Extract (data summary view – sample preparation method) ................................................................................45
Figure 17. Total β-carotene in Solution 1 (data summary view – instrumental method) ..................................................................................................................46
Figure 18. Total β-carotene in Solution 2 (data summary view – instrumental method) ..................................................................................................................47
Figure 19. Total β-carotene in SRM 3251 Serenoa repens Extract (data summary view – instrumental method) ..........................................................................................48
Figure 20. trans-β-carotene in Solution 1 (data summary view) .....................................49 Figure 21. trans-β-carotene in Solution 2 (data summary view) .....................................50 Figure 22. trans-β-carotene in SRM 3251 Serenoa repens Extract (data summary
view) ......................................................................................................................51 Figure 23. 9-cis-β-carotene in Solution 2 (data summary view)......................................52 Figure 24. 9-cis-β-carotene in SRM 3251 Serenoa repens Extract (data summary
view) ......................................................................................................................53 Figure 25. Total β-carotene in Solution 1 and Solution 2 (sample/sample comparison
view) ......................................................................................................................54 Figure 26. Total β-carotene in Solution 1 and SRM 3251 Serenoa repens Extract
(sample/sample comparison view) .........................................................................55 Figure 27. Total β-carotene in Solution 2 and SRM 3251 Serenoa repens Extract
(sample/sample comparison view) .........................................................................56 ANTHOCYANINS & ANTHOCYANIDINS IN DIETARY SUPPLEMENTS ....................57
Study Overview .................................................................................................................57 Sample Information ...........................................................................................................57 Cranberry Extract ...................................................................................................57 Bilberry Extract ......................................................................................................57 Study Results .....................................................................................................................57 Technical Recommendations .............................................................................................58 Table 13. Individual data table (NIST) for anthocyanins and anthocyanidins in dietary
supplements............................................................................................................60 Table 14. Data summary table for cyanidin in dietary supplements ................................61 Table 15. Data summary table for cyanidin-3-arabinoside in dietary supplements .........62 Table 16. Data summary table for cyanidin-3-galactoside in dietary supplements .........63 Table 17. Data summary table for cyanidin-3-glucoside in dietary supplements ............64 Table 18. Data summary table for cyanidin equivalents in dietary supplements .............65 Table 19. Data summary table for delphinidin in dietary supplements ...........................66 Table 20. Data summary table for delphinidin-3-arabinoside in dietary supplements ....67 Table 21. Data summary table for delphinidin-3-galactoside in dietary supplements .....68 Table 22. Data summary table for delphinidin-3-glucoside in dietary supplements .......69 Table 23. Data summary table for delphinidin equivalents in dietary supplements ........70 Table 24. Data summary table for malvidin in dietary supplements ...............................71 Table 25. Data summary table for malvidin-3-arabinoside in dietary supplements ........72 Table 26. Data summary table for malvidin-3-galactoside in dietary supplements .........73
iv
This publication is available free of charge from: https://doi.org/10.6028/N
IST.IR.8163
Table 27. Data summary table for malvidin-3-glucoside in dietary supplements ...........74 Table 28. Data summary table for malvidin equivalents in dietary supplements ............75 Table 29. Data summary table for peonidin in dietary supplements ................................76 Table 30. Data summary table for peonidin-3-arabinoside in dietary supplements .........77 Table 31. Data summary table for peonidin-3-galactoside in dietary supplements .........78 Table 32. Data summary table for peonidin-3-glucoside in dietary supplements ............79 Table 33. Data summary table for peonidin equivalents in dietary supplements ............80 Table 34. Data summary table for petunidin in dietary supplements ...............................81 Table 35. Data summary table for petunidin-3-arabinoside in dietary supplements .......82 Table 36. Data summary table for petunidin-3-galactoside in dietary supplements ........83 Table 37. Data summary table for petunidin-3-glucoside in dietary supplements ...........84 Table 38. Data summary table for petunidin equivalents in dietary supplements ...........85 Table 39. Data summary table for total anthocyanins in dietary supplements ................86 Figure 28. Cyanidin in SRM 3283 Cranberry Extract (data summary view) ..................87 Figure 29. Cyanidin in SRM 3291 Bilberry Extract (data summary view) .....................88 Figure 30. Cyanidin-3-arabinoside in SRM 3283 Cranberry Extract (data summary
view) ......................................................................................................................89 Figure 31. Cyanidin-3-arabinoside in SRM 3291 Bilberry Extract (data summary
view) ......................................................................................................................90 Figure 32. Cyanidin-3-galactoside in SRM 3283 Cranberry Extract (data summary
view) ......................................................................................................................91 Figure 33. Cyanidin-3-galactoside in SRM 3291 Bilberry Extract (data summary
view) ......................................................................................................................92 Figure 34. Cyanidin-3-glucoside in SRM 3283 Cranberry Extract (data summary
view) ......................................................................................................................93 Figure 35. Cyanidin-3-glucoside in SRM 3291 Bilberry Extract (data summary view) .94 Figure 36. Cyanidin equivalents in SRM 3283 Cranberry Extract (data summary
view) ......................................................................................................................95 Figure 37. Cyanidin equivalents in SRM 3291 Bilberry Extract (data summary view) ..96 Figure 38. Delphinidin in SRM 3283 Cranberry Extract (data summary view) ..............97 Figure 39. Delphinidin in SRM 3291 Bilberry Extract (data summary view) .................98 Figure 40. Delphinidin-3-arabinoside in SRM 3291 Bilberry Extract (data summary
view) ......................................................................................................................99 Figure 41. Delphinidin-3-galactoside in SRM 3291 Bilberry Extract (data summary
view) ....................................................................................................................100 Figure 42. Delphinidin-3-glucoside in SRM 3291 Bilberry Extract (data summary
view) ....................................................................................................................101 Figure 43. Delphinidin equivalents in SRM 3283 Cranberry Extract (data summary
view) ....................................................................................................................102 Figure 44. Delphinidin equivalents in SRM 3291 Bilberry Extract (data summary
view) ....................................................................................................................103 Figure 45. Malvidin in SRM 3291 Bilberry Extract (data summary view) ...................104 Figure 46. Malvidin-3-arabinoside in SRM 3291 Bilberry Extract (data summary
view) ....................................................................................................................105 Figure 47. Malvidin-3-galactoside in SRM 3283 Cranberry Extract (data summary
view) ....................................................................................................................106
v
This publication is available free of charge from: https://doi.org/10.6028/N
IST.IR.8163
Figure 48. Malvidin-3-galactoside in SRM 3291 Bilberry Extract (data summary view) ....................................................................................................................107
Figure 49. Malvidin-3-glucoside in SRM 3291 Bilberry Extract (data summary view) ....................................................................................................................108
Figure 50. Malvidin equivalents in SRM 3283 Cranberry Extract (data summary view) ....................................................................................................................109
Figure 51. Malvidin equivalents in SRM 3291 Bilberry Extract (data summary view) 110 Figure 52. Peonidin in SRM 3283 Cranberry Extract (data summary view) .................111 Figure 53. Peonidin in SRM 3291 Bilberry Extract (data summary view) ....................112 Figure 54. Peonidin-3-arabinoside in SRM 3283 Cranberry Extract (data summary
view) ....................................................................................................................113 Figure 55. Peonidin-3-arabinoside in SRM 3291 Bilberry Extract (data summary
view) ....................................................................................................................114 Figure 56. Peonidin-3-galactoside in SRM 3283 Cranberry Extract (data summary
view) ....................................................................................................................115 Figure 57. Peonidin-3-galactoside in SRM 3291 Bilberry Extract (data summary
view) ....................................................................................................................116 Figure 58. Peonidin-3-glucoside in SRM 3283 Cranberry Extract (data summary
view) ....................................................................................................................117 Figure 59. Peonidin-3-glucoside in SRM 3291 Bilberry Extract (data summary view) 118 Figure 60. Peonidin equivalents in SRM 3283 Cranberry Extract (data summary
view) ....................................................................................................................119 Figure 61. Peonidin equivalents in SRM 3291 Bilberry Extract (data summary view) 120 Figure 62. Petunidin in SRM 3291 Bilberry Extract (data summary view) ..................121 Figure 63. Petunidin-3-arabinoside in SRM 3291 Bilberry Extract (data summary
view) ....................................................................................................................122 Figure 64. Petunidin-3-galactoside in SRM 3291 Bilberry Extract (data summary
view) ....................................................................................................................123 Figure 65. Petunidin-3-glucoside in SRM 3283 Cranberry Extract (data summary
view) ....................................................................................................................124 Figure 66. Petunidin-3-glucoside in SRM 3291 Bilberry Extract (data summary
view) ....................................................................................................................125 Figure 67. Petunidin equivalents in SRM 3283 Cranberry Extract (data summary
view) ....................................................................................................................126 Figure 68. Petunidin equivalents in SRM 3291 Bilberry Extract (data summary
view) ....................................................................................................................127 Figure 69. Total anthocyanins in SRM 3283 Cranberry Extract (data summary view –
sample preparation method) .................................................................................128 Figure 70. Total anthocyanins in SRM 3291 Bilberry Extract (data summary view –
sample preparation method) .................................................................................129 Figure 71. Total anthocyanins in SRM 3283 Cranberry Extract (data summary view –
instrumental method) ...........................................................................................130 Figure 72. Total anthocyanins in SRM 3291 Bilberry Extract (data summary view –
instrumental method) ...........................................................................................131 Figure 73. Total anthocyanins in SRM 3283 Cranberry Extract and SRM 3291 Bilberry
Extract (sample/sample comparison view) ..........................................................132
1
This publication is available free of charge from: https://doi.org/10.6028/N
IST.IR.8163
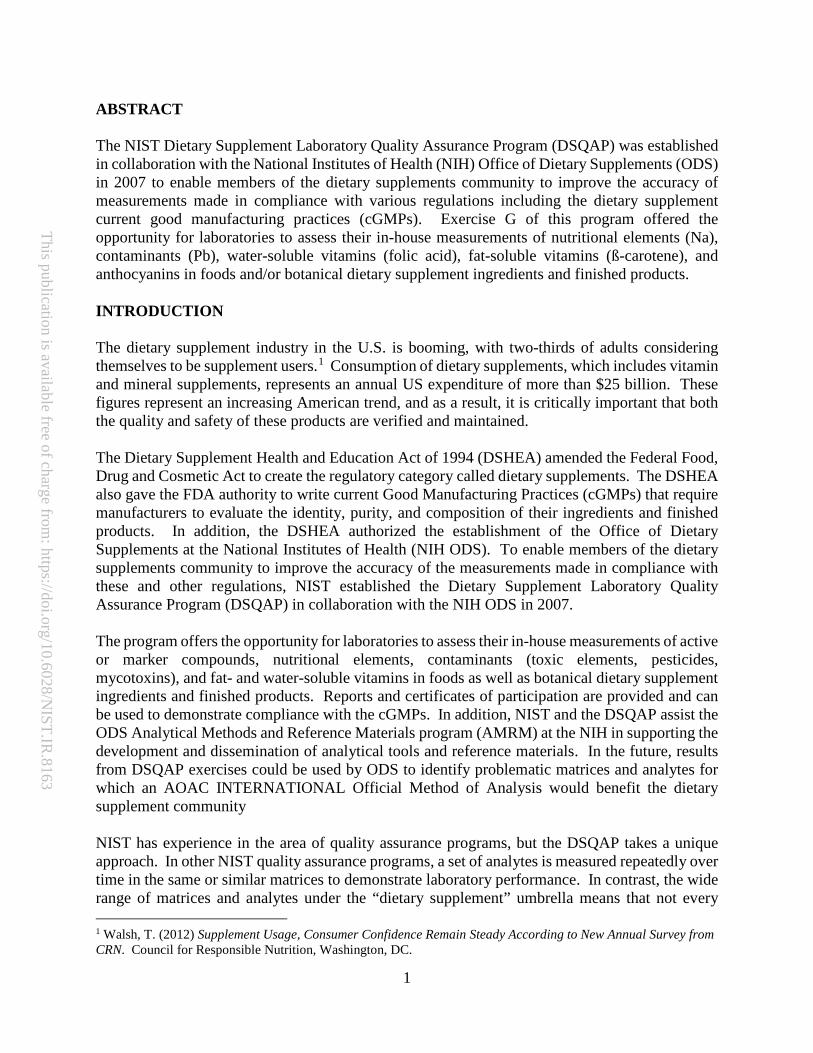
ABSTRACT The NIST Dietary Supplement Laboratory Quality Assurance Program (DSQAP) was established in collaboration with the National Institutes of Health (NIH) Office of Dietary Supplements (ODS) in 2007 to enable members of the dietary supplements community to improve the accuracy of measurements made in compliance with various regulations including the dietary supplement current good manufacturing practices (cGMPs). Exercise G of this program offered the opportunity for laboratories to assess their in-house measurements of nutritional elements (Na), contaminants (Pb), water-soluble vitamins (folic acid), fat-soluble vitamins (ß-carotene), and anthocyanins in foods and/or botanical dietary supplement ingredients and finished products. INTRODUCTION The dietary supplement industry in the U.S. is booming, with two-thirds of adults considering themselves to be supplement users.1 Consumption of dietary supplements, which includes vitamin and mineral supplements, represents an annual US expenditure of more than $25 billion. These figures represent an increasing American trend, and as a result, it is critically important that both the quality and safety of these products are verified and maintained. The Dietary Supplement Health and Education Act of 1994 (DSHEA) amended the Federal Food, Drug and Cosmetic Act to create the regulatory category called dietary supplements. The DSHEA also gave the FDA authority to write current Good Manufacturing Practices (cGMPs) that require manufacturers to evaluate the identity, purity, and composition of their ingredients and finished products. In addition, the DSHEA authorized the establishment of the Office of Dietary Supplements at the National Institutes of Health (NIH ODS). To enable members of the dietary supplements community to improve the accuracy of the measurements made in compliance with these and other regulations, NIST established the Dietary Supplement Laboratory Quality Assurance Program (DSQAP) in collaboration with the NIH ODS in 2007. The program offers the opportunity for laboratories to assess their in-house measurements of active or marker compounds, nutritional elements, contaminants (toxic elements, pesticides, mycotoxins), and fat- and water-soluble vitamins in foods as well as botanical dietary supplement ingredients and finished products. Reports and certificates of participation are provided and can be used to demonstrate compliance with the cGMPs. In addition, NIST and the DSQAP assist the ODS Analytical Methods and Reference Materials program (AMRM) at the NIH in supporting the development and dissemination of analytical tools and reference materials. In the future, results from DSQAP exercises could be used by ODS to identify problematic matrices and analytes for which an AOAC INTERNATIONAL Official Method of Analysis would benefit the dietary supplement community NIST has experience in the area of quality assurance programs, but the DSQAP takes a unique approach. In other NIST quality assurance programs, a set of analytes is measured repeatedly over time in the same or similar matrices to demonstrate laboratory performance. In contrast, the wide range of matrices and analytes under the “dietary supplement” umbrella means that not every 1 Walsh, T. (2012) Supplement Usage, Consumer Confidence Remain Steady According to New Annual Survey from CRN. Council for Responsible Nutrition, Washington, DC.
2
This publication is available free of charge from: https://doi.org/10.6028/N
IST.IR.8163
laboratory is interested in every sample or analyte. The constantly changing dietary supplement market, and the enormous diversity of finished products, makes repeated determinations of a few target compounds in a single matrix of little use to participants. Instead, participating laboratories are interested in testing in-house methods on a wide variety of challenging, real-world matrices to demonstrate that their performance is comparable to that of the community. In an area where there are few standard methods, the DSQAP offers a unique tool for assessment of the quality of measurements, provides feedback about performance, and can assist participants in improving laboratory operations. This report contains the results from the seventh exercise of the DSQAP, Exercise G. Seventy-eight laboratories responded to the call for participants distributed in May 2011. Samples were shipped to participants in July 2011, and results were returned to NIST by October 2011. The information and data contained in this report was disseminated to the participants in June 2011. OVERVIEW OF DATA TREATMENT AND REPRESENTATION Individualized data tables and certificates are provided to the participants that have submitted data in each study, in addition to this report. Examples of the data tables using NIST data are also included in each section of this report. Community tables and graphs are provided using randomized laboratory codes, with identities known only to NIST and individual laboratories. The statistical approaches are outlined below for each type of data representation. Statistics Data tables and graphs throughout this report contain information about the performance of each laboratory relative to that of the other participants in this study and relative to a target around the expected result, if available. The consensus mean and standard deviation are calculated according to the robust algorithm outlined in ISO 13528:2005(E), Annex C.2 The algorithm is summarized here in simplified form. Initial values of the consensus mean, x*, and consensus standard deviation, s*, are estimated as x* = median of xi (i = 1, 2,…,n) s* = 1.483 × median of |xi – x*| (i = 1, 2,…,n). These initial values for x* and s* are updated by first calculating the expanded standard deviation, δ, as δ = 1.5 × s*. Then each xi is compared to the expanded range and adjusted to xi* as described below to reduce the effect of outliers. If xi < x* – δ, then xi* = x* – δ. If xi > x* + δ, then xi* = x* + δ.
2 ISO 13528:2005(E), Statistical methods for use in proficiency testing by interlaboratory comparisons, pp. 14-15.
3
This publication is available free of charge from: https://doi.org/10.6028/N
IST.IR.8163
Otherwise, xi* = xi. New values of x*, s*, and δ are calculated iteratively until the process converges. Convergence is taken as no change from one iteration to the next in the third significant figure of s* and in the equivalent digit in x*: x* = ∑ 𝑥𝑥𝑖𝑖
∗𝑛𝑛𝑖𝑖=1𝑛𝑛
s* = 1.134 × �∑ �𝑥𝑥𝑖𝑖∗−𝑥𝑥∗�𝑛𝑛
𝑖𝑖=1𝑛𝑛−1
.
Individualized Data Table The data in this table is individualized to each participating laboratory and is provided to allow participants to directly compare their data to the summary statistics (consensus or community data as well as NIST certified, reference, or estimated values). The upper left of the data table includes the randomized laboratory code. Tables included in this report are generated using NIST data to protect the identity and performance of participants. Section 1 of the data table contains the laboratory results as reported, including the mean and standard deviation when multiple values were reported. A blank indicates that NIST does not have data on file for that laboratory for a particular analyte or matrix. An empty box for standard deviation indicates that only a single value was reported and therefore that value was not included in the calculation of the consensus data.2 Also in Section 1 are two Z-scores. The first Z-score, Zcomm, is calculated with respect to the community consensus value, using x* and s*: 𝑍𝑍𝑐𝑐𝑐𝑐𝑐𝑐𝑐𝑐 = 𝑥𝑥𝑖𝑖−𝑥𝑥∗
𝑠𝑠∗.
The second Z-score, ZNIST, is calculated with respect to the target value (NIST certified, reference, or estimated value), using xNIST and U95 (the expanded uncertainty) or sNIST (the standard deviation of NIST measurements): 𝑍𝑍𝑁𝑁𝑁𝑁𝑁𝑁𝑁𝑁 = 𝑥𝑥𝑖𝑖−𝑥𝑥𝑁𝑁𝑁𝑁𝑁𝑁𝑁𝑁
𝑈𝑈95
or 𝑍𝑍𝑁𝑁𝑁𝑁𝑁𝑁𝑁𝑁 = 𝑥𝑥𝑖𝑖−𝑥𝑥𝑁𝑁𝑁𝑁𝑁𝑁𝑁𝑁
𝑠𝑠𝑁𝑁𝑁𝑁𝑁𝑁𝑁𝑁.
The significance of the Z-score is as follows:
• |Z| < 2 indicates that the laboratory result is considered to be within the community consensus range (for Zcomm) or NIST target range (for ZNIST).
• 2 < |Z| < 3 indicates that the laboratory result is considered to be marginally different from the community consensus value (for Zcomm) or NIST target value (for ZNIST).
4
This publication is available free of charge from: https://doi.org/10.6028/N
IST.IR.8163
• |Z| > 3 indicates that the laboratory result is considered to be significantly different from the community consensus value (for Zcomm) or NIST target value (for ZNIST).
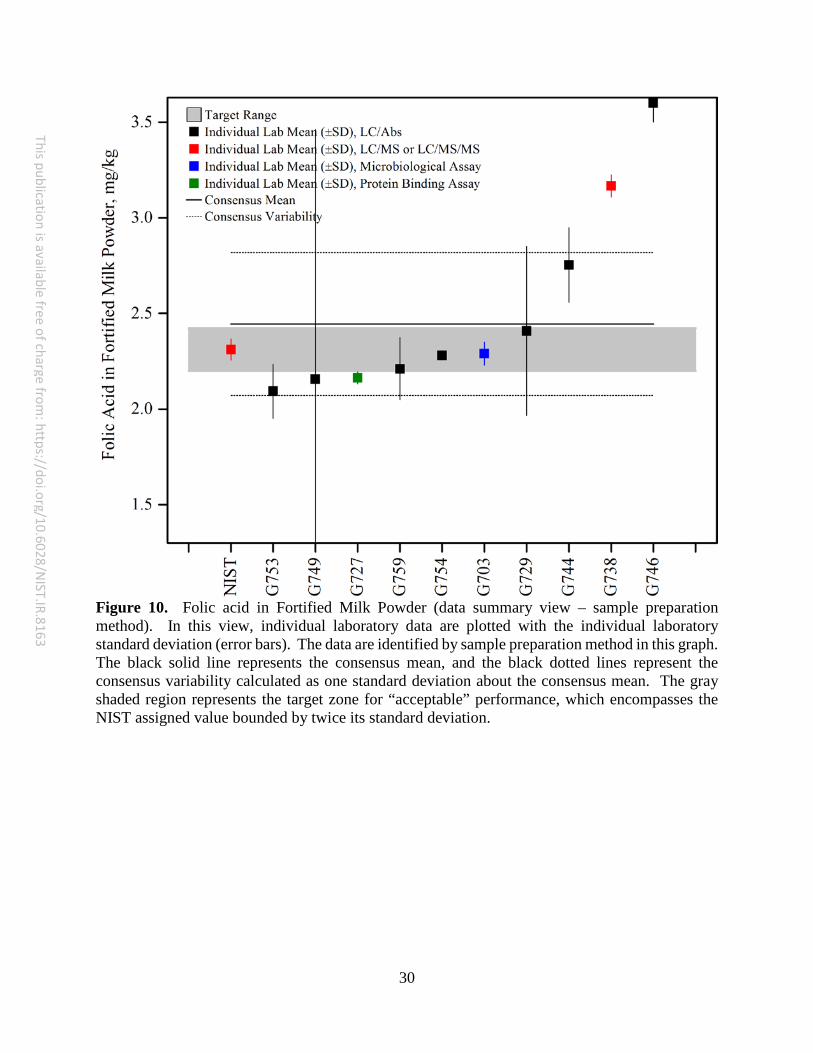
Section 2 of the data table contains the community results, including the number of laboratories reporting more than a single value for a given analyte1, the mean value determined for each analyte, and a robust estimate of the standard deviation of the reported values.3 Consensus means and standard deviations are calculated using the laboratory means; if a laboratory reported a single value, the reported value is not included.3 Additional information on calculation of the consensus mean and standard deviation can be found in the previous section. Section 3 of the data table contains the target values for each analyte. When possible, the target value is a certified or reference value determined at NIST. Certified values and the associated expanded uncertainty (U95) have been determined with two independent analytical methods at NIST, by collaborating laboratories, or in some combination. Reference values are assigned using NIST values obtained from the average and standard deviation of measurements made using a single analytical method or by measurements obtained from collaborating laboratories. For both certified and reference values, at least six samples have been tested and duplicate preparations from the sample package have been included, allowing the uncertainty to encompass variability due to inhomogeneity within and between packages. For samples in which a NIST certified or reference value is not available, the analytes are measured at NIST using an appropriate method. The NIST-assessed value represents the mean of at least three replicates. For materials acquired from another proficiency testing program, the consensus value and uncertainty from the completed round is used as the target range. Summary Data Table This data table includes a summary of all reported data for a particular analyte in a particular study. Participants can compare the raw data for a single laboratory to data reported by the other participating laboratories or to the consensus data. A blank indicates that the laboratory signed up and received samples for that particular analyte and matrix, but NIST does not have data on file for that laboratory. Graphs Data Summary View (Method Comparison Data Summary View) In this view, individual laboratory data are plotted with the individual laboratory standard deviation (error bars). Data points that are unfilled represent laboratories that reported a single value for that analyte and therefore were not included in the consensus mean. The black solid line represents the consensus mean, and the black dotted lines represent the consensus variability calculated as one standard deviation about the consensus mean. Where appropriate, two consensus means may be calculated for the same sample if bimodality is identified in the data. In this case, two consensus means and ranges will be displayed in the data summary view. The gray shaded region represents the target zone for “acceptable” performance, which encompasses the NIST certified, reference, or estimated value bounded by twice its uncertainty (U95) or standard deviation. For the purpose of the DSQAP, a target range spanning twice the uncertainty in the NIST value is selected because participants are only asked to make a limited number of
3 ISO 13528:2005(E), Statistical methods for use in proficiency testing by interlaboratory comparisons, Annex C.
5
This publication is available free of charge from: https://doi.org/10.6028/N
IST.IR.8163
observations. The size of the y-axis on the data summary view graph represents the consensus mean bounded by 2δ. In this view, the relative locations of individual laboratory data and consensus zones with respect to the target zone can be compared easily. In most cases, the target zone and the consensus zone overlap, which is the expected result. The major program goals are to reduce the size of the consensus zone and center the consensus zone about the target value. Analysis of an appropriate reference material as part of a quality control scheme can help to identify sources of bias for laboratories reporting results that are significantly different from the target zone. In the case in which a method comparison is relevant, different colored data points may be used to indicate laboratories that used a specific approach to sample preparation, analysis, or quantitation. Sample/Sample Comparison View In this view, the individual laboratory results for one sample (NIST SRM with a certified or reference value) are compared to the results for another sample (another NIST SRM with a more challenging matrix, a commercial sample, etc.). The error bars represent the individual laboratory standard deviation. The solid red box represents the target zone for the first sample (x-axis) and the second sample (y-axis). The dotted blue box represents the consensus zone for the first sample (x-axis) and the second sample (y-axis). The axes of this graph are centered about the consensus mean values for each sample or control, to a limit of zero and twice the consensus mean. Depending on the variability in the data, the axes may be scaled proportionally to better display the individual data points for each laboratory. In some cases, when the consensus and target ranges have limited overlap, the solid red box may only appear partially on the graph. If the variability in the data is high (greater than 100 % relative standard deviation (RSD)), the dotted blue box may also only appear partially on the graph. This view emphasizes trends in the data that may indicate potential calibration issues or method biases. One program goal is to identify such calibration or method biases and assist participants in improving analytical measurement capabilities. In some cases, when two equally challenging materials are provided, the same view (sample/sample comparison) can be helpful in identifying commonalities or differences in the analysis of the two materials.
6
This publication is available free of charge from: https://doi.org/10.6028/N
IST.IR.8163
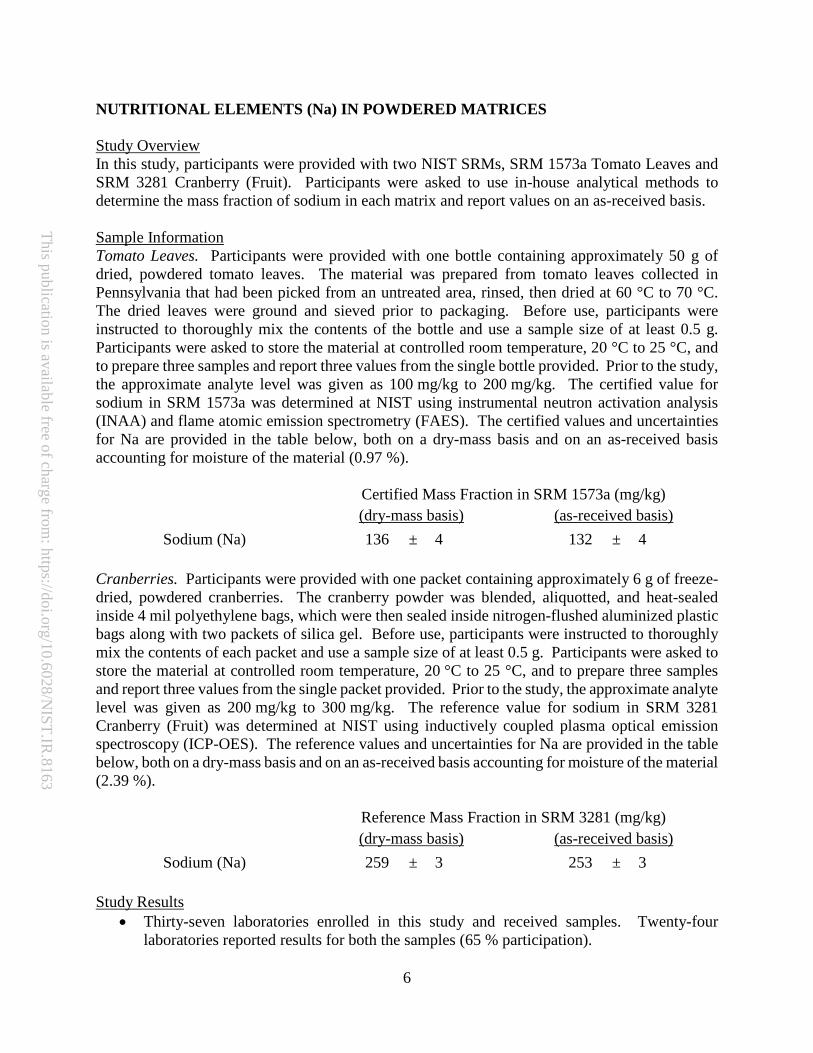
NUTRITIONAL ELEMENTS (Na) IN POWDERED MATRICES Study Overview In this study, participants were provided with two NIST SRMs, SRM 1573a Tomato Leaves and SRM 3281 Cranberry (Fruit). Participants were asked to use in-house analytical methods to determine the mass fraction of sodium in each matrix and report values on an as-received basis. Sample Information Tomato Leaves. Participants were provided with one bottle containing approximately 50 g of dried, powdered tomato leaves. The material was prepared from tomato leaves collected in Pennsylvania that had been picked from an untreated area, rinsed, then dried at 60 °C to 70 °C. The dried leaves were ground and sieved prior to packaging. Before use, participants were instructed to thoroughly mix the contents of the bottle and use a sample size of at least 0.5 g. Participants were asked to store the material at controlled room temperature, 20 °C to 25 °C, and to prepare three samples and report three values from the single bottle provided. Prior to the study, the approximate analyte level was given as 100 mg/kg to 200 mg/kg. The certified value for sodium in SRM 1573a was determined at NIST using instrumental neutron activation analysis (INAA) and flame atomic emission spectrometry (FAES). The certified values and uncertainties for Na are provided in the table below, both on a dry-mass basis and on an as-received basis accounting for moisture of the material (0.97 %).
Certified Mass Fraction in SRM 1573a (mg/kg) (dry-mass basis) (as-received basis)
Sodium (Na) 136 ± 4 132 ± 4 Cranberries. Participants were provided with one packet containing approximately 6 g of freeze-dried, powdered cranberries. The cranberry powder was blended, aliquotted, and heat-sealed inside 4 mil polyethylene bags, which were then sealed inside nitrogen-flushed aluminized plastic bags along with two packets of silica gel. Before use, participants were instructed to thoroughly mix the contents of each packet and use a sample size of at least 0.5 g. Participants were asked to store the material at controlled room temperature, 20 °C to 25 °C, and to prepare three samples and report three values from the single packet provided. Prior to the study, the approximate analyte level was given as 200 mg/kg to 300 mg/kg. The reference value for sodium in SRM 3281 Cranberry (Fruit) was determined at NIST using inductively coupled plasma optical emission spectroscopy (ICP-OES). The reference values and uncertainties for Na are provided in the table below, both on a dry-mass basis and on an as-received basis accounting for moisture of the material (2.39 %).
Reference Mass Fraction in SRM 3281 (mg/kg) (dry-mass basis) (as-received basis)
Sodium (Na) 259 ± 3 253 ± 3 Study Results
• Thirty-seven laboratories enrolled in this study and received samples. Twenty-four laboratories reported results for both the samples (65 % participation).
7
This publication is available free of charge from: https://doi.org/10.6028/N
IST.IR.8163
• For both samples, the consensus ranges were wide but encompassed the NIST target ranges. • The consensus mean for sodium in tomato leaves was on the upper edge of the target
range. • The consensus mean for sodium in the cranberries was above the target range.
• The between-laboratory variability for was high in both materials (29 % and 28 % RSD for the tomato leaves and cranberries, respectively).
• A majority of the laboratories reported using either open-beaker digestion (48 %) or microwave digestion (32 % to 36 %) for sample preparation. The remaining laboratories reported using hot block digestion, dry ashing, or dilution. One laboratory did not report the type of sample preparation technique that was used.
• A majority of the laboratories reported using either ICP-OES (56 %) or ICP-MS (28 %) as their analytical method. Two laboratories reported using atomic absorption spectroscopy, and one laboratory reported using ion chromatography with conductivity detection. One laboratory did not report the type of analytical technique that was used.
• A majority of the laboratories reported using an external standard approach to calibration (88 %). One laboratory reported using a standard addition approach, and one laboratory reported using an internal standard approach. One laboratory did not report the type of calibration approach that was used.
Technical Recommendations The following recommendations are based on results obtained from the participants in this study.
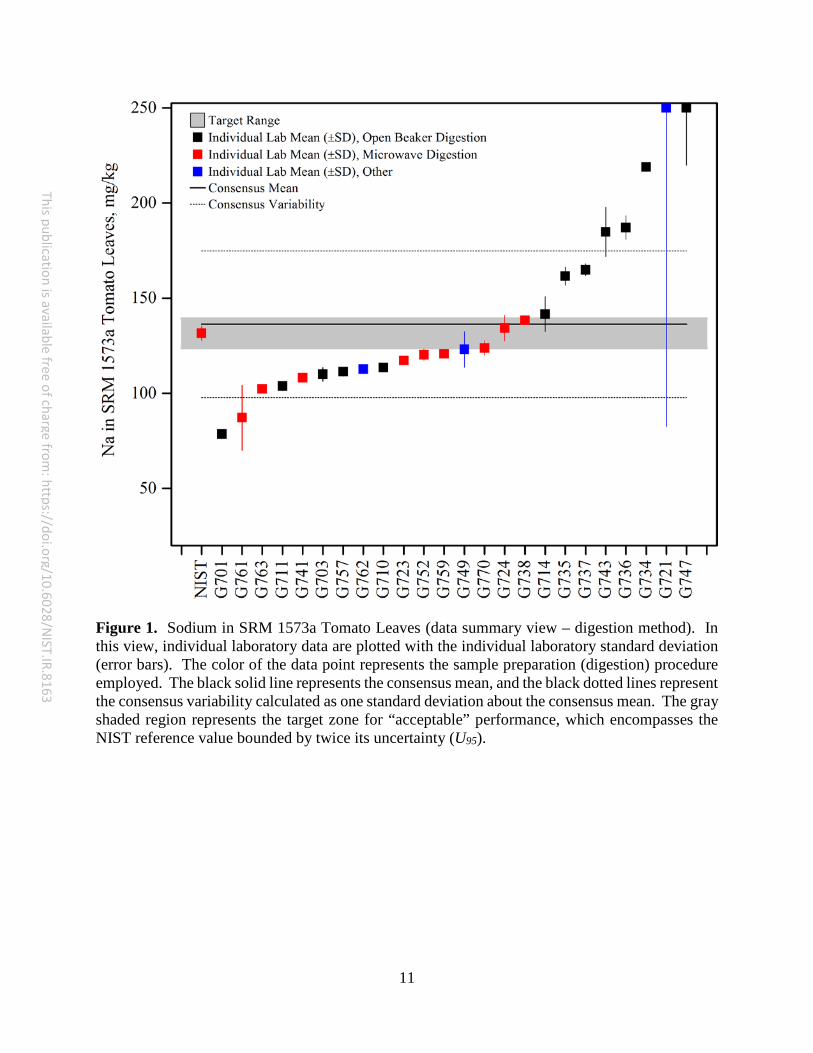
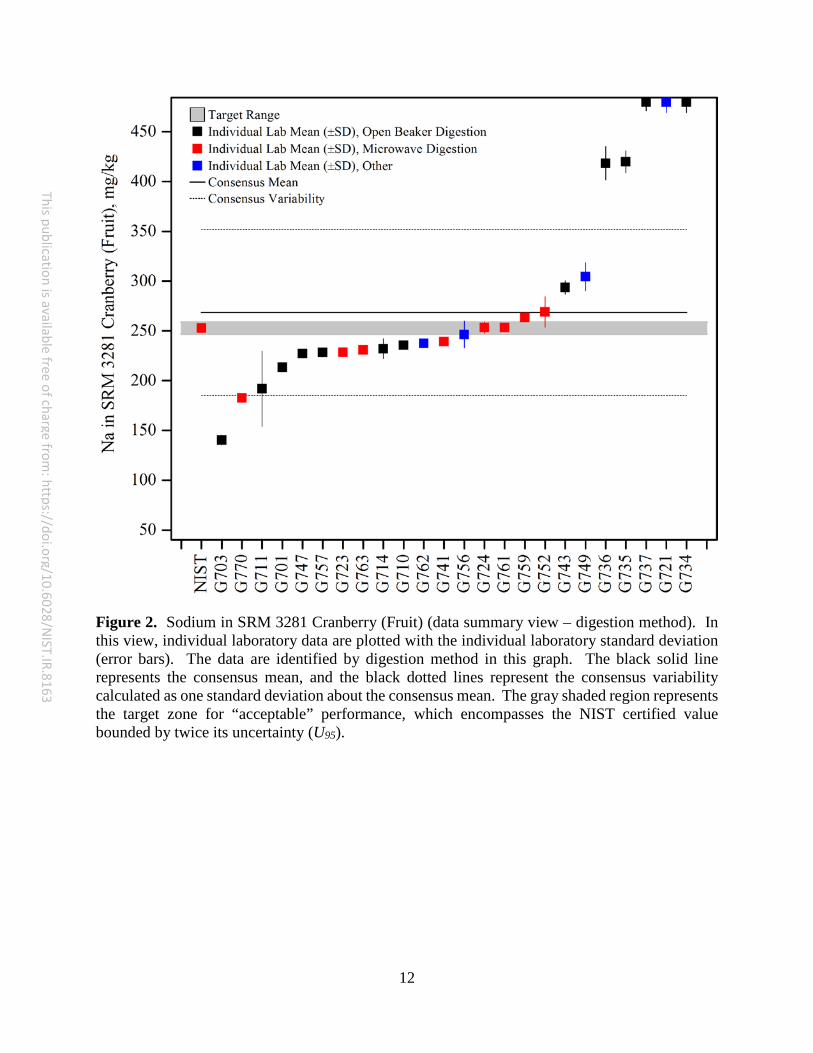
• A significant difference was apparent between results obtained using open beaker and those using microwave digestion. Too few results were reported by other methods to identify any additional trends. • As shown in Figure 1 and Figure 2, laboratories that reported high sodium values also
reported using open beaker digestion. This trend may indicate contamination of samples with sodium from the environment during digestion. • To minimize contamination, work areas should be cleaned prior to sample
preparation, glassware should be cleaned by acid wash prior to use, and exposure of samples to the laboratory environment should be limited.
• If a soap solution is used for cleaning, sodium levels in blank solutions must be checked, as some soaps will give high sodium blank levels.
• Extra procedural reagent blanks should be prepared along with samples to know the extent of sodium contamination from the analysis.
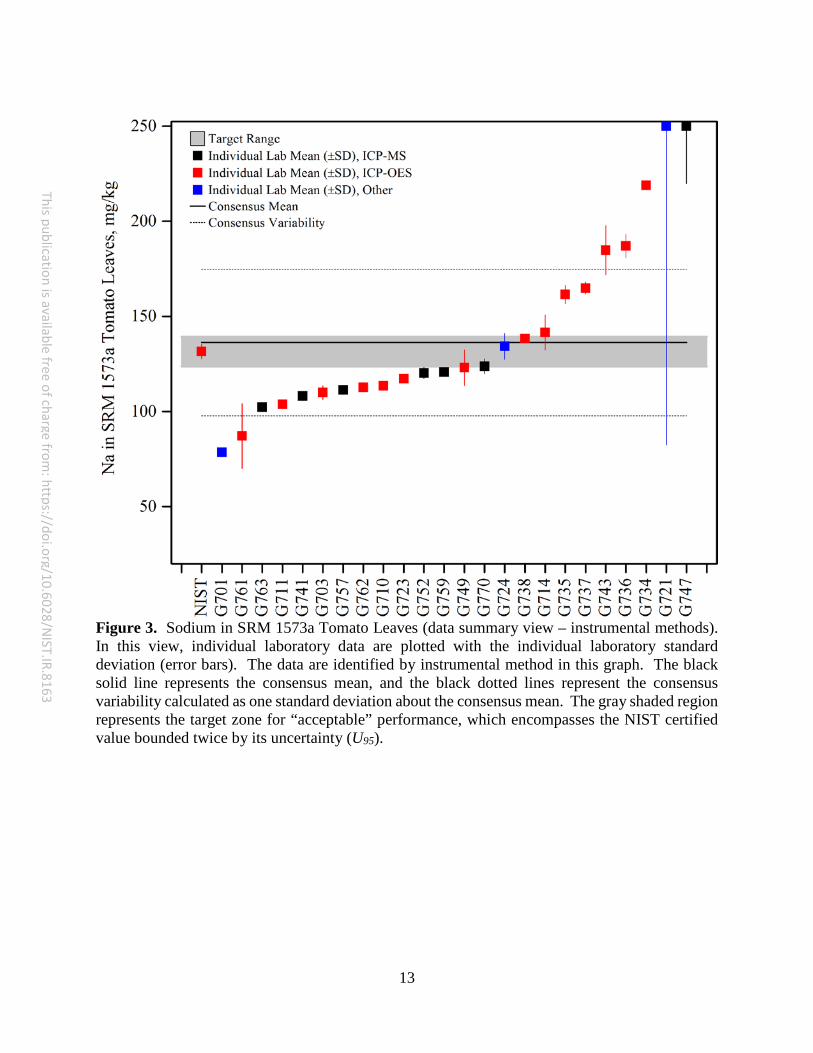
• No difference was apparent in the sodium results based on analytical method used (ICP-OES or ICP-MS). Too few results were reported by other methods to identify any additional trends.
• Additional sources for potential error in the final results may be errors in calibration and dilution.
• Samples with very low sodium levels may be inadvertently diluted below the calibration range and possibly out of the quantification or detection range of the instrument. Care should be taken to evaluate a more concentrated sample if the signal appears to be lower than expected or is below the lowest calibration point.
8
This publication is available free of charge from: https://doi.org/10.6028/N
IST.IR.8163
• Many of the calibration curves reported by participants extended far above the reported working range of sodium in the solutions to be analyzed. While the calibration curve may appear linear over a wide concentration range, a measured value near an end of the calibration curve may have significant bias. For the most accurate results, use calibration points closely surrounding the expected solution concentration, and ensure that the calibration curve is linear along the region of your expected solution concentrations. • The sample/sample comparison graph does not reflect an obvious calibration error.
Some laboratories reported values that were high for one sample but were within range for the second sample. This type of trend may indicate individualized problems with the digestion of one matrix compared to another.
• Quality assurance samples should always be used. These can be commercially available reference materials (CRMs, SRMs, or RMs) or prepared in-house, but need to be of known concentration. • They are used to ensure that the method is performing as expected. • They are useful in finding where errors are occurring, including calculation errors. • After checking for calculation errors, make sure results are reported correctly.
9
This publication is available free of charge from: https://doi.org/10.6028/N
IST.IR.8163
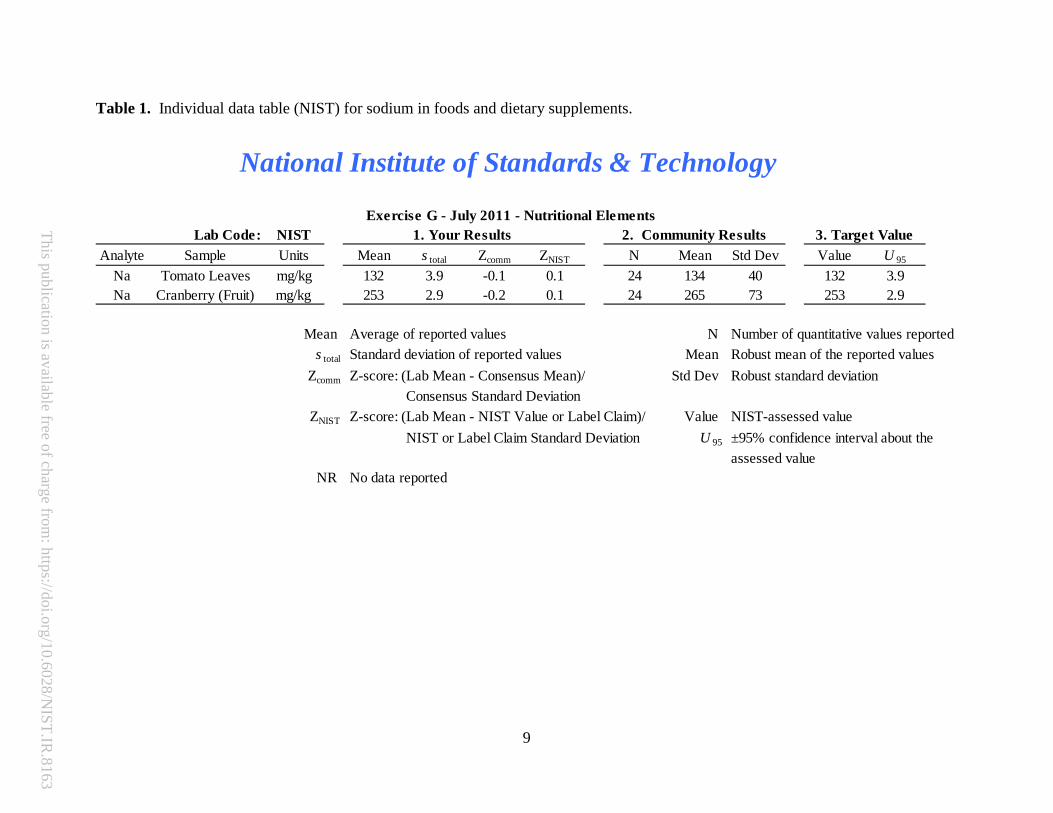
Table 1. Individual data table (NIST) for sodium in foods and dietary supplements.
Lab Code: NISTAnalyte Sample Units Mean s total Zcomm ZNIST N Mean Std Dev Value U 95
Na Tomato Leaves mg/kg 132 3.9 -0.1 0.1 24 134 40 132 3.9Na Cranberry (Fruit) mg/kg 253 2.9 -0.2 0.1 24 265 73 253 2.9
Mean Average of reported values N Number of quantitative values reporteds total Standard deviation of reported values Mean Robust mean of the reported values
Zcomm Z-score: (Lab Mean - Consensus Mean)/ Std Dev Robust standard deviationConsensus Standard Deviation
ZNIST Z-score: (Lab Mean - NIST Value or Label Claim)/ Value NIST-assessed valueNIST or Label Claim Standard Deviation U 95 ±95% confidence interval about the
assessed valueNR No data reported
National Institute of Standards & Technology
Exercise G - July 2011 - Nutritional Elements1. Your Results 2. Community Results 3. Target Value
10
This publication is available free of charge from: https://doi.org/10.6028/N
IST.IR.8163
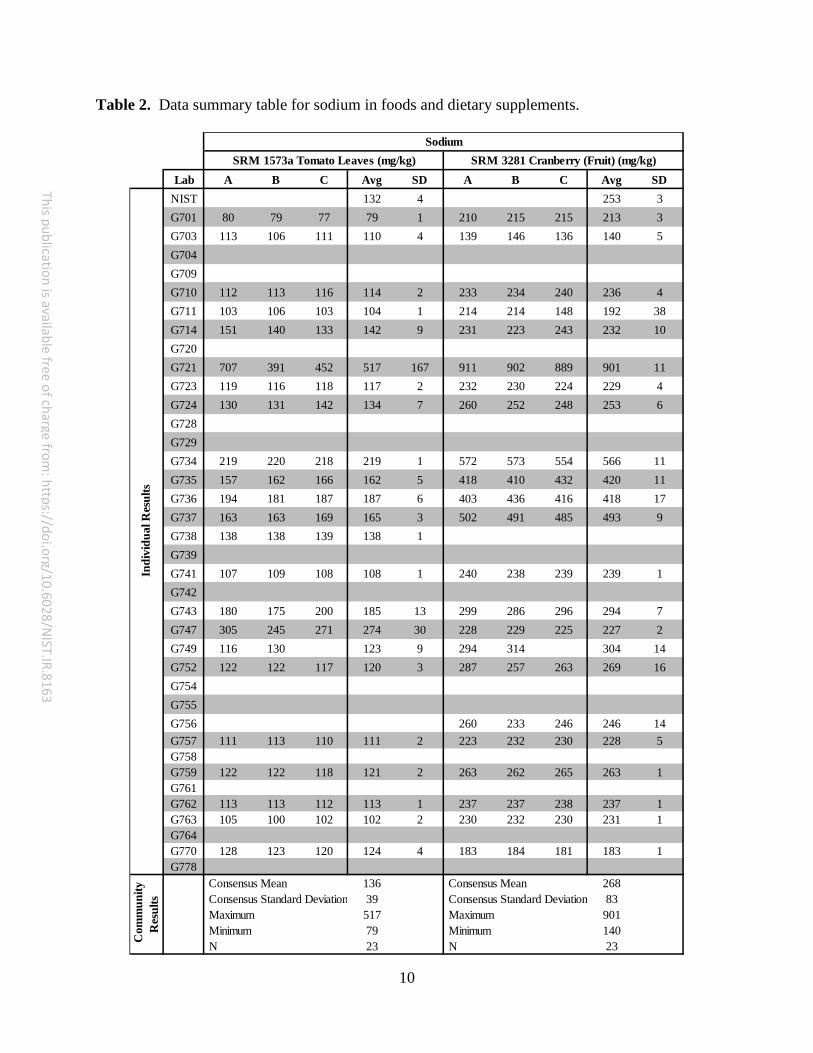
Table 2. Data summary table for sodium in foods and dietary supplements.
Lab A B C Avg SD A B C Avg SDNIST 132 4 253 3G701 80 79 77 79 1 210 215 215 213 3G703 113 106 111 110 4 139 146 136 140 5G704G709G710 112 113 116 114 2 233 234 240 236 4G711 103 106 103 104 1 214 214 148 192 38G714 151 140 133 142 9 231 223 243 232 10G720G721 707 391 452 517 167 911 902 889 901 11G723 119 116 118 117 2 232 230 224 229 4G724 130 131 142 134 7 260 252 248 253 6G728G729G734 219 220 218 219 1 572 573 554 566 11G735 157 162 166 162 5 418 410 432 420 11G736 194 181 187 187 6 403 436 416 418 17G737 163 163 169 165 3 502 491 485 493 9G738 138 138 139 138 1G739G741 107 109 108 108 1 240 238 239 239 1G742G743 180 175 200 185 13 299 286 296 294 7G747 305 245 271 274 30 228 229 225 227 2G749 116 130 123 9 294 314 304 14G752 122 122 117 120 3 287 257 263 269 16G754G755G756 260 233 246 246 14G757 111 113 110 111 2 223 232 230 228 5G758G759 122 122 118 121 2 263 262 265 263 1G761G762 113 113 112 113 1 237 237 238 237 1G763 105 100 102 102 2 230 232 230 231 1G764G770 128 123 120 124 4 183 184 181 183 1G778
Consensus Mean 136 Consensus Mean 268 Consensus Standard Deviation 39 Consensus Standard Deviation 83 Maximum 517 Maximum 901 Minimum 79 Minimum 140 N 23 N 23
SodiumSRM 1573a Tomato Leaves (mg/kg) SRM 3281 Cranberry (Fruit) (mg/kg)
Com
mun
ity
Res
ults
Indi
vidu
al R
esul
ts
11
This publication is available free of charge from: https://doi.org/10.6028/N
IST.IR.8163
Figure 1. Sodium in SRM 1573a Tomato Leaves (data summary view – digestion method). In this view, individual laboratory data are plotted with the individual laboratory standard deviation (error bars). The color of the data point represents the sample preparation (digestion) procedure employed. The black solid line represents the consensus mean, and the black dotted lines represent the consensus variability calculated as one standard deviation about the consensus mean. The gray shaded region represents the target zone for “acceptable” performance, which encompasses the NIST reference value bounded by twice its uncertainty (U95).
12
This publication is available free of charge from: https://doi.org/10.6028/N
IST.IR.8163
Figure 2. Sodium in SRM 3281 Cranberry (Fruit) (data summary view – digestion method). In this view, individual laboratory data are plotted with the individual laboratory standard deviation (error bars). The data are identified by digestion method in this graph. The black solid line represents the consensus mean, and the black dotted lines represent the consensus variability calculated as one standard deviation about the consensus mean. The gray shaded region represents the target zone for “acceptable” performance, which encompasses the NIST certified value bounded by twice its uncertainty (U95).
13
This publication is available free of charge from: https://doi.org/10.6028/N
IST.IR.8163
Figure 3. Sodium in SRM 1573a Tomato Leaves (data summary view – instrumental methods). In this view, individual laboratory data are plotted with the individual laboratory standard deviation (error bars). The data are identified by instrumental method in this graph. The black solid line represents the consensus mean, and the black dotted lines represent the consensus variability calculated as one standard deviation about the consensus mean. The gray shaded region represents the target zone for “acceptable” performance, which encompasses the NIST certified value bounded twice by its uncertainty (U95).
14
This publication is available free of charge from: https://doi.org/10.6028/N
IST.IR.8163
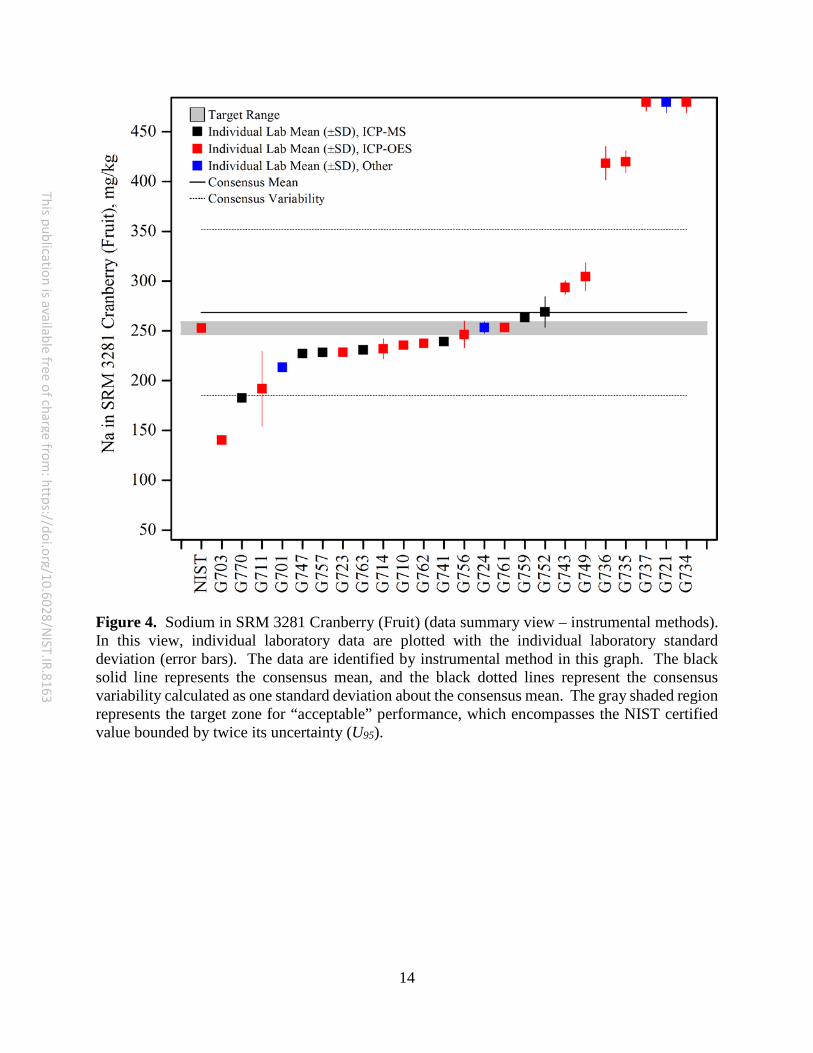
Figure 4. Sodium in SRM 3281 Cranberry (Fruit) (data summary view – instrumental methods). In this view, individual laboratory data are plotted with the individual laboratory standard deviation (error bars). The data are identified by instrumental method in this graph. The black solid line represents the consensus mean, and the black dotted lines represent the consensus variability calculated as one standard deviation about the consensus mean. The gray shaded region represents the target zone for “acceptable” performance, which encompasses the NIST certified value bounded by twice its uncertainty (U95).
15
This publication is available free of charge from: https://doi.org/10.6028/N
IST.IR.8163
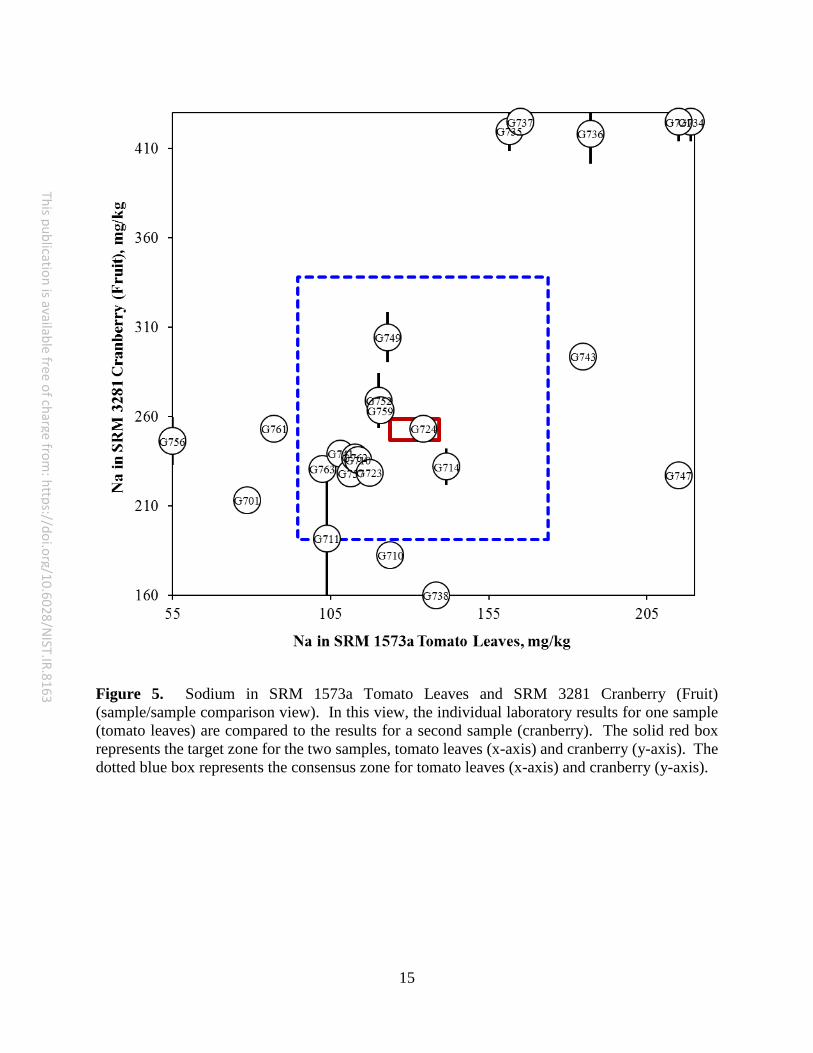
Figure 5. Sodium in SRM 1573a Tomato Leaves and SRM 3281 Cranberry (Fruit) (sample/sample comparison view). In this view, the individual laboratory results for one sample (tomato leaves) are compared to the results for a second sample (cranberry). The solid red box represents the target zone for the two samples, tomato leaves (x-axis) and cranberry (y-axis). The dotted blue box represents the consensus zone for tomato leaves (x-axis) and cranberry (y-axis).
16
This publication is available free of charge from: https://doi.org/10.6028/N
IST.IR.8163
TOXIC ELEMENTS (Pb) IN DIETARY SUPPLEMENTS Study Overview In this study, participants were provided with two NIST SRMs, SRM 3243 Ephedra-Containing Solid Oral Dosage Form and SRM 3280 Multivitamin/Multielement Tablets. Participants were asked to use in-house analytical methods to determine the mass fractions of lead (Pb) in each of the matrices and report values on an as-received basis. Sample Information Ephedra-Containing Tablets. Participants were provided with three bottles containing approximately 2.5 g of dried, powdered ephedra-containing tablets. The ephedra tablets were ground, homogenized, and packaged in amber high-density polyethylene bottles. Before use, participants were asked to thoroughly mix the contents of the bottles and use a sample size of at least 1.0 g. Participants were asked to store the material at controlled room temperature, 20 °C to 25 °C, and to prepare one sample and report one value from each bottle provided. Prior to the study, the approximate analyte level was given as 600 ng/g to 800 ng/g. The certified value for lead in SRM 3243 was determined at NIST using isotope dilution inductively coupled plasma mass spectrometry (ID-ICP-MS), in combination with data from two collaborating laboratories. The certified value and uncertainty for Pb are provided in the table below, both on a dry-mass basis and on an as-received basis accounting for moisture of the material (4.63 %).
Certified Mass Fraction in SRM 3243 (ng/g) Analyte (dry-mass basis) (as-received basis)
Lead (Pb) 692 ± 56 660 ± 53 Multivitamin/Multielement Tablets. Participants were provided with three vials containing approximately 2.5 g of ground multivitamin/multielement tablets. The multivitamin/multielement tablets were ground, sieved, and packaged in amber glass vials. Before use, participants were asked to thoroughly mix the contents of the vial and to use a sample size of at least 0.25 g. Participants were asked to store the material at controlled room temperature, 20 °C to 25 °C, and to prepare one sample and report one value from each of the vials provided. Prior to the study, the approximate analyte level was given as 200 ng/g to 300 ng/g. The certified value for lead in SRM 3280 was determined at NIST using isotope dilution inductively coupled plasma mass spectrometry (ID-ICP-MS). The certified values and uncertainties are reported in the table below, both on a dry-mass basis and on an as-received basis accounting for moisture of the material (1.37 %).
Certified Mass Fraction in SRM 3280 (ng/g) Analyte (dry-mass basis) (as-received basis)
Lead (Pb) 273 ± 2 269 ± 2
17
This publication is available free of charge from: https://doi.org/10.6028/N
IST.IR.8163
Study Results • Forty-eight laboratories enrolled in this exercise and received samples. Thirty-six
laboratories reported results for lead in Ephedra tablets (75 % participation). Thirty-seven laboratories reported results for lead in multivitamin tablets (77 % participation).
• The consensus means for lead in both matrices were within the target ranges. The between-laboratory variability for lead in the Ephedra tablets was acceptable (13 % RSD), but variability for lead in the multivitamin tablets was high (23 % RSD).
• A majority of the laboratories reported using microwave digestion (58 %) or open beaker digestion (36 %) for sample preparation. Hot block digestion was also reported as a method of sample preparation by two laboratories (6 %). One laboratory did not report the sample preparation technique used.
• Most laboratories reported using ICP-MS as their analytical method for analysis (78 %). Laboratories also reported using ICP-OES (17 %) and AAS (6 %). One laboratory did not report the analytical method used.
• A majority of the laboratories reported using an external standard approach to calibration (89 %). One laboratory reported using a standard addition approach (6 %), and one laboratory reported using an internal standard approach (6 %). One laboratory did not report the type of calibration approach that was used.
Technical Recommendations The following recommendations are based on results obtained from the participants in this study.
• Lead is generally easily digested, and digestion with HNO3 is recommended. Digestion with HCl may form a PbCl2 precipitate that is difficult to dissolve. While the sample solution may look clear, results may be biased low if solid PbCl2 remains. The Cl can be removed by repeatedly drying the sample solution using HNO3.
• Some laboratories reported high values for one sample, but not both, which may indicate more difficulty in digestion of one matrix over the other. Because each matrix is different, some may digest more readily, and the digestion quality must be evaluated for each sample prior to analysis. A quality assurance sample of a similar matrix prepared alongside unknown samples will help to determine if the digestion method is appropriate for the determination of lead in these matrices.
• ICP-OES has low sensitivity for lead, making it difficult to measure low-level samples. The concentration of lead in solutions prepared from the multivitamin samples may be near the method detection limit of many ICP-OES systems, leading to inaccurate results. Sufficient procedural reagent blanks should be prepared along with samples to determine the method detection limit for lead.
• Many of the calibration curves reported by participants extended far below the reported working range of lead in the solutions to be analyzed. While the calibration curve may appear linear over a wide concentration range, a measured value outside of the calibration curve may have significant bias. For the most accurate results, use calibration points closely surrounding the expected solution concentration, and ensure that the calibration curve is linear along the region of your expected solution concentrations. • The sample/sample comparison graph does not reflect an obvious calibration error.
Some laboratories reported values that were high for one sample but were within range for the second sample. This type of trend may indicate individualized problems with the digestion of one matrix compared to another.
18
This publication is available free of charge from: https://doi.org/10.6028/N
IST.IR.8163
• Quality assurance samples should always be used. These can be commercially available reference materials (CRMs, SRMs, or RMs) or prepared in-house, but need to be of known concentration. • They are used to ensure that the method is performing as expected. • They are useful in finding where errors are occurring, including calculation errors. • After checking for calculation errors, make sure results are reported correctly.
19
This publication is available free of charge from: https://doi.org/10.6028/N
IST.IR.8163
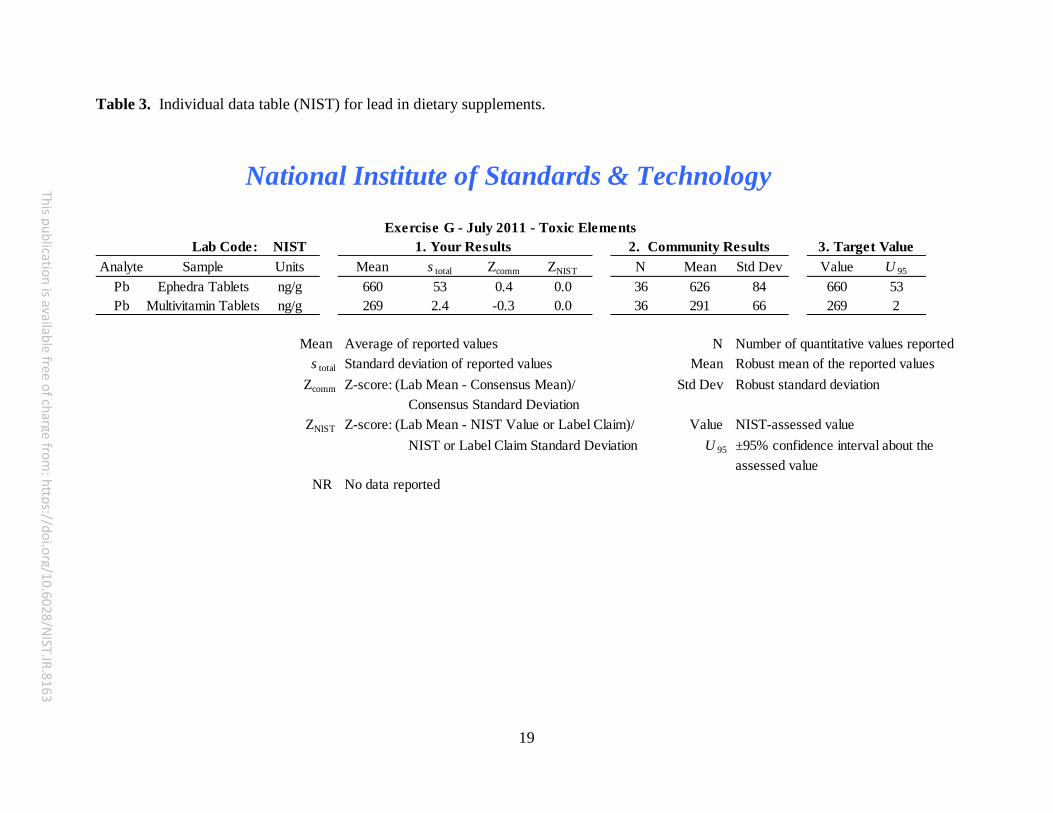
Table 3. Individual data table (NIST) for lead in dietary supplements.
Lab Code: NISTAnalyte Sample Units Mean s total Zcomm ZNIST N Mean Std Dev Value U 95
Pb Ephedra Tablets ng/g 660 53 0.4 0.0 36 626 84 660 53Pb Multivitamin Tablets ng/g 269 2.4 -0.3 0.0 36 291 66 269 2
Mean Average of reported values N Number of quantitative values reporteds total Standard deviation of reported values Mean Robust mean of the reported values
Zcomm Z-score: (Lab Mean - Consensus Mean)/ Std Dev Robust standard deviationConsensus Standard Deviation
ZNIST Z-score: (Lab Mean - NIST Value or Label Claim)/ Value NIST-assessed valueNIST or Label Claim Standard Deviation U 95 ±95% confidence interval about the
assessed valueNR No data reported
National Institute of Standards & Technology
Exercise G - July 2011 - Toxic Elements1. Your Results 2. Community Results 3. Target Value
[Type here]
20
This publication is available free of charge from: https://doi.org/10.6028/N
IST.IR.8163
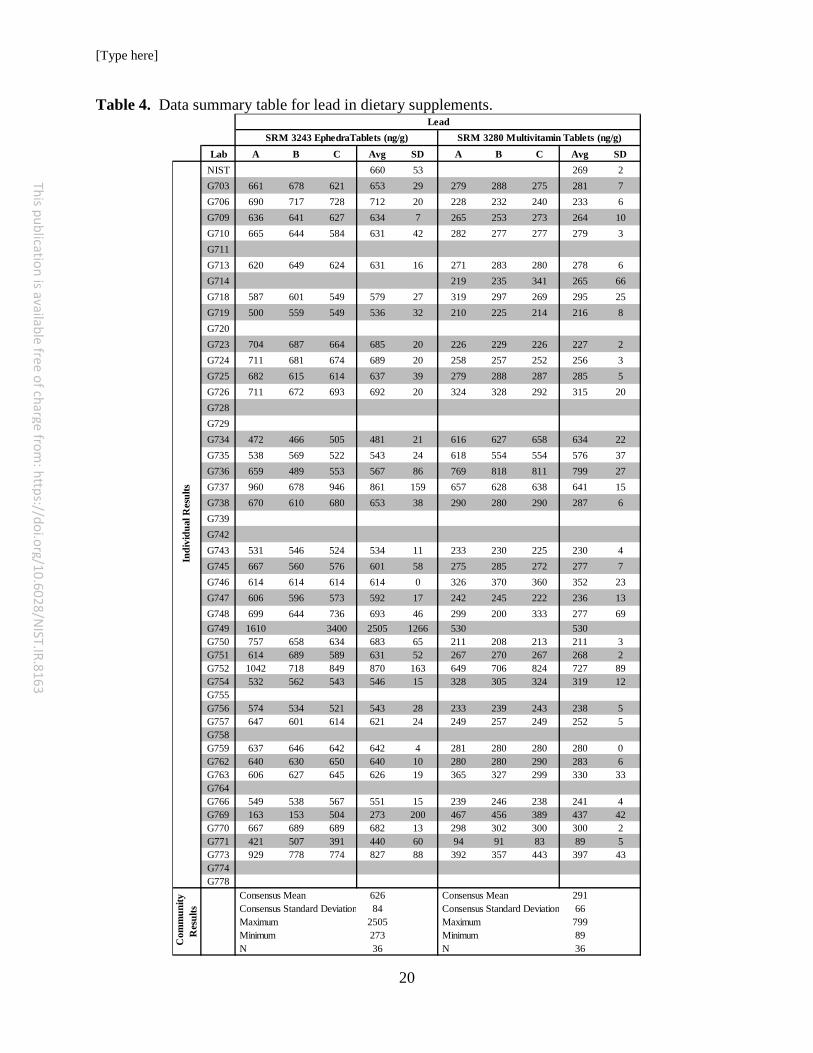
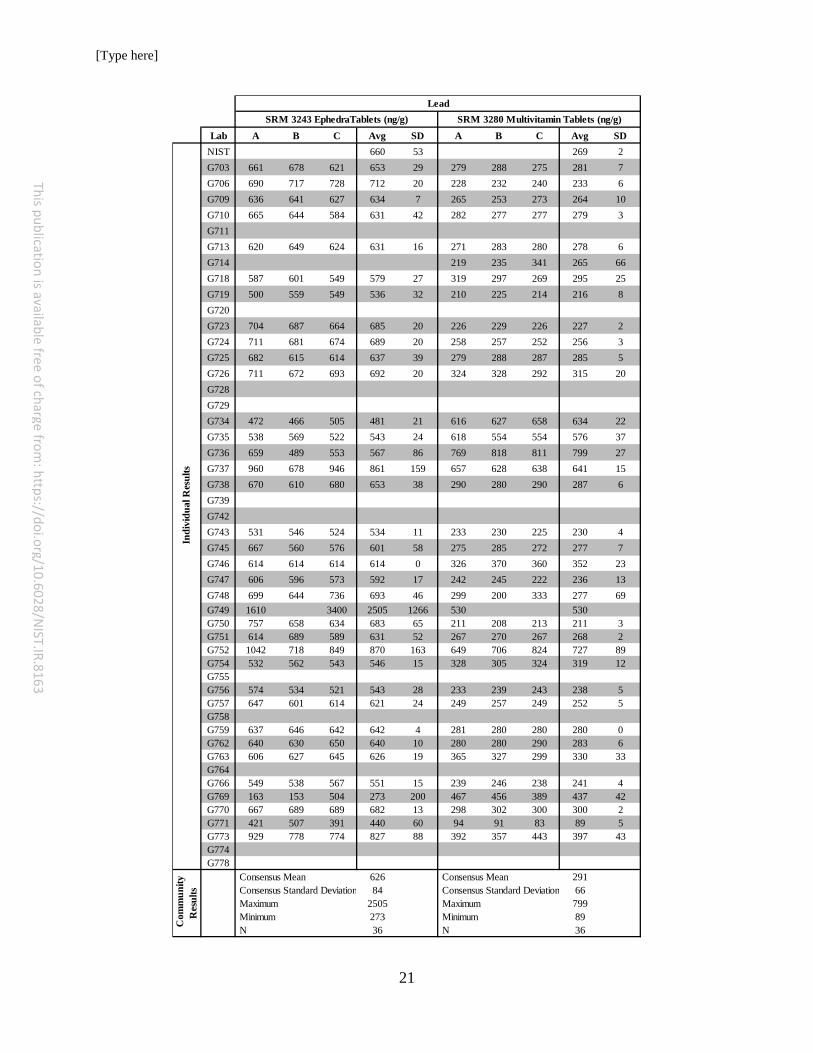
Table 4. Data summary table for lead in dietary supplements.
Lab A B C Avg SD A B C Avg SDNIST 660 53 269 2G703 661 678 621 653 29 279 288 275 281 7G706 690 717 728 712 20 228 232 240 233 6G709 636 641 627 634 7 265 253 273 264 10G710 665 644 584 631 42 282 277 277 279 3G711G713 620 649 624 631 16 271 283 280 278 6G714 219 235 341 265 66G718 587 601 549 579 27 319 297 269 295 25G719 500 559 549 536 32 210 225 214 216 8G720G723 704 687 664 685 20 226 229 226 227 2G724 711 681 674 689 20 258 257 252 256 3G725 682 615 614 637 39 279 288 287 285 5G726 711 672 693 692 20 324 328 292 315 20G728G729G734 472 466 505 481 21 616 627 658 634 22G735 538 569 522 543 24 618 554 554 576 37G736 659 489 553 567 86 769 818 811 799 27G737 960 678 946 861 159 657 628 638 641 15G738 670 610 680 653 38 290 280 290 287 6G739G742G743 531 546 524 534 11 233 230 225 230 4G745 667 560 576 601 58 275 285 272 277 7G746 614 614 614 614 0 326 370 360 352 23G747 606 596 573 592 17 242 245 222 236 13G748 699 644 736 693 46 299 200 333 277 69G749 1610 3400 2505 1266 530 530G750 757 658 634 683 65 211 208 213 211 3G751 614 689 589 631 52 267 270 267 268 2G752 1042 718 849 870 163 649 706 824 727 89G754 532 562 543 546 15 328 305 324 319 12G755G756 574 534 521 543 28 233 239 243 238 5G757 647 601 614 621 24 249 257 249 252 5G758G759 637 646 642 642 4 281 280 280 280 0G762 640 630 650 640 10 280 280 290 283 6G763 606 627 645 626 19 365 327 299 330 33G764G766 549 538 567 551 15 239 246 238 241 4G769 163 153 504 273 200 467 456 389 437 42G770 667 689 689 682 13 298 302 300 300 2G771 421 507 391 440 60 94 91 83 89 5G773 929 778 774 827 88 392 357 443 397 43G774G778
Consensus Mean 626 Consensus Mean 291 Consensus Standard Deviation 84 Consensus Standard Deviation 66 Maximum 2505 Maximum 799 Minimum 273 Minimum 89 N 36 N 36
LeadSRM 3243 EphedraTablets (ng/g) SRM 3280 Multivitamin Tablets (ng/g)
Com
mun
ity
Res
ults
Indi
vidu
al R
esul
ts
[Type here]
21
This publication is available free of charge from: https://doi.org/10.6028/N
IST.IR.8163
Lab A B C Avg SD A B C Avg SDNIST 660 53 269 2G703 661 678 621 653 29 279 288 275 281 7G706 690 717 728 712 20 228 232 240 233 6G709 636 641 627 634 7 265 253 273 264 10G710 665 644 584 631 42 282 277 277 279 3G711G713 620 649 624 631 16 271 283 280 278 6G714 219 235 341 265 66G718 587 601 549 579 27 319 297 269 295 25G719 500 559 549 536 32 210 225 214 216 8G720G723 704 687 664 685 20 226 229 226 227 2G724 711 681 674 689 20 258 257 252 256 3G725 682 615 614 637 39 279 288 287 285 5G726 711 672 693 692 20 324 328 292 315 20G728G729G734 472 466 505 481 21 616 627 658 634 22G735 538 569 522 543 24 618 554 554 576 37G736 659 489 553 567 86 769 818 811 799 27G737 960 678 946 861 159 657 628 638 641 15G738 670 610 680 653 38 290 280 290 287 6G739G742G743 531 546 524 534 11 233 230 225 230 4G745 667 560 576 601 58 275 285 272 277 7G746 614 614 614 614 0 326 370 360 352 23G747 606 596 573 592 17 242 245 222 236 13G748 699 644 736 693 46 299 200 333 277 69G749 1610 3400 2505 1266 530 530G750 757 658 634 683 65 211 208 213 211 3G751 614 689 589 631 52 267 270 267 268 2G752 1042 718 849 870 163 649 706 824 727 89G754 532 562 543 546 15 328 305 324 319 12G755G756 574 534 521 543 28 233 239 243 238 5G757 647 601 614 621 24 249 257 249 252 5G758G759 637 646 642 642 4 281 280 280 280 0G762 640 630 650 640 10 280 280 290 283 6G763 606 627 645 626 19 365 327 299 330 33G764G766 549 538 567 551 15 239 246 238 241 4G769 163 153 504 273 200 467 456 389 437 42G770 667 689 689 682 13 298 302 300 300 2G771 421 507 391 440 60 94 91 83 89 5G773 929 778 774 827 88 392 357 443 397 43G774G778
Consensus Mean 626 Consensus Mean 291 Consensus Standard Deviation 84 Consensus Standard Deviation 66 Maximum 2505 Maximum 799 Minimum 273 Minimum 89 N 36 N 36
LeadSRM 3243 EphedraTablets (ng/g) SRM 3280 Multivitamin Tablets (ng/g)
Com
mun
ity
Res
ults
Indi
vidu
al R
esul
ts
22
This publication is available free of charge from: https://doi.org/10.6028/N
IST.IR.8163
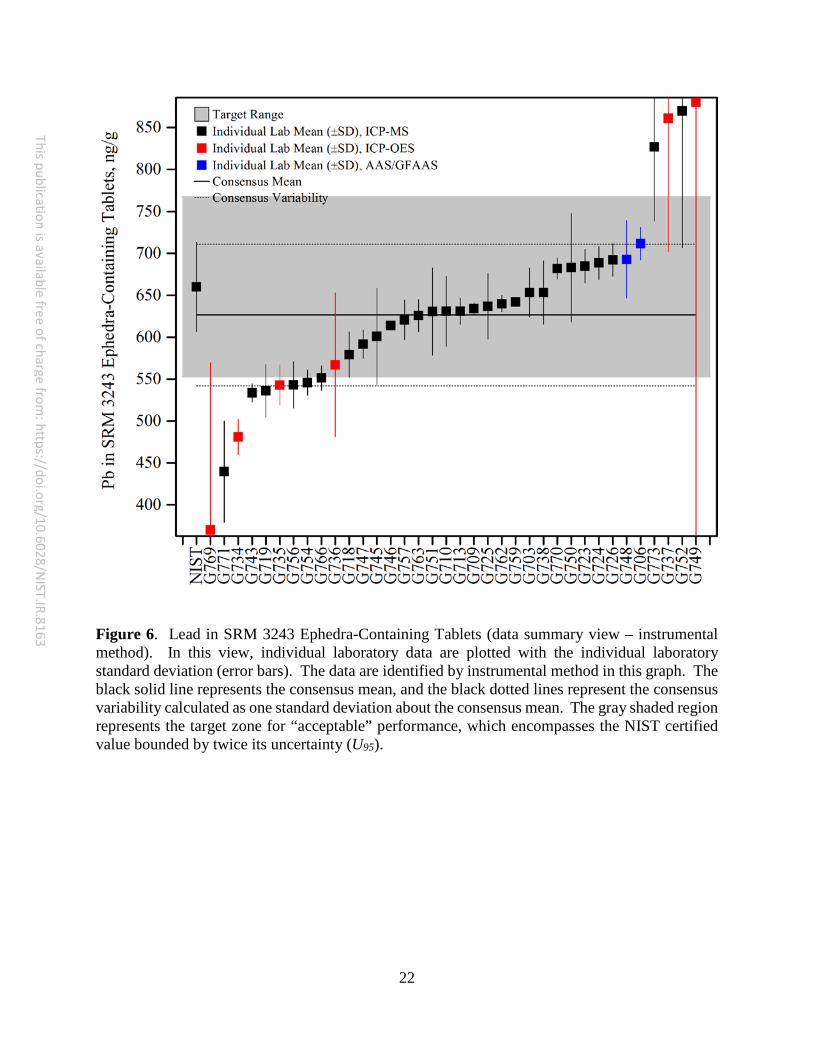
Figure 6. Lead in SRM 3243 Ephedra-Containing Tablets (data summary view – instrumental method). In this view, individual laboratory data are plotted with the individual laboratory standard deviation (error bars). The data are identified by instrumental method in this graph. The black solid line represents the consensus mean, and the black dotted lines represent the consensus variability calculated as one standard deviation about the consensus mean. The gray shaded region represents the target zone for “acceptable” performance, which encompasses the NIST certified value bounded by twice its uncertainty (U95).
23
This publication is available free of charge from: https://doi.org/10.6028/N
IST.IR.8163
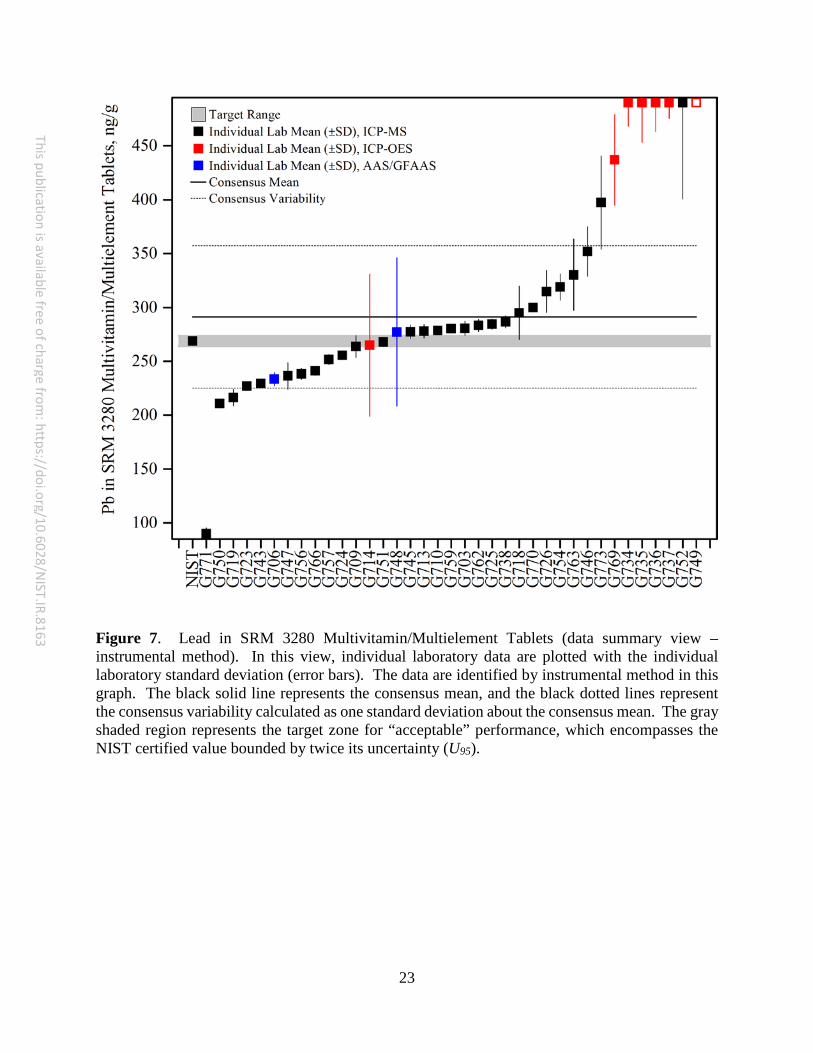
Figure 7. Lead in SRM 3280 Multivitamin/Multielement Tablets (data summary view – instrumental method). In this view, individual laboratory data are plotted with the individual laboratory standard deviation (error bars). The data are identified by instrumental method in this graph. The black solid line represents the consensus mean, and the black dotted lines represent the consensus variability calculated as one standard deviation about the consensus mean. The gray shaded region represents the target zone for “acceptable” performance, which encompasses the NIST certified value bounded by twice its uncertainty (U95).
24
This publication is available free of charge from: https://doi.org/10.6028/N
IST.IR.8163
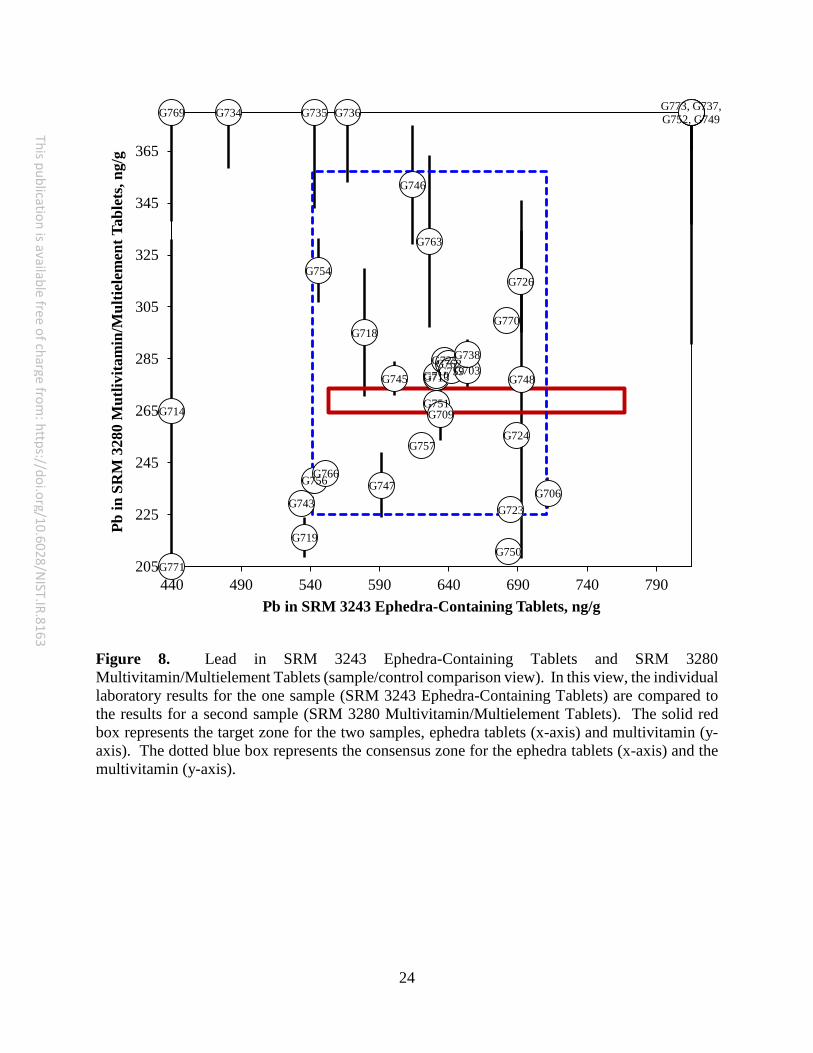
Figure 8. Lead in SRM 3243 Ephedra-Containing Tablets and SRM 3280 Multivitamin/Multielement Tablets (sample/control comparison view). In this view, the individual laboratory results for the one sample (SRM 3243 Ephedra-Containing Tablets) are compared to the results for a second sample (SRM 3280 Multivitamin/Multielement Tablets). The solid red box represents the target zone for the two samples, ephedra tablets (x-axis) and multivitamin (y-axis). The dotted blue box represents the consensus zone for the ephedra tablets (x-axis) and the multivitamin (y-axis).
G769
G771
G734
G743
G719
G735
G756
G754
G766
G736
G718
G747
G745
G746
G757
G763
G751
G713G710
G709
G725G762G759G703
G738
G770
G750
G723
G724
G726
G748
G706
G773, G737,G752, G749
G714
205
225
245
265
285
305
325
345
365
440 490 540 590 640 690 740 790
Pb in
SR
M 3
280
Mut
livita
min
/Mul
tiele
men
t Tab
lets
, ng/
g
Pb in SRM 3243 Ephedra-Containing Tablets, ng/g
25
This publication is available free of charge from: https://doi.org/10.6028/N
IST.IR.8163
FOLIC ACID IN FOOD MATRICES Study Overview In this study, participants were provided with one NIST SRM, SRM 3233 Fortified Breakfast Cereal, and a well-characterized fortified milk powder sample. Participants were asked to use in-house analytical methods to determine the mass fraction of folic acid in each of the matrices and report values on an as-received basis. Sample Information Fortified Breakfast Cereal. Participants were provided with one bottle containing approximately 60 g of dried, powdered breakfast cereal. The cereal flakes were ground, homogenized, and packaged in amber glass bottles, and the bottles were capped, sealed with heat-shrink tape, and individually sealed in mylar bags. Before use, participants were instructed to thoroughly mix the contents of the bottle and use a sample size of at least 1.0 g. Participants were asked to store the material at controlled room temperature, 20 °C to 25 °C, and to prepare three samples and report three values from the single bottle provided. Prior to the study, the approximate analyte level was given as 15 mg/kg. The certified value for folic acid in SRM 3233 was determined at NIST by ID-LC-MS/MS following solvent extraction, in combination with data from numerous collaborating laboratories. The certified values and uncertainties are reported in the table below, both on a dry-mass basis and on an as-received basis accounting for moisture of the material (1.7 %).
Certified Mass Fraction in SRM 3233 (mg/kg) Analyte (dry-mass basis) (as-received basis)
Folic Acid 15.1 ± 1.2 14.8 ± 1.2 Milk Powder. Participants were provided with three packets containing approximately 10 g of freeze-dried, powdered milk. The fortified milk powder was homogenized and packaged in nitrogen-flushed foil pouches with a paper over-wrap. Before use, participants were instructed to thoroughly mix the contents of the packet and use a sample size of at least 1.0 g. Participants were asked to store the material at –20 °C, and to prepare one sample and report one value from each packet of milk powder provided. Prior to the study, the approximate analyte level was given as 2.4 mg/kg. The target value for folic acid in the fortified milk powder was determined at NIST by ID-LC-MS/MS following solvent extraction and hydrolysis, in combination with data from two collaborating laboratories. The NIST-determined values and uncertainties are reported in the table below, both on a dry-mass basis and on an as-received basis accounting for moisture of the material (1.6 %).
Mass Fraction in Milk Powder (mg/kg) Analyte (dry-mass basis) (as-received basis)
Folic Acid 2.35 ± 0.06 2.31 ± 0.06 Study Results
• Twenty-three laboratories enrolled in this exercise and received samples. Eleven laboratories reported results for folic acid in both the breakfast cereal and the milk powder
26
This publication is available free of charge from: https://doi.org/10.6028/N
IST.IR.8163
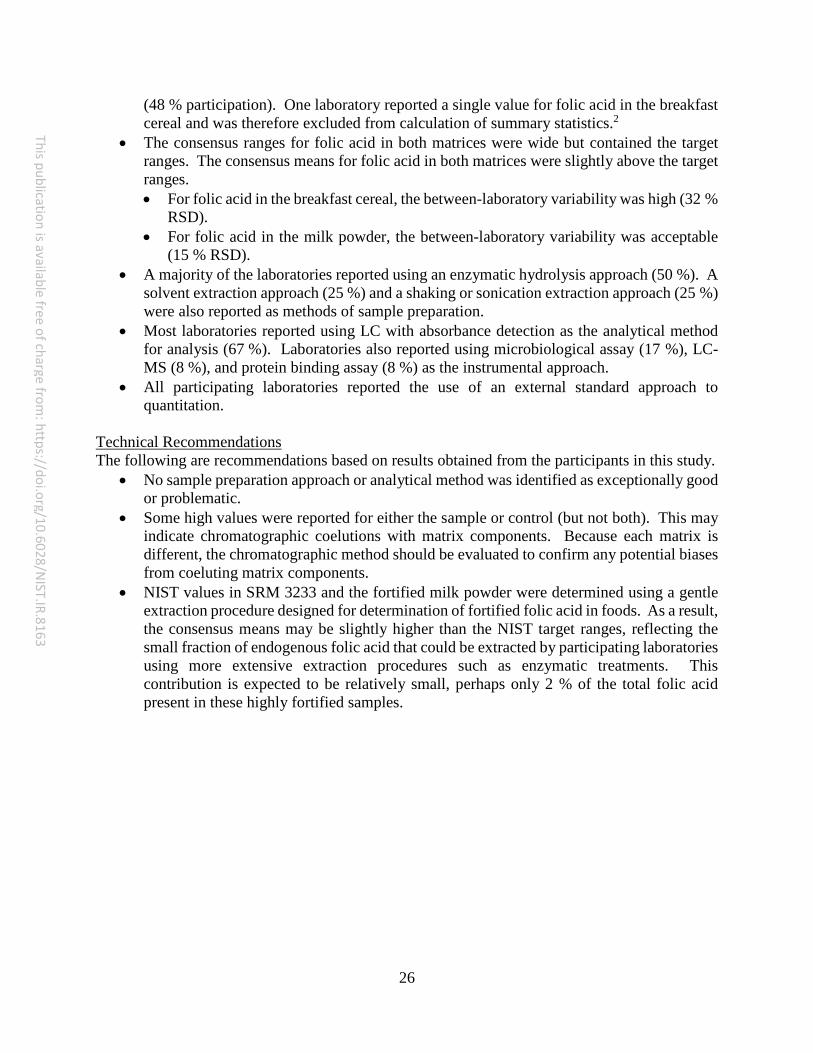
(48 % participation). One laboratory reported a single value for folic acid in the breakfast cereal and was therefore excluded from calculation of summary statistics.2
• The consensus ranges for folic acid in both matrices were wide but contained the target ranges. The consensus means for folic acid in both matrices were slightly above the target ranges. • For folic acid in the breakfast cereal, the between-laboratory variability was high (32 %
RSD). • For folic acid in the milk powder, the between-laboratory variability was acceptable
(15 % RSD). • A majority of the laboratories reported using an enzymatic hydrolysis approach (50 %). A
solvent extraction approach (25 %) and a shaking or sonication extraction approach (25 %) were also reported as methods of sample preparation.
• Most laboratories reported using LC with absorbance detection as the analytical method for analysis (67 %). Laboratories also reported using microbiological assay (17 %), LC-MS (8 %), and protein binding assay (8 %) as the instrumental approach.
• All participating laboratories reported the use of an external standard approach to quantitation.
Technical Recommendations The following are recommendations based on results obtained from the participants in this study.
• No sample preparation approach or analytical method was identified as exceptionally good or problematic.
• Some high values were reported for either the sample or control (but not both). This may indicate chromatographic coelutions with matrix components. Because each matrix is different, the chromatographic method should be evaluated to confirm any potential biases from coeluting matrix components.
• NIST values in SRM 3233 and the fortified milk powder were determined using a gentle extraction procedure designed for determination of fortified folic acid in foods. As a result, the consensus means may be slightly higher than the NIST target ranges, reflecting the small fraction of endogenous folic acid that could be extracted by participating laboratories using more extensive extraction procedures such as enzymatic treatments. This contribution is expected to be relatively small, perhaps only 2 % of the total folic acid present in these highly fortified samples.
27
This publication is available free of charge from: https://doi.org/10.6028/N
IST.IR.8163
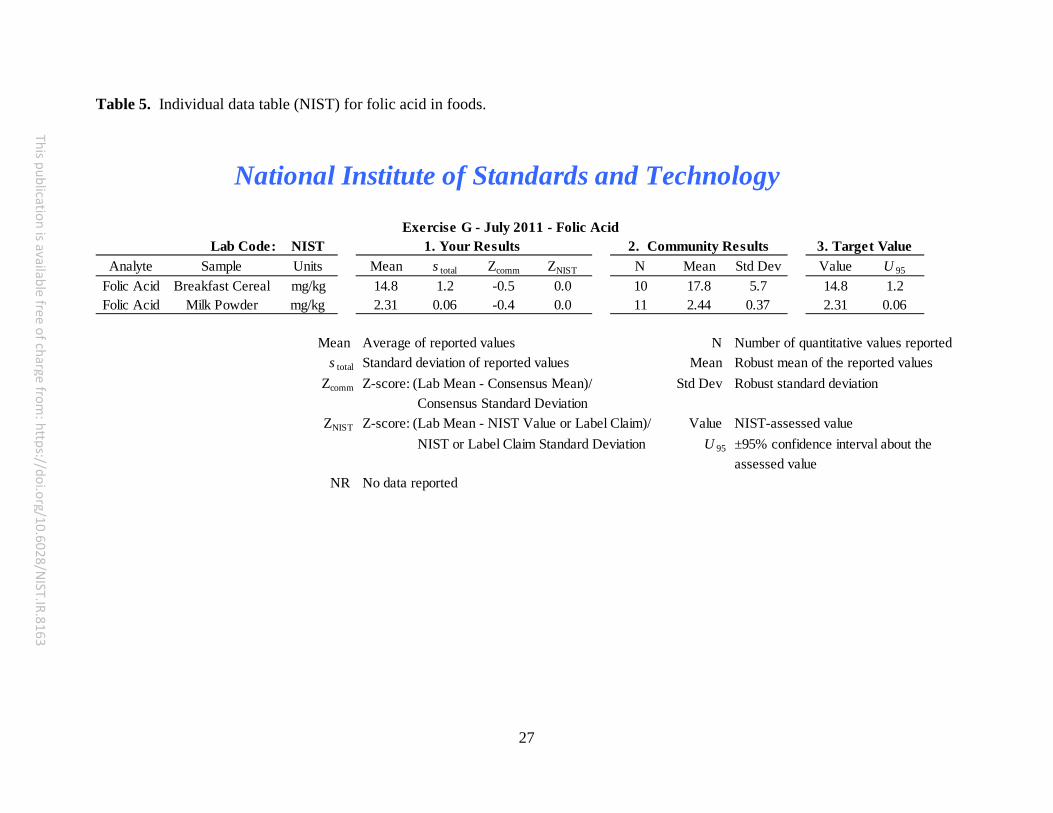
Table 5. Individual data table (NIST) for folic acid in foods.
Lab Code: NISTAnalyte Sample Units Mean s total Zcomm ZNIST N Mean Std Dev Value U 95
Folic Acid Breakfast Cereal mg/kg 14.8 1.2 -0.5 0.0 10 17.8 5.7 14.8 1.2Folic Acid Milk Powder mg/kg 2.31 0.06 -0.4 0.0 11 2.44 0.37 2.31 0.06
Mean Average of reported values N Number of quantitative values reporteds total Standard deviation of reported values Mean Robust mean of the reported values
Zcomm Z-score: (Lab Mean - Consensus Mean)/ Std Dev Robust standard deviationConsensus Standard Deviation
ZNIST Z-score: (Lab Mean - NIST Value or Label Claim)/ Value NIST-assessed valueNIST or Label Claim Standard Deviation U 95 ±95% confidence interval about the
assessed valueNR No data reported
National Institute of Standards and Technology
Exercise G - July 2011 - Folic Acid1. Your Results 2. Community Results 3. Target Value
28
This publication is available free of charge from: https://doi.org/10.6028/N
IST.IR.8163
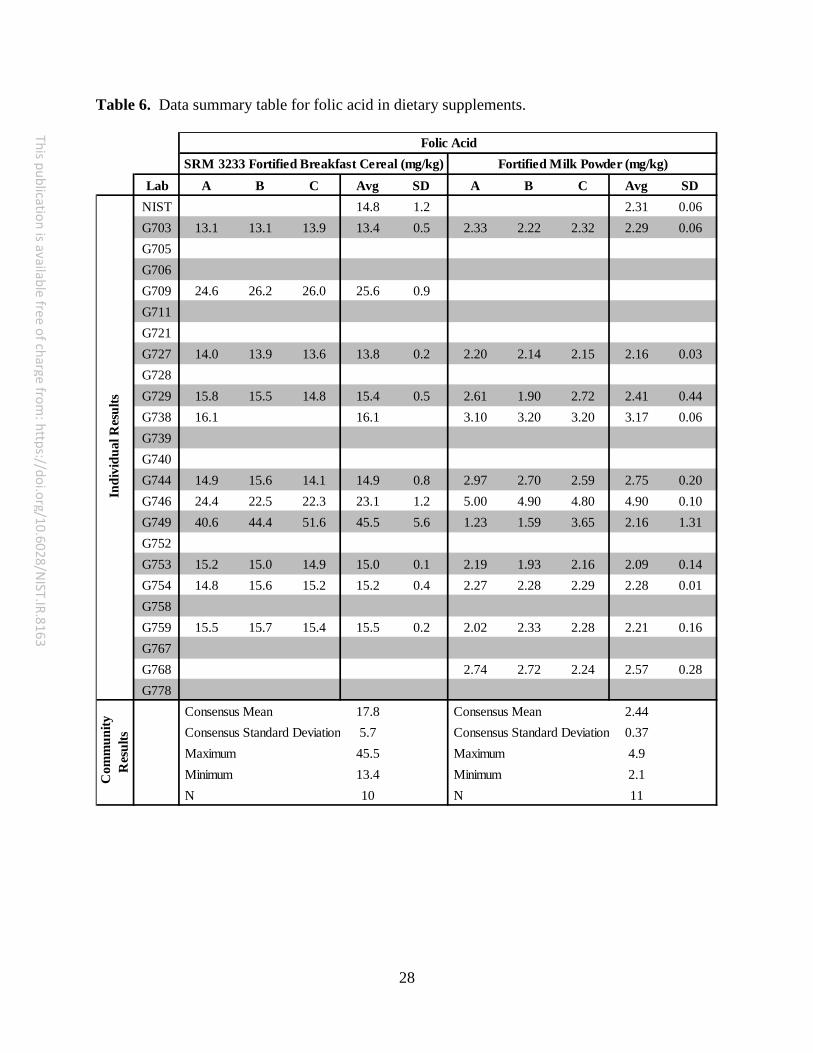
Table 6. Data summary table for folic acid in dietary supplements.
Lab A B C Avg SD A B C Avg SDNIST 14.8 1.2 2.31 0.06G703 13.1 13.1 13.9 13.4 0.5 2.33 2.22 2.32 2.29 0.06G705G706G709 24.6 26.2 26.0 25.6 0.9G711G721G727 14.0 13.9 13.6 13.8 0.2 2.20 2.14 2.15 2.16 0.03G728G729 15.8 15.5 14.8 15.4 0.5 2.61 1.90 2.72 2.41 0.44G738 16.1 16.1 3.10 3.20 3.20 3.17 0.06G739G740G744 14.9 15.6 14.1 14.9 0.8 2.97 2.70 2.59 2.75 0.20G746 24.4 22.5 22.3 23.1 1.2 5.00 4.90 4.80 4.90 0.10G749 40.6 44.4 51.6 45.5 5.6 1.23 1.59 3.65 2.16 1.31G752G753 15.2 15.0 14.9 15.0 0.1 2.19 1.93 2.16 2.09 0.14G754 14.8 15.6 15.2 15.2 0.4 2.27 2.28 2.29 2.28 0.01G758G759 15.5 15.7 15.4 15.5 0.2 2.02 2.33 2.28 2.21 0.16G767G768 2.74 2.72 2.24 2.57 0.28G778
Consensus Mean 17.8 Consensus Mean 2.44 Consensus Standard Deviation 5.7 Consensus Standard Deviation 0.37 Maximum 45.5 Maximum 4.9 Minimum 13.4 Minimum 2.1 N 10 N 11
Indi
vidu
al R
esul
ts
SRM 3233 Fortified Breakfast Cereal (mg/kg)
Com
mun
ity
Res
ults
Fortified Milk Powder (mg/kg)Folic Acid
29
This publication is available free of charge from: https://doi.org/10.6028/N
IST.IR.8163
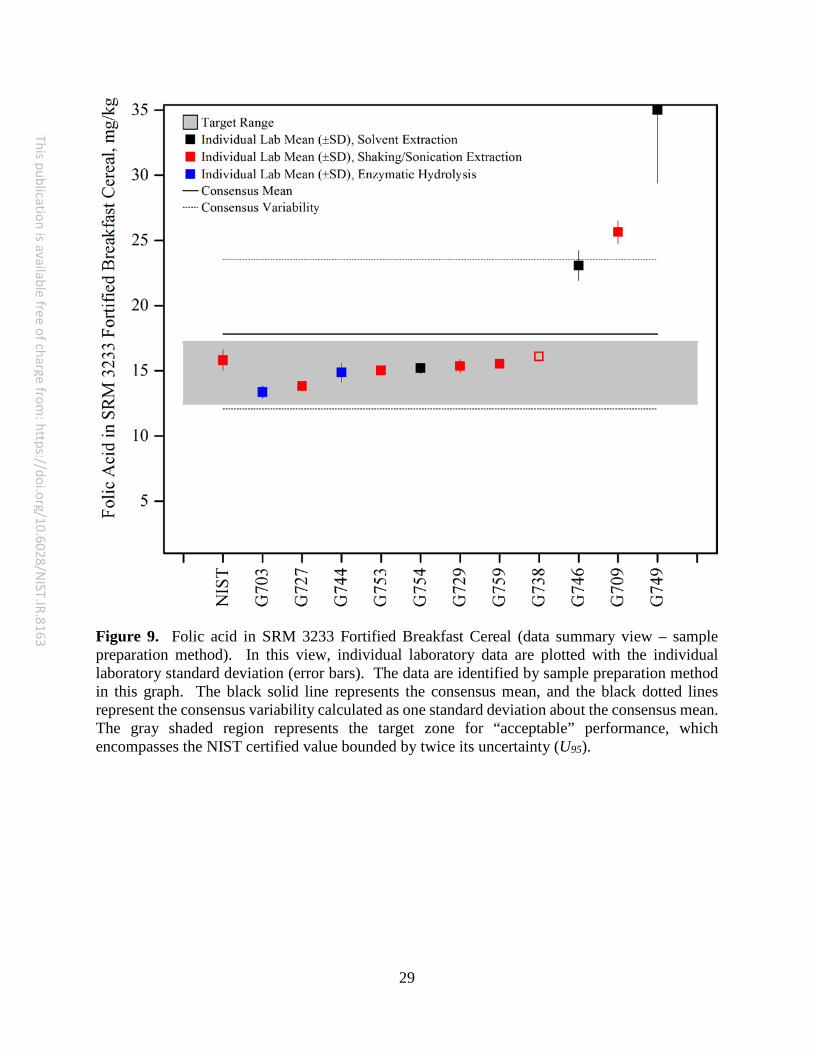
Figure 9. Folic acid in SRM 3233 Fortified Breakfast Cereal (data summary view – sample preparation method). In this view, individual laboratory data are plotted with the individual laboratory standard deviation (error bars). The data are identified by sample preparation method in this graph. The black solid line represents the consensus mean, and the black dotted lines represent the consensus variability calculated as one standard deviation about the consensus mean. The gray shaded region represents the target zone for “acceptable” performance, which encompasses the NIST certified value bounded by twice its uncertainty (U95).
30
This publication is available free of charge from: https://doi.org/10.6028/N
IST.IR.8163
Figure 10. Folic acid in Fortified Milk Powder (data summary view – sample preparation method). In this view, individual laboratory data are plotted with the individual laboratory standard deviation (error bars). The data are identified by sample preparation method in this graph. The black solid line represents the consensus mean, and the black dotted lines represent the consensus variability calculated as one standard deviation about the consensus mean. The gray shaded region represents the target zone for “acceptable” performance, which encompasses the NIST assigned value bounded by twice its standard deviation.
31
This publication is available free of charge from: https://doi.org/10.6028/N
IST.IR.8163
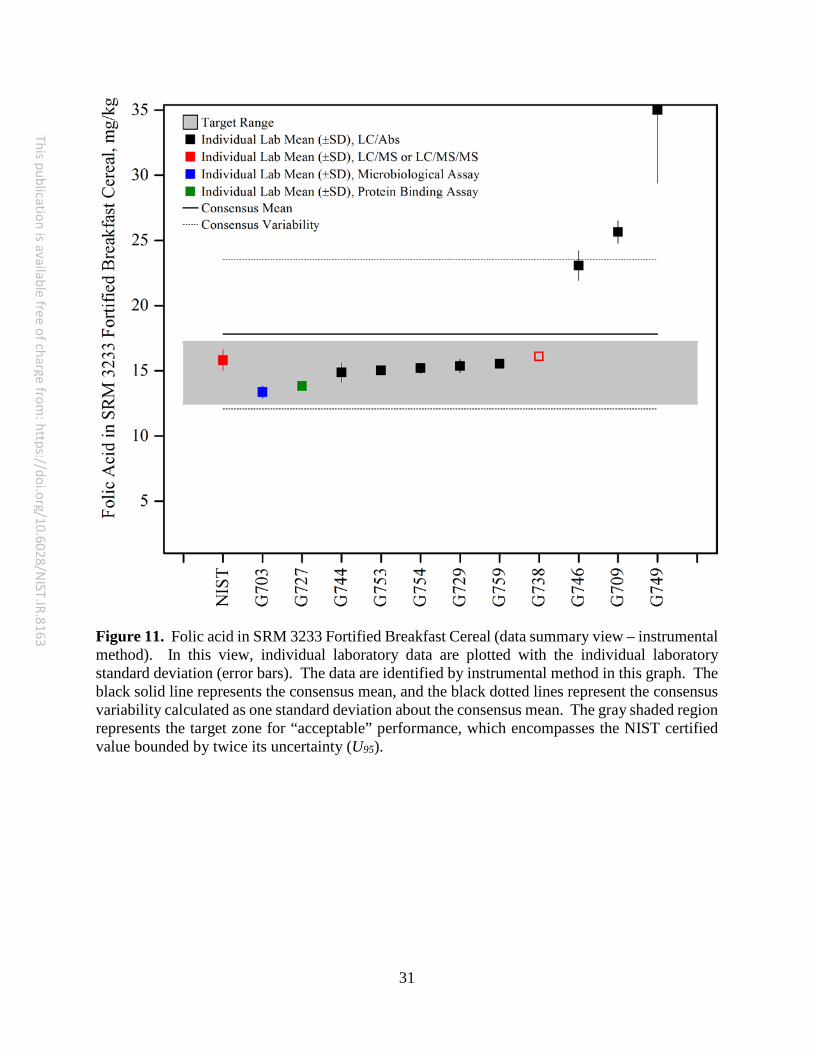
Figure 11. Folic acid in SRM 3233 Fortified Breakfast Cereal (data summary view – instrumental method). In this view, individual laboratory data are plotted with the individual laboratory standard deviation (error bars). The data are identified by instrumental method in this graph. The black solid line represents the consensus mean, and the black dotted lines represent the consensus variability calculated as one standard deviation about the consensus mean. The gray shaded region represents the target zone for “acceptable” performance, which encompasses the NIST certified value bounded by twice its uncertainty (U95).
32
This publication is available free of charge from: https://doi.org/10.6028/N
IST.IR.8163
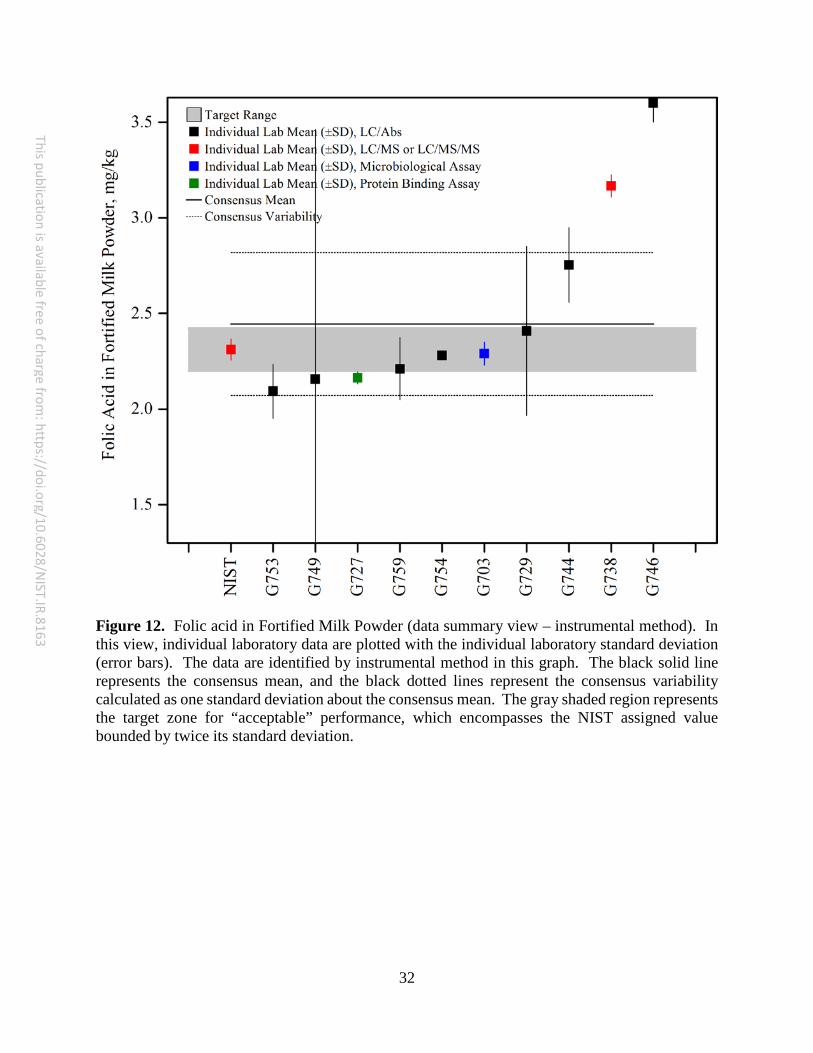
Figure 12. Folic acid in Fortified Milk Powder (data summary view – instrumental method). In this view, individual laboratory data are plotted with the individual laboratory standard deviation (error bars). The data are identified by instrumental method in this graph. The black solid line represents the consensus mean, and the black dotted lines represent the consensus variability calculated as one standard deviation about the consensus mean. The gray shaded region represents the target zone for “acceptable” performance, which encompasses the NIST assigned value bounded by twice its standard deviation.
33
This publication is available free of charge from: https://doi.org/10.6028/N
IST.IR.8163
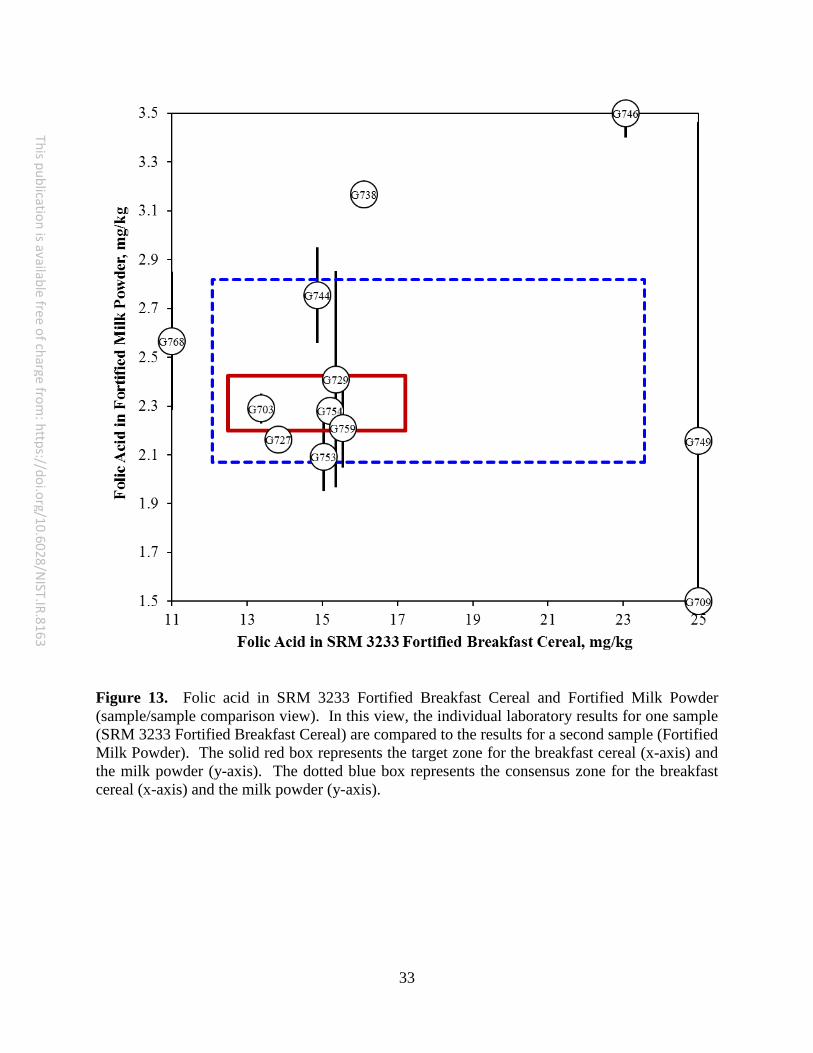
Figure 13. Folic acid in SRM 3233 Fortified Breakfast Cereal and Fortified Milk Powder (sample/sample comparison view). In this view, the individual laboratory results for one sample (SRM 3233 Fortified Breakfast Cereal) are compared to the results for a second sample (Fortified Milk Powder). The solid red box represents the target zone for the breakfast cereal (x-axis) and the milk powder (y-axis). The dotted blue box represents the consensus zone for the breakfast cereal (x-axis) and the milk powder (y-axis).
34
This publication is available free of charge from: https://doi.org/10.6028/N
IST.IR.8163
β-CAROTENE IN SOLUTIONS AND DIETARY SUPPLEMENTS Study Overview In this study, participants were provided with one NIST SRM, SRM 3251 Serenoa repens Extract, and two ethanolic solutions of β-carotene. Participants were asked to use in-house analytical methods to determine the mass fraction of total β-carotene and isomers in each of the matrices and report values on an as-received basis. Sample Information β-carotene Solution 1. Participants were provided with three vials containing approximately 2 mL of all-trans-β-carotene dissolved in ethanol containing 30 ppm BHT. Solution 1 did not contain significant amounts of cis-β-carotene isomers. Before use, participants were instructed to thoroughly mix the contents of the vials and use a sample size of at least 50 mg. Participants were asked to store the material in a freezer at -20 °C, and to prepare one sample and report one value per analyte from each vial provided. Prior to the study, the approximate level of total β-carotene was given as 0.9 mg/kg. The NIST value and uncertainty for total β-carotene in solution 1 were determined spectrophotometrically in ethanol with a molar absorptivity of 2620 dLg-1cm-1, and the β-carotene concentration decreased approximately 10 % from July 2011 until February 2012. The NIST-determined values and uncertainties are reported in the table below. β-carotene Solution 2. Participants were provided with three vials containing approximately 2 mL of Dunaliella extract dissolved in ethanol containing 30 ppm BHT. In solution 2, approximately 30 % of the total β-carotene was in the form of the 9-cis-β-carotene isomer. Before use, participants were instructed to thoroughly mix the contents of the vials and use a sample size of at least 50 mg. Participants were asked to store the material in a freezer at -20 °C, and to prepare one sample and report one value per analyte from each vial provided. Prior to the study, the approximate level of total β-carotene was given as 4 mg/kg. The NIST value and uncertainty for total β-carotene in solution 2 were determined spectrophotometrically in ethanol with a molar absorptivity of 2620 dLg-1cm-1; the total β-carotene content of solution 2 was stabile throughout the time period of the study. The NIST-determined values and uncertainties are reported in the table below. Saw Palmetto Extract. Participants were provided with three ampoules, each containing approximately 1 mL of Serenoa repens extract. The extract was packaged under nitrogen in amber glass ampoules. Before use, participants were instructed to thoroughly mix the contents of the ampoules and use a sample size of at least 50 mg. Participants were asked to store the material at controlled room temperature, 20 °C to 25 °C, and to prepare one sample and report one value per analyte from each ampoule provided. Prior to the study, the approximate level of total β-carotene was given as 50 mg/kg. The NIST certified values and uncertainties for trans-β-carotene, 9-cis-β-carotene, and total β-carotene in SRM 3251 were determined at NIST by LC-absorbance and LC-fluorescence (using different column chemistries), following gravimetric dilution and addition of an internal standard. The NIST-determined values and uncertainties are reported in the table below.
35
This publication is available free of charge from: https://doi.org/10.6028/N
IST.IR.8163
Analyte
Mass Fraction in Solution 1 (mg/kg)
Mass Fraction in Solution 2 (mg/kg)
Mass Fraction in SRM 3251
(mg/kg) trans-β-carotene 36.4 ± 5.6 9-cis-β-carotene 10.40 ± 1.20 Total β-carotene 0.900 ± 0.045 4.000 ± 0.200 46.8 ± 4.6
Study Results
• Forty-one laboratories enrolled in this exercise and received samples. Twenty-three laboratories reported results for total β-carotene in both of the β-carotene solutions (56 % participation). Twenty-four laboratories reported results for total β-carotene in the saw palmetto extract (59 % participation). One laboratory reported a single value for total β-carotene in the saw palmetto extract and was therefore excluded from calculation of summary statistics.2
• Few laboratories (6 or fewer) reported values for cis and trans isomers of β-carotene in any sample.
• The consensus ranges for total β-carotene in both solutions were wide (21 % to 23 % relative standard deviation, (RSD) respectively) but overlapped with the target ranges. The consensus means for total β-carotene in both solutions were significantly above the target ranges.
• The consensus range for total β-carotene in SRM 3251 was excellent (10 % RSD) and overlapped with the target range. The consensus mean for total β-carotene was within the target range.
• The consensus range for trans-β-carotene in SRM 3251 was excellent (7 % RSD) and overlapped with the target range. The consensus mean for trans-β-carotene was within the target range.
• The consensus range for 9-cis-β-carotene in SRM 3251 was reasonable (17 % RSD) and overlapped with the target range. The consensus mean for 9-cis-β-carotene was within the target range.
• A majority of the laboratories reported using simple dilution (48 %) or saponification with extraction (40 %). Other solvent extraction approaches (8 %) and hydrolysis extraction approaches (4 %) were also reported as methods of sample preparation.
• Most laboratories reported using LC with absorbance detection as the analytical method for analysis (92 %). Laboratories also reported using LC-MS or LC-MS/MS (4 %) and spectrophotometry (4 %) as the instrumental approach.
• All participating laboratories reported the use of an external standard approach to quantitation.
Technical Recommendations The following are recommendations based on results obtained from the participants in this study.
• No sample preparation approach or analytical method was identified as exceptionally good or problematic.
• Although no sample pretreatment was necessary for the β-carotene solutions, many laboratories subjected the samples to saponification, enzymatic hydrolysis, and solvent extraction. Sample preparation can isomerize the β-carotene, which would not be evident
36
This publication is available free of charge from: https://doi.org/10.6028/N
IST.IR.8163
in the total β-carotene measurements, but would affect the ratio of the cis/trans isomers observed.
• As shown in Figure 25, Figure 26, and Figure 27, calibration errors may be possible. Laboratories tended to report consistently biased results for the samples and solutions. The most common calibration error in the measurement of carotenoids is caused by either neglecting to assign the concentration spectrophotometrically (carotenoid measurements are traceable to molar absorptivity) or using the wrong molar absorption coefficient (wrong solvent or temperature).
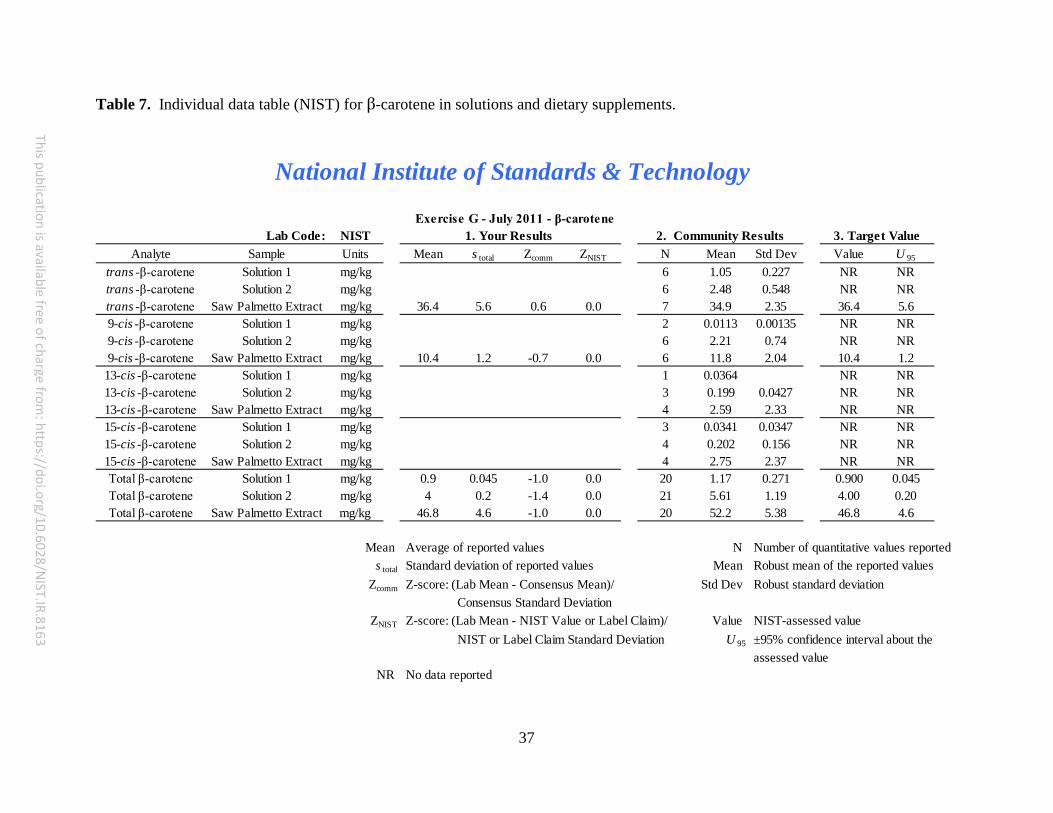
37
This publication is available free of charge from: https://doi.org/10.6028/N
IST.IR.8163
Table 7. Individual data table (NIST) for β-carotene in solutions and dietary supplements.
Lab Code: NISTAnalyte Sample Units Mean s total Zcomm ZNIST N Mean Std Dev Value U 95
trans -β-carotene Solution 1 mg/kg 6 1.05 0.227 NR NRtrans -β-carotene Solution 2 mg/kg 6 2.48 0.548 NR NRtrans -β-carotene Saw Palmetto Extract mg/kg 36.4 5.6 0.6 0.0 7 34.9 2.35 36.4 5.69-cis -β-carotene Solution 1 mg/kg 2 0.0113 0.00135 NR NR9-cis -β-carotene Solution 2 mg/kg 6 2.21 0.74 NR NR9-cis -β-carotene Saw Palmetto Extract mg/kg 10.4 1.2 -0.7 0.0 6 11.8 2.04 10.4 1.2
13-cis -β-carotene Solution 1 mg/kg 1 0.0364 NR NR13-cis -β-carotene Solution 2 mg/kg 3 0.199 0.0427 NR NR13-cis -β-carotene Saw Palmetto Extract mg/kg 4 2.59 2.33 NR NR15-cis -β-carotene Solution 1 mg/kg 3 0.0341 0.0347 NR NR15-cis -β-carotene Solution 2 mg/kg 4 0.202 0.156 NR NR15-cis -β-carotene Saw Palmetto Extract mg/kg 4 2.75 2.37 NR NRTotal β-carotene Solution 1 mg/kg 0.9 0.045 -1.0 0.0 20 1.17 0.271 0.900 0.045Total β-carotene Solution 2 mg/kg 4 0.2 -1.4 0.0 21 5.61 1.19 4.00 0.20Total β-carotene Saw Palmetto Extract mg/kg 46.8 4.6 -1.0 0.0 20 52.2 5.38 46.8 4.6
Mean Average of reported values N Number of quantitative values reporteds total Standard deviation of reported values Mean Robust mean of the reported values
Zcomm Z-score: (Lab Mean - Consensus Mean)/ Std Dev Robust standard deviationConsensus Standard Deviation
ZNIST Z-score: (Lab Mean - NIST Value or Label Claim)/ Value NIST-assessed valueNIST or Label Claim Standard Deviation U 95 ±95% confidence interval about the
assessed valueNR No data reported
National Institute of Standards & Technology
Exercise G - July 2011 - β-carotene1. Your Results 2. Community Results 3. Target Value
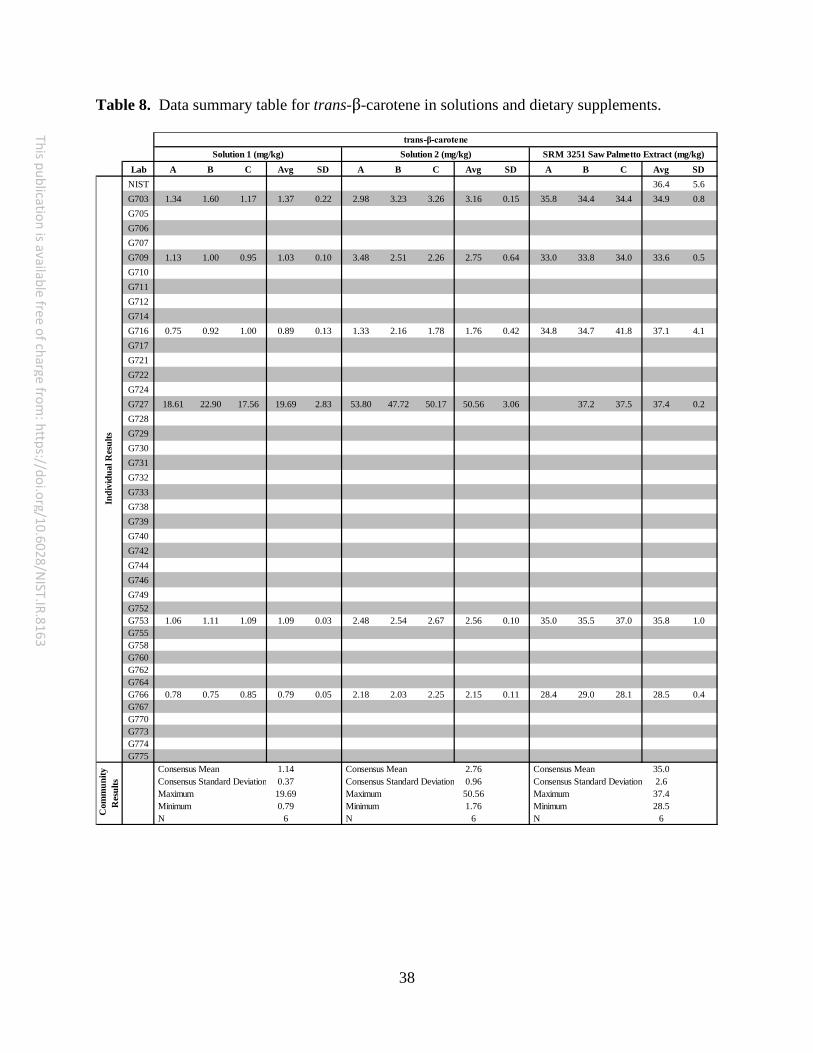
38
This publication is available free of charge from: https://doi.org/10.6028/N
IST.IR.8163
Table 8. Data summary table for trans-β-carotene in solutions and dietary supplements.
Lab A B C Avg SD A B C Avg SD A B C Avg SDNIST 36.4 5.6G703 1.34 1.60 1.17 1.37 0.22 2.98 3.23 3.26 3.16 0.15 35.8 34.4 34.4 34.9 0.8G705G706G707G709 1.13 1.00 0.95 1.03 0.10 3.48 2.51 2.26 2.75 0.64 33.0 33.8 34.0 33.6 0.5G710G711G712G714G716 0.75 0.92 1.00 0.89 0.13 1.33 2.16 1.78 1.76 0.42 34.8 34.7 41.8 37.1 4.1G717G721G722G724G727 18.61 22.90 17.56 19.69 2.83 53.80 47.72 50.17 50.56 3.06 37.2 37.5 37.4 0.2G728G729G730G731G732G733G738G739G740G742G744G746G749G752G753 1.06 1.11 1.09 1.09 0.03 2.48 2.54 2.67 2.56 0.10 35.0 35.5 37.0 35.8 1.0G755G758G760G762G764G766 0.78 0.75 0.85 0.79 0.05 2.18 2.03 2.25 2.15 0.11 28.4 29.0 28.1 28.5 0.4G767G770G773G774G775
Consensus Mean 1.14 Consensus Mean 2.76 Consensus Mean 35.0 Consensus Standard Deviation 0.37 Consensus Standard Deviation 0.96 Consensus Standard Deviation 2.6 Maximum 19.69 Maximum 50.56 Maximum 37.4 Minimum 0.79 Minimum 1.76 Minimum 28.5 N 6 N 6 N 6C
omm
unity
R
esul
tsIn
divi
dual
Res
ults
SRM 3251 Saw Palmetto Extract (mg/kg)trans-β-carotene
Solution 1 (mg/kg) Solution 2 (mg/kg)
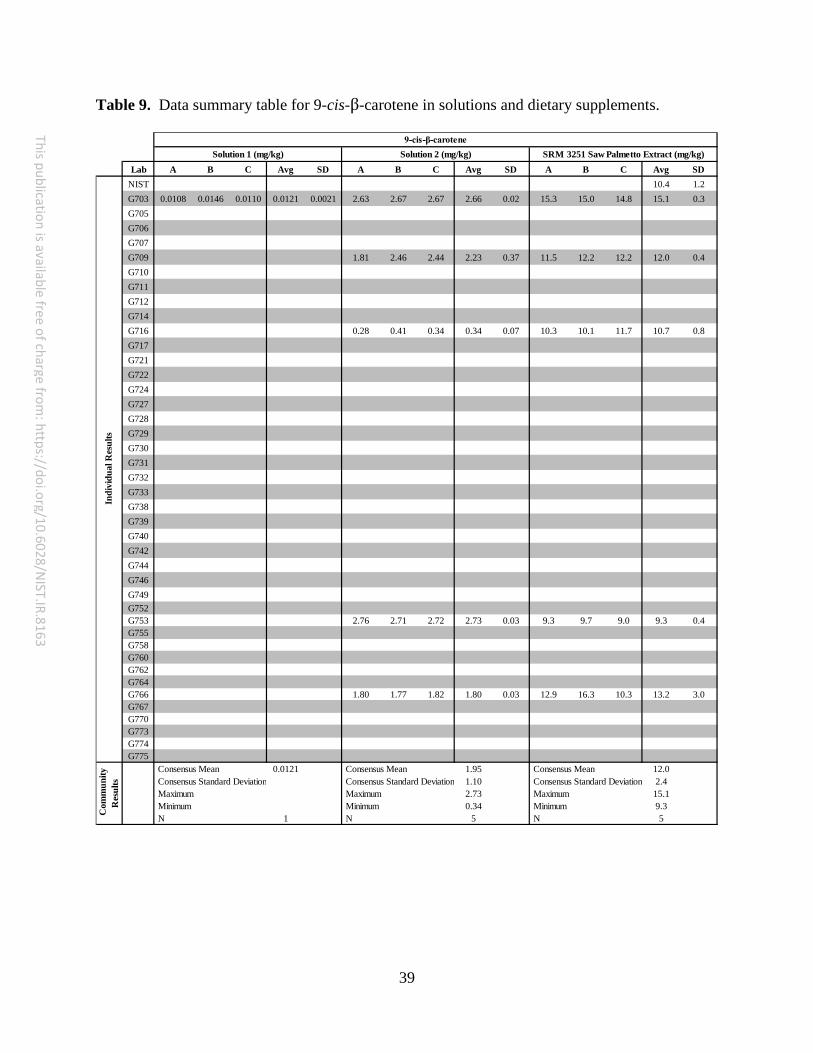
39
This publication is available free of charge from: https://doi.org/10.6028/N
IST.IR.8163
Table 9. Data summary table for 9-cis-β-carotene in solutions and dietary supplements.
Lab A B C Avg SD A B C Avg SD A B C Avg SDNIST 10.4 1.2G703 0.0108 0.0146 0.0110 0.0121 0.0021 2.63 2.67 2.67 2.66 0.02 15.3 15.0 14.8 15.1 0.3G705G706G707G709 1.81 2.46 2.44 2.23 0.37 11.5 12.2 12.2 12.0 0.4G710G711G712G714G716 0.28 0.41 0.34 0.34 0.07 10.3 10.1 11.7 10.7 0.8G717G721G722G724G727G728G729G730G731G732G733G738G739G740G742G744G746G749G752G753 2.76 2.71 2.72 2.73 0.03 9.3 9.7 9.0 9.3 0.4G755G758G760G762G764G766 1.80 1.77 1.82 1.80 0.03 12.9 16.3 10.3 13.2 3.0G767G770G773G774G775
Consensus Mean 0.0121 Consensus Mean 1.95 Consensus Mean 12.0 Consensus Standard Deviation Consensus Standard Deviation 1.10 Consensus Standard Deviation 2.4 Maximum Maximum 2.73 Maximum 15.1 Minimum Minimum 0.34 Minimum 9.3 N 1 N 5 N 5
9-cis-β-caroteneSolution 1 (mg/kg) Solution 2 (mg/kg) SRM 3251 Saw Palmetto Extract (mg/kg)
Indi
vidu
al R
esul
tsC
omm
unity
R
esul
ts

40
This publication is available free of charge from: https://doi.org/10.6028/N
IST.IR.8163
Table 10. Data summary table for 13-cis-β-carotene in solutions and dietary supplements.
Lab A B C Avg SD A B C Avg SD A B C Avg SDNISTG703G705G706G707G709 8.00 6.40 6.51 6.97 0.89G710G711G712G714G716 0.160 0.220 0.190 0.190 0.030 0.73 0.66 0.70 0.70 0.04G717G721G722G724G727G728G729G730G731G732G733G738G739G740G742G744G746G749G752G753 0.360 0.340 0.340 0.347 0.012 3.20 2.90 2.60 2.90 0.30G755G758G760G762G764G766G767G770G773G774G775
Consensus Mean Consensus Mean 0.268 Consensus Mean 3.52 Consensus Standard Deviation Consensus Standard Deviation 0.126 Consensus Standard Deviation 3.61 Maximum Maximum 0.347 Maximum 7.0 Minimum Minimum 0.190 Minimum 0.7 N 0 N 2 N 3
13-cis-β-caroteneSolution 1 (mg/kg) Solution 2 (mg/kg) SRM 3251 Saw Palmetto Extract (mg/kg)
Indi
vidu
al R
esul
tsC
omm
unity
R
esul
ts
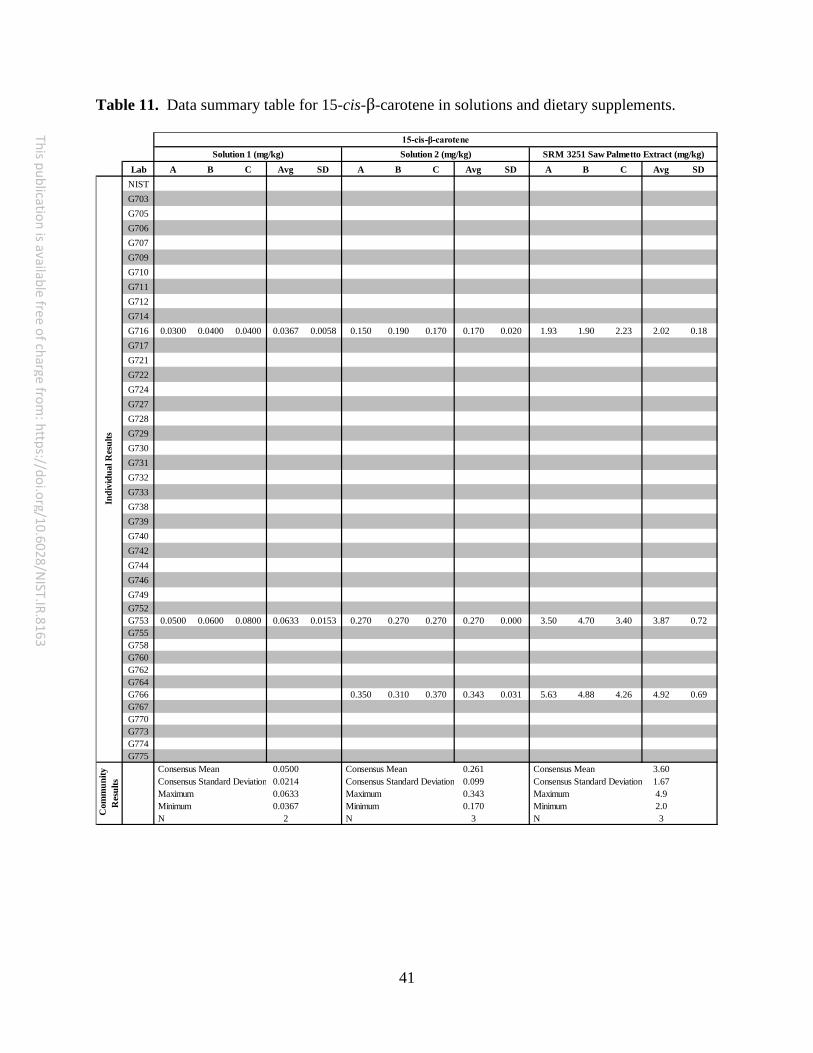
41
This publication is available free of charge from: https://doi.org/10.6028/N
IST.IR.8163
Table 11. Data summary table for 15-cis-β-carotene in solutions and dietary supplements.
Lab A B C Avg SD A B C Avg SD A B C Avg SDNISTG703G705G706G707G709G710G711G712G714G716 0.0300 0.0400 0.0400 0.0367 0.0058 0.150 0.190 0.170 0.170 0.020 1.93 1.90 2.23 2.02 0.18G717G721G722G724G727G728G729G730G731G732G733G738G739G740G742G744G746G749G752G753 0.0500 0.0600 0.0800 0.0633 0.0153 0.270 0.270 0.270 0.270 0.000 3.50 4.70 3.40 3.87 0.72G755G758G760G762G764G766 0.350 0.310 0.370 0.343 0.031 5.63 4.88 4.26 4.92 0.69G767G770G773G774G775
Consensus Mean 0.0500 Consensus Mean 0.261 Consensus Mean 3.60 Consensus Standard Deviation 0.0214 Consensus Standard Deviation 0.099 Consensus Standard Deviation 1.67 Maximum 0.0633 Maximum 0.343 Maximum 4.9 Minimum 0.0367 Minimum 0.170 Minimum 2.0 N 2 N 3 N 3
Indi
vidu
al R
esul
tsC
omm
unity
R
esul
ts
15-cis-β-caroteneSolution 1 (mg/kg) Solution 2 (mg/kg) SRM 3251 Saw Palmetto Extract (mg/kg)
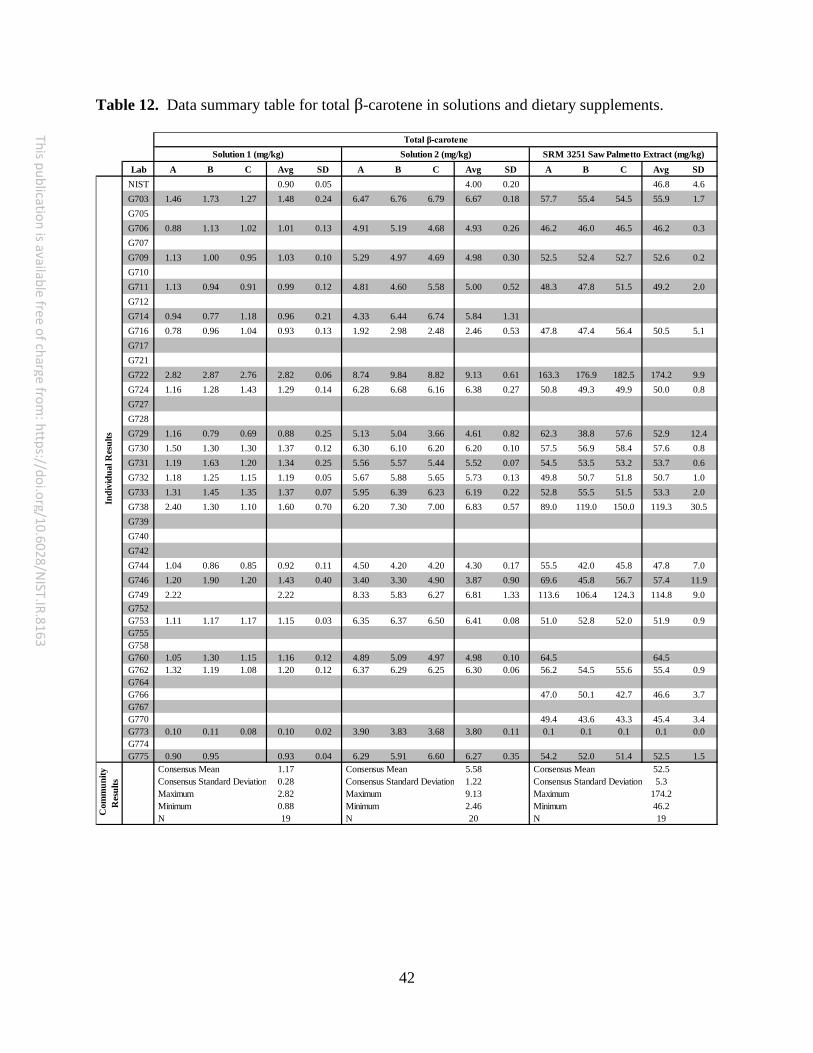
42
This publication is available free of charge from: https://doi.org/10.6028/N
IST.IR.8163
Table 12. Data summary table for total β-carotene in solutions and dietary supplements.
Lab A B C Avg SD A B C Avg SD A B C Avg SDNIST 0.90 0.05 4.00 0.20 46.8 4.6G703 1.46 1.73 1.27 1.48 0.24 6.47 6.76 6.79 6.67 0.18 57.7 55.4 54.5 55.9 1.7G705G706 0.88 1.13 1.02 1.01 0.13 4.91 5.19 4.68 4.93 0.26 46.2 46.0 46.5 46.2 0.3G707G709 1.13 1.00 0.95 1.03 0.10 5.29 4.97 4.69 4.98 0.30 52.5 52.4 52.7 52.6 0.2G710G711 1.13 0.94 0.91 0.99 0.12 4.81 4.60 5.58 5.00 0.52 48.3 47.8 51.5 49.2 2.0G712G714 0.94 0.77 1.18 0.96 0.21 4.33 6.44 6.74 5.84 1.31G716 0.78 0.96 1.04 0.93 0.13 1.92 2.98 2.48 2.46 0.53 47.8 47.4 56.4 50.5 5.1G717G721G722 2.82 2.87 2.76 2.82 0.06 8.74 9.84 8.82 9.13 0.61 163.3 176.9 182.5 174.2 9.9G724 1.16 1.28 1.43 1.29 0.14 6.28 6.68 6.16 6.38 0.27 50.8 49.3 49.9 50.0 0.8G727G728G729 1.16 0.79 0.69 0.88 0.25 5.13 5.04 3.66 4.61 0.82 62.3 38.8 57.6 52.9 12.4G730 1.50 1.30 1.30 1.37 0.12 6.30 6.10 6.20 6.20 0.10 57.5 56.9 58.4 57.6 0.8G731 1.19 1.63 1.20 1.34 0.25 5.56 5.57 5.44 5.52 0.07 54.5 53.5 53.2 53.7 0.6G732 1.18 1.25 1.15 1.19 0.05 5.67 5.88 5.65 5.73 0.13 49.8 50.7 51.8 50.7 1.0G733 1.31 1.45 1.35 1.37 0.07 5.95 6.39 6.23 6.19 0.22 52.8 55.5 51.5 53.3 2.0G738 2.40 1.30 1.10 1.60 0.70 6.20 7.30 7.00 6.83 0.57 89.0 119.0 150.0 119.3 30.5G739G740G742G744 1.04 0.86 0.85 0.92 0.11 4.50 4.20 4.20 4.30 0.17 55.5 42.0 45.8 47.8 7.0G746 1.20 1.90 1.20 1.43 0.40 3.40 3.30 4.90 3.87 0.90 69.6 45.8 56.7 57.4 11.9G749 2.22 2.22 8.33 5.83 6.27 6.81 1.33 113.6 106.4 124.3 114.8 9.0G752G753 1.11 1.17 1.17 1.15 0.03 6.35 6.37 6.50 6.41 0.08 51.0 52.8 52.0 51.9 0.9G755G758G760 1.05 1.30 1.15 1.16 0.12 4.89 5.09 4.97 4.98 0.10 64.5 64.5G762 1.32 1.19 1.08 1.20 0.12 6.37 6.29 6.25 6.30 0.06 56.2 54.5 55.6 55.4 0.9G764G766 47.0 50.1 42.7 46.6 3.7G767G770 49.4 43.6 43.3 45.4 3.4G773 0.10 0.11 0.08 0.10 0.02 3.90 3.83 3.68 3.80 0.11 0.1 0.1 0.1 0.1 0.0G774G775 0.90 0.95 0.93 0.04 6.29 5.91 6.60 6.27 0.35 54.2 52.0 51.4 52.5 1.5
Consensus Mean 1.17 Consensus Mean 5.58 Consensus Mean 52.5 Consensus Standard Deviation 0.28 Consensus Standard Deviation 1.22 Consensus Standard Deviation 5.3 Maximum 2.82 Maximum 9.13 Maximum 174.2 Minimum 0.88 Minimum 2.46 Minimum 46.2 N 19 N 20 N 19C
omm
unity
R
esul
ts
Total β-caroteneSolution 1 (mg/kg) Solution 2 (mg/kg) SRM 3251 Saw Palmetto Extract (mg/kg)
Indi
vidu
al R
esul
ts
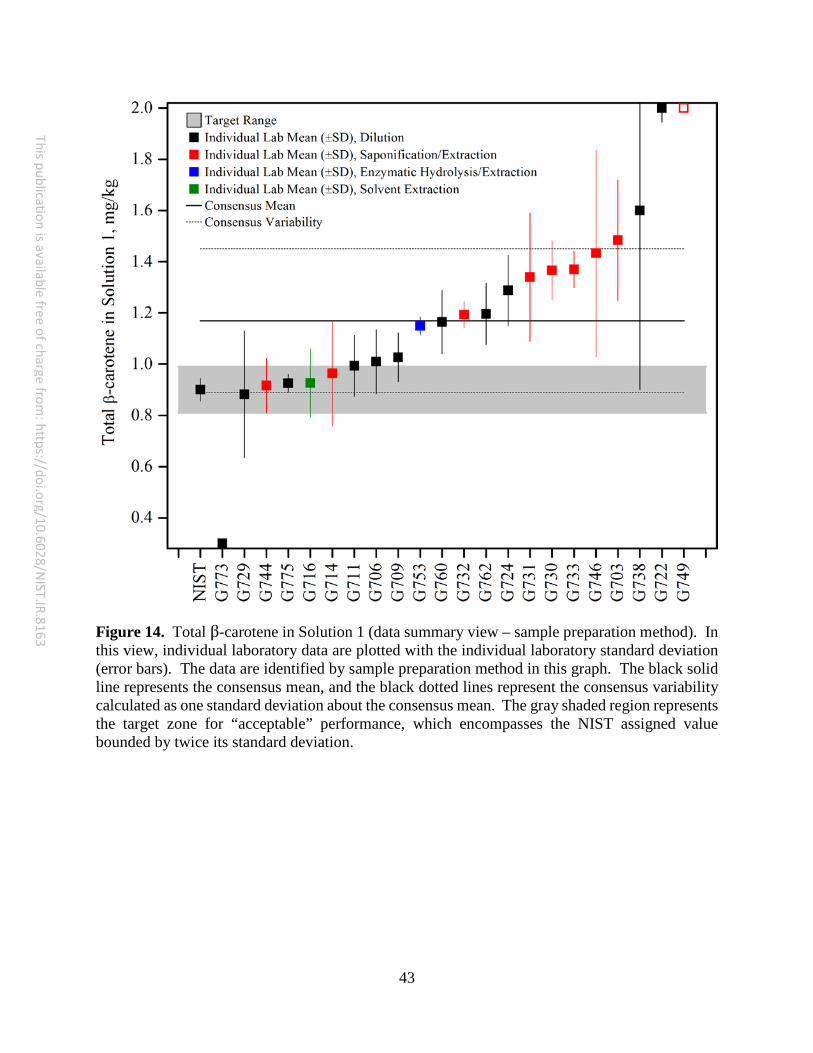
43
This publication is available free of charge from: https://doi.org/10.6028/N
IST.IR.8163
Figure 14. Total β-carotene in Solution 1 (data summary view – sample preparation method). In this view, individual laboratory data are plotted with the individual laboratory standard deviation (error bars). The data are identified by sample preparation method in this graph. The black solid line represents the consensus mean, and the black dotted lines represent the consensus variability calculated as one standard deviation about the consensus mean. The gray shaded region represents the target zone for “acceptable” performance, which encompasses the NIST assigned value bounded by twice its standard deviation.
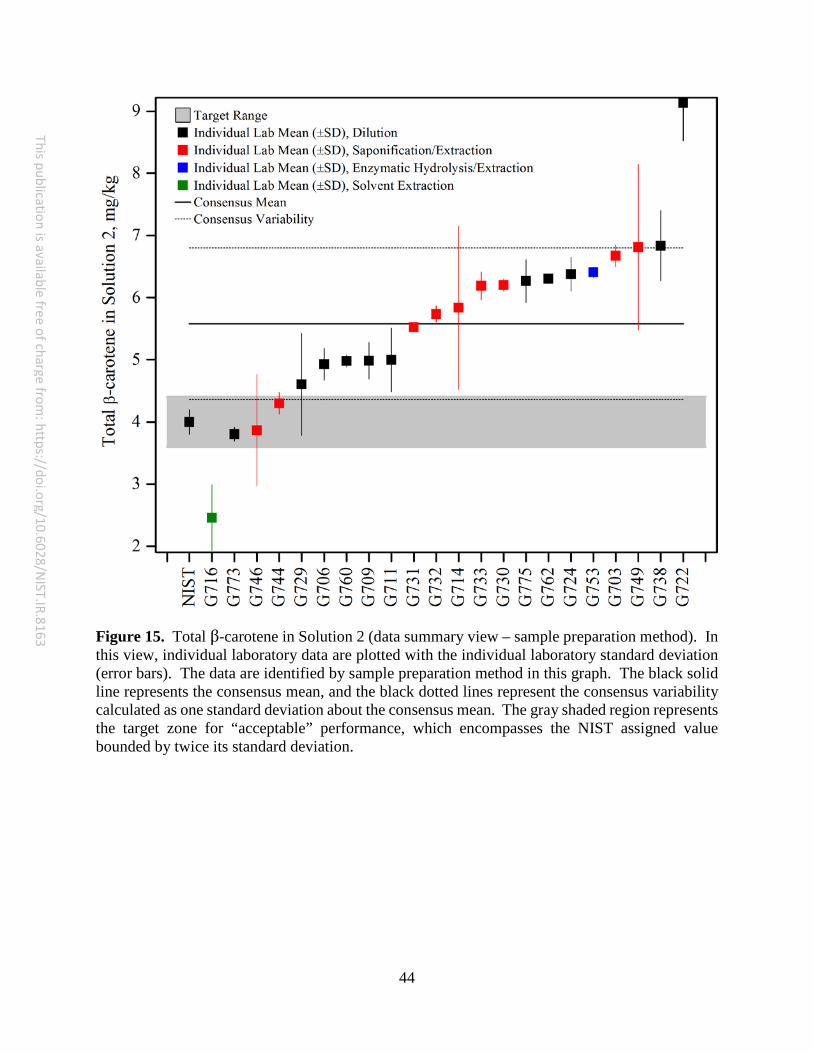
44
This publication is available free of charge from: https://doi.org/10.6028/N
IST.IR.8163
Figure 15. Total β-carotene in Solution 2 (data summary view – sample preparation method). In this view, individual laboratory data are plotted with the individual laboratory standard deviation (error bars). The data are identified by sample preparation method in this graph. The black solid line represents the consensus mean, and the black dotted lines represent the consensus variability calculated as one standard deviation about the consensus mean. The gray shaded region represents the target zone for “acceptable” performance, which encompasses the NIST assigned value bounded by twice its standard deviation.
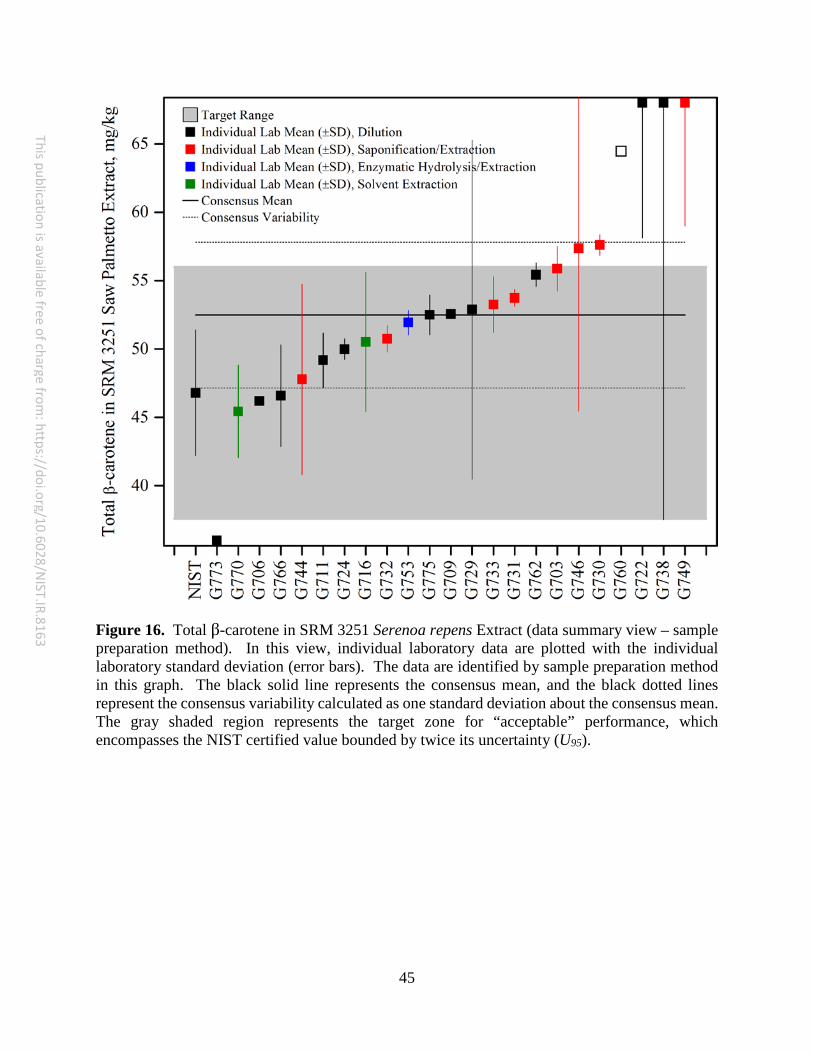
45
This publication is available free of charge from: https://doi.org/10.6028/N
IST.IR.8163
Figure 16. Total β-carotene in SRM 3251 Serenoa repens Extract (data summary view – sample preparation method). In this view, individual laboratory data are plotted with the individual laboratory standard deviation (error bars). The data are identified by sample preparation method in this graph. The black solid line represents the consensus mean, and the black dotted lines represent the consensus variability calculated as one standard deviation about the consensus mean. The gray shaded region represents the target zone for “acceptable” performance, which encompasses the NIST certified value bounded by twice its uncertainty (U95).
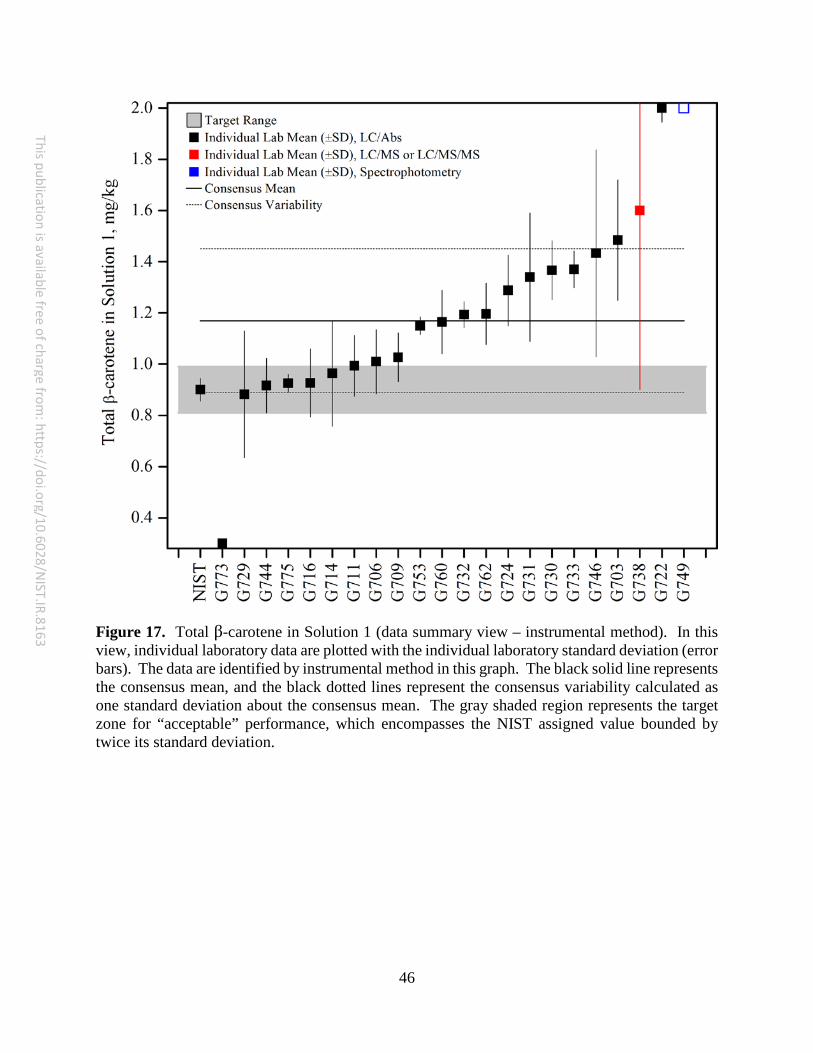
46
This publication is available free of charge from: https://doi.org/10.6028/N
IST.IR.8163
Figure 17. Total β-carotene in Solution 1 (data summary view – instrumental method). In this view, individual laboratory data are plotted with the individual laboratory standard deviation (error bars). The data are identified by instrumental method in this graph. The black solid line represents the consensus mean, and the black dotted lines represent the consensus variability calculated as one standard deviation about the consensus mean. The gray shaded region represents the target zone for “acceptable” performance, which encompasses the NIST assigned value bounded by twice its standard deviation.
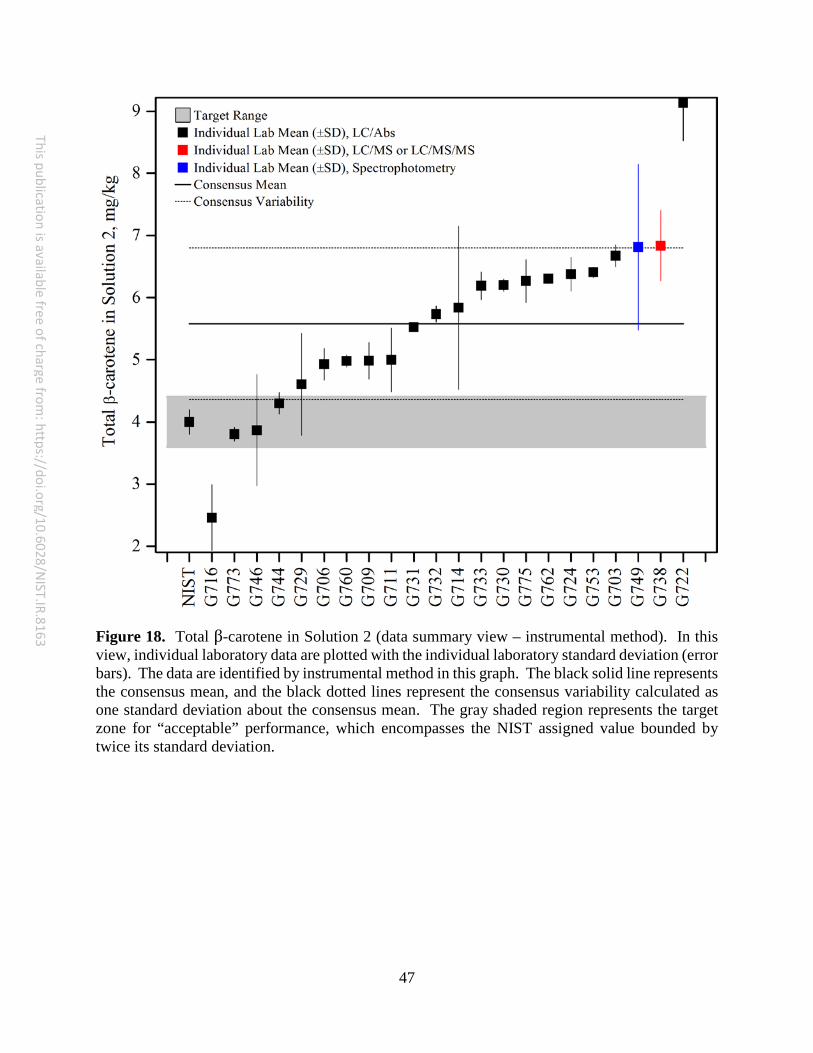
47
This publication is available free of charge from: https://doi.org/10.6028/N
IST.IR.8163
Figure 18. Total β-carotene in Solution 2 (data summary view – instrumental method). In this view, individual laboratory data are plotted with the individual laboratory standard deviation (error bars). The data are identified by instrumental method in this graph. The black solid line represents the consensus mean, and the black dotted lines represent the consensus variability calculated as one standard deviation about the consensus mean. The gray shaded region represents the target zone for “acceptable” performance, which encompasses the NIST assigned value bounded by twice its standard deviation.
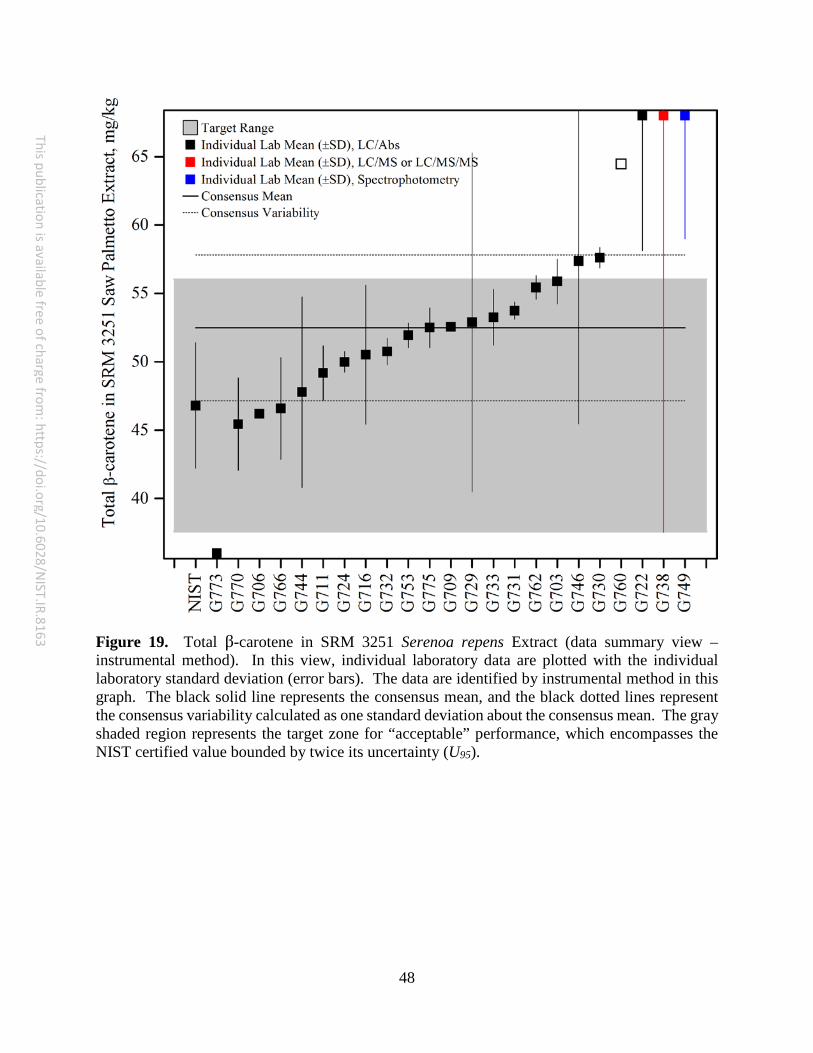
48
This publication is available free of charge from: https://doi.org/10.6028/N
IST.IR.8163
Figure 19. Total β-carotene in SRM 3251 Serenoa repens Extract (data summary view – instrumental method). In this view, individual laboratory data are plotted with the individual laboratory standard deviation (error bars). The data are identified by instrumental method in this graph. The black solid line represents the consensus mean, and the black dotted lines represent the consensus variability calculated as one standard deviation about the consensus mean. The gray shaded region represents the target zone for “acceptable” performance, which encompasses the NIST certified value bounded by twice its uncertainty (U95).
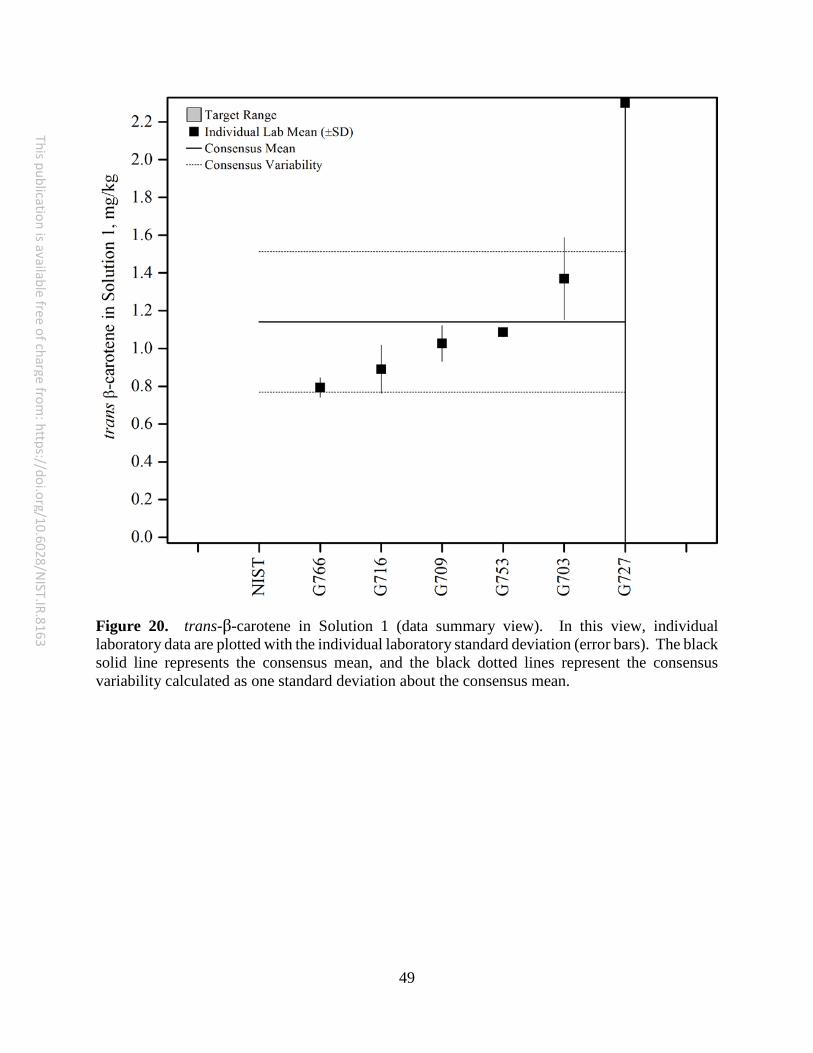
49
This publication is available free of charge from: https://doi.org/10.6028/N
IST.IR.8163
Figure 20. trans-β-carotene in Solution 1 (data summary view). In this view, individual laboratory data are plotted with the individual laboratory standard deviation (error bars). The black solid line represents the consensus mean, and the black dotted lines represent the consensus variability calculated as one standard deviation about the consensus mean.
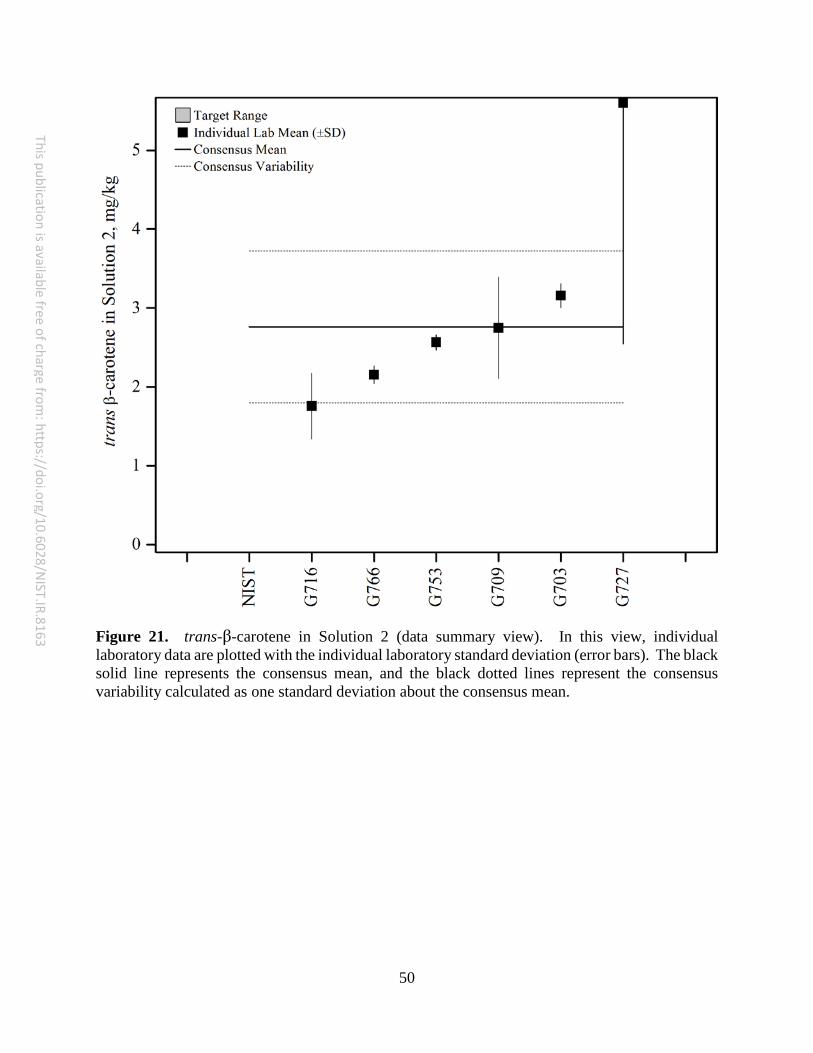
50
This publication is available free of charge from: https://doi.org/10.6028/N
IST.IR.8163
Figure 21. trans-β-carotene in Solution 2 (data summary view). In this view, individual laboratory data are plotted with the individual laboratory standard deviation (error bars). The black solid line represents the consensus mean, and the black dotted lines represent the consensus variability calculated as one standard deviation about the consensus mean.
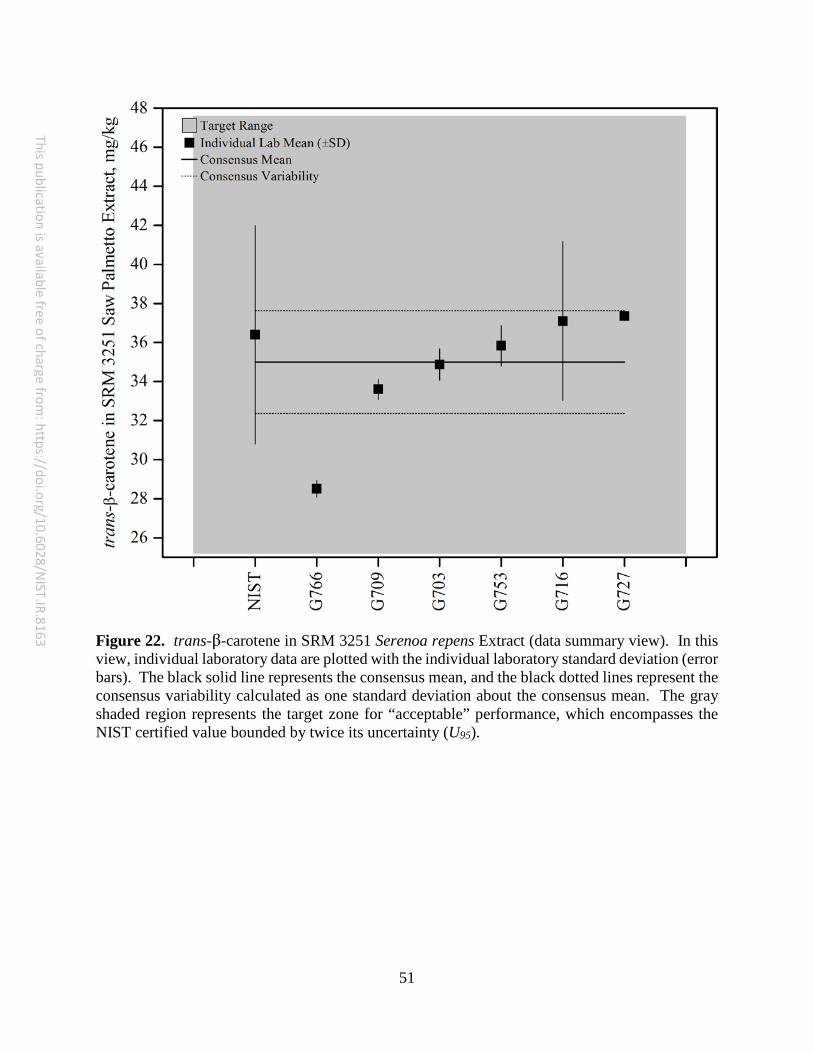
51
This publication is available free of charge from: https://doi.org/10.6028/N
IST.IR.8163
Figure 22. trans-β-carotene in SRM 3251 Serenoa repens Extract (data summary view). In this view, individual laboratory data are plotted with the individual laboratory standard deviation (error bars). The black solid line represents the consensus mean, and the black dotted lines represent the consensus variability calculated as one standard deviation about the consensus mean. The gray shaded region represents the target zone for “acceptable” performance, which encompasses the NIST certified value bounded by twice its uncertainty (U95).
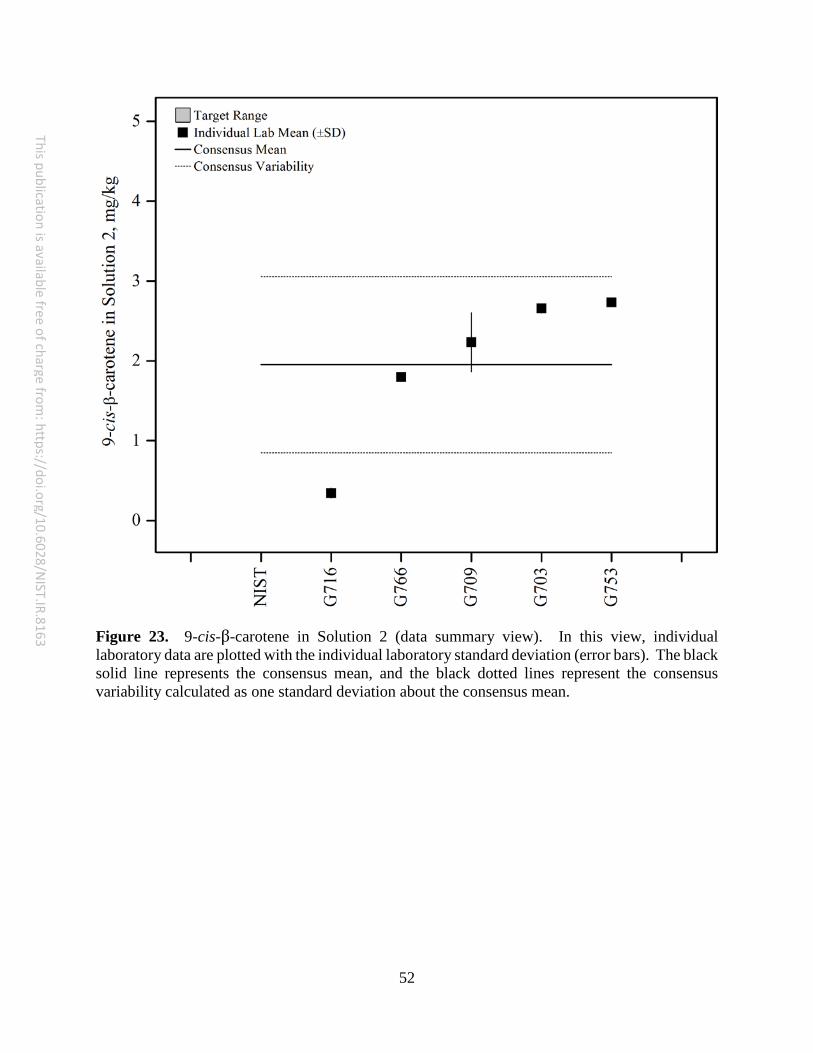
52
This publication is available free of charge from: https://doi.org/10.6028/N
IST.IR.8163
Figure 23. 9-cis-β-carotene in Solution 2 (data summary view). In this view, individual laboratory data are plotted with the individual laboratory standard deviation (error bars). The black solid line represents the consensus mean, and the black dotted lines represent the consensus variability calculated as one standard deviation about the consensus mean.
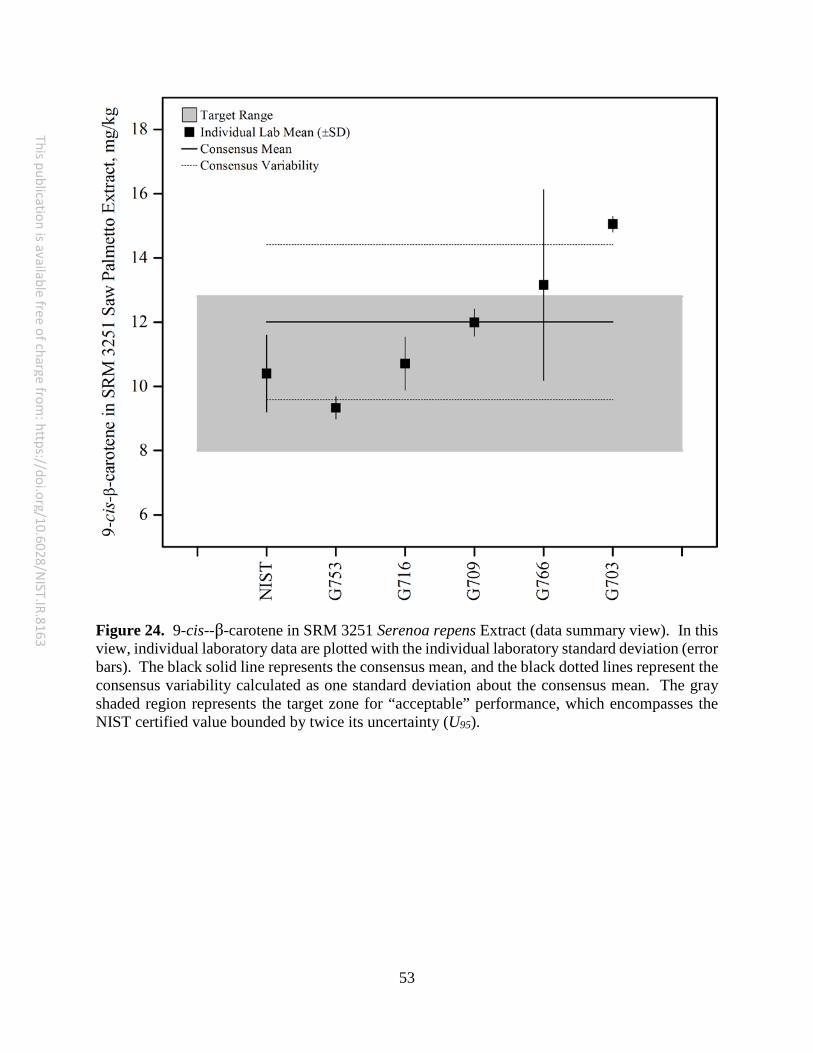
53
This publication is available free of charge from: https://doi.org/10.6028/N
IST.IR.8163
Figure 24. 9-cis--β-carotene in SRM 3251 Serenoa repens Extract (data summary view). In this view, individual laboratory data are plotted with the individual laboratory standard deviation (error bars). The black solid line represents the consensus mean, and the black dotted lines represent the consensus variability calculated as one standard deviation about the consensus mean. The gray shaded region represents the target zone for “acceptable” performance, which encompasses the NIST certified value bounded by twice its uncertainty (U95).
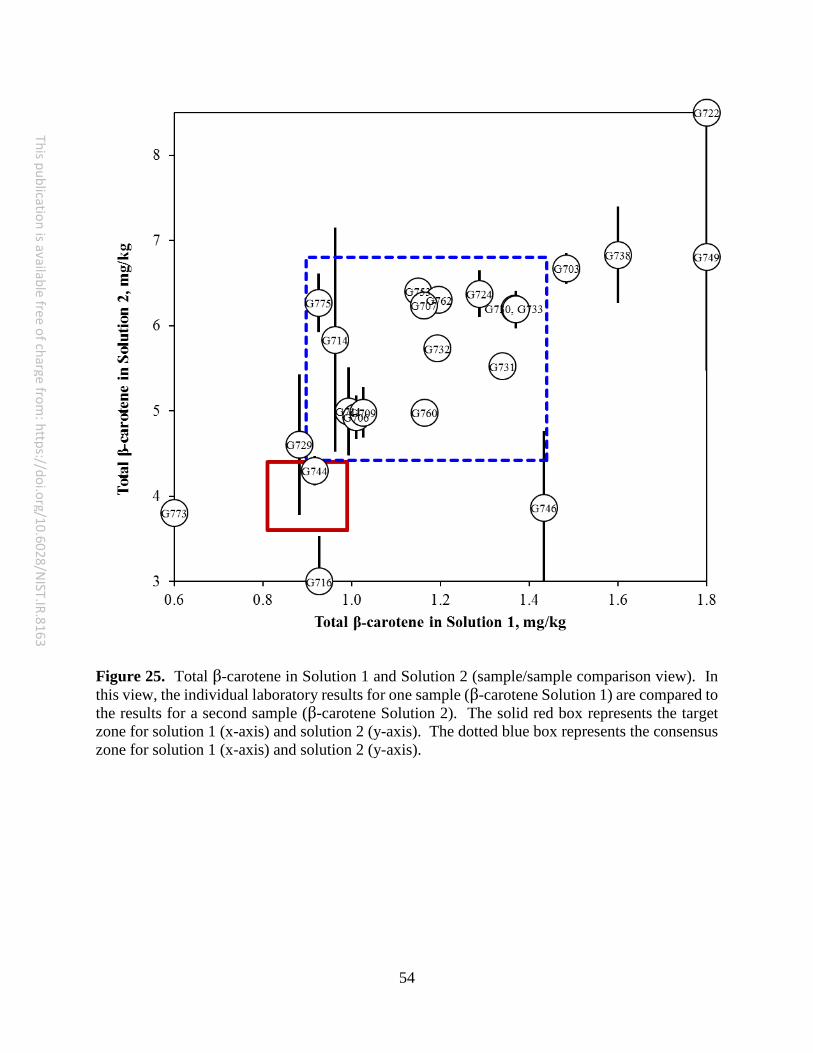
54
This publication is available free of charge from: https://doi.org/10.6028/N
IST.IR.8163
Figure 25. Total β-carotene in Solution 1 and Solution 2 (sample/sample comparison view). In this view, the individual laboratory results for one sample (β-carotene Solution 1) are compared to the results for a second sample (β-carotene Solution 2). The solid red box represents the target zone for solution 1 (x-axis) and solution 2 (y-axis). The dotted blue box represents the consensus zone for solution 1 (x-axis) and solution 2 (y-axis).
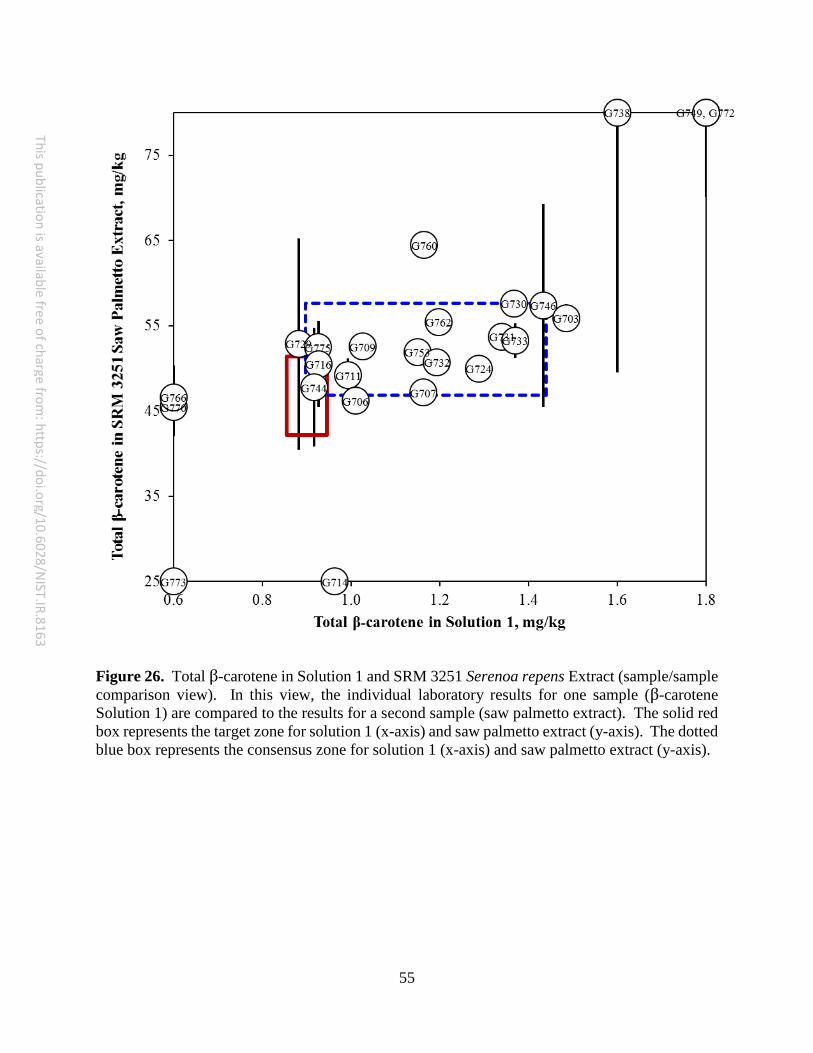
55
This publication is available free of charge from: https://doi.org/10.6028/N
IST.IR.8163
Figure 26. Total β-carotene in Solution 1 and SRM 3251 Serenoa repens Extract (sample/sample comparison view). In this view, the individual laboratory results for one sample (β-carotene Solution 1) are compared to the results for a second sample (saw palmetto extract). The solid red box represents the target zone for solution 1 (x-axis) and saw palmetto extract (y-axis). The dotted blue box represents the consensus zone for solution 1 (x-axis) and saw palmetto extract (y-axis).
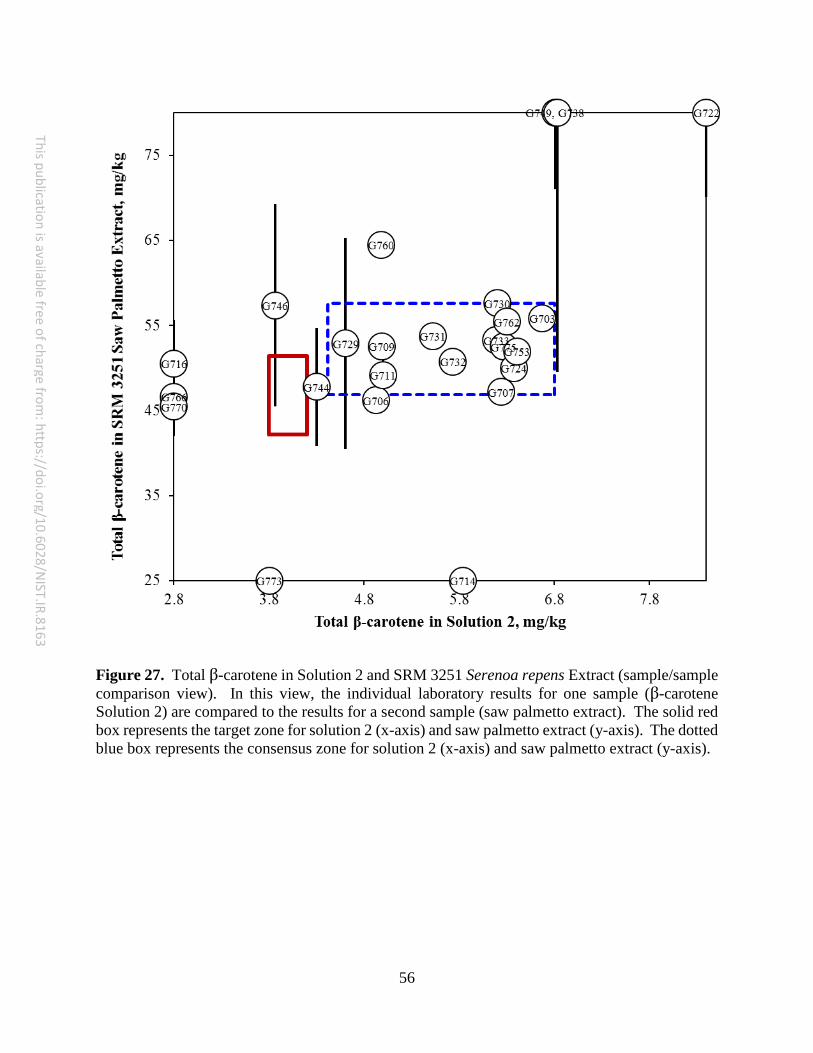
56
This publication is available free of charge from: https://doi.org/10.6028/N
IST.IR.8163
Figure 27. Total β-carotene in Solution 2 and SRM 3251 Serenoa repens Extract (sample/sample comparison view). In this view, the individual laboratory results for one sample (β-carotene Solution 2) are compared to the results for a second sample (saw palmetto extract). The solid red box represents the target zone for solution 2 (x-axis) and saw palmetto extract (y-axis). The dotted blue box represents the consensus zone for solution 2 (x-axis) and saw palmetto extract (y-axis).
57
This publication is available free of charge from: https://doi.org/10.6028/N
IST.IR.8163
ANTHOCYANINS & ANTHOCYANIDINS IN DIETARY SUPPLEMENTS Study Overview In this study, participants were provided with two NIST SRMs, SRM 3283 Cranberry Extract and SRM 3291 Bilberry Extract. Participants were asked to use in-house analytical methods to determine the mass fractions of anthocyanins and/or anthocyanidins in each of the matrices and report values on an as-received basis. Sample Information Cranberry Extract. Participants were provided with one packet containing approximately 2.5 g of cranberry extract. The cranberry extract was heat-sealed inside nitrogen-flushed 4 mil polyethylene bags, which were then sealed inside aluminized plastic bags with 2 packets of silica gel. Before use, participants were instructed to thoroughly mix the contents of the packet and use a sample size of at least 0.1 g. Participants were asked to store the material at controlled room temperature, 20 °C to 25 °C, and to prepare three samples and report three values from the single packet provided. Prior to the study, the approximate analyte levels were given as 1.8 mg/g cyanidin, 0.1 mg/g delphinidin, and 0.7 mg/g peonidin. NIST assigned values for anthocyanins and anthocyanidins were not available at the time of this report. Bilberry Extract. Participants were provided with one packet containing approximately 1 g of bilberry extract. The bilberry extract was heat-sealed inside nitrogen-flushed 4 mil polyethylene bags, which were then sealed inside aluminized plastic bags with 2 packets of silica gel. Before use, participants were instructed to thoroughly mix the contents of the packet and use a sample size of at least 0.1 g. Participants were asked to store the material at controlled room temperature, 20 °C to 25 °C, and to prepare three samples and report three values from the single packet provided. Prior to the study, the approximate analyte levels were given as 40 mg/g cyanidin, 45 mg/g delphinidin, 25 mg/g malvidin, 10 mg/g peonidin, and 15 mg/g petunidin. NIST assigned values for anthocyanins and anthocyanidins were not available at the time of this report. Study Results
• Thirty-four laboratories enrolled in this exercise and received samples. • Five to ten laboratories reported results for anthocyanidins in both the cranberry extract
and the bilberry extract (21 % to 38 % participation). One laboratory reported a single value for anthocyanidins in both samples and was therefore excluded from calculation of summary statistics.2 Further discussion will only include studies in which at least eight laboratories reported data. • The consensus ranges for anthocyanidins in both matrices were wide (46 % to over 100
% RSD). • The consensus means were very low compared to the expected values reported prior to
the study. • Nine to fourteen laboratories reported results for anthocyanins in both the cranberry extract
and the bilberry extract (27 % to 41 % participation). • The consensus ranges for anthocyanins in the cranberry extract ranged from acceptable
(21 % RSD) to wide (29 % to over 100 % RSD). • The consensus ranges for anthocyanins in the bilberry extract ranged from acceptable
(13 % to 23 % RSD) to wide (38 % to 56 % RSD).
58
This publication is available free of charge from: https://doi.org/10.6028/N
IST.IR.8163
• Nineteen laboratories reported results for total anthocyanins in both the cranberry extract and the bilberry extract (56 % participation). One laboratory reported a single value for total anthocyanins in both samples and was therefore excluded from calculation of summary statistics.2 • The consensus range for total anthocyanins in the cranberry extract was wide (38 %
RSD). • The consensus range for total anthocyanins in the bilberry extract was acceptable (22 %
RSD). • A majority of the laboratories reported using a solvent extraction approach (50 %) or a
shaking or sonication extraction approach (39 %). Hydrolysis was also reported as a method of sample preparation by two laboratories (11 %).
• Most laboratories reported using LC with absorbance detection as the analytical method for analysis (78 %). Laboratories also reported using spectrophotometry (17 %) and a microbiological assay (6 %) as the instrumental approach.
• Most laboratories reported the use of an external standard approach to quantitation (89 %), while two laboratories reported calibration against a molar absorptivity.
Technical Recommendations The following are recommendations based on results obtained from the participants in this study.
• The wide consensus ranges for the anthocyanidins may be related to the extraction approach utilized. • Laboratories using a hydrolysis approach were not included in the consensus
calculations. • The variability in the data could be attributed to the extraction approach. The
glycosides can be broken down into the aglycones, and differences in the extraction time, temperature, or solvent used could result in increased variability in the amount of glycosides converted to aglycones.
• Many laboratories are not calibrating using reference standards for each of these compounds, and are instead using a single compound (e.g. cyanidin) for calibration of all five aglycones. If this were a major factor, the variability in the cyanidin consensus should be lower than that for the other aglycones, which was not observed.
• The wide consensus ranges for the anthocyanins may also be related to the extraction approach utilized. • Laboratories using a hydrolysis approach were not included in the consensus
calculations. • As described above, the variability in the data could be attributed to the extraction
approach. The glycosides can be broken down into the aglycones, and differences in the extraction time, temperature, or solvent used could result in increased variability in the amount of glycosides converted to aglycones.
• Many laboratories are not calibrating using reference standards for each of these compounds, and are instead using a single compound (e.g. cyanidin glucoside) or a small subset of the glycosides for calibration of all fifteen glycosides. If this were a major factor, the variability in the cyanidin consensus should be lower than that for the other aglycones, which was not observed.
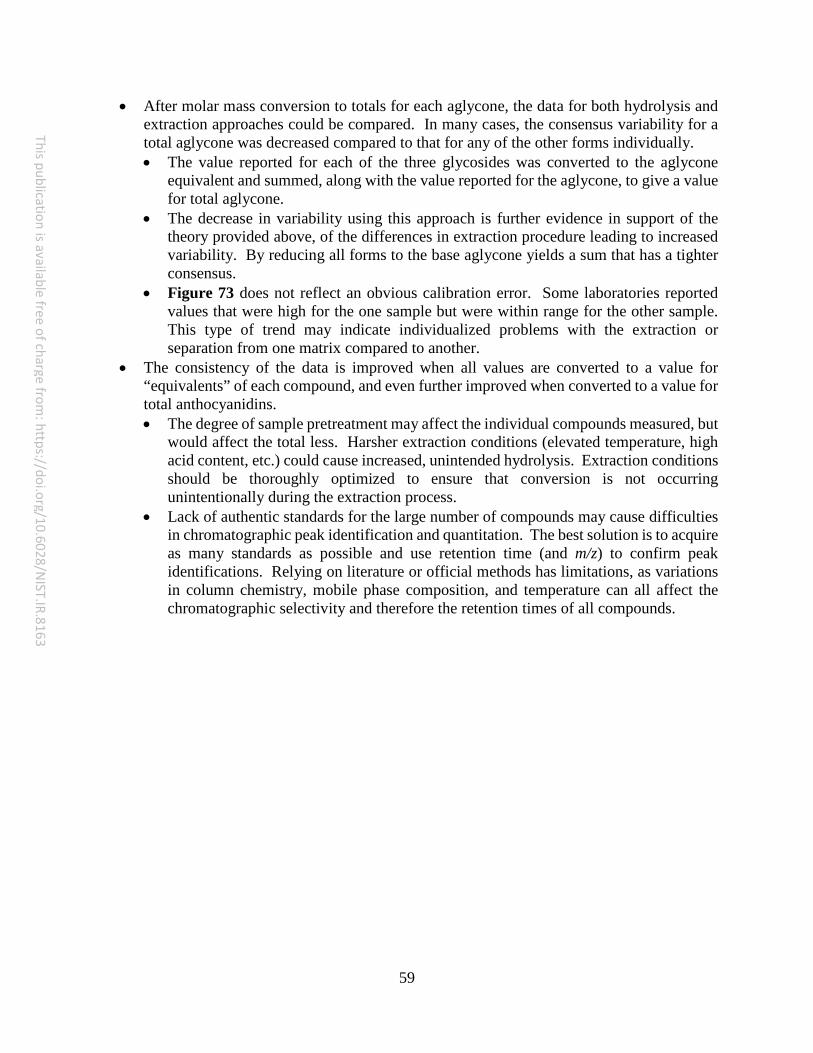
59
This publication is available free of charge from: https://doi.org/10.6028/N
IST.IR.8163
• After molar mass conversion to totals for each aglycone, the data for both hydrolysis and extraction approaches could be compared. In many cases, the consensus variability for a total aglycone was decreased compared to that for any of the other forms individually. • The value reported for each of the three glycosides was converted to the aglycone
equivalent and summed, along with the value reported for the aglycone, to give a value for total aglycone.
• The decrease in variability using this approach is further evidence in support of the theory provided above, of the differences in extraction procedure leading to increased variability. By reducing all forms to the base aglycone yields a sum that has a tighter consensus.
• Figure 73 does not reflect an obvious calibration error. Some laboratories reported values that were high for the one sample but were within range for the other sample. This type of trend may indicate individualized problems with the extraction or separation from one matrix compared to another.
• The consistency of the data is improved when all values are converted to a value for “equivalents” of each compound, and even further improved when converted to a value for total anthocyanidins. • The degree of sample pretreatment may affect the individual compounds measured, but
would affect the total less. Harsher extraction conditions (elevated temperature, high acid content, etc.) could cause increased, unintended hydrolysis. Extraction conditions should be thoroughly optimized to ensure that conversion is not occurring unintentionally during the extraction process.
• Lack of authentic standards for the large number of compounds may cause difficulties in chromatographic peak identification and quantitation. The best solution is to acquire as many standards as possible and use retention time (and m/z) to confirm peak identifications. Relying on literature or official methods has limitations, as variations in column chemistry, mobile phase composition, and temperature can all affect the chromatographic selectivity and therefore the retention times of all compounds.
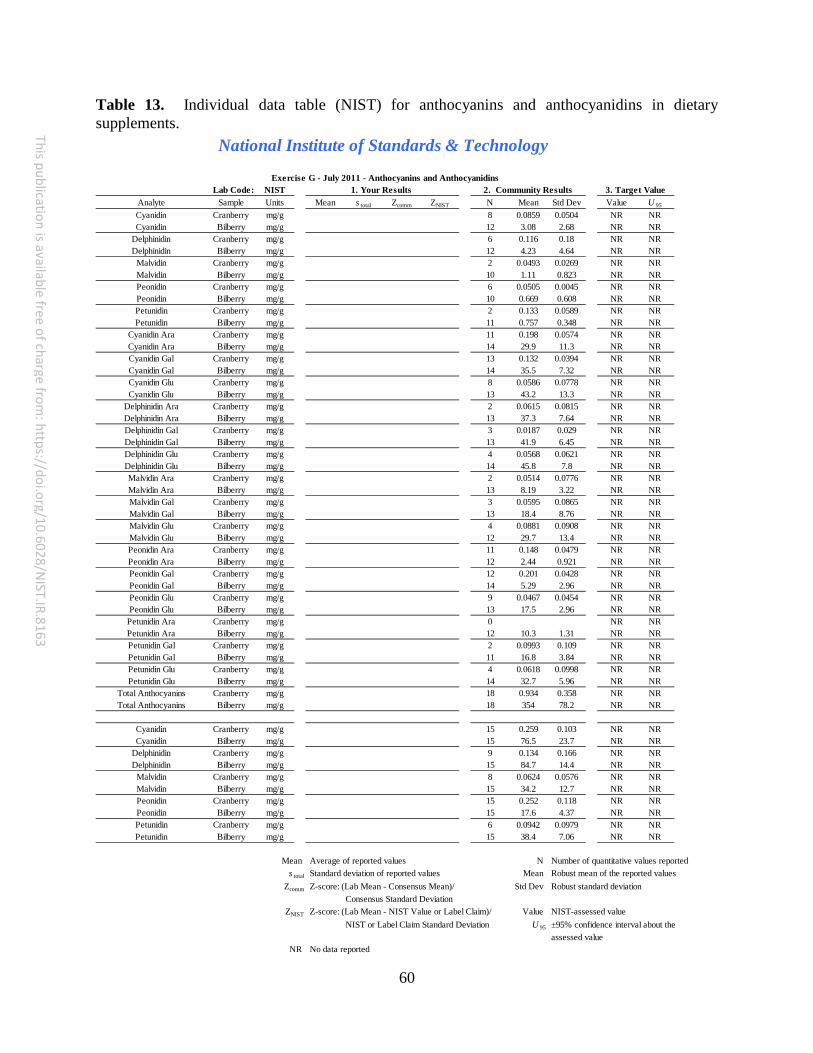
60
This publication is available free of charge from: https://doi.org/10.6028/N
IST.IR.8163
Table 13. Individual data table (NIST) for anthocyanins and anthocyanidins in dietary supplements.
Lab Code: NISTAnalyte Sample Units Mean s total Zcomm ZNIST N Mean Std Dev Value U 95
Cyanidin Cranberry mg/g 8 0.0859 0.0504 NR NRCyanidin Bilberry mg/g 12 3.08 2.68 NR NR
Delphinidin Cranberry mg/g 6 0.116 0.18 NR NRDelphinidin Bilberry mg/g 12 4.23 4.64 NR NR
Malvidin Cranberry mg/g 2 0.0493 0.0269 NR NRMalvidin Bilberry mg/g 10 1.11 0.823 NR NRPeonidin Cranberry mg/g 6 0.0505 0.0045 NR NRPeonidin Bilberry mg/g 10 0.669 0.608 NR NRPetunidin Cranberry mg/g 2 0.133 0.0589 NR NRPetunidin Bilberry mg/g 11 0.757 0.348 NR NR
Cyanidin Ara Cranberry mg/g 11 0.198 0.0574 NR NRCyanidin Ara Bilberry mg/g 14 29.9 11.3 NR NRCyanidin Gal Cranberry mg/g 13 0.132 0.0394 NR NRCyanidin Gal Bilberry mg/g 14 35.5 7.32 NR NRCyanidin Glu Cranberry mg/g 8 0.0586 0.0778 NR NRCyanidin Glu Bilberry mg/g 13 43.2 13.3 NR NR
Delphinidin Ara Cranberry mg/g 2 0.0615 0.0815 NR NRDelphinidin Ara Bilberry mg/g 13 37.3 7.64 NR NRDelphinidin Gal Cranberry mg/g 3 0.0187 0.029 NR NRDelphinidin Gal Bilberry mg/g 13 41.9 6.45 NR NRDelphinidin Glu Cranberry mg/g 4 0.0568 0.0621 NR NRDelphinidin Glu Bilberry mg/g 14 45.8 7.8 NR NRMalvidin Ara Cranberry mg/g 2 0.0514 0.0776 NR NRMalvidin Ara Bilberry mg/g 13 8.19 3.22 NR NRMalvidin Gal Cranberry mg/g 3 0.0595 0.0865 NR NRMalvidin Gal Bilberry mg/g 13 18.4 8.76 NR NRMalvidin Glu Cranberry mg/g 4 0.0881 0.0908 NR NRMalvidin Glu Bilberry mg/g 12 29.7 13.4 NR NRPeonidin Ara Cranberry mg/g 11 0.148 0.0479 NR NRPeonidin Ara Bilberry mg/g 12 2.44 0.921 NR NRPeonidin Gal Cranberry mg/g 12 0.201 0.0428 NR NRPeonidin Gal Bilberry mg/g 14 5.29 2.96 NR NRPeonidin Glu Cranberry mg/g 9 0.0467 0.0454 NR NRPeonidin Glu Bilberry mg/g 13 17.5 2.96 NR NR
Petunidin Ara Cranberry mg/g 0 NR NRPetunidin Ara Bilberry mg/g 12 10.3 1.31 NR NRPetunidin Gal Cranberry mg/g 2 0.0993 0.109 NR NRPetunidin Gal Bilberry mg/g 11 16.8 3.84 NR NRPetunidin Glu Cranberry mg/g 4 0.0618 0.0998 NR NRPetunidin Glu Bilberry mg/g 14 32.7 5.96 NR NR
Total Anthocyanins Cranberry mg/g 18 0.934 0.358 NR NRTotal Anthocyanins Bilberry mg/g 18 354 78.2 NR NR
Cyanidin Cranberry mg/g 15 0.259 0.103 NR NRCyanidin Bilberry mg/g 15 76.5 23.7 NR NR
Delphinidin Cranberry mg/g 9 0.134 0.166 NR NRDelphinidin Bilberry mg/g 15 84.7 14.4 NR NR
Malvidin Cranberry mg/g 8 0.0624 0.0576 NR NRMalvidin Bilberry mg/g 15 34.2 12.7 NR NRPeonidin Cranberry mg/g 15 0.252 0.118 NR NRPeonidin Bilberry mg/g 15 17.6 4.37 NR NRPetunidin Cranberry mg/g 6 0.0942 0.0979 NR NRPetunidin Bilberry mg/g 15 38.4 7.06 NR NR
Mean Average of reported values N Number of quantitative values reporteds total Standard deviation of reported values Mean Robust mean of the reported values
Zcomm Z-score: (Lab Mean - Consensus Mean)/ Std Dev Robust standard deviationConsensus Standard Deviation
ZNIST Z-score: (Lab Mean - NIST Value or Label Claim)/ Value NIST-assessed valueNIST or Label Claim Standard Deviation U 95 ±95% confidence interval about the
assessed valueNR No data reported
National Institute of Standards & Technology
Exercise G - July 2011 - Anthocyanins and Anthocyanidins1. Your Results 2. Community Results 3. Target Value
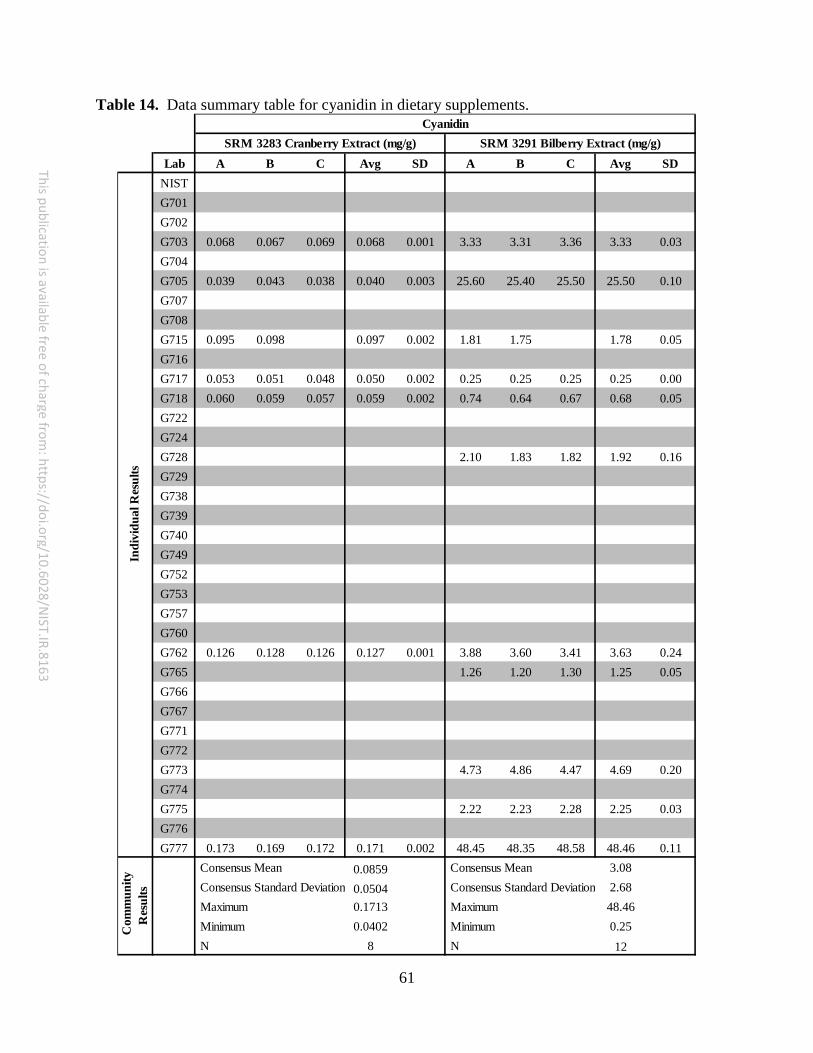
61
This publication is available free of charge from: https://doi.org/10.6028/N
IST.IR.8163
Table 14. Data summary table for cyanidin in dietary supplements.
Lab A B C Avg SD A B C Avg SDNISTG701G702G703 0.068 0.067 0.069 0.068 0.001 3.33 3.31 3.36 3.33 0.03G704G705 0.039 0.043 0.038 0.040 0.003 25.60 25.40 25.50 25.50 0.10G707G708G715 0.095 0.098 0.097 0.002 1.81 1.75 1.78 0.05G716G717 0.053 0.051 0.048 0.050 0.002 0.25 0.25 0.25 0.25 0.00G718 0.060 0.059 0.057 0.059 0.002 0.74 0.64 0.67 0.68 0.05G722G724G728 2.10 1.83 1.82 1.92 0.16G729G738G739G740G749G752G753G757G760G762 0.126 0.128 0.126 0.127 0.001 3.88 3.60 3.41 3.63 0.24G765 1.26 1.20 1.30 1.25 0.05G766G767G771G772G773 4.73 4.86 4.47 4.69 0.20G774G775 2.22 2.23 2.28 2.25 0.03G776G777 0.173 0.169 0.172 0.171 0.002 48.45 48.35 48.58 48.46 0.11
Consensus Mean 0.0859 Consensus Mean 3.08 Consensus Standard Deviation 0.0504 Consensus Standard Deviation 2.68 Maximum 0.1713 Maximum 48.46 Minimum 0.0402 Minimum 0.25 N 8 N 12
Com
mun
ity
Res
ults
CyanidinIn
divi
dual
Res
ults
SRM 3283 Cranberry Extract (mg/g) SRM 3291 Bilberry Extract (mg/g)
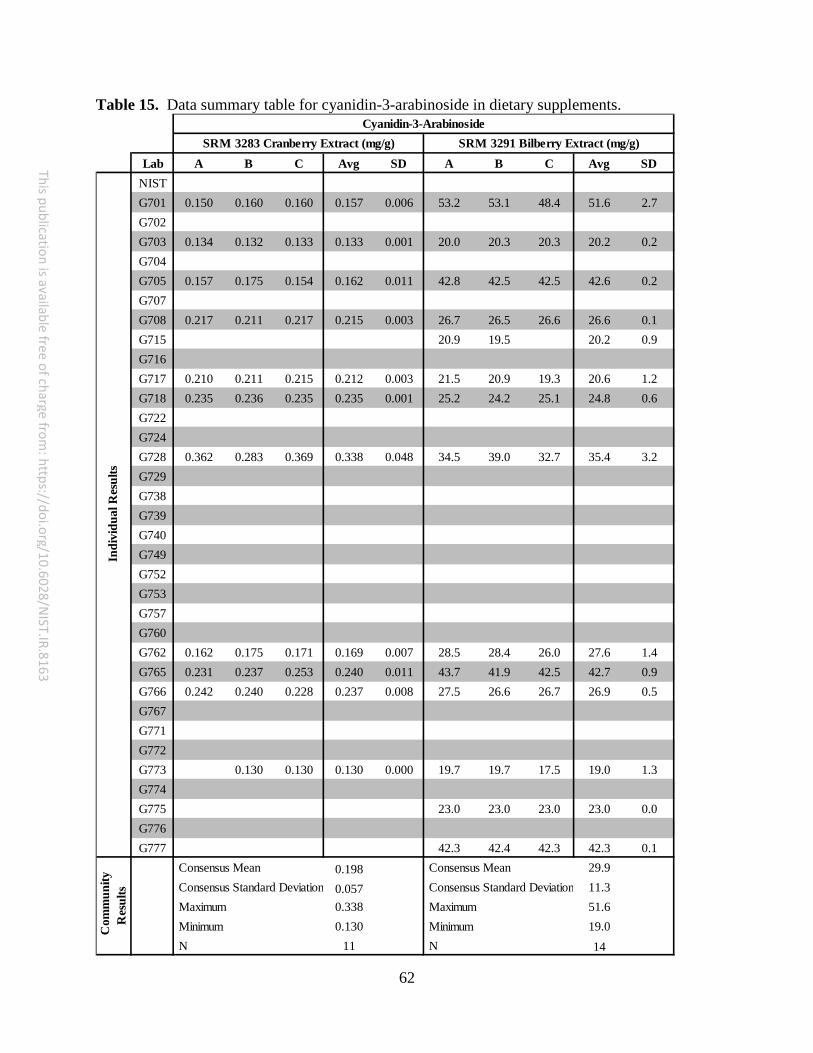
62
This publication is available free of charge from: https://doi.org/10.6028/N
IST.IR.8163
Table 15. Data summary table for cyanidin-3-arabinoside in dietary supplements.
Lab A B C Avg SD A B C Avg SDNISTG701 0.150 0.160 0.160 0.157 0.006 53.2 53.1 48.4 51.6 2.7G702G703 0.134 0.132 0.133 0.133 0.001 20.0 20.3 20.3 20.2 0.2G704G705 0.157 0.175 0.154 0.162 0.011 42.8 42.5 42.5 42.6 0.2G707G708 0.217 0.211 0.217 0.215 0.003 26.7 26.5 26.6 26.6 0.1G715 20.9 19.5 20.2 0.9G716G717 0.210 0.211 0.215 0.212 0.003 21.5 20.9 19.3 20.6 1.2G718 0.235 0.236 0.235 0.235 0.001 25.2 24.2 25.1 24.8 0.6G722G724G728 0.362 0.283 0.369 0.338 0.048 34.5 39.0 32.7 35.4 3.2G729G738G739G740G749G752G753G757G760G762 0.162 0.175 0.171 0.169 0.007 28.5 28.4 26.0 27.6 1.4G765 0.231 0.237 0.253 0.240 0.011 43.7 41.9 42.5 42.7 0.9G766 0.242 0.240 0.228 0.237 0.008 27.5 26.6 26.7 26.9 0.5G767G771G772G773 0.130 0.130 0.130 0.000 19.7 19.7 17.5 19.0 1.3G774G775 23.0 23.0 23.0 23.0 0.0G776G777 42.3 42.4 42.3 42.3 0.1
Consensus Mean 0.198 Consensus Mean 29.9 Consensus Standard Deviation 0.057 Consensus Standard Deviation 11.3 Maximum 0.338 Maximum 51.6 Minimum 0.130 Minimum 19.0 N 11 N 14
SRM 3291 Bilberry Extract (mg/g)
Indi
vidu
al R
esul
tsCyanidin-3-Arabinoside
SRM 3283 Cranberry Extract (mg/g)
Com
mun
ity
Res
ults
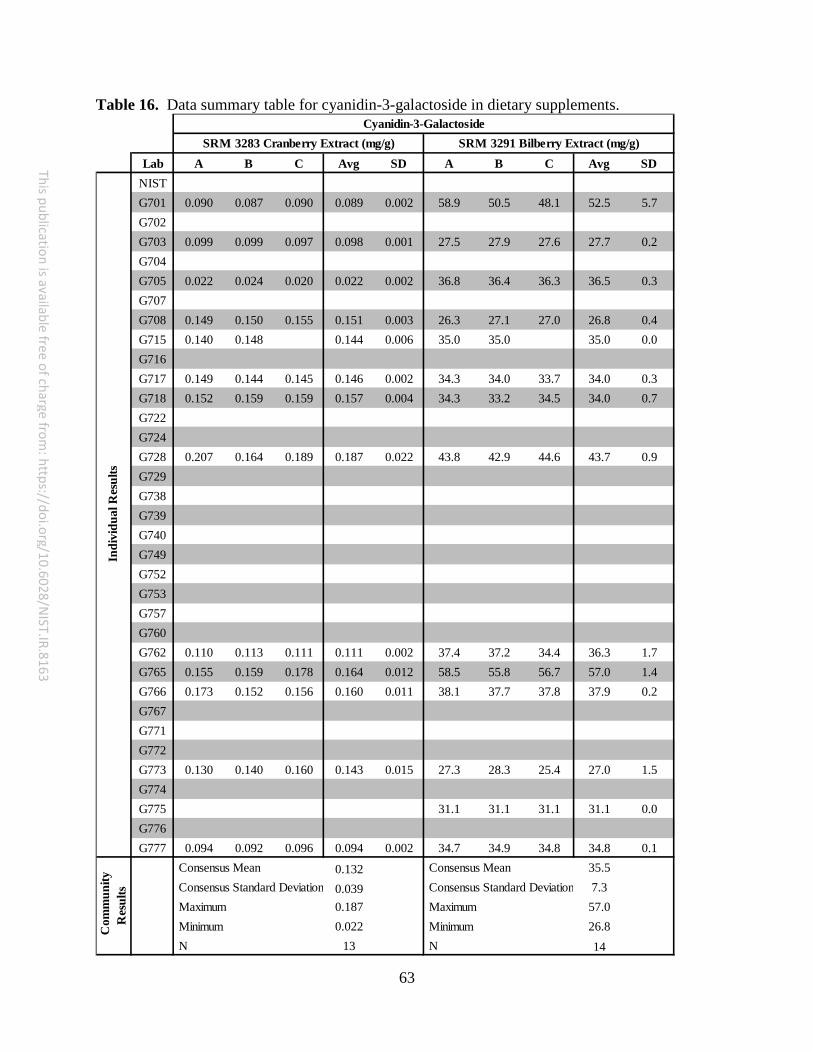
63
This publication is available free of charge from: https://doi.org/10.6028/N
IST.IR.8163
Table 16. Data summary table for cyanidin-3-galactoside in dietary supplements.
Lab A B C Avg SD A B C Avg SDNISTG701 0.090 0.087 0.090 0.089 0.002 58.9 50.5 48.1 52.5 5.7G702G703 0.099 0.099 0.097 0.098 0.001 27.5 27.9 27.6 27.7 0.2G704G705 0.022 0.024 0.020 0.022 0.002 36.8 36.4 36.3 36.5 0.3G707G708 0.149 0.150 0.155 0.151 0.003 26.3 27.1 27.0 26.8 0.4G715 0.140 0.148 0.144 0.006 35.0 35.0 35.0 0.0G716G717 0.149 0.144 0.145 0.146 0.002 34.3 34.0 33.7 34.0 0.3G718 0.152 0.159 0.159 0.157 0.004 34.3 33.2 34.5 34.0 0.7G722G724G728 0.207 0.164 0.189 0.187 0.022 43.8 42.9 44.6 43.7 0.9G729G738G739G740G749G752G753G757G760G762 0.110 0.113 0.111 0.111 0.002 37.4 37.2 34.4 36.3 1.7G765 0.155 0.159 0.178 0.164 0.012 58.5 55.8 56.7 57.0 1.4G766 0.173 0.152 0.156 0.160 0.011 38.1 37.7 37.8 37.9 0.2G767G771G772G773 0.130 0.140 0.160 0.143 0.015 27.3 28.3 25.4 27.0 1.5G774G775 31.1 31.1 31.1 31.1 0.0G776G777 0.094 0.092 0.096 0.094 0.002 34.7 34.9 34.8 34.8 0.1
Consensus Mean 0.132 Consensus Mean 35.5 Consensus Standard Deviation 0.039 Consensus Standard Deviation 7.3 Maximum 0.187 Maximum 57.0 Minimum 0.022 Minimum 26.8 N 13 N 14
Com
mun
ity
Res
ults
Indi
vidu
al R
esul
ts
SRM 3291 Bilberry Extract (mg/g)SRM 3283 Cranberry Extract (mg/g)Cyanidin-3-Galactoside
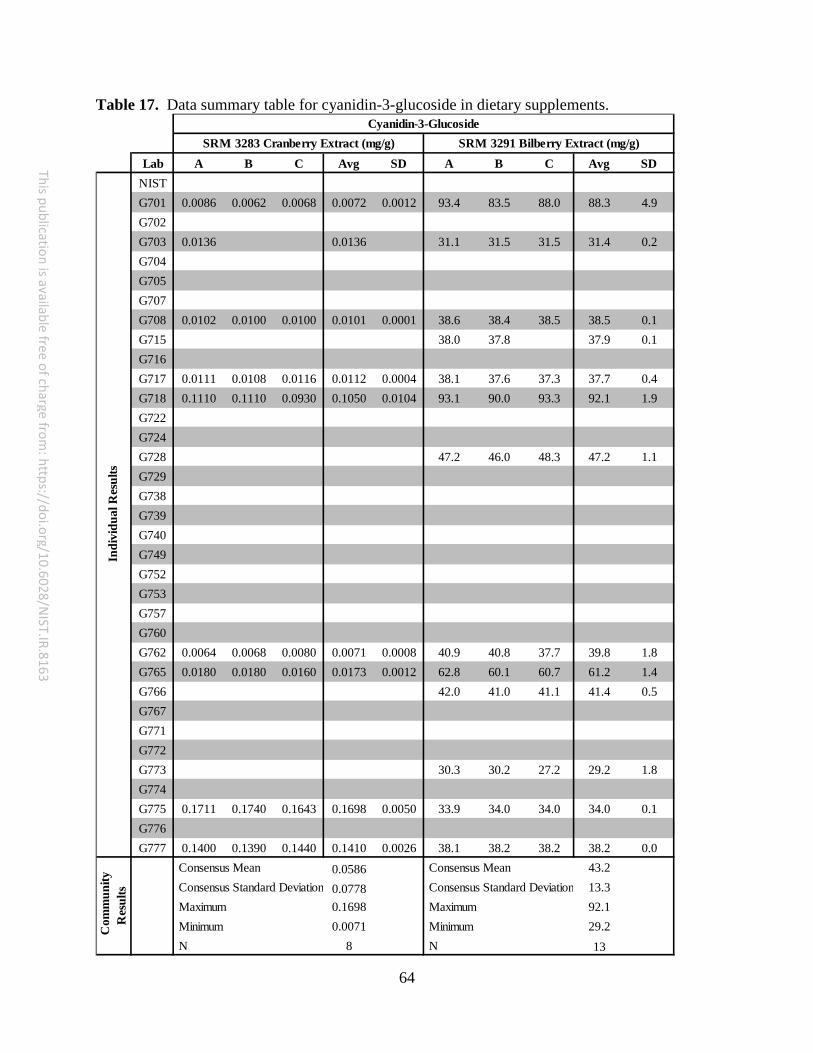
64
This publication is available free of charge from: https://doi.org/10.6028/N
IST.IR.8163
Table 17. Data summary table for cyanidin-3-glucoside in dietary supplements.
Lab A B C Avg SD A B C Avg SDNISTG701 0.0086 0.0062 0.0068 0.0072 0.0012 93.4 83.5 88.0 88.3 4.9G702G703 0.0136 0.0136 31.1 31.5 31.5 31.4 0.2G704G705G707G708 0.0102 0.0100 0.0100 0.0101 0.0001 38.6 38.4 38.5 38.5 0.1G715 38.0 37.8 37.9 0.1G716G717 0.0111 0.0108 0.0116 0.0112 0.0004 38.1 37.6 37.3 37.7 0.4G718 0.1110 0.1110 0.0930 0.1050 0.0104 93.1 90.0 93.3 92.1 1.9G722G724G728 47.2 46.0 48.3 47.2 1.1G729G738G739G740G749G752G753G757G760G762 0.0064 0.0068 0.0080 0.0071 0.0008 40.9 40.8 37.7 39.8 1.8G765 0.0180 0.0180 0.0160 0.0173 0.0012 62.8 60.1 60.7 61.2 1.4G766 42.0 41.0 41.1 41.4 0.5G767G771G772G773 30.3 30.2 27.2 29.2 1.8G774G775 0.1711 0.1740 0.1643 0.1698 0.0050 33.9 34.0 34.0 34.0 0.1G776G777 0.1400 0.1390 0.1440 0.1410 0.0026 38.1 38.2 38.2 38.2 0.0
Consensus Mean 0.0586 Consensus Mean 43.2 Consensus Standard Deviation 0.0778 Consensus Standard Deviation 13.3 Maximum 0.1698 Maximum 92.1 Minimum 0.0071 Minimum 29.2 N 8 N 13
SRM 3283 Cranberry Extract (mg/g) SRM 3291 Bilberry Extract (mg/g)
Indi
vidu
al R
esul
tsC
omm
unity
R
esul
tsCyanidin-3-Glucoside
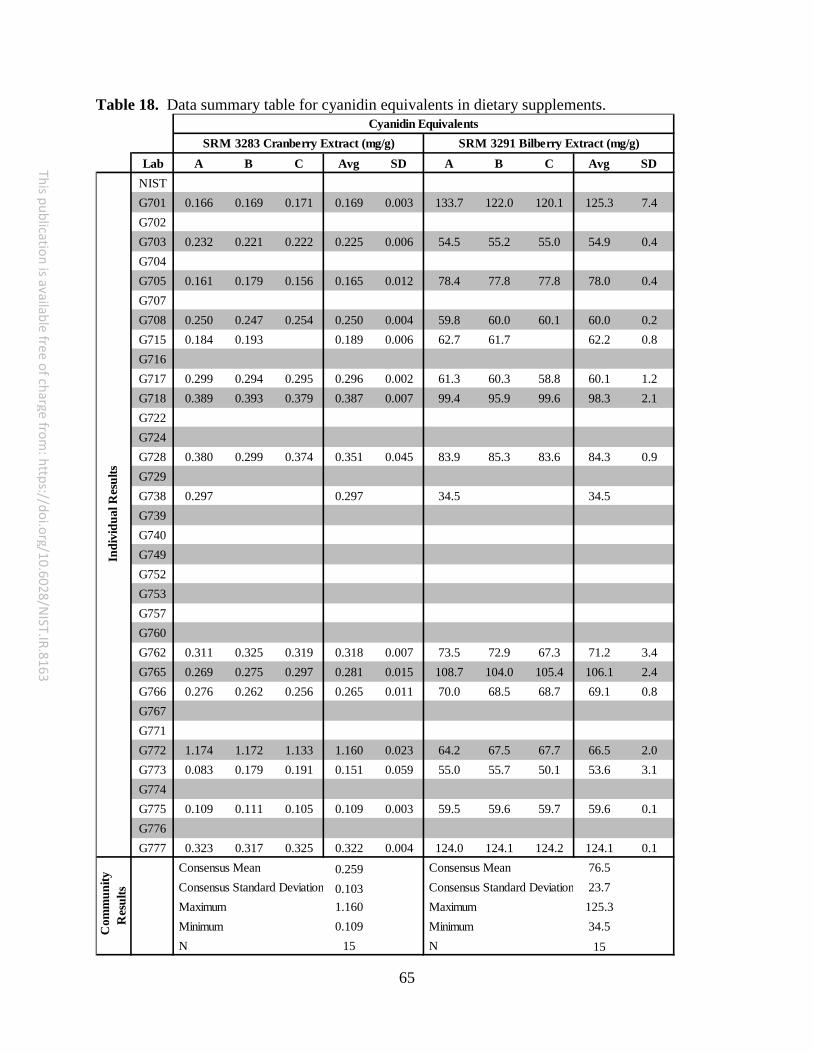
65
This publication is available free of charge from: https://doi.org/10.6028/N
IST.IR.8163
Table 18. Data summary table for cyanidin equivalents in dietary supplements.
Lab A B C Avg SD A B C Avg SDNISTG701 0.166 0.169 0.171 0.169 0.003 133.7 122.0 120.1 125.3 7.4G702G703 0.232 0.221 0.222 0.225 0.006 54.5 55.2 55.0 54.9 0.4G704G705 0.161 0.179 0.156 0.165 0.012 78.4 77.8 77.8 78.0 0.4G707G708 0.250 0.247 0.254 0.250 0.004 59.8 60.0 60.1 60.0 0.2G715 0.184 0.193 0.189 0.006 62.7 61.7 62.2 0.8G716G717 0.299 0.294 0.295 0.296 0.002 61.3 60.3 58.8 60.1 1.2G718 0.389 0.393 0.379 0.387 0.007 99.4 95.9 99.6 98.3 2.1G722G724G728 0.380 0.299 0.374 0.351 0.045 83.9 85.3 83.6 84.3 0.9G729G738 0.297 0.297 34.5 34.5G739G740G749G752G753G757G760G762 0.311 0.325 0.319 0.318 0.007 73.5 72.9 67.3 71.2 3.4G765 0.269 0.275 0.297 0.281 0.015 108.7 104.0 105.4 106.1 2.4G766 0.276 0.262 0.256 0.265 0.011 70.0 68.5 68.7 69.1 0.8G767G771G772 1.174 1.172 1.133 1.160 0.023 64.2 67.5 67.7 66.5 2.0G773 0.083 0.179 0.191 0.151 0.059 55.0 55.7 50.1 53.6 3.1G774G775 0.109 0.111 0.105 0.109 0.003 59.5 59.6 59.7 59.6 0.1G776G777 0.323 0.317 0.325 0.322 0.004 124.0 124.1 124.2 124.1 0.1
Consensus Mean 0.259 Consensus Mean 76.5 Consensus Standard Deviation 0.103 Consensus Standard Deviation 23.7 Maximum 1.160 Maximum 125.3 Minimum 0.109 Minimum 34.5 N 15 N 15
Cyanidin EquivalentsSRM 3283 Cranberry Extract (mg/g) SRM 3291 Bilberry Extract (mg/g)
Indi
vidu
al R
esul
tsC
omm
unity
R
esul
ts
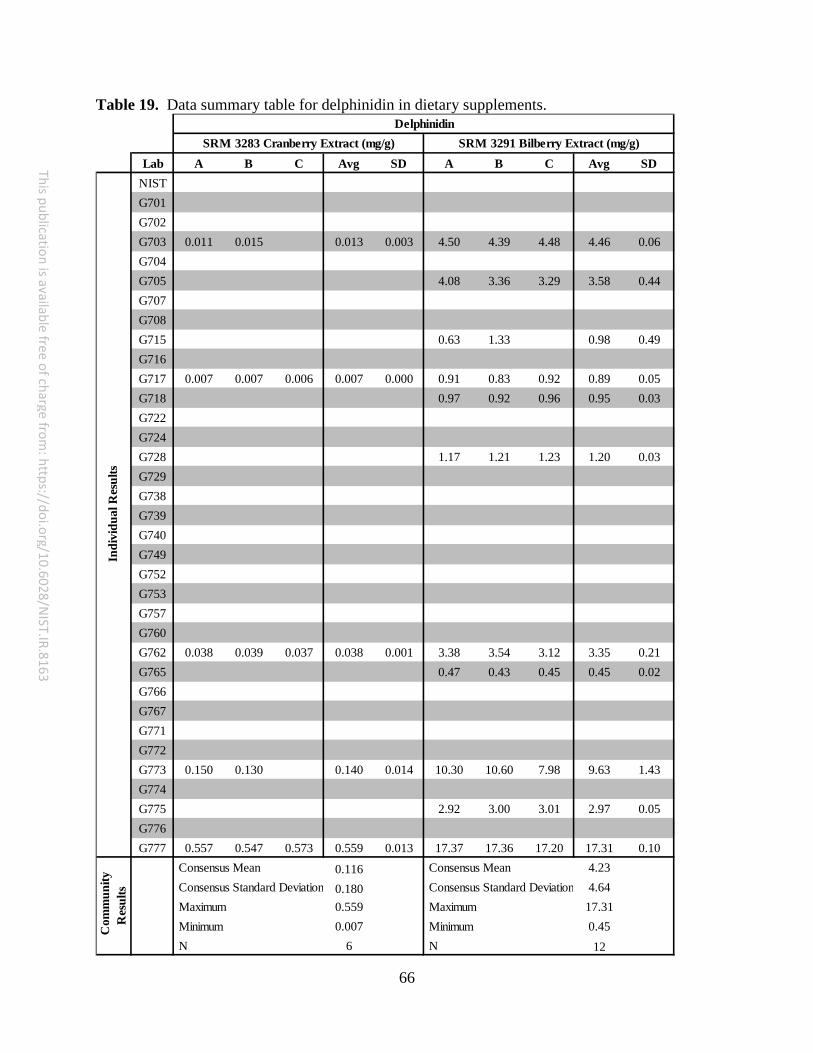
66
This publication is available free of charge from: https://doi.org/10.6028/N
IST.IR.8163
Table 19. Data summary table for delphinidin in dietary supplements.
Lab A B C Avg SD A B C Avg SDNISTG701G702G703 0.011 0.015 0.013 0.003 4.50 4.39 4.48 4.46 0.06G704G705 4.08 3.36 3.29 3.58 0.44G707G708G715 0.63 1.33 0.98 0.49G716G717 0.007 0.007 0.006 0.007 0.000 0.91 0.83 0.92 0.89 0.05G718 0.97 0.92 0.96 0.95 0.03G722G724G728 1.17 1.21 1.23 1.20 0.03G729G738G739G740G749G752G753G757G760G762 0.038 0.039 0.037 0.038 0.001 3.38 3.54 3.12 3.35 0.21G765 0.47 0.43 0.45 0.45 0.02G766G767G771G772G773 0.150 0.130 0.140 0.014 10.30 10.60 7.98 9.63 1.43G774G775 2.92 3.00 3.01 2.97 0.05G776G777 0.557 0.547 0.573 0.559 0.013 17.37 17.36 17.20 17.31 0.10
Consensus Mean 0.116 Consensus Mean 4.23 Consensus Standard Deviation 0.180 Consensus Standard Deviation 4.64 Maximum 0.559 Maximum 17.31 Minimum 0.007 Minimum 0.45 N 6 N 12
DelphinidinSRM 3283 Cranberry Extract (mg/g) SRM 3291 Bilberry Extract (mg/g)
Indi
vidu
al R
esul
tsC
omm
unity
R
esul
ts

67
This publication is available free of charge from: https://doi.org/10.6028/N
IST.IR.8163
Table 20. Data summary table for delphinidin-3-arabinoside in dietary supplements.
Lab A B C Avg SD A B C Avg SDNISTG701 0.166 0.169 0.171 0.169 0.003 133.7 122.0 120.1 125.3 7.4G702G703 0.232 0.221 0.222 0.225 0.006 54.5 55.2 55.0 54.9 0.4G704G705 0.161 0.179 0.156 0.165 0.012 78.4 77.8 77.8 78.0 0.4G707G708 0.250 0.247 0.254 0.250 0.004 59.8 60.0 60.1 60.0 0.2G715 0.184 0.193 0.189 0.006 62.7 61.7 62.2 0.8G716G717 0.299 0.294 0.295 0.296 0.002 61.3 60.3 58.8 60.1 1.2G718 0.389 0.393 0.379 0.387 0.007 99.4 95.9 99.6 98.3 2.1G722G724G728 0.380 0.299 0.374 0.351 0.045 83.9 85.3 83.6 84.3 0.9G729G738 0.297 0.297 34.5 34.5G739G740G749G752G753G757G760G762 0.311 0.325 0.319 0.318 0.007 73.5 72.9 67.3 71.2 3.4G765 0.269 0.275 0.297 0.281 0.015 108.7 104.0 105.4 106.1 2.4G766 0.276 0.262 0.256 0.265 0.011 70.0 68.5 68.7 69.1 0.8G767G771G772 1.174 1.172 1.133 1.160 0.023 64.2 67.5 67.7 66.5 2.0G773 0.083 0.179 0.191 0.151 0.059 55.0 55.7 50.1 53.6 3.1G774G775 0.109 0.111 0.105 0.109 0.003 59.5 59.6 59.7 59.6 0.1G776G777 0.323 0.317 0.325 0.322 0.004 124.0 124.1 124.2 124.1 0.1
Consensus Mean 0.259 Consensus Mean 76.5 Consensus Standard Deviation 0.103 Consensus Standard Deviation 23.7 Maximum 1.160 Maximum 125.3 Minimum 0.109 Minimum 34.5 N 15 N 15
Cyanidin EquivalentsSRM 3283 Cranberry Extract (mg/g) SRM 3291 Bilberry Extract (mg/g)
Indi
vidu
al R
esul
tsC
omm
unity
R
esul
ts

68
This publication is available free of charge from: https://doi.org/10.6028/N
IST.IR.8163
Table 21. Data summary table for delphinidin-3-galactoside in dietary supplements.
Lab A B C Avg SD A B C Avg SDNISTG701G702G703 35.2 35.7 35.6 35.5 0.3G704G705 47.5 47.0 47.2 47.2 0.3G707G708 43.6 43.6 43.7 43.6 0.1G715 42.2 42.5 42.4 0.2G716G717 44.4 43.9 43.6 44.0 0.4G718 42.7 41.4 43.0 42.3 0.9G722G724G728 48.7 47.7 48.3 48.2 0.5G729G738G739G740G749G752G753G757G760G762 0.0020 0.0069 0.0030 0.0040 0.0026 45.1 45.3 41.6 44.0 2.1G765 61.1 58.4 59.2 59.6 1.4G766 31.0 30.9 31.0 30.9 0.1G767G771G772G773 34.7 34.8 31.4 33.6 1.9G774G775 0.0488 0.0495 0.0464 0.0482 0.0016 38.0 38.3 38.3 38.2 0.2G776G777 0.0040 0.0040 0.0040 0.0040 0.0000 42.1 42.1 42.1 42.1 0.0
Consensus Mean 0.0187 Consensus Mean 41.9 Consensus Standard Deviation 0.0290 Consensus Standard Deviation 6.4 Maximum 0.0482 Maximum 59.6 Minimum 0.0040 Minimum 30.9 N 3 N 13
Delphinidin-3-GalactosideSRM 3283 Cranberry Extract (mg/g) SRM 3291 Bilberry Extract (mg/g)
Indi
vidu
al R
esul
tsC
omm
unity
R
esul
ts
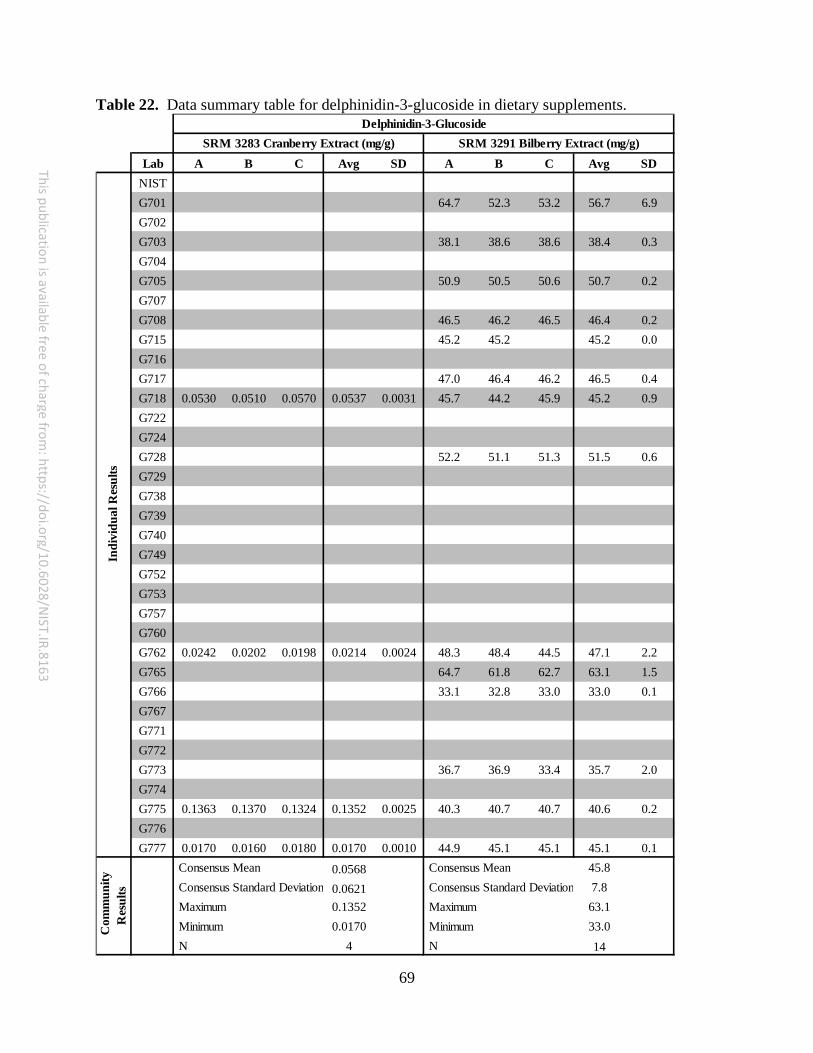
69
This publication is available free of charge from: https://doi.org/10.6028/N
IST.IR.8163
Table 22. Data summary table for delphinidin-3-glucoside in dietary supplements.
Lab A B C Avg SD A B C Avg SDNISTG701 64.7 52.3 53.2 56.7 6.9G702G703 38.1 38.6 38.6 38.4 0.3G704G705 50.9 50.5 50.6 50.7 0.2G707G708 46.5 46.2 46.5 46.4 0.2G715 45.2 45.2 45.2 0.0G716G717 47.0 46.4 46.2 46.5 0.4G718 0.0530 0.0510 0.0570 0.0537 0.0031 45.7 44.2 45.9 45.2 0.9G722G724G728 52.2 51.1 51.3 51.5 0.6G729G738G739G740G749G752G753G757G760G762 0.0242 0.0202 0.0198 0.0214 0.0024 48.3 48.4 44.5 47.1 2.2G765 64.7 61.8 62.7 63.1 1.5G766 33.1 32.8 33.0 33.0 0.1G767G771G772G773 36.7 36.9 33.4 35.7 2.0G774G775 0.1363 0.1370 0.1324 0.1352 0.0025 40.3 40.7 40.7 40.6 0.2G776G777 0.0170 0.0160 0.0180 0.0170 0.0010 44.9 45.1 45.1 45.1 0.1
Consensus Mean 0.0568 Consensus Mean 45.8 Consensus Standard Deviation 0.0621 Consensus Standard Deviation 7.8 Maximum 0.1352 Maximum 63.1 Minimum 0.0170 Minimum 33.0 N 4 N 14
SRM 3283 Cranberry Extract (mg/g) SRM 3291 Bilberry Extract (mg/g)
Indi
vidu
al R
esul
tsC
omm
unity
R
esul
tsDelphinidin-3-Glucoside

70
This publication is available free of charge from: https://doi.org/10.6028/N
IST.IR.8163
Table 23. Data summary table for delphinidin equivalents in dietary supplements.
Lab A B C Avg SD A B C Avg SDNISTG701 42.2 34.0 34.7 37.0 4.5G702G703 0.011 0.015 0.013 0.003 72.8 73.6 73.8 73.4 0.5G704G705 0.076 0.085 0.074 0.078 0.006 96.8 95.2 95.5 95.9 0.8G707G708 92.3 91.3 91.9 91.8 0.5G715 83.5 84.5 84.0 0.7G716G717 0.007 0.007 0.006 0.007 0.000 87.3 86.0 85.7 86.3 0.8G718 0.035 0.033 0.037 0.035 0.002 83.8 81.1 84.2 83.0 1.7G722G724G728 96.9 94.6 95.3 95.6 1.2G729G738 0.087 0.087 41.7 41.7G739G740G749G752G753G757G760G762 0.055 0.056 0.052 0.054 0.002 92.2 92.4 84.9 89.8 4.3G765 120.4 114.9 116.6 117.3 2.8G766 60.0 59.5 59.8 59.7 0.2G767G771G772 0.384 0.383 0.369 0.379 0.008 83.3 86.8 86.9 85.7 2.0G773 0.150 0.130 0.140 0.014 77.5 77.7 68.5 74.6 5.2G774G775 0.121 0.122 0.117 0.120 0.003 76.8 77.5 77.6 77.3 0.4G776G777 0.580 0.566 0.594 0.580 0.014 100.4 100.6 100.3 100.4 0.1
Consensus Mean 0.134 Consensus Mean 84.7 Consensus Standard Deviation 0.166 Consensus Standard Deviation 14.4 Maximum 0.580 Maximum 117.3 Minimum 0.007 Minimum 37.0 N 9 N 15
Delphinidin EquivalentsSRM 3283 Cranberry Extract (mg/g) SRM 3291 Bilberry Extract (mg/g)
Indi
vidu
al R
esul
tsC
omm
unity
R
esul
ts
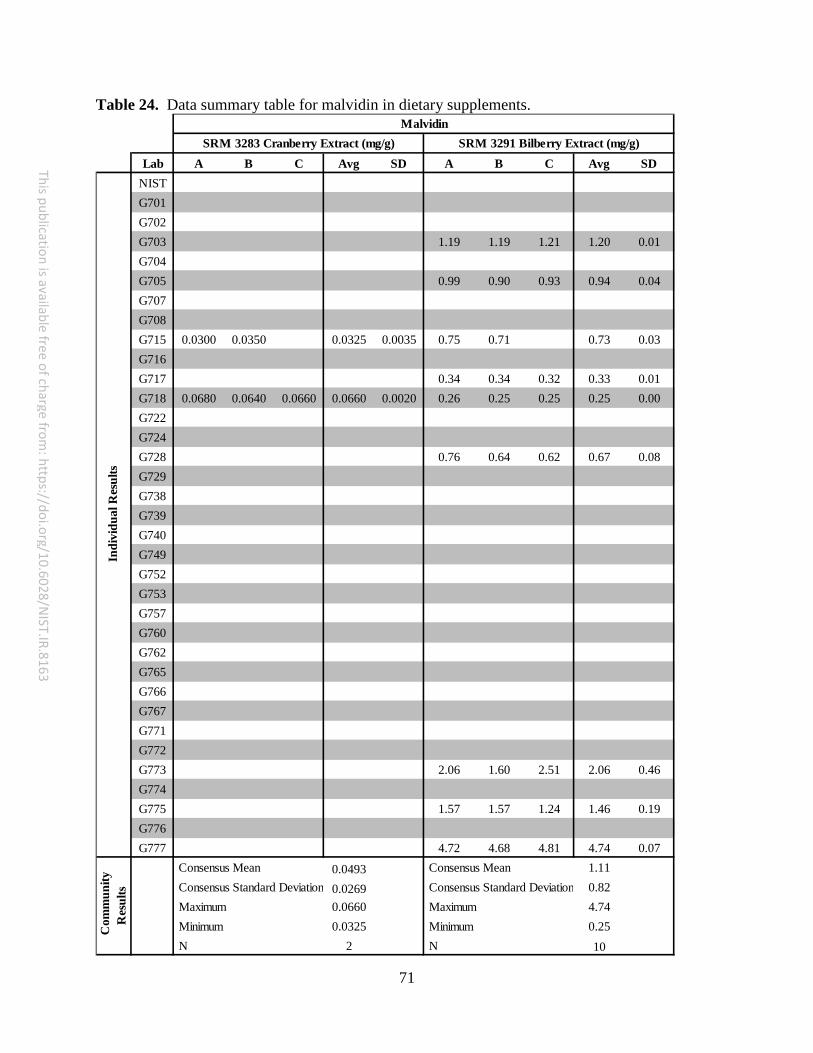
71
This publication is available free of charge from: https://doi.org/10.6028/N
IST.IR.8163
Table 24. Data summary table for malvidin in dietary supplements.
Lab A B C Avg SD A B C Avg SDNISTG701G702G703 1.19 1.19 1.21 1.20 0.01G704G705 0.99 0.90 0.93 0.94 0.04G707G708G715 0.0300 0.0350 0.0325 0.0035 0.75 0.71 0.73 0.03G716G717 0.34 0.34 0.32 0.33 0.01G718 0.0680 0.0640 0.0660 0.0660 0.0020 0.26 0.25 0.25 0.25 0.00G722G724G728 0.76 0.64 0.62 0.67 0.08G729G738G739G740G749G752G753G757G760G762G765G766G767G771G772G773 2.06 1.60 2.51 2.06 0.46G774G775 1.57 1.57 1.24 1.46 0.19G776G777 4.72 4.68 4.81 4.74 0.07
Consensus Mean 0.0493 Consensus Mean 1.11 Consensus Standard Deviation 0.0269 Consensus Standard Deviation 0.82 Maximum 0.0660 Maximum 4.74 Minimum 0.0325 Minimum 0.25 N 2 N 10
SRM 3283 Cranberry Extract (mg/g)Malvidin
SRM 3291 Bilberry Extract (mg/g)
Indi
vidu
al R
esul
tsC
omm
unity
R
esul
ts

72
This publication is available free of charge from: https://doi.org/10.6028/N
IST.IR.8163
Table 25. Data summary table for malvidin-3-arabinoside in dietary supplements.
Lab A B C Avg SD A B C Avg SDNISTG701G702G703 6.89 7.12 7.08 7.03 0.12G704G705 9.25 9.14 9.19 9.19 0.06G707G708 0.0959 0.0966 0.1070 0.0998 0.0062 11.20 11.00 11.10 11.10 0.10G715 8.87 9.00 8.94 0.09G716G717 8.43 8.23 8.40 8.35 0.11G718 9.21 8.48 8.71 8.80 0.37G722G724G728 12.34 11.36 12.04 11.91 0.50G729G738G739G740G749G752G753G757G760G762 10.50 10.20 9.47 10.06 0.53G765 11.52 11.11 11.79 11.47 0.34G766 5.03 4.84 4.91 4.93 0.10G767G771G772G773 1.24 1.04 0.96 1.08 0.14G774G775 7.87 7.85 7.82 7.85 0.03G776G777 0.0030 0.0030 0.0030 0.0030 0.0000 1.50 1.49 1.52 1.50 0.01
Consensus Mean 0.0514 Consensus Mean 8.19 Consensus Standard Deviation 0.0776 Consensus Standard Deviation 3.22 Maximum 0.0998 Maximum 11.91 Minimum 0.0030 Minimum 1.08 N 2 N 13
Com
mun
ity
Res
ults
Malvidin-3-ArabinosideSRM 3283 Cranberry Extract (mg/g) SRM 3291 Bilberry Extract (mg/g)
Indi
vidu
al R
esul
ts

73
This publication is available free of charge from: https://doi.org/10.6028/N
IST.IR.8163
Table 26. Data summary table for malvidin-3-galactoside in dietary supplements.
Lab A B C Avg SD A B C Avg SDNISTG701 0.1400 0.1400 0.1600 0.1467 0.0115 26.1 23.1 21.0 23.4 2.5G702G703 0.0125 0.0125 12.1 12.3 12.3 12.2 0.1G704G705 16.3 16.1 16.2 16.2 0.1G707G708G715 12.5 12.6 12.5 0.1G716G717 38.1 37.1 38.6 37.9 0.8G718 0.0520 0.0520 14.9 14.2 14.7 14.6 0.3G722G724G728 19.2 18.1 19.4 18.9 0.7G729G738G739G740G749G752G753G757G760G762 0.0252 0.0270 0.0270 0.0264 0.0010 14.0 14.0 13.0 13.7 0.6G765 18.3 17.4 17.8 17.8 0.4G766 6.7 6.6 6.8 6.7 0.1G767G771G772G773 27.9 27.9 25.3 27.0 1.5G774G775 33.3 33.3 33.2 33.3 0.1G776G777 0.0060 0.0050 0.0050 0.0053 0.0006 13.3 13.3 13.3 13.3 0.0
Consensus Mean 0.0595 Consensus Mean 18.4 Consensus Standard Deviation 0.0865 Consensus Standard Deviation 8.8 Maximum 0.1467 Maximum 37.9 Minimum 0.0053 Minimum 6.7 N 3 N 13
Malvidin-3-GalactosideSRM 3283 Cranberry Extract (mg/g) SRM 3291 Bilberry Extract (mg/g)
Indi
vidu
al R
esul
tsC
omm
unity
R
esul
ts

74
This publication is available free of charge from: https://doi.org/10.6028/N
IST.IR.8163
Table 27. Data summary table for malvidin-3-glucoside in dietary supplements.
Lab A B C Avg SD A B C Avg SDNISTG701G702G703 30.2 30.6 30.6 30.5 0.2G704G705G707G708 0.1720 0.1780 0.1800 0.1767 0.0042 37.3 37.0 37.2 37.2 0.2G715 0.0270 0.0320 0.0295 0.0035 34.7 34.8 34.8 0.0G716G717 0.0128 0.0110 0.0117 0.0118 0.0009 14.5 14.3 14.2 14.3 0.2G718 36.5 35.4 36.6 36.2 0.7G722G724G728 43.8 42.5 43.3 43.2 0.6G729G738G739G740G749G752G753G757G760G762 35.8 35.6 32.9 34.8 1.6G765 45.9 43.9 44.4 44.7 1.0G766 0.1323 0.1340 0.1370 0.1344 0.0024 21.6 21.2 21.2 21.3 0.2G767G771G772G773 10.2 11.4 9.7 10.4 0.9G774G775 13.4 13.5 13.5 13.4 0.0G776G777 35.7 35.8 35.8 35.8 0.1
Consensus Mean 0.0881 Consensus Mean 29.7 Consensus Standard Deviation 0.0908 Consensus Standard Deviation 13.4 Maximum 0.1767 Maximum 44.7 Minimum 0.0118 Minimum 10.4 N 4 N 12
Com
mun
ity
Res
ults
Malvidin-3-GlucosideSRM 3283 Cranberry Extract (mg/g) SRM 3291 Bilberry Extract (mg/g)
Indi
vidu
al R
esul
ts
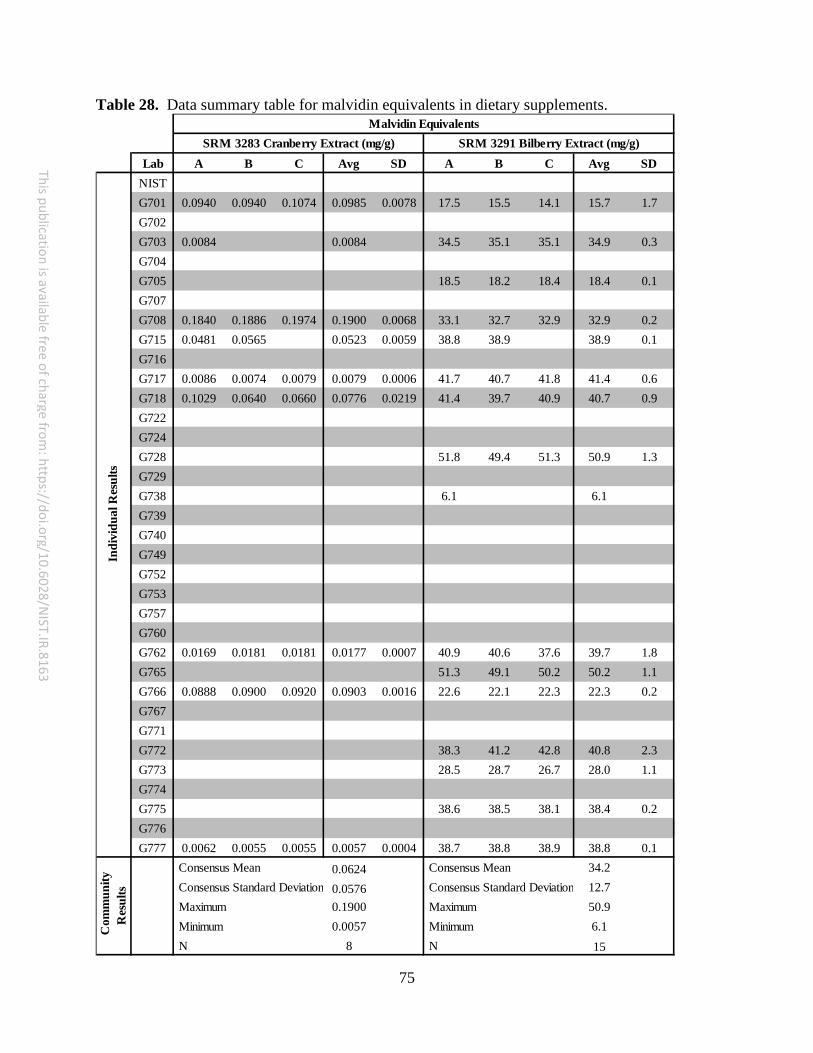
75
This publication is available free of charge from: https://doi.org/10.6028/N
IST.IR.8163
Table 28. Data summary table for malvidin equivalents in dietary supplements.
Lab A B C Avg SD A B C Avg SDNISTG701 0.0940 0.0940 0.1074 0.0985 0.0078 17.5 15.5 14.1 15.7 1.7G702G703 0.0084 0.0084 34.5 35.1 35.1 34.9 0.3G704G705 18.5 18.2 18.4 18.4 0.1G707G708 0.1840 0.1886 0.1974 0.1900 0.0068 33.1 32.7 32.9 32.9 0.2G715 0.0481 0.0565 0.0523 0.0059 38.8 38.9 38.9 0.1G716G717 0.0086 0.0074 0.0079 0.0079 0.0006 41.7 40.7 41.8 41.4 0.6G718 0.1029 0.0640 0.0660 0.0776 0.0219 41.4 39.7 40.9 40.7 0.9G722G724G728 51.8 49.4 51.3 50.9 1.3G729G738 6.1 6.1G739G740G749G752G753G757G760G762 0.0169 0.0181 0.0181 0.0177 0.0007 40.9 40.6 37.6 39.7 1.8G765 51.3 49.1 50.2 50.2 1.1G766 0.0888 0.0900 0.0920 0.0903 0.0016 22.6 22.1 22.3 22.3 0.2G767G771G772 38.3 41.2 42.8 40.8 2.3G773 28.5 28.7 26.7 28.0 1.1G774G775 38.6 38.5 38.1 38.4 0.2G776G777 0.0062 0.0055 0.0055 0.0057 0.0004 38.7 38.8 38.9 38.8 0.1
Consensus Mean 0.0624 Consensus Mean 34.2 Consensus Standard Deviation 0.0576 Consensus Standard Deviation 12.7 Maximum 0.1900 Maximum 50.9 Minimum 0.0057 Minimum 6.1 N 8 N 15
Malvidin EquivalentsSRM 3283 Cranberry Extract (mg/g) SRM 3291 Bilberry Extract (mg/g)
Indi
vidu
al R
esul
tsC
omm
unity
R
esul
ts
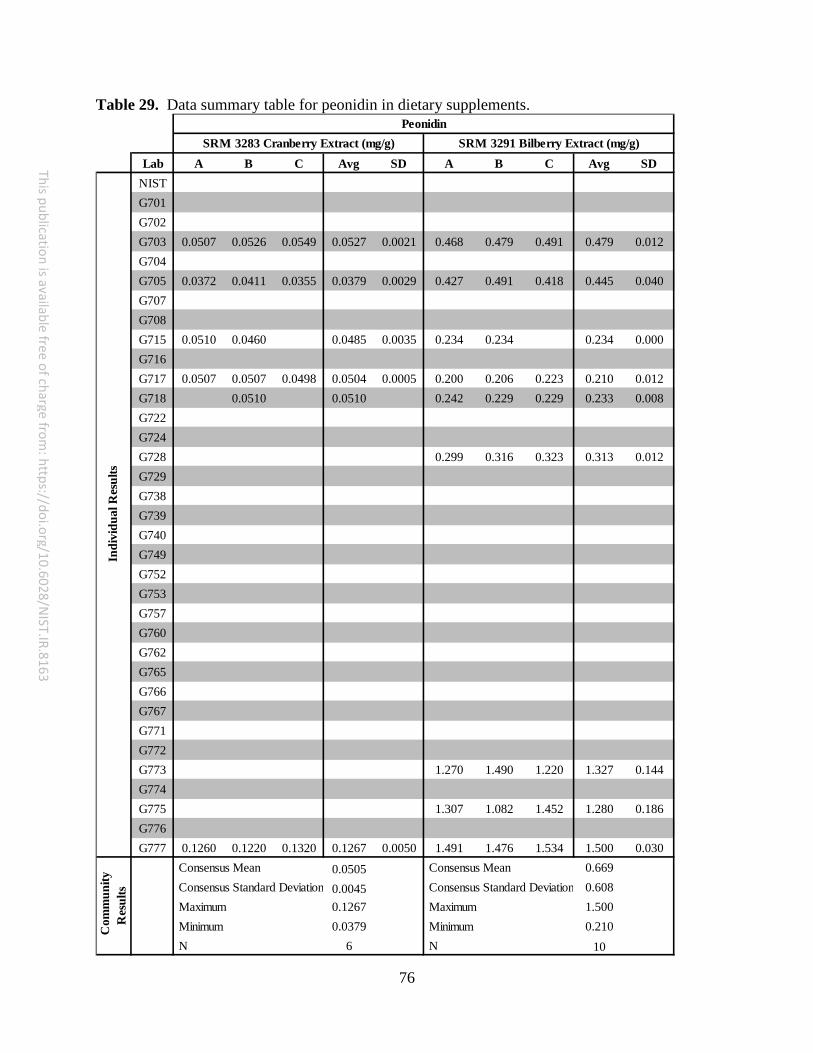
76
This publication is available free of charge from: https://doi.org/10.6028/N
IST.IR.8163
Table 29. Data summary table for peonidin in dietary supplements.
Lab A B C Avg SD A B C Avg SDNISTG701G702G703 0.0507 0.0526 0.0549 0.0527 0.0021 0.468 0.479 0.491 0.479 0.012G704G705 0.0372 0.0411 0.0355 0.0379 0.0029 0.427 0.491 0.418 0.445 0.040G707G708G715 0.0510 0.0460 0.0485 0.0035 0.234 0.234 0.234 0.000G716G717 0.0507 0.0507 0.0498 0.0504 0.0005 0.200 0.206 0.223 0.210 0.012G718 0.0510 0.0510 0.242 0.229 0.229 0.233 0.008G722G724G728 0.299 0.316 0.323 0.313 0.012G729G738G739G740G749G752G753G757G760G762G765G766G767G771G772G773 1.270 1.490 1.220 1.327 0.144G774G775 1.307 1.082 1.452 1.280 0.186G776G777 0.1260 0.1220 0.1320 0.1267 0.0050 1.491 1.476 1.534 1.500 0.030
Consensus Mean 0.0505 Consensus Mean 0.669 Consensus Standard Deviation 0.0045 Consensus Standard Deviation 0.608 Maximum 0.1267 Maximum 1.500 Minimum 0.0379 Minimum 0.210 N 6 N 10
Com
mun
ity
Res
ults
PeonidinSRM 3283 Cranberry Extract (mg/g) SRM 3291 Bilberry Extract (mg/g)
Indi
vidu
al R
esul
ts
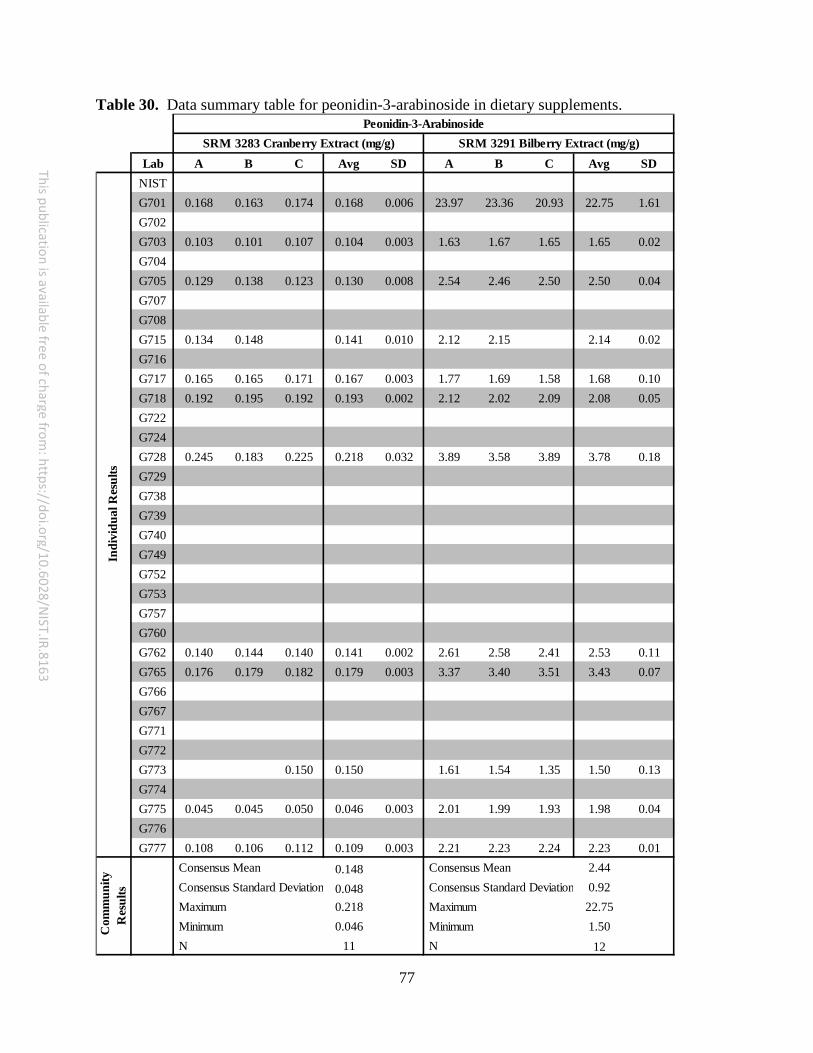
77
This publication is available free of charge from: https://doi.org/10.6028/N
IST.IR.8163
Table 30. Data summary table for peonidin-3-arabinoside in dietary supplements.
Lab A B C Avg SD A B C Avg SDNISTG701 0.168 0.163 0.174 0.168 0.006 23.97 23.36 20.93 22.75 1.61G702G703 0.103 0.101 0.107 0.104 0.003 1.63 1.67 1.65 1.65 0.02G704G705 0.129 0.138 0.123 0.130 0.008 2.54 2.46 2.50 2.50 0.04G707G708G715 0.134 0.148 0.141 0.010 2.12 2.15 2.14 0.02G716G717 0.165 0.165 0.171 0.167 0.003 1.77 1.69 1.58 1.68 0.10G718 0.192 0.195 0.192 0.193 0.002 2.12 2.02 2.09 2.08 0.05G722G724G728 0.245 0.183 0.225 0.218 0.032 3.89 3.58 3.89 3.78 0.18G729G738G739G740G749G752G753G757G760G762 0.140 0.144 0.140 0.141 0.002 2.61 2.58 2.41 2.53 0.11G765 0.176 0.179 0.182 0.179 0.003 3.37 3.40 3.51 3.43 0.07G766G767G771G772G773 0.150 0.150 1.61 1.54 1.35 1.50 0.13G774G775 0.045 0.045 0.050 0.046 0.003 2.01 1.99 1.93 1.98 0.04G776G777 0.108 0.106 0.112 0.109 0.003 2.21 2.23 2.24 2.23 0.01
Consensus Mean 0.148 Consensus Mean 2.44 Consensus Standard Deviation 0.048 Consensus Standard Deviation 0.92 Maximum 0.218 Maximum 22.75 Minimum 0.046 Minimum 1.50 N 11 N 12
Peonidin-3-ArabinosideSRM 3283 Cranberry Extract (mg/g) SRM 3291 Bilberry Extract (mg/g)
Indi
vidu
al R
esul
tsC
omm
unity
R
esul
ts
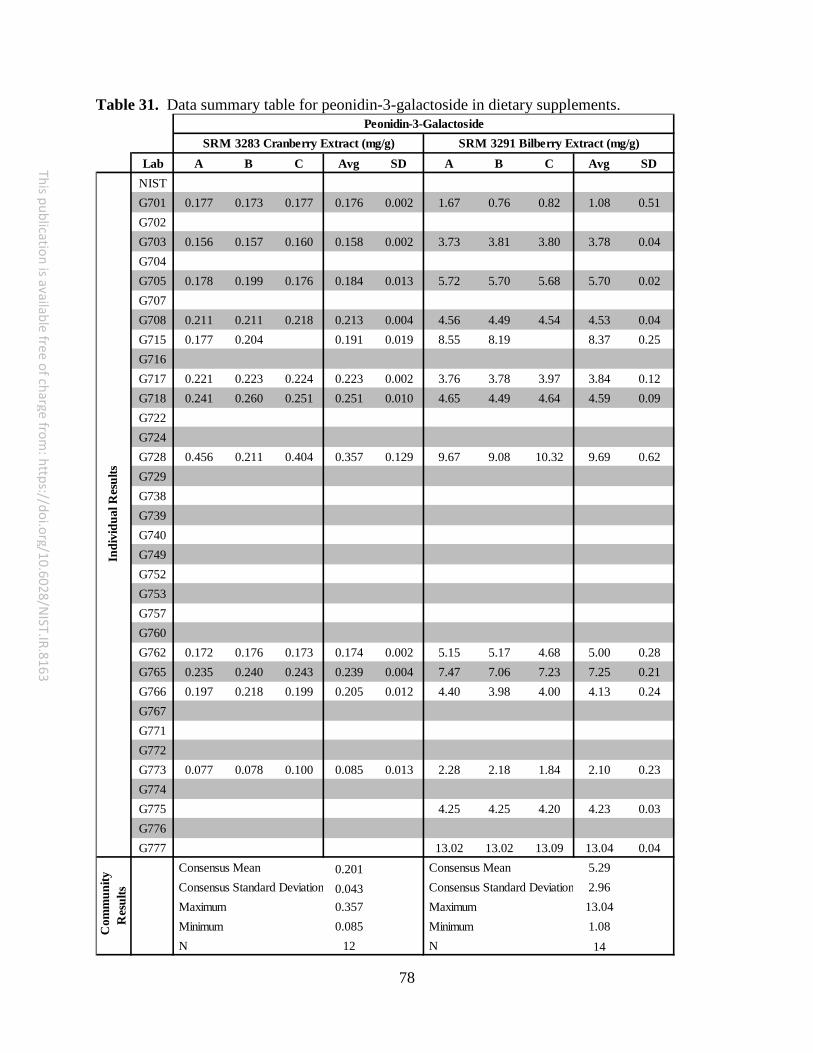
78
This publication is available free of charge from: https://doi.org/10.6028/N
IST.IR.8163
Table 31. Data summary table for peonidin-3-galactoside in dietary supplements.
Lab A B C Avg SD A B C Avg SDNISTG701 0.177 0.173 0.177 0.176 0.002 1.67 0.76 0.82 1.08 0.51G702G703 0.156 0.157 0.160 0.158 0.002 3.73 3.81 3.80 3.78 0.04G704G705 0.178 0.199 0.176 0.184 0.013 5.72 5.70 5.68 5.70 0.02G707G708 0.211 0.211 0.218 0.213 0.004 4.56 4.49 4.54 4.53 0.04G715 0.177 0.204 0.191 0.019 8.55 8.19 8.37 0.25G716G717 0.221 0.223 0.224 0.223 0.002 3.76 3.78 3.97 3.84 0.12G718 0.241 0.260 0.251 0.251 0.010 4.65 4.49 4.64 4.59 0.09G722G724G728 0.456 0.211 0.404 0.357 0.129 9.67 9.08 10.32 9.69 0.62G729G738G739G740G749G752G753G757G760G762 0.172 0.176 0.173 0.174 0.002 5.15 5.17 4.68 5.00 0.28G765 0.235 0.240 0.243 0.239 0.004 7.47 7.06 7.23 7.25 0.21G766 0.197 0.218 0.199 0.205 0.012 4.40 3.98 4.00 4.13 0.24G767G771G772G773 0.077 0.078 0.100 0.085 0.013 2.28 2.18 1.84 2.10 0.23G774G775 4.25 4.25 4.20 4.23 0.03G776G777 13.02 13.02 13.09 13.04 0.04
Consensus Mean 0.201 Consensus Mean 5.29 Consensus Standard Deviation 0.043 Consensus Standard Deviation 2.96 Maximum 0.357 Maximum 13.04 Minimum 0.085 Minimum 1.08 N 12 N 14
Indi
vidu
al R
esul
tsC
omm
unity
R
esul
ts
SRM 3283 Cranberry Extract (mg/g) SRM 3291 Bilberry Extract (mg/g)Peonidin-3-Galactoside
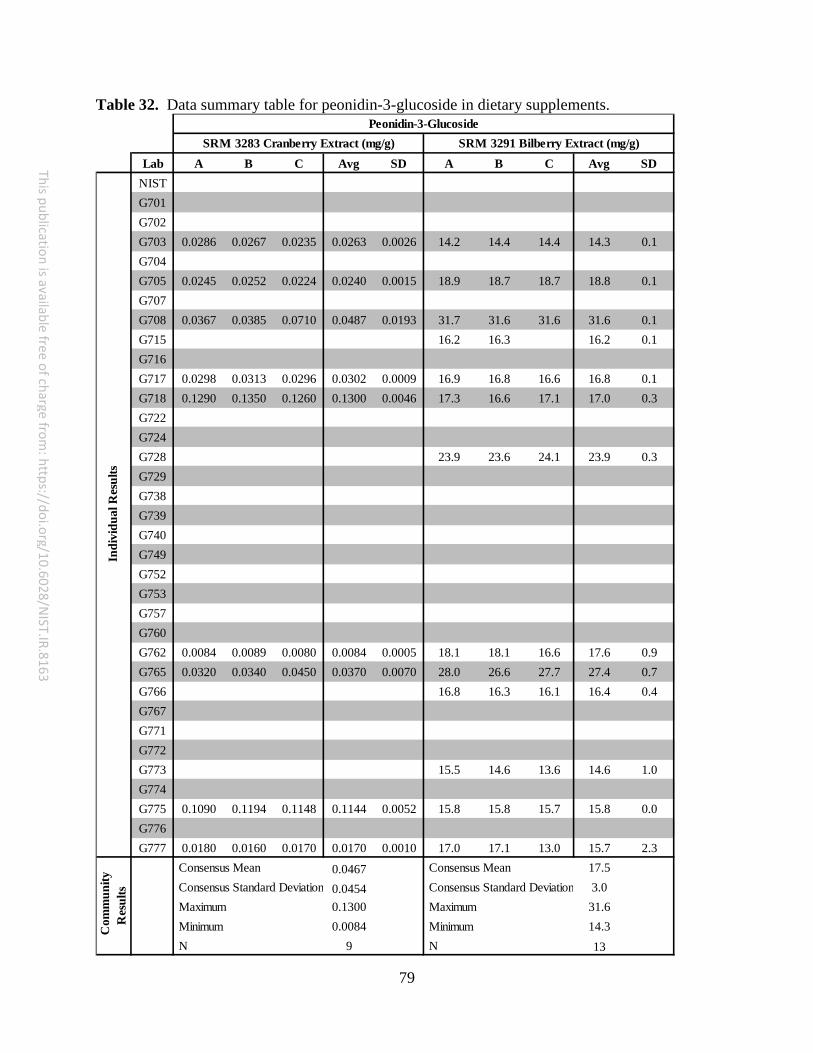
79
This publication is available free of charge from: https://doi.org/10.6028/N
IST.IR.8163
Table 32. Data summary table for peonidin-3-glucoside in dietary supplements.
Lab A B C Avg SD A B C Avg SDNISTG701G702G703 0.0286 0.0267 0.0235 0.0263 0.0026 14.2 14.4 14.4 14.3 0.1G704G705 0.0245 0.0252 0.0224 0.0240 0.0015 18.9 18.7 18.7 18.8 0.1G707G708 0.0367 0.0385 0.0710 0.0487 0.0193 31.7 31.6 31.6 31.6 0.1G715 16.2 16.3 16.2 0.1G716G717 0.0298 0.0313 0.0296 0.0302 0.0009 16.9 16.8 16.6 16.8 0.1G718 0.1290 0.1350 0.1260 0.1300 0.0046 17.3 16.6 17.1 17.0 0.3G722G724G728 23.9 23.6 24.1 23.9 0.3G729G738G739G740G749G752G753G757G760G762 0.0084 0.0089 0.0080 0.0084 0.0005 18.1 18.1 16.6 17.6 0.9G765 0.0320 0.0340 0.0450 0.0370 0.0070 28.0 26.6 27.7 27.4 0.7G766 16.8 16.3 16.1 16.4 0.4G767G771G772G773 15.5 14.6 13.6 14.6 1.0G774G775 0.1090 0.1194 0.1148 0.1144 0.0052 15.8 15.8 15.7 15.8 0.0G776G777 0.0180 0.0160 0.0170 0.0170 0.0010 17.0 17.1 13.0 15.7 2.3
Consensus Mean 0.0467 Consensus Mean 17.5 Consensus Standard Deviation 0.0454 Consensus Standard Deviation 3.0 Maximum 0.1300 Maximum 31.6 Minimum 0.0084 Minimum 14.3 N 9 N 13
Com
mun
ity
Res
ults
Peonidin-3-GlucosideSRM 3283 Cranberry Extract (mg/g) SRM 3291 Bilberry Extract (mg/g)
Indi
vidu
al R
esul
ts

80
This publication is available free of charge from: https://doi.org/10.6028/N
IST.IR.8163
Table 33. Data summary table for peonidin equivalents in dietary supplements.
Lab A B C Avg SD A B C Avg SDNISTG701 0.232 0.226 0.236 0.231 0.005 17.7 16.7 15.1 16.5 1.3G702G703 0.242 0.242 0.249 0.244 0.004 13.3 13.5 13.5 13.4 0.1G704G705 0.259 0.283 0.250 0.264 0.017 18.2 18.1 18.0 18.1 0.1G707G708 0.161 0.162 0.188 0.170 0.015 23.6 23.5 23.5 23.5 0.1G715 0.259 0.281 0.270 0.016 17.8 17.6 17.7 0.1G716G717 0.328 0.331 0.333 0.331 0.003 14.9 14.7 14.7 14.8 0.1G718 0.374 0.443 0.379 0.399 0.039 16.0 15.4 15.8 15.7 0.3G722G724G728 0.467 0.264 0.419 0.383 0.106 24.8 24.0 25.4 24.8 0.7G729G738 0.092 0.092 2.5 2.5G739G740G749G752G753G757G760G762 0.215 0.220 0.215 0.217 0.003 16.9 16.9 15.5 16.5 0.8G765 0.296 0.303 0.314 0.304 0.009 25.4 24.2 25.1 24.9 0.6G766 0.128 0.142 0.129 0.133 0.008 13.8 13.2 13.0 13.3 0.4G767G771G772 0.642 0.641 0.600 0.628 0.024 15.5 16.6 17.3 16.5 0.9G773 0.050 0.051 0.169 0.090 0.069 13.9 13.5 12.2 13.2 0.9G774G775 0.102 0.109 0.109 0.107 0.004 15.7 15.5 15.7 15.6 0.1G776G777 0.213 0.206 0.221 0.213 0.007 22.6 22.6 20.1 21.7 1.4
Consensus Mean 0.252 Consensus Mean 17.6 Consensus Standard Deviation 0.118 Consensus Standard Deviation 4.4 Maximum 0.628 Maximum 24.9 Minimum 0.090 Minimum 2.5 N 15 N 15
Peonidin EquivalentsSRM 3283 Cranberry Extract (mg/g) SRM 3291 Bilberry Extract (mg/g)
Indi
vidu
al R
esul
tsC
omm
unity
R
esul
ts
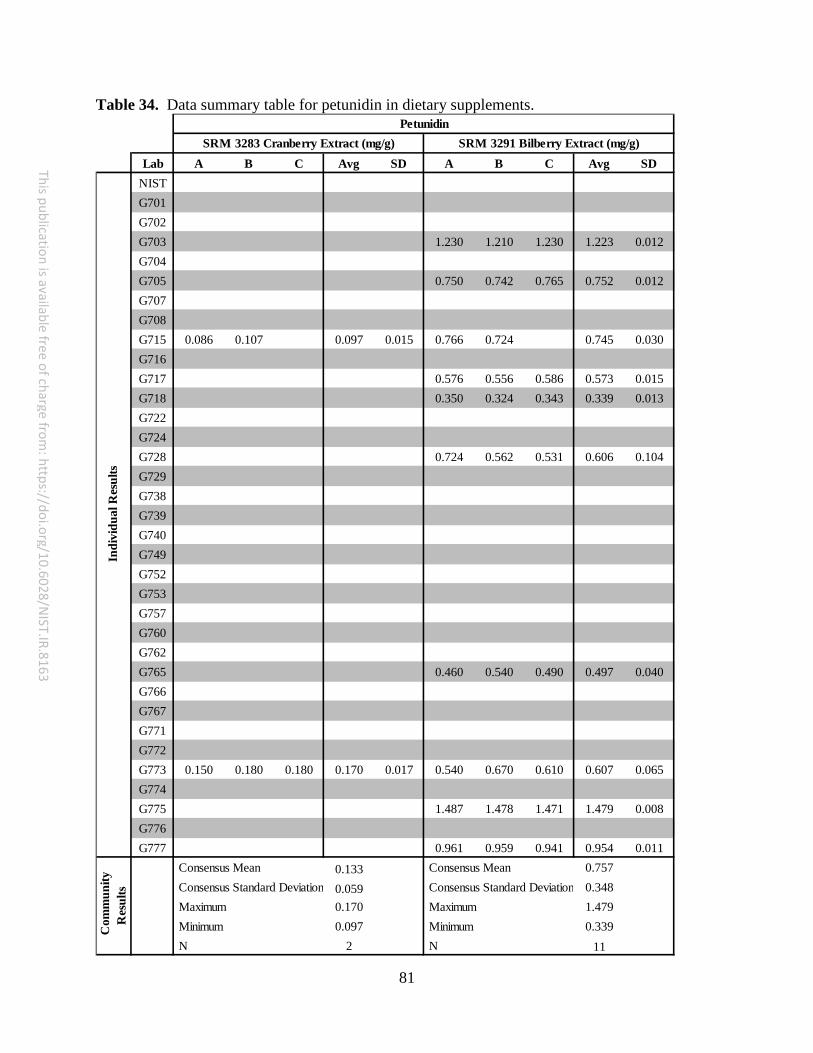
81
This publication is available free of charge from: https://doi.org/10.6028/N
IST.IR.8163
Table 34. Data summary table for petunidin in dietary supplements.
Lab A B C Avg SD A B C Avg SDNISTG701G702G703 1.230 1.210 1.230 1.223 0.012G704G705 0.750 0.742 0.765 0.752 0.012G707G708G715 0.086 0.107 0.097 0.015 0.766 0.724 0.745 0.030G716G717 0.576 0.556 0.586 0.573 0.015G718 0.350 0.324 0.343 0.339 0.013G722G724G728 0.724 0.562 0.531 0.606 0.104G729G738G739G740G749G752G753G757G760G762G765 0.460 0.540 0.490 0.497 0.040G766G767G771G772G773 0.150 0.180 0.180 0.170 0.017 0.540 0.670 0.610 0.607 0.065G774G775 1.487 1.478 1.471 1.479 0.008G776G777 0.961 0.959 0.941 0.954 0.011
Consensus Mean 0.133 Consensus Mean 0.757 Consensus Standard Deviation 0.059 Consensus Standard Deviation 0.348 Maximum 0.170 Maximum 1.479 Minimum 0.097 Minimum 0.339 N 2 N 11
Indi
vidu
al R
esul
tsC
omm
unity
R
esul
tsPetunidin
SRM 3283 Cranberry Extract (mg/g) SRM 3291 Bilberry Extract (mg/g)
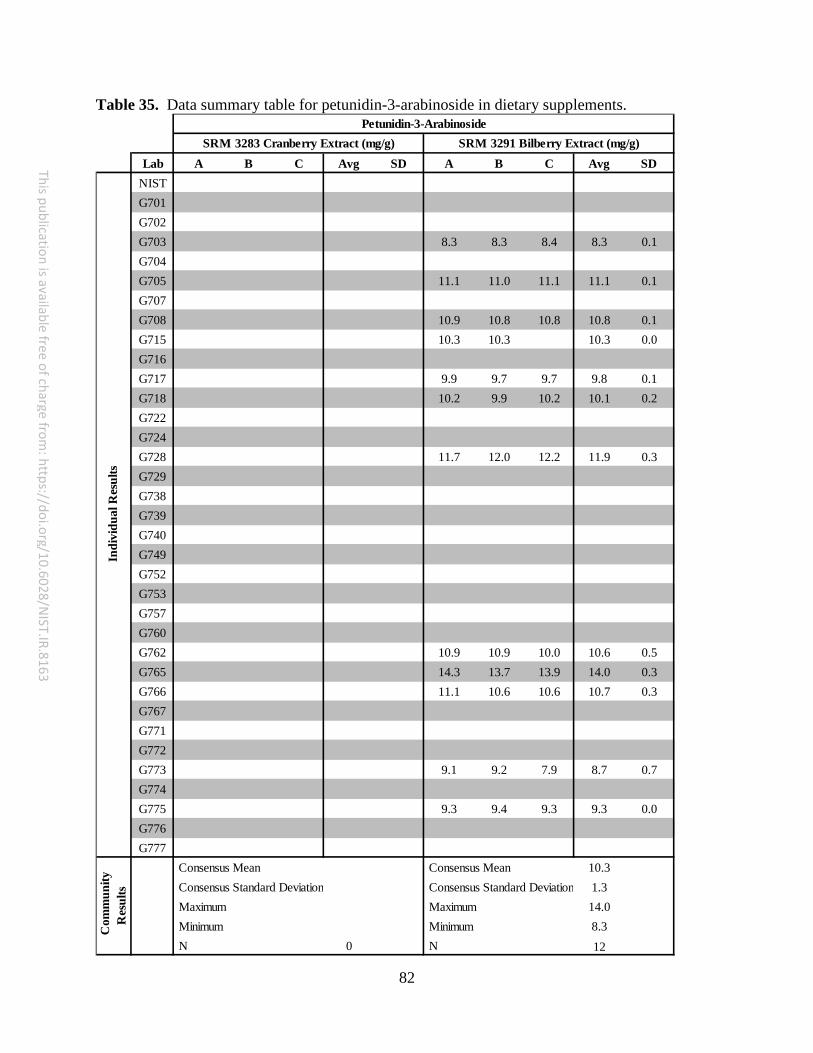
82
This publication is available free of charge from: https://doi.org/10.6028/N
IST.IR.8163
Table 35. Data summary table for petunidin-3-arabinoside in dietary supplements.
Lab A B C Avg SD A B C Avg SDNISTG701G702G703 8.3 8.3 8.4 8.3 0.1G704G705 11.1 11.0 11.1 11.1 0.1G707G708 10.9 10.8 10.8 10.8 0.1G715 10.3 10.3 10.3 0.0G716G717 9.9 9.7 9.7 9.8 0.1G718 10.2 9.9 10.2 10.1 0.2G722G724G728 11.7 12.0 12.2 11.9 0.3G729G738G739G740G749G752G753G757G760G762 10.9 10.9 10.0 10.6 0.5G765 14.3 13.7 13.9 14.0 0.3G766 11.1 10.6 10.6 10.7 0.3G767G771G772G773 9.1 9.2 7.9 8.7 0.7G774G775 9.3 9.4 9.3 9.3 0.0G776G777
Consensus Mean Consensus Mean 10.3 Consensus Standard Deviation Consensus Standard Deviation 1.3 Maximum Maximum 14.0 Minimum Minimum 8.3 N 0 N 12
Petunidin-3-ArabinosideSRM 3283 Cranberry Extract (mg/g) SRM 3291 Bilberry Extract (mg/g)
Indi
vidu
al R
esul
tsC
omm
unity
R
esul
ts
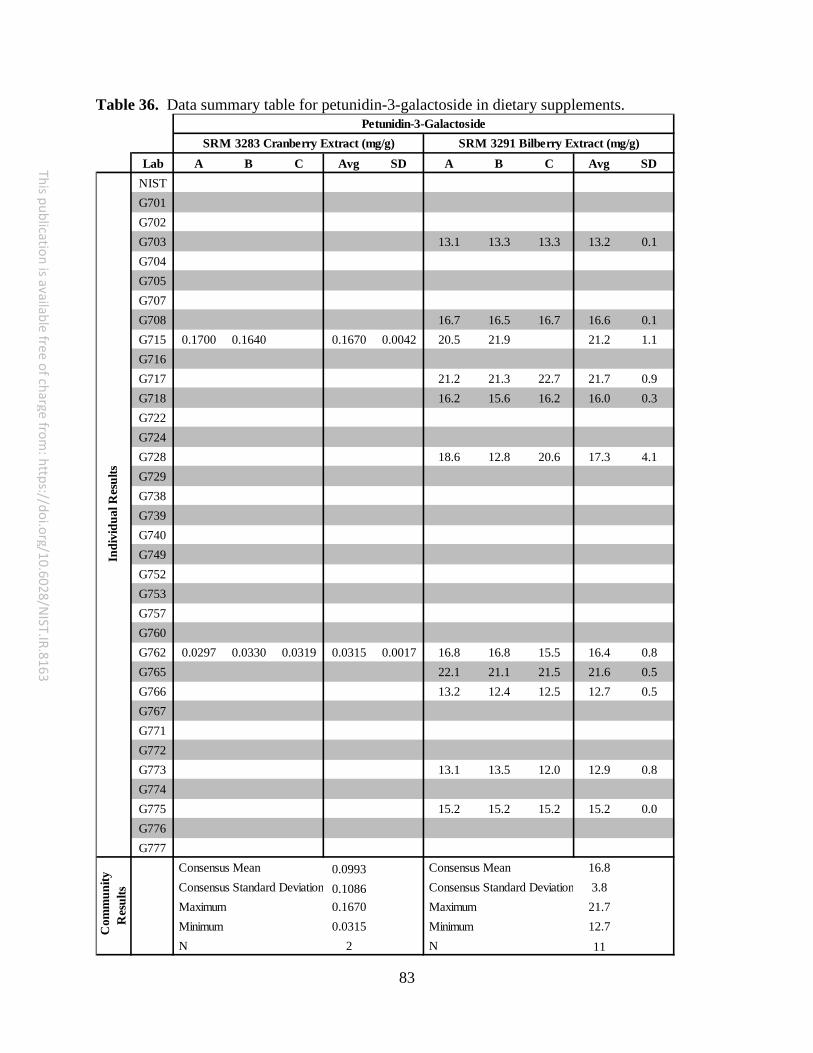
83
This publication is available free of charge from: https://doi.org/10.6028/N
IST.IR.8163
Table 36. Data summary table for petunidin-3-galactoside in dietary supplements.
Lab A B C Avg SD A B C Avg SDNISTG701G702G703 13.1 13.3 13.3 13.2 0.1G704G705G707G708 16.7 16.5 16.7 16.6 0.1G715 0.1700 0.1640 0.1670 0.0042 20.5 21.9 21.2 1.1G716G717 21.2 21.3 22.7 21.7 0.9G718 16.2 15.6 16.2 16.0 0.3G722G724G728 18.6 12.8 20.6 17.3 4.1G729G738G739G740G749G752G753G757G760G762 0.0297 0.0330 0.0319 0.0315 0.0017 16.8 16.8 15.5 16.4 0.8G765 22.1 21.1 21.5 21.6 0.5G766 13.2 12.4 12.5 12.7 0.5G767G771G772G773 13.1 13.5 12.0 12.9 0.8G774G775 15.2 15.2 15.2 15.2 0.0G776G777
Consensus Mean 0.0993 Consensus Mean 16.8 Consensus Standard Deviation 0.1086 Consensus Standard Deviation 3.8 Maximum 0.1670 Maximum 21.7 Minimum 0.0315 Minimum 12.7 N 2 N 11
Petunidin-3-GalactosideSRM 3283 Cranberry Extract (mg/g) SRM 3291 Bilberry Extract (mg/g)
Indi
vidu
al R
esul
tsC
omm
unity
R
esul
ts

84
This publication is available free of charge from: https://doi.org/10.6028/N
IST.IR.8163
Table 37. Data summary table for petunidin-3-glucoside in dietary supplements.
Lab A B C Avg SD A B C Avg SDNISTG701 57.8 49.6 53.0 53.5 4.1G702G703 27.3 27.7 27.6 27.5 0.2G704G705 33.5 34.5 34.6 34.2 0.6G707G708 34.0 34.0 34.2 34.1 0.1G715 29.4 30.6 30.0 0.8G716G717 32.6 33.7 33.6 33.3 0.6G718 0.0440 0.0440 0.0440 0.0000 33.2 32.0 33.2 32.8 0.7G722G724G728 39.9 37.5 39.6 39.0 1.3G729G738G739G740G749G752G753G757G760G762 0.0056 0.0057 0.0060 0.0058 0.0002 34.0 33.9 31.0 33.0 1.7G765 44.3 42.3 43.0 43.2 1.0G766 26.2 25.2 25.3 25.6 0.6G767G771G772G773 0.0180 0.0180 23.8 23.0 21.5 22.8 1.2G774G775 0.1866 0.1918 0.1945 0.1910 0.0040 30.1 30.2 30.2 30.2 0.1G776G777 0.0070 0.0060 0.0060 0.0063 0.0006 31.9 32.0 32.0 31.9 0.0
Consensus Mean 0.0618 Consensus Mean 32.7 Consensus Standard Deviation 0.0998 Consensus Standard Deviation 6.0 Maximum 0.1910 Maximum 53.5 Minimum 0.0058 Minimum 22.8 N 4 N 14
Com
mun
ity
Res
ults
Indi
vidu
al R
esul
tsPetunidin-3-Glucoside
SRM 3283 Cranberry Extract (mg/g) SRM 3291 Bilberry Extract (mg/g)

85
This publication is available free of charge from: https://doi.org/10.6028/N
IST.IR.8163
Table 38. Data summary table for petunidin equivalents in dietary supplements.
Lab A B C Avg SD A B C Avg SDNISTG701 38.3 32.8 35.1 35.4 2.7G702G703 33.8 34.2 34.2 34.1 0.2G704G705 30.8 31.3 31.5 31.2 0.4G707G708 41.2 41.0 41.3 41.2 0.1G715 0.1985 0.2155 0.2070 0.0120 41.0 42.8 41.9 1.2G716G717 43.1 43.8 44.7 43.9 0.8G718 0.0291 0.0291 0.0291 0.0000 40.3 38.9 40.2 39.8 0.8G722G724G728 47.7 42.3 49.0 46.3 3.6G729G738 12.1 12.1G739G740G749G752G753G757G760G762 0.0233 0.0256 0.0251 0.0247 0.0012 41.3 41.2 37.8 40.1 2.0G765 54.5 52.2 53.0 53.2 1.2G766 34.0 32.4 32.4 32.9 0.9G767G771G772 41.9 44.4 45.3 43.9 1.8G773 0.1500 0.1919 0.1800 0.1740 0.0216 31.4 31.3 28.4 30.4 1.7G774G775 0.1235 0.1269 0.1287 0.1264 0.0027 38.0 38.2 38.1 38.1 0.1G776G777 0.0046 0.0040 0.0040 0.0042 0.0004 22.1 22.1 22.1 22.1 0.0
Consensus Mean 0.0942 Consensus Mean 38.4 Consensus Standard Deviation 0.0979 Consensus Standard Deviation 7.1 Maximum 0.2070 Maximum 53.2 Minimum 0.0042 Minimum 12.1 N 6 N 15
Petunidin EquivalentsSRM 3283 Cranberry Extract (mg/g) SRM 3291 Bilberry Extract (mg/g)
Indi
vidu
al R
esul
tsC
omm
unity
R
esul
ts

86
This publication is available free of charge from: https://doi.org/10.6028/N
IST.IR.8163
Table 39. Data summary table for total anthocyanins in dietary supplements.
Lab A B C Avg SD A B C Avg SDNISTG701 0.734 0.729 0.768 0.744 0.021 380 336 334 350 26G702G703 0.676 0.651 0.644 0.657 0.017 310 314 314 313 2G704G705 0.696 0.768 0.675 0.713 0.049 390 387 387 388 2G707G708 0.891 0.895 0.958 0.915 0.038 376 374 376 375 1G715 0.910 0.982 0.946 0.051 366 368 367 2G716 1.700 1.800 1.900 1.800 0.100 290 280 270 280 10G717 0.798 0.796 0.808 0.801 0.006 371 367 367 368 2G718 1.337 1.321 1.280 1.313 0.029 424 409 424 419 9G722G724 0.730 0.770 0.770 0.757 0.023 282 281 282 282 1G728 1.270 0.841 1.187 1.099 0.228 457 443 457 453 8G729G738 0.476 0.476 97 97G739G740G749G752G753G757 10.100 11.100 10.200 10.467 0.551 433 444 419 432 13G760G762 0.685 0.710 0.699 0.698 0.013 388 387 357 377 18G765 0.847 0.867 0.917 0.877 0.036 543 519 528 530 12G766 0.745 0.745 0.720 0.737 0.014 303 296 297 298 4G767G771G772 2.200 2.196 2.102 2.166 0.055 243 257 260 253 9G773 0.507 0.676 0.720 0.634 0.112 302 303 272 292 17G774G775 0.696 0.717 0.702 0.705 0.010 340 341 341 340 1G776G777 1.267 1.233 1.292 1.264 0.030 428 428 424 427 2
Consensus Mean 0.934 Consensus Mean 354 Consensus Standard Deviation 0.358 Consensus Standard Deviation 78 Maximum 10.467 Maximum 530 Minimum 0.476 Minimum 97 N 18 N 18
SRM 3291 Bilberry Extract (mg/g)Total Anthocyanins
SRM 3283 Cranberry Extract (mg/g)
Indi
vidu
al R
esul
tsC
omm
unity
R
esul
ts
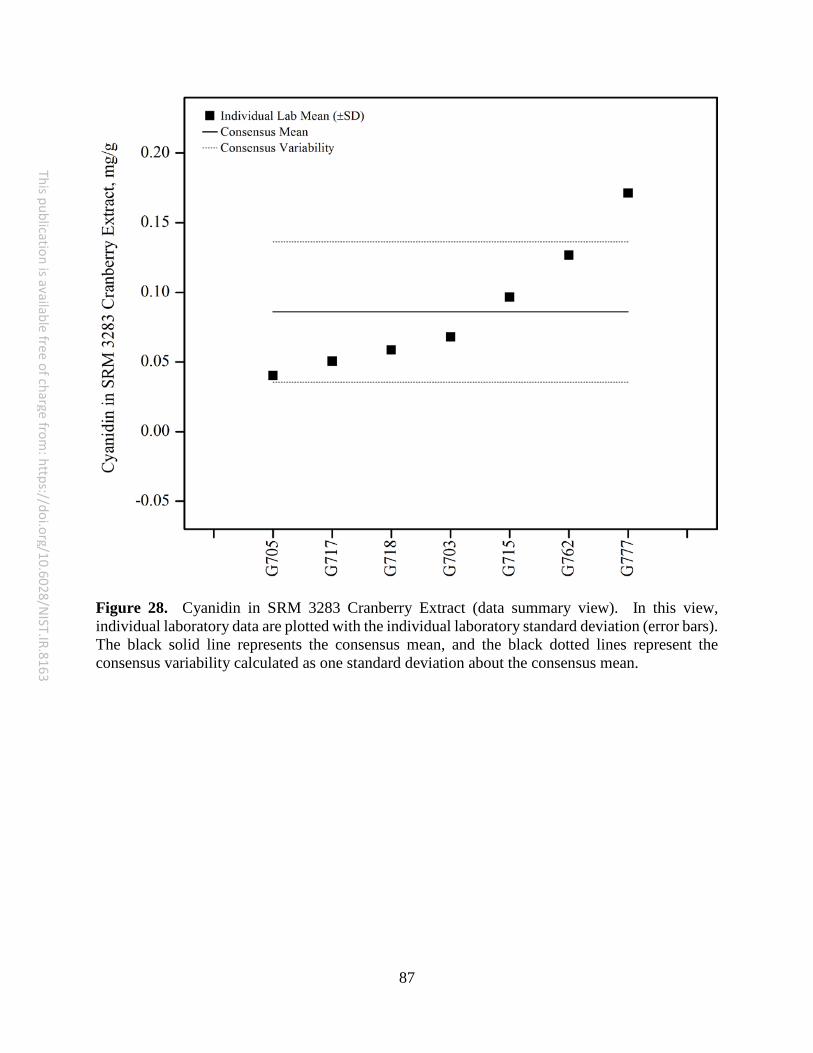
87
This publication is available free of charge from: https://doi.org/10.6028/N
IST.IR.8163
Figure 28. Cyanidin in SRM 3283 Cranberry Extract (data summary view). In this view, individual laboratory data are plotted with the individual laboratory standard deviation (error bars). The black solid line represents the consensus mean, and the black dotted lines represent the consensus variability calculated as one standard deviation about the consensus mean.
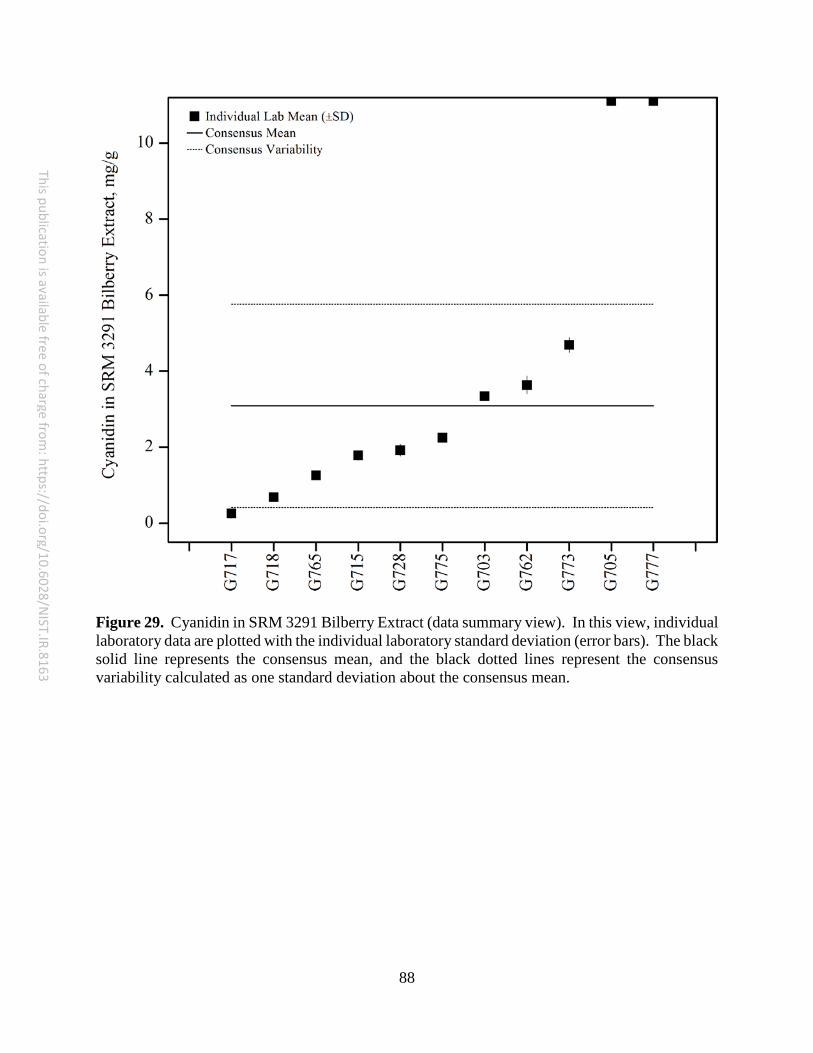
88
This publication is available free of charge from: https://doi.org/10.6028/N
IST.IR.8163
Figure 29. Cyanidin in SRM 3291 Bilberry Extract (data summary view). In this view, individual laboratory data are plotted with the individual laboratory standard deviation (error bars). The black solid line represents the consensus mean, and the black dotted lines represent the consensus variability calculated as one standard deviation about the consensus mean.

89
This publication is available free of charge from: https://doi.org/10.6028/N
IST.IR.8163
Figure 30. Cyanidin-3-arabinoside in SRM 3283 Cranberry Extract (data summary view). In this view, individual laboratory data are plotted with the individual laboratory standard deviation (error bars). The black solid line represents the consensus mean, and the black dotted lines represent the consensus variability calculated as one standard deviation about the consensus mean.

90
This publication is available free of charge from: https://doi.org/10.6028/N
IST.IR.8163
Figure 31. Cyanidin-3-arabinoside in SRM 3291 Bilberry Extract (data summary view). In this view, individual laboratory data are plotted with the individual laboratory standard deviation (error bars). The black solid line represents the consensus mean, and the black dotted lines represent the consensus variability calculated as one standard deviation about the consensus mean.
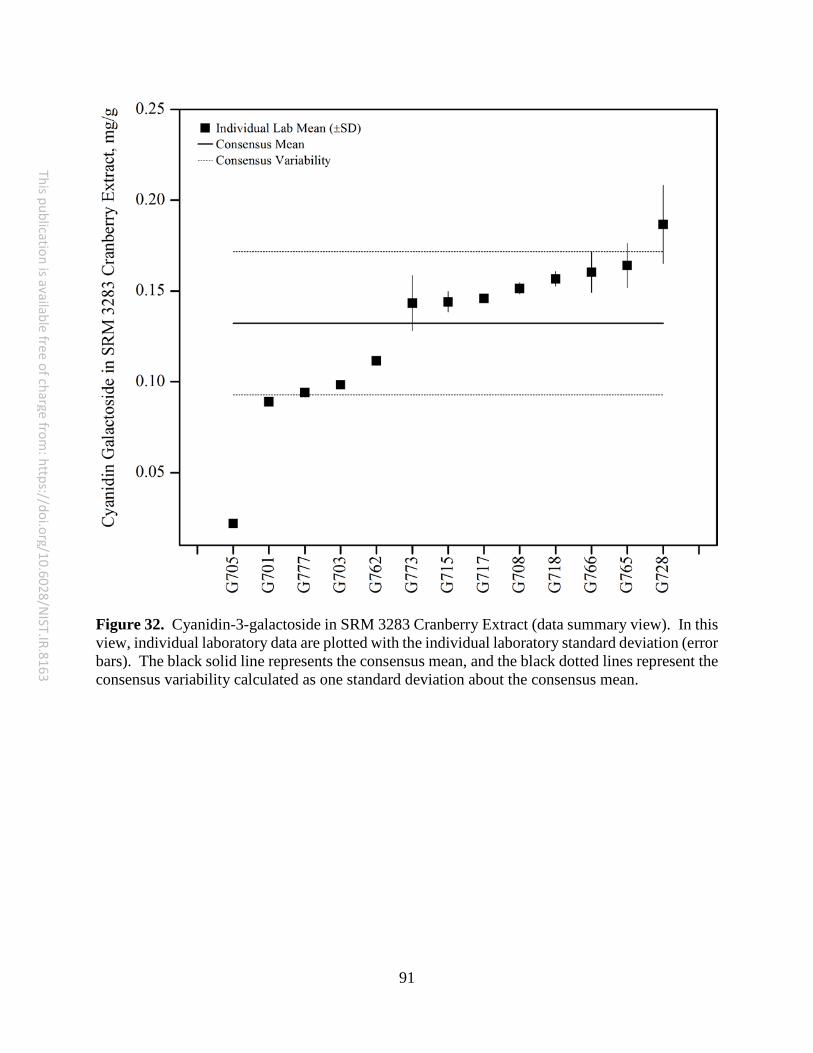
91
This publication is available free of charge from: https://doi.org/10.6028/N
IST.IR.8163
Figure 32. Cyanidin-3-galactoside in SRM 3283 Cranberry Extract (data summary view). In this view, individual laboratory data are plotted with the individual laboratory standard deviation (error bars). The black solid line represents the consensus mean, and the black dotted lines represent the consensus variability calculated as one standard deviation about the consensus mean.

92
This publication is available free of charge from: https://doi.org/10.6028/N
IST.IR.8163
Figure 33. Cyanidin-3-galactoside in SRM 3291 Bilberry Extract (data summary view). In this view, individual laboratory data are plotted with the individual laboratory standard deviation (error bars). The black solid line represents the consensus mean, and the black dotted lines represent the consensus variability calculated as one standard deviation about the consensus mean.
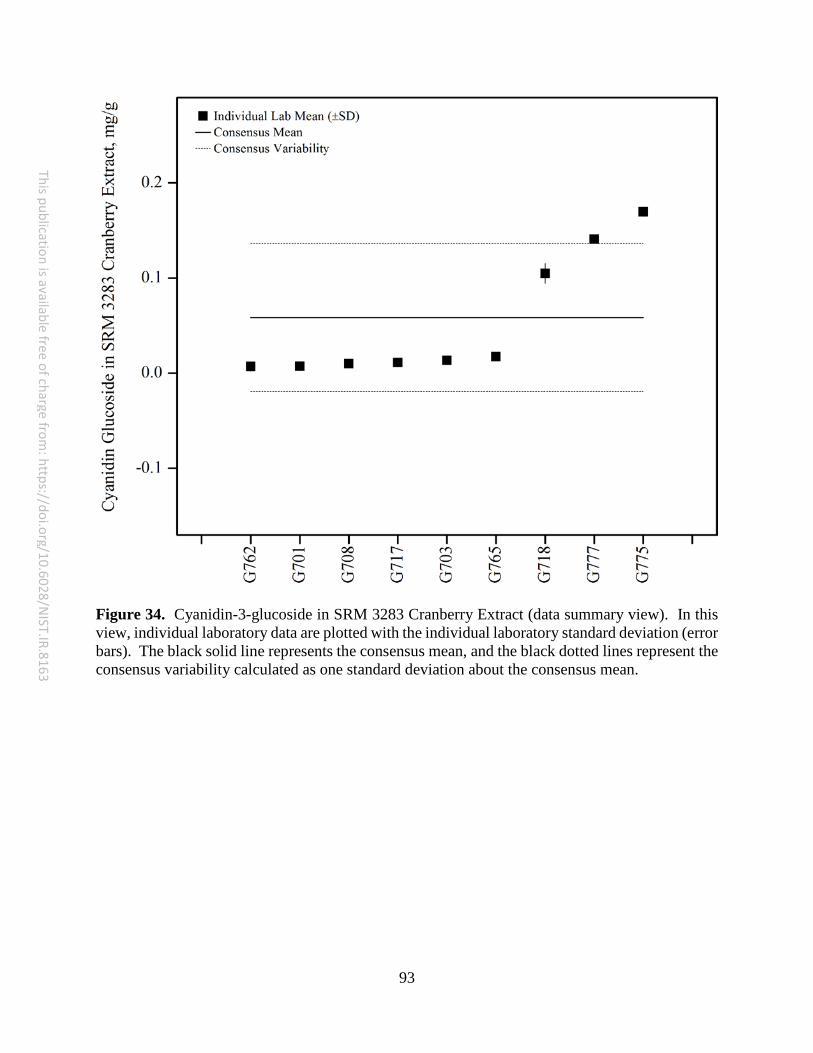
93
This publication is available free of charge from: https://doi.org/10.6028/N
IST.IR.8163
Figure 34. Cyanidin-3-glucoside in SRM 3283 Cranberry Extract (data summary view). In this view, individual laboratory data are plotted with the individual laboratory standard deviation (error bars). The black solid line represents the consensus mean, and the black dotted lines represent the consensus variability calculated as one standard deviation about the consensus mean.
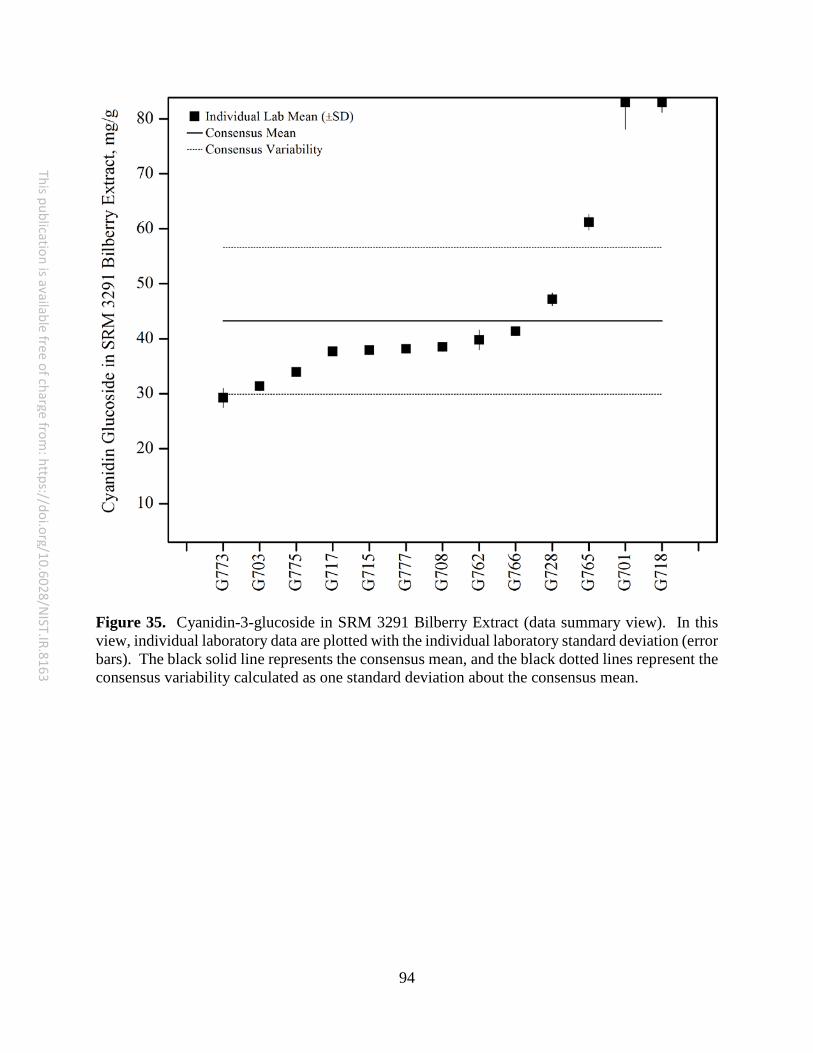
94
This publication is available free of charge from: https://doi.org/10.6028/N
IST.IR.8163
Figure 35. Cyanidin-3-glucoside in SRM 3291 Bilberry Extract (data summary view). In this view, individual laboratory data are plotted with the individual laboratory standard deviation (error bars). The black solid line represents the consensus mean, and the black dotted lines represent the consensus variability calculated as one standard deviation about the consensus mean.
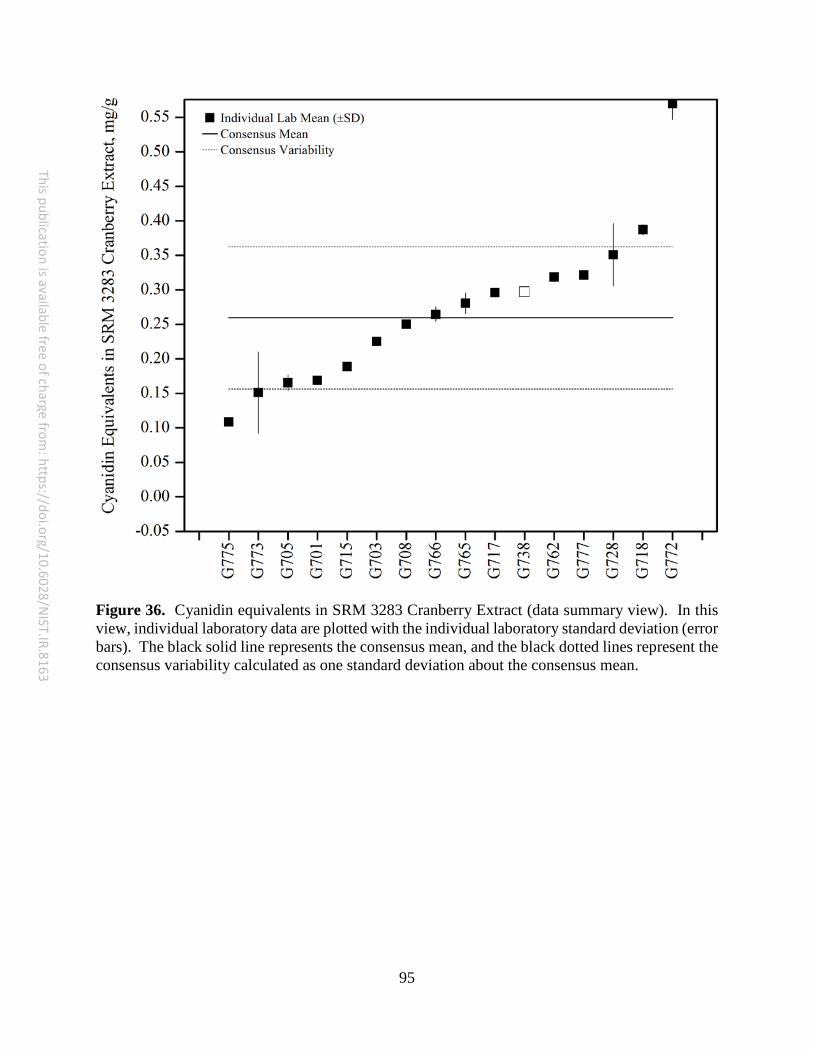
95
This publication is available free of charge from: https://doi.org/10.6028/N
IST.IR.8163
Figure 36. Cyanidin equivalents in SRM 3283 Cranberry Extract (data summary view). In this view, individual laboratory data are plotted with the individual laboratory standard deviation (error bars). The black solid line represents the consensus mean, and the black dotted lines represent the consensus variability calculated as one standard deviation about the consensus mean.
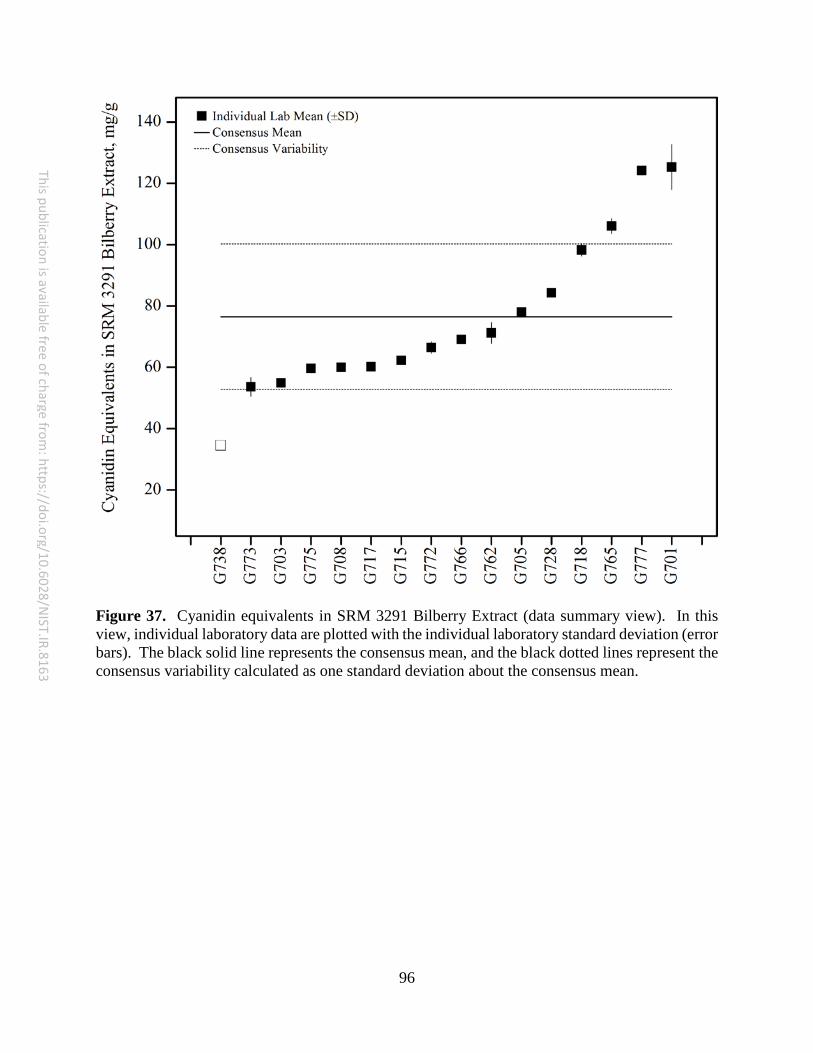
96
This publication is available free of charge from: https://doi.org/10.6028/N
IST.IR.8163
Figure 37. Cyanidin equivalents in SRM 3291 Bilberry Extract (data summary view). In this view, individual laboratory data are plotted with the individual laboratory standard deviation (error bars). The black solid line represents the consensus mean, and the black dotted lines represent the consensus variability calculated as one standard deviation about the consensus mean.

97
This publication is available free of charge from: https://doi.org/10.6028/N
IST.IR.8163
Figure 38. Delphinidin in SRM 3283 Cranberry Extract (data summary view). In this view, individual laboratory data are plotted with the individual laboratory standard deviation (error bars). The black solid line represents the consensus mean, and the black dotted lines represent the consensus variability calculated as one standard deviation about the consensus mean.
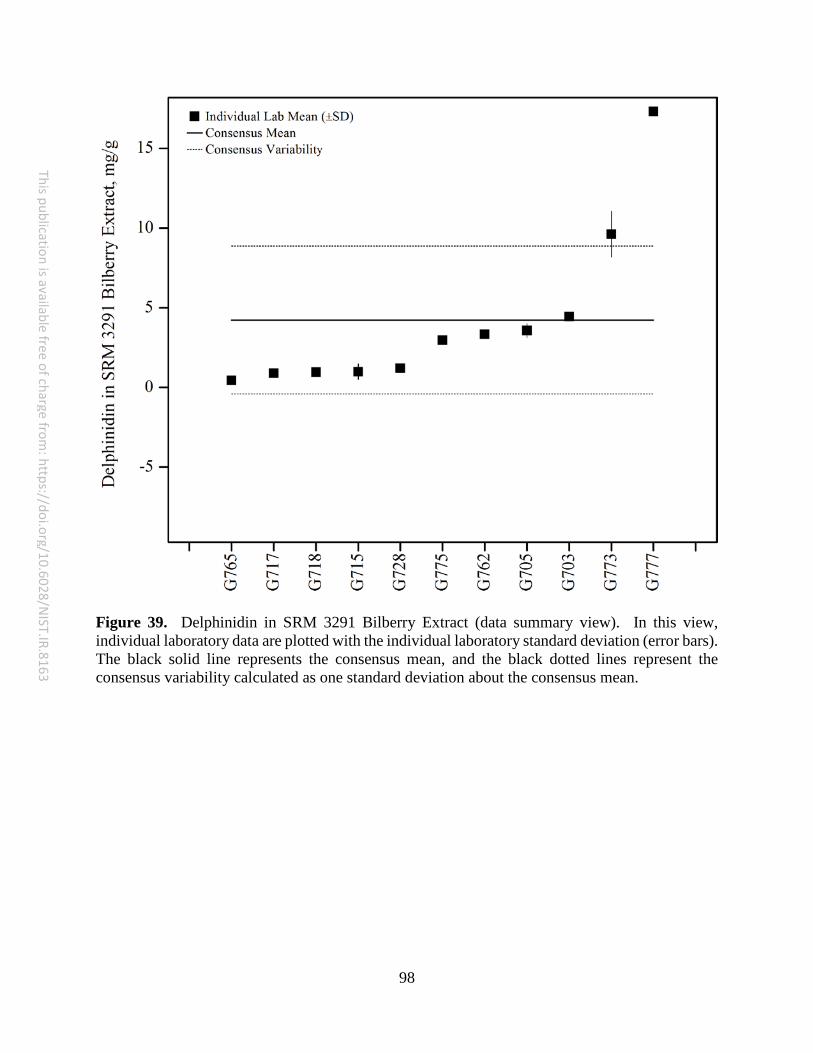
98
This publication is available free of charge from: https://doi.org/10.6028/N
IST.IR.8163
Figure 39. Delphinidin in SRM 3291 Bilberry Extract (data summary view). In this view, individual laboratory data are plotted with the individual laboratory standard deviation (error bars). The black solid line represents the consensus mean, and the black dotted lines represent the consensus variability calculated as one standard deviation about the consensus mean.
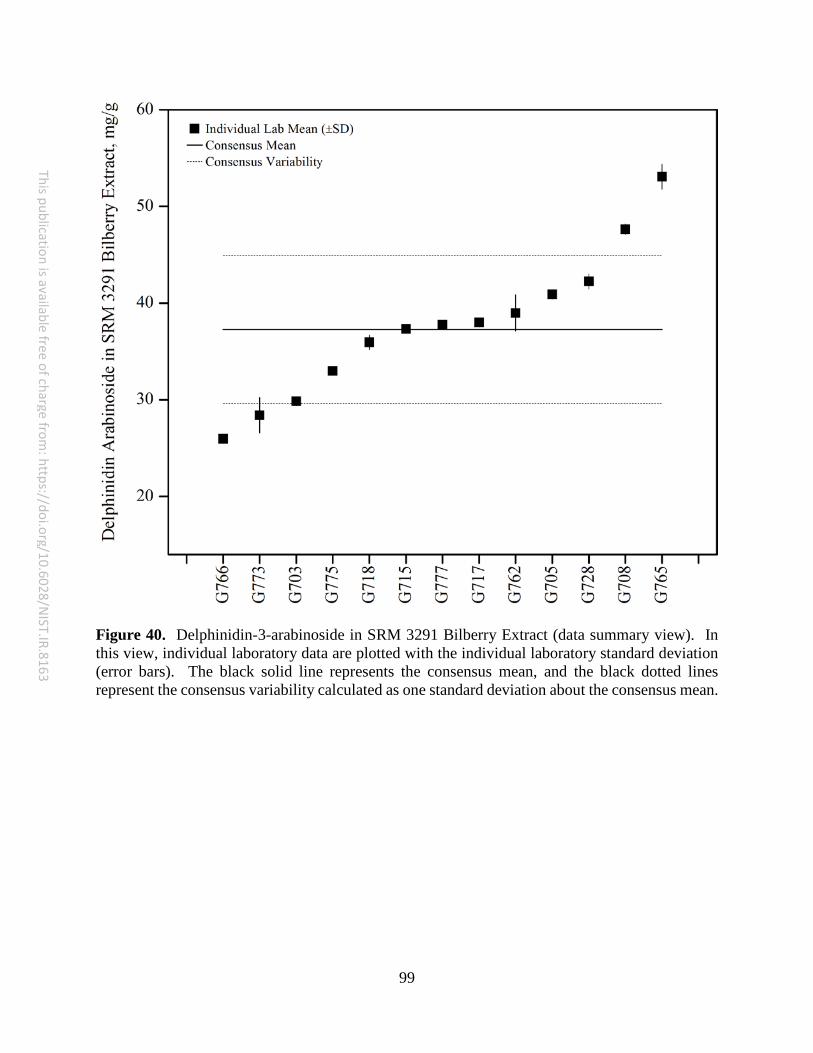
99
This publication is available free of charge from: https://doi.org/10.6028/N
IST.IR.8163
Figure 40. Delphinidin-3-arabinoside in SRM 3291 Bilberry Extract (data summary view). In this view, individual laboratory data are plotted with the individual laboratory standard deviation (error bars). The black solid line represents the consensus mean, and the black dotted lines represent the consensus variability calculated as one standard deviation about the consensus mean.
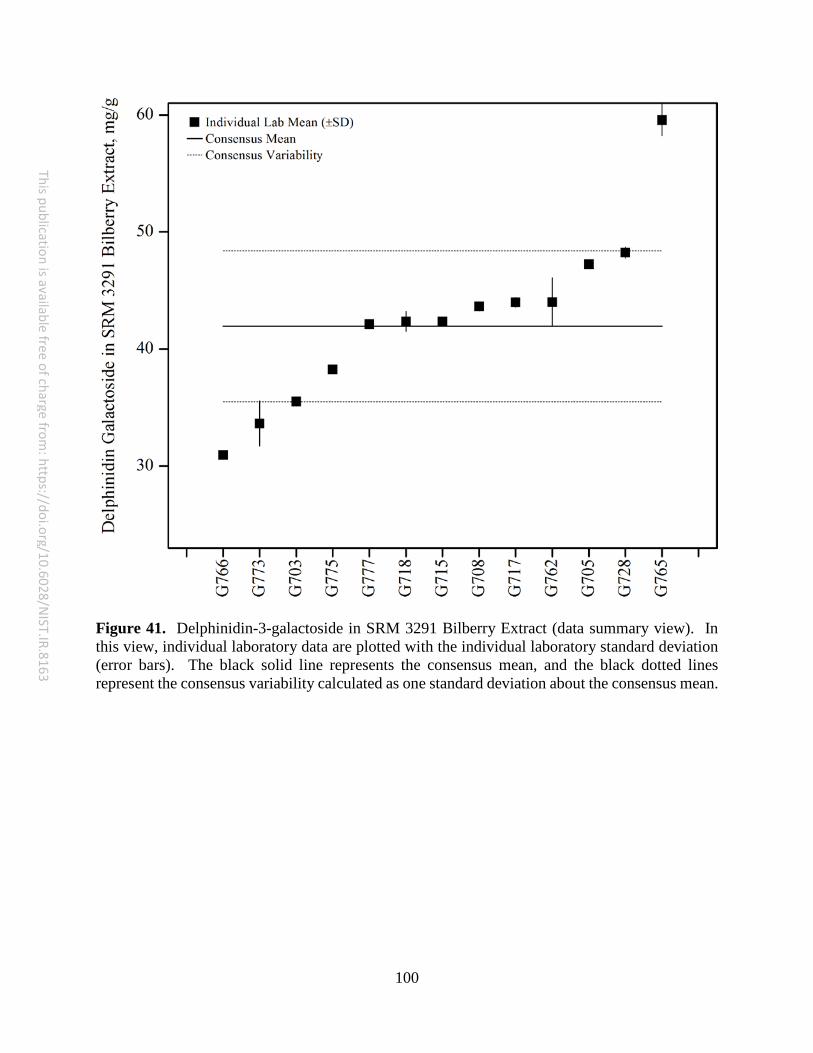
100
This publication is available free of charge from: https://doi.org/10.6028/N
IST.IR.8163
Figure 41. Delphinidin-3-galactoside in SRM 3291 Bilberry Extract (data summary view). In this view, individual laboratory data are plotted with the individual laboratory standard deviation (error bars). The black solid line represents the consensus mean, and the black dotted lines represent the consensus variability calculated as one standard deviation about the consensus mean.
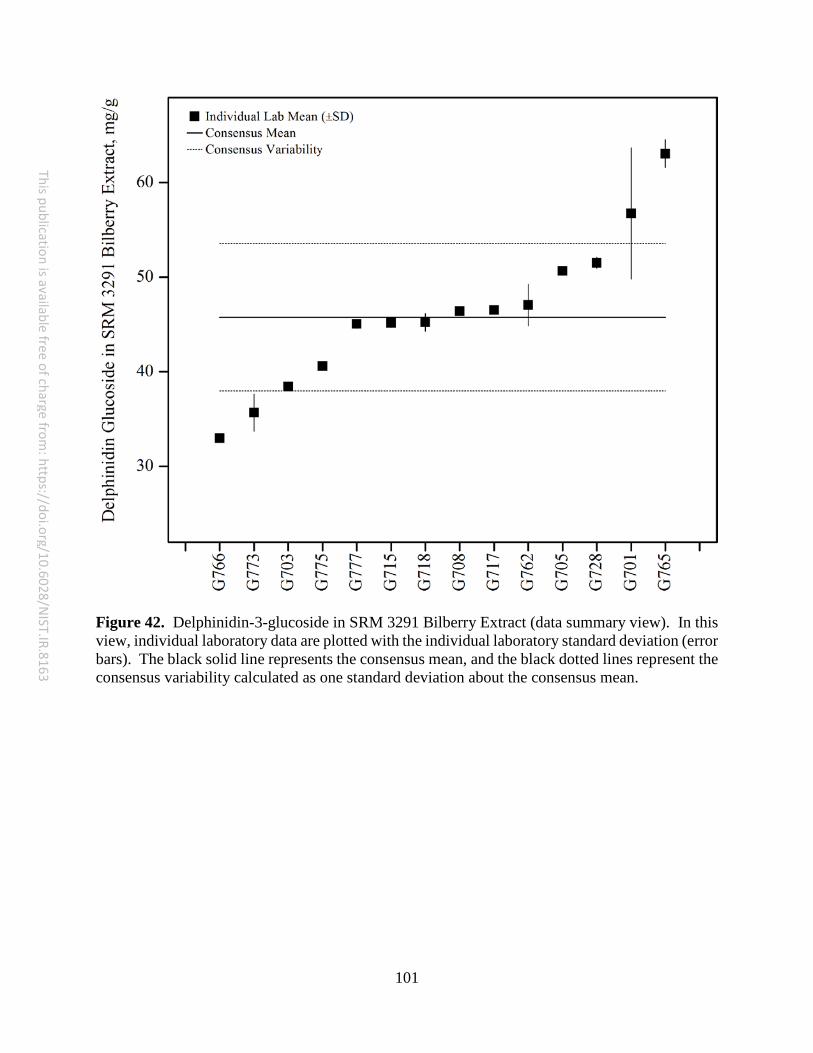
101
This publication is available free of charge from: https://doi.org/10.6028/N
IST.IR.8163
Figure 42. Delphinidin-3-glucoside in SRM 3291 Bilberry Extract (data summary view). In this view, individual laboratory data are plotted with the individual laboratory standard deviation (error bars). The black solid line represents the consensus mean, and the black dotted lines represent the consensus variability calculated as one standard deviation about the consensus mean.
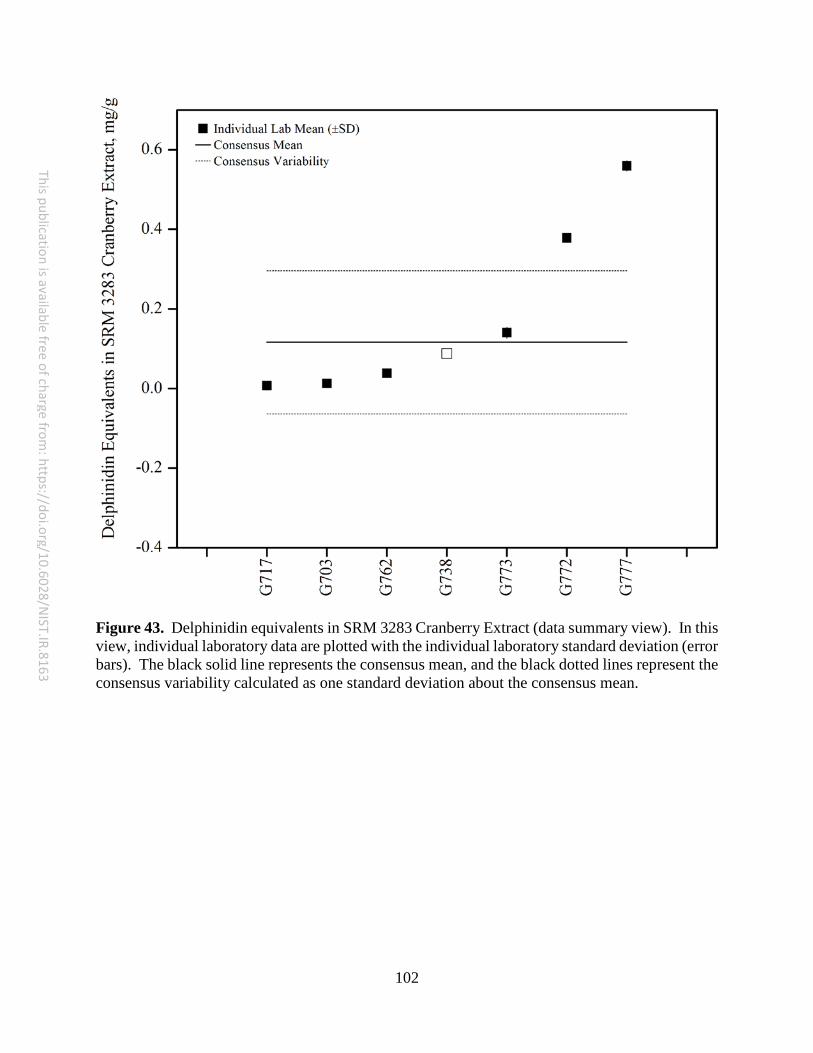
102
This publication is available free of charge from: https://doi.org/10.6028/N
IST.IR.8163
Figure 43. Delphinidin equivalents in SRM 3283 Cranberry Extract (data summary view). In this view, individual laboratory data are plotted with the individual laboratory standard deviation (error bars). The black solid line represents the consensus mean, and the black dotted lines represent the consensus variability calculated as one standard deviation about the consensus mean.
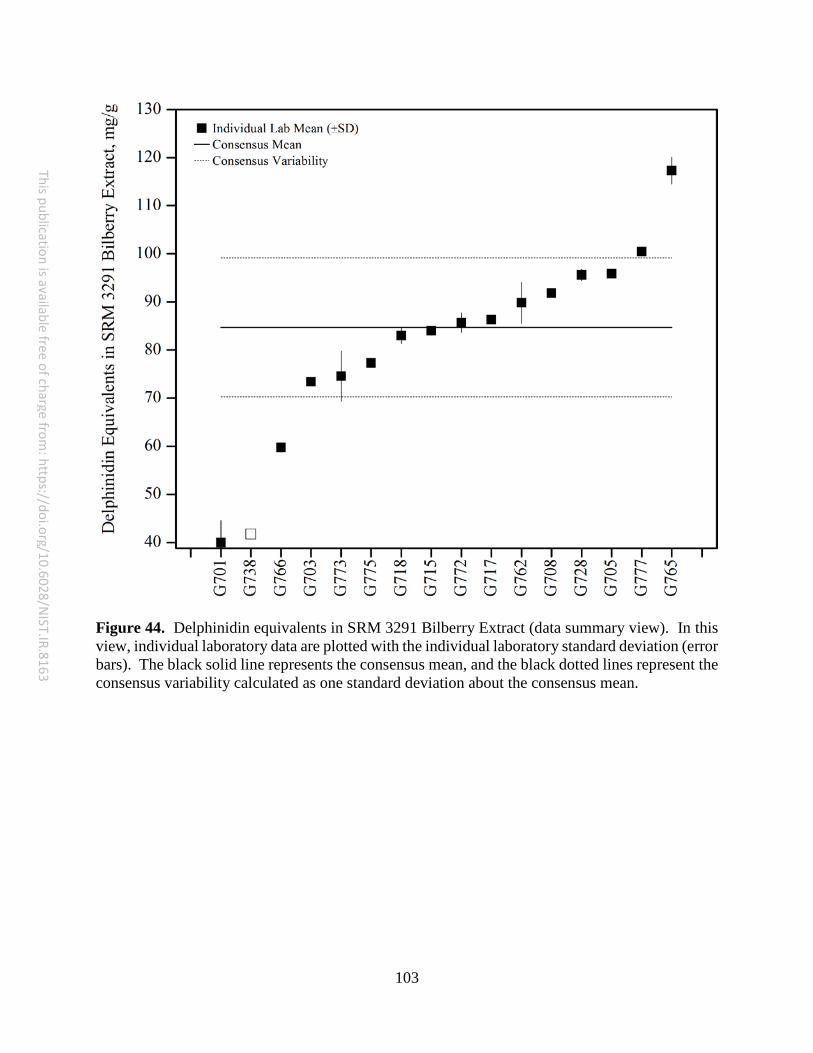
103
This publication is available free of charge from: https://doi.org/10.6028/N
IST.IR.8163
Figure 44. Delphinidin equivalents in SRM 3291 Bilberry Extract (data summary view). In this view, individual laboratory data are plotted with the individual laboratory standard deviation (error bars). The black solid line represents the consensus mean, and the black dotted lines represent the consensus variability calculated as one standard deviation about the consensus mean.

104
This publication is available free of charge from: https://doi.org/10.6028/N
IST.IR.8163
Figure 45. Malvidin in SRM 3291 Bilberry Extract (data summary view). In this view, individual laboratory data are plotted with the individual laboratory standard deviation (error bars). The black solid line represents the consensus mean, and the black dotted lines represent the consensus variability calculated as one standard deviation about the consensus mean.
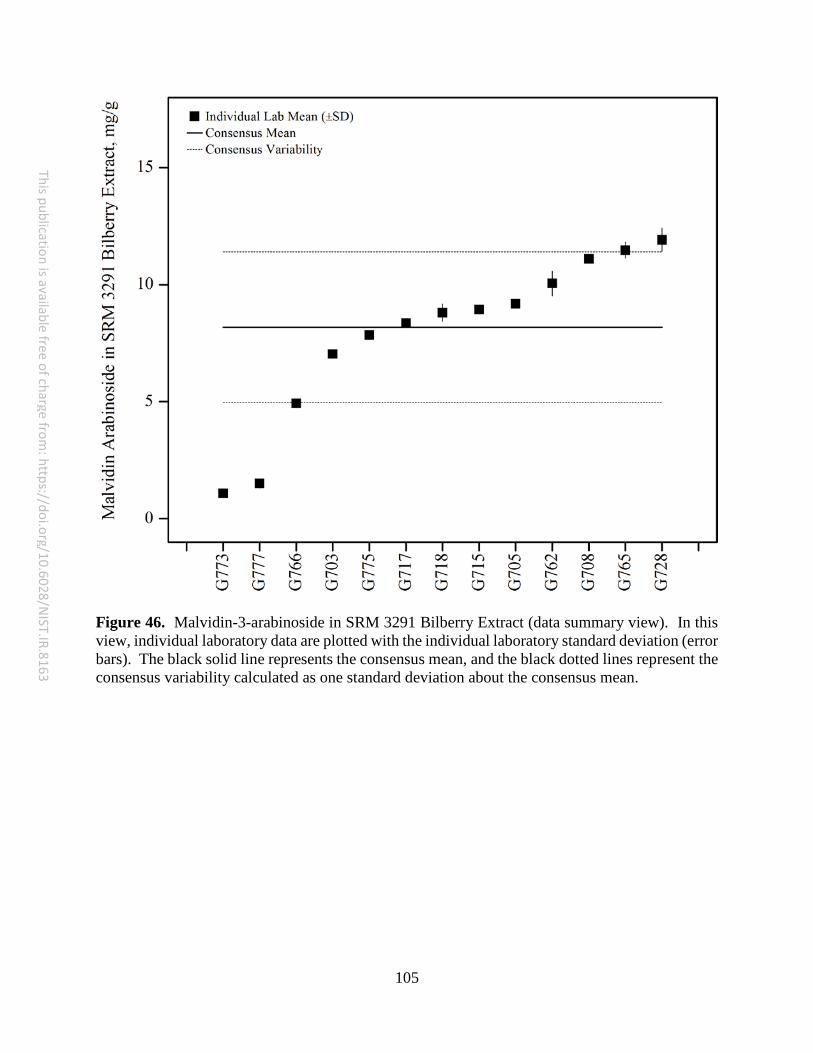
105
This publication is available free of charge from: https://doi.org/10.6028/N
IST.IR.8163
Figure 46. Malvidin-3-arabinoside in SRM 3291 Bilberry Extract (data summary view). In this view, individual laboratory data are plotted with the individual laboratory standard deviation (error bars). The black solid line represents the consensus mean, and the black dotted lines represent the consensus variability calculated as one standard deviation about the consensus mean.
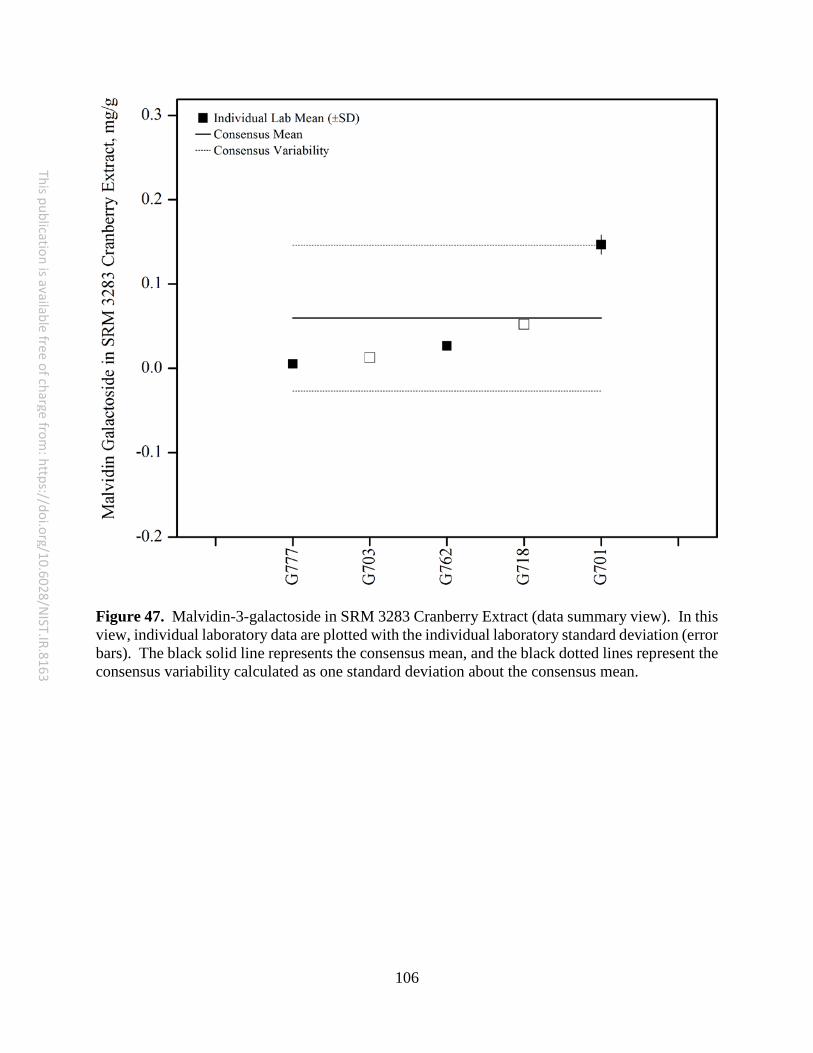
106
This publication is available free of charge from: https://doi.org/10.6028/N
IST.IR.8163
Figure 47. Malvidin-3-galactoside in SRM 3283 Cranberry Extract (data summary view). In this view, individual laboratory data are plotted with the individual laboratory standard deviation (error bars). The black solid line represents the consensus mean, and the black dotted lines represent the consensus variability calculated as one standard deviation about the consensus mean.
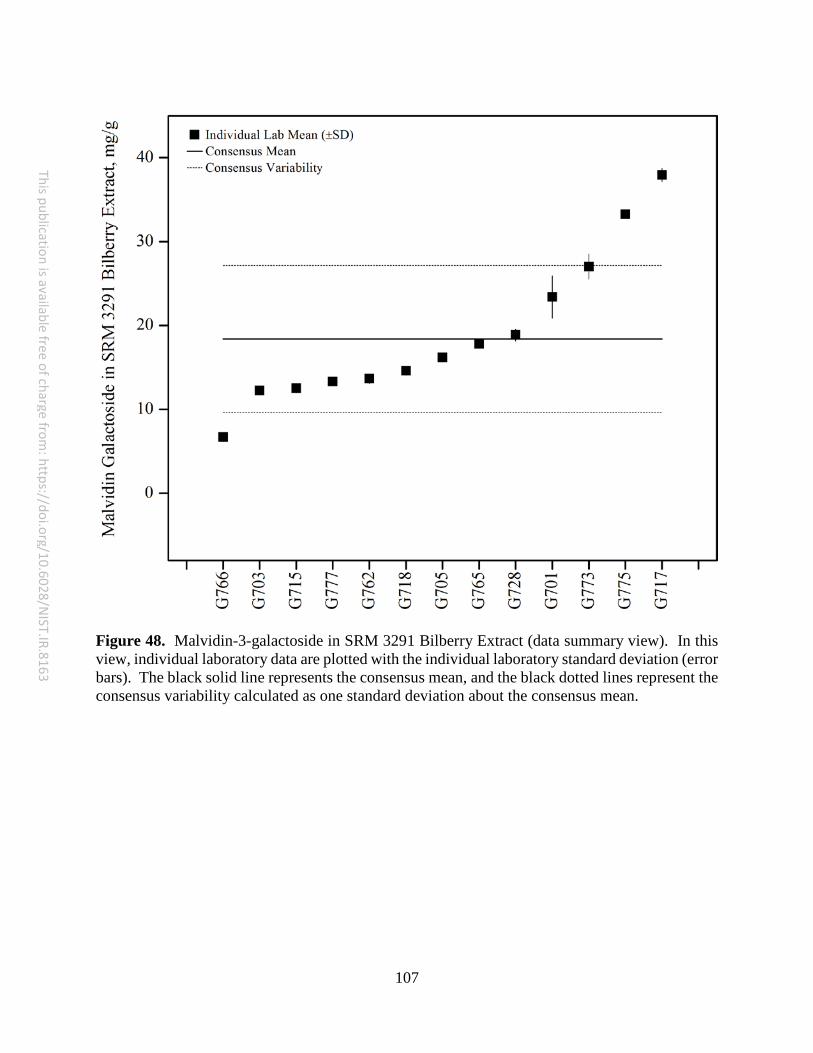
107
This publication is available free of charge from: https://doi.org/10.6028/N
IST.IR.8163
Figure 48. Malvidin-3-galactoside in SRM 3291 Bilberry Extract (data summary view). In this view, individual laboratory data are plotted with the individual laboratory standard deviation (error bars). The black solid line represents the consensus mean, and the black dotted lines represent the consensus variability calculated as one standard deviation about the consensus mean.
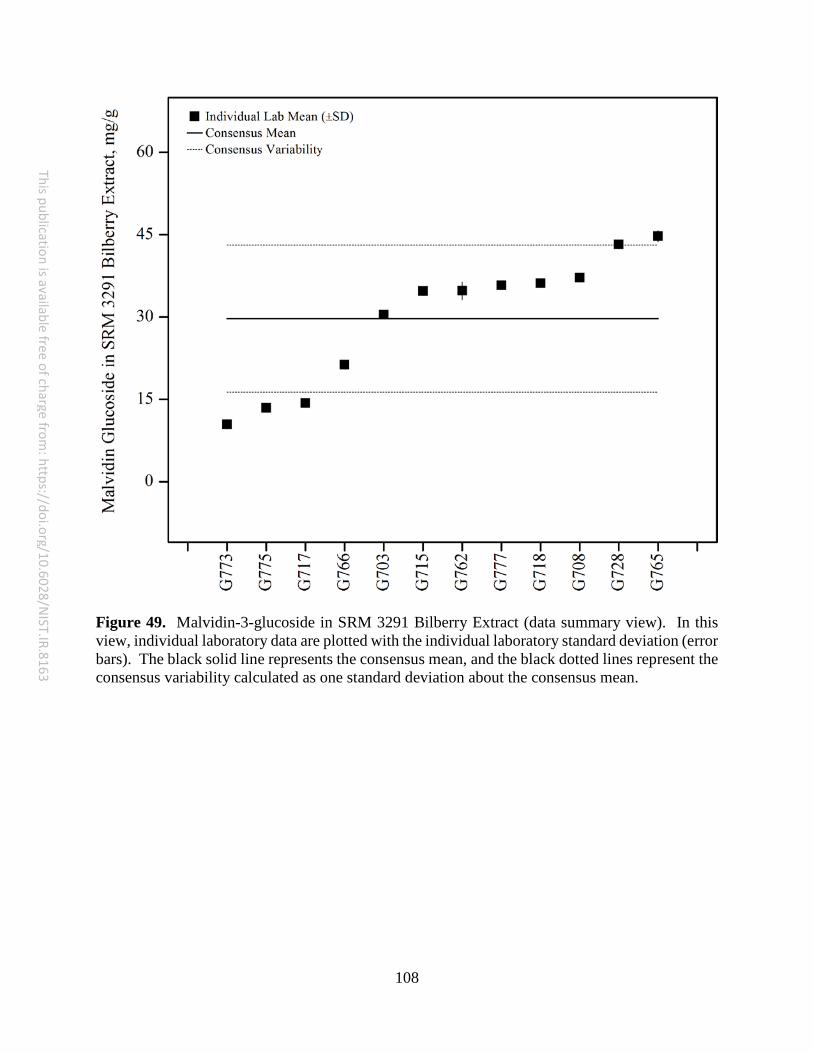
108
This publication is available free of charge from: https://doi.org/10.6028/N
IST.IR.8163
Figure 49. Malvidin-3-glucoside in SRM 3291 Bilberry Extract (data summary view). In this view, individual laboratory data are plotted with the individual laboratory standard deviation (error bars). The black solid line represents the consensus mean, and the black dotted lines represent the consensus variability calculated as one standard deviation about the consensus mean.
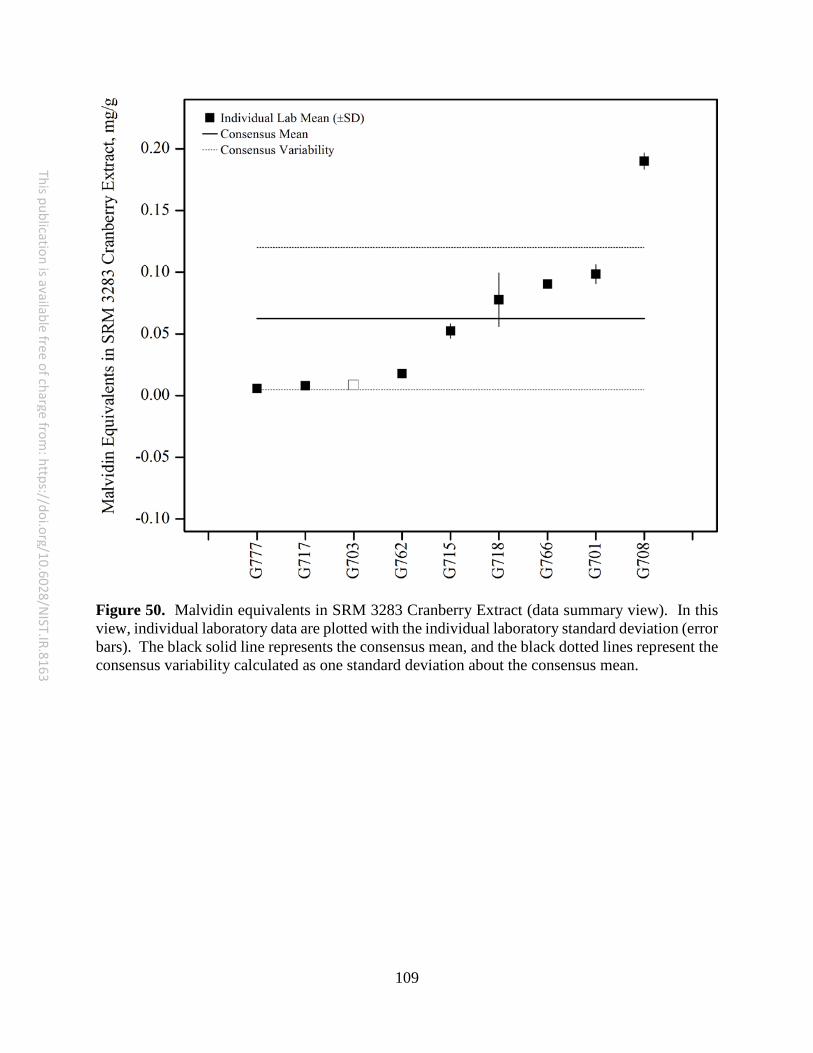
109
This publication is available free of charge from: https://doi.org/10.6028/N
IST.IR.8163
Figure 50. Malvidin equivalents in SRM 3283 Cranberry Extract (data summary view). In this view, individual laboratory data are plotted with the individual laboratory standard deviation (error bars). The black solid line represents the consensus mean, and the black dotted lines represent the consensus variability calculated as one standard deviation about the consensus mean.
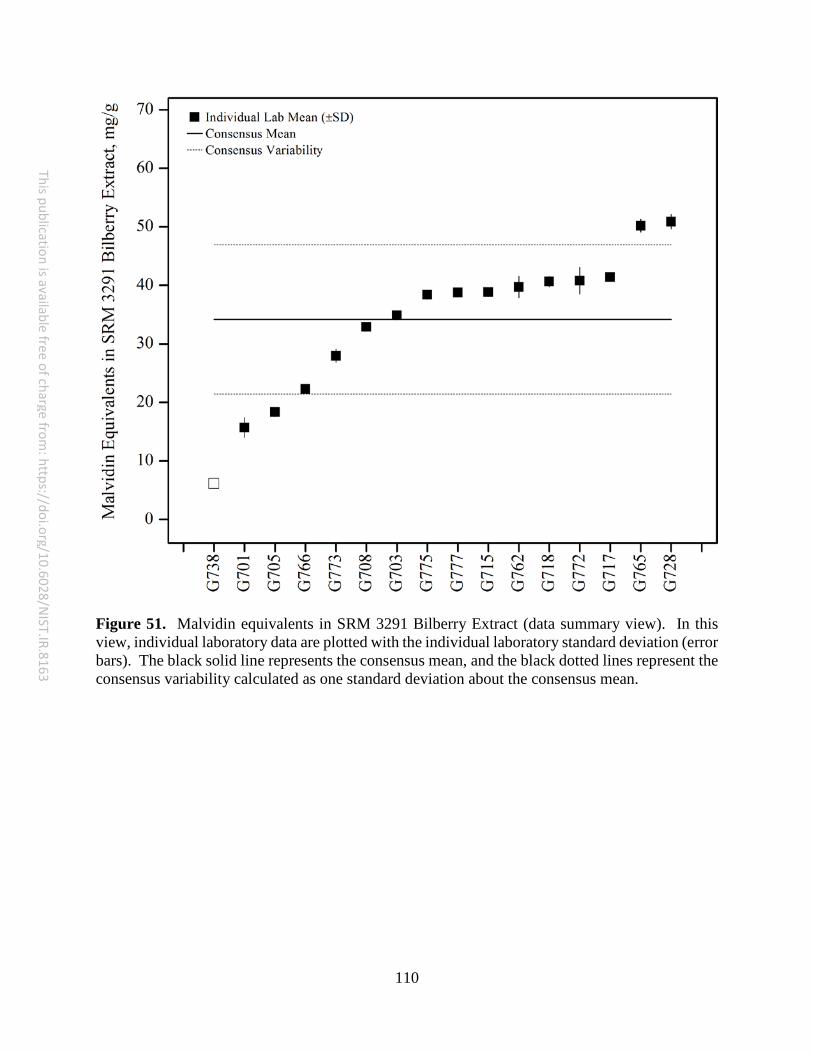
110
This publication is available free of charge from: https://doi.org/10.6028/N
IST.IR.8163
Figure 51. Malvidin equivalents in SRM 3291 Bilberry Extract (data summary view). In this view, individual laboratory data are plotted with the individual laboratory standard deviation (error bars). The black solid line represents the consensus mean, and the black dotted lines represent the consensus variability calculated as one standard deviation about the consensus mean.
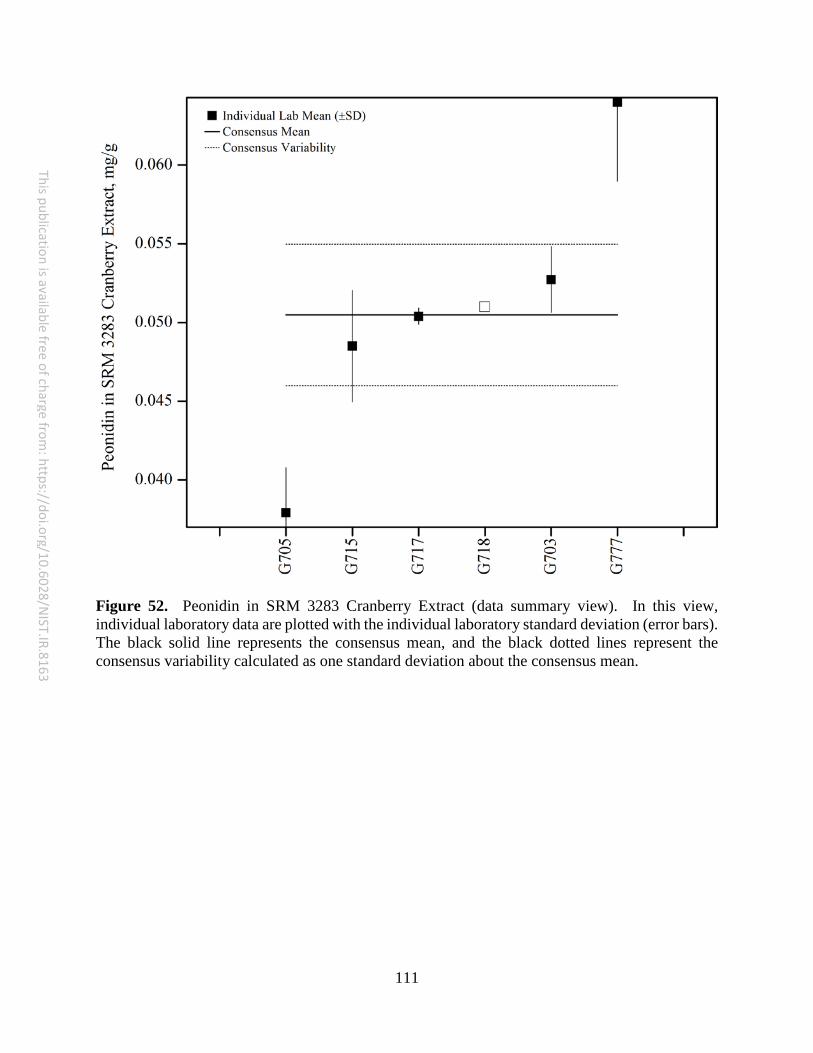
111
This publication is available free of charge from: https://doi.org/10.6028/N
IST.IR.8163
Figure 52. Peonidin in SRM 3283 Cranberry Extract (data summary view). In this view, individual laboratory data are plotted with the individual laboratory standard deviation (error bars). The black solid line represents the consensus mean, and the black dotted lines represent the consensus variability calculated as one standard deviation about the consensus mean.
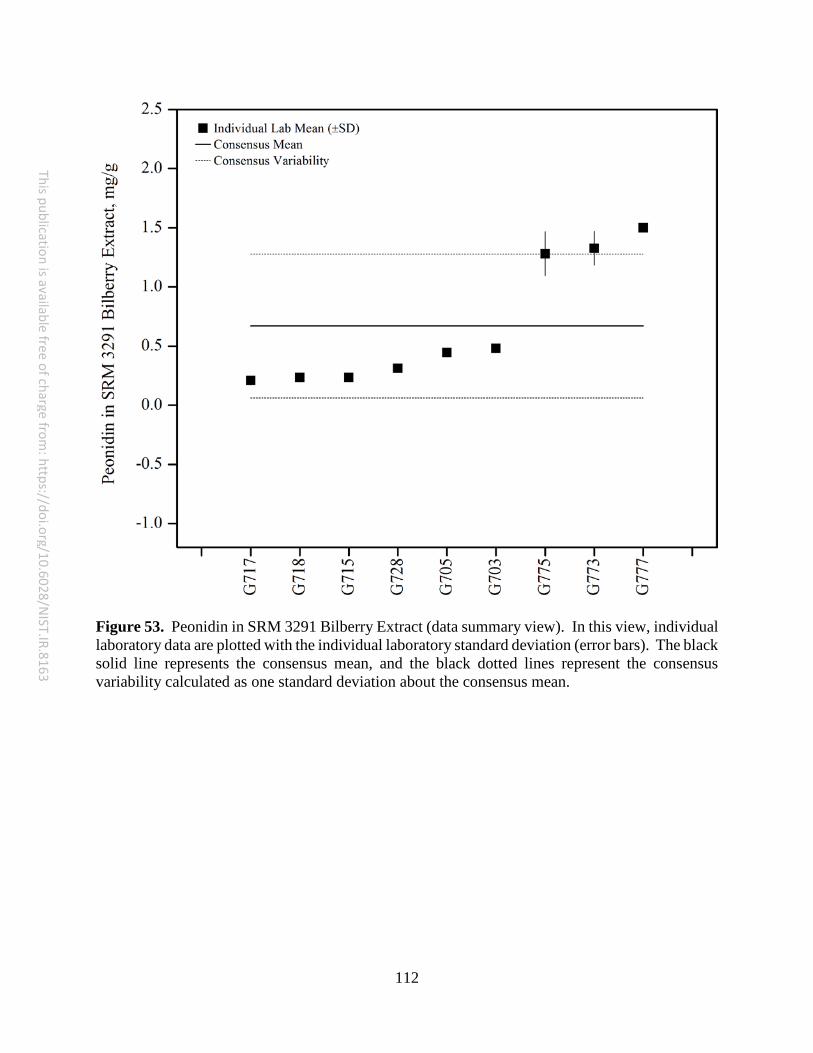
112
This publication is available free of charge from: https://doi.org/10.6028/N
IST.IR.8163
Figure 53. Peonidin in SRM 3291 Bilberry Extract (data summary view). In this view, individual laboratory data are plotted with the individual laboratory standard deviation (error bars). The black solid line represents the consensus mean, and the black dotted lines represent the consensus variability calculated as one standard deviation about the consensus mean.
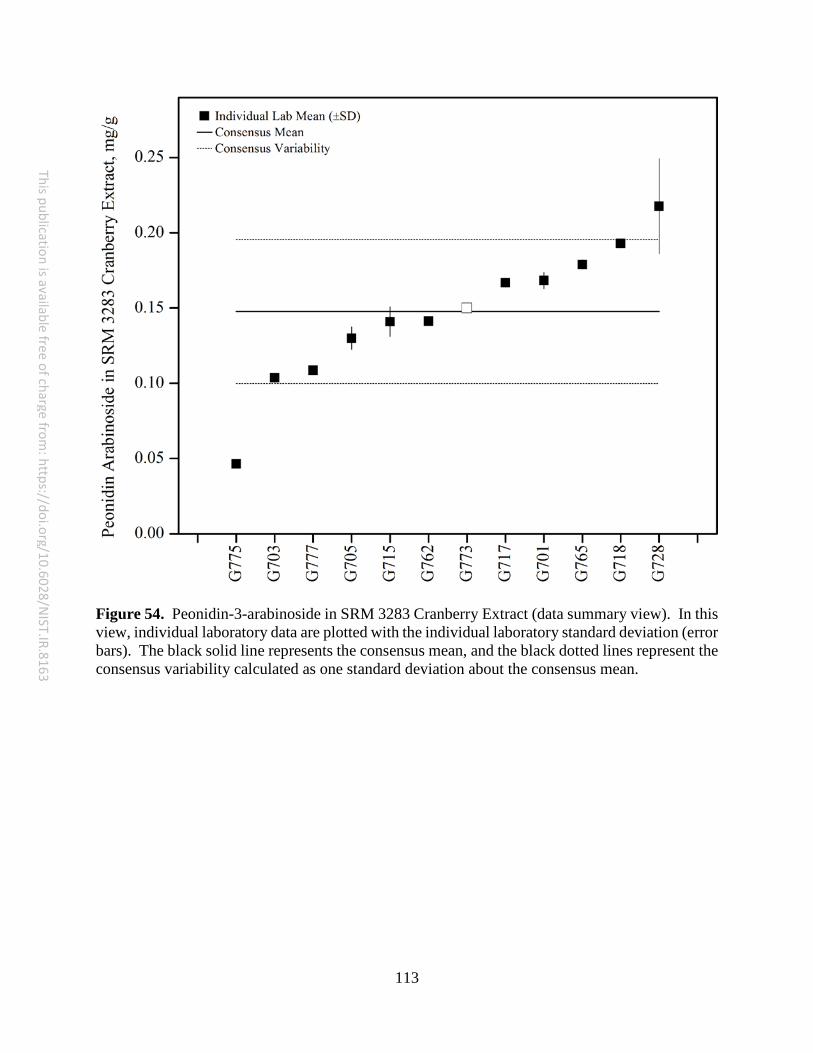
113
This publication is available free of charge from: https://doi.org/10.6028/N
IST.IR.8163
Figure 54. Peonidin-3-arabinoside in SRM 3283 Cranberry Extract (data summary view). In this view, individual laboratory data are plotted with the individual laboratory standard deviation (error bars). The black solid line represents the consensus mean, and the black dotted lines represent the consensus variability calculated as one standard deviation about the consensus mean.
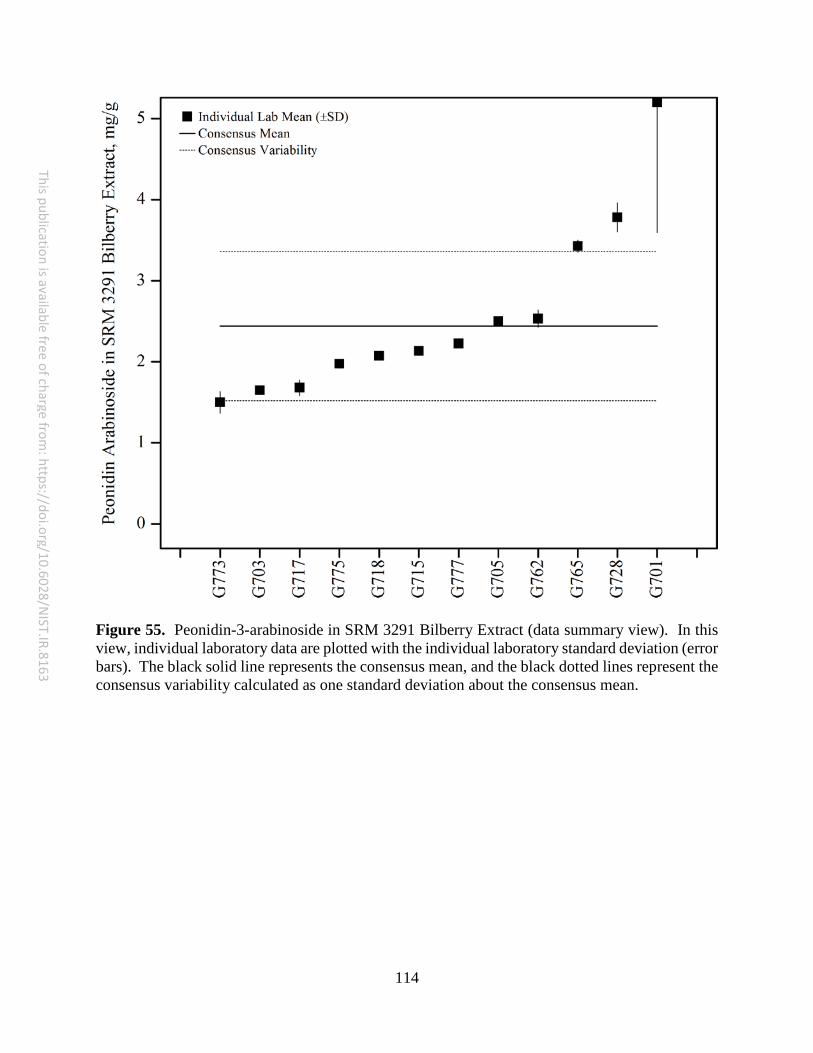
114
This publication is available free of charge from: https://doi.org/10.6028/N
IST.IR.8163
Figure 55. Peonidin-3-arabinoside in SRM 3291 Bilberry Extract (data summary view). In this view, individual laboratory data are plotted with the individual laboratory standard deviation (error bars). The black solid line represents the consensus mean, and the black dotted lines represent the consensus variability calculated as one standard deviation about the consensus mean.
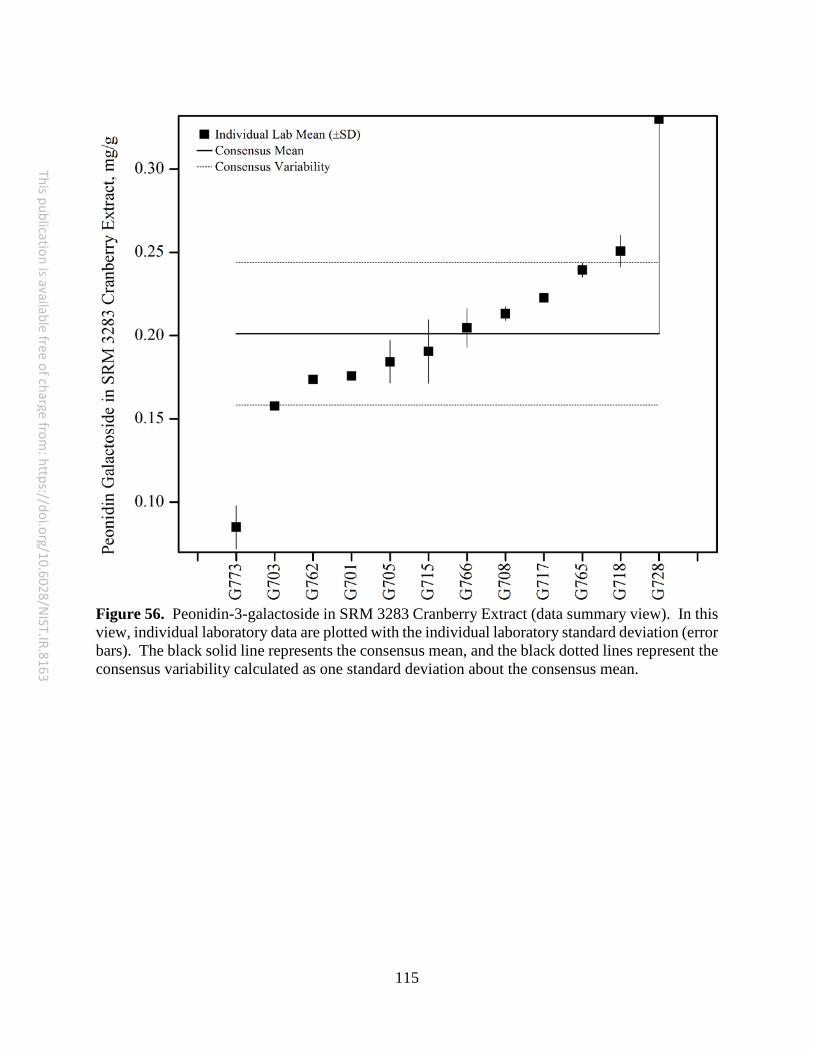
115
This publication is available free of charge from: https://doi.org/10.6028/N
IST.IR.8163
Figure 56. Peonidin-3-galactoside in SRM 3283 Cranberry Extract (data summary view). In this view, individual laboratory data are plotted with the individual laboratory standard deviation (error bars). The black solid line represents the consensus mean, and the black dotted lines represent the consensus variability calculated as one standard deviation about the consensus mean.

116
This publication is available free of charge from: https://doi.org/10.6028/N
IST.IR.8163
Figure 57. Peonidin-3-galactoside in SRM 3291 Bilberry Extract (data summary view). In this view, individual laboratory data are plotted with the individual laboratory standard deviation (error bars). The black solid line represents the consensus mean, and the black dotted lines represent the consensus variability calculated as one standard deviation about the consensus mean.

117
This publication is available free of charge from: https://doi.org/10.6028/N
IST.IR.8163
Figure 58. Peonidin-3-glucoside in SRM 3283 Cranberry Extract (data summary view). In this view, individual laboratory data are plotted with the individual laboratory standard deviation (error bars). The black solid line represents the consensus mean, and the black dotted lines represent the consensus variability calculated as one standard deviation about the consensus mean.
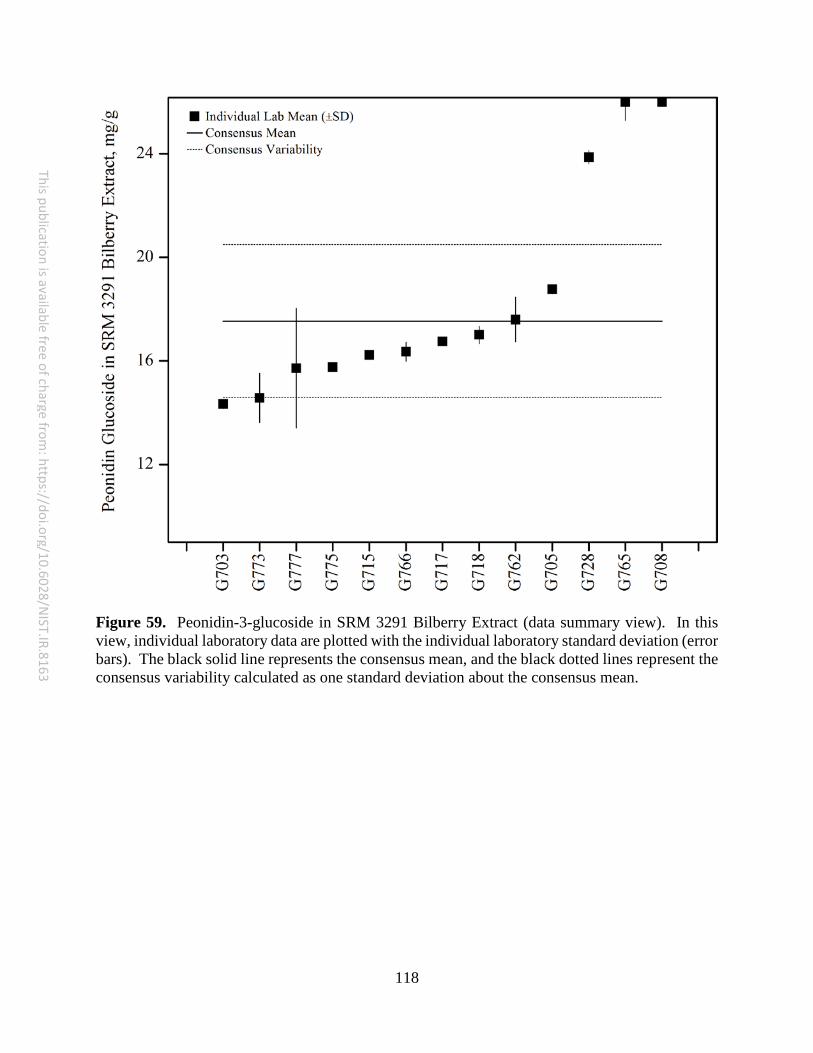
118
This publication is available free of charge from: https://doi.org/10.6028/N
IST.IR.8163
Figure 59. Peonidin-3-glucoside in SRM 3291 Bilberry Extract (data summary view). In this view, individual laboratory data are plotted with the individual laboratory standard deviation (error bars). The black solid line represents the consensus mean, and the black dotted lines represent the consensus variability calculated as one standard deviation about the consensus mean.

119
This publication is available free of charge from: https://doi.org/10.6028/N
IST.IR.8163
Figure 60. Peonidin equivalents in SRM 3283 Cranberry Extract (data summary view). In this view, individual laboratory data are plotted with the individual laboratory standard deviation (error bars). The black solid line represents the consensus mean, and the black dotted lines represent the consensus variability calculated as one standard deviation about the consensus mean.
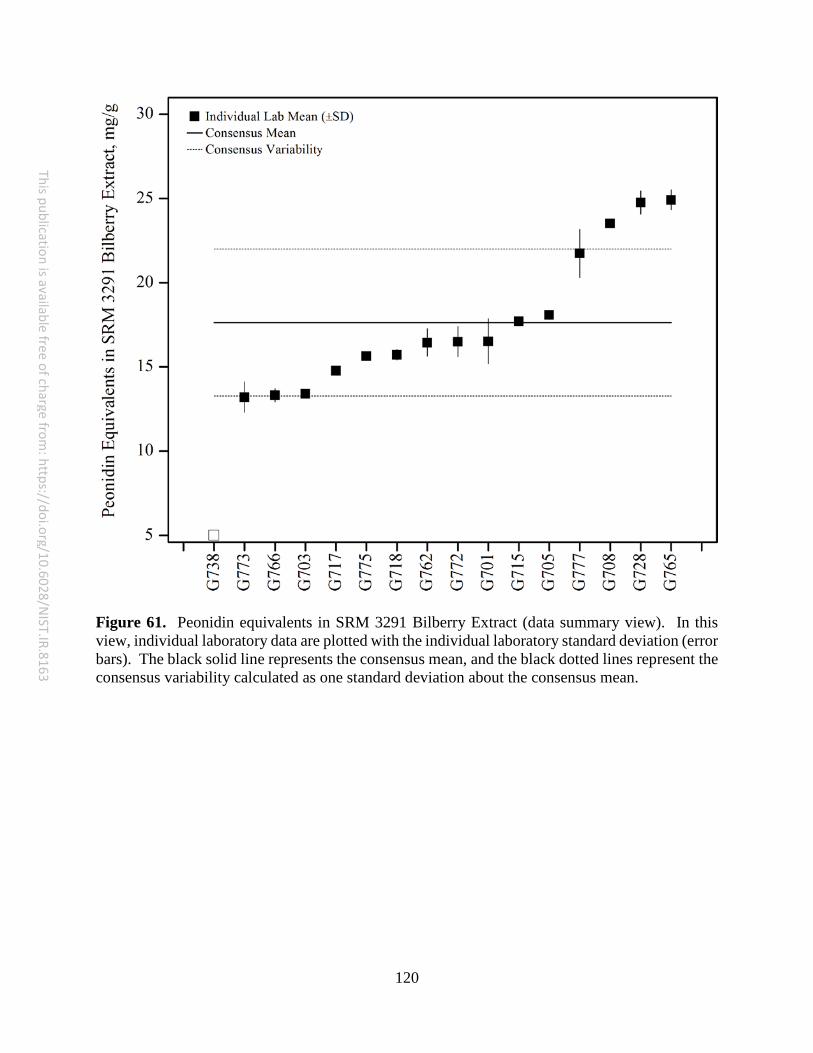
120
This publication is available free of charge from: https://doi.org/10.6028/N
IST.IR.8163
Figure 61. Peonidin equivalents in SRM 3291 Bilberry Extract (data summary view). In this view, individual laboratory data are plotted with the individual laboratory standard deviation (error bars). The black solid line represents the consensus mean, and the black dotted lines represent the consensus variability calculated as one standard deviation about the consensus mean.

121
This publication is available free of charge from: https://doi.org/10.6028/N
IST.IR.8163
Figure 62. Petunidin in SRM 3291 Bilberry Extract (data summary view). In this view, individual laboratory data are plotted with the individual laboratory standard deviation (error bars). The black solid line represents the consensus mean, and the black dotted lines represent the consensus variability calculated as one standard deviation about the consensus mean.

122
This publication is available free of charge from: https://doi.org/10.6028/N
IST.IR.8163
Figure 63. Petunidin-3-arabinoside in SRM 3291 Bilberry Extract (data summary view). In this view, individual laboratory data are plotted with the individual laboratory standard deviation (error bars). The black solid line represents the consensus mean, and the black dotted lines represent the consensus variability calculated as one standard deviation about the consensus mean.

123
This publication is available free of charge from: https://doi.org/10.6028/N
IST.IR.8163
Figure 64. Petunidin-3-galactoside in SRM 3291 Bilberry Extract (data summary view). In this view, individual laboratory data are plotted with the individual laboratory standard deviation (error bars). The black solid line represents the consensus mean, and the black dotted lines represent the consensus variability calculated as one standard deviation about the consensus mean.
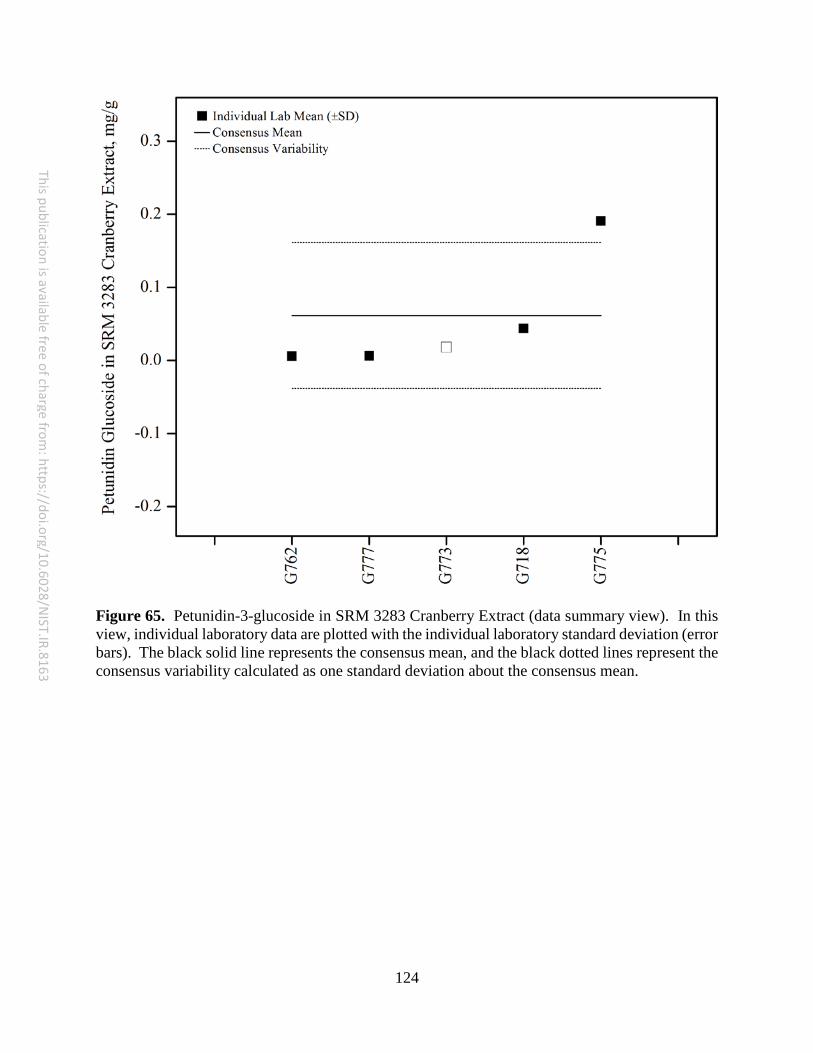
124
This publication is available free of charge from: https://doi.org/10.6028/N
IST.IR.8163
Figure 65. Petunidin-3-glucoside in SRM 3283 Cranberry Extract (data summary view). In this view, individual laboratory data are plotted with the individual laboratory standard deviation (error bars). The black solid line represents the consensus mean, and the black dotted lines represent the consensus variability calculated as one standard deviation about the consensus mean.

125
This publication is available free of charge from: https://doi.org/10.6028/N
IST.IR.8163
Figure 66. Petunidin-3-glucoside in SRM 3291 Bilberry Extract (data summary view). In this view, individual laboratory data are plotted with the individual laboratory standard deviation (error bars). The black solid line represents the consensus mean, and the black dotted lines represent the consensus variability calculated as one standard deviation about the consensus mean.

126
This publication is available free of charge from: https://doi.org/10.6028/N
IST.IR.8163
Figure 67. Petunidin equivalents in SRM 3283 Cranberry Extract (data summary view). In this view, individual laboratory data are plotted with the individual laboratory standard deviation (error bars). The black solid line represents the consensus mean, and the black dotted lines represent the consensus variability calculated as one standard deviation about the consensus mean.
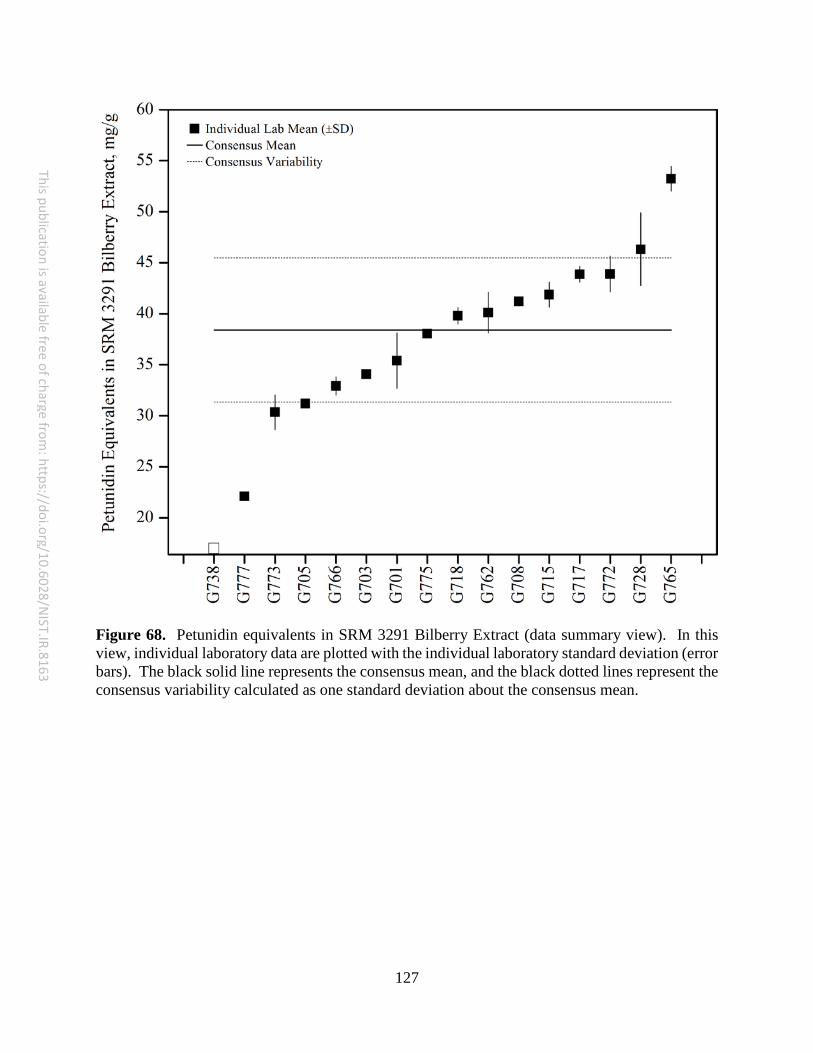
127
This publication is available free of charge from: https://doi.org/10.6028/N
IST.IR.8163
Figure 68. Petunidin equivalents in SRM 3291 Bilberry Extract (data summary view). In this view, individual laboratory data are plotted with the individual laboratory standard deviation (error bars). The black solid line represents the consensus mean, and the black dotted lines represent the consensus variability calculated as one standard deviation about the consensus mean.
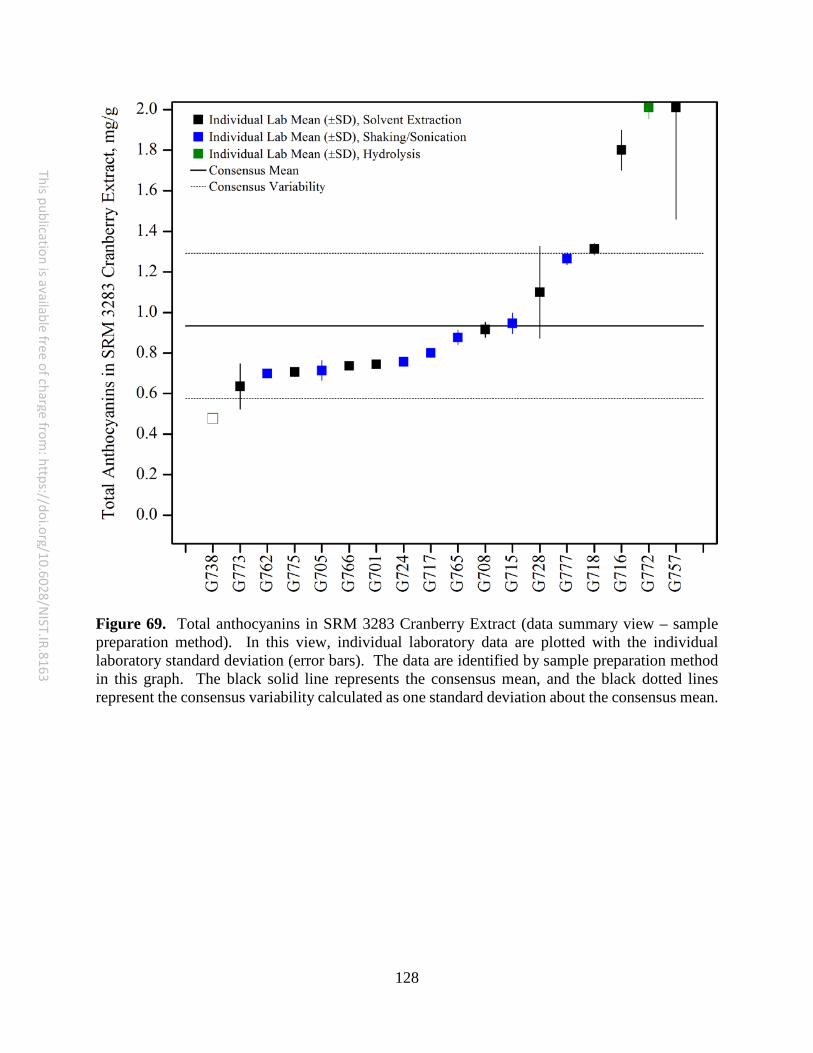
128
This publication is available free of charge from: https://doi.org/10.6028/N
IST.IR.8163
Figure 69. Total anthocyanins in SRM 3283 Cranberry Extract (data summary view – sample preparation method). In this view, individual laboratory data are plotted with the individual laboratory standard deviation (error bars). The data are identified by sample preparation method in this graph. The black solid line represents the consensus mean, and the black dotted lines represent the consensus variability calculated as one standard deviation about the consensus mean.
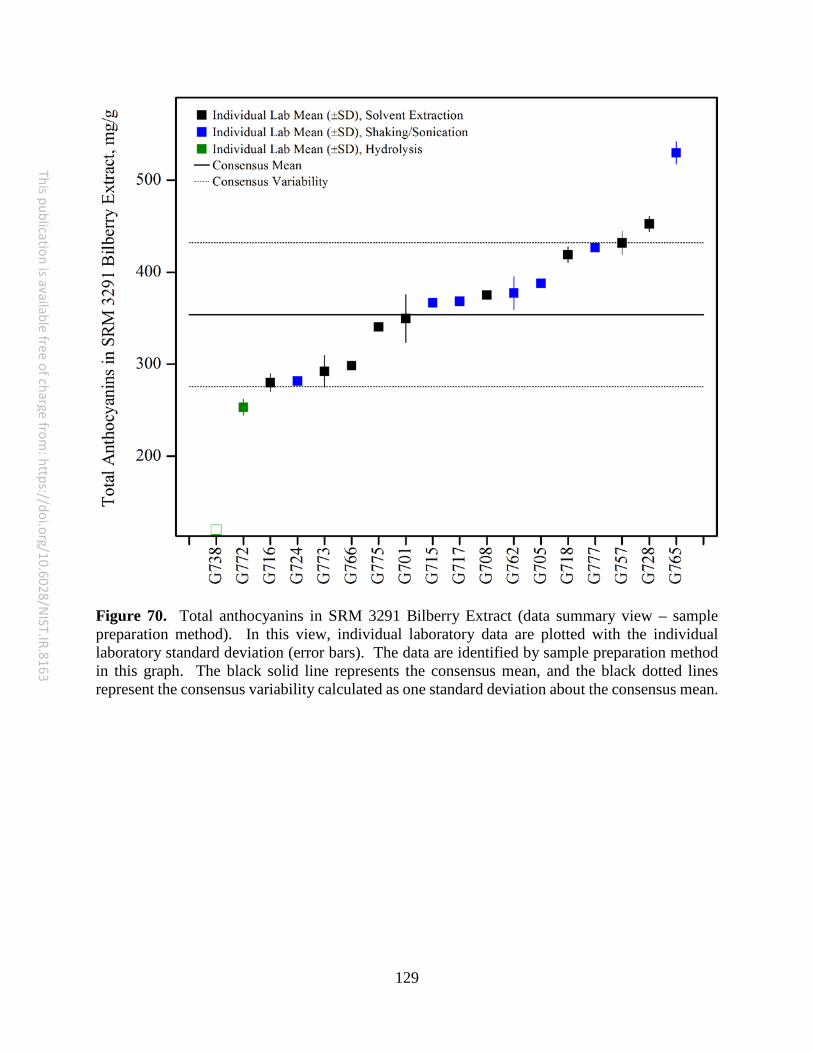
129
This publication is available free of charge from: https://doi.org/10.6028/N
IST.IR.8163
Figure 70. Total anthocyanins in SRM 3291 Bilberry Extract (data summary view – sample preparation method). In this view, individual laboratory data are plotted with the individual laboratory standard deviation (error bars). The data are identified by sample preparation method in this graph. The black solid line represents the consensus mean, and the black dotted lines represent the consensus variability calculated as one standard deviation about the consensus mean.
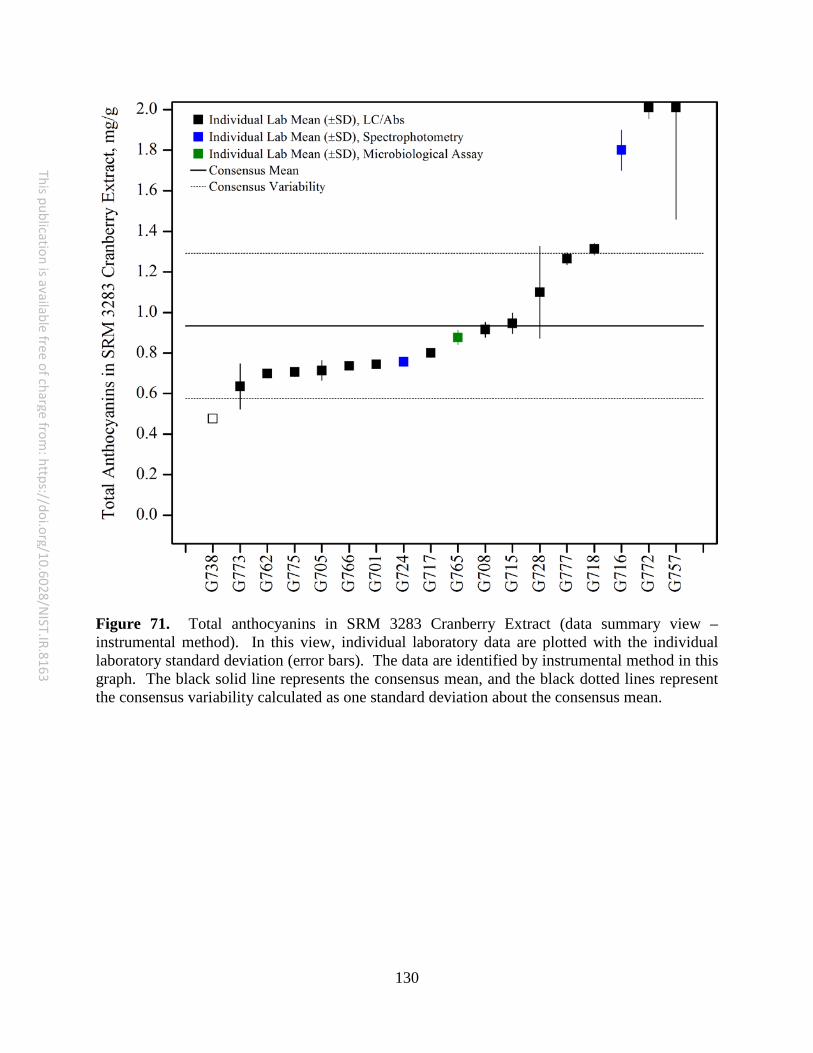
130
This publication is available free of charge from: https://doi.org/10.6028/N
IST.IR.8163
Figure 71. Total anthocyanins in SRM 3283 Cranberry Extract (data summary view – instrumental method). In this view, individual laboratory data are plotted with the individual laboratory standard deviation (error bars). The data are identified by instrumental method in this graph. The black solid line represents the consensus mean, and the black dotted lines represent the consensus variability calculated as one standard deviation about the consensus mean.
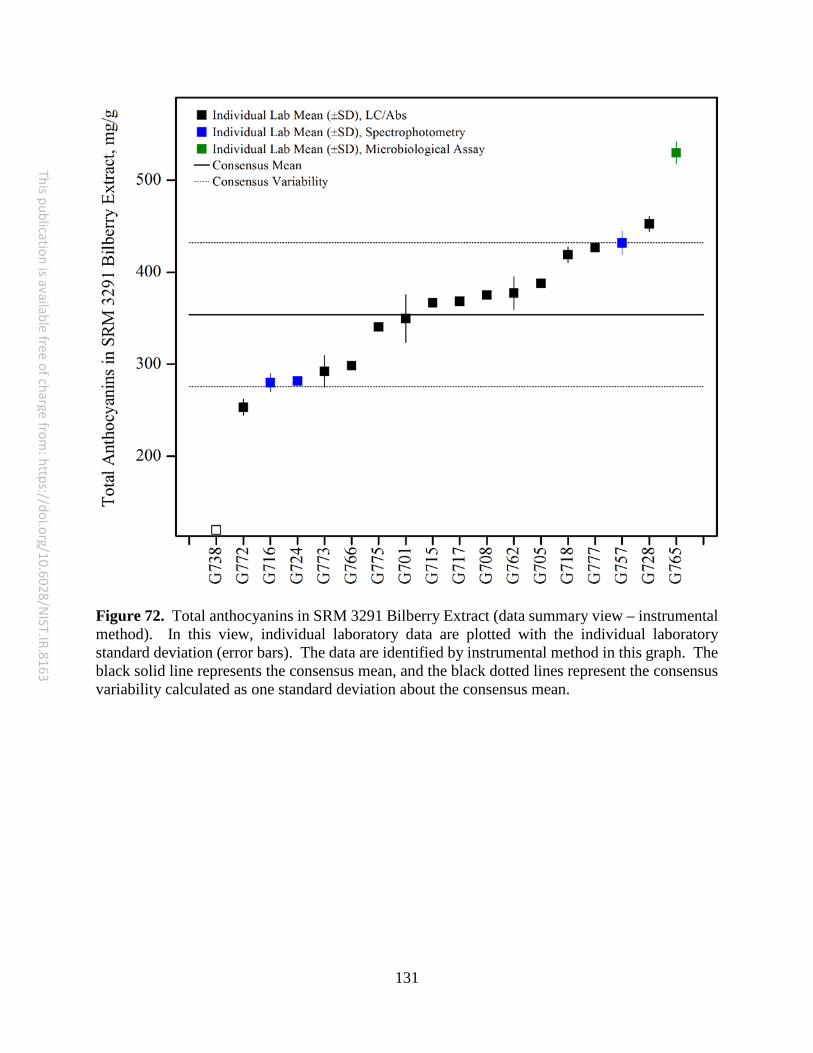
131
This publication is available free of charge from: https://doi.org/10.6028/N
IST.IR.8163
Figure 72. Total anthocyanins in SRM 3291 Bilberry Extract (data summary view – instrumental method). In this view, individual laboratory data are plotted with the individual laboratory standard deviation (error bars). The data are identified by instrumental method in this graph. The black solid line represents the consensus mean, and the black dotted lines represent the consensus variability calculated as one standard deviation about the consensus mean.
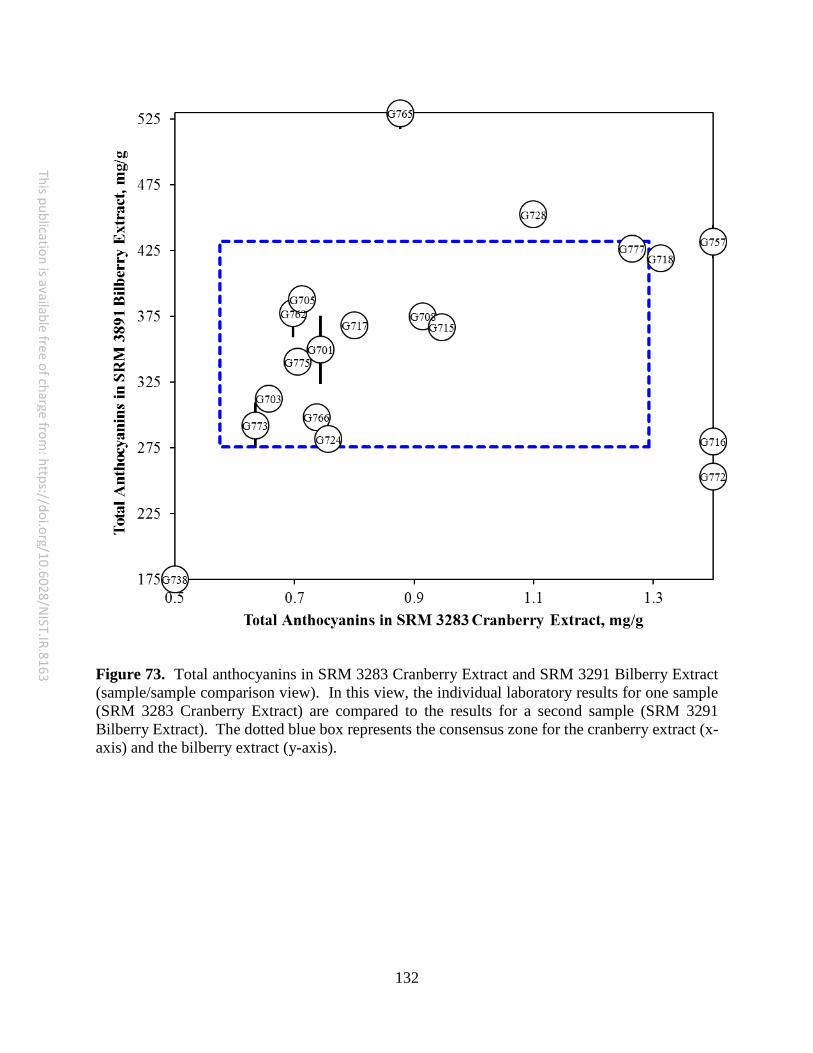
132
This publication is available free of charge from: https://doi.org/10.6028/N
IST.IR.8163
Figure 73. Total anthocyanins in SRM 3283 Cranberry Extract and SRM 3291 Bilberry Extract (sample/sample comparison view). In this view, the individual laboratory results for one sample (SRM 3283 Cranberry Extract) are compared to the results for a second sample (SRM 3291 Bilberry Extract). The dotted blue box represents the consensus zone for the cranberry extract (x-axis) and the bilberry extract (y-axis).