
Development of an Organotellurium Tag Compatible …...ii Development of an Organotellurium Tag...
101
Development of an Organotellurium Tag Compatible with Mass Cytometry to Probe Senescence-Associated β- Galactosidase Activity by Matthew A. Lumba A thesis submitted in conformity with the requirements for the degree of Master of Science Department of Chemistry University of Toronto © Copyright by Matthew Lumba 2015
Transcript of Development of an Organotellurium Tag Compatible …...ii Development of an Organotellurium Tag...
Development of an Organotellurium Tag Compatible with Mass Cytometry to Probe Senescence-Associated β-
Galactosidase Activity
by
Matthew A. Lumba
A thesis submitted in conformity with the requirements for the degree of Master of Science
Department of Chemistry University of Toronto
© Copyright by Matthew Lumba 2015
ii
Development of an Organotellurium Tag Compatible with Mass
Cytometry to Probe Senescence-Associated β-Galactosidase
Activity
Matthew A. Lumba
Master of Science
Department of Chemistry University of Toronto
2015
Abstract
Fluoresence-based flow cytometry has found great use in investigating biomarker
composition in cell samples. Its reliance on fluorophores, however, restricts the technology from
comfortably performing multiparametric experiments. Mass cytometry (MC) has emerged as an
alternative, capable of simultaneous quantification of multiple parameters over zero background.
However, the antibody-conjugated mass tags commonly used as probes can only detect presence
of analyte, and do not provide direct information regarding activity of enzyme targets. Therefore,
we developed an activity-based small molecule probe compatible with MC, with senescence-
associated β-galactosidase as a target and tellurium as the mass tag. The stabilities of various
organotellurium functionalities were compared to determine the most optimal candidate for
incorporation into probes compatible with MC, with the tellurophene exhibiting the best
characteristics. Various generations of the senescence probe were evaluated in vitro, with the
tellurophene-containing derivatives showing the most promise. Preliminary studies in senescent
cell culture have yielded encouraging results.
iii
Acknowledgments
I would be remiss if I told the story of my Master’s degree without acknowledging those
who helped shape me as a scientist, as a student, and as a person, for this work is theirs as much
as it is my own. I am surrounded by the best family, friends and mentors that a struggling student
could ask for, a group so supportive that I want to take all of you out for dumplings as a show of
my eternal gratitude. I wouldn’t be able to afford that on a graduate student’s salary, so here are a
few pages in my thesis.
Firstly, to Prof. Mark Nitz: you, along with Prof. Jik Chin and Dr. Andy Dicks were my
first instructors in organic chemistry. If it were anyone else, I doubt I would have been so
interested in the subject. Since my third year summer project, you have been supremely
supportive, knowledgeable and patient. It was a privilege to be able to work under your tutelage
for three years, so thank you for everything. I also express my gratitude to Prof. Deborah
Zamble, who gave me my first experience as a researcher out of second year, and inspired me to
continue on with biological chemistry.
To my mentors in the Nitz and Zamble Labs, Drs. Pengpeng Cao and Colin Douglas: you
are the best. You taught me all I needed to know about lab techniques and handled my
undergraduate incompetence with all the patience in the world. You were the best lab parents I
could ask for, and I am sorry I could not get our projects to work (metal-binding is hard!). I wish
you nothing but success in your post-doctoral lives—you have truly earned it.
To those who had a direct hand in my thesis, Dr. Lisa Willis, Landon Edgar and Hanuel
Park: without your expertise, this thesis would have been three times shorter. Lisa, your
knowledge of biology is unparalleled and your practical skills unmatched. Thank you for leading
me through the cell work and for all of your guidance. Landon and Hanuel, y’all are
organotellurium champs. You spoiled me with tellurophene, and helped me through the awkward
trifluoromethyl telluroether phase of my scientific maturation. Additional thanks to Landon and
Lisa for helping me with ICP-MS, and Prof. Xiao-An Zhang for reviewing my thesis. Hanuel, I
will miss our lunch runs to Pho Hung and your dismissal of my movie interests (Linklater’s
Before series is amazing). I wish you all the best in your Ph.D. and married life.
To the rest of the Nitz Lab, past and present: thank you for your guidance, discussions,

iv
trips to Mother’s Dumplings, and making my experience here so memorable. Nesrin, Ben, Yoshi
and Varvara, thanks for being so welcoming to me when I was a lowly undergrad. Rohan, Yedi
and Jason, your sage scientific advice was invaluable and abilities absolutely enviable. Adam,
Hunter, Mariam and Gabe, thanks for all your support in the tougher, waning days of my project.
Rishi, we were trapped in the department together since our summer in the Zamble Lab, and you
made the entire experience so much better. Thanks for everything, sorry for all of my inane
questions, and all the best in your future endeavours. Room 473, sorry (not really) for all the
Beyoncé and Drake. Thank you to the Zamble, Woolley and Winnik labs for discussions, and
staff Dr. Darcy Burns, Dmitry Pichugin, Giordana Riccitelli, Dr. Matt Forbes, and Ken Greaves
for all of their help with instrumentation and our chemical needs.
Along my journey, I have made a number of great friends outside of the lab whose
companionship and support helped me maintain my sanity and grow. To Giordana, Joe and
Kimia: you have provided me with nothing but support, laughs and lasting memories since
undergrad. I can only hope to be half the friend to you as you three are to me. Jon and Ari,
meeting you two was one of the best parts of grad school; you made the days go by so much
quicker. Kenny, Erik and Maz, I am lucky to have suffered with you guys in undergrad; suffering
never felt so fun.
Lastly, and most importantly, I would like to thank my family. It is because of their
unwavering belief in me that I have the privilege of writing this thesis. To my older sisters,
Shelley, Louise and Diana: how lucky was I to be raised by three extra mothers? Three
extraordinary people who have imbued in me a sense of confidence beyond my actual abilities.
The three smartest, happiest, most successful people I know, striving for their baby brother to
reach even higher heights. You three are the voices in my head, my personal therapists, my
inspiration. To my parents: you are my heroes. You uprooted your entire life in the Philippines
so that your daughters could have it all, and just as you were getting settled, I came along, and
you had to do it all over again. The fact you raised three amazing, intelligent, successful
daughters is a testament to your unconditional love and enduring support. Your perseverance and
work ethic are absolutely incredible and you inspire me day after day. I may sometimes act like
an unappreciative slob, but please know how truly grateful I am to have parents like you. I could
write a million more theses dedicated to the five of you, and it would still not be enough. Thank
you for everything.
v
Table of Contents
ACKNOWLEDGMENTS .......................................................................................................... III
TABLE OF CONTENTS ............................................................................................................ V
LIST OF TABLES .................................................................................................................... VII
LIST OF FIGURES ................................................................................................................. VIII
LIST OF SCHEMES .................................................................................................................. IX
LIST OF ABBREVIATIONS ..................................................................................................... X
1 INTRODUCTION .................................................................................................................. 1
1.1 BACKGROUND ..................................................................................................................... 1
1.2 MASS CYTOMETRY .............................................................................................................. 2
1.2.1 The arsenal of tools for mass cytometry ...................................................................... 4
1.3 SCOPE OF THESIS ................................................................................................................. 6
2 DEVELOPMENT OF A TRIFLUOROMETHYL TELLUROETHER SCAFFOLD
TOWARDS MORE STABLE SMALL MOLECULE PROBES COMPATIBLE WITH
MASS CYTOMETRY .................................................................................................................. 7
2.1 INTRODUCTION .................................................................................................................... 7
2.2 EXPERIMENTAL ................................................................................................................... 8
2.2.1 Instrumentation ............................................................................................................ 8
2.2.2 Materials ...................................................................................................................... 9
2.2.3 Synthesis ...................................................................................................................... 9
2.2.4 Stability testing .......................................................................................................... 10
2.2.5 Toxicity study ............................................................................................................. 11
2.3 RESULTS AND DISCUSSION ................................................................................................ 12
2.3.1 Design and synthesis of trifluoromethyl telluroether scaffold ................................... 12
2.3.2 Stability assessments of tellurium-containing functionalities .................................... 15
2.3.3 Toxicity assessments of tellurium-containing functionalities .................................... 19
2.4 SUMMARY ......................................................................................................................... 19
2.5 CONTENTS OF APPENDIX TO CHAPTER 2 ........................................................................... 20
vi
3 DEVELOPMENT AND TESTING OF AN ORGANOTELLURIUM ACTIVITY-
BASED MASS TAG TO PROBE SENESCENCE-ASSOCIATED Β-GALACTOSIDASE 21
3.1 INTRODUCTION .................................................................................................................. 21
3.1.1 Cellular senescence ................................................................................................... 21
3.1.2 Senescence markers ................................................................................................... 22
3.1.3 A MC-compatible probe for senescence-associated β-galactosidase ....................... 24
3.2 EXPERIMENTAL ................................................................................................................. 25
3.2.1 Instrumentation .......................................................................................................... 25
3.2.2 Materials .................................................................................................................... 26
3.2.3 Cell culture ................................................................................................................ 26
3.2.4 Synthesis .................................................................................................................... 26
3.2.5 Kinetic/inhibition assays ............................................................................................ 39
3.2.6 ICP-MS assays ........................................................................................................... 39
3.2.7 Stability studies .......................................................................................................... 39
3.2.8 HPLC analysis ........................................................................................................... 40
3.2.9 RPE studies ................................................................................................................ 40
3.3 RESULTS AND DISCUSSION ................................................................................................ 41
3.3.1 Synthesis and evaluation of first-generation SA-βgal probes .................................... 41
3.3.2 Synthesis and evaluation of a second-generation SA-βgal probe ............................. 51
3.3.3 Synthesis and preliminary evaluation of next-generation SA-βgal probes ............... 59
3.4 SUMMARY ......................................................................................................................... 63
3.5 CONTENTS OF APPENDIX TO CHAPTER 3 ............................................................................ 63
4 SUMMARY AND FUTURE DIRECTIONS ...................................................................... 64
4.1 SUMMARY ......................................................................................................................... 64
4.2 FUTURE DIRECTIONS ......................................................................................................... 64
APPENDIX I ............................................................................................................................... 66
APPENDIX II: NMR SPECTRA OF SYNTHETIC TARGETS ........................................... 69
REFERENCES ............................................................................................................................ 87

vii
List of Tables
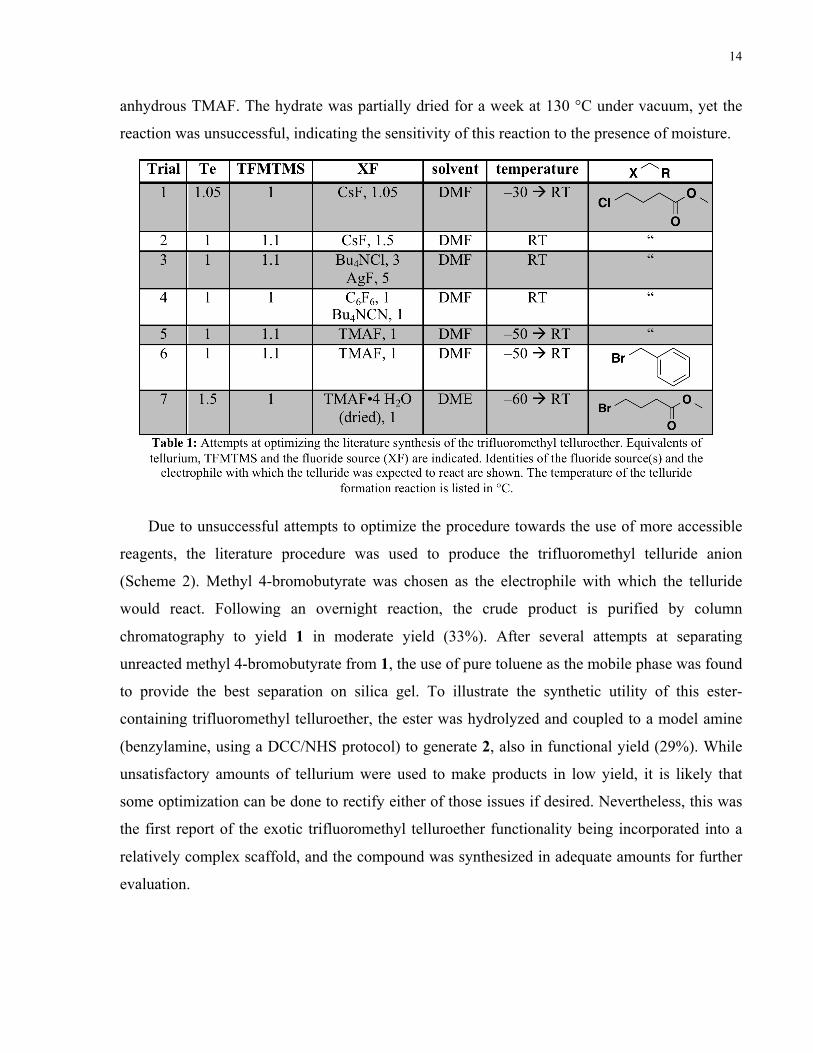
TABLE 1: CONDITIONS ATTEMPTED TOWARDS THE SYNTHESIS OF THE TRIFLUOROMETHYL
TELLUROETHER SCAFFOLD ..................................................................................................... 14
viii
List of Figures
FIGURE 1: SCHEMATIC OF MASS CYTOMETRY .................................................................................. 3
FIGURE 2: TOOLS COMPATIBLE WITH MC ........................................................................................ 5
FIGURE 3: ORGANOTELLURIUM FUNCTIONALITIES FOR MC-COMPATIBLE SCAFFOLDS ..................... 8
FIGURE 4: 1H-NMR STABILITY STUDY OF METHYL ESTER-CONTAINING TELLURIUM COMPOUNDS...
............................................................................................................................................... 17
FIGURE 5: 1H-NMR STABILITY STUDY OF BENZYL AMIDE-CONTAINING TELLURIUM COMPOUNDS...
............................................................................................................................................... 18
FIGURE 6: AQUEOUS STABILITY STUDY OF TELLURIUM COMPOUNDS ............................................. 18
FIGURE 7: CELL VIABILITY OF JURKAT CELLS WHEN TREATED WITH TELLURIUM COMPOUNDS ...... 19
FIGURE 8: STAINING OF SENESCENT CELLS WITH X-GAL ................................................................ 24
FIGURE 9: ABSORBANCE CURVES ILLUSTRATING ONPG HYDROLYSIS BY E. COLI Β-GAL IN THE
PRESENCE OF 16 ..................................................................................................................... 44
FIGURE 10: LINEWEAVER-BURK PLOT FOR INHIBITION OF Β-GALACTOSIDASE BY 16 ..................... 44
FIGURE 11: ICP-MS ANALYSIS OF REACTION BETWEEN 14 AND E. COLI Β-GALACTOSIDASE .......... 46
FIGURE 12: ICP-MS ANALYSIS OF REACTIONS BETWEEN 16 AND E. COLI Β-GALACTOSIDASE ........ 47
FIGURE 13: 1H NMR SPECTRA FROM STABILITY STUDY OF 16 (ROOM TEMPERATURE) ................... 49
FIGURE 14: 1H NMR SPECTRA FROM STABILITY STUDY OF 16 (37 °C) ........................................... 50
FIGURE 15: 1H NMR STABILITY PLOT FOR 16 ................................................................................. 50
FIGURE 16: 1H NMR SPECTRA FROM STABILITY STUDY OF 18 (ROOM TEMPERATURE) ................... 52
FIGURE 17: 1H NMR SPECTRA FROM STABILITY STUDY OF 18 (37 °C) ........................................... 53
FIGURE 18: 1H NMR STABILITY PLOT FOR 18 ................................................................................ 53
FIGURE 19: ABSORBANCE CURVES ILLUSTRATING ONPG HYDROLYSIS BY E. COLI Β-GAL IN THE
PRESENCE OF 18 ..................................................................................................................... 55
FIGURE 20: INITIAL RATE OF ONPG HYDROLYSIS BY E. COLI Β-GAL IN THE PRESENCE OF 18 ........ 55
FIGURE 21: HPLC TRACE OF REACTION BETWEEN GALTE 18 AND E. COLI Β-GAL ......................... 57
FIGURE 22: TREATMENT AND ICP-MS ANALYSIS OF RPE CELLS WITH GALTE 18 ......................... 59
FIGURE 23: ABSORBANCE CURVES ILLUSTRATING ONPG HYDROLYSIS BY E. COLI Β-GAL IN THE
PRESENCE OF 29 ..................................................................................................................... 62
FIGURE 24: INITIAL RATE OF ONPG HYDROLYSIS BY E. COLI Β-GAL IN THE PRESENCE OF 29 ........ 63
ix
List of Schemes
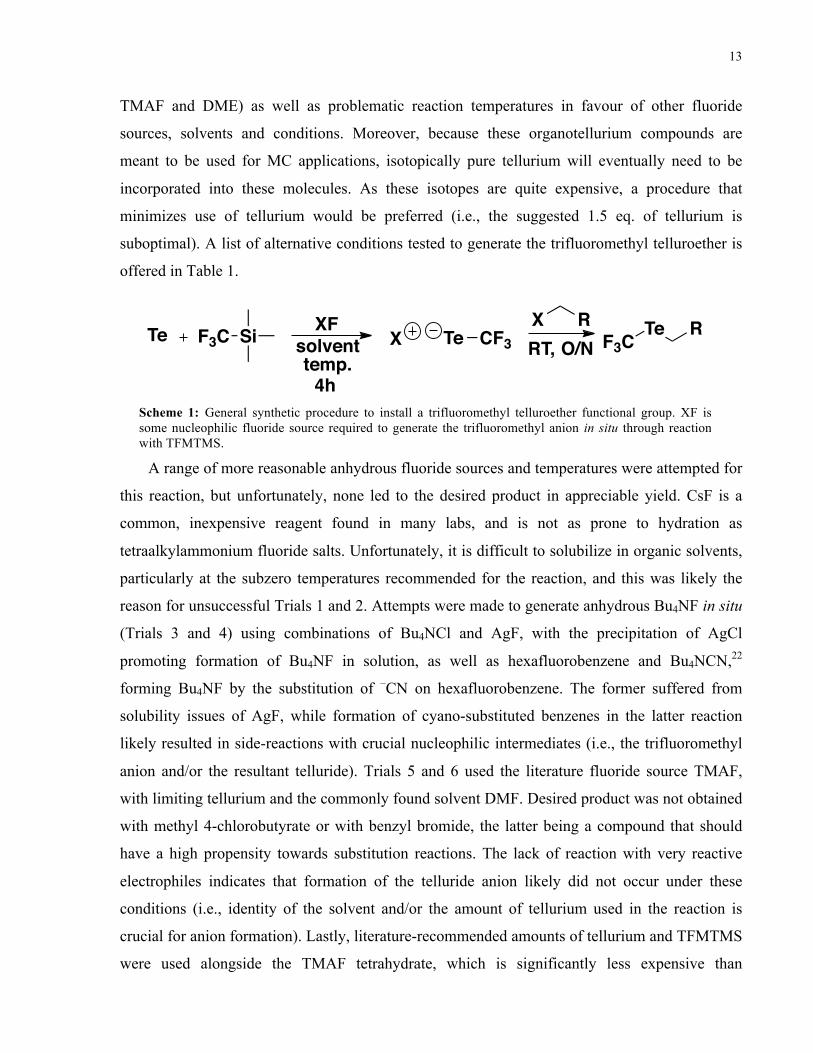
SCHEME 1: GENERAL SYNTHETIC PROCEDURE TO INSTALL A TRIFLUOROMETHYL TELLUROETHER
FUNCTIONAL GROUP ............................................................................................................... 13
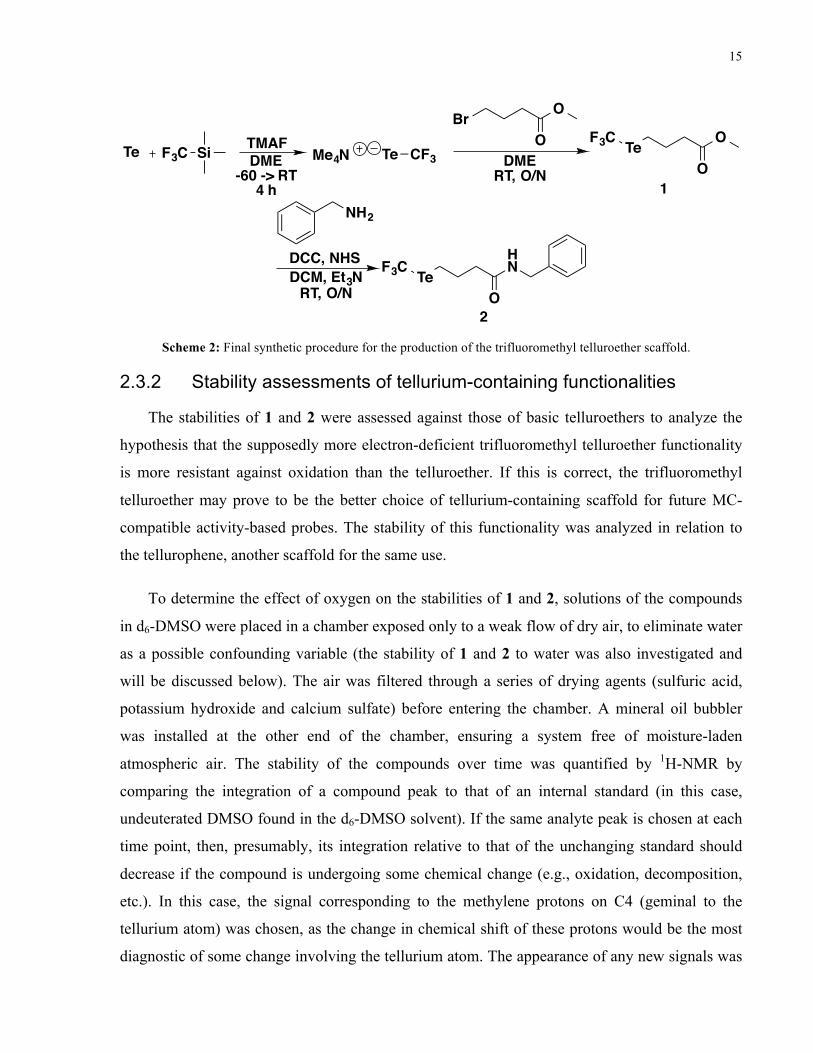
SCHEME 2: FINAL SYNTHETIC PROCEDURE FOR THE PRODUCTION OF THE TRIFLUOROMETHYL
TELLUROETHER SCAFFOLD. .................................................................................................... 15
SCHEME 3: DETECTION OF Β-GALACTOSIDASE ACTIVITY WITH THE SUBSTRATE X-GAL. ................ 24
SCHEME 4: DETECTING SA-ΒGAL IN SENESCENT CELLS WITH A TELLURIUM-CONTAINING ABP .... 25
SCHEME 5: SYNTHESIS OF FIRST-GENERATION GALTE ................................................................... 42
SCHEME 6: SYNTHESIS OF SECOND-GENERATION GALTE 18.. ........................................................ 51
SCHEME 7: PROPOSED MECHANISM FOR FORMATION OF THE ALDEHYDE BYPRODUCT ................... 57
SCHEME 8: PROPOSED MECHANISM OF TAGGING FOR A MONOFLUOROMETHYL ARYL ABP ........... 60
SCHEME 9: SYNTHESIS OF NEXT GENERATION GALTE ................................................................... 61
x
List of Abbreviations
ABP activity-based probe
AfBP affinity-based probe
Cbz carboxybenzyl
DART-MS direct analysis in real time mass spectrometry
DAST diethylaminosulfur trifluoride
DCC N,N’-dicyclohexylcarbodiimide
DCM dichloromethane
DME dimethoxyethane
DOTA 1,4,7,10-tetraazacyclododecane-1,4,7,10-tetraacetic acid
DTPA diethylene triamine pentaacetic acid
ESI-MS electrospray ionization mass spectrometry
FBS fetal bovine serum
FC flow cytometry
h hour
HEPES 4-(2-hydroxyethyl)-1-piperazineethanesulfonic acid
HPLC high-performance liquid chromatography
IC50 half maximal inhibitory concentration
ICP-MS inductively coupled plasma mass spectrometry
IPTG isopropyl-β-D-1-thiogalactopyranoside
MALDI-MS matrix-assisted laser desorption/ionization mass spectrometry
MC mass cytometry
MCP metal-chelating polymer
methyl DAST dimethylaminosulfur trifluoride
MOPS 3-(N-morpholino)propanesulfonic acid
NHS N-hydroxysuccinimide
NSB non-specific binding
ONPG ortho-nitrophenyl-β-galactoside
PBS phosphate buffered saline
PFC polychromatic flow cytometry
pNP- para-nitrophenyl-
xi
RPE retinal pigment epithelium cells
RT room temperature
SA-βgal senescence-associated β-galactosidase
t1/2 half-life
T3P propylphosphonic anhydride
TBAB tetrabutylammonium bromide
TCEP tris(2-carboxyethyl)phosphine
TFA trifluoroacetic acid
TFMTMS trifluoromethyltrimethylsilane
THF tetrahydrofuran
TMAF tetramethylammonium fluoride
TOF time-of-flight
Tris tris(hydroxymethyl)aminomethane
X-gal 5-bromo-4-chloro-3-indoyl β-D-galactopyranoside
1
1 Introduction
1.1 Background
A thorough understanding of the biology of tissues necessitates a complete analysis of the
individual cells that comprise that tissue. Phenotypic changes at the single-cell level, caused by
external agents or conditions, as well as by innate mutations, can have drastic effects on the
health of a tissue and, ultimately, that of a patient. The identification and study of these
perturbations, however, can become quite complex, as multiple biological parameters can
simultaneously and conjunctively amount to a particular cellular phenotype. Moreover, these
phenotypes differ on a cell-to-cell basis, yielding heterogeneous cell populations and thereby
adding another layer of complexity towards the complete analysis of cell or tissue samples.
Therefore, it is clear that sophisticated, yet accessible and efficient technologies, capable of
multiparametric and high-throughput cellular analysis, are required to further enrich the
understanding of disease states and cell biology as a whole.
The traditional method for this analysis is fluorescence-based flow cytometry (FC), a
technique widely used throughout research and clinical settings.1 In this method, an individual
cellular target is tagged with a fluorophore (proteins are typically tagged by an antibody-
conjugated dye, nucleic acids by an intercalating dye) and the stained cells are passed single-file
through a laser for fluorophore excitation. Light emitted from the dye is detected by
photomultiplier tubes, and the signal is digitized for analysis by a computer program.2
Advancements in the technology have allowed for the simultaneous measurement of multiple
parameters, a method termed polychromatic flow cytometry (PFC). Targets of interest are tagged
with dyes specific to each target, and the emissions of the dyes are measured at once, per cell.
The application of PFC has been crucial in numerous studies, such as the identification and
characterization of T-cells,3,4 drug screening and signaling profiling of immune cells,5 and
diagnosis and typing of leukemia and lymphoma in the clinic.6 With improvements in laser and
fluorophore technologies, as well as in optics design and computing software, technologies to
measure as many as 17 fluorophores simultaneously have been developed.7,8
While PFC is a powerful technology, its drawbacks are well documented. With respect to
multiparametric experiments, by design, any technique based on fluorescence will be limited by
2
the spectral overlap of the fluorophores used to tag the cellular markers. As such, the practical
limit of this technology remains at a dozen parameters at once, since more complex experiments
require specialized personnel to design the antibody-fluorophore panel and to resolve the
overlapping spectral data.8–10 Further, the use of fluorescence as a detection method for PFC
brings with it the issue of sensitivity. Background fluorescence due to spectral overlap and
autofluorescence of the cell at certain wavelengths can significantly confound measurements,
thus reducing sensitivity, and can lead to more difficult panel design.7 Therefore, a tool to
complement PFC, which can easily work around both drawbacks of spectral overlap and
background fluorescence, would surely find great use in the increasingly complex experiments
demanded by cell biology.
1.2 Mass cytometry
Mass cytometry (MC), marketed as CyTOF, is a relatively new technology that offers
single-cell analysis akin to FC, but essentially without the aforementioned issues of spectral
overlap and background fluorescence. Instead of being stained with antibody-conjugated
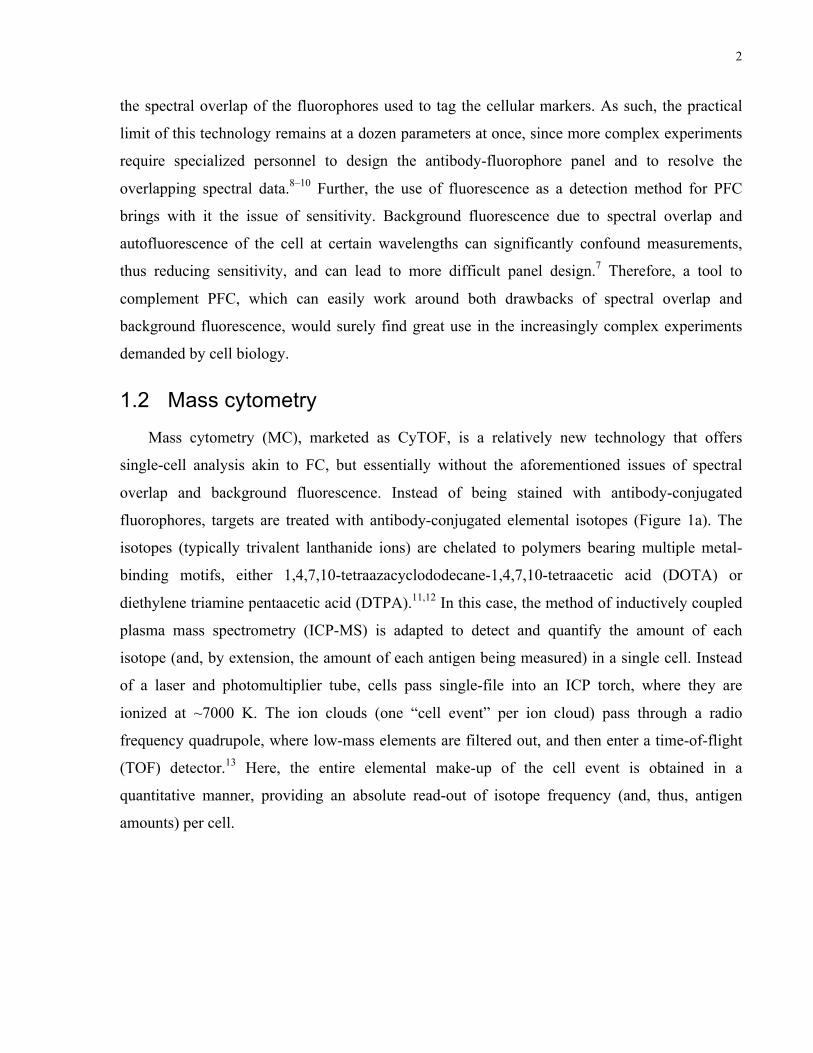
fluorophores, targets are treated with antibody-conjugated elemental isotopes (Figure 1a). The
isotopes (typically trivalent lanthanide ions) are chelated to polymers bearing multiple metal-
binding motifs, either 1,4,7,10-tetraazacyclododecane-1,4,7,10-tetraacetic acid (DOTA) or
diethylene triamine pentaacetic acid (DTPA).11,12 In this case, the method of inductively coupled
plasma mass spectrometry (ICP-MS) is adapted to detect and quantify the amount of each
isotope (and, by extension, the amount of each antigen being measured) in a single cell. Instead
of a laser and photomultiplier tube, cells pass single-file into an ICP torch, where they are
ionized at ~7000 K. The ion clouds (one “cell event” per ion cloud) pass through a radio
frequency quadrupole, where low-mass elements are filtered out, and then enter a time-of-flight
(TOF) detector.13 Here, the entire elemental make-up of the cell event is obtained in a
quantitative manner, providing an absolute read-out of isotope frequency (and, thus, antigen
amounts) per cell.
3
!earth metals are used as reporters. By exploiting theresolution, sensitivity and dynamic range of mass spec-trometry on a time-scale that allows the measurement of1000 individual cells per second, this configuration offers anew approach to high-content cytometric analysis.
Elemental mass spectrometryInductively coupled plasma mass spectrometry (ICP-MS)is the most advanced and sensitive means of determiningthe elemental composition of materials [30]. Classically, ithas been used for ultra-trace (10–15 g/ml) detection ofmetals and other elements in both environmental (water,soil and air) and clinical (blood and urine) samples. Thecentral component of this system is a high-temperatureplasma (!7000 K), which vaporizes the sample, breaks allmolecular bonds, and strips one electron from each atom.This creates a cloud of elemental ions, from which therelative abundance of isotopes can be determined. Theability to detect and quantify trace levels of multiple,nonbiologic elements from complex matrices makes ICP-MS an ideal detection tool for biological studies [31–38].
Mass cytometryMass cytometry is the adaptation of ICP-MS to single-cellanalysis [39], based on the concept that a purified singleisotope could be used to tag antibodies, and that theseconjugates could be quantified in an ICP-MS detectionsystem. Mass cytometry has essentially the same workflowas conventional flow cytometry (Figure 2). Cells are stainedwith target-specific antibodies labeled with metal isotopes
(typically lanthanide metals) [37,40]; these are the sameantibody clones used in conventional cytometry. Cells arealso stained with rhodium- or iridium-conjugated DNAintercalators, providing a baseline for detection and infor-mation about DNA content [33]. The use of differentialintercalator staining [36] as well as chemical labeling withchelated metals [41,42] provides a viability measure. In theinstrument, stained cells are nebulized into single-celldroplets and introduced into the plasma. The resultingcharged atomic ion clouds are immediately transferredinto the high vacuum of the mass spectrometer.
All cellular material is ionized, therefore, atomic ionsare produced from elements common in cells (such ascarbon, nitrogen and oxygen), along with ions from theargon plasma itself. To resolve the probe ions (e.g. lantha-nides) from these overly abundant ions, the mass cyt-ometer is configured as a quadrupole-time-of-flight(qTOF) instrument [30]. The quadrupole acts as a filterallowing only the heavier elemental ions, which consistprimarily of the reporter masses, to be quantitated by TOFmass analysis.
For a typical cell, the ion cloud has a lifetime of !300 msover which it is measured (scanned) 20–30 times by TOF-mass spectrometry. This lifetime precludes analysis of>1000 cells/s, as single cells cannot be resolved beyondthis rate. At lower rates, the system is remarkably robust;there is little measurable signal (background) betweencells, as the elemental reporters used are uncommon ina biological context or within the laboratory environment.The amount of each isotopic reporter is quantified for the
Antibodieslabeled with
elemental isotopes
ICP
.FCS file
Mass
Cell 3
Cell 2
Cell 1Integrate-per-cell
Light (<100 Da)Overly abundant ions
Heavy (>100 Da)Reporter atomic ions
Analysis
Ele
men
t A
Element B
Nebulizer
Quadrupole
Time-of-flight
TRENDS in Immunology
Figure 2. Mass cytometry allows single-cell atomic mass spectrometry of heavy elemental (>100 Da) reporters. Schematic of ICP-MS-based analysis of cellular markers. Anaffinity product (e.g. antibody) tagged with a specific element binds to the cellular epitope. The cell is introduced into the ICP by droplet nebulization. Each cell is atomized,ionized, overly abundant ions removed, and the elemental composition of remaining heavy elements (reporters) is determined. Signals corresponding to each elementaltag are then correlated with the presence of the respective marker and analyzed using conventional cytometry platforms.
Review Trends in Immunology July 2012, Vol. 33, No. 7
325
Figure 1: Schematic of mass cytometry.9 The cell is stained with MaxPar® reagents (antibodies labelled with metal-chelating polymers) specific for various parameters in the cell. Then, cells are nebulized and ionized by the inductively coupled plasma torch. After a quadrupole removes light ions (less than 100 Da), ion clouds (cell events) enter a time-of-flight detector, and the resultant data per cell is packaged.
isotope-labeledantibodies
nebulize single cell droplets
ICP!
!earth metals are used as reporters. By exploiting theresolution, sensitivity and dynamic range of mass spec-trometry on a time-scale that allows the measurement of1000 individual cells per second, this configuration offers anew approach to high-content cytometric analysis.
Elemental mass spectrometryInductively coupled plasma mass spectrometry (ICP-MS)is the most advanced and sensitive means of determiningthe elemental composition of materials [30]. Classically, ithas been used for ultra-trace (10–15 g/ml) detection ofmetals and other elements in both environmental (water,soil and air) and clinical (blood and urine) samples. Thecentral component of this system is a high-temperatureplasma (!7000 K), which vaporizes the sample, breaks allmolecular bonds, and strips one electron from each atom.This creates a cloud of elemental ions, from which therelative abundance of isotopes can be determined. Theability to detect and quantify trace levels of multiple,nonbiologic elements from complex matrices makes ICP-MS an ideal detection tool for biological studies [31–38].
Mass cytometryMass cytometry is the adaptation of ICP-MS to single-cellanalysis [39], based on the concept that a purified singleisotope could be used to tag antibodies, and that theseconjugates could be quantified in an ICP-MS detectionsystem. Mass cytometry has essentially the same workflowas conventional flow cytometry (Figure 2). Cells are stainedwith target-specific antibodies labeled with metal isotopes
(typically lanthanide metals) [37,40]; these are the sameantibody clones used in conventional cytometry. Cells arealso stained with rhodium- or iridium-conjugated DNAintercalators, providing a baseline for detection and infor-mation about DNA content [33]. The use of differentialintercalator staining [36] as well as chemical labeling withchelated metals [41,42] provides a viability measure. In theinstrument, stained cells are nebulized into single-celldroplets and introduced into the plasma. The resultingcharged atomic ion clouds are immediately transferredinto the high vacuum of the mass spectrometer.
All cellular material is ionized, therefore, atomic ionsare produced from elements common in cells (such ascarbon, nitrogen and oxygen), along with ions from theargon plasma itself. To resolve the probe ions (e.g. lantha-nides) from these overly abundant ions, the mass cyt-ometer is configured as a quadrupole-time-of-flight(qTOF) instrument [30]. The quadrupole acts as a filterallowing only the heavier elemental ions, which consistprimarily of the reporter masses, to be quantitated by TOFmass analysis.
For a typical cell, the ion cloud has a lifetime of !300 msover which it is measured (scanned) 20–30 times by TOF-mass spectrometry. This lifetime precludes analysis of>1000 cells/s, as single cells cannot be resolved beyondthis rate. At lower rates, the system is remarkably robust;there is little measurable signal (background) betweencells, as the elemental reporters used are uncommon ina biological context or within the laboratory environment.The amount of each isotopic reporter is quantified for the
Antibodieslabeled with
elemental isotopes
ICP
.FCS file
Mass
Cell 3
Cell 2
Cell 1Integrate-per-cell
Light (<100 Da)Overly abundant ions
Heavy (>100 Da)Reporter atomic ions
Analysis
Ele
men
t A
Element B
Nebulizer
Quadrupole
Time-of-flight
TRENDS in Immunology
Figure 2. Mass cytometry allows single-cell atomic mass spectrometry of heavy elemental (>100 Da) reporters. Schematic of ICP-MS-based analysis of cellular markers. Anaffinity product (e.g. antibody) tagged with a specific element binds to the cellular epitope. The cell is introduced into the ICP by droplet nebulization. Each cell is atomized,ionized, overly abundant ions removed, and the elemental composition of remaining heavy elements (reporters) is determined. Signals corresponding to each elementaltag are then correlated with the presence of the respective marker and analyzed using conventional cytometry platforms.
Review Trends in Immunology July 2012, Vol. 33, No. 7
325
Figure 1: Schematic of mass cytometry.9 The cell is stained with MaxPar® reagents (antibodies labelled with metal-chelating polymers) specific for various parameters in the cell. Then, cells are nebulized and ionized by the inductively coupled plasma torch. After a quadrupole removes light ions (less than 100 Da), ion clouds (cell events) enter a time-of-flight detector, and the resultant data per cell is packaged.
quadrupole!
TOF!cell 1!
cell 2!
!earth metals are used as reporters. By exploiting theresolution, sensitivity and dynamic range of mass spec-trometry on a time-scale that allows the measurement of1000 individual cells per second, this configuration offers anew approach to high-content cytometric analysis.
Elemental mass spectrometryInductively coupled plasma mass spectrometry (ICP-MS)is the most advanced and sensitive means of determiningthe elemental composition of materials [30]. Classically, ithas been used for ultra-trace (10–15 g/ml) detection ofmetals and other elements in both environmental (water,soil and air) and clinical (blood and urine) samples. Thecentral component of this system is a high-temperatureplasma (!7000 K), which vaporizes the sample, breaks allmolecular bonds, and strips one electron from each atom.This creates a cloud of elemental ions, from which therelative abundance of isotopes can be determined. Theability to detect and quantify trace levels of multiple,nonbiologic elements from complex matrices makes ICP-MS an ideal detection tool for biological studies [31–38].
Mass cytometryMass cytometry is the adaptation of ICP-MS to single-cellanalysis [39], based on the concept that a purified singleisotope could be used to tag antibodies, and that theseconjugates could be quantified in an ICP-MS detectionsystem. Mass cytometry has essentially the same workflowas conventional flow cytometry (Figure 2). Cells are stainedwith target-specific antibodies labeled with metal isotopes
(typically lanthanide metals) [37,40]; these are the sameantibody clones used in conventional cytometry. Cells arealso stained with rhodium- or iridium-conjugated DNAintercalators, providing a baseline for detection and infor-mation about DNA content [33]. The use of differentialintercalator staining [36] as well as chemical labeling withchelated metals [41,42] provides a viability measure. In theinstrument, stained cells are nebulized into single-celldroplets and introduced into the plasma. The resultingcharged atomic ion clouds are immediately transferredinto the high vacuum of the mass spectrometer.
All cellular material is ionized, therefore, atomic ionsare produced from elements common in cells (such ascarbon, nitrogen and oxygen), along with ions from theargon plasma itself. To resolve the probe ions (e.g. lantha-nides) from these overly abundant ions, the mass cyt-ometer is configured as a quadrupole-time-of-flight(qTOF) instrument [30]. The quadrupole acts as a filterallowing only the heavier elemental ions, which consistprimarily of the reporter masses, to be quantitated by TOFmass analysis.
For a typical cell, the ion cloud has a lifetime of !300 msover which it is measured (scanned) 20–30 times by TOF-mass spectrometry. This lifetime precludes analysis of>1000 cells/s, as single cells cannot be resolved beyondthis rate. At lower rates, the system is remarkably robust;there is little measurable signal (background) betweencells, as the elemental reporters used are uncommon ina biological context or within the laboratory environment.The amount of each isotopic reporter is quantified for the
Antibodieslabeled with
elemental isotopes
ICP
.FCS file
Mass
Cell 3
Cell 2
Cell 1Integrate-per-cell
Light (<100 Da)Overly abundant ions
Heavy (>100 Da)Reporter atomic ions
Analysis
Ele
men
t A
Element B
Nebulizer
Quadrupole
Time-of-flight
TRENDS in Immunology
Figure 2. Mass cytometry allows single-cell atomic mass spectrometry of heavy elemental (>100 Da) reporters. Schematic of ICP-MS-based analysis of cellular markers. Anaffinity product (e.g. antibody) tagged with a specific element binds to the cellular epitope. The cell is introduced into the ICP by droplet nebulization. Each cell is atomized,ionized, overly abundant ions removed, and the elemental composition of remaining heavy elements (reporters) is determined. Signals corresponding to each elementaltag are then correlated with the presence of the respective marker and analyzed using conventional cytometry platforms.
Review Trends in Immunology July 2012, Vol. 33, No. 7
325
Figure 1: Schematic of mass cytometry.9 The cell is stained with MaxPar® reagents (antibodies labelled with metal-chelating polymers) specific for various parameters in the cell. Then, cells are nebulized and ionized by the inductively coupled plasma torch. After a quadrupole removes light ions (less than 100 Da), ion clouds (cell events) enter a time-of-flight detector, and the resultant data per cell is packaged.
Elem
ent A!
Element A!
There are a number of advantages that MC provides that make this technology quite
appealing for applications in cell biology. Firstly, the approach is perfectly amenable to
multiparametric experiments. While PFC experiments struggle with spectral overlap when more
than five fluorophores are used (with >12-colour experiments becoming prohibitively difficult),
MC can, theoretically, be used to resolve more than 50 parameters at once because of its use of
elemental isotopes and the exquisite resolution of mass detection by TOF. There are 37 stable
lanthanide isotopes available for use in MC, while other elements such as the noble metals, tin,
iodine and tellurium offer additional options for use as isotopic tags.9,10 Of course, the elements
used in the MC study must be those with low to zero biological abundance. This, in effect, is
another one of the advantages of this technology; the fact that the elements used as isotopic tags
are not typically found in biological milieu results in measurement over zero background.
Contrasted with fluorescence-based FC, where autofluorescence of the cell confounds emission
spectra, one can be confident that the mass spectrum obtained is solely a product of the isotopic
tags, and not some other cellular component. Theoretically, this should lead to a significant
increase in sensitivity over fluorescence-based FC, allowing for more accurate detection and
quantification, particularly of low-abundance parameters. The fact that MC offers the possibility
Figure 1: Schematic of mass cytometry.9 The cell is stained with MaxPar® reagents (antibodies labeled with metal-chelating polymers) specific for various parameters in the cell. Then, cells are nebulized and ionized by the inductively coupled plasma torch. After a quadrupole removes light ions (less than 100 Da), ion clouds (cell events) enter a time-of-flight detector, and the resultant data per cell is packaged.
4
of massively multiparametric experiments with little penalty in sensitivity makes it an excellent
tool for characterizing cellular composition at unprecedented scales.
1.2.1 The arsenal of tools for mass cytometry
There are a number of tools available for probing a multitude of targets by MC. The most
prolific of these are the aforementioned antibodies conjugated to metal-chelating polymers
(MCPs), referred to as MaxPar® reagents (Figure 2a), originally developed by Dr. Scott Tanner
with the Winnik and Nitz Labs at the University of Toronto.11 Perhaps most famously, these
probes were used by Bendall, et al. to study signaling in a human hematopoietic continuum, and
its response to external stimuli such as cytokines and drugs. 34 parameters were measured at
once: cell viability, DNA content and cell size were measured by using dyes or metal-chelating
small-molecule probes (Figure 2b), while MaxPar® reagents were used against 13 surface
markers to determine cellular phenotype (i.e., immune cell subtype) and 18 intracellular
signaling molecules to determine the functionality of certain pathways. MC allowed for the
mapping of perturbations (caused by drug- or immune-based modulators) on these signaling
pathways onto particular immune cell subtypes. Some marked differences in signaling response
with respect to cell type were found, with some responses observed within precisely defined cell
subsets, while others were observed across cell differentiation transitions.14 Information gleaned
from this research allows to further enrich the understanding of immune signaling in
hematopoiesis and related disease states, and also provide a more targeted approach for drug
design against these pathways. This landmark report not only illustrated the massively
multiparametric experiments promised by MC, but it also realized the potential for this
technology to provide truly useful, groundbreaking and system-wide information based on
simultaneous, high-throughput analysis of numerous analytes in single cells.
For all of the excellent work illustrated in this report, it is important to note that only the
presence of the biomarkers was identified. This is a quality of all affinity-based probes (AfBPs)
such as these antibody-based ones, as they are based solely on the recognition of epitopes on
antigens, regardless of the activity of the target (if the target is an enzyme). To report on both the
presence and activity of enzyme targets, activity-based probes (ABPs) were developed. ABPs
provide a readout of enzymatic activity by being activated (i.e., detectable) only when the
enzyme is active. This is achieved by the covalent attachment of the probe to the enzyme, or
5
some other proximal macromolecule, in a manner dependent on the catalytic machinery of the
enzyme.15,16 Therefore, the enzyme must be catalytically active in order for the attachment to
occur. An ABP is typically a small molecule composed of a specificity element, for recognition
by the active site of the enzyme, a “warhead”, for covalent modification of the protein following
its enzymatic activation of the probe, and a detection moiety, typically a fluorophore to detect
tagged analyte by fluorescence, or biotin to isolate tagged analyte by streptavidin (Figure 2c).15,16
The nature of these probes allows for the activities of enzymes to be directly quantified, and on a
larger scale (i.e., profiling the “catalome”), it could provide revealing information regarding the
cell state that could not be garnered using simple AfBPs alone. As such, if MC adapted the use of
ABPs instead of, or in concert with, existing AfBPs, this would open up the entire dimension of
catalomics to a technology that thrives on examining proteins on a massive scale, thus providing
unprecedented levels of detail in the biology of cells and whole systems.
Edgar, et al. realized the potential of the intrinsic compatibility of MC for ABPs, and
developed the first probe with detection by this method (Figure 2d). As a proof-of-concept,
cellular hypoxia was chosen as a target for probing due to its significance in tumour biology—
solid tumours typically house hypoxic regions, which can lead to resistance to therapies and
increased metastasis, but are difficult to study because of fluctuations in oxygen levels.17–19 A 2-
N
N N
NIr
S
H2N NH2SN
O
O
N
O
O
S
Ln3+
Ln3+Ln3+
Ln3+
a)! b)!
specificity!
warhead! detection!c)!
TeO
O
HNN
H
ONN
O2N
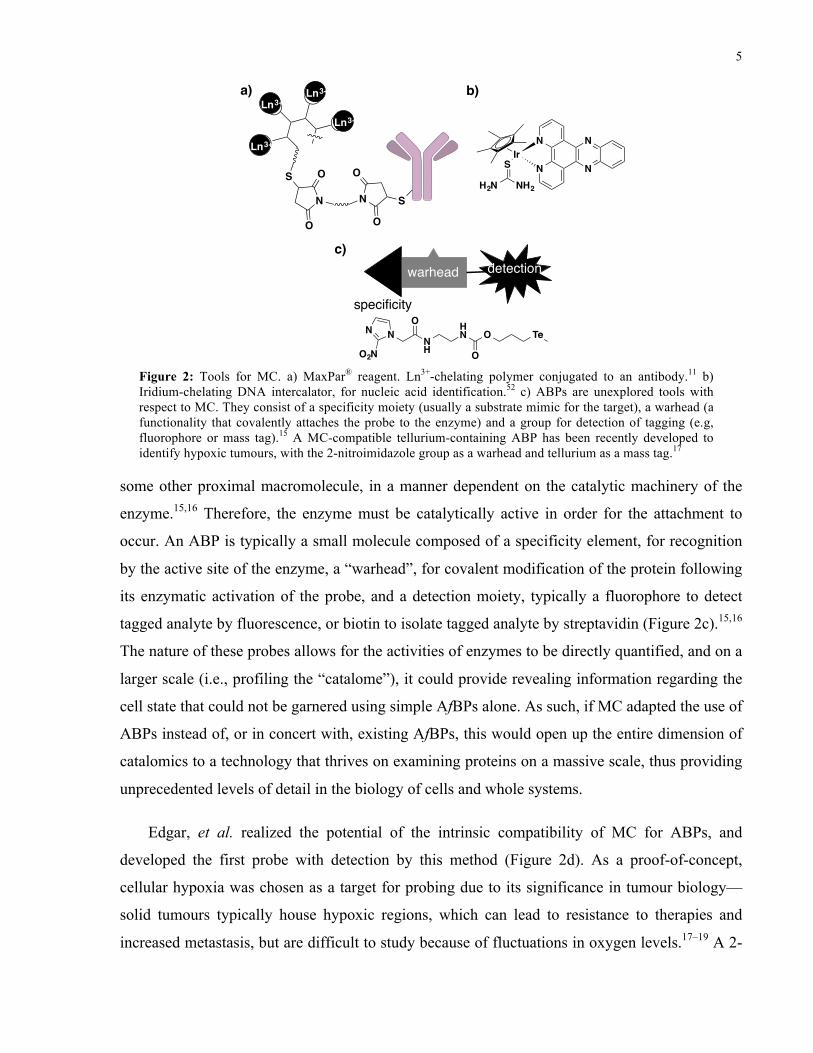
Figure 2: Tools for MC. a) MaxPar® reagent. Ln3+-chelating polymer conjugated to an antibody.11 b) Iridium-chelating DNA intercalator, for nucleic acid identification.52 c) ABPs are unexplored tools with respect to MC. They consist of a specificity moiety (usually a substrate mimic for the target), a warhead (a functionality that covalently attaches the probe to the enzyme) and a group for detection of tagging (e.g, fluorophore or mass tag).15 A MC-compatible tellurium-containing ABP has been recently developed to identify hypoxic tumours, with the 2-nitroimidazole group as a warhead and tellurium as a mass tag.17
6
nitroimidazole functionality was used as the warhead, as its reduction in hypoxic conditions
results in the production of a highly electrophilic species, which can then form an adduct with a
nearby macromolecule, thereby achieving specific tagging for hypoxic tumours. To detect
tagging events by MC, a tellurium-containing organic functionality, the telluroether, was used as
an elemental tag. Telluroethers have the advantage of being compact, so as to minimize
disruptions to the biological system, lipophilic, for more favourable bioavailability, relatively
stable, and simple to synthesize. This is in contrast with the more canonical MC-compatible
reagents, metal-chelated DOTA or DTPA ligands, which are large, polar, and difficult to append
to a small molecule. Eight stable isotopes of tellurium are commercially available, and the
element is not found in biological systems, making it amenable for use in multiparametric studies
with MC. By this technique, the researchers observed hypoxic-dependent labeling of tumours,
with the probe being able to discriminate between different levels of oxygen in a heterogeneous
sample of cells.17 This work established the utility of organotellurium functionalities as a
detection handle for ABPs in the context of MC, further expanding the arsenal of tools available
for cellular profiling by this technology.
1.3 Scope of thesis
This thesis will further explore the use of organotellurium molecules for applications in
mass cytometry. Firstly, work towards the development of a more optimal tellurium-containing
scaffold than the telluroether, the trifluoromethyl telluroether, will be presented. Following this
will be a discussion on the synthesis and biological evaluation of a MC-compatible, tellurium-
containing ABP for cellular senescence. This ABP targets β-galactosidase, an enzyme
overexpressed in senescent cells.
7
2 Development of a trifluoromethyl telluroether scaffold towards more stable small molecule probes compatible with mass cytometry
This chapter has been reproduced in part with full permission from: Park, H.; Willis,
L. M.; Edgar, L. J.; Lumba, M. A.; Nitz, M. Manuscript in preparation.
Park, H. and Edgar, L. J. synthesized compounds 3–8. Park, H. performed stability studies on
compounds 3–8. Willis, L. M. performed all toxicity studies.
2.1 Introduction
As illustrated in Figure 2c, ABPs are composed of a specificity moiety, a warhead, and a
group detectable by some analytical method.15 The last-mentioned is of crucial importance in
order to build ABPs compatible with alternative detection methods, and its chemical
characteristics are governed by a number of general criteria. The group must be relatively small,
so as to not interfere with enzymatic activity on the probe itself, and to minimize perturbations to
cellular activity, which is particularly a concern when performing studies in cell culture or in
vivo. In these situations, it must also be minimally toxic to the cell. The moiety must also be
stable in aqueous solutions and in the cell, as well as during any synthetic manipulations that
may be performed on the probe. It should be somewhat soluble in water, but lipophilic enough
not to perturb membrane permeability if live-cell studies are required. Fluorophores typically
meet these criteria, however MC demands further requirements for a mass tag, namely, absence
of the element in biological milieu and, preferably, the availability of multiple isotopes of that
element.
As discussed above, Edgar, et al. have illustrated the potential for tellurium to fulfill many
of these criteria in their cell culture study of tumour hypoxia by MC.17 The telluroether scaffold
did not interfere with reduction of the probe by xanthine oxidase in vitro, and seemingly
performed well in cells, as it was able to discriminate between those exposed to normoxic and
anoxic conditions. It was minimially toxic, with a half maximal inhibitory concentration (IC50) of
200 ± 20 µM in Jurkat cells. The probe, however, was found to be unstable in the presence of
ambient light and oxygen levels, possessing a half-life (t1/2) of about 48 h in solution.17
Presumably, the decomposition can be attributed to the telluroether functionality, as it is prone to
8
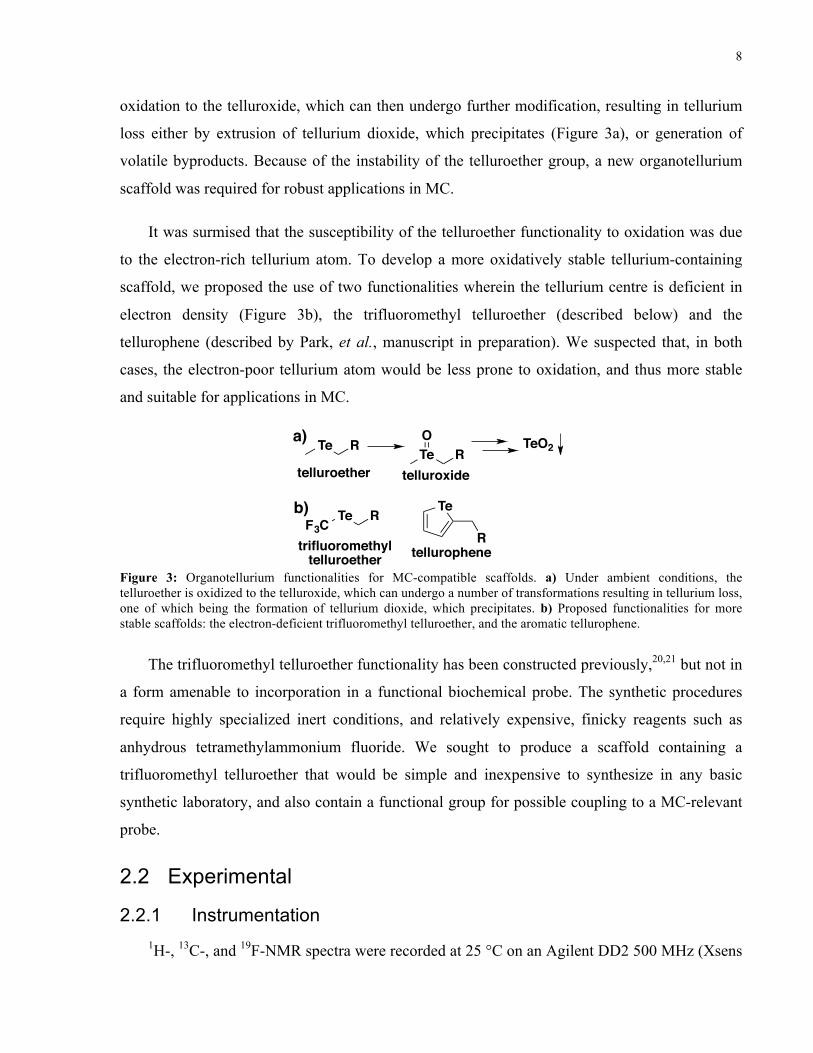
oxidation to the telluroxide, which can then undergo further modification, resulting in tellurium
loss either by extrusion of tellurium dioxide, which precipitates (Figure 3a), or generation of
volatile byproducts. Because of the instability of the telluroether group, a new organotellurium
scaffold was required for robust applications in MC.
It was surmised that the susceptibility of the telluroether functionality to oxidation was due
to the electron-rich tellurium atom. To develop a more oxidatively stable tellurium-containing
scaffold, we proposed the use of two functionalities wherein the tellurium centre is deficient in
electron density (Figure 3b), the trifluoromethyl telluroether (described below) and the
tellurophene (described by Park, et al., manuscript in preparation). We suspected that, in both
cases, the electron-poor tellurium atom would be less prone to oxidation, and thus more stable
and suitable for applications in MC.
The trifluoromethyl telluroether functionality has been constructed previously,20,21 but not in
a form amenable to incorporation in a functional biochemical probe. The synthetic procedures
require highly specialized inert conditions, and relatively expensive, finicky reagents such as
anhydrous tetramethylammonium fluoride. We sought to produce a scaffold containing a
trifluoromethyl telluroether that would be simple and inexpensive to synthesize in any basic
synthetic laboratory, and also contain a functional group for possible coupling to a MC-relevant
probe.
2.2 Experimental
2.2.1 Instrumentation 1H-, 13C-, and 19F-NMR spectra were recorded at 25 °C on an Agilent DD2 500 MHz (Xsens
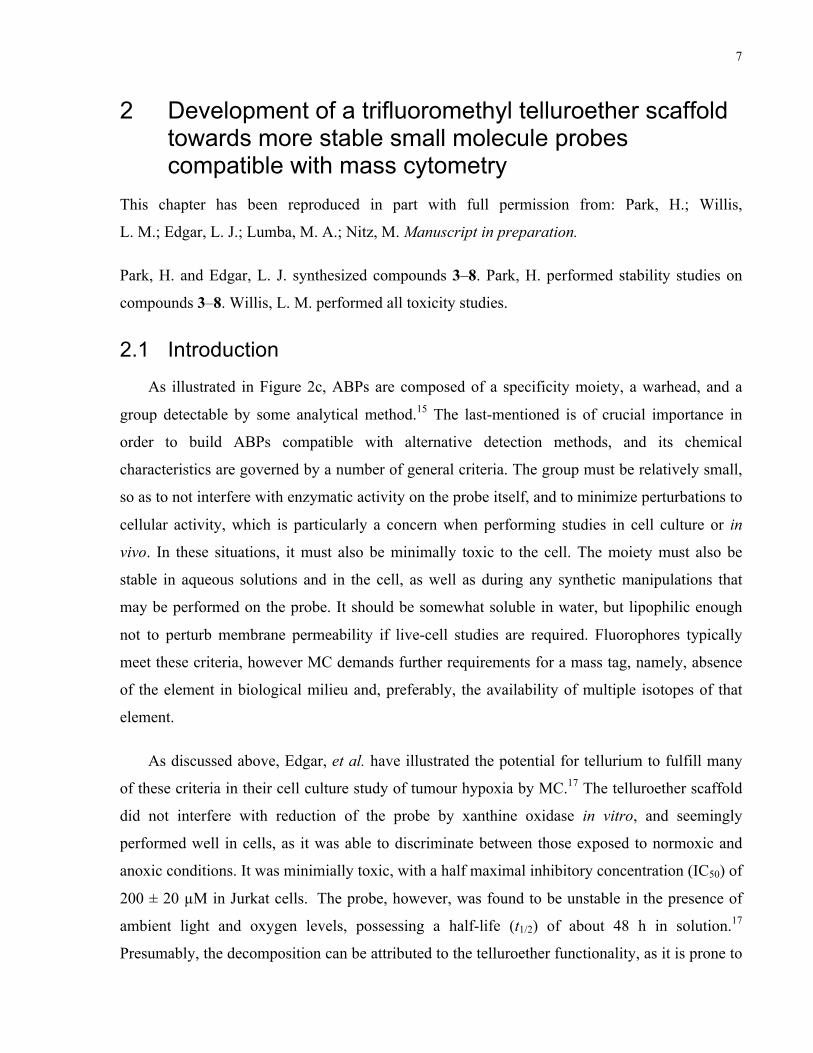
Figure 3: Organotellurium functionalities for MC-compatible scaffolds. a) Under ambient conditions, the telluroether is oxidized to the telluroxide, which can undergo a number of transformations resulting in tellurium loss, one of which being the formation of tellurium dioxide, which precipitates. b) Proposed functionalities for more stable scaffolds: the electron-deficient trifluoromethyl telluroether, and the aromatic tellurophene.
Te R Te RO
telluroether telluroxide
F3CTe R
trifluoromethyltelluroether
Te
Rtellurophene
a)
b)
TeO2
9
cold probe) or a Varian NMR System 400 MHz (AutoX probe) spectrometer. High resolution
mass spectra were obtained from a JEOL AccuTOF mass spectrometer with a Direct Analysis in
Real Time (DART) ion source. Solvents were removed under vacuum at approximately 35 °C
using a Heidolph rotary evaporator.
2.2.2 Materials
Dry dimethoxyethane (DME, Acros Organics), ethyl acetate (Fisher), tetrahydrofuran (THF,
Fisher), trifluoromethyltrimethylsilane (TFMTMS, Oakwood Chemical), methyl 4-
bromobutyrate (Alfa Aesar), WST-1 (Roche) and all other compounds (Sigma-Aldrich) were
used as supplied. All reactions were carried out under an inert atmosphere (N2). Silica
chromatography was performed with SiliCycle Silica-P Flash Silica Gel.
2.2.3 Synthesis
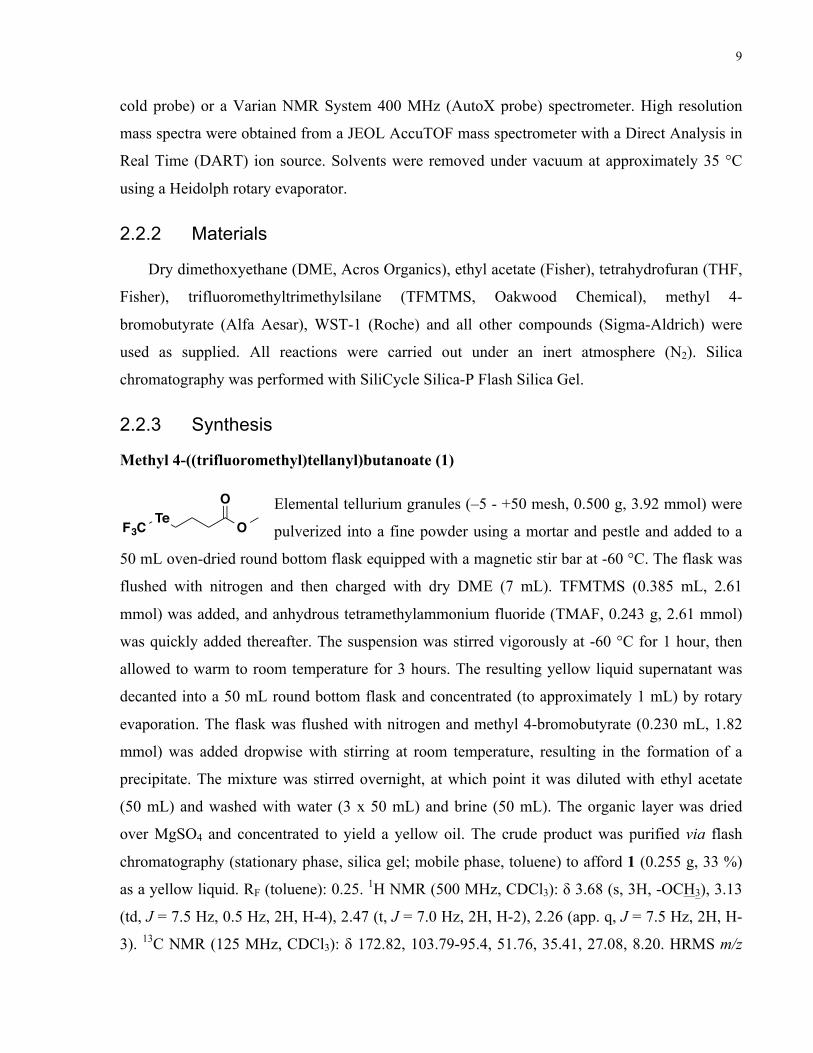
Methyl 4-((trifluoromethyl)tellanyl)butanoate (1)
Elemental tellurium granules (–5 - +50 mesh, 0.500 g, 3.92 mmol) were
pulverized into a fine powder using a mortar and pestle and added to a
50 mL oven-dried round bottom flask equipped with a magnetic stir bar at -60 °C. The flask was
flushed with nitrogen and then charged with dry DME (7 mL). TFMTMS (0.385 mL, 2.61
mmol) was added, and anhydrous tetramethylammonium fluoride (TMAF, 0.243 g, 2.61 mmol)
was quickly added thereafter. The suspension was stirred vigorously at -60 °C for 1 hour, then
allowed to warm to room temperature for 3 hours. The resulting yellow liquid supernatant was
decanted into a 50 mL round bottom flask and concentrated (to approximately 1 mL) by rotary
evaporation. The flask was flushed with nitrogen and methyl 4-bromobutyrate (0.230 mL, 1.82
mmol) was added dropwise with stirring at room temperature, resulting in the formation of a
precipitate. The mixture was stirred overnight, at which point it was diluted with ethyl acetate
(50 mL) and washed with water (3 x 50 mL) and brine (50 mL). The organic layer was dried
over MgSO4 and concentrated to yield a yellow oil. The crude product was purified via flash
chromatography (stationary phase, silica gel; mobile phase, toluene) to afford 1 (0.255 g, 33 %)
as a yellow liquid. RF (toluene): 0.25. 1H NMR (500 MHz, CDCl3): δ 3.68 (s, 3H, -OCH3), 3.13
(td, J = 7.5 Hz, 0.5 Hz, 2H, H-4), 2.47 (t, J = 7.0 Hz, 2H, H-2), 2.26 (app. q, J = 7.5 Hz, 2H, H-
3). 13C NMR (125 MHz, CDCl3): δ 172.82, 103.79-95.4, 51.76, 35.41, 27.08, 8.20. HRMS m/z
Te O
O
F3C
10
calcd. for C6H9F3O2130Te [M+NH4]+ 317.99511, found 317.99529.
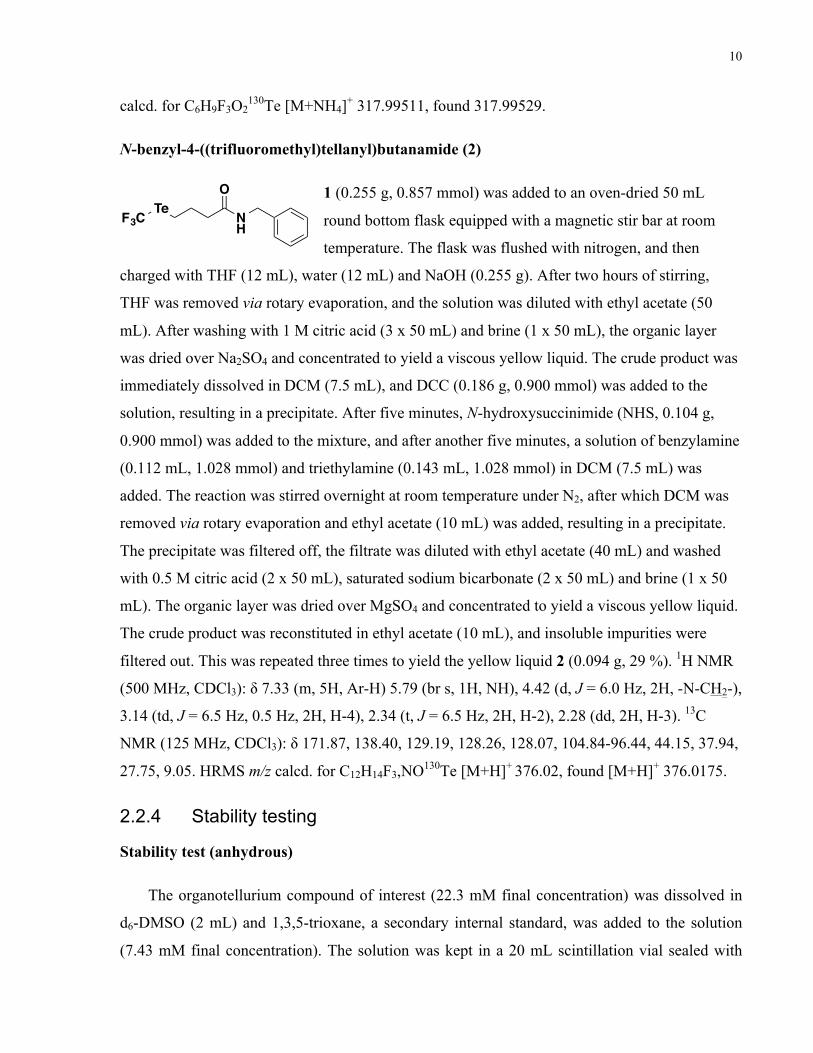
N-benzyl-4-((trifluoromethyl)tellanyl)butanamide (2)
1 (0.255 g, 0.857 mmol) was added to an oven-dried 50 mL
round bottom flask equipped with a magnetic stir bar at room
temperature. The flask was flushed with nitrogen, and then
charged with THF (12 mL), water (12 mL) and NaOH (0.255 g). After two hours of stirring,
THF was removed via rotary evaporation, and the solution was diluted with ethyl acetate (50
mL). After washing with 1 M citric acid (3 x 50 mL) and brine (1 x 50 mL), the organic layer
was dried over Na2SO4 and concentrated to yield a viscous yellow liquid. The crude product was
immediately dissolved in DCM (7.5 mL), and DCC (0.186 g, 0.900 mmol) was added to the
solution, resulting in a precipitate. After five minutes, N-hydroxysuccinimide (NHS, 0.104 g,
0.900 mmol) was added to the mixture, and after another five minutes, a solution of benzylamine
(0.112 mL, 1.028 mmol) and triethylamine (0.143 mL, 1.028 mmol) in DCM (7.5 mL) was
added. The reaction was stirred overnight at room temperature under N2, after which DCM was
removed via rotary evaporation and ethyl acetate (10 mL) was added, resulting in a precipitate.
The precipitate was filtered off, the filtrate was diluted with ethyl acetate (40 mL) and washed
with 0.5 M citric acid (2 x 50 mL), saturated sodium bicarbonate (2 x 50 mL) and brine (1 x 50
mL). The organic layer was dried over MgSO4 and concentrated to yield a viscous yellow liquid.
The crude product was reconstituted in ethyl acetate (10 mL), and insoluble impurities were
filtered out. This was repeated three times to yield the yellow liquid 2 (0.094 g, 29 %). 1H NMR
(500 MHz, CDCl3): δ 7.33 (m, 5H, Ar-H) 5.79 (br s, 1H, NH), 4.42 (d, J = 6.0 Hz, 2H, -N-CH2-),
3.14 (td, J = 6.5 Hz, 0.5 Hz, 2H, H-4), 2.34 (t, J = 6.5 Hz, 2H, H-2), 2.28 (dd, 2H, H-3). 13C
NMR (125 MHz, CDCl3): δ 171.87, 138.40, 129.19, 128.26, 128.07, 104.84-96.44, 44.15, 37.94,
27.75, 9.05. HRMS m/z calcd. for C12H14F3,NO130Te [M+H]+ 376.02, found [M+H]+ 376.0175.
2.2.4 Stability testing
Stability test (anhydrous)
The organotellurium compound of interest (22.3 mM final concentration) was dissolved in
d6-DMSO (2 mL) and 1,3,5-trioxane, a secondary internal standard, was added to the solution
(7.43 mM final concentration). The solution was kept in a 20 mL scintillation vial sealed with
F3CTe N
H
O
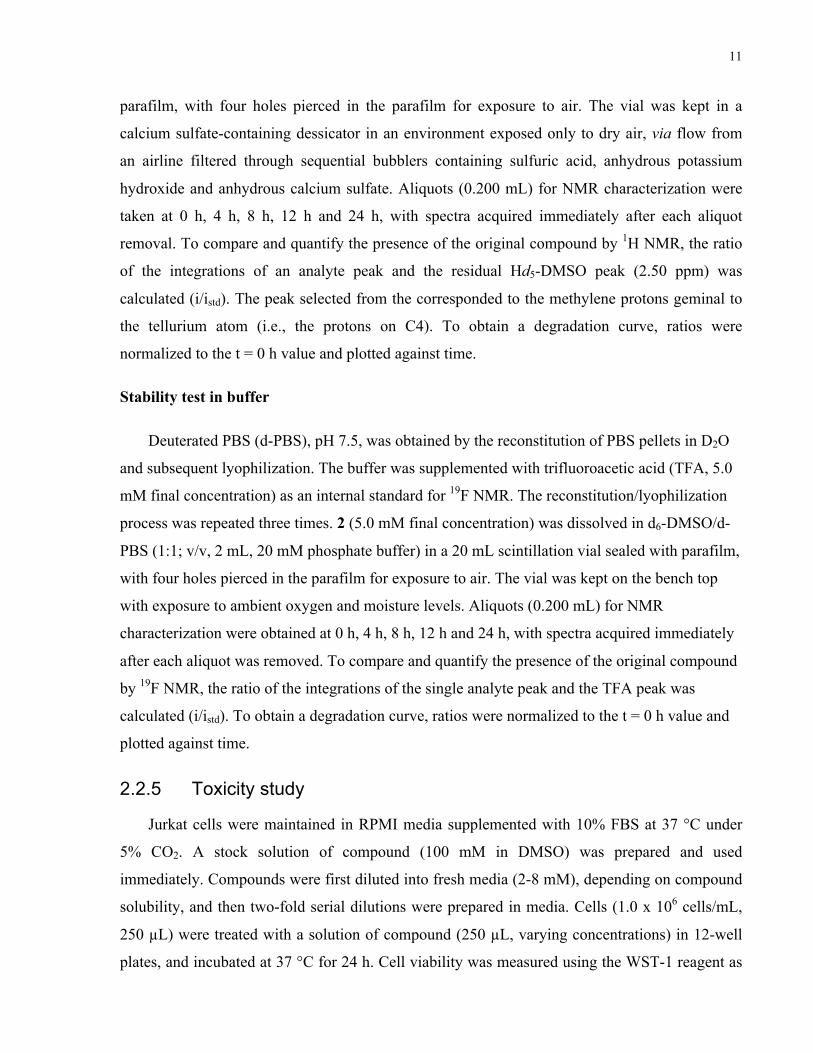
11
parafilm, with four holes pierced in the parafilm for exposure to air. The vial was kept in a
calcium sulfate-containing dessicator in an environment exposed only to dry air, via flow from
an airline filtered through sequential bubblers containing sulfuric acid, anhydrous potassium
hydroxide and anhydrous calcium sulfate. Aliquots (0.200 mL) for NMR characterization were
taken at 0 h, 4 h, 8 h, 12 h and 24 h, with spectra acquired immediately after each aliquot
removal. To compare and quantify the presence of the original compound by 1H NMR, the ratio
of the integrations of an analyte peak and the residual Hd5-DMSO peak (2.50 ppm) was
calculated (i/istd). The peak selected from the corresponded to the methylene protons geminal to
the tellurium atom (i.e., the protons on C4). To obtain a degradation curve, ratios were
normalized to the t = 0 h value and plotted against time.
Stability test in buffer
Deuterated PBS (d-PBS), pH 7.5, was obtained by the reconstitution of PBS pellets in D2O
and subsequent lyophilization. The buffer was supplemented with trifluoroacetic acid (TFA, 5.0
mM final concentration) as an internal standard for 19F NMR. The reconstitution/lyophilization
process was repeated three times. 2 (5.0 mM final concentration) was dissolved in d6-DMSO/d-
PBS (1:1; v/v, 2 mL, 20 mM phosphate buffer) in a 20 mL scintillation vial sealed with parafilm,
with four holes pierced in the parafilm for exposure to air. The vial was kept on the bench top
with exposure to ambient oxygen and moisture levels. Aliquots (0.200 mL) for NMR
characterization were obtained at 0 h, 4 h, 8 h, 12 h and 24 h, with spectra acquired immediately
after each aliquot was removed. To compare and quantify the presence of the original compound
by 19F NMR, the ratio of the integrations of the single analyte peak and the TFA peak was
calculated (i/istd). To obtain a degradation curve, ratios were normalized to the t = 0 h value and
plotted against time.
2.2.5 Toxicity study
Jurkat cells were maintained in RPMI media supplemented with 10% FBS at 37 °C under
5% CO2. A stock solution of compound (100 mM in DMSO) was prepared and used
immediately. Compounds were first diluted into fresh media (2-8 mM), depending on compound
solubility, and then two-fold serial dilutions were prepared in media. Cells (1.0 x 10⁶ cells/mL,
250 µL) were treated with a solution of compound (250 µL, varying concentrations) in 12-well
plates, and incubated at 37 °C for 24 h. Cell viability was measured using the WST-1 reagent as
12
per the manufacturer.
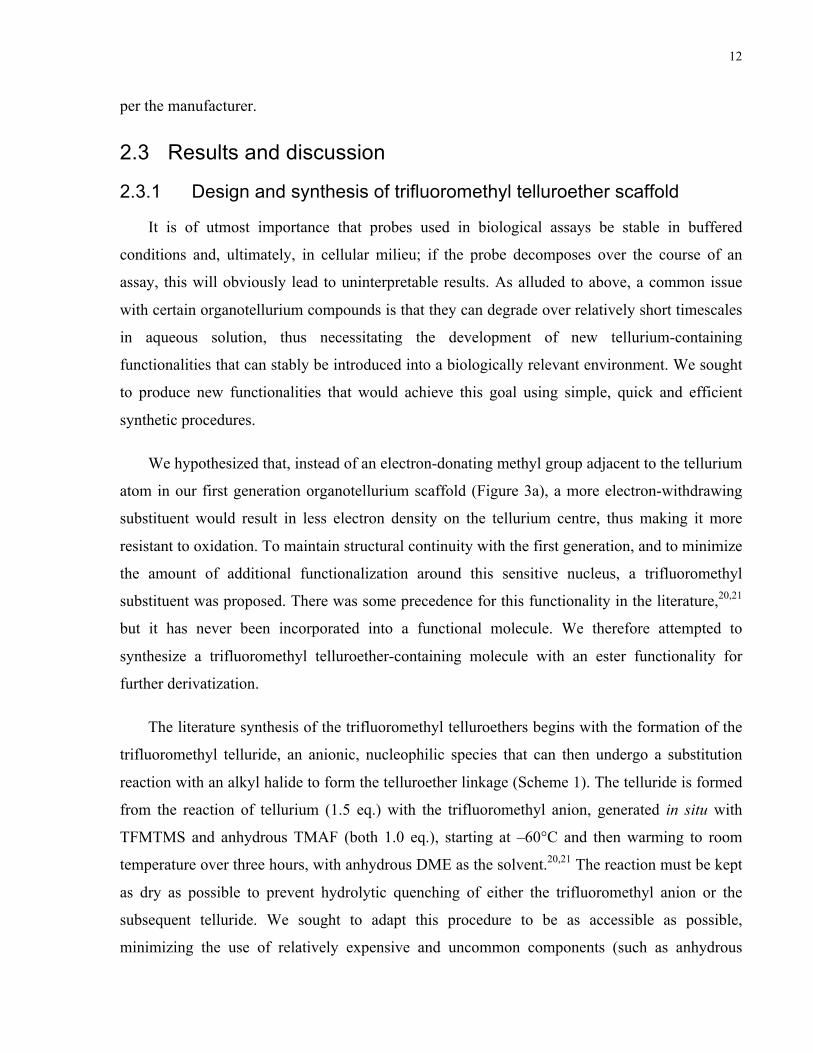
2.3 Results and discussion
2.3.1 Design and synthesis of trifluoromethyl telluroether scaffold
It is of utmost importance that probes used in biological assays be stable in buffered
conditions and, ultimately, in cellular milieu; if the probe decomposes over the course of an
assay, this will obviously lead to uninterpretable results. As alluded to above, a common issue
with certain organotellurium compounds is that they can degrade over relatively short timescales
in aqueous solution, thus necessitating the development of new tellurium-containing
functionalities that can stably be introduced into a biologically relevant environment. We sought
to produce new functionalities that would achieve this goal using simple, quick and efficient
synthetic procedures.
We hypothesized that, instead of an electron-donating methyl group adjacent to the tellurium
atom in our first generation organotellurium scaffold (Figure 3a), a more electron-withdrawing
substituent would result in less electron density on the tellurium centre, thus making it more
resistant to oxidation. To maintain structural continuity with the first generation, and to minimize
the amount of additional functionalization around this sensitive nucleus, a trifluoromethyl
substituent was proposed. There was some precedence for this functionality in the literature,20,21
but it has never been incorporated into a functional molecule. We therefore attempted to
synthesize a trifluoromethyl telluroether-containing molecule with an ester functionality for
further derivatization.
The literature synthesis of the trifluoromethyl telluroethers begins with the formation of the
trifluoromethyl telluride, an anionic, nucleophilic species that can then undergo a substitution
reaction with an alkyl halide to form the telluroether linkage (Scheme 1). The telluride is formed
from the reaction of tellurium (1.5 eq.) with the trifluoromethyl anion, generated in situ with
TFMTMS and anhydrous TMAF (both 1.0 eq.), starting at –60°C and then warming to room
temperature over three hours, with anhydrous DME as the solvent.20,21 The reaction must be kept
as dry as possible to prevent hydrolytic quenching of either the trifluoromethyl anion or the
subsequent telluride. We sought to adapt this procedure to be as accessible as possible,
minimizing the use of relatively expensive and uncommon components (such as anhydrous
13
TMAF and DME) as well as problematic reaction temperatures in favour of other fluoride
sources, solvents and conditions. Moreover, because these organotellurium compounds are
meant to be used for MC applications, isotopically pure tellurium will eventually need to be
incorporated into these molecules. As these isotopes are quite expensive, a procedure that
minimizes use of tellurium would be preferred (i.e., the suggested 1.5 eq. of tellurium is
suboptimal). A list of alternative conditions tested to generate the trifluoromethyl telluroether is
offered in Table 1.
A range of more reasonable anhydrous fluoride sources and temperatures were attempted for
this reaction, but unfortunately, none led to the desired product in appreciable yield. CsF is a
common, inexpensive reagent found in many labs, and is not as prone to hydration as
tetraalkylammonium fluoride salts. Unfortunately, it is difficult to solubilize in organic solvents,
particularly at the subzero temperatures recommended for the reaction, and this was likely the
reason for unsuccessful Trials 1 and 2. Attempts were made to generate anhydrous Bu4NF in situ
(Trials 3 and 4) using combinations of Bu4NCl and AgF, with the precipitation of AgCl
promoting formation of Bu4NF in solution, as well as hexafluorobenzene and Bu4NCN,22
forming Bu4NF by the substitution of –CN on hexafluorobenzene. The former suffered from
solubility issues of AgF, while formation of cyano-substituted benzenes in the latter reaction
likely resulted in side-reactions with crucial nucleophilic intermediates (i.e., the trifluoromethyl
anion and/or the resultant telluride). Trials 5 and 6 used the literature fluoride source TMAF,
with limiting tellurium and the commonly found solvent DMF. Desired product was not obtained
with methyl 4-chlorobutyrate or with benzyl bromide, the latter being a compound that should
have a high propensity towards substitution reactions. The lack of reaction with very reactive
electrophiles indicates that formation of the telluride anion likely did not occur under these
conditions (i.e., identity of the solvent and/or the amount of tellurium used in the reaction is
crucial for anion formation). Lastly, literature-recommended amounts of tellurium and TFMTMS
were used alongside the TMAF tetrahydrate, which is significantly less expensive than
F3C SiTe XFsolventtemp.
Te CF3XX R
F3CTe R
4h
RT, O/N
Scheme 1: General synthetic procedure to install a trifluoromethyl telluroether functional group. XF is some nucleophilic fluoride source required to generate the trifluoromethyl anion in situ through reaction with TFMTMS.
14
anhydrous TMAF. The hydrate was partially dried for a week at 130 °C under vacuum, yet the
reaction was unsuccessful, indicating the sensitivity of this reaction to the presence of moisture.
Due to unsuccessful attempts to optimize the procedure towards the use of more accessible
reagents, the literature procedure was used to produce the trifluoromethyl telluride anion
(Scheme 2). Methyl 4-bromobutyrate was chosen as the electrophile with which the telluride
would react. Following an overnight reaction, the crude product is purified by column
chromatography to yield 1 in moderate yield (33%). After several attempts at separating
unreacted methyl 4-bromobutyrate from 1, the use of pure toluene as the mobile phase was found
to provide the best separation on silica gel. To illustrate the synthetic utility of this ester-
containing trifluoromethyl telluroether, the ester was hydrolyzed and coupled to a model amine
(benzylamine, using a DCC/NHS protocol) to generate 2, also in functional yield (29%). While
unsatisfactory amounts of tellurium were used to make products in low yield, it is likely that
some optimization can be done to rectify either of those issues if desired. Nevertheless, this was
the first report of the exotic trifluoromethyl telluroether functionality being incorporated into a
relatively complex scaffold, and the compound was synthesized in adequate amounts for further
evaluation.
15
2.3.2 Stability assessments of tellurium-containing functionalities
The stabilities of 1 and 2 were assessed against those of basic telluroethers to analyze the
hypothesis that the supposedly more electron-deficient trifluoromethyl telluroether functionality
is more resistant against oxidation than the telluroether. If this is correct, the trifluoromethyl
telluroether may prove to be the better choice of tellurium-containing scaffold for future MC-
compatible activity-based probes. The stability of this functionality was analyzed in relation to
the tellurophene, another scaffold for the same use.
To determine the effect of oxygen on the stabilities of 1 and 2, solutions of the compounds
in d6-DMSO were placed in a chamber exposed only to a weak flow of dry air, to eliminate water
as a possible confounding variable (the stability of 1 and 2 to water was also investigated and
will be discussed below). The air was filtered through a series of drying agents (sulfuric acid,
potassium hydroxide and calcium sulfate) before entering the chamber. A mineral oil bubbler
was installed at the other end of the chamber, ensuring a system free of moisture-laden
atmospheric air. The stability of the compounds over time was quantified by 1H-NMR by
comparing the integration of a compound peak to that of an internal standard (in this case,
undeuterated DMSO found in the d6-DMSO solvent). If the same analyte peak is chosen at each
time point, then, presumably, its integration relative to that of the unchanging standard should
decrease if the compound is undergoing some chemical change (e.g., oxidation, decomposition,
etc.). In this case, the signal corresponding to the methylene protons on C4 (geminal to the
tellurium atom) was chosen, as the change in chemical shift of these protons would be the most
diagnostic of some change involving the tellurium atom. The appearance of any new signals was
F3C SiTe TMAFDME
-60 -> RT4 h
Te CF3Me4N
Br O
O Te O
O
F3CDME
RT, O/N
NH2
DCC, NHSDCM, Et3N
RT, O/NTe
HN
O
F3C
1
2
Scheme 2: Final synthetic procedure for the production of the trifluoromethyl telluroether scaffold.
16
also monitored.
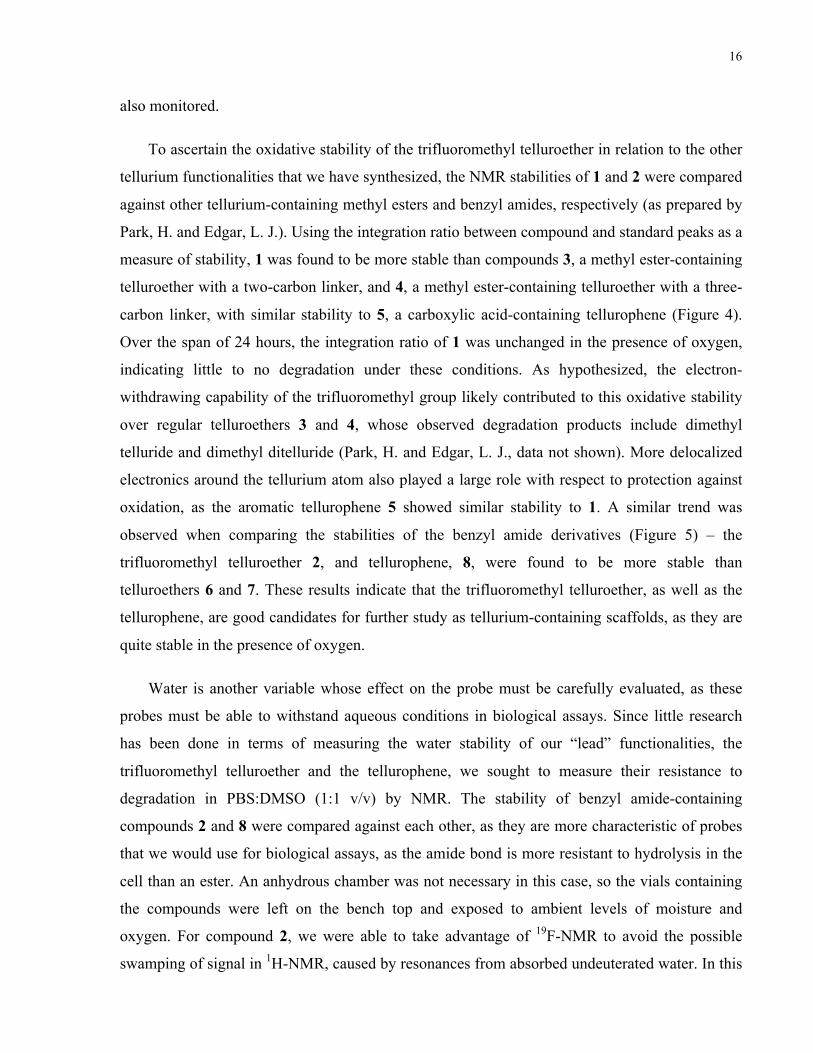
To ascertain the oxidative stability of the trifluoromethyl telluroether in relation to the other
tellurium functionalities that we have synthesized, the NMR stabilities of 1 and 2 were compared
against other tellurium-containing methyl esters and benzyl amides, respectively (as prepared by
Park, H. and Edgar, L. J.). Using the integration ratio between compound and standard peaks as a
measure of stability, 1 was found to be more stable than compounds 3, a methyl ester-containing
telluroether with a two-carbon linker, and 4, a methyl ester-containing telluroether with a three-
carbon linker, with similar stability to 5, a carboxylic acid-containing tellurophene (Figure 4).
Over the span of 24 hours, the integration ratio of 1 was unchanged in the presence of oxygen,
indicating little to no degradation under these conditions. As hypothesized, the electron-
withdrawing capability of the trifluoromethyl group likely contributed to this oxidative stability
over regular telluroethers 3 and 4, whose observed degradation products include dimethyl
telluride and dimethyl ditelluride (Park, H. and Edgar, L. J., data not shown). More delocalized
electronics around the tellurium atom also played a large role with respect to protection against
oxidation, as the aromatic tellurophene 5 showed similar stability to 1. A similar trend was
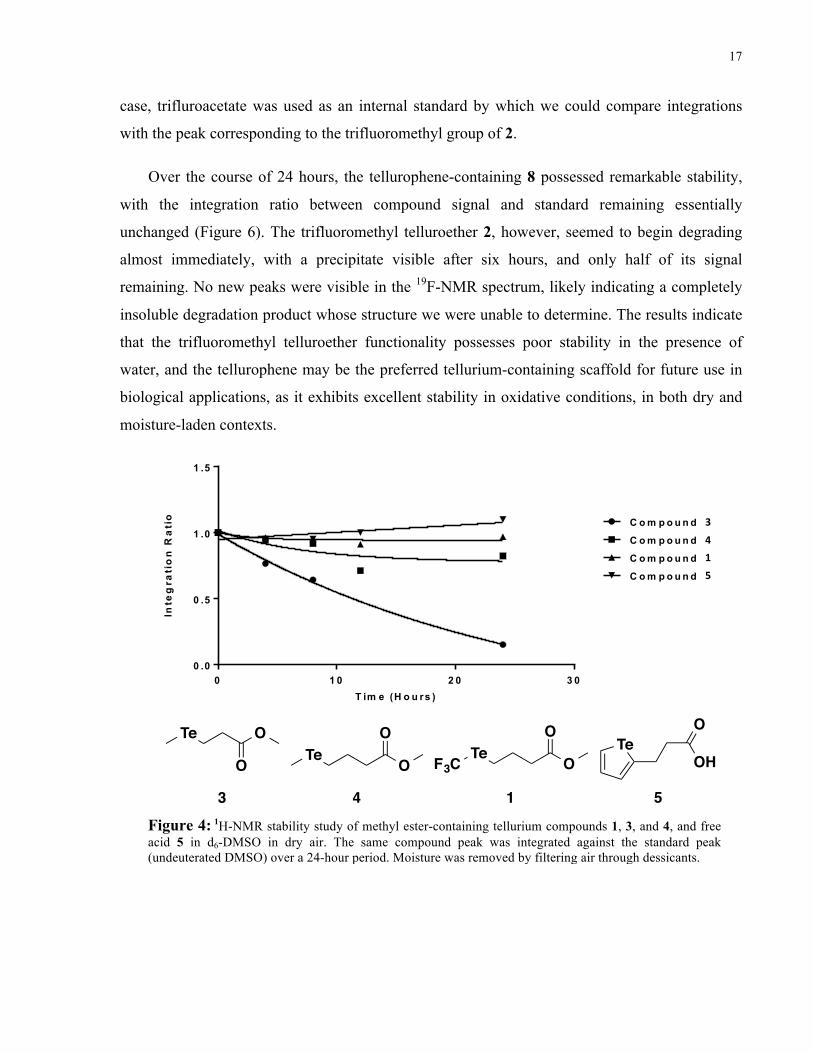
observed when comparing the stabilities of the benzyl amide derivatives (Figure 5) – the
trifluoromethyl telluroether 2, and tellurophene, 8, were found to be more stable than
telluroethers 6 and 7. These results indicate that the trifluoromethyl telluroether, as well as the
tellurophene, are good candidates for further study as tellurium-containing scaffolds, as they are
quite stable in the presence of oxygen.
Water is another variable whose effect on the probe must be carefully evaluated, as these
probes must be able to withstand aqueous conditions in biological assays. Since little research
has been done in terms of measuring the water stability of our “lead” functionalities, the
trifluoromethyl telluroether and the tellurophene, we sought to measure their resistance to
degradation in PBS:DMSO (1:1 v/v) by NMR. The stability of benzyl amide-containing
compounds 2 and 8 were compared against each other, as they are more characteristic of probes
that we would use for biological assays, as the amide bond is more resistant to hydrolysis in the
cell than an ester. An anhydrous chamber was not necessary in this case, so the vials containing
the compounds were left on the bench top and exposed to ambient levels of moisture and
oxygen. For compound 2, we were able to take advantage of 19F-NMR to avoid the possible
swamping of signal in 1H-NMR, caused by resonances from absorbed undeuterated water. In this
17
case, trifluroacetate was used as an internal standard by which we could compare integrations
with the peak corresponding to the trifluoromethyl group of 2.
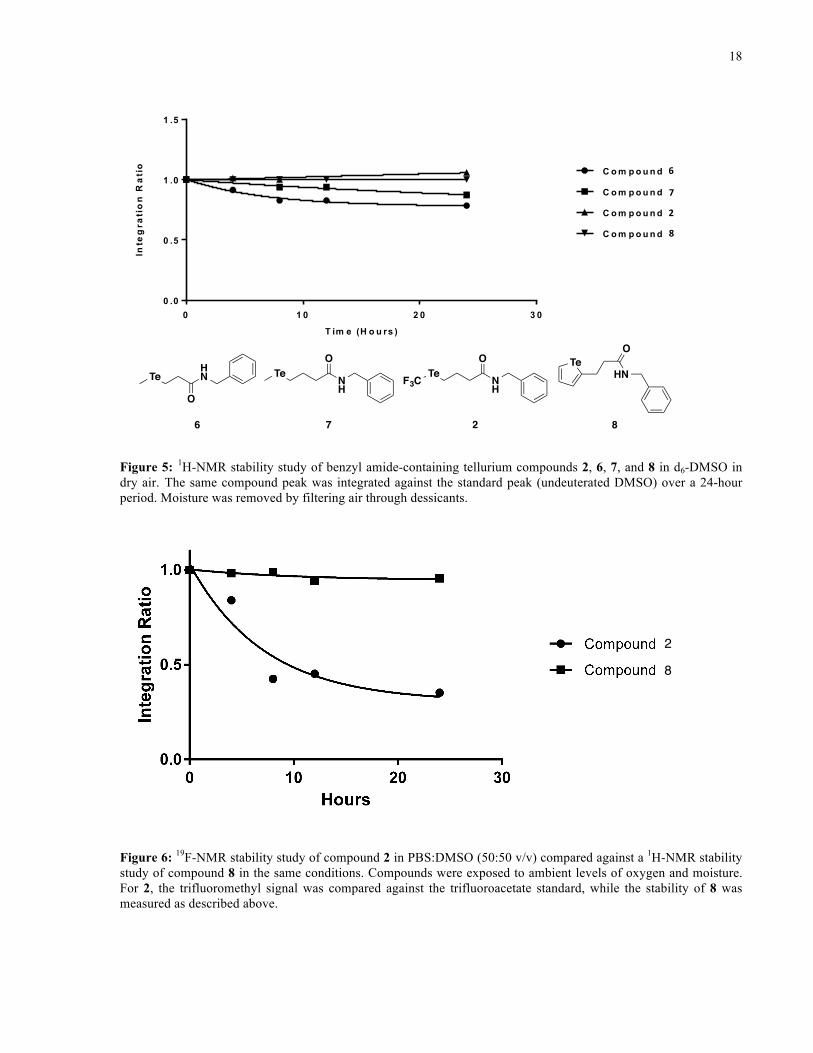
Over the course of 24 hours, the tellurophene-containing 8 possessed remarkable stability,
with the integration ratio between compound signal and standard remaining essentially
unchanged (Figure 6). The trifluoromethyl telluroether 2, however, seemed to begin degrading
almost immediately, with a precipitate visible after six hours, and only half of its signal
remaining. No new peaks were visible in the 19F-NMR spectrum, likely indicating a completely
insoluble degradation product whose structure we were unable to determine. The results indicate
that the trifluoromethyl telluroether functionality possesses poor stability in the presence of
water, and the tellurophene may be the preferred tellurium-containing scaffold for future use in
biological applications, as it exhibits excellent stability in oxidative conditions, in both dry and
moisture-laden contexts.
0 1 0 2 0 3 00 .0
0 .5
1 .0
1 .5
T im e (H o u rs )
Inte
gra
tio
n R
ati
o C o m p o u n d 3
C o m p o u n d 4
C o m p o u n d 5
C o m p o u n d 6
1"
3"4"
5"
Te O
O Te O
OTe O
O
F3CTe
OH
O
13 4 5Figure 4: 1H-NMR stability study of methyl ester-containing tellurium compounds 1, 3, and 4, and free acid 5 in d6-DMSO in dry air. The same compound peak was integrated against the standard peak (undeuterated DMSO) over a 24-hour period. Moisture was removed by filtering air through dessicants.
18
0 1 0 2 0 3 00 .0
0 .5
1 .0
1 .5
T im e (H o u rs )
Inte
gra
tio
n R
ati
o C o m p o u n d 8
C o m p o u n d 9
C o m p o u n d 1 0
C o m p o u n d 1 1
2"
6"
7"
8"
TeHN
O
Te NH
OTe N
H
O
F3CTe
HN
O
6 7 2 8
Figure 5: 1H-NMR stability study of benzyl amide-containing tellurium compounds 2, 6, 7, and 8 in d6-DMSO in dry air. The same compound peak was integrated against the standard peak (undeuterated DMSO) over a 24-hour period. Moisture was removed by filtering air through dessicants.
2!
8!
Figure 6: 19F-NMR stability study of compound 2 in PBS:DMSO (50:50 v/v) compared against a 1H-NMR stability study of compound 8 in the same conditions. Compounds were exposed to ambient levels of oxygen and moisture. For 2, the trifluoromethyl signal was compared against the trifluoroacetate standard, while the stability of 8 was measured as described above.
19
2.3.3 Toxicity assessments of tellurium-containing functionalities
The toxicity of tellurium-containing organic compounds has not been completely elucidated,
but it is an important consideration if we were to use these molecules in biological assays. In
particular, there is little to no information regarding toxic effects of organic molecules containing
the telluroether, trifluoromethyl telluroether and the tellurophene functionalities, apart from
Edgar et al.’s report that their telluroether-containing probe possessed an IC50 of 200 ± 20 µM in
Jurkat cells.17 We aimed to determine the toxicity of our lead functionalities to determine if these
scaffolds are also safe to use in live-cell studies.
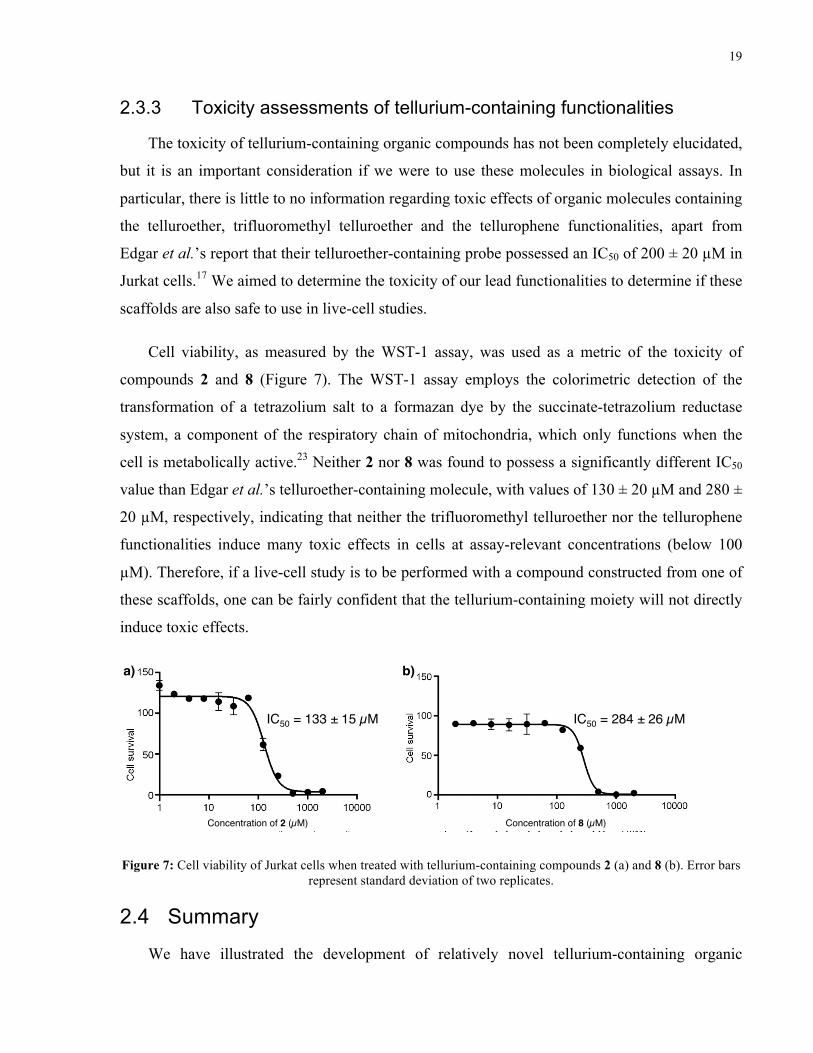
Cell viability, as measured by the WST-1 assay, was used as a metric of the toxicity of
compounds 2 and 8 (Figure 7). The WST-1 assay employs the colorimetric detection of the
transformation of a tetrazolium salt to a formazan dye by the succinate-tetrazolium reductase
system, a component of the respiratory chain of mitochondria, which only functions when the
cell is metabolically active.23 Neither 2 nor 8 was found to possess a significantly different IC50
value than Edgar et al.’s telluroether-containing molecule, with values of 130 ± 20 µM and 280 ±
20 µM, respectively, indicating that neither the trifluoromethyl telluroether nor the tellurophene
functionalities induce many toxic effects in cells at assay-relevant concentrations (below 100
µM). Therefore, if a live-cell study is to be performed with a compound constructed from one of
these scaffolds, one can be fairly confident that the tellurium-containing moiety will not directly
induce toxic effects.
Concentration of 2 (µM)! Concentration of 8 (µM)!
IC50 = 133 ± 15 µM! IC50 = 284 ± 26 µM!
a)! b)!
Figure 7: Cell viability of Jurkat cells when treated with tellurium-containing compounds 2 (a) and 8 (b). Error bars represent standard deviation of two replicates.
2.4 Summary
We have illustrated the development of relatively novel tellurium-containing organic
20
scaffolds for possible use in MC-compatible ABPs. Molecules containing the trifluoromethyl
telluroether functionality were synthesized and shown to have excellent stability in the presence
of oxygen, indicating that electron-deficient tellurium centres are more resistant to oxidation,
compared to more electron-rich moieties like the simple telluroether. Unfortunately, these
trifluoromethyl-containing compounds possessed poor stability in water compared to those
containing the tellurophene functionality. Due to its stability in oxygen- and moisture-rich
conditions, as well as its relatively low toxicity, the tellurophene functionality appears to be the
best choice for a tellurium-containing scaffold used in future biological assays.
2.5 Contents of Appendix to Chapter 2
NMR spectra for stability studies of 1 and 2 are located in Appendix I. High-resolution 1H
and 13C NMR spectra of synthetic targets 1 and 2 are found in Appendix II.
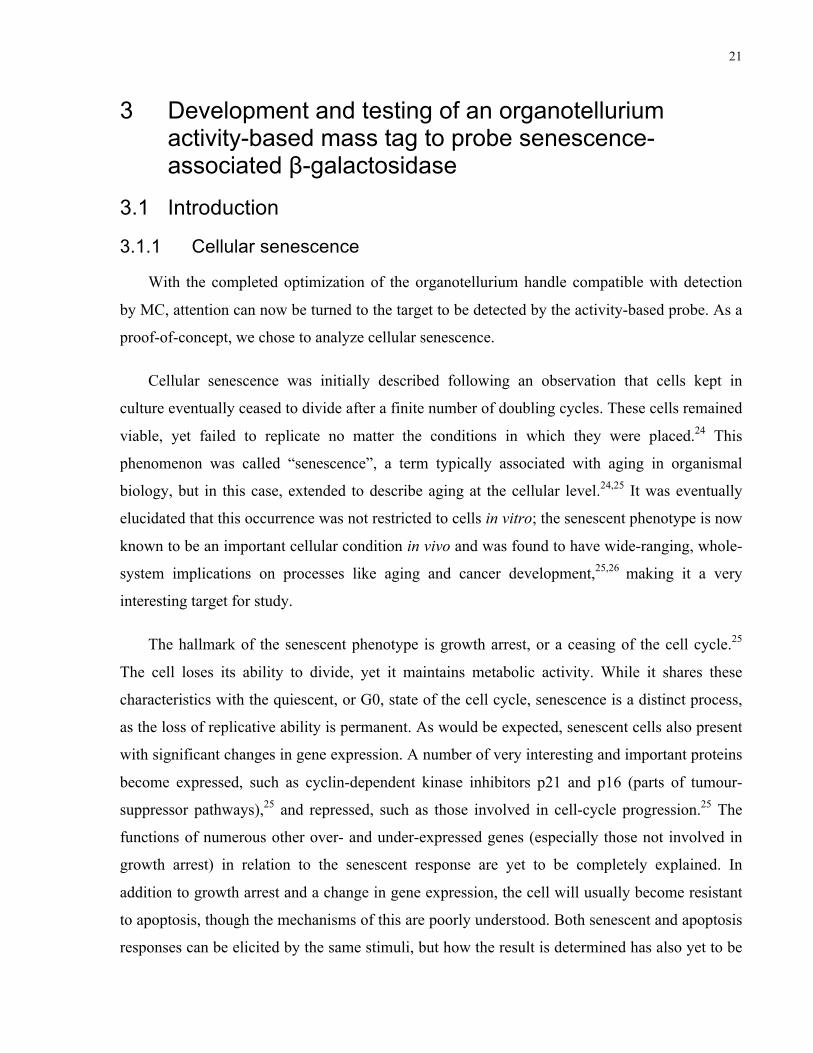
21
3 Development and testing of an organotellurium activity-based mass tag to probe senescence-associated β-galactosidase
3.1 Introduction
3.1.1 Cellular senescence
With the completed optimization of the organotellurium handle compatible with detection
by MC, attention can now be turned to the target to be detected by the activity-based probe. As a
proof-of-concept, we chose to analyze cellular senescence.
Cellular senescence was initially described following an observation that cells kept in
culture eventually ceased to divide after a finite number of doubling cycles. These cells remained
viable, yet failed to replicate no matter the conditions in which they were placed.24 This
phenomenon was called “senescence”, a term typically associated with aging in organismal
biology, but in this case, extended to describe aging at the cellular level.24,25 It was eventually
elucidated that this occurrence was not restricted to cells in vitro; the senescent phenotype is now
known to be an important cellular condition in vivo and was found to have wide-ranging, whole-
system implications on processes like aging and cancer development,25,26 making it a very
interesting target for study.
The hallmark of the senescent phenotype is growth arrest, or a ceasing of the cell cycle.25
The cell loses its ability to divide, yet it maintains metabolic activity. While it shares these
characteristics with the quiescent, or G0, state of the cell cycle, senescence is a distinct process,
as the loss of replicative ability is permanent. As would be expected, senescent cells also present
with significant changes in gene expression. A number of very interesting and important proteins
become expressed, such as cyclin-dependent kinase inhibitors p21 and p16 (parts of tumour-
suppressor pathways),25 and repressed, such as those involved in cell-cycle progression.25 The
functions of numerous other over- and under-expressed genes (especially those not involved in
growth arrest) in relation to the senescent response are yet to be completely explained. In
addition to growth arrest and a change in gene expression, the cell will usually become resistant
to apoptosis, though the mechanisms of this are poorly understood. Both senescent and apoptosis
responses can be elicited by the same stimuli, but how the result is determined has also yet to be
22
elucidated.25
A number of stimuli can induce a senescent phenotype. The first explanation for this
phenomenon was telomere shortening, resulting in telomere-dependent senescence.25,27
Telomeres consist of repetitive, non-productive stretches of DNA (5’-TTAGGG-3’) and protein
located at the end of chromosomes, thereby providing physical protection of the actual genetic
contents of the chromosomes against degradation and recombination.28 After every DNA
replication event, the telomere is shortened due to the “end-replication problem” inherent to the
lagging strand. As a result, after a certain number of cell divisions, the telomere reaches a critical
length at which it is rendered dysfunctional.27,29 At this point, a signaling response is induced
akin to that elicited when DNA damage occurs (activation of the p53 pathway), thereby resulting
in the arrest of the cell-cycle.30,31 What differentiates this response from a regular DNA-damage
response is the constant signaling of the pathway,31 resulting in the perpetual state of senescence.
While telomere-dependent senescence can be viewed as the “natural” cause of senescence
(indeed, it is why cellular senescence is implicated in organismal aging), external factors can also
elicit the same phenotype. For example, mutagens (e.g., oxidizing agents, chemotherapeutics,
radiation) that result in double-stranded breaks in DNA lead to the activation of the same p53
DNA damage pathway, possibly resulting in DNA-damage-initiated senescence, independent of
telomere length.25,32,33 Further, the phenotype can also be induced by the activation of oncogenes,
genes that can, when expressed, lead to tumorigenesis.34 Interestingly, the result of both DNA-
damage-initiated senescence and oncogene-activated senescence (cell cycle arrest) is in direct
contrast to the other possible effect of both DNA damage or oncogene activation (indefinite
cellular proliferation). This therefore suggests that senescence plays the role of a built-in defense
mechanism, preventing the cell from dividing at all instead of dividing uncontrollably. Recent
research has illustrated that this may indeed be the case,34,35 thereby demonstrating the
importance of this cellular process in cancer progression and making it a potentially interesting
target for study by MC.
3.1.2 Senescence markers
Study of a cellular condition by MC necessitates the presence of detectable markers to
identify that condition. Other than visible (but variable) changes in cell morphology,36 the
detection of senescence-associated biomarkers can be used to diagnose the phenotype.
23
Unfortunately, these detection methods struggle with long development times and a lack of
specificity for the senescent phenotype.25
As mentioned above, the hallmark of the senescent phenotype is arrest of the cell cycle.
Therefore, a typical method for identifying senescent cells is the use of a nucleic acid probe
(such as 3H-thymidine or 5-bromodeoxyuridine) to illustrate the lack of incorporation (i.e.,
replication) of the probe into cellular DNA.37 However, this method alone cannot distinguish
between cells in the G0 phase and senescent cells,25 two similar cell states that define very
different outcomes on the future of the cell culture or tissue sample. Another possible avenue for
detection is the previously mentioned p53 pathway, induced in senescent cells as part of the
DNA damage response, though this also overlaps too closely with other non-senescent
phenotypes, thus making an immunotag for p53, for example, poorly specific.
Instead, the most commonly used marker for cellular senescence is β-galactosidase activity.
At pH 6.0, senescent cells were observed to cleave the chromogenic β-galactosidase substrate 5-
bromo-4-chloro-3-indoyl β-D-galactopyranoside (X-gal), resulting in a blue coloration.38 This
activity, caused by so-called senescence-associated β-galactosidase (SA-βgal), was later
determined to be overexpression of the classic lysosomal β-galactosidase, associated with an
increase in lysosomal mass in senescent cells.39 While β-galactosidase activity is by no means
absent in pre-senescent cells, staining cells at a pH that is suboptimal for this enzyme (pH 6.0)
will allow for the distinction between basal (pre-senescent) and overexpressed (senescent) levels
of activity.38 Though it is not exclusively specific for senescent cells (cells held at confluence can
induce the same activity38) detection of SA-βgal has become the most widely used method for
identifying senescent cells.
Detection of SA-βgal involves the colorimetric detection of X-gal, a substrate that results in
dimerization of the aglycones following cleavage of the glycosidic bond (Scheme 3). The
dimerized product locally precipitates, resulting in cells that are dyed blue (Figure 8). While it is
the most widely used technique for senescence detection, it is rather crude, subjective and time-
consuming, involving the identification and counting of blue cells by eye.40 Some alternative,
less popular methods involving computational quantification of X-gal staining41 and fluorophore-
based FC methods40,42 suffer from the same issues faced by fluorophores discussed above
(namely, issues with quantification, background emission and lack of potential for
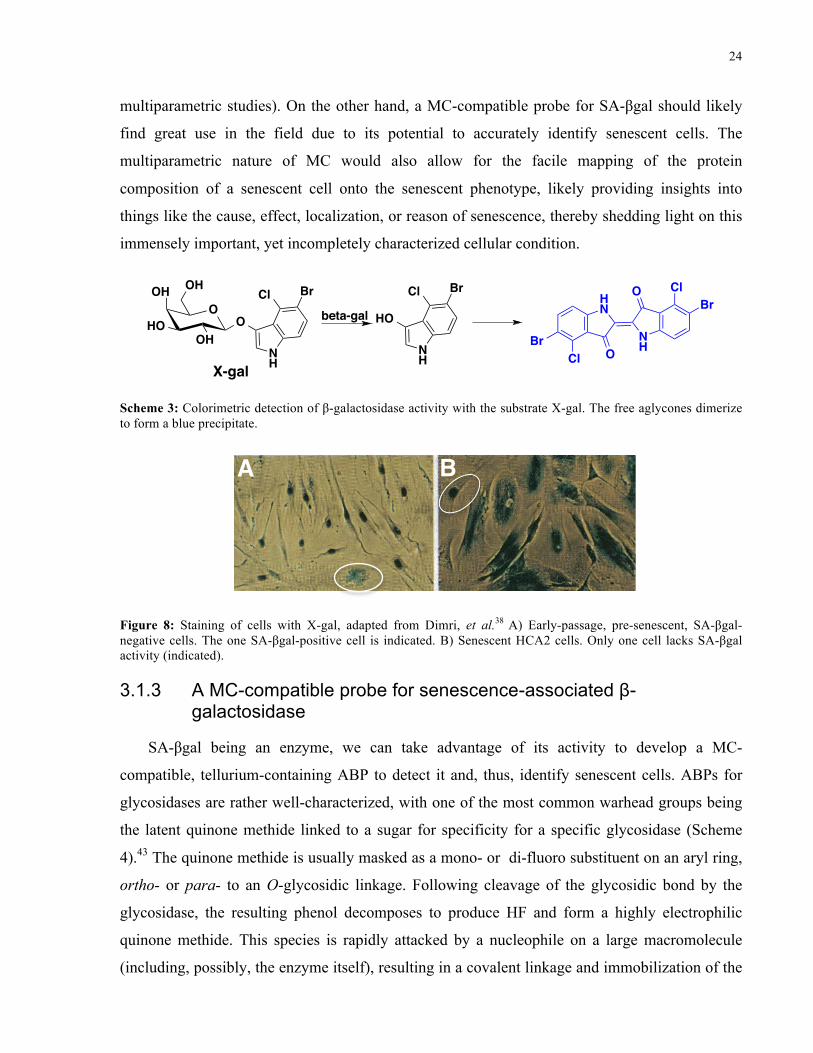
24
multiparametric studies). On the other hand, a MC-compatible probe for SA-βgal should likely
find great use in the field due to its potential to accurately identify senescent cells. The
multiparametric nature of MC would also allow for the facile mapping of the protein
composition of a senescent cell onto the senescent phenotype, likely providing insights into
things like the cause, effect, localization, or reason of senescence, thereby shedding light on this
immensely important, yet incompletely characterized cellular condition.
OHO
OH
OHO
OH
NH
Cl Br
HO
NH
Cl Br
NH
ClBrH
N
O
O
ClBr
beta-gal
X-gal
Scheme 3: Colorimetric detection of β-galactosidase activity with the substrate X-gal. The free aglycones dimerize to form a blue precipitate.
Proc. Natl. Acad. Sci. USA 92 (1995)
Cells were cultured, as described (15-17). Neonatal humanepidermal keratinocytes (NHEK; Clonetics, San Diego) werecultured as per the supplier's instructions in 10% CO2 and 10mM Hepes (pH 7.4); differentiation was induced by CaCl2 orphorbol 12-myristate 13-acetate (18). Microcell fusion wasperformed, as described (16, 17). IDH4 cells were grown in 1,tM dexamethasone (dex) or arrested in 10% charcoal-strippedserum and medium lacking phenol red and dex, as described(19). Human endothelial cells (strain H3605) were from J.Wessendorf and T. Maciag (American Red Cross, Rockville,MD) (20), neonatal melanocytes were from Z. Abdel-Malek(University of Cincinnati), adult melanocytes were from shavebiopsies (21), mammary cells were from V. Band (New En-gland Medical Center, Boston) (22), and ovarian cells werefrom N. Auersperg (23). SV40-WI38, C33a, U20S, SAOS, andHTB9 were from the American Type Culture Collection.
[3HJThymidine Labeling. Sparse cells (1-5 x 10³ per cm2)were given 10 ,uCi of [3H]thymidine (60-80 Ci/mmol; 1 Ci =37 GBq) per ml for 48-72 hr, stained where indicated, washedin phosphate-buffered saline (PBS), rinsed twice in methanol,and processed for autoradiography, as described (15).
I8-Galactosidase (13-Gal) Staining. Cells were washed inPBS, fixed for 3-5 min (room temperature) in 2% formalde-hyde/0.2% glutaraldehyde (or 3% formaldehyde), washed,and incubated at 37° C (no C02) with fresh senescence-associated (3-Gal (SA-,3-Gal) stain solution: 1 mg of 5-bromo-4-chloro-3-indolyl P3-D-galactoside (X-Gal) per ml (stock = 20mg of dimethylformamide per ml)/40 mM citric acid/sodiumphosphate, pH 6.0/5 mM potassium ferrocyanide/5 mM po-tassium ferricyanide/150 mM NaCl/2 mM MgCl2. Stainingwas evident in 2-4 hr and maximal in 12-16 hr. To detectlysosomal ,B-Gal, the citric acid/sodium phosphate was pH 4.0.
Skin Samples. Human skin from individuals undergoingMoh's micrographic surgery for skin cancer was rapidly frozenin liquid nitrogen, and mounted in OCT. Thin sections (4 ,um)were cut, mounted onto glass slides, fixed in 1% formalin inPBS for 1 min at room temperature, washed in PBS, immersedovernight in SA-3-Gal staining solution, counterstained witheosin, and viewed under bright field at 100-200X magnifica-tion.
RESULTS13-Gal in Cultured Human Fibroblasts. Senescent human
fibroblasts expressed a 13-Gal that was detected in single cellsby X-Gal, which forms a local blue precipitate upon cleavage(24), independent of DNA synthesis measurements. Early,middle, and late passage cultures (15) were given [3H]thymi-dine to label presenescent cells, stained for }3-Gal, and pro-cessed for autoradiography. Thus, individual cells were mon-itored simultaneously for ability to synthesize DNA and (3-Galactivity. Two human fibroblast strains, HCA2 (neonatal fore-skin) and WI-38 (fetal lung), showed similar results.Most cells express a lysosomal (3-Gal that is optimally active
at about pH 4 (25). Indeed, presenescent and senescent cellsstained equally well when assayed at pH 4 (Fig. 1 A and B).Neither stained at pH 7.5, the optimum for the bacterial (3-Galreporter enzyme (not shown). At pH 6, only senescent cellsstained (Fig. 1 C and D). We refer to this pH 6 activity as theSA-1-Gal.Most early passage cells were labeled with [3H]thymidine
and did not express SA-f3-Gal (Fig. 1C). The occasionalSA-13-Gal-positive cell almost invariably was unlabeled (Fig.1C). With increasing PD, there was a striking inverse relation-ship between SA-13-Gal staining and radiolabeling (Fig. 2A).By late passage, most cells were unlabeled and strongly SA-P-Gal positive (Fig. 1D). The most intense staining wasperinuclear and in late passage cultures (Fig. 1D). Uponreplating, senescent cells retained SA-1-Gal and did not divide(not shown). Typically, radiolabeled cells were SA-1-Gal neg-
FIG. 1. 83-Gal in cultured human cells. Cells were radiolabeled,stained, and photographed at 10OX (A-E and J-L) or 200X (F-I)magnification (final magnifications: A-E and J-L, x60; F-I, x 120).Most cells were either labeled and SA-,B-Gal negative or unlabeled andSA-f-Gal positive. Double positive cells comprised <0.1% of early,and 5-8% of late, passage cultures. Such cells may have completedtheir last cell cycle and induced SA-,B-Gal during the 3-day labeling orinduced SA-13-Gal before the last cell cycle. Double negatives com-prised 1-2% of early, and 20-25% of late, passage cultures. Some wereslow-cycling cells, because labeling for 5-7 days reduced them from22% to 16% and increased labeled cells from 15% to 20%. Othersexpressed low SA-,3-Gal, since longer staining (24 vs. 8 hr) decreasedthem from 23% to 17% and increased SA-f3-Gal positives from 69%to 75%. Ten to 15% of cells in senescent cultures were unlabeled andSA-f-Gal negative for unknown reasons. (A and B) Early passage (A)and senescent (B) WI-38 cells stained for lysosomal 1B-Gal. (C) Earlypassage HCA2 cells; labeled, SA-3-Gal staining. An unlabeled SA-13-Gal-positive cell is in the lower right. (D) Senescent HCA2; labeled,SA-,B-Gal staining. A labeled SA-,B-Gal-negative cell is in upper left.(E) Presenescent, confluent WI-38; SA-,3-Gal staining. Staining dis-appeared 2 days after replating. (F) Early passage NHEK; labeled,SA-P-Gal staining. (G) Middle passage NHEK; labeled, SA-,3-Galstaining. (H) Early passage differentiated NHEK; labeled, SA-P3-Galstaining. (I) CMV-MJ cells 10 passages after receiving human chro-mosome 1; labeled, SA-,B-Gal staining. Unlabeled SA-,B-Gal-positivecells were not seen in the parent culture. (J) IDH4 cells growing in dex;SA-13-Gal staining. (K) IDH4 minus dex for 17 days; SA-,B-Galstaining. (L) IDH4 minus dex for 20 days, then plus dex for 3 days;SA-13-Gal staining.
ative, and unlabeled cells were SA-,B-Gal positive (see legendto Fig. 1).
SA-13-Gal Is Not Induced Quiescence or Terminal Differ-entiation. Presenescent fibroblasts were made quiescent by
9364 Cell Biology: Dimri et al.
A! B!
Figure 8: Staining of cells with X-gal, adapted from Dimri, et al.38 A) Early-passage, pre-senescent, SA-βgal-negative cells. The one SA-βgal-positive cell is indicated. B) Senescent HCA2 cells. Only one cell lacks SA-βgal activity (indicated).
3.1.3 A MC-compatible probe for senescence-associated β-galactosidase
SA-βgal being an enzyme, we can take advantage of its activity to develop a MC-
compatible, tellurium-containing ABP to detect it and, thus, identify senescent cells. ABPs for
glycosidases are rather well-characterized, with one of the most common warhead groups being
the latent quinone methide linked to a sugar for specificity for a specific glycosidase (Scheme
4).43 The quinone methide is usually masked as a mono- or di-fluoro substituent on an aryl ring,
ortho- or para- to an O-glycosidic linkage. Following cleavage of the glycosidic bond by the
glycosidase, the resulting phenol decomposes to produce HF and form a highly electrophilic
quinone methide. This species is rapidly attacked by a nucleophile on a large macromolecule
(including, possibly, the enzyme itself), resulting in a covalent linkage and immobilization of the
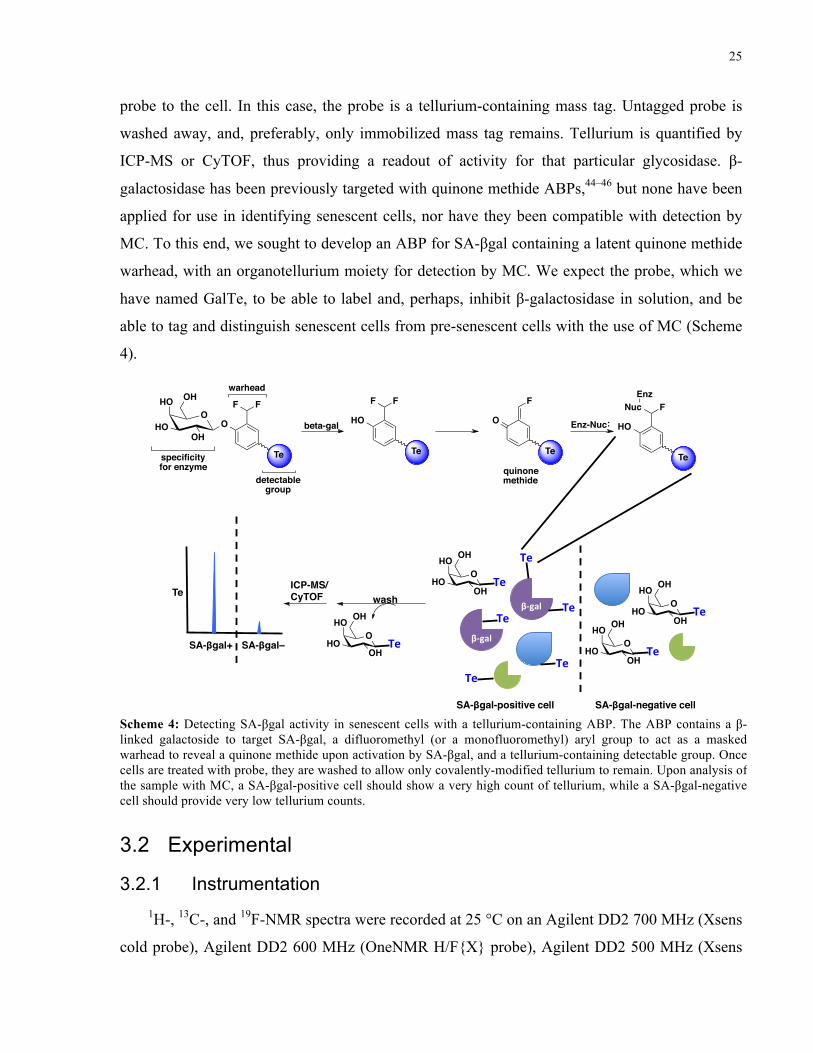
25
probe to the cell. In this case, the probe is a tellurium-containing mass tag. Untagged probe is
washed away, and, preferably, only immobilized mass tag remains. Tellurium is quantified by
ICP-MS or CyTOF, thus providing a readout of activity for that particular glycosidase. β-
galactosidase has been previously targeted with quinone methide ABPs,44–46 but none have been
applied for use in identifying senescent cells, nor have they been compatible with detection by
MC. To this end, we sought to develop an ABP for SA-βgal containing a latent quinone methide
warhead, with an organotellurium moiety for detection by MC. We expect the probe, which we
have named GalTe, to be able to label and, perhaps, inhibit β-galactosidase in solution, and be
able to tag and distinguish senescent cells from pre-senescent cells with the use of MC (Scheme
4).
3.2 Experimental
3.2.1 Instrumentation 1H-, 13C-, and 19F-NMR spectra were recorded at 25 °C on an Agilent DD2 700 MHz (Xsens
cold probe), Agilent DD2 600 MHz (OneNMR H/F{X} probe), Agilent DD2 500 MHz (Xsens
Te#
Te#Te#
Te#Te#
ICP-MS/!CyTOF!
SA-βgal-positive cell!
wash!β%gal#
β%gal#
Te#
SA-βgal-negative cell!
SA-βgal+! SA-βgal–!
Te!
O
OHHO
OHOH
beta-gal Enz-NucO
HO
OH
OHO
OH
FF
quinonemethide
specificityfor enzyme
warhead
Te
detectablegroup
HO
FF
Te
O
F
Te
F
Te
HO
NucEnz
Te#O
OHHO
OHOH
Te#O
OHHO
OHOH
Te#O
OHHO
OHOH
Scheme 4: Detecting SA-βgal activity in senescent cells with a tellurium-containing ABP. The ABP contains a β-linked galactoside to target SA-βgal, a difluoromethyl (or a monofluoromethyl) aryl group to act as a masked warhead to reveal a quinone methide upon activation by SA-βgal, and a tellurium-containing detectable group. Once cells are treated with probe, they are washed to allow only covalently-modified tellurium to remain. Upon analysis of the sample with MC, a SA-βgal-positive cell should show a very high count of tellurium, while a SA-βgal-negative cell should provide very low tellurium counts.
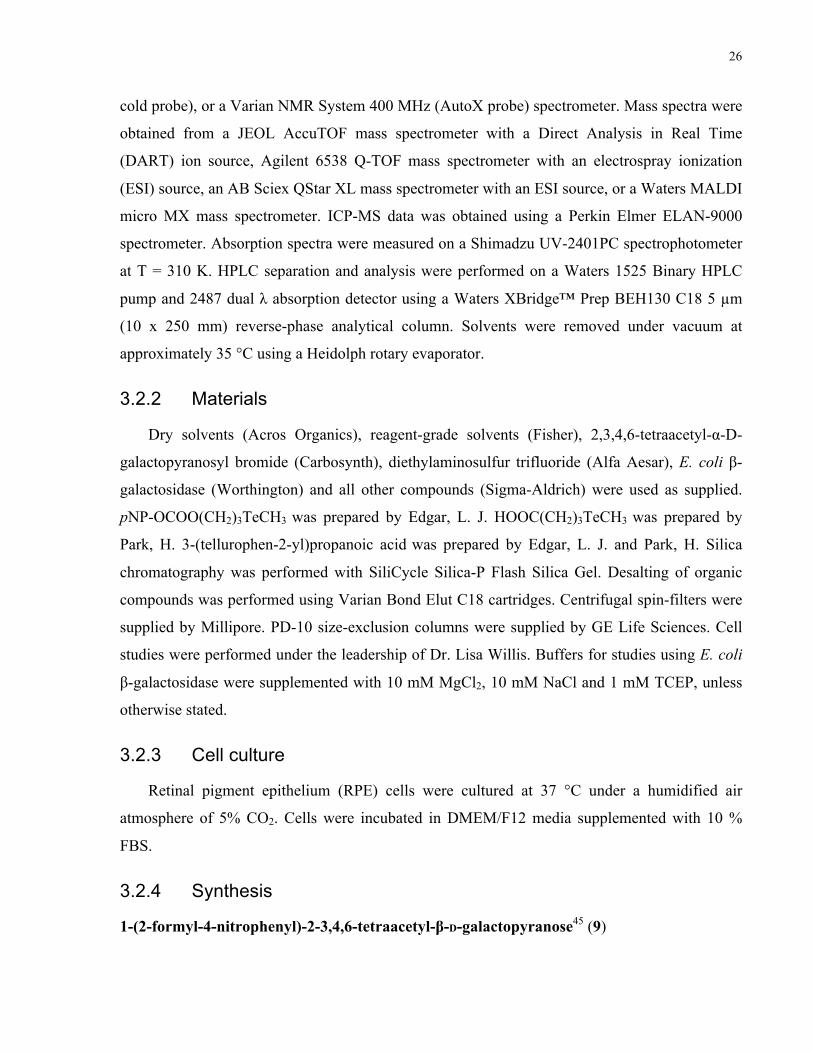
26
cold probe), or a Varian NMR System 400 MHz (AutoX probe) spectrometer. Mass spectra were
obtained from a JEOL AccuTOF mass spectrometer with a Direct Analysis in Real Time
(DART) ion source, Agilent 6538 Q-TOF mass spectrometer with an electrospray ionization
(ESI) source, an AB Sciex QStar XL mass spectrometer with an ESI source, or a Waters MALDI
micro MX mass spectrometer. ICP-MS data was obtained using a Perkin Elmer ELAN-9000
spectrometer. Absorption spectra were measured on a Shimadzu UV-2401PC spectrophotometer
at T = 310 K. HPLC separation and analysis were performed on a Waters 1525 Binary HPLC
pump and 2487 dual λ absorption detector using a Waters XBridge™ Prep BEH130 C18 5 µm
(10 x 250 mm) reverse-phase analytical column. Solvents were removed under vacuum at
approximately 35 °C using a Heidolph rotary evaporator.
3.2.2 Materials
Dry solvents (Acros Organics), reagent-grade solvents (Fisher), 2,3,4,6-tetraacetyl-α-D-
galactopyranosyl bromide (Carbosynth), diethylaminosulfur trifluoride (Alfa Aesar), E. coli β-
galactosidase (Worthington) and all other compounds (Sigma-Aldrich) were used as supplied.
pNP-OCOO(CH2)3TeCH3 was prepared by Edgar, L. J. HOOC(CH2)3TeCH3 was prepared by
Park, H. 3-(tellurophen-2-yl)propanoic acid was prepared by Edgar, L. J. and Park, H. Silica
chromatography was performed with SiliCycle Silica-P Flash Silica Gel. Desalting of organic
compounds was performed using Varian Bond Elut C18 cartridges. Centrifugal spin-filters were
supplied by Millipore. PD-10 size-exclusion columns were supplied by GE Life Sciences. Cell
studies were performed under the leadership of Dr. Lisa Willis. Buffers for studies using E. coli
β-galactosidase were supplemented with 10 mM MgCl2, 10 mM NaCl and 1 mM TCEP, unless
otherwise stated.
3.2.3 Cell culture
Retinal pigment epithelium (RPE) cells were cultured at 37 °C under a humidified air
atmosphere of 5% CO2. Cells were incubated in DMEM/F12 media supplemented with 10 %
FBS.
3.2.4 Synthesis
1-(2-formyl-4-nitrophenyl)-2-3,4,6-tetraacetyl-β-D-galactopyranose45 (9)
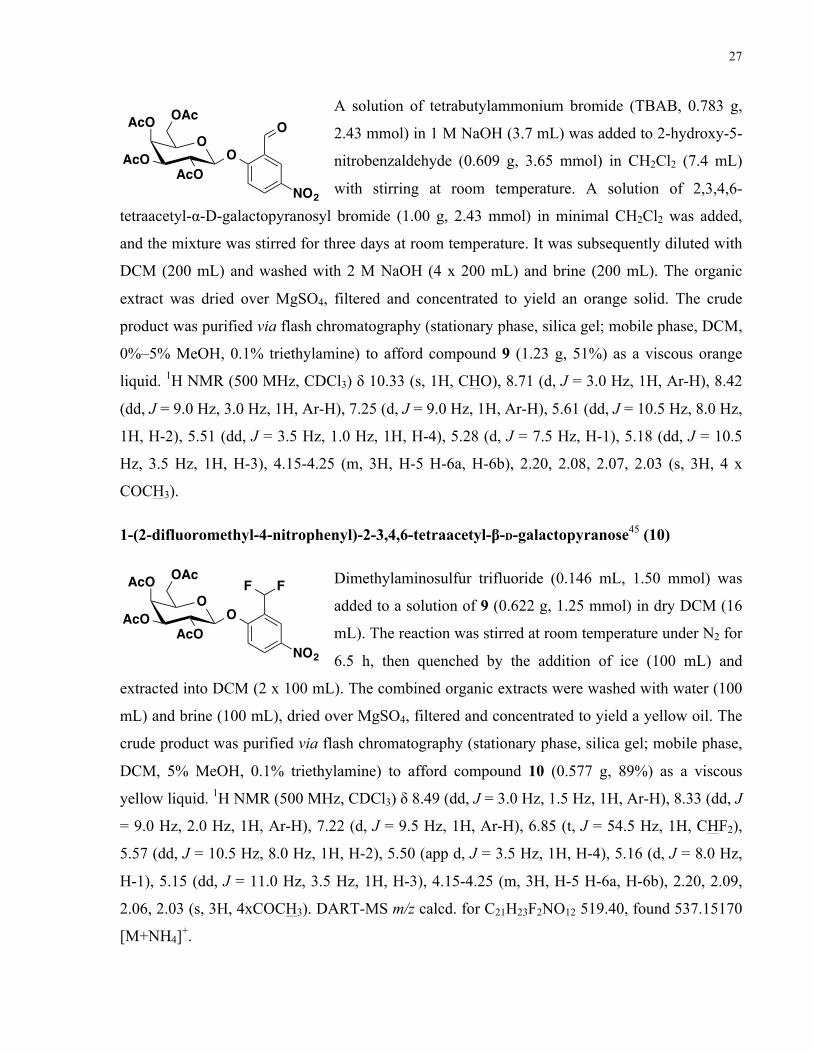
27
A solution of tetrabutylammonium bromide (TBAB, 0.783 g,
2.43 mmol) in 1 M NaOH (3.7 mL) was added to 2-hydroxy-5-
nitrobenzaldehyde (0.609 g, 3.65 mmol) in CH2Cl2 (7.4 mL)
with stirring at room temperature. A solution of 2,3,4,6-
tetraacetyl-α-D-galactopyranosyl bromide (1.00 g, 2.43 mmol) in minimal CH2Cl2 was added,
and the mixture was stirred for three days at room temperature. It was subsequently diluted with
DCM (200 mL) and washed with 2 M NaOH (4 x 200 mL) and brine (200 mL). The organic
extract was dried over MgSO4, filtered and concentrated to yield an orange solid. The crude
product was purified via flash chromatography (stationary phase, silica gel; mobile phase, DCM,
0%–5% MeOH, 0.1% triethylamine) to afford compound 9 (1.23 g, 51%) as a viscous orange
liquid. 1H NMR (500 MHz, CDCl3) δ 10.33 (s, 1H, CHO), 8.71 (d, J = 3.0 Hz, 1H, Ar-H), 8.42
(dd, J = 9.0 Hz, 3.0 Hz, 1H, Ar-H), 7.25 (d, J = 9.0 Hz, 1H, Ar-H), 5.61 (dd, J = 10.5 Hz, 8.0 Hz,
1H, H-2), 5.51 (dd, J = 3.5 Hz, 1.0 Hz, 1H, H-4), 5.28 (d, J = 7.5 Hz, H-1), 5.18 (dd, J = 10.5
Hz, 3.5 Hz, 1H, H-3), 4.15-4.25 (m, 3H, H-5 H-6a, H-6b), 2.20, 2.08, 2.07, 2.03 (s, 3H, 4 x
COCH3).
1-(2-difluoromethyl-4-nitrophenyl)-2-3,4,6-tetraacetyl-β-D-galactopyranose45 (10)
Dimethylaminosulfur trifluoride (0.146 mL, 1.50 mmol) was
added to a solution of 9 (0.622 g, 1.25 mmol) in dry DCM (16
mL). The reaction was stirred at room temperature under N2 for
6.5 h, then quenched by the addition of ice (100 mL) and
extracted into DCM (2 x 100 mL). The combined organic extracts were washed with water (100
mL) and brine (100 mL), dried over MgSO4, filtered and concentrated to yield a yellow oil. The
crude product was purified via flash chromatography (stationary phase, silica gel; mobile phase,
DCM, 5% MeOH, 0.1% triethylamine) to afford compound 10 (0.577 g, 89%) as a viscous
yellow liquid. 1H NMR (500 MHz, CDCl3) δ 8.49 (dd, J = 3.0 Hz, 1.5 Hz, 1H, Ar-H), 8.33 (dd, J
= 9.0 Hz, 2.0 Hz, 1H, Ar-H), 7.22 (d, J = 9.5 Hz, 1H, Ar-H), 6.85 (t, J = 54.5 Hz, 1H, CHF2),
5.57 (dd, J = 10.5 Hz, 8.0 Hz, 1H, H-2), 5.50 (app d, J = 3.5 Hz, 1H, H-4), 5.16 (d, J = 8.0 Hz,
H-1), 5.15 (dd, J = 11.0 Hz, 3.5 Hz, 1H, H-3), 4.15-4.25 (m, 3H, H-5 H-6a, H-6b), 2.20, 2.09,
2.06, 2.03 (s, 3H, 4xCOCH3). DART-MS m/z calcd. for C21H23F2NO12 519.40, found 537.15170
[M+NH4]+.
OAcO
OAc
AcOO
NO2
AcO O
OAcO
OAc
AcOO
NO2
AcO FF
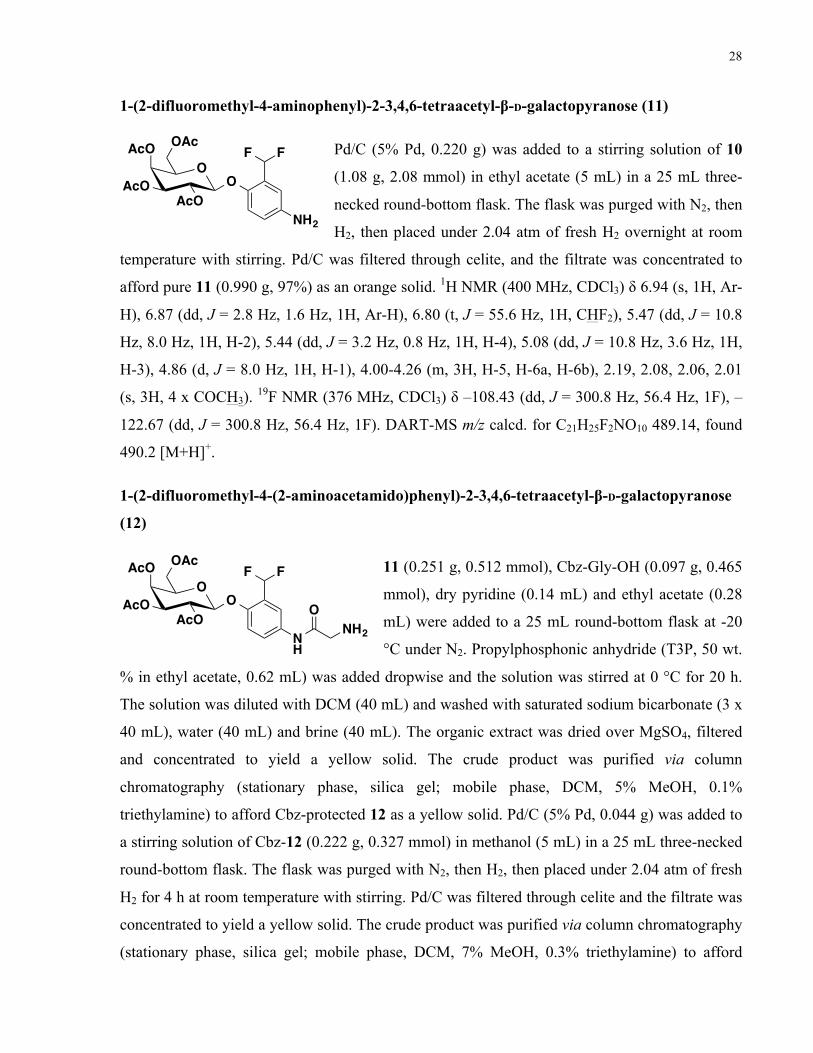
28
1-(2-difluoromethyl-4-aminophenyl)-2-3,4,6-tetraacetyl-β-D-galactopyranose (11)
Pd/C (5% Pd, 0.220 g) was added to a stirring solution of 10
(1.08 g, 2.08 mmol) in ethyl acetate (5 mL) in a 25 mL three-
necked round-bottom flask. The flask was purged with N2, then
H2, then placed under 2.04 atm of fresh H2 overnight at room
temperature with stirring. Pd/C was filtered through celite, and the filtrate was concentrated to
afford pure 11 (0.990 g, 97%) as an orange solid. 1H NMR (400 MHz, CDCl3) δ 6.94 (s, 1H, Ar-
H), 6.87 (dd, J = 2.8 Hz, 1.6 Hz, 1H, Ar-H), 6.80 (t, J = 55.6 Hz, 1H, CHF2), 5.47 (dd, J = 10.8
Hz, 8.0 Hz, 1H, H-2), 5.44 (dd, J = 3.2 Hz, 0.8 Hz, 1H, H-4), 5.08 (dd, J = 10.8 Hz, 3.6 Hz, 1H,
H-3), 4.86 (d, J = 8.0 Hz, 1H, H-1), 4.00-4.26 (m, 3H, H-5, H-6a, H-6b), 2.19, 2.08, 2.06, 2.01
(s, 3H, 4 x COCH3). 19F NMR (376 MHz, CDCl3) δ –108.43 (dd, J = 300.8 Hz, 56.4 Hz, 1F), –
122.67 (dd, J = 300.8 Hz, 56.4 Hz, 1F). DART-MS m/z calcd. for C21H25F2NO10 489.14, found
490.2 [M+H]+.
1-(2-difluoromethyl-4-(2-aminoacetamido)phenyl)-2-3,4,6-tetraacetyl-β-D-galactopyranose
(12)
11 (0.251 g, 0.512 mmol), Cbz-Gly-OH (0.097 g, 0.465
mmol), dry pyridine (0.14 mL) and ethyl acetate (0.28
mL) were added to a 25 mL round-bottom flask at -20
°C under N2. Propylphosphonic anhydride (T3P, 50 wt.
% in ethyl acetate, 0.62 mL) was added dropwise and the solution was stirred at 0 °C for 20 h.
The solution was diluted with DCM (40 mL) and washed with saturated sodium bicarbonate (3 x
40 mL), water (40 mL) and brine (40 mL). The organic extract was dried over MgSO4, filtered
and concentrated to yield a yellow solid. The crude product was purified via column
chromatography (stationary phase, silica gel; mobile phase, DCM, 5% MeOH, 0.1%
triethylamine) to afford Cbz-protected 12 as a yellow solid. Pd/C (5% Pd, 0.044 g) was added to
a stirring solution of Cbz-12 (0.222 g, 0.327 mmol) in methanol (5 mL) in a 25 mL three-necked
round-bottom flask. The flask was purged with N2, then H2, then placed under 2.04 atm of fresh
H2 for 4 h at room temperature with stirring. Pd/C was filtered through celite and the filtrate was
concentrated to yield a yellow solid. The crude product was purified via column chromatography
(stationary phase, silica gel; mobile phase, DCM, 7% MeOH, 0.3% triethylamine) to afford
OAcO
OAc
AcOO
NH2
AcO FF
OAcO
OAc
AcOO
NH
AcO FF
ONH2
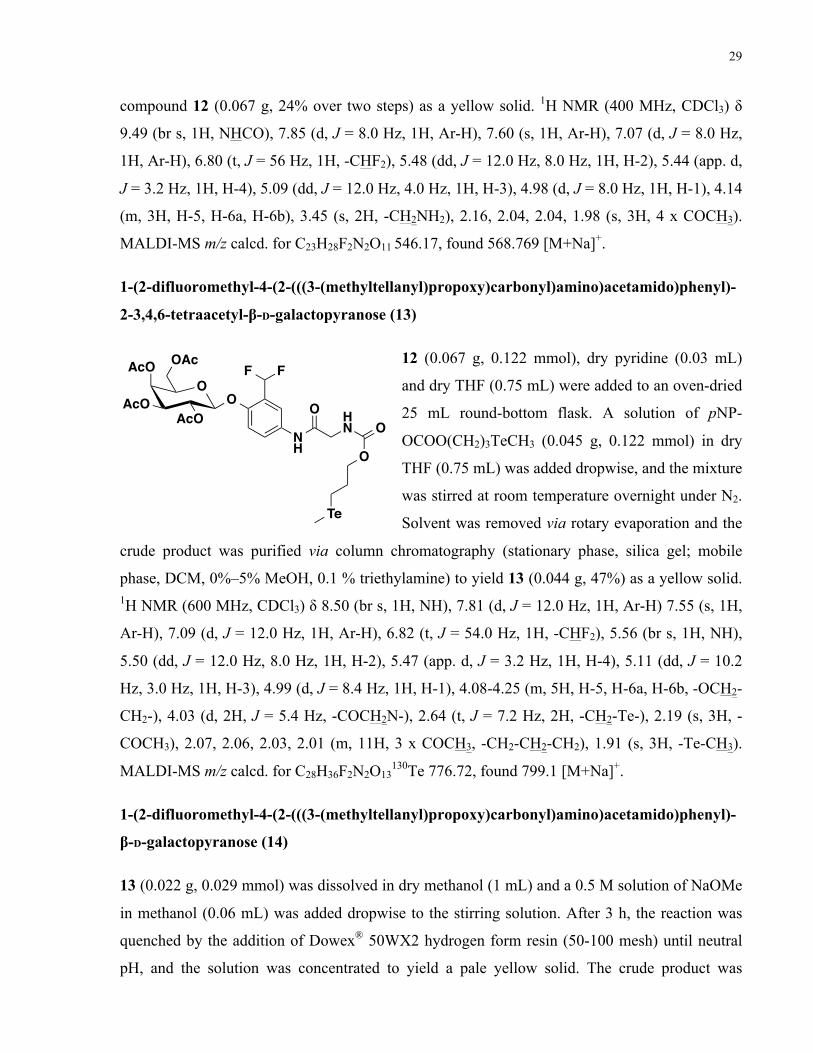
29
compound 12 (0.067 g, 24% over two steps) as a yellow solid. 1H NMR (400 MHz, CDCl3) δ
9.49 (br s, 1H, NHCO), 7.85 (d, J = 8.0 Hz, 1H, Ar-H), 7.60 (s, 1H, Ar-H), 7.07 (d, J = 8.0 Hz,
1H, Ar-H), 6.80 (t, J = 56 Hz, 1H, -CHF2), 5.48 (dd, J = 12.0 Hz, 8.0 Hz, 1H, H-2), 5.44 (app. d,
J = 3.2 Hz, 1H, H-4), 5.09 (dd, J = 12.0 Hz, 4.0 Hz, 1H, H-3), 4.98 (d, J = 8.0 Hz, 1H, H-1), 4.14
(m, 3H, H-5, H-6a, H-6b), 3.45 (s, 2H, -CH2NH2), 2.16, 2.04, 2.04, 1.98 (s, 3H, 4 x COCH3).
MALDI-MS m/z calcd. for C23H28F2N2O11 546.17, found 568.769 [M+Na]+.
1-(2-difluoromethyl-4-(2-(((3-(methyltellanyl)propoxy)carbonyl)amino)acetamido)phenyl)-
2-3,4,6-tetraacetyl-β-D-galactopyranose (13)
12 (0.067 g, 0.122 mmol), dry pyridine (0.03 mL)
and dry THF (0.75 mL) were added to an oven-dried
25 mL round-bottom flask. A solution of pNP-
OCOO(CH2)3TeCH3 (0.045 g, 0.122 mmol) in dry
THF (0.75 mL) was added dropwise, and the mixture
was stirred at room temperature overnight under N2.
Solvent was removed via rotary evaporation and the
crude product was purified via column chromatography (stationary phase, silica gel; mobile
phase, DCM, 0%–5% MeOH, 0.1 % triethylamine) to yield 13 (0.044 g, 47%) as a yellow solid. 1H NMR (600 MHz, CDCl3) δ 8.50 (br s, 1H, NH), 7.81 (d, J = 12.0 Hz, 1H, Ar-H) 7.55 (s, 1H,
Ar-H), 7.09 (d, J = 12.0 Hz, 1H, Ar-H), 6.82 (t, J = 54.0 Hz, 1H, -CHF2), 5.56 (br s, 1H, NH),
5.50 (dd, J = 12.0 Hz, 8.0 Hz, 1H, H-2), 5.47 (app. d, J = 3.2 Hz, 1H, H-4), 5.11 (dd, J = 10.2
Hz, 3.0 Hz, 1H, H-3), 4.99 (d, J = 8.4 Hz, 1H, H-1), 4.08-4.25 (m, 5H, H-5, H-6a, H-6b, -OCH2-
CH2-), 4.03 (d, 2H, J = 5.4 Hz, -COCH2N-), 2.64 (t, J = 7.2 Hz, 2H, -CH2-Te-), 2.19 (s, 3H, -
COCH3), 2.07, 2.06, 2.03, 2.01 (m, 11H, 3 x COCH3, -CH2-CH2-CH2), 1.91 (s, 3H, -Te-CH3).
MALDI-MS m/z calcd. for C28H36F2N2O13130Te 776.72, found 799.1 [M+Na]+.
1-(2-difluoromethyl-4-(2-(((3-(methyltellanyl)propoxy)carbonyl)amino)acetamido)phenyl)-
β-D-galactopyranose (14)
13 (0.022 g, 0.029 mmol) was dissolved in dry methanol (1 mL) and a 0.5 M solution of NaOMe
in methanol (0.06 mL) was added dropwise to the stirring solution. After 3 h, the reaction was
quenched by the addition of Dowex® 50WX2 hydrogen form resin (50-100 mesh) until neutral
pH, and the solution was concentrated to yield a pale yellow solid. The crude product was
OAcO
OAc
AcOO
NH
AcO FF
O HN
O
O
Te
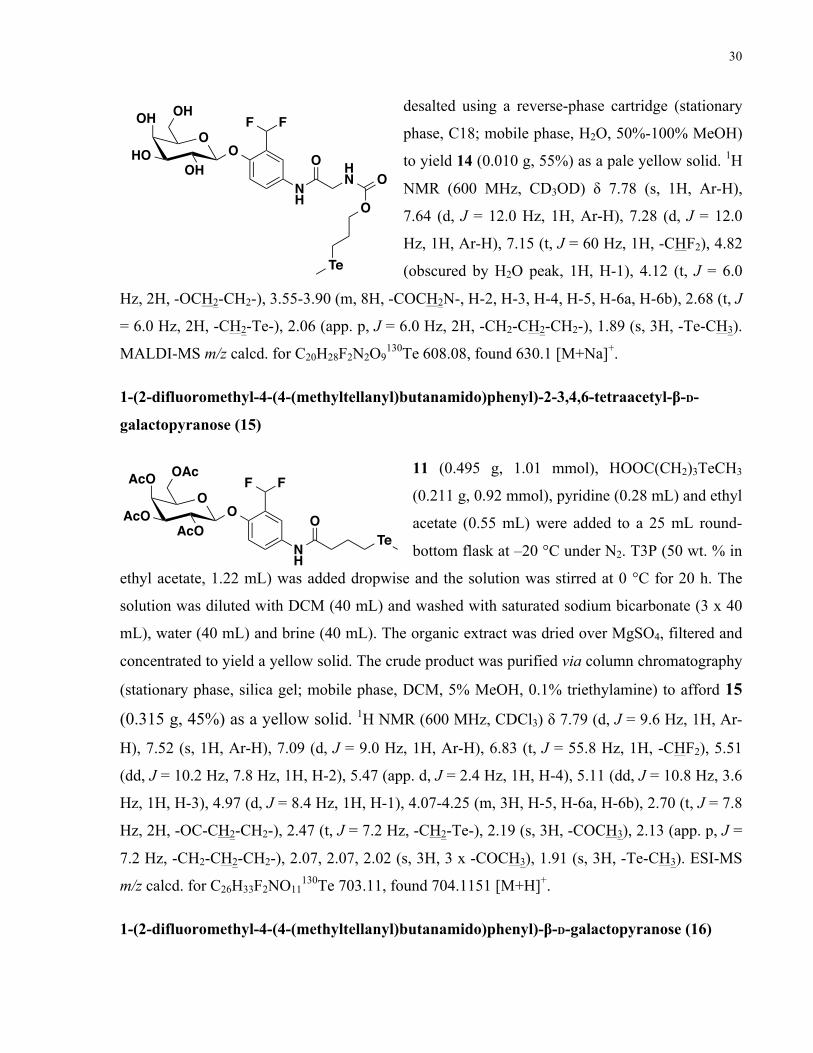
30
desalted using a reverse-phase cartridge (stationary
phase, C18; mobile phase, H2O, 50%-100% MeOH)
to yield 14 (0.010 g, 55%) as a pale yellow solid. 1H
NMR (600 MHz, CD3OD) δ 7.78 (s, 1H, Ar-H),
7.64 (d, J = 12.0 Hz, 1H, Ar-H), 7.28 (d, J = 12.0
Hz, 1H, Ar-H), 7.15 (t, J = 60 Hz, 1H, -CHF2), 4.82
(obscured by H2O peak, 1H, H-1), 4.12 (t, J = 6.0
Hz, 2H, -OCH2-CH2-), 3.55-3.90 (m, 8H, -COCH2N-, H-2, H-3, H-4, H-5, H-6a, H-6b), 2.68 (t, J
= 6.0 Hz, 2H, -CH2-Te-), 2.06 (app. p, J = 6.0 Hz, 2H, -CH2-CH2-CH2-), 1.89 (s, 3H, -Te-CH3).
MALDI-MS m/z calcd. for C20H28F2N2O9130Te 608.08, found 630.1 [M+Na]+.
1-(2-difluoromethyl-4-(4-(methyltellanyl)butanamido)phenyl)-2-3,4,6-tetraacetyl-β-D-
galactopyranose (15)
11 (0.495 g, 1.01 mmol), HOOC(CH2)3TeCH3
(0.211 g, 0.92 mmol), pyridine (0.28 mL) and ethyl
acetate (0.55 mL) were added to a 25 mL round-
bottom flask at –20 °C under N2. T3P (50 wt. % in
ethyl acetate, 1.22 mL) was added dropwise and the solution was stirred at 0 °C for 20 h. The
solution was diluted with DCM (40 mL) and washed with saturated sodium bicarbonate (3 x 40
mL), water (40 mL) and brine (40 mL). The organic extract was dried over MgSO4, filtered and
concentrated to yield a yellow solid. The crude product was purified via column chromatography
(stationary phase, silica gel; mobile phase, DCM, 5% MeOH, 0.1% triethylamine) to afford 15
(0.315 g, 45%) as a yellow solid. 1H NMR (600 MHz, CDCl3) δ 7.79 (d, J = 9.6 Hz, 1H, Ar-
H), 7.52 (s, 1H, Ar-H), 7.09 (d, J = 9.0 Hz, 1H, Ar-H), 6.83 (t, J = 55.8 Hz, 1H, -CHF2), 5.51
(dd, J = 10.2 Hz, 7.8 Hz, 1H, H-2), 5.47 (app. d, J = 2.4 Hz, 1H, H-4), 5.11 (dd, J = 10.8 Hz, 3.6
Hz, 1H, H-3), 4.97 (d, J = 8.4 Hz, 1H, H-1), 4.07-4.25 (m, 3H, H-5, H-6a, H-6b), 2.70 (t, J = 7.8
Hz, 2H, -OC-CH2-CH2-), 2.47 (t, J = 7.2 Hz, -CH2-Te-), 2.19 (s, 3H, -COCH3), 2.13 (app. p, J =
7.2 Hz, -CH2-CH2-CH2-), 2.07, 2.07, 2.02 (s, 3H, 3 x -COCH3), 1.91 (s, 3H, -Te-CH3). ESI-MS
m/z calcd. for C26H33F2NO11130Te 703.11, found 704.1151 [M+H]+.
1-(2-difluoromethyl-4-(4-(methyltellanyl)butanamido)phenyl)-β-D-galactopyranose (16)
OHO
OH
OHO
NH
OH FF
O HN
O
O
Te
OAcO
OAc
AcOO
NH
AcO FF
OTe
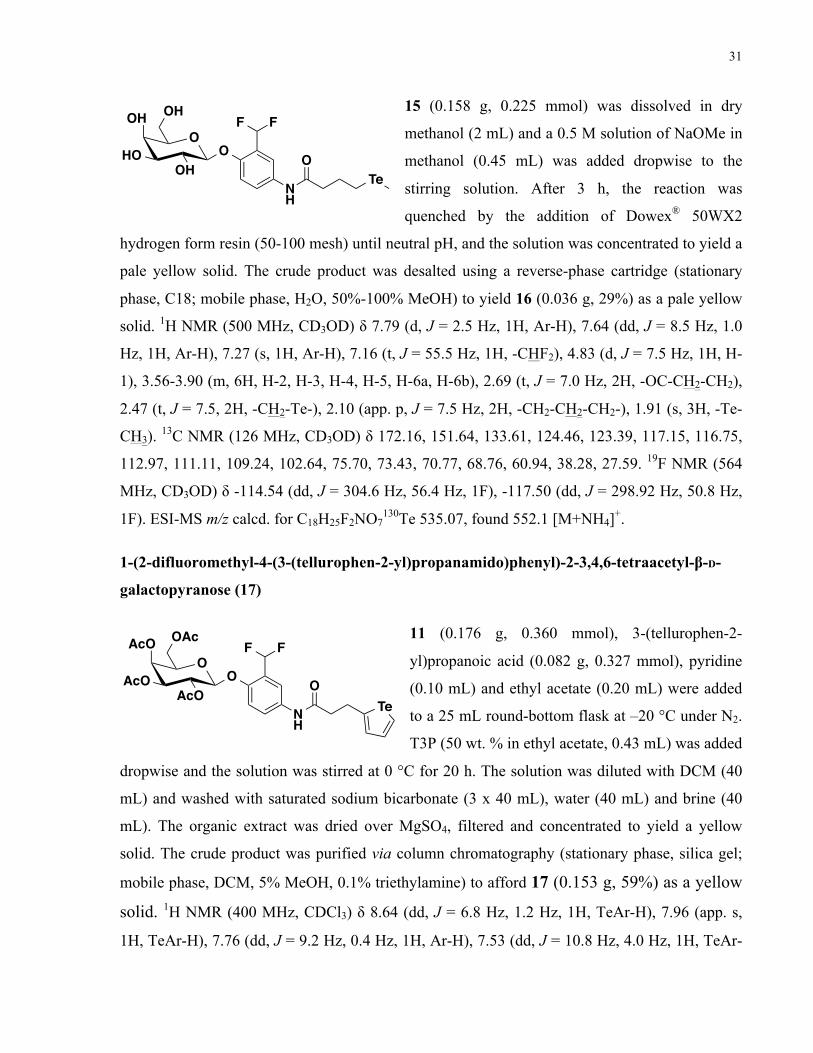
31
15 (0.158 g, 0.225 mmol) was dissolved in dry
methanol (2 mL) and a 0.5 M solution of NaOMe in
methanol (0.45 mL) was added dropwise to the
stirring solution. After 3 h, the reaction was
quenched by the addition of Dowex® 50WX2
hydrogen form resin (50-100 mesh) until neutral pH, and the solution was concentrated to yield a
pale yellow solid. The crude product was desalted using a reverse-phase cartridge (stationary
phase, C18; mobile phase, H2O, 50%-100% MeOH) to yield 16 (0.036 g, 29%) as a pale yellow
solid. 1H NMR (500 MHz, CD3OD) δ 7.79 (d, J = 2.5 Hz, 1H, Ar-H), 7.64 (dd, J = 8.5 Hz, 1.0
Hz, 1H, Ar-H), 7.27 (s, 1H, Ar-H), 7.16 (t, J = 55.5 Hz, 1H, -CHF2), 4.83 (d, J = 7.5 Hz, 1H, H-
1), 3.56-3.90 (m, 6H, H-2, H-3, H-4, H-5, H-6a, H-6b), 2.69 (t, J = 7.0 Hz, 2H, -OC-CH2-CH2),
2.47 (t, J = 7.5, 2H, -CH2-Te-), 2.10 (app. p, J = 7.5 Hz, 2H, -CH2-CH2-CH2-), 1.91 (s, 3H, -Te-
CH3). 13C NMR (126 MHz, CD3OD) δ 172.16, 151.64, 133.61, 124.46, 123.39, 117.15, 116.75,
112.97, 111.11, 109.24, 102.64, 75.70, 73.43, 70.77, 68.76, 60.94, 38.28, 27.59. 19F NMR (564
MHz, CD3OD) δ -114.54 (dd, J = 304.6 Hz, 56.4 Hz, 1F), -117.50 (dd, J = 298.92 Hz, 50.8 Hz,
1F). ESI-MS m/z calcd. for C18H25F2NO7130Te 535.07, found 552.1 [M+NH4]+.
1-(2-difluoromethyl-4-(3-(tellurophen-2-yl)propanamido)phenyl)-2-3,4,6-tetraacetyl-β-D-
galactopyranose (17)
11 (0.176 g, 0.360 mmol), 3-(tellurophen-2-
yl)propanoic acid (0.082 g, 0.327 mmol), pyridine
(0.10 mL) and ethyl acetate (0.20 mL) were added
to a 25 mL round-bottom flask at –20 °C under N2.
T3P (50 wt. % in ethyl acetate, 0.43 mL) was added
dropwise and the solution was stirred at 0 °C for 20 h. The solution was diluted with DCM (40
mL) and washed with saturated sodium bicarbonate (3 x 40 mL), water (40 mL) and brine (40
mL). The organic extract was dried over MgSO4, filtered and concentrated to yield a yellow
solid. The crude product was purified via column chromatography (stationary phase, silica gel;
mobile phase, DCM, 5% MeOH, 0.1% triethylamine) to afford 17 (0.153 g, 59%) as a yellow
solid. 1H NMR (400 MHz, CDCl3) δ 8.64 (dd, J = 6.8 Hz, 1.2 Hz, 1H, TeAr-H), 7.96 (app. s,
1H, TeAr-H), 7.76 (dd, J = 9.2 Hz, 0.4 Hz, 1H, Ar-H), 7.53 (dd, J = 10.8 Hz, 4.0 Hz, 1H, TeAr-
OHO
OH
OHO
NH
OH FF
OTe
OAcO
OAc
AcOO
NH
AcO FF
OTe
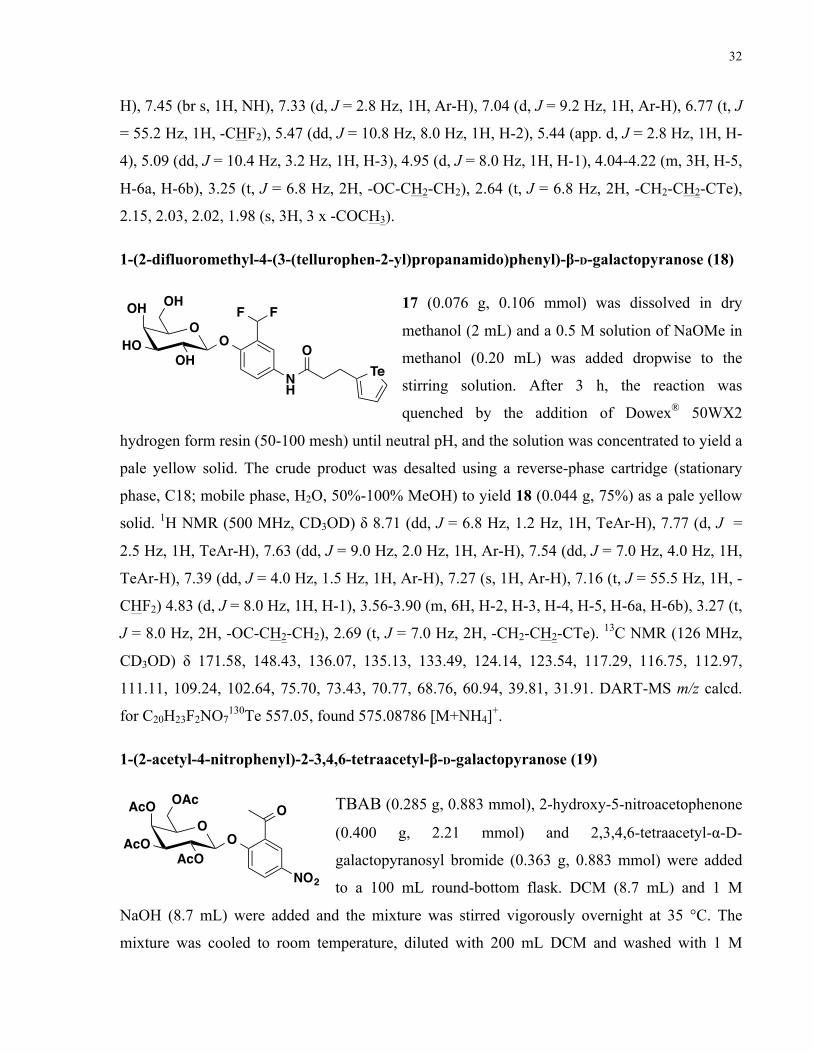
32
H), 7.45 (br s, 1H, NH), 7.33 (d, J = 2.8 Hz, 1H, Ar-H), 7.04 (d, J = 9.2 Hz, 1H, Ar-H), 6.77 (t, J
= 55.2 Hz, 1H, -CHF2), 5.47 (dd, J = 10.8 Hz, 8.0 Hz, 1H, H-2), 5.44 (app. d, J = 2.8 Hz, 1H, H-
4), 5.09 (dd, J = 10.4 Hz, 3.2 Hz, 1H, H-3), 4.95 (d, J = 8.0 Hz, 1H, H-1), 4.04-4.22 (m, 3H, H-5,
H-6a, H-6b), 3.25 (t, J = 6.8 Hz, 2H, -OC-CH2-CH2), 2.64 (t, J = 6.8 Hz, 2H, -CH2-CH2-CTe),
2.15, 2.03, 2.02, 1.98 (s, 3H, 3 x -COCH3).
1-(2-difluoromethyl-4-(3-(tellurophen-2-yl)propanamido)phenyl)-β-D-galactopyranose (18)
17 (0.076 g, 0.106 mmol) was dissolved in dry
methanol (2 mL) and a 0.5 M solution of NaOMe in
methanol (0.20 mL) was added dropwise to the
stirring solution. After 3 h, the reaction was
quenched by the addition of Dowex® 50WX2
hydrogen form resin (50-100 mesh) until neutral pH, and the solution was concentrated to yield a
pale yellow solid. The crude product was desalted using a reverse-phase cartridge (stationary
phase, C18; mobile phase, H2O, 50%-100% MeOH) to yield 18 (0.044 g, 75%) as a pale yellow
solid. 1H NMR (500 MHz, CD3OD) δ 8.71 (dd, J = 6.8 Hz, 1.2 Hz, 1H, TeAr-H), 7.77 (d, J =
2.5 Hz, 1H, TeAr-H), 7.63 (dd, J = 9.0 Hz, 2.0 Hz, 1H, Ar-H), 7.54 (dd, J = 7.0 Hz, 4.0 Hz, 1H,
TeAr-H), 7.39 (dd, J = 4.0 Hz, 1.5 Hz, 1H, Ar-H), 7.27 (s, 1H, Ar-H), 7.16 (t, J = 55.5 Hz, 1H, -
CHF2) 4.83 (d, J = 8.0 Hz, 1H, H-1), 3.56-3.90 (m, 6H, H-2, H-3, H-4, H-5, H-6a, H-6b), 3.27 (t,
J = 8.0 Hz, 2H, -OC-CH2-CH2), 2.69 (t, J = 7.0 Hz, 2H, -CH2-CH2-CTe). 13C NMR (126 MHz,
CD3OD) δ 171.58, 148.43, 136.07, 135.13, 133.49, 124.14, 123.54, 117.29, 116.75, 112.97,
111.11, 109.24, 102.64, 75.70, 73.43, 70.77, 68.76, 60.94, 39.81, 31.91. DART-MS m/z calcd.
for C20H23F2NO7130Te 557.05, found 575.08786 [M+NH4]+.
1-(2-acetyl-4-nitrophenyl)-2-3,4,6-tetraacetyl-β-D-galactopyranose (19)
TBAB (0.285 g, 0.883 mmol), 2-hydroxy-5-nitroacetophenone
(0.400 g, 2.21 mmol) and 2,3,4,6-tetraacetyl-α-D-
galactopyranosyl bromide (0.363 g, 0.883 mmol) were added
to a 100 mL round-bottom flask. DCM (8.7 mL) and 1 M
NaOH (8.7 mL) were added and the mixture was stirred vigorously overnight at 35 °C. The
mixture was cooled to room temperature, diluted with 200 mL DCM and washed with 1 M
OHO
OH
OHO
NH
OH FF
OTe
OAcO
OAc
AcOO
NO2
AcO O
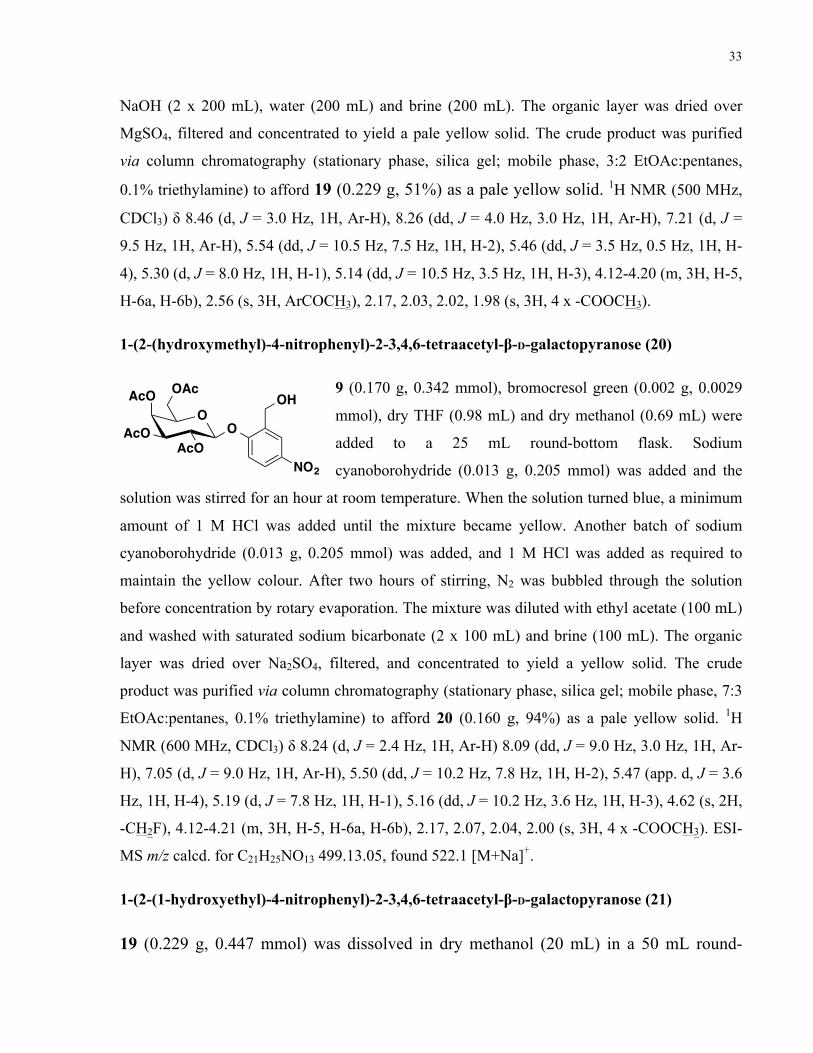
33
NaOH (2 x 200 mL), water (200 mL) and brine (200 mL). The organic layer was dried over
MgSO4, filtered and concentrated to yield a pale yellow solid. The crude product was purified
via column chromatography (stationary phase, silica gel; mobile phase, 3:2 EtOAc:pentanes,
0.1% triethylamine) to afford 19 (0.229 g, 51%) as a pale yellow solid. 1H NMR (500 MHz,
CDCl3) δ 8.46 (d, J = 3.0 Hz, 1H, Ar-H), 8.26 (dd, J = 4.0 Hz, 3.0 Hz, 1H, Ar-H), 7.21 (d, J =
9.5 Hz, 1H, Ar-H), 5.54 (dd, J = 10.5 Hz, 7.5 Hz, 1H, H-2), 5.46 (dd, J = 3.5 Hz, 0.5 Hz, 1H, H-
4), 5.30 (d, J = 8.0 Hz, 1H, H-1), 5.14 (dd, J = 10.5 Hz, 3.5 Hz, 1H, H-3), 4.12-4.20 (m, 3H, H-5,
H-6a, H-6b), 2.56 (s, 3H, ArCOCH3), 2.17, 2.03, 2.02, 1.98 (s, 3H, 4 x -COOCH3).
1-(2-(hydroxymethyl)-4-nitrophenyl)-2-3,4,6-tetraacetyl-β-D-galactopyranose (20)
9 (0.170 g, 0.342 mmol), bromocresol green (0.002 g, 0.0029
mmol), dry THF (0.98 mL) and dry methanol (0.69 mL) were
added to a 25 mL round-bottom flask. Sodium
cyanoborohydride (0.013 g, 0.205 mmol) was added and the
solution was stirred for an hour at room temperature. When the solution turned blue, a minimum
amount of 1 M HCl was added until the mixture became yellow. Another batch of sodium
cyanoborohydride (0.013 g, 0.205 mmol) was added, and 1 M HCl was added as required to
maintain the yellow colour. After two hours of stirring, N2 was bubbled through the solution
before concentration by rotary evaporation. The mixture was diluted with ethyl acetate (100 mL)
and washed with saturated sodium bicarbonate (2 x 100 mL) and brine (100 mL). The organic
layer was dried over Na2SO4, filtered, and concentrated to yield a yellow solid. The crude
product was purified via column chromatography (stationary phase, silica gel; mobile phase, 7:3
EtOAc:pentanes, 0.1% triethylamine) to afford 20 (0.160 g, 94%) as a pale yellow solid. 1H
NMR (600 MHz, CDCl3) δ 8.24 (d, J = 2.4 Hz, 1H, Ar-H) 8.09 (dd, J = 9.0 Hz, 3.0 Hz, 1H, Ar-
H), 7.05 (d, J = 9.0 Hz, 1H, Ar-H), 5.50 (dd, J = 10.2 Hz, 7.8 Hz, 1H, H-2), 5.47 (app. d, J = 3.6
Hz, 1H, H-4), 5.19 (d, J = 7.8 Hz, 1H, H-1), 5.16 (dd, J = 10.2 Hz, 3.6 Hz, 1H, H-3), 4.62 (s, 2H,
-CH2F), 4.12-4.21 (m, 3H, H-5, H-6a, H-6b), 2.17, 2.07, 2.04, 2.00 (s, 3H, 4 x -COOCH3). ESI-
MS m/z calcd. for C21H25NO13 499.13.05, found 522.1 [M+Na]+.
1-(2-(1-hydroxyethyl)-4-nitrophenyl)-2-3,4,6-tetraacetyl-β-D-galactopyranose (21)
19 (0.229 g, 0.447 mmol) was dissolved in dry methanol (20 mL) in a 50 mL round-
OAcO
OAc
AcOO
NO2
AcO OH
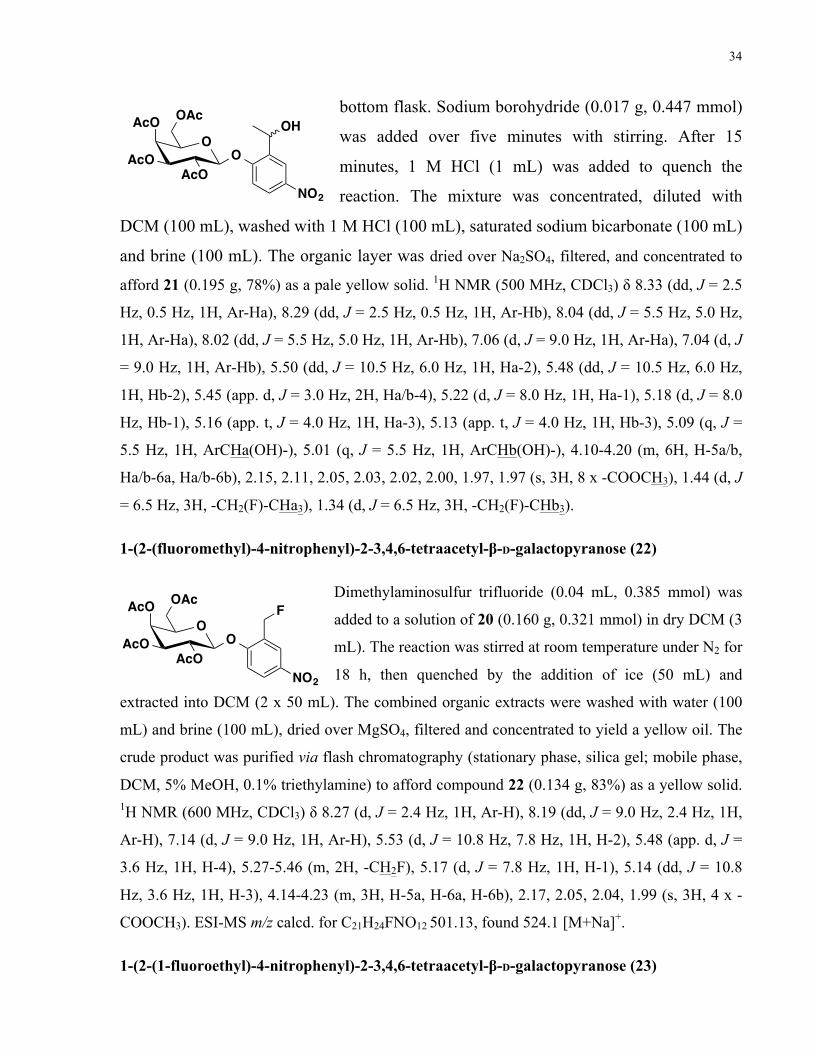
34
bottom flask. Sodium borohydride (0.017 g, 0.447 mmol)
was added over five minutes with stirring. After 15
minutes, 1 M HCl (1 mL) was added to quench the
reaction. The mixture was concentrated, diluted with
DCM (100 mL), washed with 1 M HCl (100 mL), saturated sodium bicarbonate (100 mL)
and brine (100 mL). The organic layer was dried over Na2SO4, filtered, and concentrated to
afford 21 (0.195 g, 78%) as a pale yellow solid. 1H NMR (500 MHz, CDCl3) δ 8.33 (dd, J = 2.5
Hz, 0.5 Hz, 1H, Ar-Ha), 8.29 (dd, J = 2.5 Hz, 0.5 Hz, 1H, Ar-Hb), 8.04 (dd, J = 5.5 Hz, 5.0 Hz,
1H, Ar-Ha), 8.02 (dd, J = 5.5 Hz, 5.0 Hz, 1H, Ar-Hb), 7.06 (d, J = 9.0 Hz, 1H, Ar-Ha), 7.04 (d, J
= 9.0 Hz, 1H, Ar-Hb), 5.50 (dd, J = 10.5 Hz, 6.0 Hz, 1H, Ha-2), 5.48 (dd, J = 10.5 Hz, 6.0 Hz,
1H, Hb-2), 5.45 (app. d, J = 3.0 Hz, 2H, Ha/b-4), 5.22 (d, J = 8.0 Hz, 1H, Ha-1), 5.18 (d, J = 8.0
Hz, Hb-1), 5.16 (app. t, J = 4.0 Hz, 1H, Ha-3), 5.13 (app. t, J = 4.0 Hz, 1H, Hb-3), 5.09 (q, J =
5.5 Hz, 1H, ArCHa(OH)-), 5.01 (q, J = 5.5 Hz, 1H, ArCHb(OH)-), 4.10-4.20 (m, 6H, H-5a/b,
Ha/b-6a, Ha/b-6b), 2.15, 2.11, 2.05, 2.03, 2.02, 2.00, 1.97, 1.97 (s, 3H, 8 x -COOCH3), 1.44 (d, J
= 6.5 Hz, 3H, -CH2(F)-CHa3), 1.34 (d, J = 6.5 Hz, 3H, -CH2(F)-CHb3).
1-(2-(fluoromethyl)-4-nitrophenyl)-2-3,4,6-tetraacetyl-β-D-galactopyranose (22)
Dimethylaminosulfur trifluoride (0.04 mL, 0.385 mmol) was
added to a solution of 20 (0.160 g, 0.321 mmol) in dry DCM (3
mL). The reaction was stirred at room temperature under N2 for
18 h, then quenched by the addition of ice (50 mL) and
extracted into DCM (2 x 50 mL). The combined organic extracts were washed with water (100
mL) and brine (100 mL), dried over MgSO4, filtered and concentrated to yield a yellow oil. The
crude product was purified via flash chromatography (stationary phase, silica gel; mobile phase,
DCM, 5% MeOH, 0.1% triethylamine) to afford compound 22 (0.134 g, 83%) as a yellow solid. 1H NMR (600 MHz, CDCl3) δ 8.27 (d, J = 2.4 Hz, 1H, Ar-H), 8.19 (dd, J = 9.0 Hz, 2.4 Hz, 1H,
Ar-H), 7.14 (d, J = 9.0 Hz, 1H, Ar-H), 5.53 (d, J = 10.8 Hz, 7.8 Hz, 1H, H-2), 5.48 (app. d, J =
3.6 Hz, 1H, H-4), 5.27-5.46 (m, 2H, -CH2F), 5.17 (d, J = 7.8 Hz, 1H, H-1), 5.14 (dd, J = 10.8
Hz, 3.6 Hz, 1H, H-3), 4.14-4.23 (m, 3H, H-5a, H-6a, H-6b), 2.17, 2.05, 2.04, 1.99 (s, 3H, 4 x -
COOCH3). ESI-MS m/z calcd. for C21H24FNO12 501.13, found 524.1 [M+Na]+.
1-(2-(1-fluoroethyl)-4-nitrophenyl)-2-3,4,6-tetraacetyl-β-D-galactopyranose (23)
OAcO
OAc
AcOO
NO2
AcO OH
OAcO
OAc
AcOO
NO2
AcO F
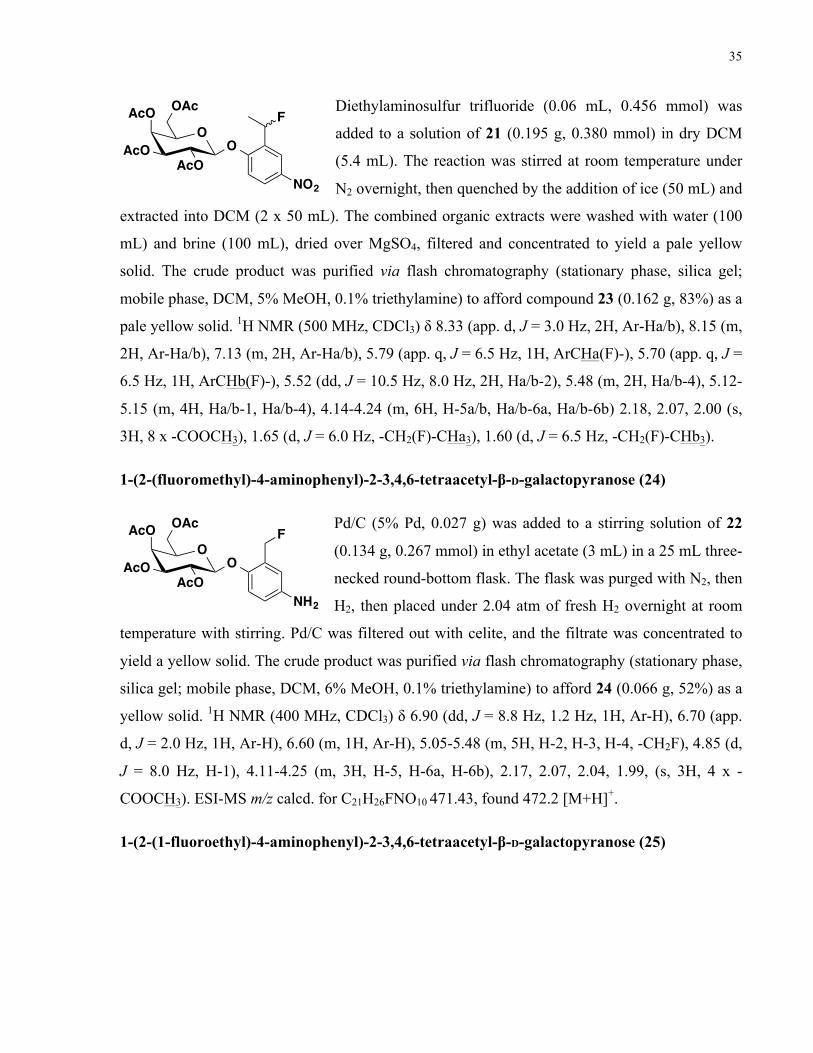
35
Diethylaminosulfur trifluoride (0.06 mL, 0.456 mmol) was
added to a solution of 21 (0.195 g, 0.380 mmol) in dry DCM
(5.4 mL). The reaction was stirred at room temperature under
N2 overnight, then quenched by the addition of ice (50 mL) and
extracted into DCM (2 x 50 mL). The combined organic extracts were washed with water (100
mL) and brine (100 mL), dried over MgSO4, filtered and concentrated to yield a pale yellow
solid. The crude product was purified via flash chromatography (stationary phase, silica gel;
mobile phase, DCM, 5% MeOH, 0.1% triethylamine) to afford compound 23 (0.162 g, 83%) as a
pale yellow solid. 1H NMR (500 MHz, CDCl3) δ 8.33 (app. d, J = 3.0 Hz, 2H, Ar-Ha/b), 8.15 (m,
2H, Ar-Ha/b), 7.13 (m, 2H, Ar-Ha/b), 5.79 (app. q, J = 6.5 Hz, 1H, ArCHa(F)-), 5.70 (app. q, J =
6.5 Hz, 1H, ArCHb(F)-), 5.52 (dd, J = 10.5 Hz, 8.0 Hz, 2H, Ha/b-2), 5.48 (m, 2H, Ha/b-4), 5.12-
5.15 (m, 4H, Ha/b-1, Ha/b-4), 4.14-4.24 (m, 6H, H-5a/b, Ha/b-6a, Ha/b-6b) 2.18, 2.07, 2.00 (s,
3H, 8 x -COOCH3), 1.65 (d, J = 6.0 Hz, -CH2(F)-CHa3), 1.60 (d, J = 6.5 Hz, -CH2(F)-CHb3).
1-(2-(fluoromethyl)-4-aminophenyl)-2-3,4,6-tetraacetyl-β-D-galactopyranose (24)
Pd/C (5% Pd, 0.027 g) was added to a stirring solution of 22
(0.134 g, 0.267 mmol) in ethyl acetate (3 mL) in a 25 mL three-
necked round-bottom flask. The flask was purged with N2, then
H2, then placed under 2.04 atm of fresh H2 overnight at room
temperature with stirring. Pd/C was filtered out with celite, and the filtrate was concentrated to
yield a yellow solid. The crude product was purified via flash chromatography (stationary phase,
silica gel; mobile phase, DCM, 6% MeOH, 0.1% triethylamine) to afford 24 (0.066 g, 52%) as a
yellow solid. 1H NMR (400 MHz, CDCl3) δ 6.90 (dd, J = 8.8 Hz, 1.2 Hz, 1H, Ar-H), 6.70 (app.
d, J = 2.0 Hz, 1H, Ar-H), 6.60 (m, 1H, Ar-H), 5.05-5.48 (m, 5H, H-2, H-3, H-4, -CH2F), 4.85 (d,
J = 8.0 Hz, H-1), 4.11-4.25 (m, 3H, H-5, H-6a, H-6b), 2.17, 2.07, 2.04, 1.99, (s, 3H, 4 x -
COOCH3). ESI-MS m/z calcd. for C21H26FNO10 471.43, found 472.2 [M+H]+.
1-(2-(1-fluoroethyl)-4-aminophenyl)-2-3,4,6-tetraacetyl-β-D-galactopyranose (25)
OAcO
OAc
AcOO
NO2
AcO F
OAcO
OAc
AcOO
NH2
AcO F
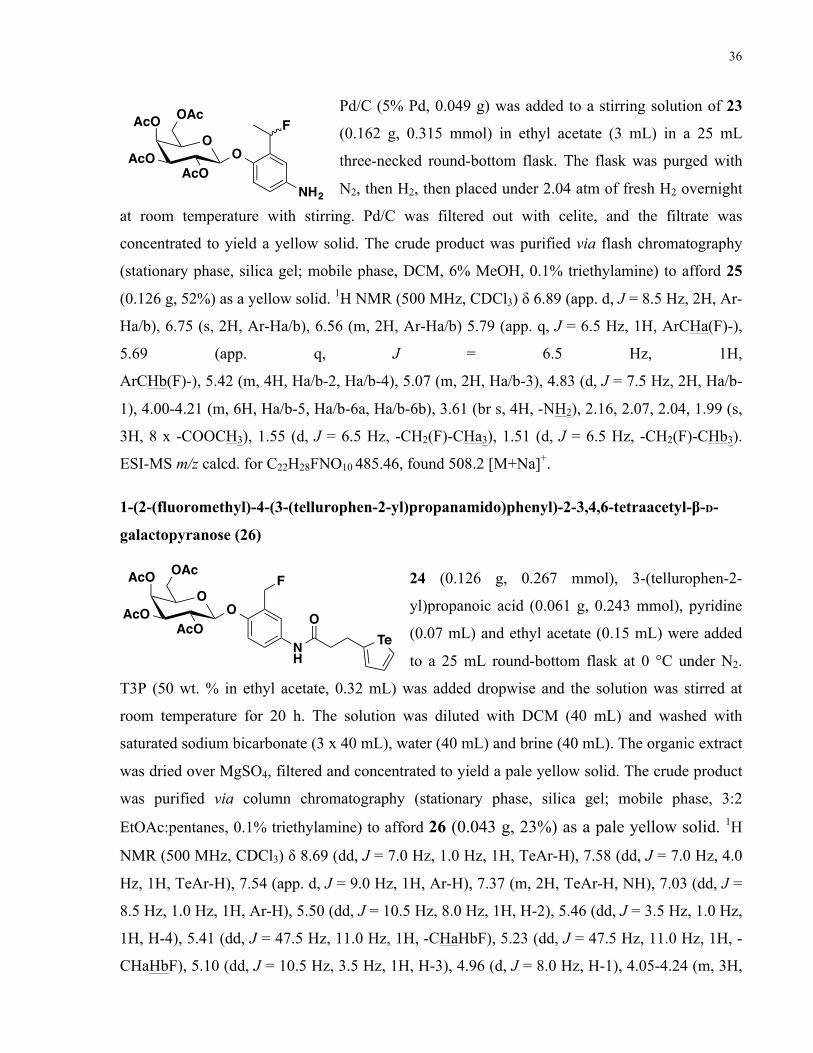
36
Pd/C (5% Pd, 0.049 g) was added to a stirring solution of 23
(0.162 g, 0.315 mmol) in ethyl acetate (3 mL) in a 25 mL
three-necked round-bottom flask. The flask was purged with
N2, then H2, then placed under 2.04 atm of fresh H2 overnight
at room temperature with stirring. Pd/C was filtered out with celite, and the filtrate was
concentrated to yield a yellow solid. The crude product was purified via flash chromatography
(stationary phase, silica gel; mobile phase, DCM, 6% MeOH, 0.1% triethylamine) to afford 25
(0.126 g, 52%) as a yellow solid. 1H NMR (500 MHz, CDCl3) δ 6.89 (app. d, J = 8.5 Hz, 2H, Ar-
Ha/b), 6.75 (s, 2H, Ar-Ha/b), 6.56 (m, 2H, Ar-Ha/b) 5.79 (app. q, J = 6.5 Hz, 1H, ArCHa(F)-),
5.69 (app. q, J = 6.5 Hz, 1H,
ArCHb(F)-), 5.42 (m, 4H, Ha/b-2, Ha/b-4), 5.07 (m, 2H, Ha/b-3), 4.83 (d, J = 7.5 Hz, 2H, Ha/b-
1), 4.00-4.21 (m, 6H, Ha/b-5, Ha/b-6a, Ha/b-6b), 3.61 (br s, 4H, -NH2), 2.16, 2.07, 2.04, 1.99 (s,
3H, 8 x -COOCH3), 1.55 (d, J = 6.5 Hz, -CH2(F)-CHa3), 1.51 (d, J = 6.5 Hz, -CH2(F)-CHb3).
ESI-MS m/z calcd. for C22H28FNO10 485.46, found 508.2 [M+Na]+.
1-(2-(fluoromethyl)-4-(3-(tellurophen-2-yl)propanamido)phenyl)-2-3,4,6-tetraacetyl-β-D-
galactopyranose (26)
24 (0.126 g, 0.267 mmol), 3-(tellurophen-2-
yl)propanoic acid (0.061 g, 0.243 mmol), pyridine
(0.07 mL) and ethyl acetate (0.15 mL) were added
to a 25 mL round-bottom flask at 0 °C under N2.
T3P (50 wt. % in ethyl acetate, 0.32 mL) was added dropwise and the solution was stirred at
room temperature for 20 h. The solution was diluted with DCM (40 mL) and washed with
saturated sodium bicarbonate (3 x 40 mL), water (40 mL) and brine (40 mL). The organic extract
was dried over MgSO4, filtered and concentrated to yield a pale yellow solid. The crude product
was purified via column chromatography (stationary phase, silica gel; mobile phase, 3:2
EtOAc:pentanes, 0.1% triethylamine) to afford 26 (0.043 g, 23%) as a pale yellow solid. 1H
NMR (500 MHz, CDCl3) δ 8.69 (dd, J = 7.0 Hz, 1.0 Hz, 1H, TeAr-H), 7.58 (dd, J = 7.0 Hz, 4.0
Hz, 1H, TeAr-H), 7.54 (app. d, J = 9.0 Hz, 1H, Ar-H), 7.37 (m, 2H, TeAr-H, NH), 7.03 (dd, J =
8.5 Hz, 1.0 Hz, 1H, Ar-H), 5.50 (dd, J = 10.5 Hz, 8.0 Hz, 1H, H-2), 5.46 (dd, J = 3.5 Hz, 1.0 Hz,
1H, H-4), 5.41 (dd, J = 47.5 Hz, 11.0 Hz, 1H, -CHaHbF), 5.23 (dd, J = 47.5 Hz, 11.0 Hz, 1H, -
CHaHbF), 5.10 (dd, J = 10.5 Hz, 3.5 Hz, 1H, H-3), 4.96 (d, J = 8.0 Hz, H-1), 4.05-4.24 (m, 3H,
OAcO
OAc
AcOO
NH2
AcO F
OAcO
OAc
AcOO
NH
AcO F
OTe
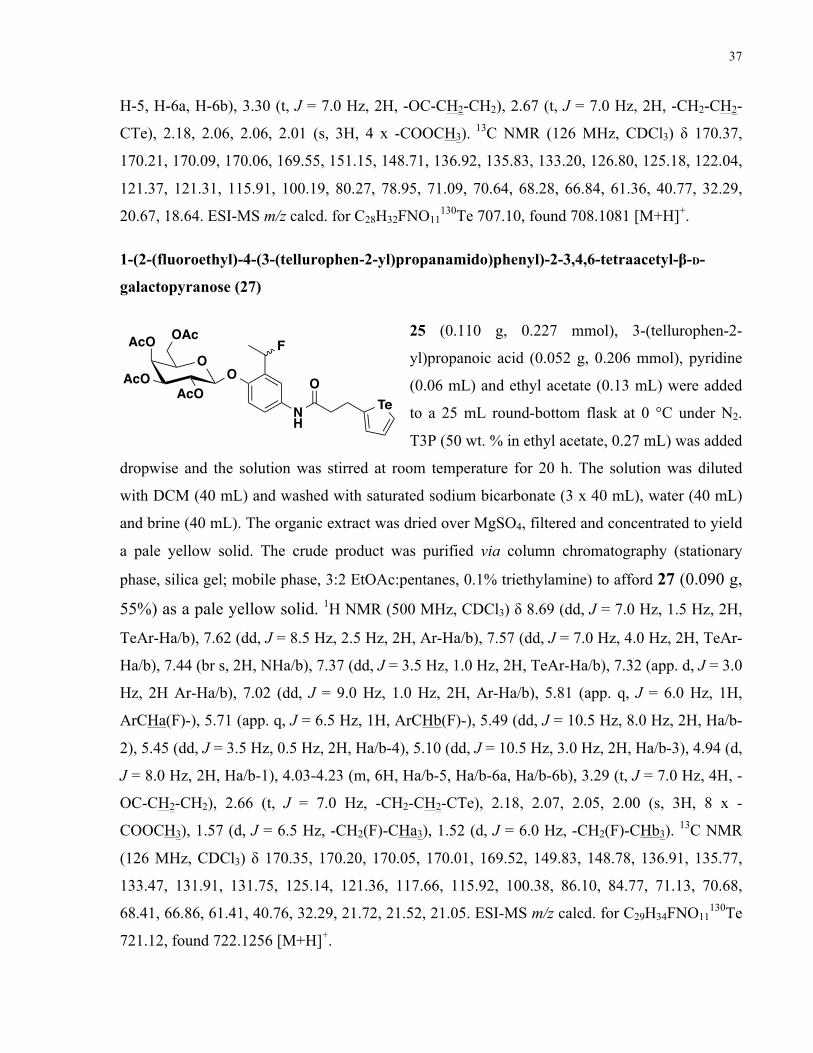
37
H-5, H-6a, H-6b), 3.30 (t, J = 7.0 Hz, 2H, -OC-CH2-CH2), 2.67 (t, J = 7.0 Hz, 2H, -CH2-CH2-
CTe), 2.18, 2.06, 2.06, 2.01 (s, 3H, 4 x -COOCH3). 13C NMR (126 MHz, CDCl3) δ 170.37,
170.21, 170.09, 170.06, 169.55, 151.15, 148.71, 136.92, 135.83, 133.20, 126.80, 125.18, 122.04,
121.37, 121.31, 115.91, 100.19, 80.27, 78.95, 71.09, 70.64, 68.28, 66.84, 61.36, 40.77, 32.29,
20.67, 18.64. ESI-MS m/z calcd. for C28H32FNO11130Te 707.10, found 708.1081 [M+H]+.
1-(2-(fluoroethyl)-4-(3-(tellurophen-2-yl)propanamido)phenyl)-2-3,4,6-tetraacetyl-β-D-
galactopyranose (27)
25 (0.110 g, 0.227 mmol), 3-(tellurophen-2-
yl)propanoic acid (0.052 g, 0.206 mmol), pyridine
(0.06 mL) and ethyl acetate (0.13 mL) were added
to a 25 mL round-bottom flask at 0 °C under N2.
T3P (50 wt. % in ethyl acetate, 0.27 mL) was added
dropwise and the solution was stirred at room temperature for 20 h. The solution was diluted
with DCM (40 mL) and washed with saturated sodium bicarbonate (3 x 40 mL), water (40 mL)
and brine (40 mL). The organic extract was dried over MgSO4, filtered and concentrated to yield
a pale yellow solid. The crude product was purified via column chromatography (stationary
phase, silica gel; mobile phase, 3:2 EtOAc:pentanes, 0.1% triethylamine) to afford 27 (0.090 g,
55%) as a pale yellow solid. 1H NMR (500 MHz, CDCl3) δ 8.69 (dd, J = 7.0 Hz, 1.5 Hz, 2H,
TeAr-Ha/b), 7.62 (dd, J = 8.5 Hz, 2.5 Hz, 2H, Ar-Ha/b), 7.57 (dd, J = 7.0 Hz, 4.0 Hz, 2H, TeAr-
Ha/b), 7.44 (br s, 2H, NHa/b), 7.37 (dd, J = 3.5 Hz, 1.0 Hz, 2H, TeAr-Ha/b), 7.32 (app. d, J = 3.0
Hz, 2H Ar-Ha/b), 7.02 (dd, J = 9.0 Hz, 1.0 Hz, 2H, Ar-Ha/b), 5.81 (app. q, J = 6.0 Hz, 1H,
ArCHa(F)-), 5.71 (app. q, J = 6.5 Hz, 1H, ArCHb(F)-), 5.49 (dd, J = 10.5 Hz, 8.0 Hz, 2H, Ha/b-
2), 5.45 (dd, J = 3.5 Hz, 0.5 Hz, 2H, Ha/b-4), 5.10 (dd, J = 10.5 Hz, 3.0 Hz, 2H, Ha/b-3), 4.94 (d,
J = 8.0 Hz, 2H, Ha/b-1), 4.03-4.23 (m, 6H, Ha/b-5, Ha/b-6a, Ha/b-6b), 3.29 (t, J = 7.0 Hz, 4H, -
OC-CH2-CH2), 2.66 (t, J = 7.0 Hz, -CH2-CH2-CTe), 2.18, 2.07, 2.05, 2.00 (s, 3H, 8 x -
COOCH3), 1.57 (d, J = 6.5 Hz, -CH2(F)-CHa3), 1.52 (d, J = 6.0 Hz, -CH2(F)-CHb3). 13C NMR
(126 MHz, CDCl3) δ 170.35, 170.20, 170.05, 170.01, 169.52, 149.83, 148.78, 136.91, 135.77,
133.47, 131.91, 131.75, 125.14, 121.36, 117.66, 115.92, 100.38, 86.10, 84.77, 71.13, 70.68,
68.41, 66.86, 61.41, 40.76, 32.29, 21.72, 21.52, 21.05. ESI-MS m/z calcd. for C29H34FNO11130Te
721.12, found 722.1256 [M+H]+.
OAcO
OAc
AcOO
NH
AcO F
OTe
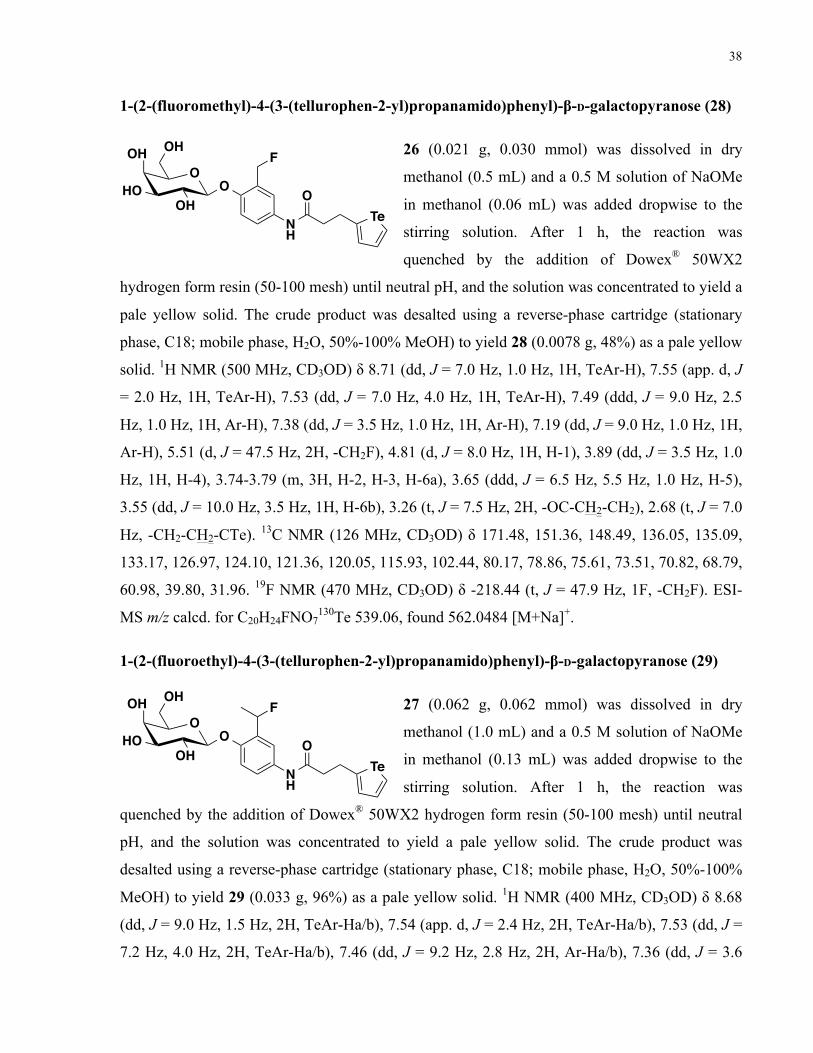
38
1-(2-(fluoromethyl)-4-(3-(tellurophen-2-yl)propanamido)phenyl)-β-D-galactopyranose (28)
26 (0.021 g, 0.030 mmol) was dissolved in dry
methanol (0.5 mL) and a 0.5 M solution of NaOMe
in methanol (0.06 mL) was added dropwise to the
stirring solution. After 1 h, the reaction was
quenched by the addition of Dowex® 50WX2
hydrogen form resin (50-100 mesh) until neutral pH, and the solution was concentrated to yield a
pale yellow solid. The crude product was desalted using a reverse-phase cartridge (stationary
phase, C18; mobile phase, H2O, 50%-100% MeOH) to yield 28 (0.0078 g, 48%) as a pale yellow
solid. 1H NMR (500 MHz, CD3OD) δ 8.71 (dd, J = 7.0 Hz, 1.0 Hz, 1H, TeAr-H), 7.55 (app. d, J
= 2.0 Hz, 1H, TeAr-H), 7.53 (dd, J = 7.0 Hz, 4.0 Hz, 1H, TeAr-H), 7.49 (ddd, J = 9.0 Hz, 2.5
Hz, 1.0 Hz, 1H, Ar-H), 7.38 (dd, J = 3.5 Hz, 1.0 Hz, 1H, Ar-H), 7.19 (dd, J = 9.0 Hz, 1.0 Hz, 1H,
Ar-H), 5.51 (d, J = 47.5 Hz, 2H, -CH2F), 4.81 (d, J = 8.0 Hz, 1H, H-1), 3.89 (dd, J = 3.5 Hz, 1.0
Hz, 1H, H-4), 3.74-3.79 (m, 3H, H-2, H-3, H-6a), 3.65 (ddd, J = 6.5 Hz, 5.5 Hz, 1.0 Hz, H-5),
3.55 (dd, J = 10.0 Hz, 3.5 Hz, 1H, H-6b), 3.26 (t, J = 7.5 Hz, 2H, -OC-CH2-CH2), 2.68 (t, J = 7.0
Hz, -CH2-CH2-CTe). 13C NMR (126 MHz, CD3OD) δ 171.48, 151.36, 148.49, 136.05, 135.09,
133.17, 126.97, 124.10, 121.36, 120.05, 115.93, 102.44, 80.17, 78.86, 75.61, 73.51, 70.82, 68.79,
60.98, 39.80, 31.96. 19F NMR (470 MHz, CD3OD) δ -218.44 (t, J = 47.9 Hz, 1F, -CH2F). ESI-
MS m/z calcd. for C20H24FNO7130Te 539.06, found 562.0484 [M+Na]+.
1-(2-(fluoroethyl)-4-(3-(tellurophen-2-yl)propanamido)phenyl)-β-D-galactopyranose (29)
27 (0.062 g, 0.062 mmol) was dissolved in dry
methanol (1.0 mL) and a 0.5 M solution of NaOMe
in methanol (0.13 mL) was added dropwise to the
stirring solution. After 1 h, the reaction was
quenched by the addition of Dowex® 50WX2 hydrogen form resin (50-100 mesh) until neutral
pH, and the solution was concentrated to yield a pale yellow solid. The crude product was
desalted using a reverse-phase cartridge (stationary phase, C18; mobile phase, H2O, 50%-100%
MeOH) to yield 29 (0.033 g, 96%) as a pale yellow solid. 1H NMR (400 MHz, CD3OD) δ 8.68
(dd, J = 9.0 Hz, 1.5 Hz, 2H, TeAr-Ha/b), 7.54 (app. d, J = 2.4 Hz, 2H, TeAr-Ha/b), 7.53 (dd, J =
7.2 Hz, 4.0 Hz, 2H, TeAr-Ha/b), 7.46 (dd, J = 9.2 Hz, 2.8 Hz, 2H, Ar-Ha/b), 7.36 (dd, J = 3.6
OHO
OH
OHO
NH
OH F
OTe
OHO
OH
OHO
NH
OH F
OTe
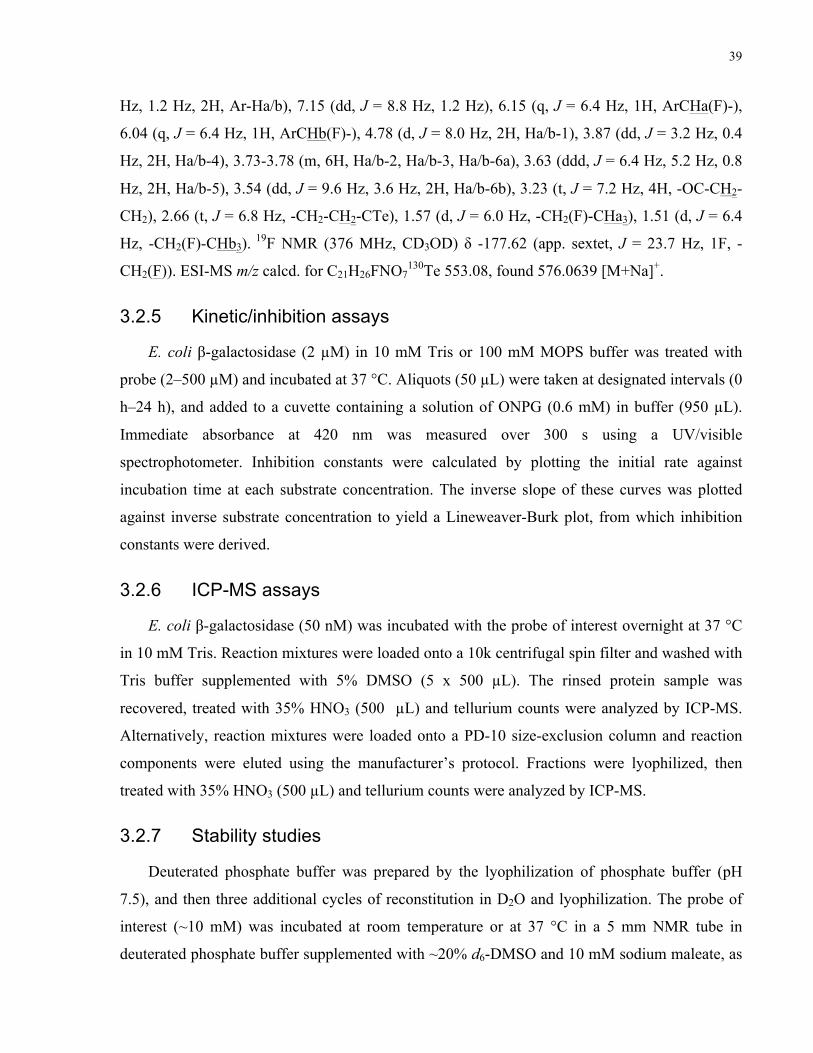
39
Hz, 1.2 Hz, 2H, Ar-Ha/b), 7.15 (dd, J = 8.8 Hz, 1.2 Hz), 6.15 (q, J = 6.4 Hz, 1H, ArCHa(F)-),
6.04 (q, J = 6.4 Hz, 1H, ArCHb(F)-), 4.78 (d, J = 8.0 Hz, 2H, Ha/b-1), 3.87 (dd, J = 3.2 Hz, 0.4
Hz, 2H, Ha/b-4), 3.73-3.78 (m, 6H, Ha/b-2, Ha/b-3, Ha/b-6a), 3.63 (ddd, J = 6.4 Hz, 5.2 Hz, 0.8
Hz, 2H, Ha/b-5), 3.54 (dd, J = 9.6 Hz, 3.6 Hz, 2H, Ha/b-6b), 3.23 (t, J = 7.2 Hz, 4H, -OC-CH2-
CH2), 2.66 (t, J = 6.8 Hz, -CH2-CH2-CTe), 1.57 (d, J = 6.0 Hz, -CH2(F)-CHa3), 1.51 (d, J = 6.4
Hz, -CH2(F)-CHb3). 19F NMR (376 MHz, CD3OD) δ -177.62 (app. sextet, J = 23.7 Hz, 1F, -
CH2(F)). ESI-MS m/z calcd. for C21H26FNO7130Te 553.08, found 576.0639 [M+Na]+.
3.2.5 Kinetic/inhibition assays
E. coli β-galactosidase (2 µM) in 10 mM Tris or 100 mM MOPS buffer was treated with
probe (2–500 µM) and incubated at 37 °C. Aliquots (50 µL) were taken at designated intervals (0
h–24 h), and added to a cuvette containing a solution of ONPG (0.6 mM) in buffer (950 µL).
Immediate absorbance at 420 nm was measured over 300 s using a UV/visible
spectrophotometer. Inhibition constants were calculated by plotting the initial rate against
incubation time at each substrate concentration. The inverse slope of these curves was plotted
against inverse substrate concentration to yield a Lineweaver-Burk plot, from which inhibition
constants were derived.
3.2.6 ICP-MS assays
E. coli β-galactosidase (50 nM) was incubated with the probe of interest overnight at 37 °C
in 10 mM Tris. Reaction mixtures were loaded onto a 10k centrifugal spin filter and washed with
Tris buffer supplemented with 5% DMSO (5 x 500 µL). The rinsed protein sample was
recovered, treated with 35% HNO3 (500 µL) and tellurium counts were analyzed by ICP-MS.
Alternatively, reaction mixtures were loaded onto a PD-10 size-exclusion column and reaction
components were eluted using the manufacturer’s protocol. Fractions were lyophilized, then
treated with 35% HNO3 (500 µL) and tellurium counts were analyzed by ICP-MS.
3.2.7 Stability studies
Deuterated phosphate buffer was prepared by the lyophilization of phosphate buffer (pH
7.5), and then three additional cycles of reconstitution in D2O and lyophilization. The probe of
interest (~10 mM) was incubated at room temperature or at 37 °C in a 5 mm NMR tube in
deuterated phosphate buffer supplemented with ~20% d6-DMSO and 10 mM sodium maleate, as
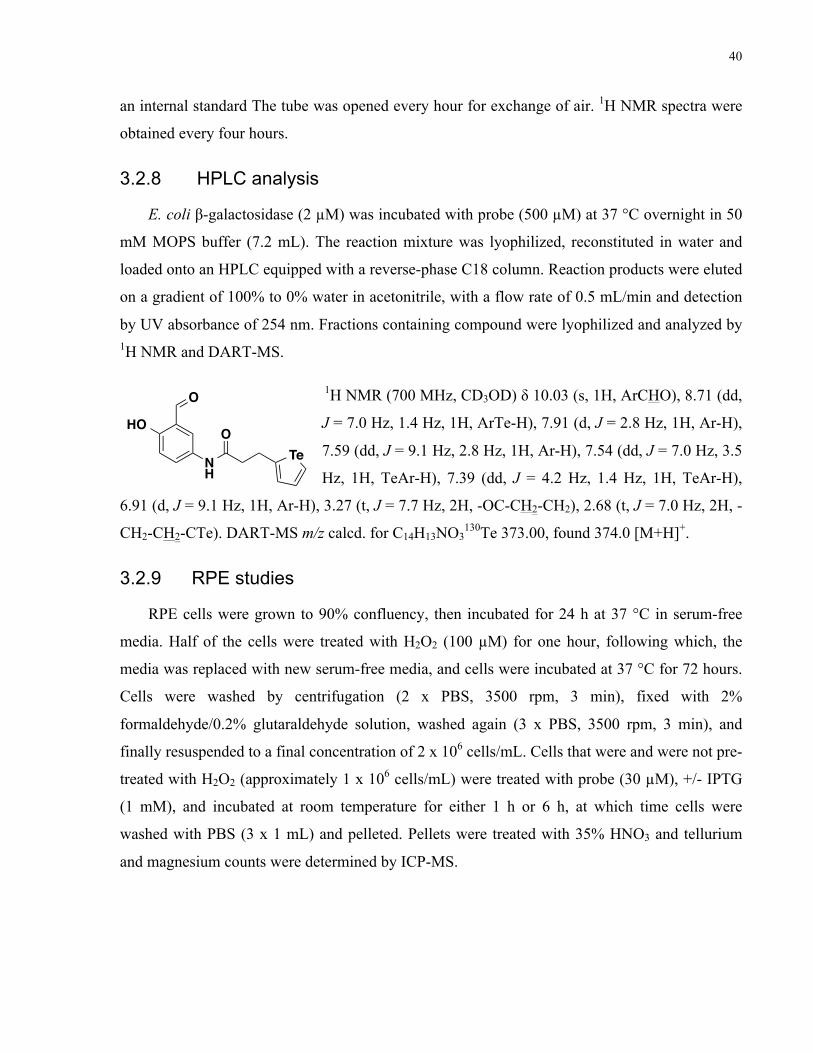
40
an internal standard The tube was opened every hour for exchange of air. 1H NMR spectra were
obtained every four hours.
3.2.8 HPLC analysis
E. coli β-galactosidase (2 µM) was incubated with probe (500 µM) at 37 °C overnight in 50
mM MOPS buffer (7.2 mL). The reaction mixture was lyophilized, reconstituted in water and
loaded onto an HPLC equipped with a reverse-phase C18 column. Reaction products were eluted
on a gradient of 100% to 0% water in acetonitrile, with a flow rate of 0.5 mL/min and detection
by UV absorbance of 254 nm. Fractions containing compound were lyophilized and analyzed by 1H NMR and DART-MS.
1H NMR (700 MHz, CD3OD) δ 10.03 (s, 1H, ArCHO), 8.71 (dd,
J = 7.0 Hz, 1.4 Hz, 1H, ArTe-H), 7.91 (d, J = 2.8 Hz, 1H, Ar-H),
7.59 (dd, J = 9.1 Hz, 2.8 Hz, 1H, Ar-H), 7.54 (dd, J = 7.0 Hz, 3.5
Hz, 1H, TeAr-H), 7.39 (dd, J = 4.2 Hz, 1.4 Hz, 1H, TeAr-H),
6.91 (d, J = 9.1 Hz, 1H, Ar-H), 3.27 (t, J = 7.7 Hz, 2H, -OC-CH2-CH2), 2.68 (t, J = 7.0 Hz, 2H, -
CH2-CH2-CTe). DART-MS m/z calcd. for C14H13NO3130Te 373.00, found 374.0 [M+H]+.
3.2.9 RPE studies
RPE cells were grown to 90% confluency, then incubated for 24 h at 37 °C in serum-free
media. Half of the cells were treated with H2O2 (100 µM) for one hour, following which, the
media was replaced with new serum-free media, and cells were incubated at 37 °C for 72 hours.
Cells were washed by centrifugation (2 x PBS, 3500 rpm, 3 min), fixed with 2%
formaldehyde/0.2% glutaraldehyde solution, washed again (3 x PBS, 3500 rpm, 3 min), and
finally resuspended to a final concentration of 2 x 10⁶ cells/mL. Cells that were and were not pre-
treated with H2O2 (approximately 1 x 10⁶ cells/mL) were treated with probe (30 µM), +/- IPTG
(1 mM), and incubated at room temperature for either 1 h or 6 h, at which time cells were
washed with PBS (3 x 1 mL) and pelleted. Pellets were treated with 35% HNO3 and tellurium
and magnesium counts were determined by ICP-MS.
NH
O
OTe
HO
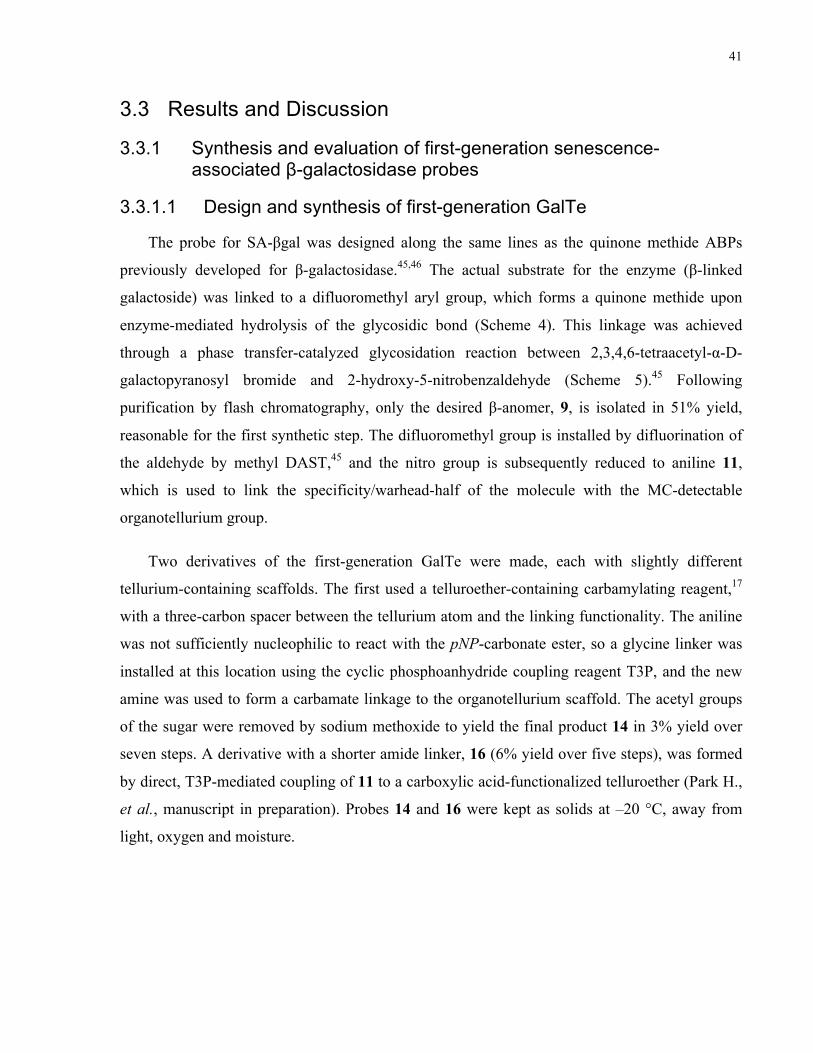
41
3.3 Results and Discussion
3.3.1 Synthesis and evaluation of first-generation senescence-associated β-galactosidase probes
3.3.1.1 Design and synthesis of first-generation GalTe
The probe for SA-βgal was designed along the same lines as the quinone methide ABPs
previously developed for β-galactosidase.45,46 The actual substrate for the enzyme (β-linked
galactoside) was linked to a difluoromethyl aryl group, which forms a quinone methide upon
enzyme-mediated hydrolysis of the glycosidic bond (Scheme 4). This linkage was achieved
through a phase transfer-catalyzed glycosidation reaction between 2,3,4,6-tetraacetyl-α-D-
galactopyranosyl bromide and 2-hydroxy-5-nitrobenzaldehyde (Scheme 5).45 Following
purification by flash chromatography, only the desired β-anomer, 9, is isolated in 51% yield,
reasonable for the first synthetic step. The difluoromethyl group is installed by difluorination of
the aldehyde by methyl DAST,45 and the nitro group is subsequently reduced to aniline 11,
which is used to link the specificity/warhead-half of the molecule with the MC-detectable
organotellurium group.
Two derivatives of the first-generation GalTe were made, each with slightly different
tellurium-containing scaffolds. The first used a telluroether-containing carbamylating reagent,17
with a three-carbon spacer between the tellurium atom and the linking functionality. The aniline
was not sufficiently nucleophilic to react with the pNP-carbonate ester, so a glycine linker was
installed at this location using the cyclic phosphoanhydride coupling reagent T3P, and the new
amine was used to form a carbamate linkage to the organotellurium scaffold. The acetyl groups
of the sugar were removed by sodium methoxide to yield the final product 14 in 3% yield over
seven steps. A derivative with a shorter amide linker, 16 (6% yield over five steps), was formed
by direct, T3P-mediated coupling of 11 to a carboxylic acid-functionalized telluroether (Park H.,
et al., manuscript in preparation). Probes 14 and 16 were kept as solids at –20 °C, away from
light, oxygen and moisture.
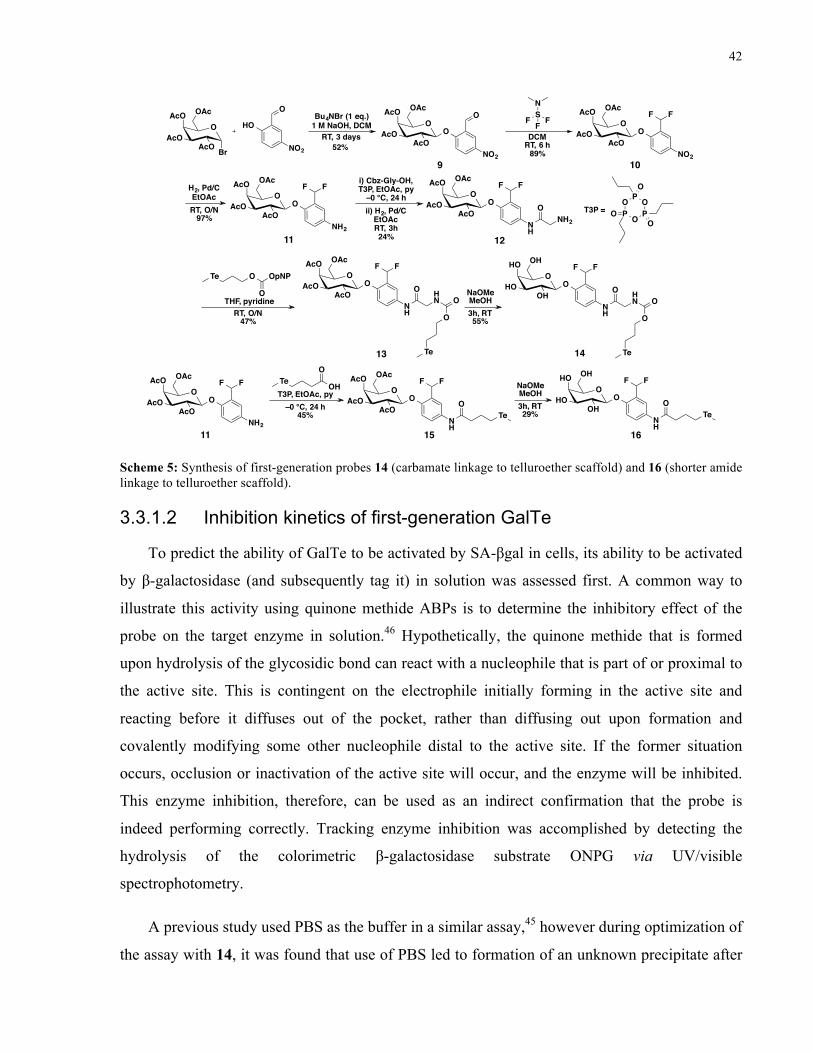
42
OAcO
OAc
AcO Br
HO
NO2
OAcO
OAc
AcOO
NO2
AcO Bu4NBr (1 eq.)1 M NaOH, DCM
RT, 3 days52%
AcOO
DCMRT, 6 h
OAcO
OAc
AcOO
NO289%
AcO FF
OAcO
OAc
AcOO
NH2
AcO FF
NSF F FO
H2, Pd/CEtOAcRT, O/N
97%
9 10
11 12
i) Cbz-Gly-OH,T3P, EtOAc, py
–0 °C, 24 hii) H2, Pd/C
EtOAcRT, 3h24%
OAcO
OAc
AcOO
NH
AcO FF
ONH2
OAcO
OAc
AcOO
NH
AcO FF
O HN
O
O
Te13
Te O
O
OpNP
THF, pyridineRT, O/N
47%
NaOMeMeOH3h, RT55%
OHO
OH
OHO
NH
OH
FF
O HN
O
O
Te14
OAcO
OAc
AcOO
NH2
AcO FF
11
Te OH
O
T3P, EtOAc, py–0 °C, 24 h
45%
OAcO
OAc
AcOO
NH
AcO FF
OTe
OHO
OH
OHO
NH
OH
FF
OTe
NaOMeMeOH3h, RT29%
15 16
OP O P
OPO
OOT3P =
Scheme 5: Synthesis of first-generation probes 14 (carbamate linkage to telluroether scaffold) and 16 (shorter amide linkage to telluroether scaffold).
3.3.1.2 Inhibition kinetics of first-generation GalTe
To predict the ability of GalTe to be activated by SA-βgal in cells, its ability to be activated
by β-galactosidase (and subsequently tag it) in solution was assessed first. A common way to
illustrate this activity using quinone methide ABPs is to determine the inhibitory effect of the
probe on the target enzyme in solution.46 Hypothetically, the quinone methide that is formed
upon hydrolysis of the glycosidic bond can react with a nucleophile that is part of or proximal to
the active site. This is contingent on the electrophile initially forming in the active site and
reacting before it diffuses out of the pocket, rather than diffusing out upon formation and
covalently modifying some other nucleophile distal to the active site. If the former situation
occurs, occlusion or inactivation of the active site will occur, and the enzyme will be inhibited.
This enzyme inhibition, therefore, can be used as an indirect confirmation that the probe is
indeed performing correctly. Tracking enzyme inhibition was accomplished by detecting the
hydrolysis of the colorimetric β-galactosidase substrate ONPG via UV/visible
spectrophotometry.
A previous study used PBS as the buffer in a similar assay,45 however during optimization of
the assay with 14, it was found that use of PBS led to formation of an unknown precipitate after
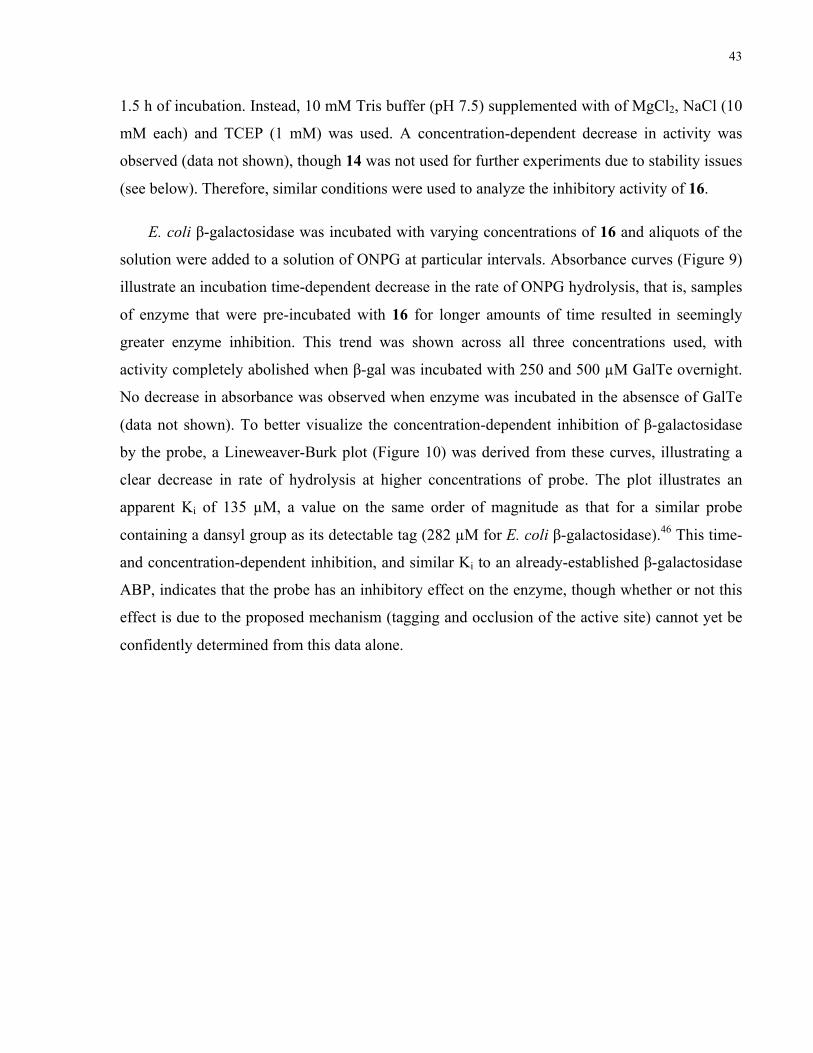
43
1.5 h of incubation. Instead, 10 mM Tris buffer (pH 7.5) supplemented with of MgCl2, NaCl (10
mM each) and TCEP (1 mM) was used. A concentration-dependent decrease in activity was
observed (data not shown), though 14 was not used for further experiments due to stability issues
(see below). Therefore, similar conditions were used to analyze the inhibitory activity of 16.
E. coli β-galactosidase was incubated with varying concentrations of 16 and aliquots of the
solution were added to a solution of ONPG at particular intervals. Absorbance curves (Figure 9)
illustrate an incubation time-dependent decrease in the rate of ONPG hydrolysis, that is, samples
of enzyme that were pre-incubated with 16 for longer amounts of time resulted in seemingly
greater enzyme inhibition. This trend was shown across all three concentrations used, with
activity completely abolished when β-gal was incubated with 250 and 500 µM GalTe overnight.
No decrease in absorbance was observed when enzyme was incubated in the absensce of GalTe
(data not shown). To better visualize the concentration-dependent inhibition of β-galactosidase
by the probe, a Lineweaver-Burk plot (Figure 10) was derived from these curves, illustrating a
clear decrease in rate of hydrolysis at higher concentrations of probe. The plot illustrates an
apparent Ki of 135 µM, a value on the same order of magnitude as that for a similar probe
containing a dansyl group as its detectable tag (282 µM for E. coli β-galactosidase).46 This time-
and concentration-dependent inhibition, and similar Ki to an already-established β-galactosidase
ABP, indicates that the probe has an inhibitory effect on the enzyme, though whether or not this
effect is due to the proposed mechanism (tagging and occlusion of the active site) cannot yet be
confidently determined from this data alone.
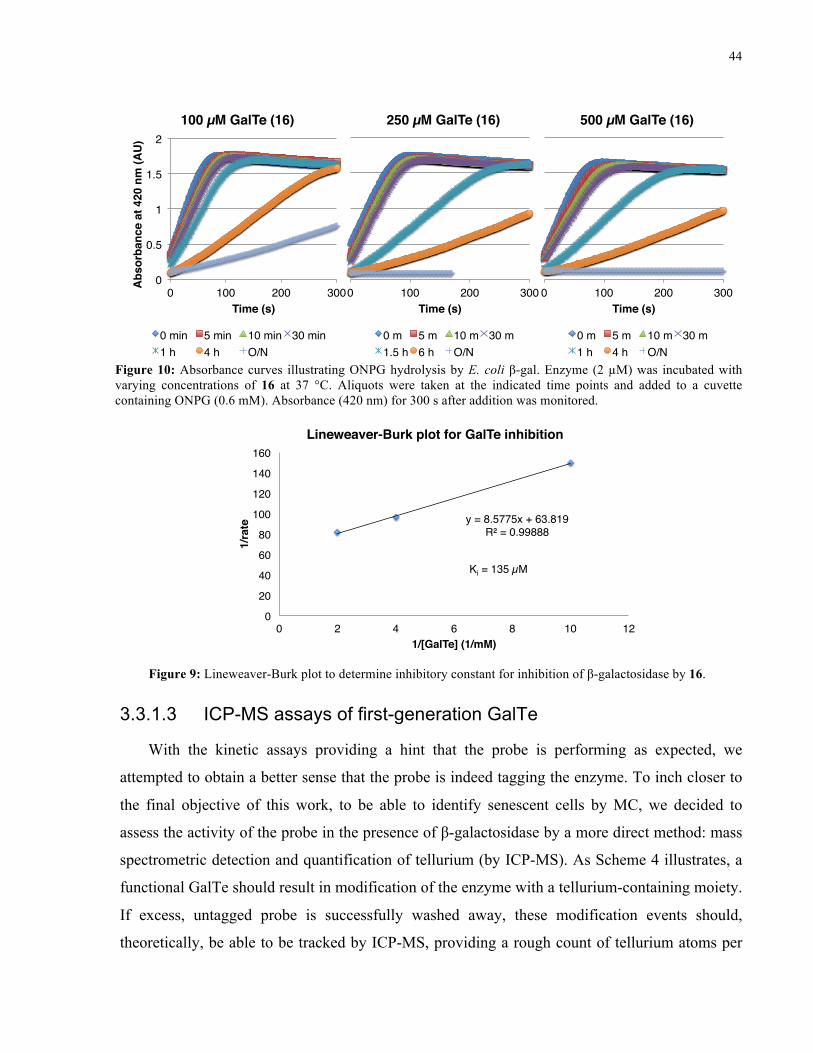
44
3.3.1.3 ICP-MS assays of first-generation GalTe
With the kinetic assays providing a hint that the probe is performing as expected, we
attempted to obtain a better sense that the probe is indeed tagging the enzyme. To inch closer to
the final objective of this work, to be able to identify senescent cells by MC, we decided to
assess the activity of the probe in the presence of β-galactosidase by a more direct method: mass
spectrometric detection and quantification of tellurium (by ICP-MS). As Scheme 4 illustrates, a
functional GalTe should result in modification of the enzyme with a tellurium-containing moiety.
If excess, untagged probe is successfully washed away, these modification events should,
theoretically, be able to be tracked by ICP-MS, providing a rough count of tellurium atoms per
Figure 10: Absorbance curves illustrating ONPG hydrolysis by E. coli β-gal. Enzyme (2 µM) was incubated with varying concentrations of 16 at 37 °C. Aliquots were taken at the indicated time points and added to a cuvette containing ONPG (0.6 mM). Absorbance (420 nm) for 300 s after addition was monitored.
y = 8.5775x + 63.819!R² = 0.99888!
0!
20!
40!
60!
80!
100!
120!
140!
160!
0! 2! 4! 6! 8! 10! 12!
1/ra
te!
1/[GalTe] (1/mM)!
Lineweaver-Burk plot for GalTe inhibition !
Ki = 135 µM!
Figure 9: Lineweaver-Burk plot to determine inhibitory constant for inhibition of β-galactosidase by 16.
0!
0.5!
1!
1.5!
2!
0! 100! 200! 300!Abs
orba
nce
at 4
20 n
m (A
U)!
Time (s)!
100 µM GalTe (16)!
0 min! 5 min! 10 min! 30 min!1 h! 4 h! O/N!
0! 100! 200! 300!Time (s)!
250 µM GalTe (16)!
0 m! 5 m! 10 m! 30 m!1.5 h! 6 h! O/N!
0! 100! 200! 300!Time (s)!
500 µM GalTe (16)!
0 m! 5 m! 10 m! 30 m!1 h! 4 h! O/N!
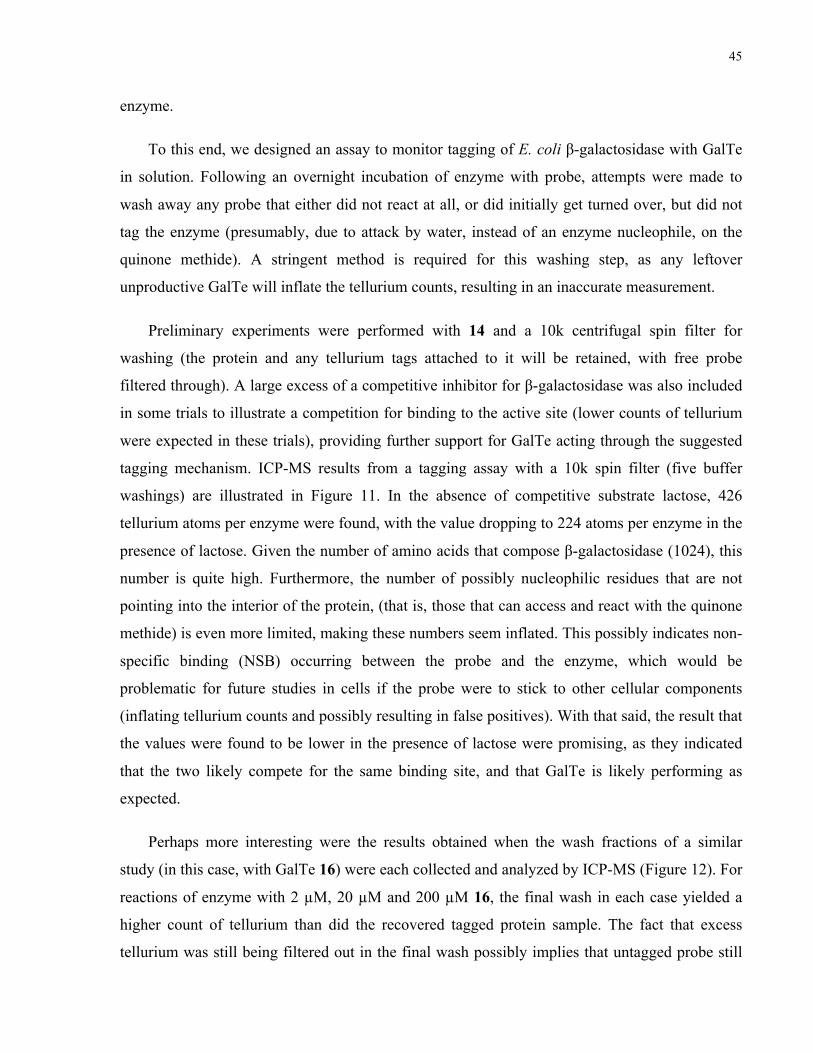
45
enzyme.
To this end, we designed an assay to monitor tagging of E. coli β-galactosidase with GalTe
in solution. Following an overnight incubation of enzyme with probe, attempts were made to
wash away any probe that either did not react at all, or did initially get turned over, but did not
tag the enzyme (presumably, due to attack by water, instead of an enzyme nucleophile, on the
quinone methide). A stringent method is required for this washing step, as any leftover
unproductive GalTe will inflate the tellurium counts, resulting in an inaccurate measurement.
Preliminary experiments were performed with 14 and a 10k centrifugal spin filter for
washing (the protein and any tellurium tags attached to it will be retained, with free probe
filtered through). A large excess of a competitive inhibitor for β-galactosidase was also included
in some trials to illustrate a competition for binding to the active site (lower counts of tellurium
were expected in these trials), providing further support for GalTe acting through the suggested
tagging mechanism. ICP-MS results from a tagging assay with a 10k spin filter (five buffer
washings) are illustrated in Figure 11. In the absence of competitive substrate lactose, 426
tellurium atoms per enzyme were found, with the value dropping to 224 atoms per enzyme in the
presence of lactose. Given the number of amino acids that compose β-galactosidase (1024), this
number is quite high. Furthermore, the number of possibly nucleophilic residues that are not
pointing into the interior of the protein, (that is, those that can access and react with the quinone
methide) is even more limited, making these numbers seem inflated. This possibly indicates non-
specific binding (NSB) occurring between the probe and the enzyme, which would be
problematic for future studies in cells if the probe were to stick to other cellular components
(inflating tellurium counts and possibly resulting in false positives). With that said, the result that
the values were found to be lower in the presence of lactose were promising, as they indicated
that the two likely compete for the same binding site, and that GalTe is likely performing as
expected.
Perhaps more interesting were the results obtained when the wash fractions of a similar
study (in this case, with GalTe 16) were each collected and analyzed by ICP-MS (Figure 12). For
reactions of enzyme with 2 µM, 20 µM and 200 µM 16, the final wash in each case yielded a
higher count of tellurium than did the recovered tagged protein sample. The fact that excess
tellurium was still being filtered out in the final wash possibly implies that untagged probe still
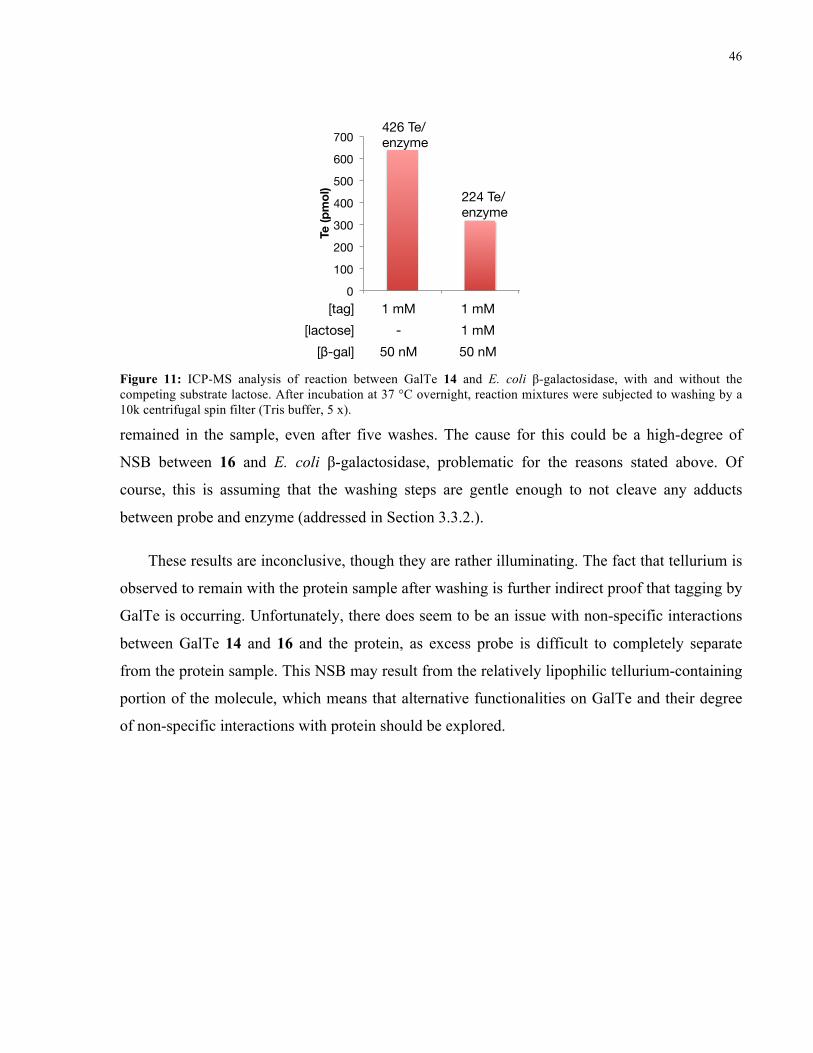
46
remained in the sample, even after five washes. The cause for this could be a high-degree of
NSB between 16 and E. coli β-galactosidase, problematic for the reasons stated above. Of
course, this is assuming that the washing steps are gentle enough to not cleave any adducts
between probe and enzyme (addressed in Section 3.3.2.).
These results are inconclusive, though they are rather illuminating. The fact that tellurium is
observed to remain with the protein sample after washing is further indirect proof that tagging by
GalTe is occurring. Unfortunately, there does seem to be an issue with non-specific interactions
between GalTe 14 and 16 and the protein, as excess probe is difficult to completely separate
from the protein sample. This NSB may result from the relatively lipophilic tellurium-containing
portion of the molecule, which means that alternative functionalities on GalTe and their degree
of non-specific interactions with protein should be explored.
0 100 200 300 400 500 600 700
1" 2" 3"
Te (p
mol
) [tag] 1 mM 1 mM 1 mM
[lactose] - 1 mM - [β-gal] 50 nM 50 nM -
426 Te/enzyme
224 Te/enzyme
Figure 11: ICP-MS analysis of reaction between GalTe 14 and E. coli β-galactosidase, with and without the competing substrate lactose. After incubation at 37 °C overnight, reaction mixtures were subjected to washing by a 10k centrifugal spin filter (Tris buffer, 5 x).
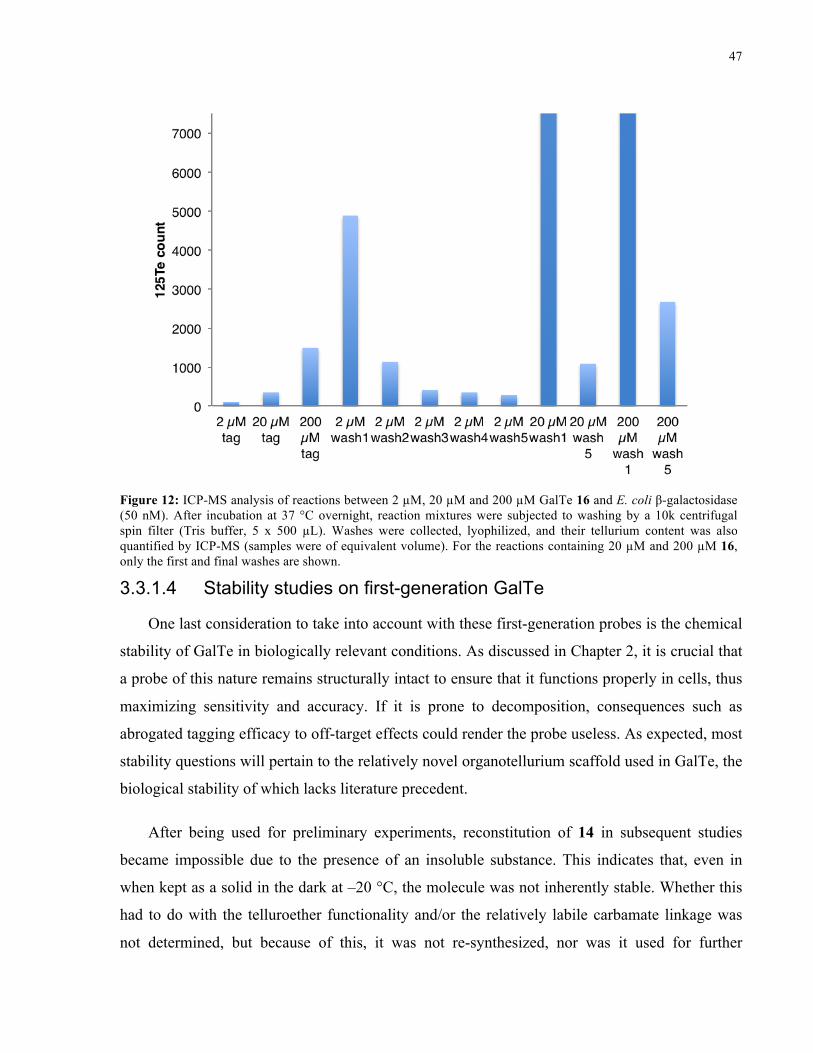
47
3.3.1.4 Stability studies on first-generation GalTe
One last consideration to take into account with these first-generation probes is the chemical
stability of GalTe in biologically relevant conditions. As discussed in Chapter 2, it is crucial that
a probe of this nature remains structurally intact to ensure that it functions properly in cells, thus
maximizing sensitivity and accuracy. If it is prone to decomposition, consequences such as
abrogated tagging efficacy to off-target effects could render the probe useless. As expected, most
stability questions will pertain to the relatively novel organotellurium scaffold used in GalTe, the
biological stability of which lacks literature precedent.
After being used for preliminary experiments, reconstitution of 14 in subsequent studies
became impossible due to the presence of an insoluble substance. This indicates that, even in
when kept as a solid in the dark at –20 °C, the molecule was not inherently stable. Whether this
had to do with the telluroether functionality and/or the relatively labile carbamate linkage was
not determined, but because of this, it was not re-synthesized, nor was it used for further
Figure 12: ICP-MS analysis of reactions between 2 µM, 20 µM and 200 µM GalTe 16 and E. coli β-galactosidase (50 nM). After incubation at 37 °C overnight, reaction mixtures were subjected to washing by a 10k centrifugal spin filter (Tris buffer, 5 x 500 µL). Washes were collected, lyophilized, and their tellurium content was also quantified by ICP-MS (samples were of equivalent volume). For the reactions containing 20 µM and 200 µM 16, only the first and final washes are shown.
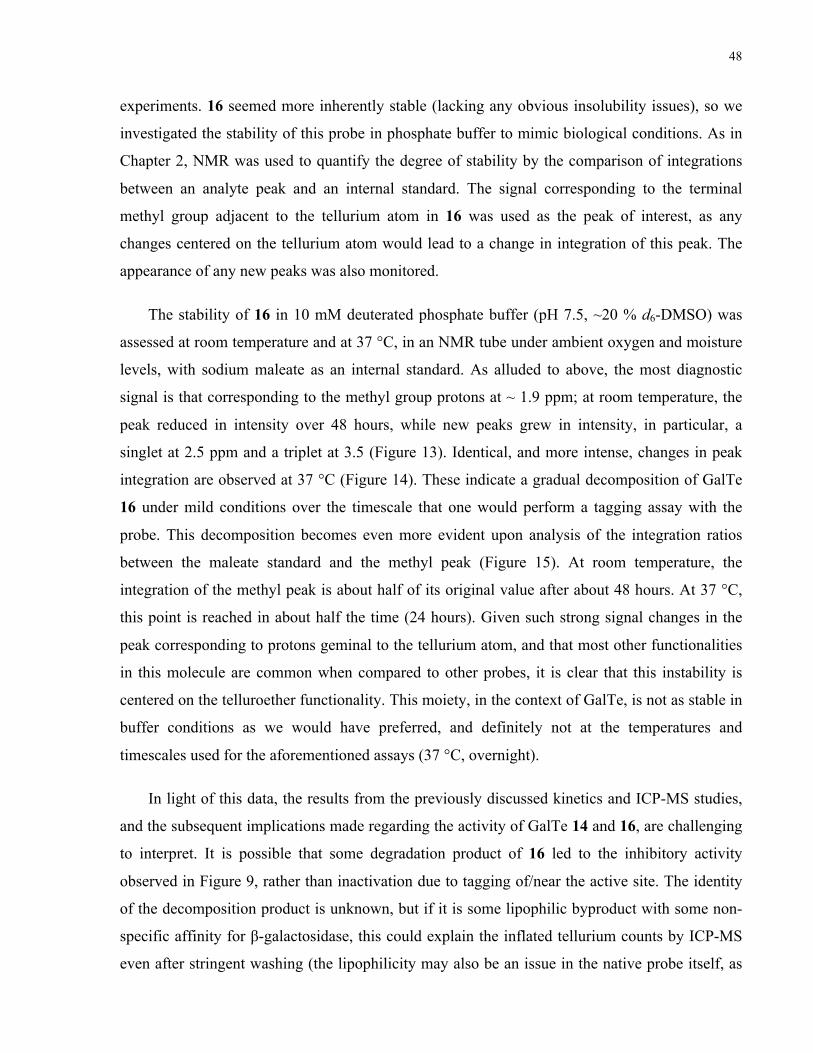
48
experiments. 16 seemed more inherently stable (lacking any obvious insolubility issues), so we
investigated the stability of this probe in phosphate buffer to mimic biological conditions. As in
Chapter 2, NMR was used to quantify the degree of stability by the comparison of integrations
between an analyte peak and an internal standard. The signal corresponding to the terminal
methyl group adjacent to the tellurium atom in 16 was used as the peak of interest, as any
changes centered on the tellurium atom would lead to a change in integration of this peak. The
appearance of any new peaks was also monitored.
The stability of 16 in 10 mM deuterated phosphate buffer (pH 7.5, ~20 % d6-DMSO) was
assessed at room temperature and at 37 °C, in an NMR tube under ambient oxygen and moisture
levels, with sodium maleate as an internal standard. As alluded to above, the most diagnostic
signal is that corresponding to the methyl group protons at ~ 1.9 ppm; at room temperature, the
peak reduced in intensity over 48 hours, while new peaks grew in intensity, in particular, a
singlet at 2.5 ppm and a triplet at 3.5 (Figure 13). Identical, and more intense, changes in peak
integration are observed at 37 °C (Figure 14). These indicate a gradual decomposition of GalTe
16 under mild conditions over the timescale that one would perform a tagging assay with the
probe. This decomposition becomes even more evident upon analysis of the integration ratios
between the maleate standard and the methyl peak (Figure 15). At room temperature, the
integration of the methyl peak is about half of its original value after about 48 hours. At 37 °C,
this point is reached in about half the time (24 hours). Given such strong signal changes in the
peak corresponding to protons geminal to the tellurium atom, and that most other functionalities
in this molecule are common when compared to other probes, it is clear that this instability is
centered on the telluroether functionality. This moiety, in the context of GalTe, is not as stable in
buffer conditions as we would have preferred, and definitely not at the temperatures and
timescales used for the aforementioned assays (37 °C, overnight).
In light of this data, the results from the previously discussed kinetics and ICP-MS studies,
and the subsequent implications made regarding the activity of GalTe 14 and 16, are challenging
to interpret. It is possible that some degradation product of 16 led to the inhibitory activity
observed in Figure 9, rather than inactivation due to tagging of/near the active site. The identity
of the decomposition product is unknown, but if it is some lipophilic byproduct with some non-
specific affinity for β-galactosidase, this could explain the inflated tellurium counts by ICP-MS
even after stringent washing (the lipophilicity may also be an issue in the native probe itself, as
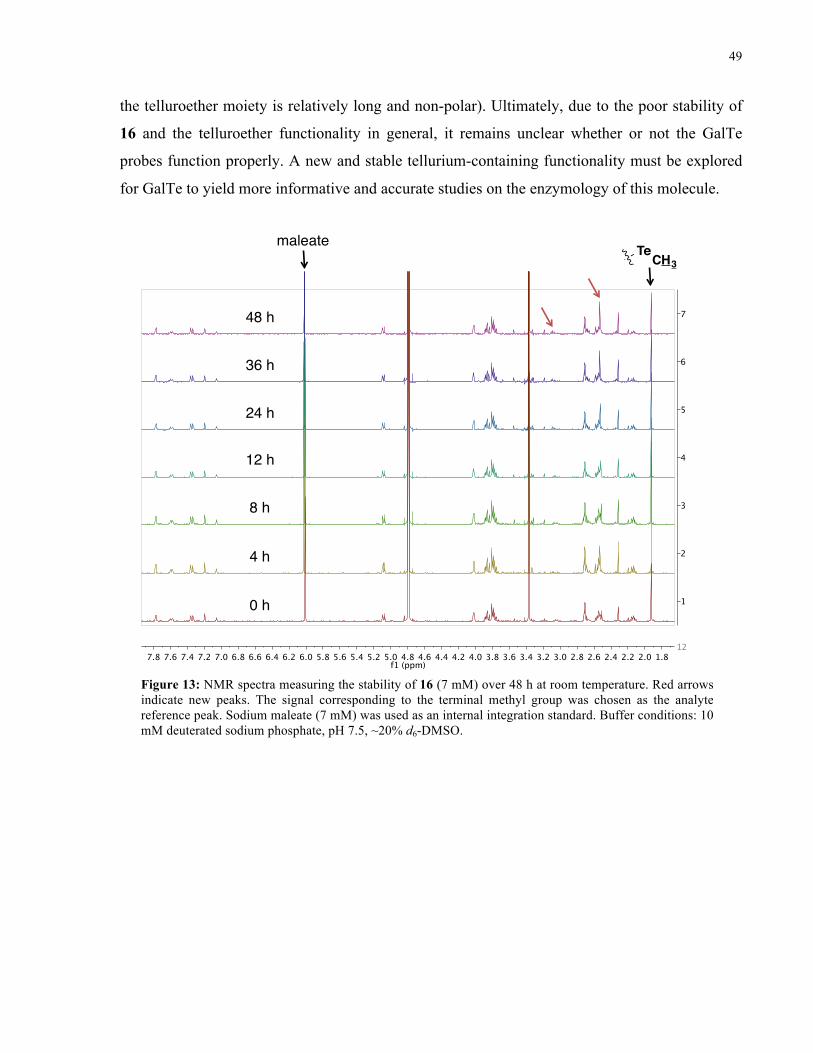
49
the telluroether moiety is relatively long and non-polar). Ultimately, due to the poor stability of
16 and the telluroether functionality in general, it remains unclear whether or not the GalTe
probes function properly. A new and stable tellurium-containing functionality must be explored
for GalTe to yield more informative and accurate studies on the enzymology of this molecule.
�������������������������������������������������������������������������������������� ����
�
�
�
�
�
TeCH3
12#
0 h!
4 h!
8 h!
12 h!
24 h!
36 h!
48 h!
maleate!
Figure 13: NMR spectra measuring the stability of 16 (7 mM) over 48 h at room temperature. Red arrows indicate new peaks. The signal corresponding to the terminal methyl group was chosen as the analyte reference peak. Sodium maleate (7 mM) was used as an internal integration standard. Buffer conditions: 10 mM deuterated sodium phosphate, pH 7.5, ~20% d6-DMSO.
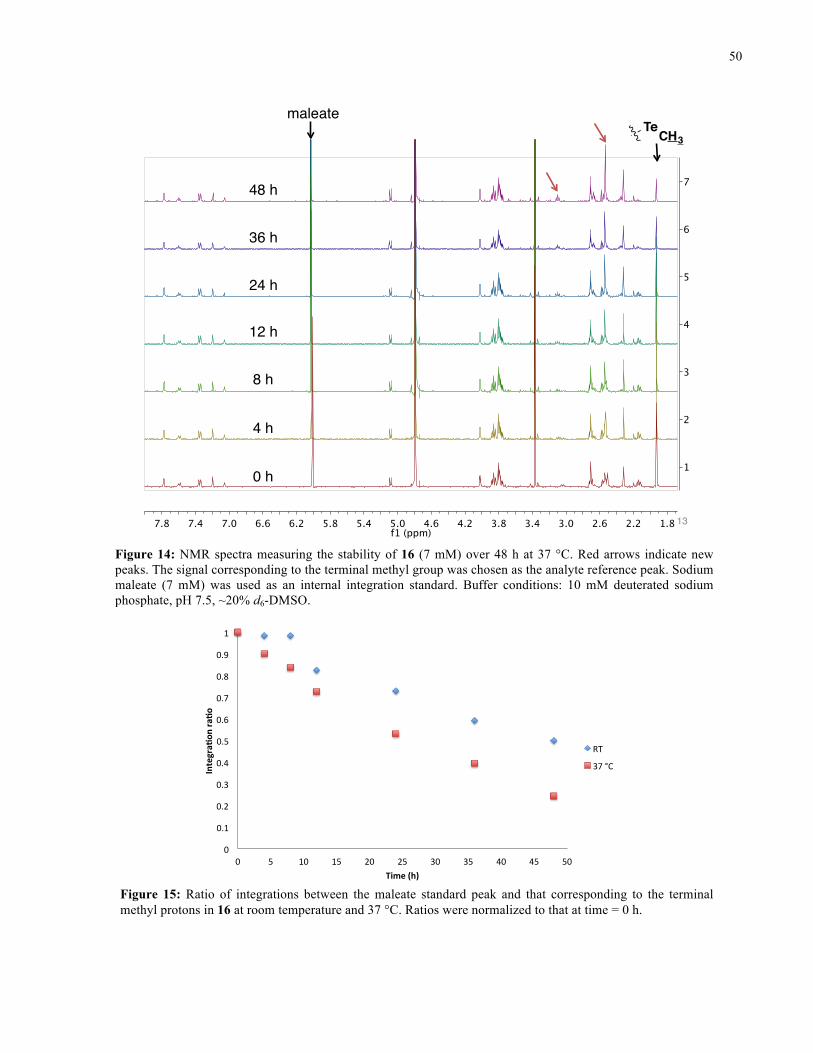
50
13!��������������������������������������������� ����
�
�
�
�
�
0 h!
4 h!
8 h!
12 h!
24 h!
36 h!
48 h!
maleate!TeCH3
Figure 14: NMR spectra measuring the stability of 16 (7 mM) over 48 h at 37 °C. Red arrows indicate new peaks. The signal corresponding to the terminal methyl group was chosen as the analyte reference peak. Sodium maleate (7 mM) was used as an internal integration standard. Buffer conditions: 10 mM deuterated sodium phosphate, pH 7.5, ~20% d6-DMSO.
0"
0.1"
0.2"
0.3"
0.4"
0.5"
0.6"
0.7"
0.8"
0.9"
1"
0" 5" 10" 15" 20" 25" 30" 35" 40" 45" 50"
Integra(
on*ra
(o*
Time*(h)*
RT"
37"°C"
Figure 15: Ratio of integrations between the maleate standard peak and that corresponding to the terminal methyl protons in 16 at room temperature and 37 °C. Ratios were normalized to that at time = 0 h.
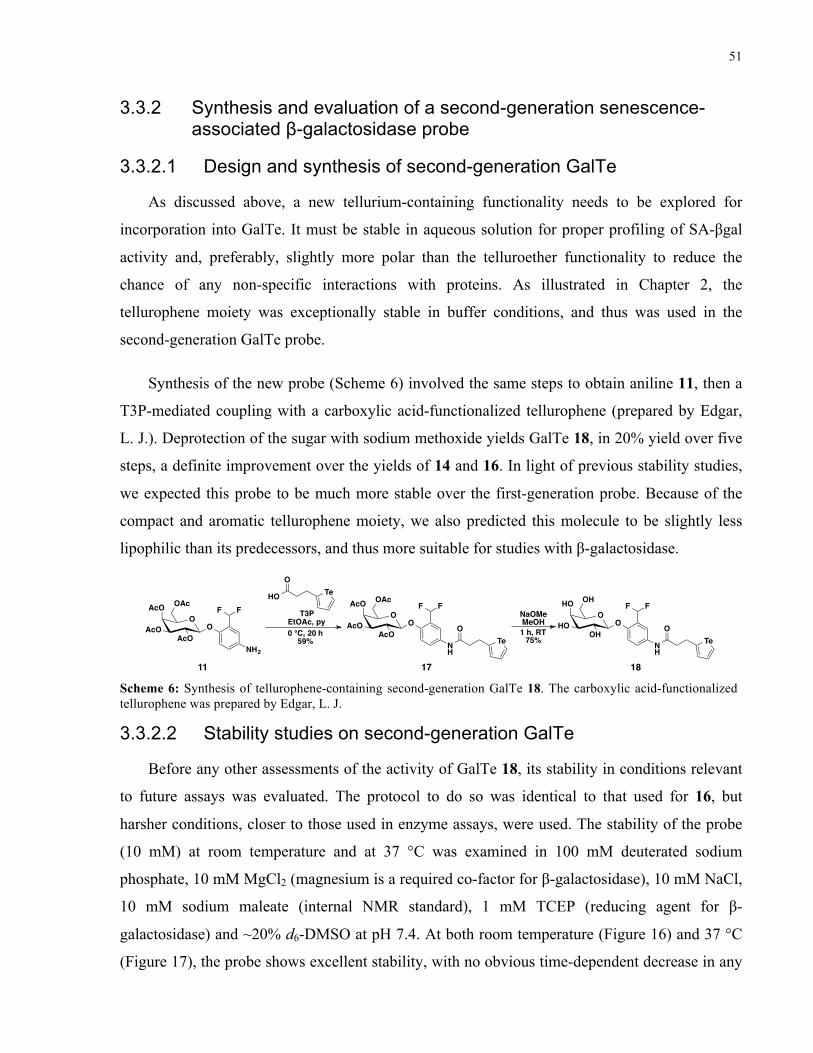
51
3.3.2 Synthesis and evaluation of a second-generation senescence-associated β-galactosidase probe
3.3.2.1 Design and synthesis of second-generation GalTe
As discussed above, a new tellurium-containing functionality needs to be explored for
incorporation into GalTe. It must be stable in aqueous solution for proper profiling of SA-βgal
activity and, preferably, slightly more polar than the telluroether functionality to reduce the
chance of any non-specific interactions with proteins. As illustrated in Chapter 2, the
tellurophene moiety was exceptionally stable in buffer conditions, and thus was used in the
second-generation GalTe probe.
Synthesis of the new probe (Scheme 6) involved the same steps to obtain aniline 11, then a
T3P-mediated coupling with a carboxylic acid-functionalized tellurophene (prepared by Edgar,
L. J.). Deprotection of the sugar with sodium methoxide yields GalTe 18, in 20% yield over five
steps, a definite improvement over the yields of 14 and 16. In light of previous stability studies,
we expected this probe to be much more stable over the first-generation probe. Because of the
compact and aromatic tellurophene moiety, we also predicted this molecule to be slightly less
lipophilic than its predecessors, and thus more suitable for studies with β-galactosidase.
3.3.2.2 Stability studies on second-generation GalTe
Before any other assessments of the activity of GalTe 18, its stability in conditions relevant
to future assays was evaluated. The protocol to do so was identical to that used for 16, but
harsher conditions, closer to those used in enzyme assays, were used. The stability of the probe
(10 mM) at room temperature and at 37 °C was examined in 100 mM deuterated sodium
phosphate, 10 mM MgCl2 (magnesium is a required co-factor for β-galactosidase), 10 mM NaCl,
10 mM sodium maleate (internal NMR standard), 1 mM TCEP (reducing agent for β-
galactosidase) and ~20% d6-DMSO at pH 7.4. At both room temperature (Figure 16) and 37 °C
(Figure 17), the probe shows excellent stability, with no obvious time-dependent decrease in any
Scheme 6: Synthesis of tellurophene-containing second-generation GalTe 18. The carboxylic acid-functionalized tellurophene was prepared by Edgar, L. J.
OAcO
OAc
AcOO
NH2
AcO FFHO
O
T3PEtOAc, py0 °C, 20 h
59%
OAcO
OAc
AcOO
NH
AcO FF
OO
HO
OH
OHO
NH
FF
O1 h, RT75%
Te
Te Te
11 17 18
NaOMeMeOH
OH
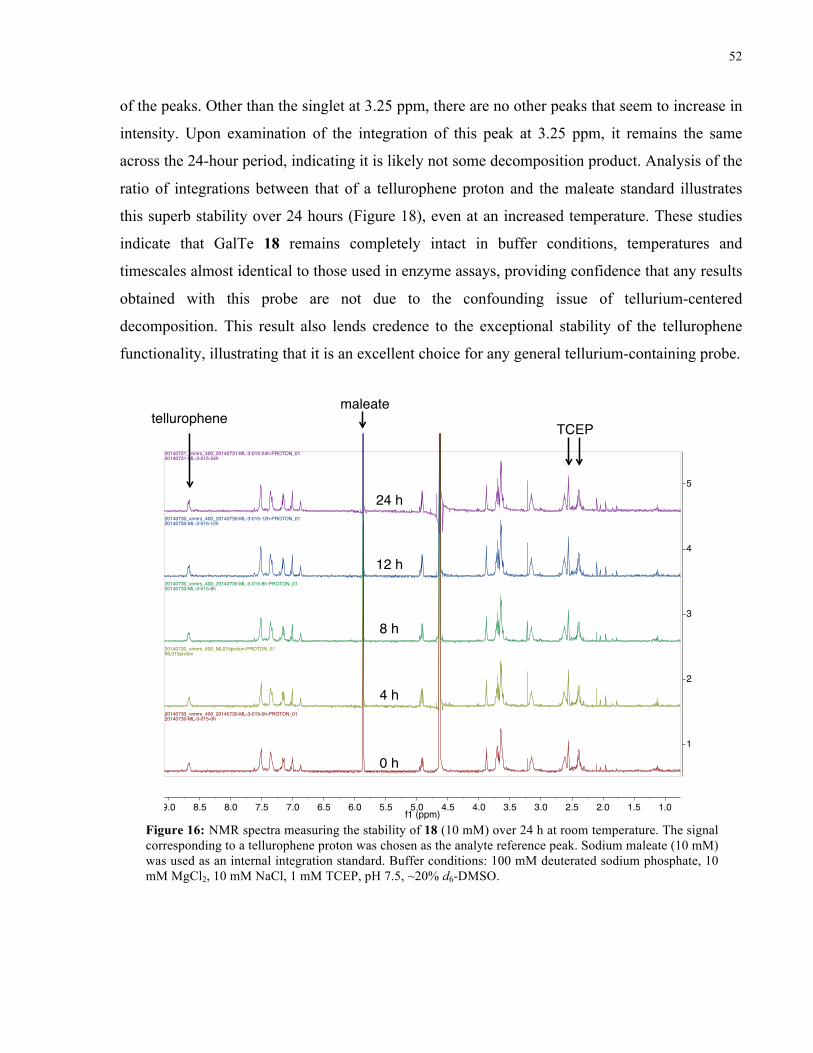
52
of the peaks. Other than the singlet at 3.25 ppm, there are no other peaks that seem to increase in
intensity. Upon examination of the integration of this peak at 3.25 ppm, it remains the same
across the 24-hour period, indicating it is likely not some decomposition product. Analysis of the
ratio of integrations between that of a tellurophene proton and the maleate standard illustrates
this superb stability over 24 hours (Figure 18), even at an increased temperature. These studies
indicate that GalTe 18 remains completely intact in buffer conditions, temperatures and
timescales almost identical to those used in enzyme assays, providing confidence that any results
obtained with this probe are not due to the confounding issue of tellurium-centered
decomposition. This result also lends credence to the exceptional stability of the tellurophene
functionality, illustrating that it is an excellent choice for any general tellurium-containing probe.
0 h!
4 h!
8 h!
12 h!
24 h!
maleate!tellurophene!
TCEP!
Figure 16: NMR spectra measuring the stability of 18 (10 mM) over 24 h at room temperature. The signal corresponding to a tellurophene proton was chosen as the analyte reference peak. Sodium maleate (10 mM) was used as an internal integration standard. Buffer conditions: 100 mM deuterated sodium phosphate, 10 mM MgCl2, 10 mM NaCl, 1 mM TCEP, pH 7.5, ~20% d6-DMSO.
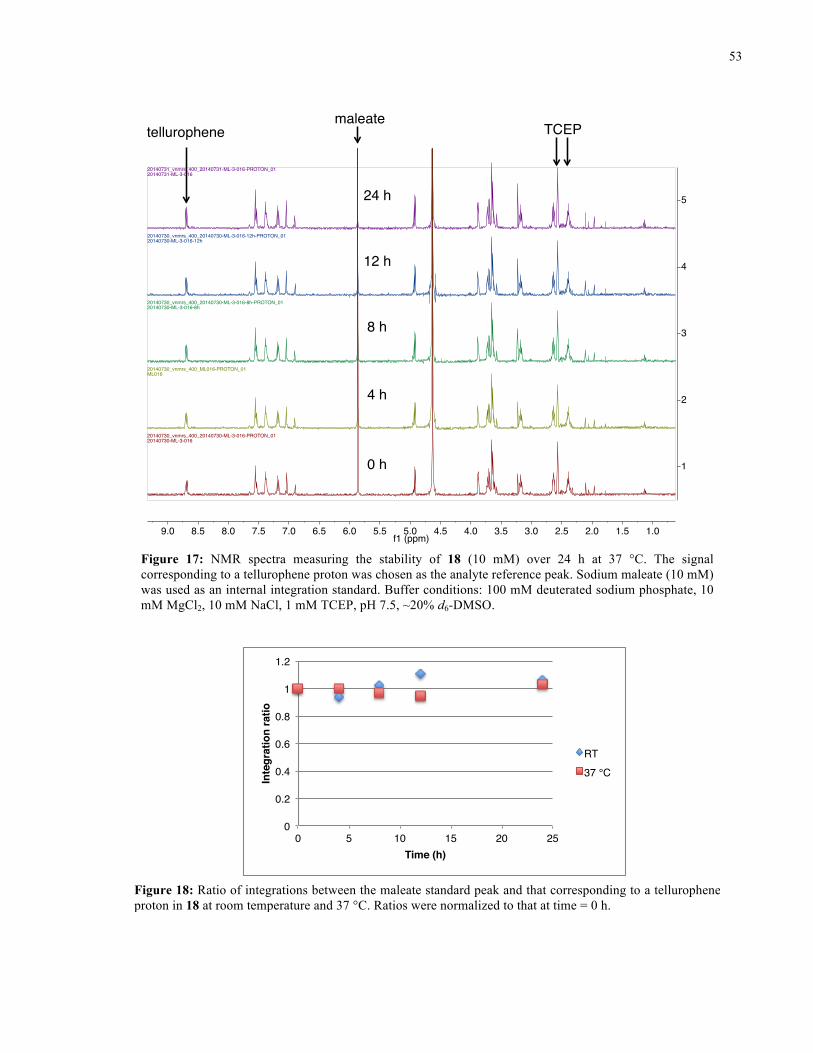
53
0 h!
4 h!
8 h!
12 h!
24 h!
maleate!tellurophene! TCEP!
Figure 17: NMR spectra measuring the stability of 18 (10 mM) over 24 h at 37 °C. The signal corresponding to a tellurophene proton was chosen as the analyte reference peak. Sodium maleate (10 mM) was used as an internal integration standard. Buffer conditions: 100 mM deuterated sodium phosphate, 10 mM MgCl2, 10 mM NaCl, 1 mM TCEP, pH 7.5, ~20% d6-DMSO.
0!
0.2!
0.4!
0.6!
0.8!
1!
1.2!
0! 5! 10! 15! 20! 25!
Inte
grat
ion
ratio!
Time (h)!
RT!
37 °C!
Figure 18: Ratio of integrations between the maleate standard peak and that corresponding to a tellurophene proton in 18 at room temperature and 37 °C. Ratios were normalized to that at time = 0 h.
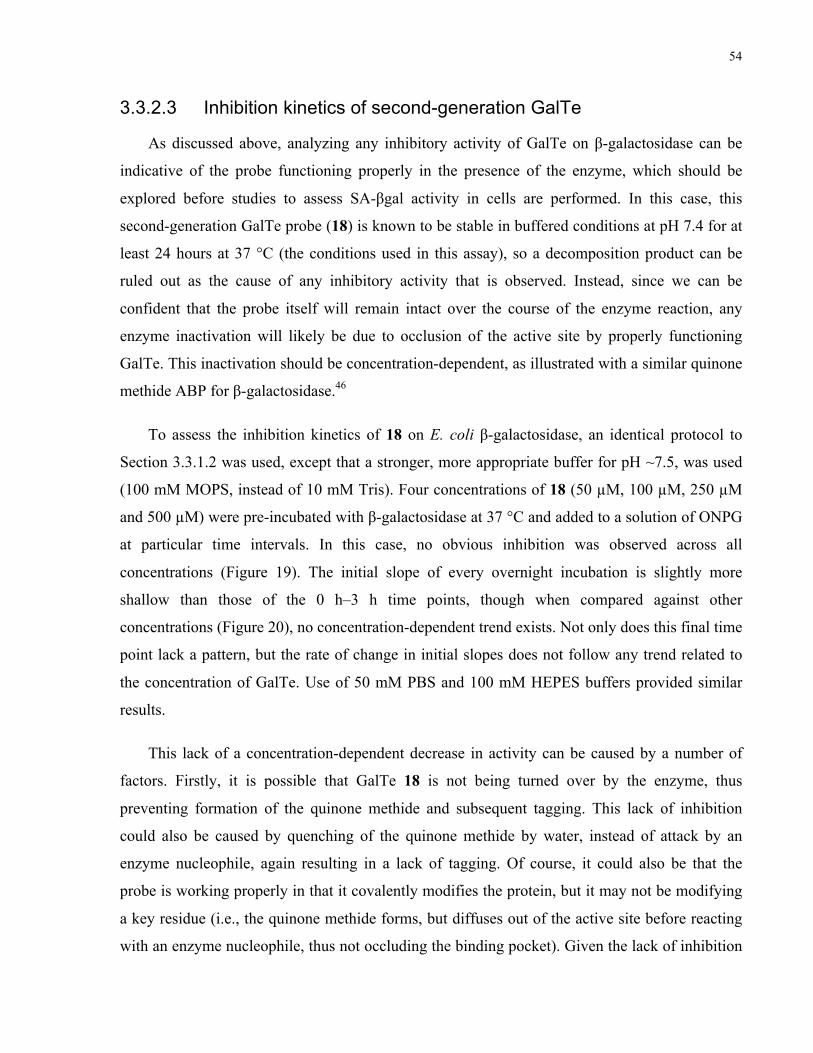
54
3.3.2.3 Inhibition kinetics of second-generation GalTe
As discussed above, analyzing any inhibitory activity of GalTe on β-galactosidase can be
indicative of the probe functioning properly in the presence of the enzyme, which should be
explored before studies to assess SA-βgal activity in cells are performed. In this case, this
second-generation GalTe probe (18) is known to be stable in buffered conditions at pH 7.4 for at
least 24 hours at 37 °C (the conditions used in this assay), so a decomposition product can be
ruled out as the cause of any inhibitory activity that is observed. Instead, since we can be
confident that the probe itself will remain intact over the course of the enzyme reaction, any
enzyme inactivation will likely be due to occlusion of the active site by properly functioning
GalTe. This inactivation should be concentration-dependent, as illustrated with a similar quinone
methide ABP for β-galactosidase.46
To assess the inhibition kinetics of 18 on E. coli β-galactosidase, an identical protocol to
Section 3.3.1.2 was used, except that a stronger, more appropriate buffer for pH ~7.5, was used
(100 mM MOPS, instead of 10 mM Tris). Four concentrations of 18 (50 µM, 100 µM, 250 µM
and 500 µM) were pre-incubated with β-galactosidase at 37 °C and added to a solution of ONPG
at particular time intervals. In this case, no obvious inhibition was observed across all
concentrations (Figure 19). The initial slope of every overnight incubation is slightly more
shallow than those of the 0 h–3 h time points, though when compared against other
concentrations (Figure 20), no concentration-dependent trend exists. Not only does this final time
point lack a pattern, but the rate of change in initial slopes does not follow any trend related to
the concentration of GalTe. Use of 50 mM PBS and 100 mM HEPES buffers provided similar
results.
This lack of a concentration-dependent decrease in activity can be caused by a number of
factors. Firstly, it is possible that GalTe 18 is not being turned over by the enzyme, thus
preventing formation of the quinone methide and subsequent tagging. This lack of inhibition
could also be caused by quenching of the quinone methide by water, instead of attack by an
enzyme nucleophile, again resulting in a lack of tagging. Of course, it could also be that the
probe is working properly in that it covalently modifies the protein, but it may not be modifying
a key residue (i.e., the quinone methide forms, but diffuses out of the active site before reacting
with an enzyme nucleophile, thus not occluding the binding pocket). Given the lack of inhibition
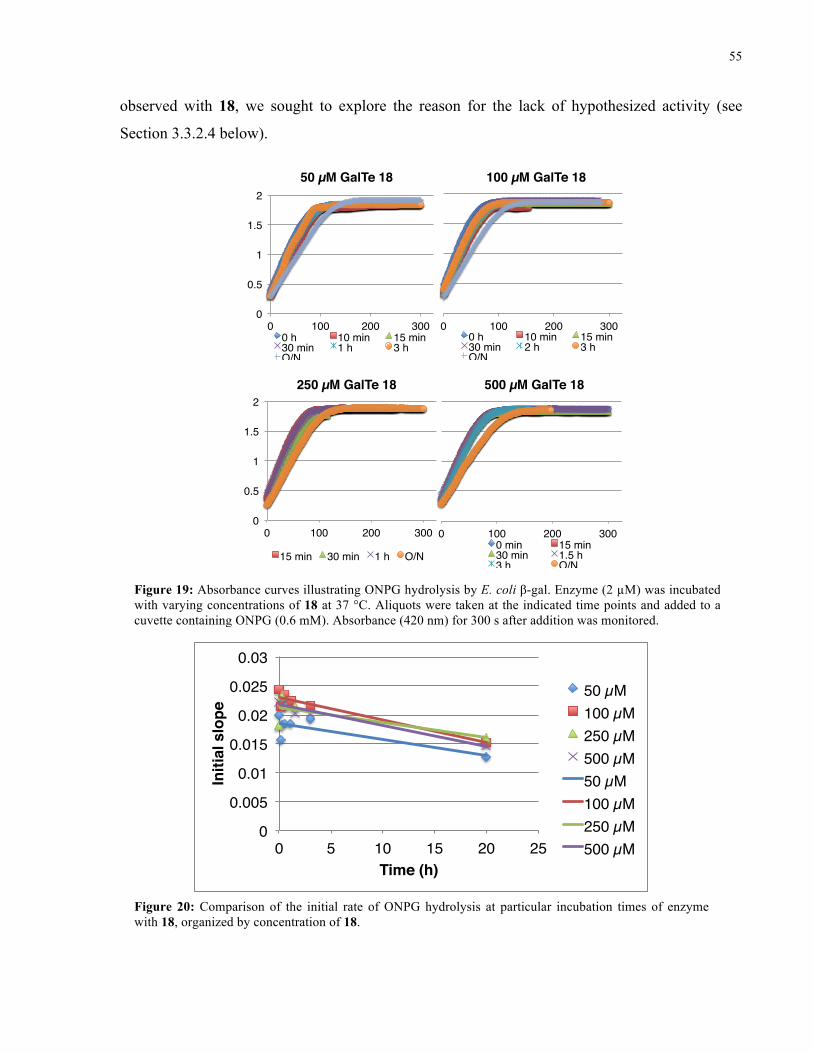
55
observed with 18, we sought to explore the reason for the lack of hypothesized activity (see
Section 3.3.2.4 below).
0!
0.5!
1!
1.5!
2!
0! 100! 200! 300!
50 µM GalTe 18!
0 h! 10 min! 15 min!30 min! 1 h! 3 h!O/N!
0! 100! 200! 300!
100 µM GalTe 18!
0 h! 10 min! 15 min!30 min! 2 h! 3 h!O/N!
0!
0.5!
1!
1.5!
2!
0! 100! 200! 300!
250 µM GalTe 18!
15 min! 30 min! 1 h! O/N!
0! 100! 200! 300!
500 µM GalTe 18!
0 min! 15 min!30 min! 1.5 h!3 h! O/N!
Figure 19: Absorbance curves illustrating ONPG hydrolysis by E. coli β-gal. Enzyme (2 µM) was incubated with varying concentrations of 18 at 37 °C. Aliquots were taken at the indicated time points and added to a cuvette containing ONPG (0.6 mM). Absorbance (420 nm) for 300 s after addition was monitored.
0!
0.005!
0.01!
0.015!
0.02!
0.025!
0.03!
0! 5! 10! 15! 20! 25!
Initi
al s
lope!
Time (h)!
50 µM!100 µM!250 µM!500 µM!50 µM!100 µM!250 µM!500 µM!
Figure 20: Comparison of the initial rate of ONPG hydrolysis at particular incubation times of enzyme with 18, organized by concentration of 18.
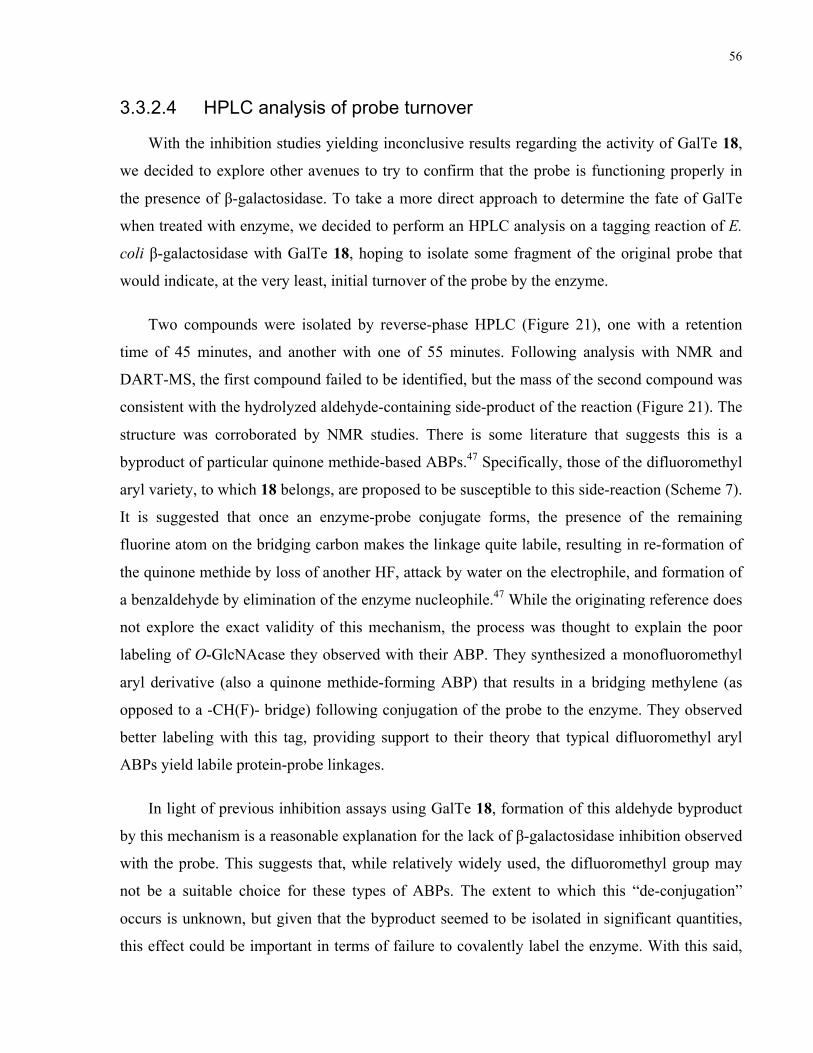
56
3.3.2.4 HPLC analysis of probe turnover
With the inhibition studies yielding inconclusive results regarding the activity of GalTe 18,
we decided to explore other avenues to try to confirm that the probe is functioning properly in
the presence of β-galactosidase. To take a more direct approach to determine the fate of GalTe
when treated with enzyme, we decided to perform an HPLC analysis on a tagging reaction of E.
coli β-galactosidase with GalTe 18, hoping to isolate some fragment of the original probe that
would indicate, at the very least, initial turnover of the probe by the enzyme.
Two compounds were isolated by reverse-phase HPLC (Figure 21), one with a retention
time of 45 minutes, and another with one of 55 minutes. Following analysis with NMR and
DART-MS, the first compound failed to be identified, but the mass of the second compound was
consistent with the hydrolyzed aldehyde-containing side-product of the reaction (Figure 21). The
structure was corroborated by NMR studies. There is some literature that suggests this is a
byproduct of particular quinone methide-based ABPs.47 Specifically, those of the difluoromethyl
aryl variety, to which 18 belongs, are proposed to be susceptible to this side-reaction (Scheme 7).
It is suggested that once an enzyme-probe conjugate forms, the presence of the remaining
fluorine atom on the bridging carbon makes the linkage quite labile, resulting in re-formation of
the quinone methide by loss of another HF, attack by water on the electrophile, and formation of
a benzaldehyde by elimination of the enzyme nucleophile.47 While the originating reference does
not explore the exact validity of this mechanism, the process was thought to explain the poor
labeling of O-GlcNAcase they observed with their ABP. They synthesized a monofluoromethyl
aryl derivative (also a quinone methide-forming ABP) that results in a bridging methylene (as
opposed to a -CH(F)- bridge) following conjugation of the probe to the enzyme. They observed
better labeling with this tag, providing support to their theory that typical difluoromethyl aryl
ABPs yield labile protein-probe linkages.
In light of previous inhibition assays using GalTe 18, formation of this aldehyde byproduct
by this mechanism is a reasonable explanation for the lack of β-galactosidase inhibition observed
with the probe. This suggests that, while relatively widely used, the difluoromethyl group may
not be a suitable choice for these types of ABPs. The extent to which this “de-conjugation”
occurs is unknown, but given that the byproduct seemed to be isolated in significant quantities,
this effect could be important in terms of failure to covalently label the enzyme. With this said,
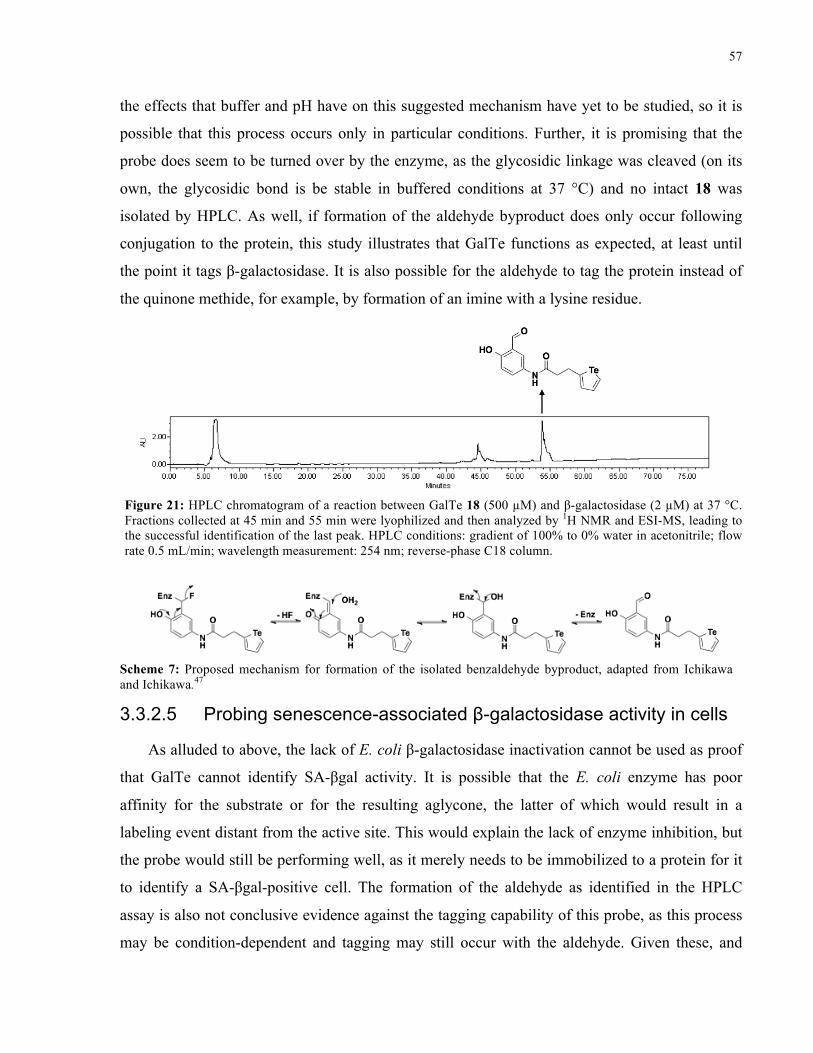
57
the effects that buffer and pH have on this suggested mechanism have yet to be studied, so it is
possible that this process occurs only in particular conditions. Further, it is promising that the
probe does seem to be turned over by the enzyme, as the glycosidic linkage was cleaved (on its
own, the glycosidic bond is be stable in buffered conditions at 37 °C) and no intact 18 was
isolated by HPLC. As well, if formation of the aldehyde byproduct does only occur following
conjugation to the protein, this study illustrates that GalTe functions as expected, at least until
the point it tags β-galactosidase. It is also possible for the aldehyde to tag the protein instead of
the quinone methide, for example, by formation of an imine with a lysine residue.
3.3.2.5 Probing senescence-associated β-galactosidase activity in cells
As alluded to above, the lack of E. coli β-galactosidase inactivation cannot be used as proof
that GalTe cannot identify SA-βgal activity. It is possible that the E. coli enzyme has poor
affinity for the substrate or for the resulting aglycone, the latter of which would result in a
labeling event distant from the active site. This would explain the lack of enzyme inhibition, but
the probe would still be performing well, as it merely needs to be immobilized to a protein for it
to identify a SA-βgal-positive cell. The formation of the aldehyde as identified in the HPLC
assay is also not conclusive evidence against the tagging capability of this probe, as this process
may be condition-dependent and tagging may still occur with the aldehyde. Given these, and
Scheme 7: Proposed mechanism for formation of the isolated benzaldehyde byproduct, adapted from Ichikawa and Ichikawa.47
Figure 21: HPLC chromatogram of a reaction between GalTe 18 (500 µM) and β-galactosidase (2 µM) at 37 °C. Fractions collected at 45 min and 55 min were lyophilized and then analyzed by 1H NMR and ESI-MS, leading to the successful identification of the last peak. HPLC conditions: gradient of 100% to 0% water in acetonitrile; flow rate 0.5 mL/min; wavelength measurement: 254 nm; reverse-phase C18 column.
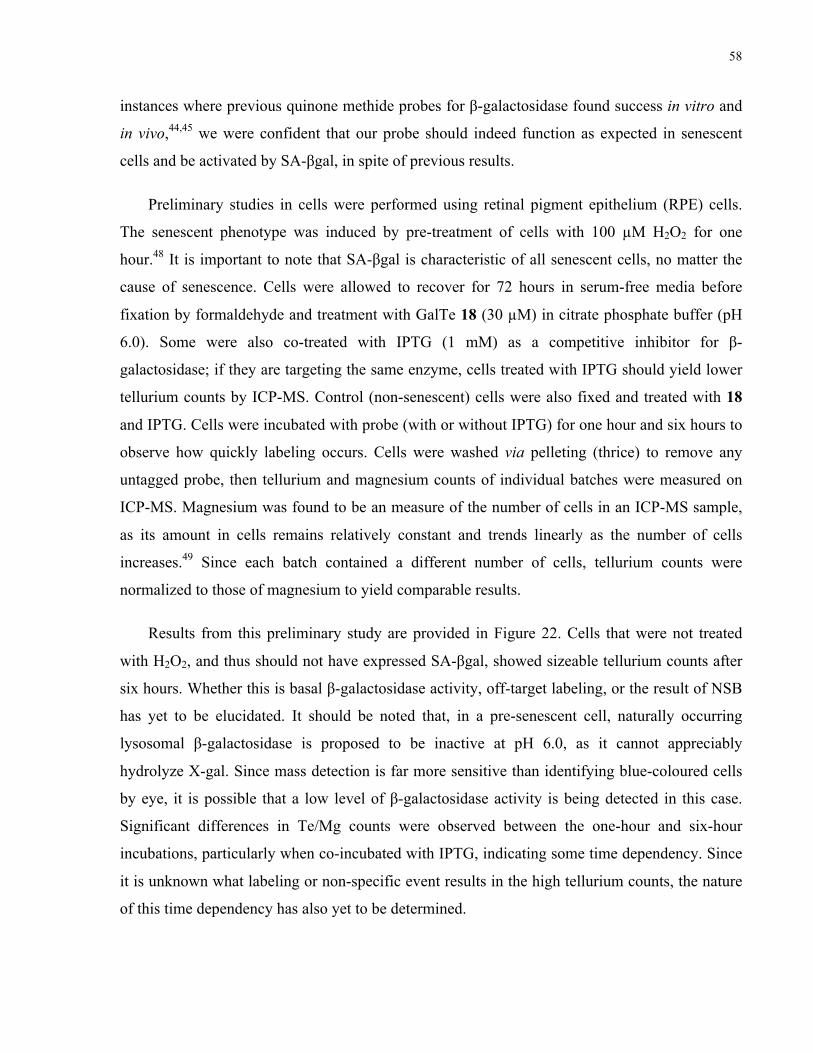
58
instances where previous quinone methide probes for β-galactosidase found success in vitro and
in vivo,44,45 we were confident that our probe should indeed function as expected in senescent
cells and be activated by SA-βgal, in spite of previous results.
Preliminary studies in cells were performed using retinal pigment epithelium (RPE) cells.
The senescent phenotype was induced by pre-treatment of cells with 100 µM H2O2 for one
hour.48 It is important to note that SA-βgal is characteristic of all senescent cells, no matter the
cause of senescence. Cells were allowed to recover for 72 hours in serum-free media before
fixation by formaldehyde and treatment with GalTe 18 (30 µM) in citrate phosphate buffer (pH
6.0). Some were also co-treated with IPTG (1 mM) as a competitive inhibitor for β-
galactosidase; if they are targeting the same enzyme, cells treated with IPTG should yield lower
tellurium counts by ICP-MS. Control (non-senescent) cells were also fixed and treated with 18
and IPTG. Cells were incubated with probe (with or without IPTG) for one hour and six hours to
observe how quickly labeling occurs. Cells were washed via pelleting (thrice) to remove any
untagged probe, then tellurium and magnesium counts of individual batches were measured on
ICP-MS. Magnesium was found to be an measure of the number of cells in an ICP-MS sample,
as its amount in cells remains relatively constant and trends linearly as the number of cells
increases.49 Since each batch contained a different number of cells, tellurium counts were
normalized to those of magnesium to yield comparable results.
Results from this preliminary study are provided in Figure 22. Cells that were not treated
with H2O2, and thus should not have expressed SA-βgal, showed sizeable tellurium counts after
six hours. Whether this is basal β-galactosidase activity, off-target labeling, or the result of NSB
has yet to be elucidated. It should be noted that, in a pre-senescent cell, naturally occurring
lysosomal β-galactosidase is proposed to be inactive at pH 6.0, as it cannot appreciably
hydrolyze X-gal. Since mass detection is far more sensitive than identifying blue-coloured cells
by eye, it is possible that a low level of β-galactosidase activity is being detected in this case.
Significant differences in Te/Mg counts were observed between the one-hour and six-hour
incubations, particularly when co-incubated with IPTG, indicating some time dependency. Since
it is unknown what labeling or non-specific event results in the high tellurium counts, the nature
of this time dependency has also yet to be determined.
59
A more striking difference between the short and long incubations is observed in cells
treated with H2O2 (presumably senescent), with and without IPTG. More interestingly, these
cells possess a higher tellurium count than do the non-senescent cells; this increase may be
attributed to the presence of SA-βgal, and tagging by GalTe. Senescent cells treated with IPTG
also yield lower tellurium counts than those incubated in the absence of the inhibitor, indicating
that, in the former case, IPTG is competing for the same enzyme active site as GalTe 18
(presumably, SA-βgal), thus providing further support for the probe successfully tagging SA-
βgal. While preliminary, these findings are quite promising.
3.3.3 Synthesis and preliminary evaluation of next-generation senescence-associated β-galactosidase probes
3.3.3.1 Design and synthesis of next-generation GalTe
To circumvent the issue of benzaldehyde formation proposed to occur with their
difluoromethyl aryl quinone methide ABP, Ichikawa and Ichikawa synthesized a
monofluoromethyl derivative of the same probe.47 Once the first fluorine is lost to form the
quinone methide (Scheme 8), no labile bond exists on that electrophilic carbon (as opposed to the
difluoromethyl derivative, which still contains a carbon-fluorine bond). Once a nucleophile
attacks this centre, the linkage that forms should be much more stable, as there is no other
0.000!
5.000!
10.000!
15.000!
20.000!
25.000!
Te/M
g (a
rbitr
ary
units
)!
1h!6h!
probe! +! +! +! +!H2O2! –! –! +! +!IPTG! –! +! –! +!
Figure 22: Treatment of RPE cells with GalTe 18 and subsequent quantification of tellurium by ICP-MS for each condition. Senescence was induced by an hour-long preincubation of cells with H2O2 72 hours prior to treatment with probe. Cells were treated with IPTG and probe simultaneously, and incubated at room temperature for either one or six hours. Tellurium counts are normalized to magnesium counts to correct for differing numbers of cells in each trial. Error bars show standard error between duplicate assays.
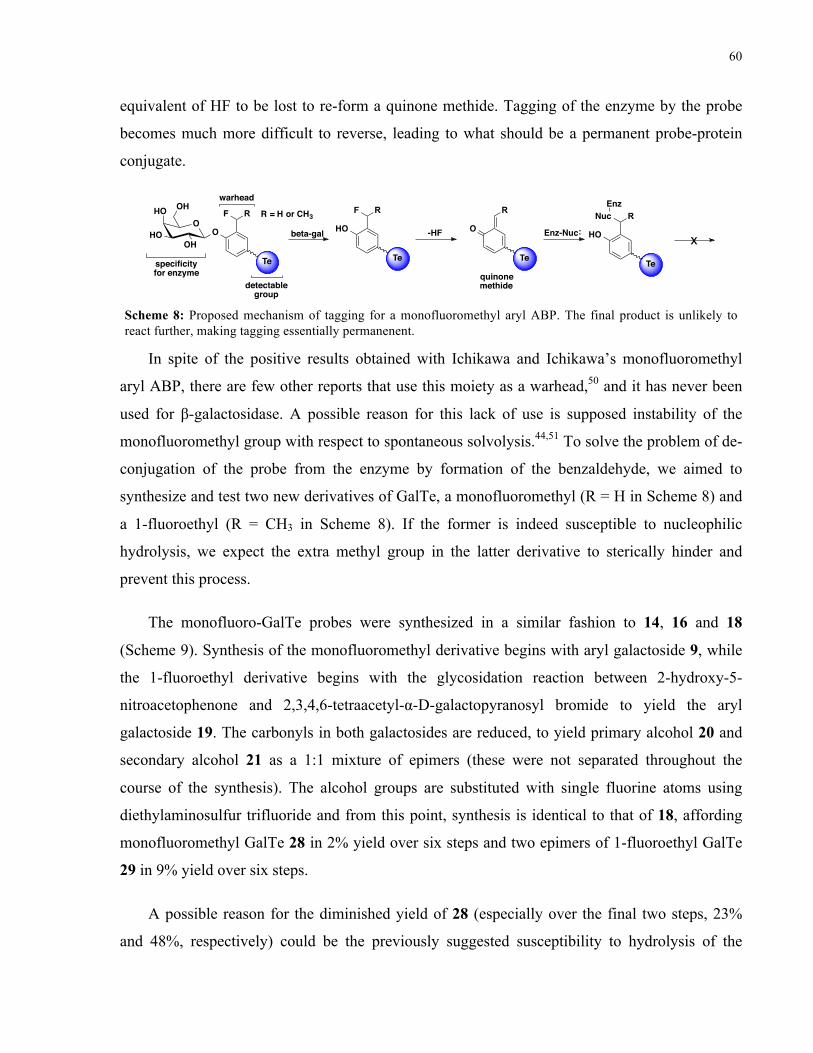
60
equivalent of HF to be lost to re-form a quinone methide. Tagging of the enzyme by the probe
becomes much more difficult to reverse, leading to what should be a permanent probe-protein
conjugate.
In spite of the positive results obtained with Ichikawa and Ichikawa’s monofluoromethyl
aryl ABP, there are few other reports that use this moiety as a warhead,50 and it has never been
used for β-galactosidase. A possible reason for this lack of use is supposed instability of the
monofluoromethyl group with respect to spontaneous solvolysis.44,51 To solve the problem of de-
conjugation of the probe from the enzyme by formation of the benzaldehyde, we aimed to
synthesize and test two new derivatives of GalTe, a monofluoromethyl (R = H in Scheme 8) and
a 1-fluoroethyl (R = CH3 in Scheme 8). If the former is indeed susceptible to nucleophilic
hydrolysis, we expect the extra methyl group in the latter derivative to sterically hinder and
prevent this process.
The monofluoro-GalTe probes were synthesized in a similar fashion to 14, 16 and 18
(Scheme 9). Synthesis of the monofluoromethyl derivative begins with aryl galactoside 9, while
the 1-fluoroethyl derivative begins with the glycosidation reaction between 2-hydroxy-5-
nitroacetophenone and 2,3,4,6-tetraacetyl-α-D-galactopyranosyl bromide to yield the aryl
galactoside 19. The carbonyls in both galactosides are reduced, to yield primary alcohol 20 and
secondary alcohol 21 as a 1:1 mixture of epimers (these were not separated throughout the
course of the synthesis). The alcohol groups are substituted with single fluorine atoms using
diethylaminosulfur trifluoride and from this point, synthesis is identical to that of 18, affording
monofluoromethyl GalTe 28 in 2% yield over six steps and two epimers of 1-fluoroethyl GalTe
29 in 9% yield over six steps.
A possible reason for the diminished yield of 28 (especially over the final two steps, 23%
and 48%, respectively) could be the previously suggested susceptibility to hydrolysis of the
beta-gal Enz-NucO
HO
OH
OHO
OH
F
quinonemethide
specificityfor enzyme
warhead
Te
detectablegroup
HO
F
Te
O
Te Te
HO
NucEnz
-HF x
R R RRR = H or CH3
Scheme 8: Proposed mechanism of tagging for a monofluoromethyl aryl ABP. The final product is unlikely to react further, making tagging essentially permanenent.
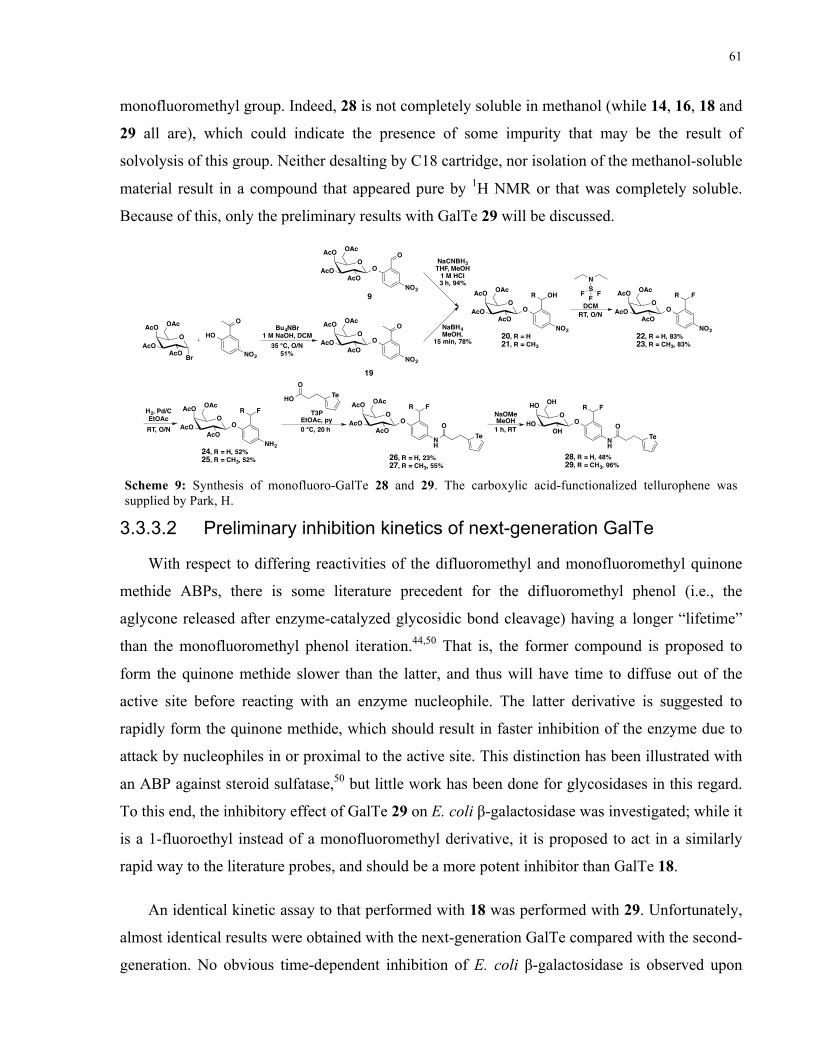
61
monofluoromethyl group. Indeed, 28 is not completely soluble in methanol (while 14, 16, 18 and
29 all are), which could indicate the presence of some impurity that may be the result of
solvolysis of this group. Neither desalting by C18 cartridge, nor isolation of the methanol-soluble
material result in a compound that appeared pure by 1H NMR or that was completely soluble.
Because of this, only the preliminary results with GalTe 29 will be discussed.
3.3.3.2 Preliminary inhibition kinetics of next-generation GalTe
With respect to differing reactivities of the difluoromethyl and monofluoromethyl quinone
methide ABPs, there is some literature precedent for the difluoromethyl phenol (i.e., the
aglycone released after enzyme-catalyzed glycosidic bond cleavage) having a longer “lifetime”
than the monofluoromethyl phenol iteration.44,50 That is, the former compound is proposed to
form the quinone methide slower than the latter, and thus will have time to diffuse out of the
active site before reacting with an enzyme nucleophile. The latter derivative is suggested to
rapidly form the quinone methide, which should result in faster inhibition of the enzyme due to
attack by nucleophiles in or proximal to the active site. This distinction has been illustrated with
an ABP against steroid sulfatase,50 but little work has been done for glycosidases in this regard.
To this end, the inhibitory effect of GalTe 29 on E. coli β-galactosidase was investigated; while it
is a 1-fluoroethyl instead of a monofluoromethyl derivative, it is proposed to act in a similarly
rapid way to the literature probes, and should be a more potent inhibitor than GalTe 18.
An identical kinetic assay to that performed with 18 was performed with 29. Unfortunately,
almost identical results were obtained with the next-generation GalTe compared with the second-
generation. No obvious time-dependent inhibition of E. coli β-galactosidase is observed upon
OAcO
OAc
AcOO
NO2
AcO O
9
OAcO
OAc
AcO Br
HO
NO2
OAcO
OAc
AcOO
NO2
AcO Bu4NBr1 M NaOH, DCM
35 °C, O/N51%
AcOOO
19
NSFF F
NaCNBH3THF, MeOH
1 M HCl3 h, 94%
NaBH4MeOH,
15 min, 78%
OAcO
OAc
AcOO
NO2
AcO R OH
20, R = H21, R = CH3
OAcO
OAc
AcOO
NO2
AcO R FDCM
RT, O/N
22, R = H, 83%23, R = CH3, 83%
OAcO
OAc
AcOO
NH2
AcO R F
24, R = H, 52%25, R = CH3, 52%
H2, Pd/CEtOAcRT, O/N
HO
O
T3PEtOAc, py0 °C, 20 h
Te
OAcO
OAc
AcOO
NH
AcO F
OTe
R
26, R = H, 23%27, R = CH3, 55%
OHO
OH
OHO
NH
FR
O1 h, RTTe
NaOMeMeOH
OH
28, R = H, 48%29, R = CH3, 96%
Scheme 9: Synthesis of monofluoro-GalTe 28 and 29. The carboxylic acid-functionalized tellurophene was supplied by Park, H.
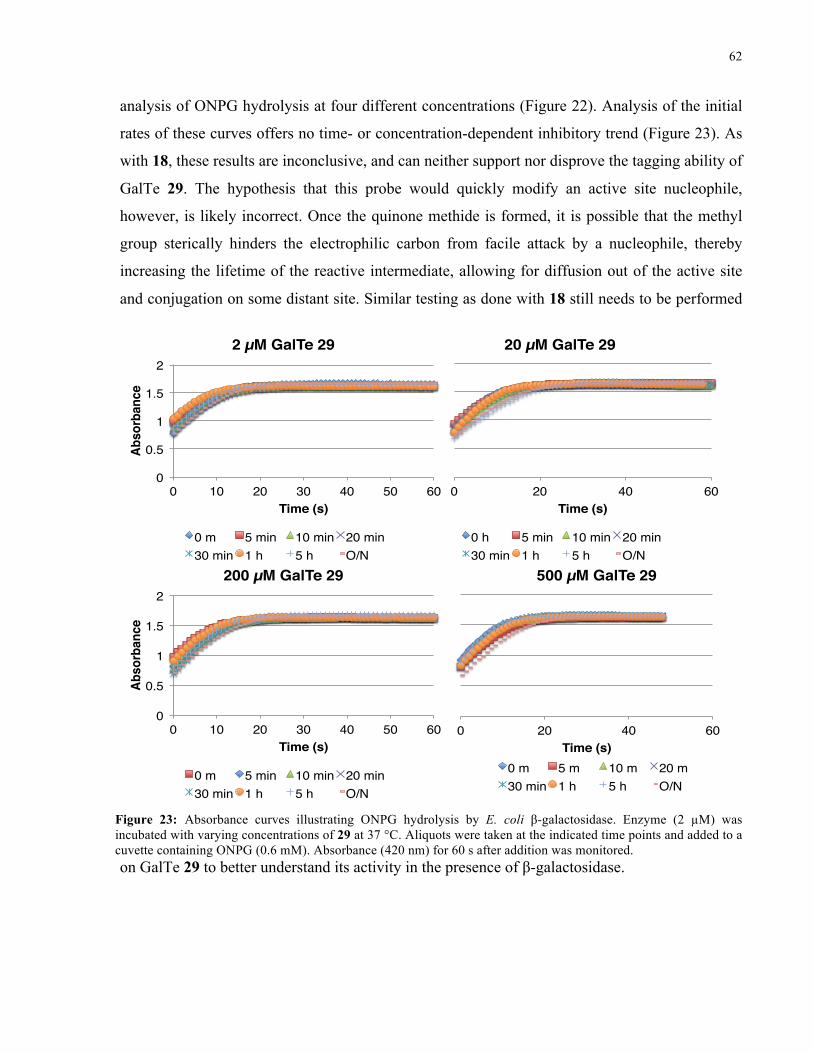
62
analysis of ONPG hydrolysis at four different concentrations (Figure 22). Analysis of the initial
rates of these curves offers no time- or concentration-dependent inhibitory trend (Figure 23). As
with 18, these results are inconclusive, and can neither support nor disprove the tagging ability of
GalTe 29. The hypothesis that this probe would quickly modify an active site nucleophile,
however, is likely incorrect. Once the quinone methide is formed, it is possible that the methyl
group sterically hinders the electrophilic carbon from facile attack by a nucleophile, thereby
increasing the lifetime of the reactive intermediate, allowing for diffusion out of the active site
and conjugation on some distant site. Similar testing as done with 18 still needs to be performed
on GalTe 29 to better understand its activity in the presence of β-galactosidase.
0! 20! 40! 60!Time (s)!
20 µM GalTe 29!
0 h! 5 min! 10 min! 20 min!30 min! 1 h! 5 h! O/N!
0!
0.5!
1!
1.5!
2!
0! 10! 20! 30! 40! 50! 60!
Abso
rban
ce!
Time (s)!
2 µM GalTe 29!
0 m! 5 min! 10 min! 20 min!30 min! 1 h! 5 h! O/N!
0!
0.5!
1!
1.5!
2!
0! 10! 20! 30! 40! 50! 60!
Abso
rban
ce!
Time (s)!
200 µM GalTe 29!
0 m! 5 min! 10 min! 20 min!30 min! 1 h! 5 h! O/N!
0! 20! 40! 60!Time (s)!
500 µM GalTe 29!
0 m! 5 m! 10 m! 20 m!30 min! 1 h! 5 h! O/N!
Figure 23: Absorbance curves illustrating ONPG hydrolysis by E. coli β-galactosidase. Enzyme (2 µM) was incubated with varying concentrations of 29 at 37 °C. Aliquots were taken at the indicated time points and added to a cuvette containing ONPG (0.6 mM). Absorbance (420 nm) for 60 s after addition was monitored.
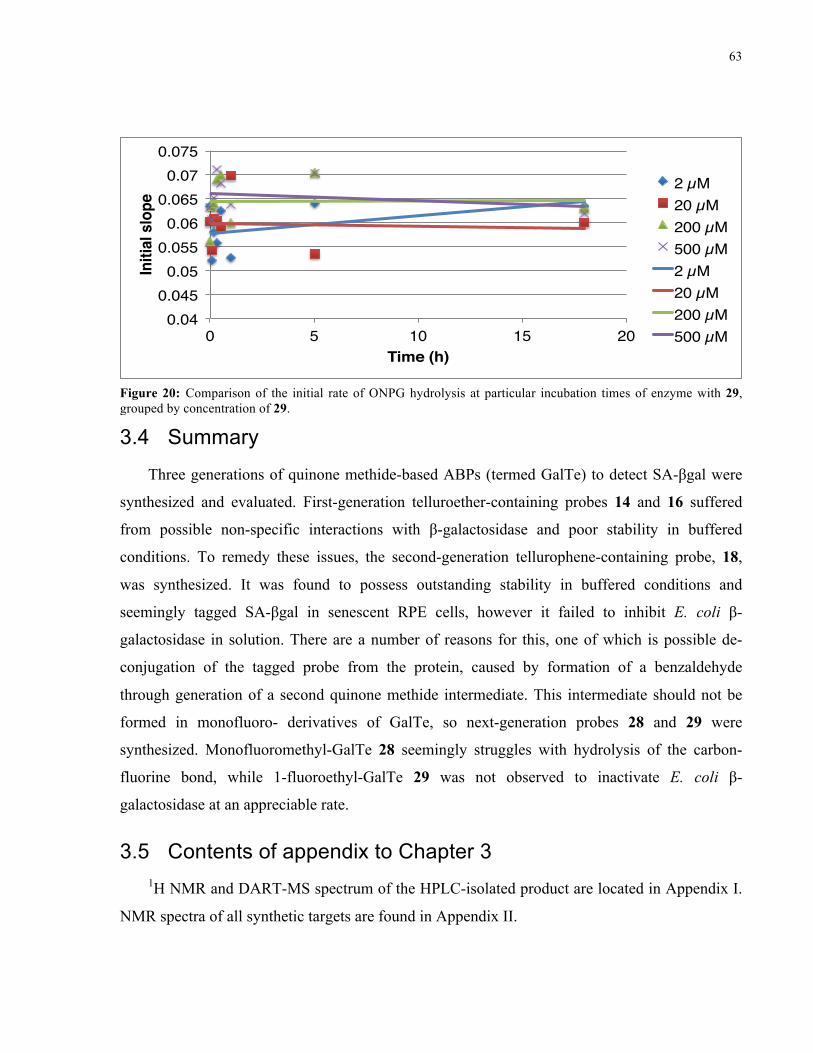
63
3.4 Summary
Three generations of quinone methide-based ABPs (termed GalTe) to detect SA-βgal were
synthesized and evaluated. First-generation telluroether-containing probes 14 and 16 suffered
from possible non-specific interactions with β-galactosidase and poor stability in buffered
conditions. To remedy these issues, the second-generation tellurophene-containing probe, 18,
was synthesized. It was found to possess outstanding stability in buffered conditions and
seemingly tagged SA-βgal in senescent RPE cells, however it failed to inhibit E. coli β-
galactosidase in solution. There are a number of reasons for this, one of which is possible de-
conjugation of the tagged probe from the protein, caused by formation of a benzaldehyde
through generation of a second quinone methide intermediate. This intermediate should not be
formed in monofluoro- derivatives of GalTe, so next-generation probes 28 and 29 were
synthesized. Monofluoromethyl-GalTe 28 seemingly struggles with hydrolysis of the carbon-
fluorine bond, while 1-fluoroethyl-GalTe 29 was not observed to inactivate E. coli β-
galactosidase at an appreciable rate.
3.5 Contents of appendix to Chapter 3 1H NMR and DART-MS spectrum of the HPLC-isolated product are located in Appendix I.
NMR spectra of all synthetic targets are found in Appendix II.
0.04!0.045!
0.05!0.055!
0.06!0.065!
0.07!0.075!
0! 5! 10! 15! 20!
Initi
al s
lope!
Time (h)!
2 µM!20 µM!200 µM!500 µM!2 µM!20 µM!200 µM!500 µM!
Figure 20: Comparison of the initial rate of ONPG hydrolysis at particular incubation times of enzyme with 29, grouped by concentration of 29.
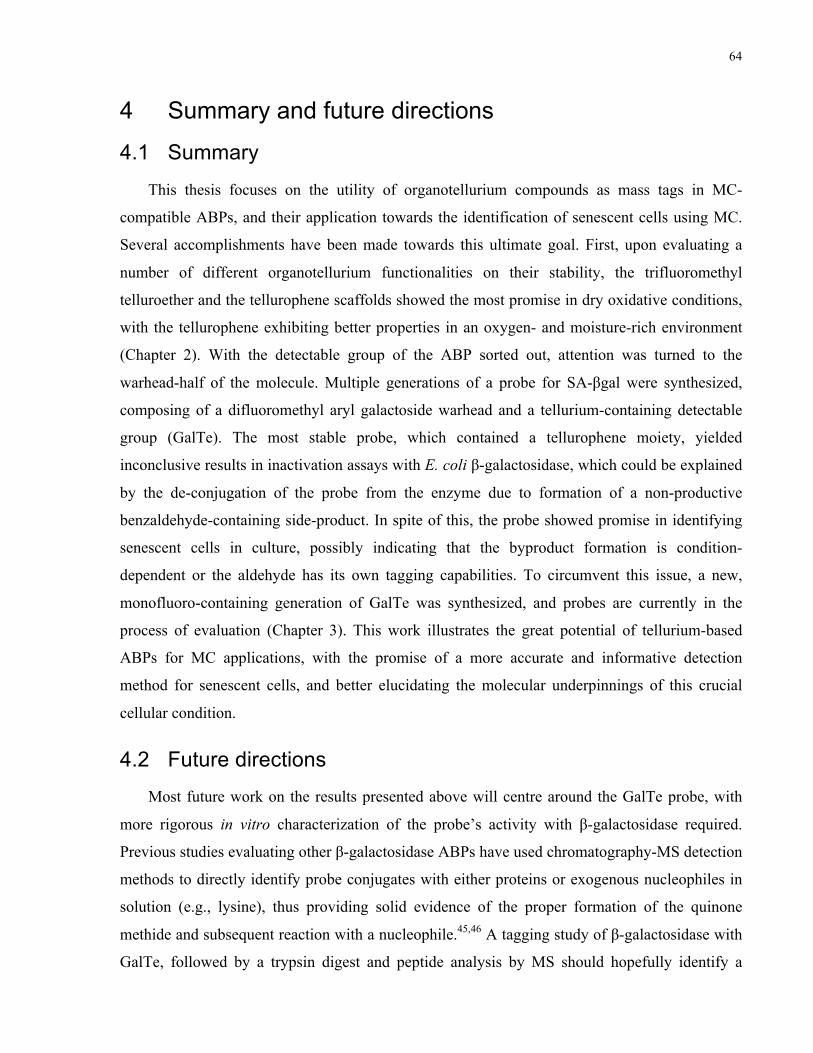
64
4 Summary and future directions
4.1 Summary
This thesis focuses on the utility of organotellurium compounds as mass tags in MC-
compatible ABPs, and their application towards the identification of senescent cells using MC.
Several accomplishments have been made towards this ultimate goal. First, upon evaluating a
number of different organotellurium functionalities on their stability, the trifluoromethyl
telluroether and the tellurophene scaffolds showed the most promise in dry oxidative conditions,
with the tellurophene exhibiting better properties in an oxygen- and moisture-rich environment
(Chapter 2). With the detectable group of the ABP sorted out, attention was turned to the
warhead-half of the molecule. Multiple generations of a probe for SA-βgal were synthesized,
composing of a difluoromethyl aryl galactoside warhead and a tellurium-containing detectable
group (GalTe). The most stable probe, which contained a tellurophene moiety, yielded
inconclusive results in inactivation assays with E. coli β-galactosidase, which could be explained
by the de-conjugation of the probe from the enzyme due to formation of a non-productive
benzaldehyde-containing side-product. In spite of this, the probe showed promise in identifying
senescent cells in culture, possibly indicating that the byproduct formation is condition-
dependent or the aldehyde has its own tagging capabilities. To circumvent this issue, a new,
monofluoro-containing generation of GalTe was synthesized, and probes are currently in the
process of evaluation (Chapter 3). This work illustrates the great potential of tellurium-based
ABPs for MC applications, with the promise of a more accurate and informative detection
method for senescent cells, and better elucidating the molecular underpinnings of this crucial
cellular condition.
4.2 Future directions
Most future work on the results presented above will centre around the GalTe probe, with
more rigorous in vitro characterization of the probe’s activity with β-galactosidase required.
Previous studies evaluating other β-galactosidase ABPs have used chromatography-MS detection
methods to directly identify probe conjugates with either proteins or exogenous nucleophiles in
solution (e.g., lysine), thus providing solid evidence of the proper formation of the quinone
methide and subsequent reaction with a nucleophile.45,46 A tagging study of β-galactosidase with
GalTe, followed by a trypsin digest and peptide analysis by MS should hopefully identify a
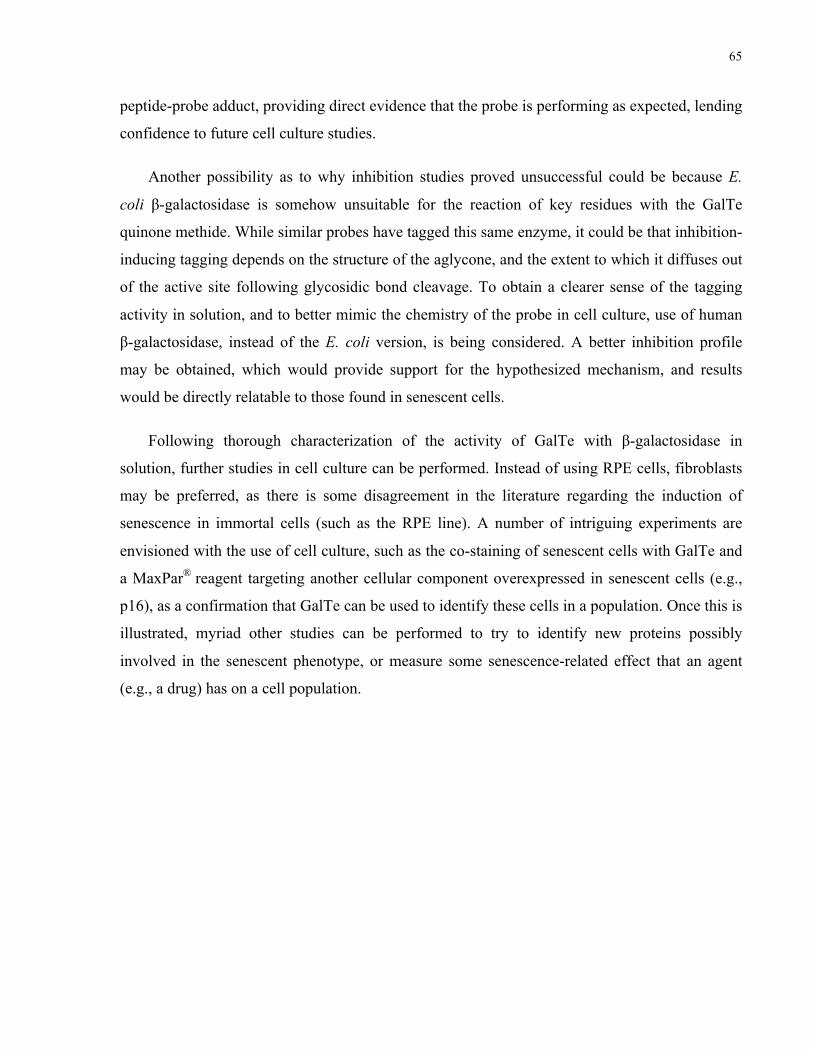
65
peptide-probe adduct, providing direct evidence that the probe is performing as expected, lending
confidence to future cell culture studies.
Another possibility as to why inhibition studies proved unsuccessful could be because E.
coli β-galactosidase is somehow unsuitable for the reaction of key residues with the GalTe
quinone methide. While similar probes have tagged this same enzyme, it could be that inhibition-
inducing tagging depends on the structure of the aglycone, and the extent to which it diffuses out
of the active site following glycosidic bond cleavage. To obtain a clearer sense of the tagging
activity in solution, and to better mimic the chemistry of the probe in cell culture, use of human
β-galactosidase, instead of the E. coli version, is being considered. A better inhibition profile
may be obtained, which would provide support for the hypothesized mechanism, and results
would be directly relatable to those found in senescent cells.
Following thorough characterization of the activity of GalTe with β-galactosidase in
solution, further studies in cell culture can be performed. Instead of using RPE cells, fibroblasts
may be preferred, as there is some disagreement in the literature regarding the induction of
senescence in immortal cells (such as the RPE line). A number of intriguing experiments are
envisioned with the use of cell culture, such as the co-staining of senescent cells with GalTe and
a MaxPar® reagent targeting another cellular component overexpressed in senescent cells (e.g.,
p16), as a confirmation that GalTe can be used to identify these cells in a population. Once this is
illustrated, myriad other studies can be performed to try to identify new proteins possibly
involved in the senescent phenotype, or measure some senescence-related effect that an agent
(e.g., a drug) has on a cell population.
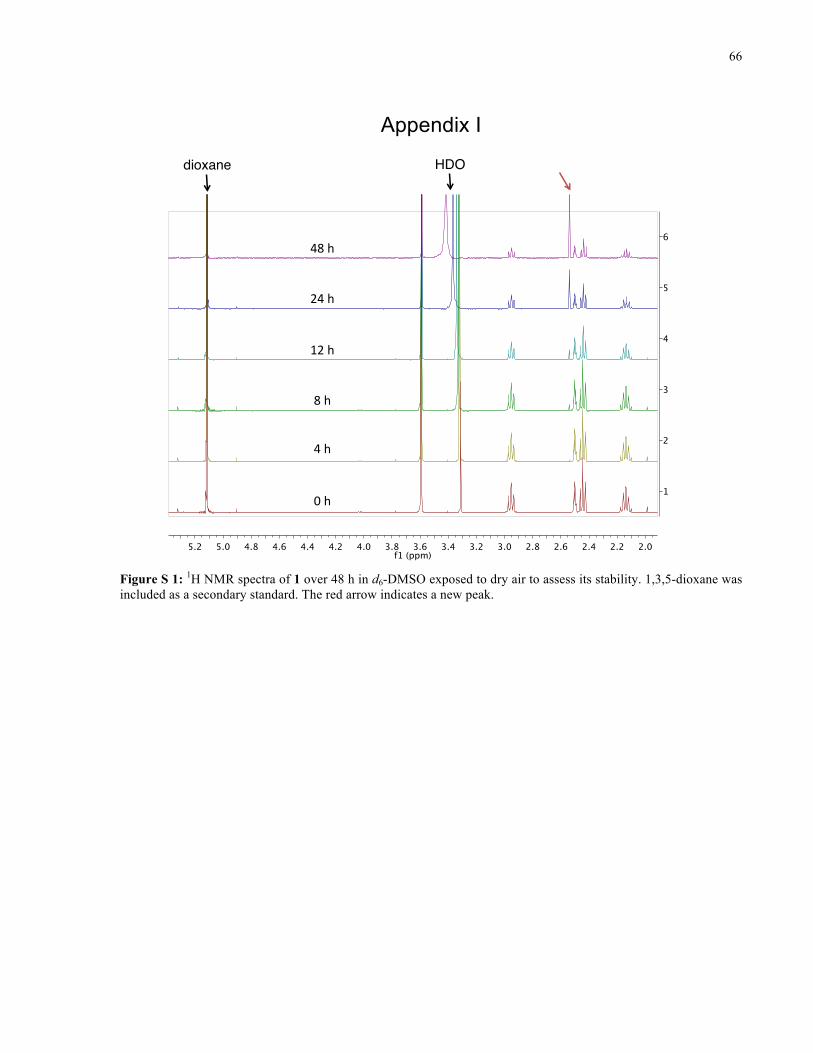
66
Appendix I
����������������������������������������������������� ��
�
�
�
�
�
0"h"
4"h"
8"h"
12"h"
24"h"
48"h"
dioxane! HDO!
Figure S 1: 1H NMR spectra of 1 over 48 h in d6-DMSO exposed to dry air to assess its stability. 1,3,5-dioxane was included as a secondary standard. The red arrow indicates a new peak.
67
0 h!
4 h!
8 h!
12 h!
24 h!
dioxane! HDO!
Figure S 2: 1H NMR spectra of 2 over 24 h in d6-DMSO exposed to dry air to assess its stability. 1,3,5-dioxane was included as a secondary standard. The red arrow indicates a new peak.
0 h!
4 h!
8 h!
12 h!
24 h!
TFA!
Figure S 3: 1F NMR spectra of 2 over 24 h in deuterated PBS to assess its stability. TFA was used as a standard.
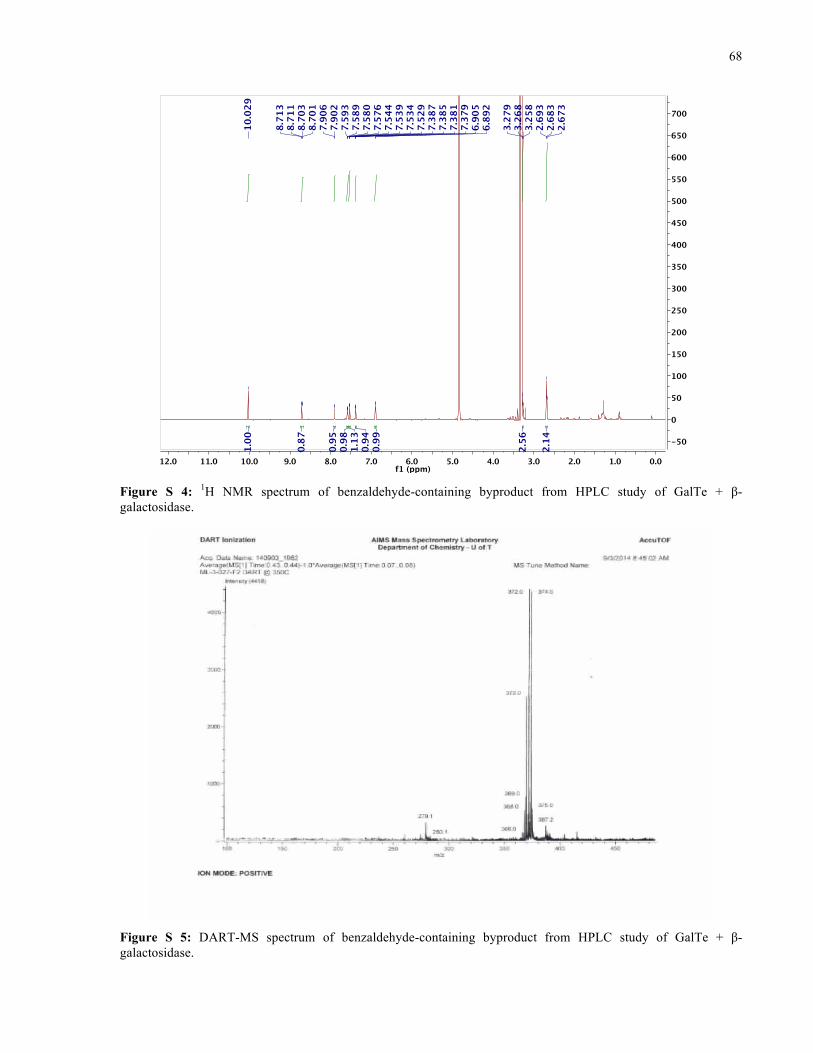
68
Figure S 4: 1H NMR spectrum of benzaldehyde-containing byproduct from HPLC study of GalTe + β-galactosidase.
Figure S 5: DART-MS spectrum of benzaldehyde-containing byproduct from HPLC study of GalTe + β-galactosidase.
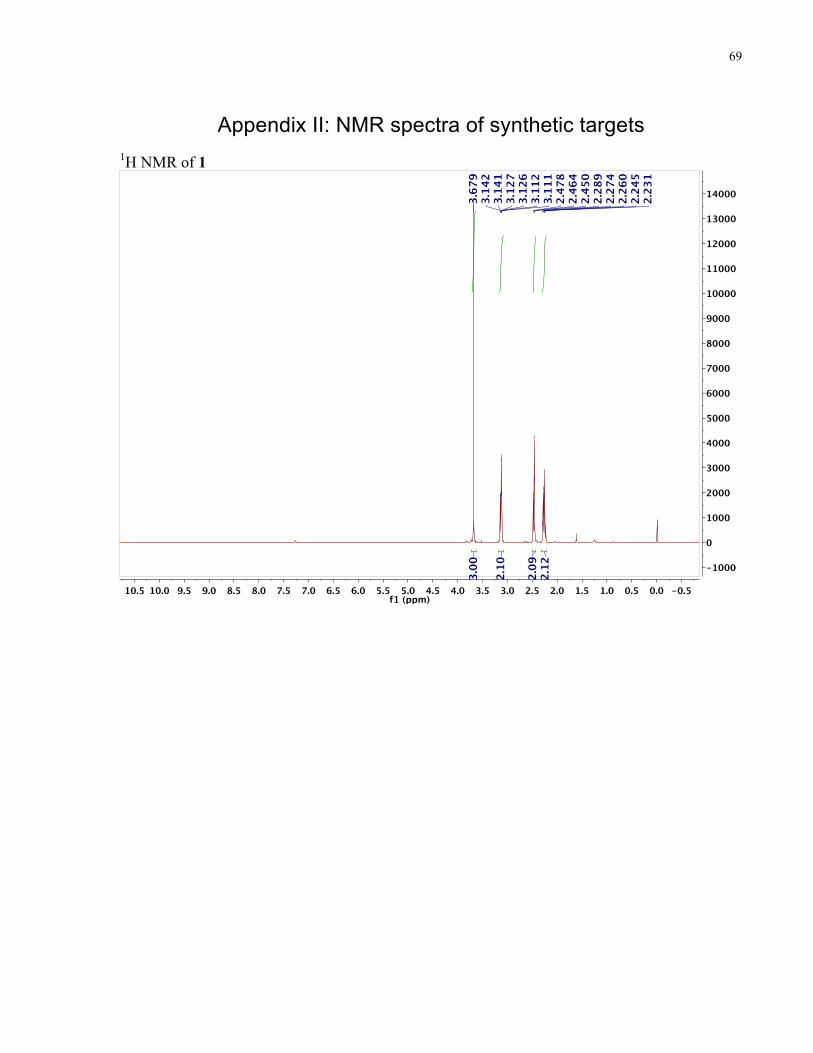
69
Appendix II: NMR spectra of synthetic targets 1H NMR of 1
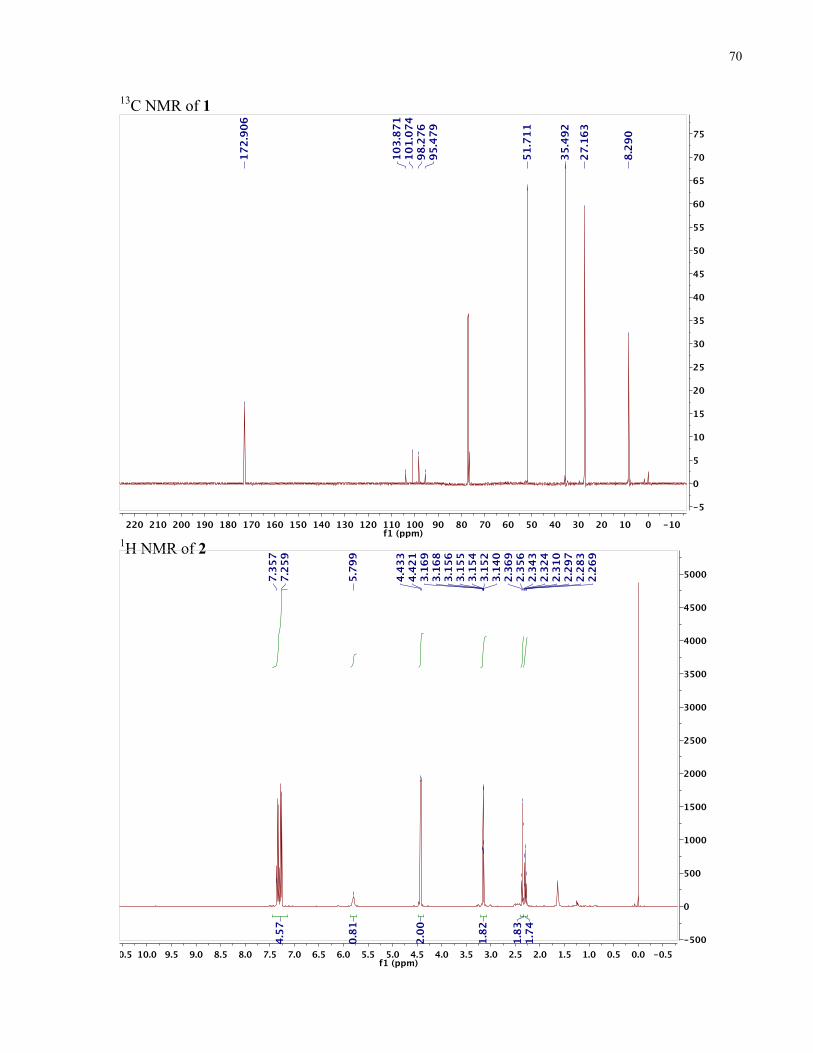
70
13C NMR of 1
1H NMR of 2
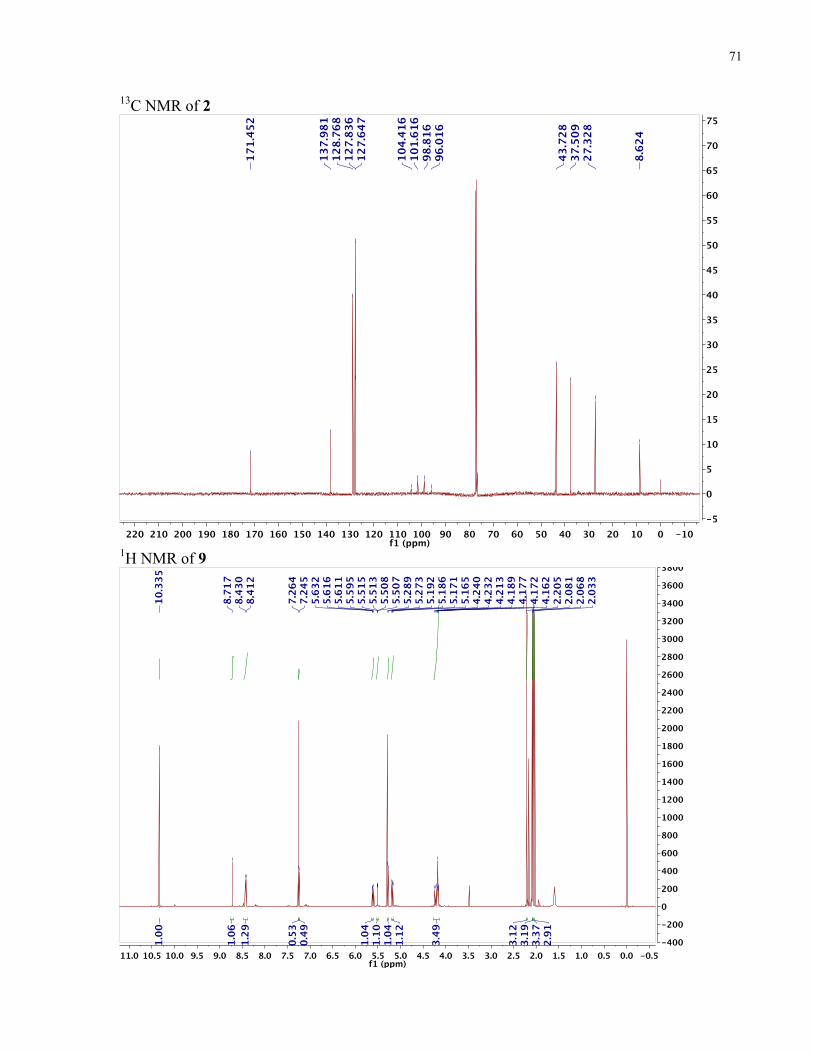
71
13C NMR of 2
1H NMR of 9
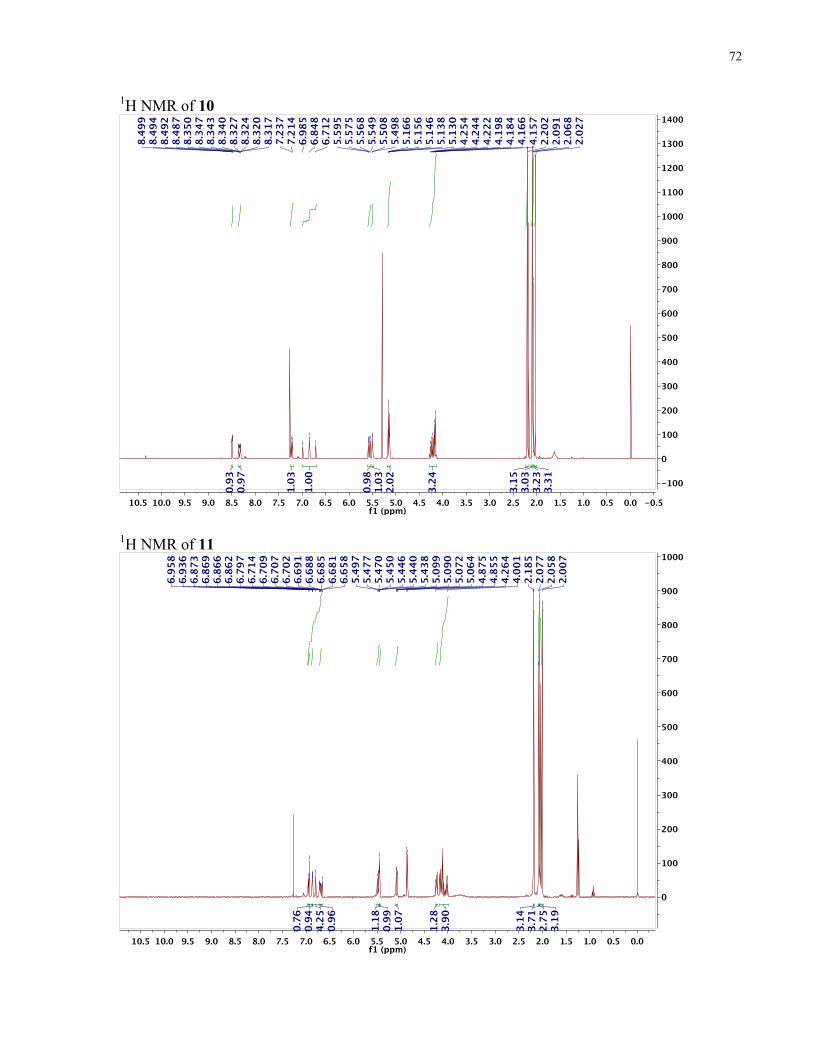
72
1H NMR of 10
1H NMR of 11
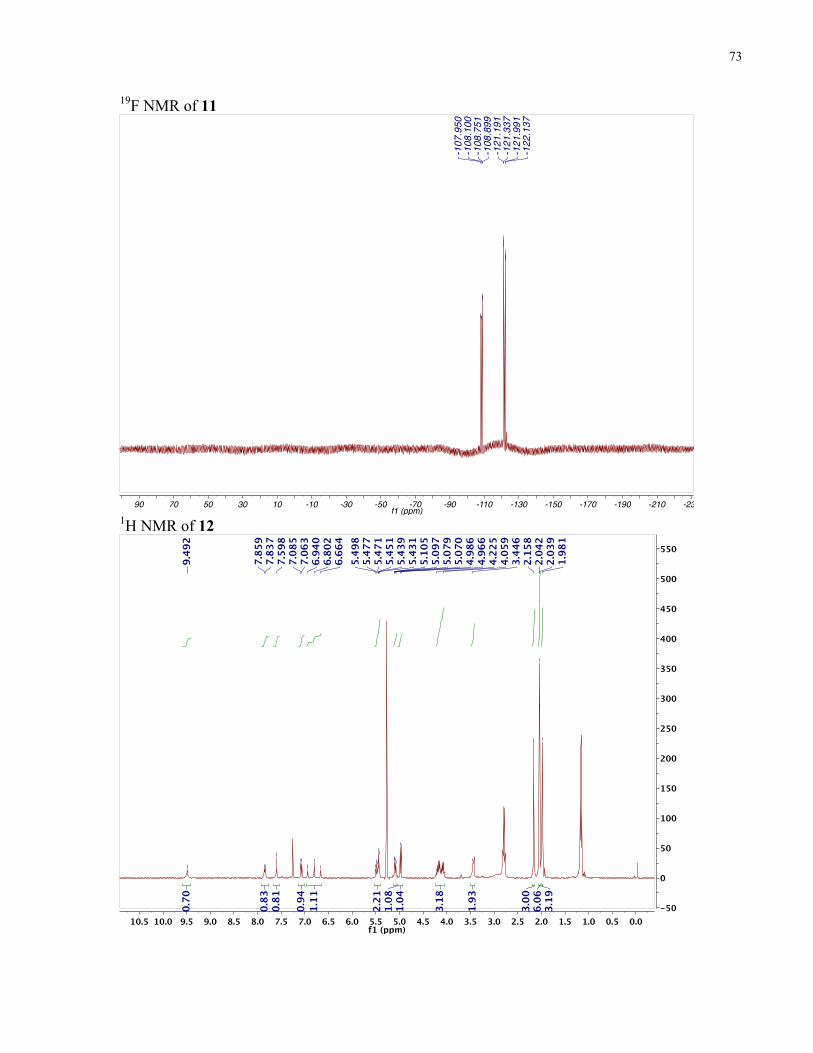
73
19F NMR of 11
1H NMR of 12
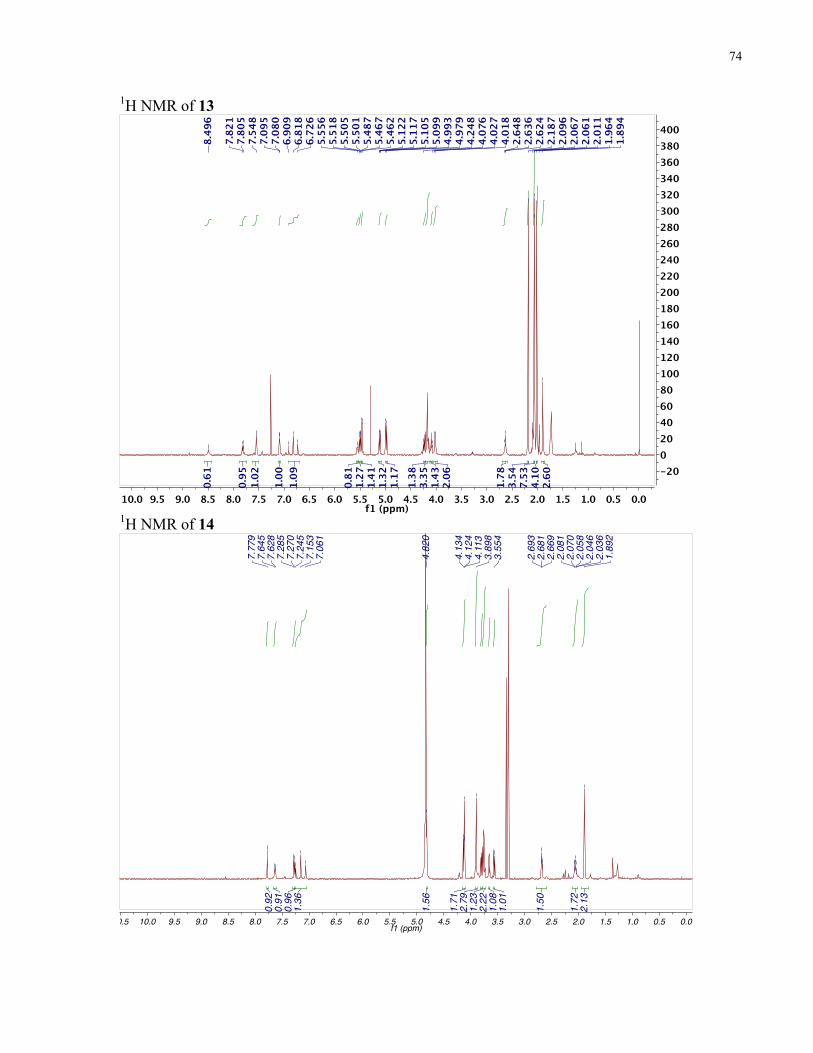
74
1H NMR of 13
1H NMR of 14
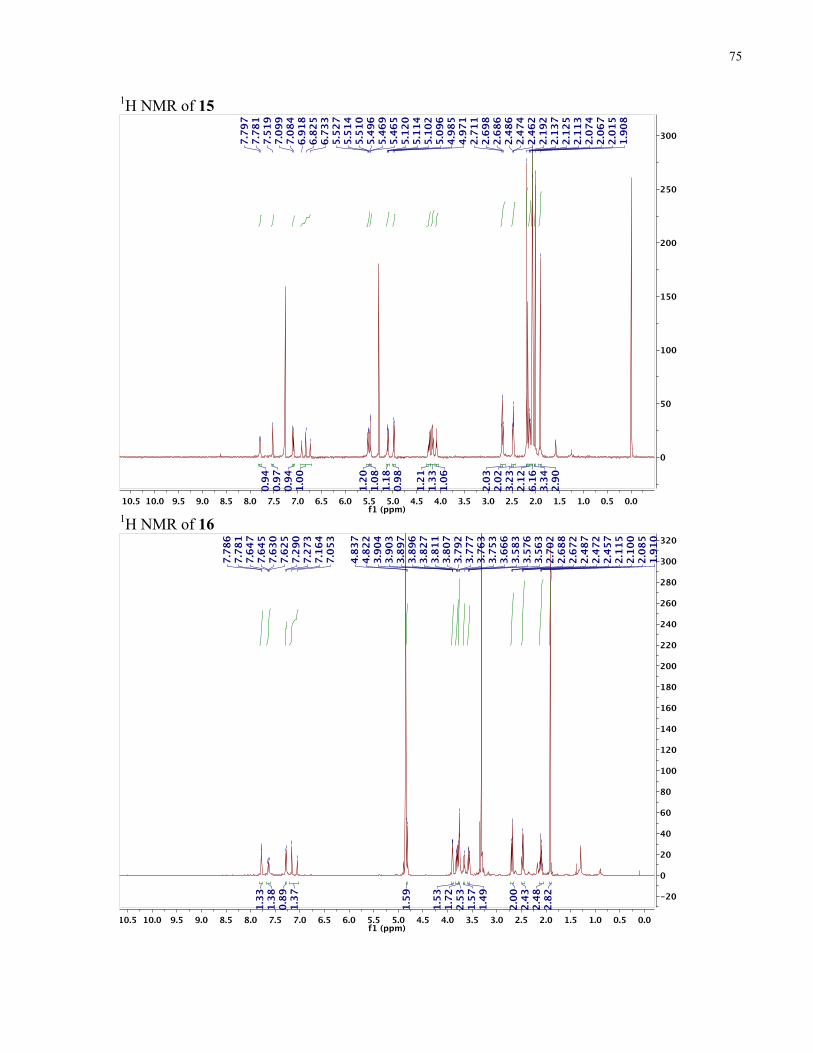
75
1H NMR of 15
1H NMR of 16
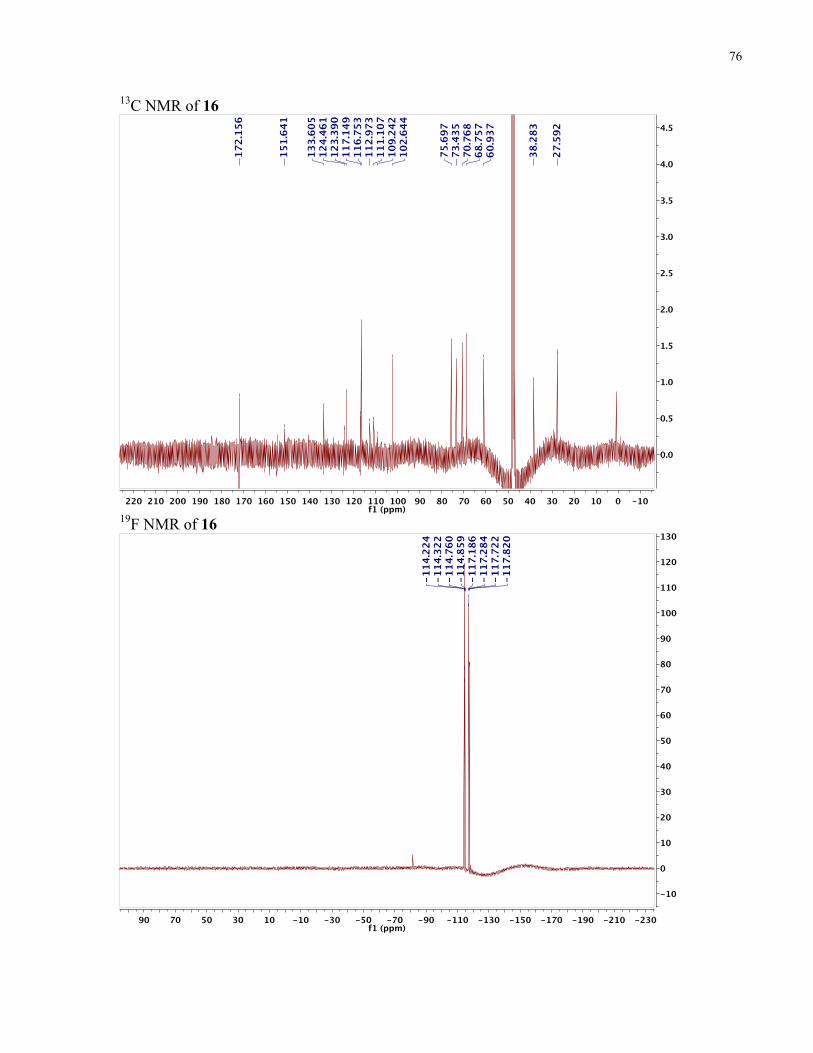
76
13C NMR of 16
19F NMR of 16
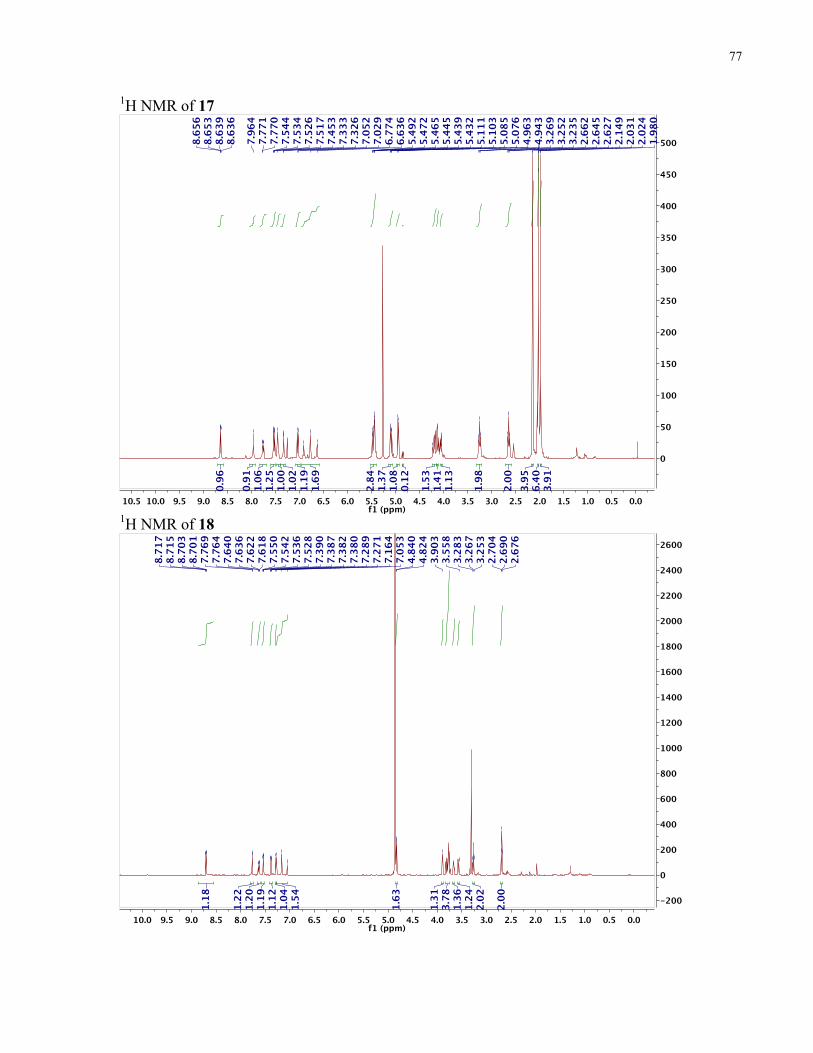
77
1H NMR of 17
1H NMR of 18
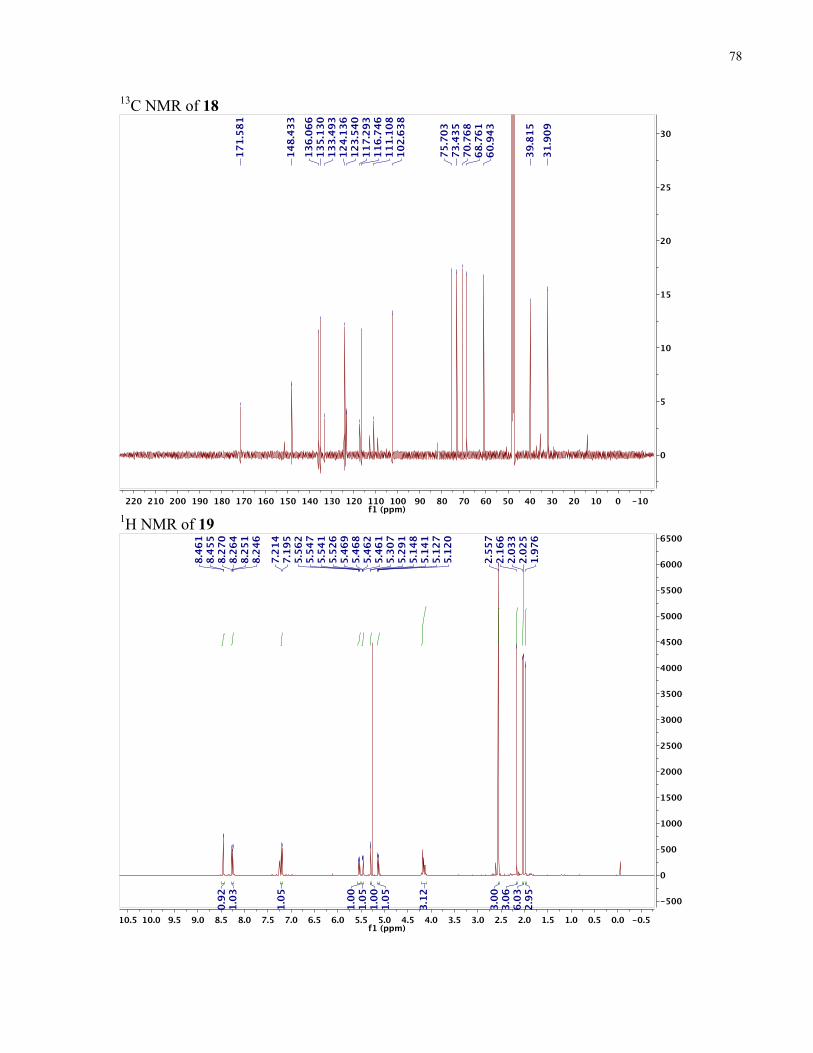
78
13C NMR of 18
1H NMR of 19
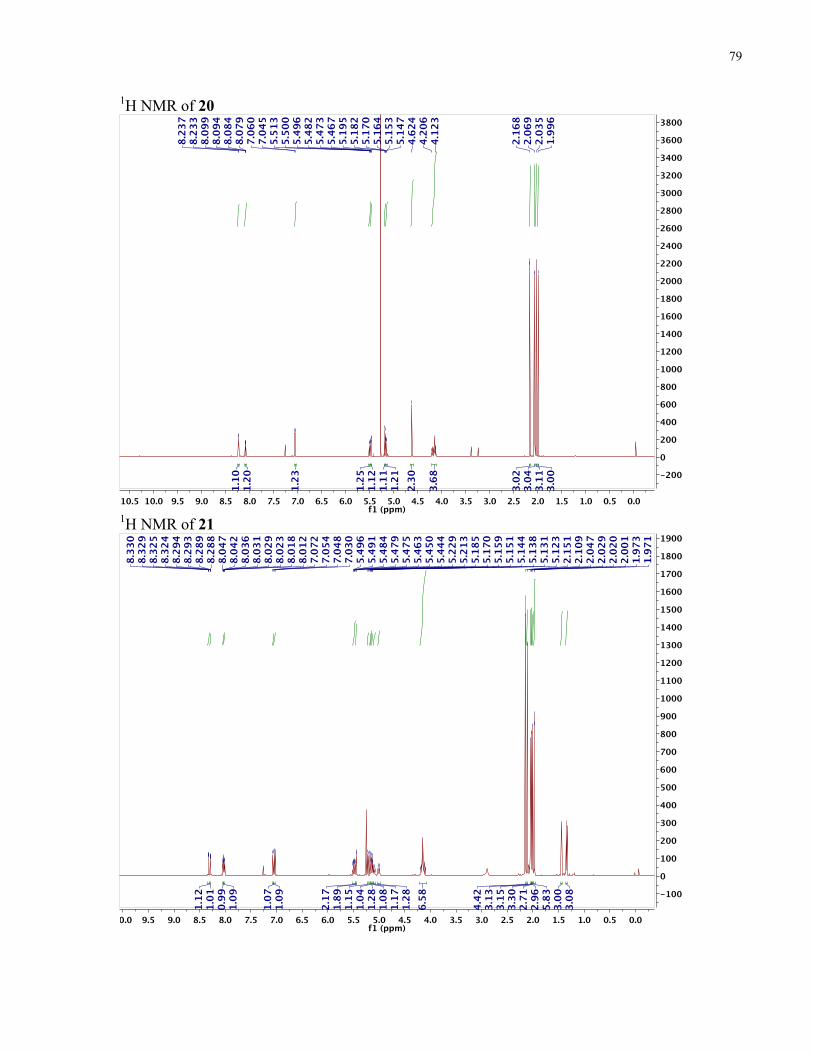
79
1H NMR of 20
1H NMR of 21
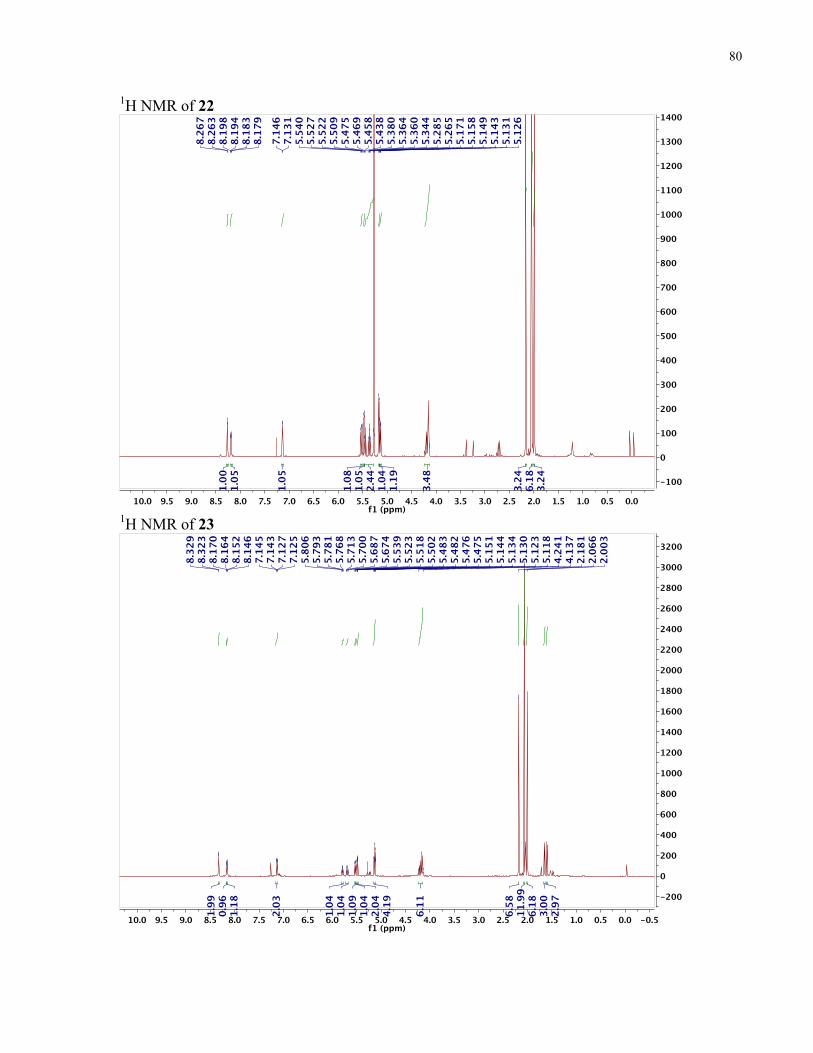
80
1H NMR of 22
1H NMR of 23
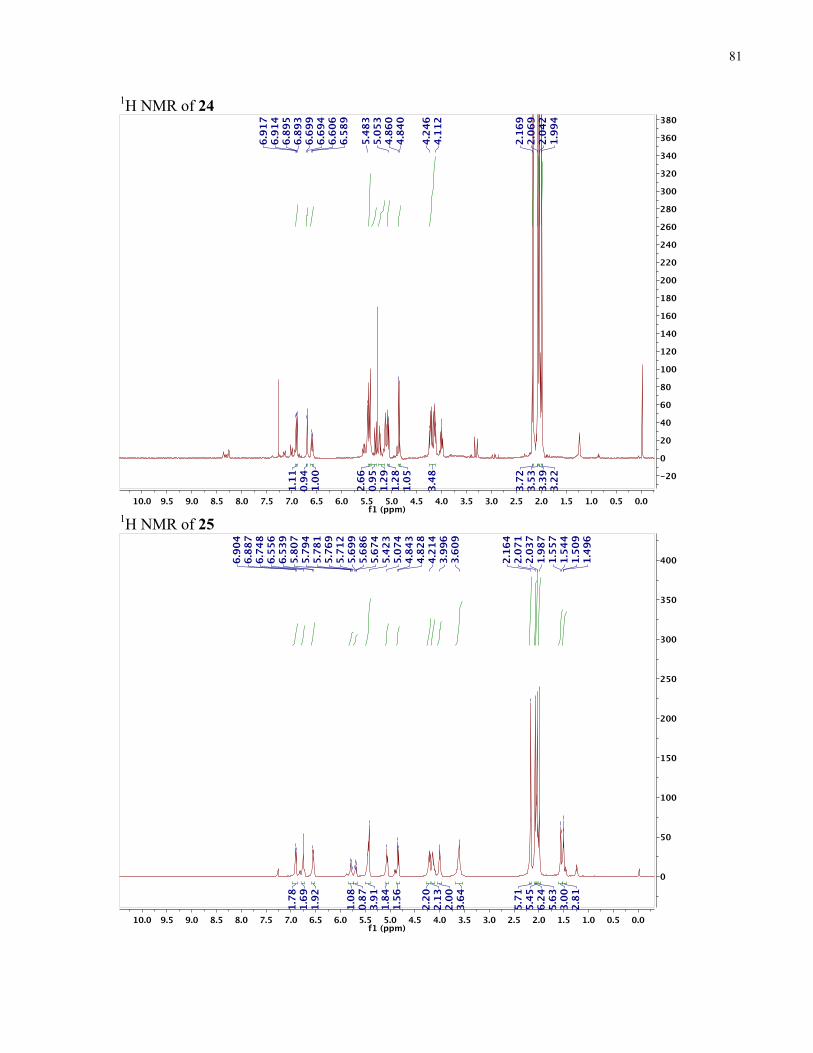
81
1H NMR of 24
1H NMR of 25
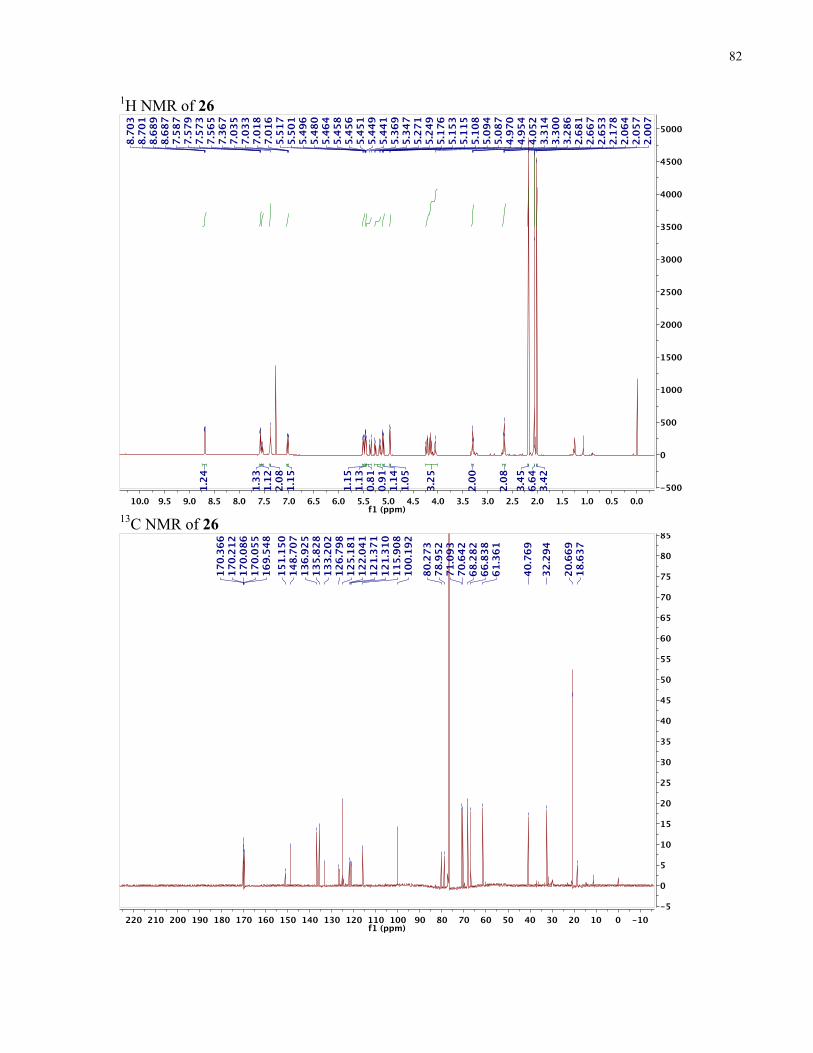
82
1H NMR of 26
13C NMR of 26
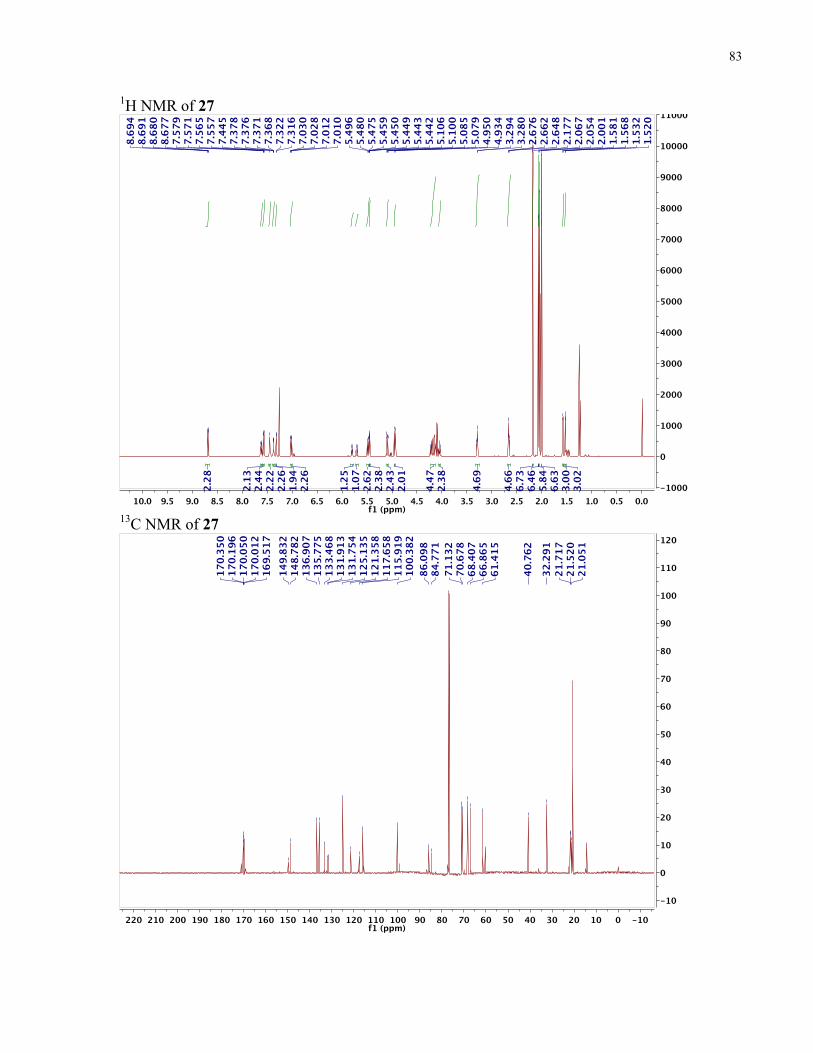
83
1H NMR of 27
13C NMR of 27
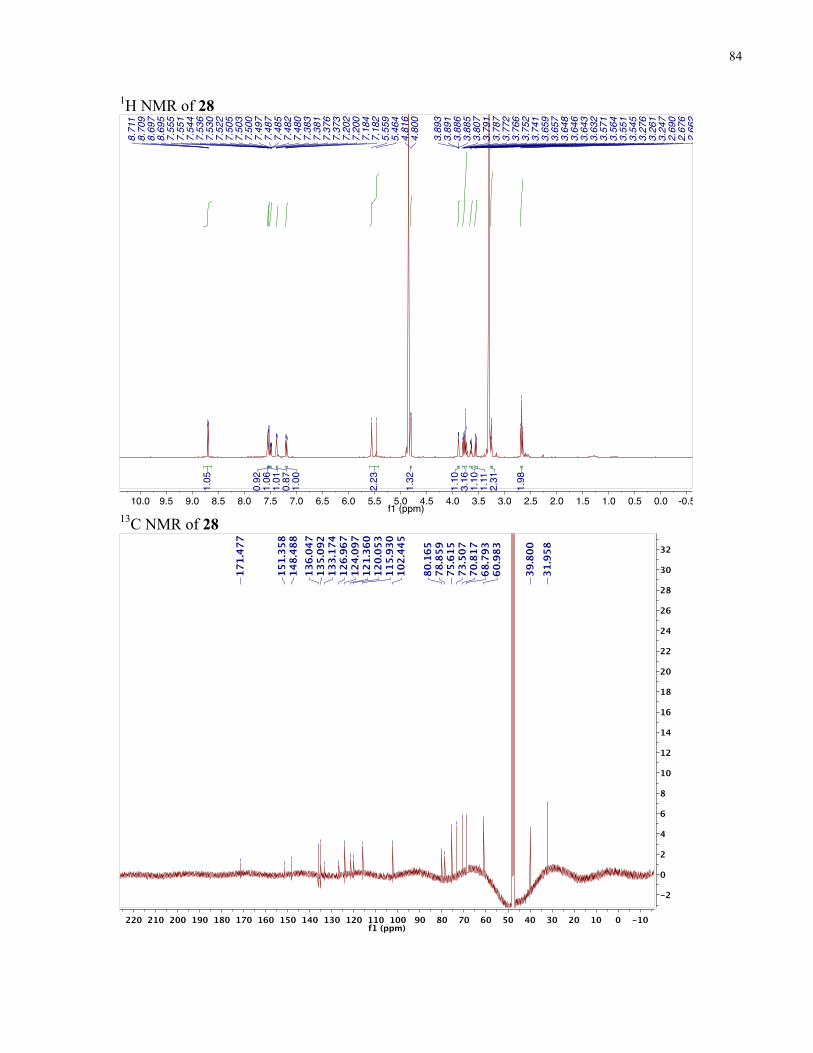
84
1H NMR of 28
13C NMR of 28
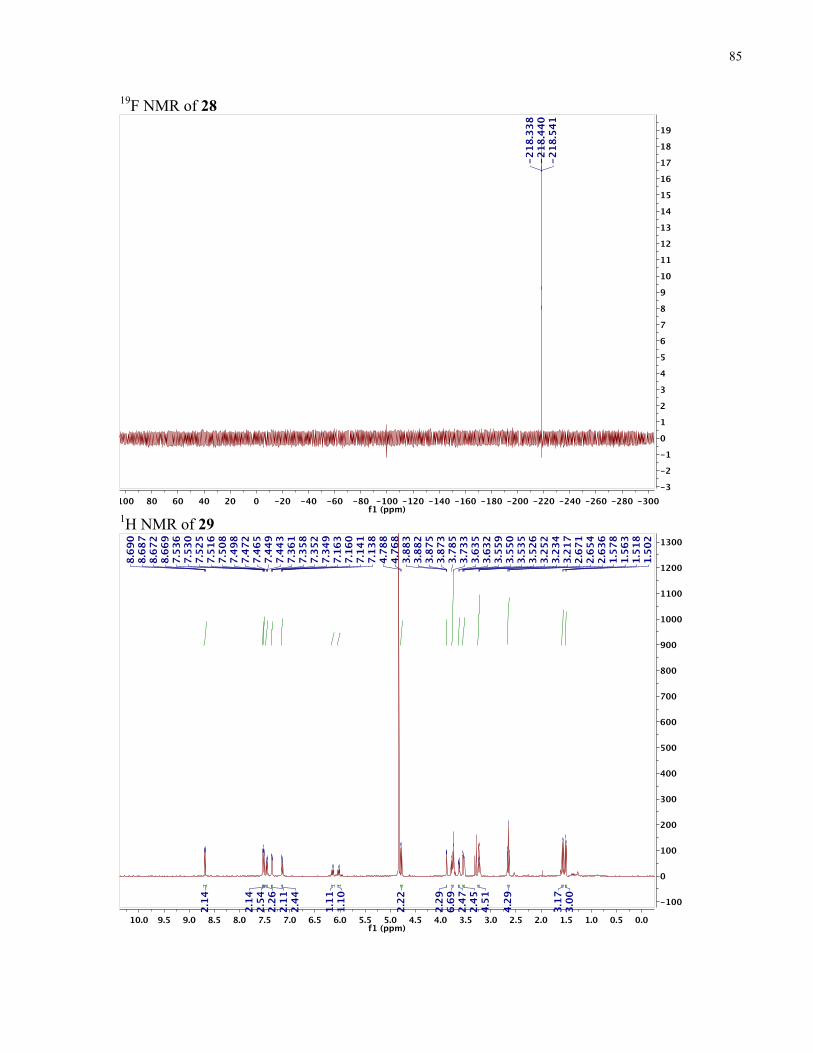
85
19F NMR of 28
1H NMR of 29
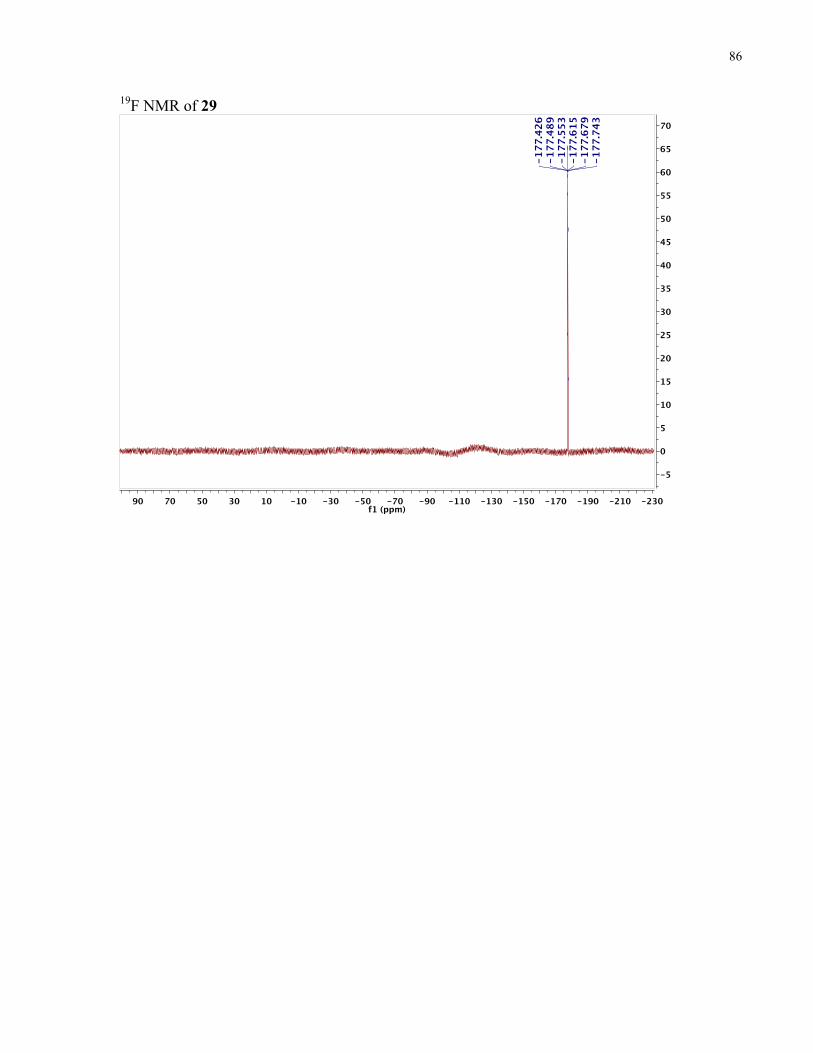
86
19F NMR of 29
87
References
(1) Galbraith, D. Methods 2012, 57, 249–250.
(2) Brown, M.; Wittwer, C. Clin. Chem. 2000, 8, 1221–1229.
(3) De Rosa, S. C.; Herzenberg, L. A.; Roederer, M. Nat. Med. 2001, 7, 245–248.
(4) Gattinoni, L.; Lugli, E.; Ji, Y.; Pos, Z.; Paulos, C. M.; Quigley, M. F.; Almeida, J. R.;
Gostick, E.; Yu, Z.; Carpenito, C.; Wang, E.; Douek, D. C.; Price, D. A.; June, C. H.;
Marincola, F. M.; Roederer, M.; Restifo, N. P. Nat. Med. 2011, 17, 1290–1297.
(5) Krutzik, P. O.; Nolan, G. P. Nat. Methods 2006, 3, 361–368.
(6) Craig, F. E.; Foon, K. A. Flow cytometric immunophenotyping for hematologic
neoplasms. Blood 2008, 111, 3941–3967.
(7) Chattopadhyay, P. K.; Roederer, M. Methods 2012, 57, 251–258.
(8) Chattopadhyay, P. K.; Price, D. a; Harper, T. F.; Betts, M. R.; Yu, J.; Gostick, E.; Perfetto,
S. P.; Goepfert, P.; Koup, R. a; De Rosa, S. C.; Bruchez, M. P.; Roederer, M. Nat. Med.
2006, 12, 972–977.
(9) Bendall, S. C.; Nolan, G. P.; Roederer, M.; Chattopadhyay, P. K. Trends Immunol. 2012,
33, 323–332.
(10) Bjornson, Z. B.; Nolan, G. P.; Fantl, W. J. Curr. Opin. Immunol. 2013, 25, 484–494.
(11) Lou, X.; Zhang, G.; Herrera, I.; Kinach, R.; Ornatsky, O.; Baranov, V.; Nitz, M.; Winnik,
M. A. Angew. Chem. Int. Ed. Engl. 2007, 46, 6111–6114.
(12) Majonis, D.; Herrera, I.; Ornatsky, O.; Schulze, M.; Lou, X.; Soleimani, M.; Nitz, M.;
Winnik, M. A. Anal. Chem. 2010, 82, 8961–8969.
(13) Tanner, S. D.; Bandura, D. R.; Ornatsky, O.; Baranov, V. I.; Nitz, M.; Winnik, M. a. Pure
Appl. Chem. 2008, 80, 2627–2641.
88
(14) Bendall, S. C.; Simonds, E. F.; Qiu, P.; Amir, E. D.; Krutzik, P. O.; Finck, R.; Bruggner,
R. V; Melamed, R.; Trejo, A.; Ornatsky, O. I.; Balderas, R. S.; Plevritis, S. K.; Sachs, K.;
Pe’er, D.; Tanner, S. D.; Nolan, G. P. Science 2011, 332, 687–696.
(15) Heal, W. P.; Dang, T. H. T.; Tate, E. W. Chem. Soc. Rev. 2011, 40, 246–257.
(16) Barglow, K. T.; Cravatt, B. F. Nat. Methods 2007, 4, 822–827.
(17) Edgar, L. J.; Vellanki, R. N.; Halupa, A.; Hedley, D.; Wouters, B. G.; Nitz, M. Angew.
Chem. Int. Ed. Engl. 2014, 53, 11473–11477.
(18) Dewhirst, M. W.; Cao, Y.; Moeller, B. Nat. Rev. Cancer 2008, 8, 425–437.
(19) Brown, J. M.; Wilson, W. R. Nat. Rev. Cancer 2004, 4, 437–447.
(20) Tyrra, W.; Kirij, N. V.; Naumann, D.; Yagupolskii, Y. L. J. Fluor. Chem. 2004, 125,
1437–1440.
(21) Tyrra, W.; Naumann, D.; Kremer, S.; Hermle, J.; Treutlein, V.; Pantenburg, I.; Fischer, H.
T. M.; Scherer, H. Z. Anorg. Allg. Chem. 2012, 638, 580–588.
(22) Sun, H.; DiMagno, S. G. J. Am. Chem. Soc. 2005, 127, 2050–2051.
(23) Roche. Cell Prolif. 2007, 1–4.
(24) Hayflick, L. Exp. Cell Res. 1965, 37, 614–636.
(25) Campisi, J.; d’Adda di Fagagna, F. Nat. Rev. Mol. Cell Biol. 2007, 8, 729–740.
(26) Rodier, F.; Campisi, J. J. Cell Biol. 2011, 192, 547–556.
(27) Harley, C. B.; Futcher, A. B.; Greider, C. W. Nature 1990, 345, 458–460.
(28) Blasco, M. A. Nat. Rev. Genet. 2005, 6, 611–622.
(29) Allsopp, R. C.; Harley, C. B. Exp. Cell Res. 1995, 219, 130–136.
(30) d’Adda di Fagagna, F.; Reaper, P. M.; Clay-Farrace, L.; Fiegler, H.; Carr, P.; Von
Zglinicki, T.; Saretzki, G.; Carter, N. P.; Jackson, S. P. Nature 2003, 426, 194–198.
89
(31) Herbig, U.; Jobling, W. A.; Chen, B. P. C.; Chen, D. J.; Sedivy, J. M. Mol. Cell 2004, 14,
501–513.
(32) Chen, Q. M.; Prowse, K. R.; Tu, V. C.; Purdom, S.; Linskens, M. H. Exp. Cell Res. 2001,
265, 294–303.
(33) Roninson, I. B. Cancer Research, 2003, 63, 2705–2715.
(34) Bartkova, J.; Rezaei, N.; Liontos, M.; Karakaidos, P.; Kletsas, D.; Issaeva, N.; Vassiliou,
L.-V. F.; Kolettas, E.; Niforou, K.; Zoumpourlis, V. C.; Takaoka, M.; Nakagawa, H.; Tort,
F.; Fugger, K.; Johansson, F.; Sehested, M.; Andersen, C. L.; Dyrskjot, L.; Ørntoft, T.;
Lukas, J.; Kittas, C.; Helleday, T.; Halazonetis, T. D.; Bartek, J.; Gorgoulis, V. G. Nature
2006, 444, 633–637.
(35) Chen, Z.; Trotman, L. C.; Shaffer, D.; Lin, H.-K.; Dotan, Z. A.; Niki, M.; Koutcher, J. A.;
Scher, H. I.; Ludwig, T.; Gerald, W.; Cordon-Cardo, C.; Pandolfi, P. P. Nature 2005, 436,
725–730.
(36) Matsumura, T.; Zerrudo, Z.; Hayflick, L. J. Gerontol. 1979, 34, 328–334.
(37) Sherwood, S.; Rush, D.; Ellsworth, J. L.; Schimke, R. T. Proc. Natl. Acad. Sci. U.S.A.
1988, 85, 9086–9090.
(38) Dimri, G.; Lee, X.; Basile, G. Proc. Natl. Acad. Sci. U.S.A. 1995, 92, 9363–9367.
(39) Lee, B. Y.; Han, J. a; Im, J. S.; Morrone, A.; Johung, K.; Goodwin, E. C.; Kleijer, W. J.;
DiMaio, D.; Hwang, E. S. Aging Cell 2006, 5, 187–195.
(40) Debacq-Chainiaux, F.; Erusalimsky, J. D.; Campisi, J.; Toussaint, O. Nat. Protoc. 2009, 4,
1798–1806.
(41) Shlush, L. I.; Itzkovitz, S.; Cohen, A.; Rutenberg, A.; Berkovitz, R.; Yehezkel, S.; Shahar,
H.; Selig, S.; Skorecki, K. BMC Cell Biol. 2011, 12, 16.
(42) Noppe, G.; Dekker, P.; de Koning-Treurniet, C.; Blom, J.; van Heemst, D.; Dirks, R. W.;
Tanke, H. J.; Westendorp, R. G. J.; Maier, A. B. Cytometry. A 2009, 75, 910–916.
90
(43) Rempel, B. P.; Withers, S. G. Glycobiology 2008, 18, 570–586.
(44) Kwan, D. H.; Chen, H. M.; Ratananikom, K.; Hancock, S. M.; Watanabe, Y.; Kongsaeree,
P. T.; Samuels, A. L.; Withers, S. G. Angew. Chem. Int. Ed. Engl. 2011, 50, 300–303.
(45) Chang, Y. T.; Cheng, C. M.; Su, Y. Z.; Lee, W. T.; Hsu, J. S.; Liu, G. C.; Cheng, T. L.;
Wang, Y. M. Bioconjug. Chem. 2007, 18, 1716–1727.
(46) Kurogochi, M.; Nishimura, S.-I.; Lee, Y. C. J. Biol. Chem. 2004, 279 , 44704–44712.
(47) Ichikawa, M.; Ichikawa, Y. 2001, 11, 1769–1773.
(48) Yu, A. L.; Fuchshofer, R.; Kook, D.; Kampik, A.; Bloemendal, H.; Welge-Lüssen, U.
Invest. Ophthalmol. Vis. Sci. 2009, 50, 926–935.
(49) Albanese, A.; Tsoi, K. M.; Chan, W. C. W. J. Lab. Autom. 2013, 18, 99–104.
(50) Ahmed, V.; Liu, Y.; Taylor, S. D. Chembiochem 2009, 10, 1457–1461.
(51) Wang, Q.; Dechert, U.; Jirik, F.; Withers, S. G. Biochem. Biophys. Res. Commun. 1994,
200, 577–583.
(52) Ornatsky, O. I.; Lou, X.; Nitz, M.; Schäfer, S.; Sheldrick, W. S.; Baranov, V. I.; Bandura,
D. R.; Tanner, S. D. Anal. Chem. 2008, 80, 2539–2547.