Development and application of molecular biomarkers for ... · the complement system, Nf-κB...
20
Submitted 15 June 2015 Accepted 13 October 2015 Published 3 November 2015 Corresponding author Michael Morgan, [email protected] Academic editor M´ onica Medina Additional Information and Declarations can be found on page 15 DOI 10.7717/peerj.1371 Copyright 2015 Morgan et al. Distributed under Creative Commons CC-BY 4.0 OPEN ACCESS Development and application of molecular biomarkers for characterizing Caribbean Yellow Band Disease in Orbicella faveolata Michael Morgan 1 , Kylia Goodner 2 , James Ross 1 , Angela Z. Poole 3 , Elizabeth Stepp 4 , Christopher H. Stuart 5 , Cydney Wilbanks 1 and Ernesto Weil 6 1 Department of Biology, Berry College, Mount Berry, GA, United States 2 Department of Genetics, Yale University, New Haven, CT, United States 3 Department of Biology, Western Oregon University, Monmouth, OR, United States 4 The Medical College of Georgia, Georgia Regents University, Augusta, GA, United States 5 Department of Molecular Medicine, Wake Forest School of Medicine, Winston-Salem, NC, United States 6 Department of Marine Sciences, University of Puerto Rico, Lajas, Puerto Rico, United States ABSTRACT Molecular stress responses associated with coral diseases represent an under-studied area of cnidarian transcriptome investigations. Caribbean Yellow Band Disease (CYBD) is considered a disease of Symbiodinium within the tissues of the coral host Orbicella faveolata. There is a paucity of diagnostic tools to assist in the early detection and characterization of coral diseases. The validity of a diagnostic test is determined by its ability to distinguish host organisms that have the disease from those that do not. The ability to detect and identify disease-affected tissue before visible signs of the disease are evident would then be a useful diagnostic tool for monitoring and managing disease outbreaks. Representational Difference Analysis (RDA) was utilized to isolate differentially expressed genes in O. faveolata exhibiting CYBD. Preliminary screening of RDA products identified a small number of genes of interest (GOI) which included an early growth response factor and ubiquitin ligase from the coral host as well as cytochrome oxidase from the algal symbiont. To further characterize the specificity of response, quantitative real-time PCR (qPCR) was utilized to compare the expression profiles of these GOIs within diseased tissues (visible lesions), tissues that precede visible lesions by 2–4 cm (transition area), and tissues from healthy-looking colonies with no signs of disease. Results show there are distinctive differences in the expression profiles of these three GOIs within each tissue examined. Collectively, this small suite of GOIs can provide a molecular “finger print” which is capable of differentiating between infected and uninfected colonies on reefs where CYBD is known to occur. Subjects Marine Biology Keywords Differential gene expression, CYBD, RDA, Coral disease, Diagnostic tools, Orbicella faveolata, Symbiodinium, Representational Difference Analysis How to cite this article Morgan et al. (2015), Development and application of molecular biomarkers for characterizing Caribbean Yellow Band Disease in Orbicella faveolata. PeerJ 3:e1371; DOI 10.7717/peerj.1371
-
Upload
truongdien -
Category
Documents
-
view
216 -
download
0
Transcript of Development and application of molecular biomarkers for ... · the complement system, Nf-κB...
Submitted 15 June 2015Accepted 13 October 2015Published 3 November 2015
Corresponding authorMichael Morgan,[email protected]
Academic editorMonica Medina
Additional Information andDeclarations can be found onpage 15
DOI 10.7717/peerj.1371
Copyright2015 Morgan et al.
Distributed underCreative Commons CC-BY 4.0
OPEN ACCESS
Development and application ofmolecular biomarkers for characterizingCaribbean Yellow Band Disease inOrbicella faveolataMichael Morgan1, Kylia Goodner2, James Ross1, Angela Z. Poole3,Elizabeth Stepp4, Christopher H. Stuart5, Cydney Wilbanks1 andErnesto Weil6
1 Department of Biology, Berry College, Mount Berry, GA, United States2 Department of Genetics, Yale University, New Haven, CT, United States3 Department of Biology, Western Oregon University, Monmouth, OR, United States4 The Medical College of Georgia, Georgia Regents University, Augusta, GA, United States5 Department of Molecular Medicine, Wake Forest School of Medicine, Winston-Salem, NC,
United States6 Department of Marine Sciences, University of Puerto Rico, Lajas, Puerto Rico, United States
ABSTRACTMolecular stress responses associated with coral diseases represent an under-studiedarea of cnidarian transcriptome investigations. Caribbean Yellow Band Disease(CYBD) is considered a disease of Symbiodinium within the tissues of the coralhost Orbicella faveolata. There is a paucity of diagnostic tools to assist in the earlydetection and characterization of coral diseases. The validity of a diagnostic test isdetermined by its ability to distinguish host organisms that have the disease fromthose that do not. The ability to detect and identify disease-affected tissue beforevisible signs of the disease are evident would then be a useful diagnostic tool formonitoring and managing disease outbreaks. Representational Difference Analysis(RDA) was utilized to isolate differentially expressed genes in O. faveolata exhibitingCYBD. Preliminary screening of RDA products identified a small number of genesof interest (GOI) which included an early growth response factor and ubiquitinligase from the coral host as well as cytochrome oxidase from the algal symbiont. Tofurther characterize the specificity of response, quantitative real-time PCR (qPCR)was utilized to compare the expression profiles of these GOIs within diseased tissues(visible lesions), tissues that precede visible lesions by 2–4 cm (transition area), andtissues from healthy-looking colonies with no signs of disease. Results show thereare distinctive differences in the expression profiles of these three GOIs within eachtissue examined. Collectively, this small suite of GOIs can provide a molecular “fingerprint” which is capable of differentiating between infected and uninfected colonieson reefs where CYBD is known to occur.
Subjects Marine BiologyKeywords Differential gene expression, CYBD, RDA, Coral disease, Diagnostic tools,Orbicella faveolata, Symbiodinium, Representational Difference Analysis
How to cite this article Morgan et al. (2015), Development and application of molecular biomarkers for characterizing Caribbean YellowBand Disease in Orbicella faveolata. PeerJ 3:e1371; DOI 10.7717/peerj.1371
INTRODUCTIONWorldwide, marine diseases are quickly spreading and creating a large ecological and
economic problem for global marine ecosystems (Harvell et al., 1999; Harvell et al., 2002;
Burge et al., 2014). This problem is particularly important in coral reef ecosystems which
have experienced significant declines and phase shifts to algal dominated communities
over the past 30 years. Correlations are known to exist between increasing sea water
temperatures, extensive and intensive bleaching events, and the prevalence of disease
outbreaks (Bruno et al., 2007; Hoegh-Guldberg et al., 2007; Eakin et al., 2010; Ruiz-Moreno
et al., 2012). Yellow Band Disease is a disease affecting reef-building corals in the Caribbean
and Indo-Pacific regions characterized by a distinct yellow-to-white wide (1–10 cm) band
or halo pattern separating healthy-looking tissue and the algae-colonized, tissue-denuded
skeleton (Fig. 1) of infected colonies (Gil-Agudelo et al., 2004; Weil, 2004) and apparently
by similar pathogens (Cervino et al., 2004a; Cervino et al., 2008). The Caribbean is a
disease hot spot (Weil, 2004) and Caribbean Yellow Band Disease (CYBD) has caused
significant mortalities in some of the major reef-building genera (Orbicella, Montastraea)
in the region since 1997 (Gil-Agudelo et al., 2004; Bruckner & Bruckner, 2006; Bruckner
& Hill, 2009; Weil, Croquer & Urreiztieta, 2009a; Weil & Rogers, 2011). Although no
mode of transmission has been identified (Weil et al., 2008), it has been reported that
CYBD is caused by infection of the zooxanthellae with at least three Vibrio spp. causing
degradation to the symbiotic dinoflagellates of the genus Symbiodinium that reside within
coral gastrodermal cells (Cervino et al., 2004a; Cervino et al., 2004b; Cervino et al., 2008;
Cunning et al., 2008). This relationship forms the basis for the productivity and diversity of
reef ecosystems and therefore understanding how this disease influences the holobiont is
extremely important in mitigating the spread of this disease.
Unlike other coral diseases, during infection with CYBD, Symbiodinium exhibit
compromised cellular integrity, loss of pigmentation and mortality. Algal cells remain
inside the coral endoderm, but as coral tissue loses pigmentation and transitions from
yellow to pale yellow to white, and is similar in appearance to bleached coral, most algal
cells are dead (Cervino et al., 2004a; Cervino et al., 2008). The signs on the coral colonies
are bands or halos of yellow-pale or bleached tissues bordering the dead tissue areas on
one side and fringing healthy-looking tissue on the other (see Fig. 1) (Cervino et al., 2004a;
Gil-Agudelo et al., 2004). Compounding the effects of the disease, rising global water
temperatures allows Vibrio to thrive (Harvell et al., 1999; Harvell et al., 2009). Comparisons
between healthy and diseased corals at slightly elevated water temperature found that while
healthy corals survive, diseased corals had a 60–80% mortality rate within a 96-hour
period (Cervino et al., 2004a; Cervino et al., 2004b). The disease has a systemic effect
significantly reducing fecundity of infected colonies and therefore, fitness of populations
and species reducing the potential for natural recovery (Weil, Croquer & Urreiztieta,
2009a). As worldwide water temperatures continue to rise, conditions favor new infections
and higher virulence of the Vibrio species that cause CYBD (Weil, Croquer & Urreiztieta,
2009a). Therefore it is important to further clarify the transmission and progression
mechanisms in order to manage the disease and protect Caribbean coral ecosystems and
Morgan et al. (2015), PeerJ, DOI 10.7717/peerj.1371 2/20
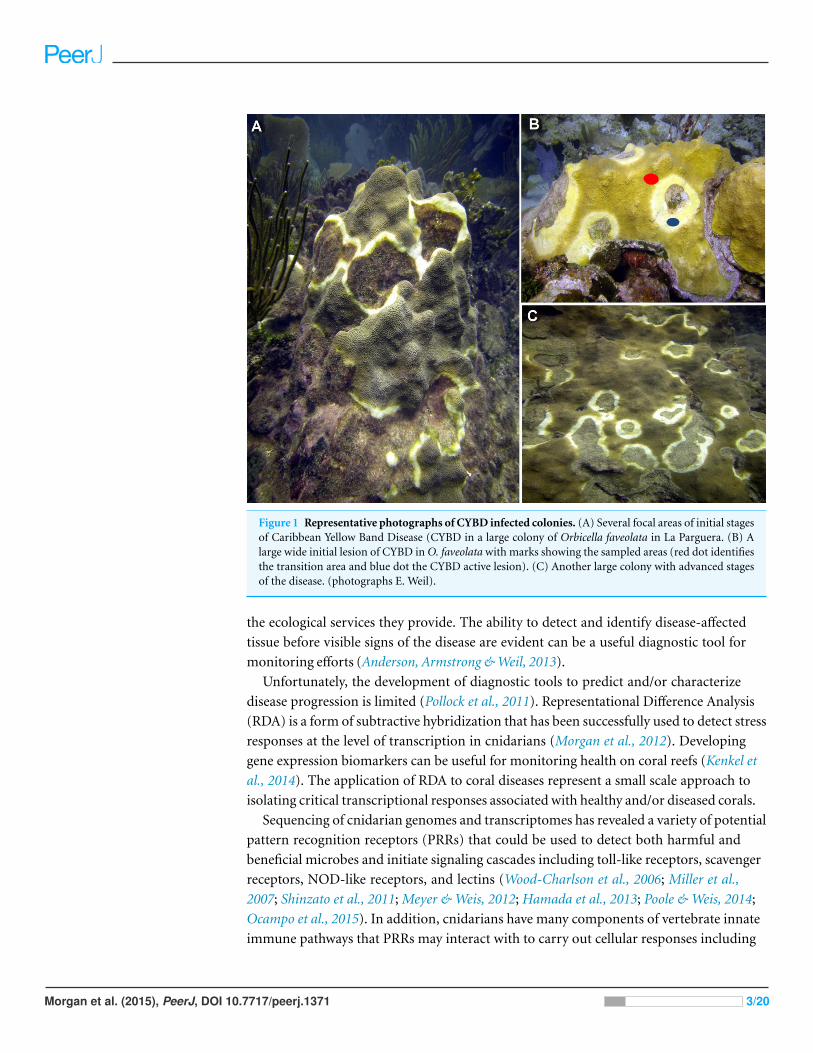
Figure 1 Representative photographs of CYBD infected colonies. (A) Several focal areas of initial stagesof Caribbean Yellow Band Disease (CYBD in a large colony of Orbicella faveolata in La Parguera. (B) Alarge wide initial lesion of CYBD in O. faveolata with marks showing the sampled areas (red dot identifiesthe transition area and blue dot the CYBD active lesion). (C) Another large colony with advanced stagesof the disease. (photographs E. Weil).
the ecological services they provide. The ability to detect and identify disease-affected
tissue before visible signs of the disease are evident can be a useful diagnostic tool for
monitoring efforts (Anderson, Armstrong & Weil, 2013).
Unfortunately, the development of diagnostic tools to predict and/or characterize
disease progression is limited (Pollock et al., 2011). Representational Difference Analysis
(RDA) is a form of subtractive hybridization that has been successfully used to detect stress
responses at the level of transcription in cnidarians (Morgan et al., 2012). Developing
gene expression biomarkers can be useful for monitoring health on coral reefs (Kenkel et
al., 2014). The application of RDA to coral diseases represent a small scale approach to
isolating critical transcriptional responses associated with healthy and/or diseased corals.
Sequencing of cnidarian genomes and transcriptomes has revealed a variety of potential
pattern recognition receptors (PRRs) that could be used to detect both harmful and
beneficial microbes and initiate signaling cascades including toll-like receptors, scavenger
receptors, NOD-like receptors, and lectins (Wood-Charlson et al., 2006; Miller et al.,
2007; Shinzato et al., 2011; Meyer & Weis, 2012; Hamada et al., 2013; Poole & Weis, 2014;
Ocampo et al., 2015). In addition, cnidarians have many components of vertebrate innate
immune pathways that PRRs may interact with to carry out cellular responses including
Morgan et al. (2015), PeerJ, DOI 10.7717/peerj.1371 3/20
the complement system, Nf-κB pathway, production of reactive oxygen species (ROS),
antimicrobial peptides and the prophenoloxidase pathway (Mydlarz et al., 2009; Shinzato
et al., 2011; Vidal-Dupiol et al., 2011; Wolenski et al., 2011; Ocampo et al., 2015). The
involvement of these immune pathways in coral diseases is still not well understood.
Several transcriptomic studies have identified differential expression of immune related
transcripts between healthy and diseased states (Closek et al., 2014; Libro & Kalaziak, 2013;
Vidal-Dupiol et al., 2011) One recent study on CYBD identified significant changes in
the host transcriptome which included downregulation of two antimicrobial peptides
and upregulation of two other immune genes in the diseased state as well as shifts in the
microbial communities in tissues from healthy, diseased, and healthy border regions of
the coral (Closek et al., 2014). From these data it is clear that each coral disease generates
a unique response in the host and therefore characterization of differentially expressed
genes between different stages of disease progression is essential for the development
of diagnostic tools to predict and/or characterize the progression of a given disease.
Characterizing specific responses in both members of the holobiont transcriptome are
important steps in order to better characterize disease progression. The objective of
this study was to identify responsive genes that can be used to better characterize the
development of CYBD in the important reef-building coral Orbicella faveolata.
MATERIALS AND METHODSCoral collectionsCoral samples were collected in Oct 2009 and Oct 2013 from La Parguera, Puerto Rico.
Specimens were collected under the General Collection Permit of the Department of
Marine Sciences, University of Puerto Rico, Mayaguez. Diseased and healthy colonies of
Orbicella faveolata were sampled from depth range of 9 to 12 m. At the time of collection,
all samples were individually labeled, placed in plastic bags, and immediately transported
back to the laboratory where they were placed on a seawater table and immediately
processed. Five colonies with no visible evidence of disease were used as representative
healthy tissue controls. Five other colonies with visible CYBD lesions were sampled
as representative of the diseased condition. In addition, tissues were also sampled in
the transition zone (Weil, Croquer & Urreiztieta, 2009b), 2–4 cm in front of the visible
lesion border on the same five diseased coral colonies. Diseased tissue (visible lesion) was
identified and then separated from colony sample by chisel. Transition tissue was also taken
from the same diseased colony. Transition tissues were sampled approximately 2–4 cm
in front of the advancing visually identified transition/lesion border (see Fig. 1). Healthy
colonies which had no visible signs of CYBD were also collected. After each sample was
isolated, approximately 2 to 3 cm2 of tissue was immersed in 5 mls of Trizol followed by im-
mediate homogenization by vortexing. Total RNA was extracted following Trizol protocol
(Invitrogen, Carlsbad, CA, USA) with the additional use of 2 ml phase-lock gels (5’Prime,
Gaithersburg, MD) to aid in the recovery of the aqueous phase. RNA concentrations were
estimated by absorbance readings at 260 nm (Biophotometer; Eppendorf, Hauppauge,
NY). The integrity of the total RNA was confirmed by electrophoresis of an aliquot of
Morgan et al. (2015), PeerJ, DOI 10.7717/peerj.1371 4/20
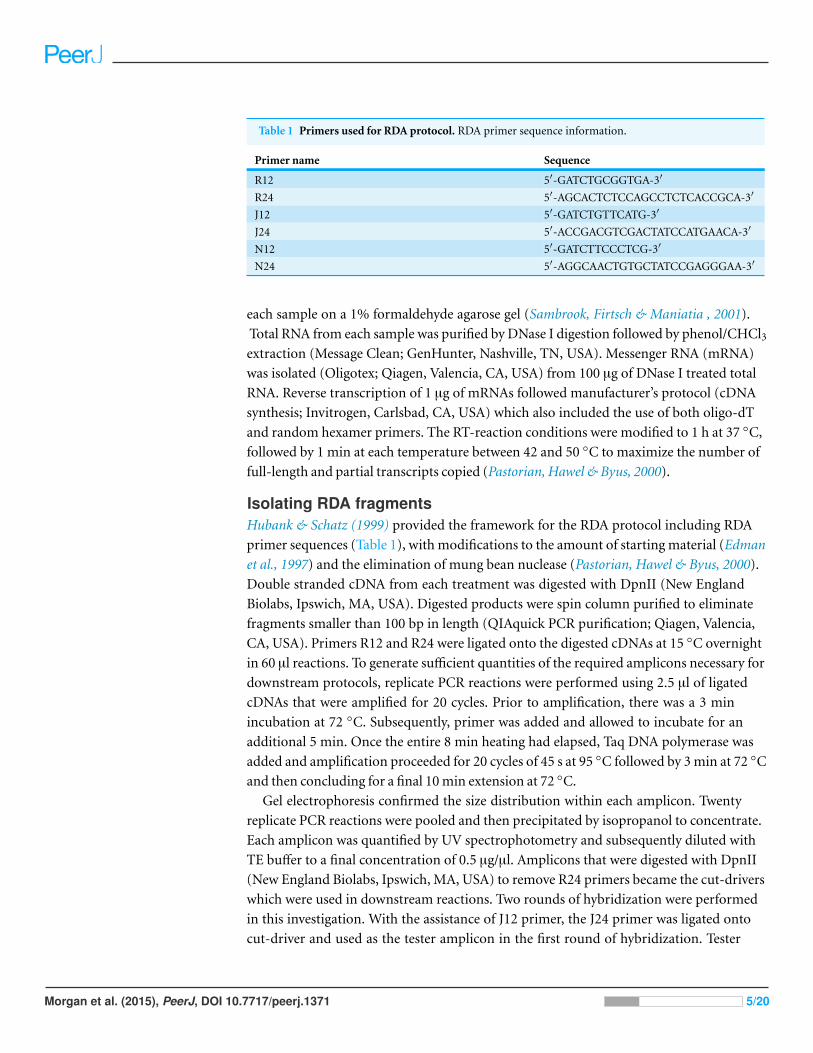
Table 1 Primers used for RDA protocol. RDA primer sequence information.
Primer name Sequence
R12 5′-GATCTGCGGTGA-3′
R24 5′-AGCACTCTCCAGCCTCTCACCGCA-3′
J12 5′-GATCTGTTCATG-3′
J24 5′-ACCGACGTCGACTATCCATGAACA-3′
N12 5′-GATCTTCCCTCG-3′
N24 5′-AGGCAACTGTGCTATCCGAGGGAA-3′
each sample on a 1% formaldehyde agarose gel (Sambrook, Firtsch & Maniatia , 2001).
Total RNA from each sample was purified by DNase I digestion followed by phenol/CHCl3extraction (Message Clean; GenHunter, Nashville, TN, USA). Messenger RNA (mRNA)
was isolated (Oligotex; Qiagen, Valencia, CA, USA) from 100 µg of DNase I treated total
RNA. Reverse transcription of 1 µg of mRNAs followed manufacturer’s protocol (cDNA
synthesis; Invitrogen, Carlsbad, CA, USA) which also included the use of both oligo-dT
and random hexamer primers. The RT-reaction conditions were modified to 1 h at 37 ◦C,
followed by 1 min at each temperature between 42 and 50 ◦C to maximize the number of
full-length and partial transcripts copied (Pastorian, Hawel & Byus, 2000).
Isolating RDA fragmentsHubank & Schatz (1999) provided the framework for the RDA protocol including RDA
primer sequences (Table 1), with modifications to the amount of starting material (Edman
et al., 1997) and the elimination of mung bean nuclease (Pastorian, Hawel & Byus, 2000).
Double stranded cDNA from each treatment was digested with DpnII (New England
Biolabs, Ipswich, MA, USA). Digested products were spin column purified to eliminate
fragments smaller than 100 bp in length (QIAquick PCR purification; Qiagen, Valencia,
CA, USA). Primers R12 and R24 were ligated onto the digested cDNAs at 15 ◦C overnight
in 60 µl reactions. To generate sufficient quantities of the required amplicons necessary for
downstream protocols, replicate PCR reactions were performed using 2.5 µl of ligated
cDNAs that were amplified for 20 cycles. Prior to amplification, there was a 3 min
incubation at 72 ◦C. Subsequently, primer was added and allowed to incubate for an
additional 5 min. Once the entire 8 min heating had elapsed, Taq DNA polymerase was
added and amplification proceeded for 20 cycles of 45 s at 95 ◦C followed by 3 min at 72 ◦C
and then concluding for a final 10 min extension at 72 ◦C.
Gel electrophoresis confirmed the size distribution within each amplicon. Twenty
replicate PCR reactions were pooled and then precipitated by isopropanol to concentrate.
Each amplicon was quantified by UV spectrophotometry and subsequently diluted with
TE buffer to a final concentration of 0.5 µg/µl. Amplicons that were digested with DpnII
(New England Biolabs, Ipswich, MA, USA) to remove R24 primers became the cut-drivers
which were used in downstream reactions. Two rounds of hybridization were performed
in this investigation. With the assistance of J12 primer, the J24 primer was ligated onto
cut-driver and used as the tester amplicon in the first round of hybridization. Tester
Morgan et al. (2015), PeerJ, DOI 10.7717/peerj.1371 5/20
populations in the second round of hybridizations used the N24/N12 primers. Ligation
conditions were always the same throughout the investigation even though the use
of J24/J12 or N24/N12 primers depended on the round of hybridization. The ratio of
tester/driver in round one was 1:100, whereas in round 2 it was 1:800. The first round of
hybridization combined 50 ng of J24-ligated tester to 5 µg of cut-driver. The second round
of subtraction/hybridization combined 6.25 ng of N24-ligated hybridization product from
the first round of hybridization and 5 µg of cut-driver. Each sample population (healthy or
diseased) was used as a tester in one series of hybridizations and as the driver in the other
series of hybridizations. After combining testers and drivers in the desired ratio, pooled
samples were extracted with Phenol/Chloroform/Isoamyl alcohol and then precipitated
in 30 µl of 10 M ammonium acetate and 250 µl ethanol at −70 ◦C for one hour. After
centrifugation at 14,000 rpm for 15 min at 4 ◦C, resulting pellets were washed twice in 70%
ethanol and allowed to air dry. Each pellet was resuspended in 4 µl EEx3 (30 mM EPPS, pH
8.0 at 20 ◦C, 3 mM EDTA) buffer by pipetting repeatedly for 2 min then warmed to 37 ◦C
for 5 min, vortexed, and then briefly centrifuged. Samples were then overlayed with 35 µl
mineral oil and then heated to 95 ◦C for 5 min to denature. Afterwards they were allowed
to cool to 67 ◦C and 1 µl 5M NaCl was added directly into the DNA, and the samples were
incubated overnight at 67 ◦C. After the overnight incubation, mineral oil was removed and
samples were diluted in 95 µl TE. Five microliters of a hybridization product were used in
downstream PCR reactions. The hybridization products were amplified by PCR beginning
with a 3 min incubation at 72 ◦C followed by the addition of Taq DNA polymerase. After
5 additional minutes at 72 ◦C, primer was added (either J24 or N24 primer depending on
which round of hybridization had been performed). Amplification conditions consisted
of 45 s at 95 ◦C followed by 3 min at 70 ◦C (J24) or 72 ◦C (N24) for a total of 27 cycles
and then concluded with a 10 min extension at 72 ◦C. To eliminate the need of mung bean
nuclease, a modified PCR reaction was employed which involved taking a 10 µl aliquot out
of the PCR reaction after 7 cycles and placing it in a new PCR reaction with all reagents
and continuing for an additional 20 cycles (Pastorian, Hawel & Byus, 2000). Amplified
RDA products were cloned (TopoTA, Invitrogen, Carlsbad, CA, USA) and then sequenced
using M13 (forward and reverse) primers (Nevada Genomics Center, University of Reno,
NV, USA). Ninety-five sequences from CYBD infected tissues were cloned and sequenced.
Another 190 sequences were sequenced from RDA products representing healthy tissues.
Sequence analysisA contig assembly program (CAP3) (http://doua.prabi.fr/software/cap3) was used to
determine how many unique sequences were represented within the total number of
cloned RDA products. Sequences were compared against the nr and EST databases at NCBI
(National Center for Biotechnology Information) database (http://www.ncbi.nlm.nih.gov)
using the BLASTX algorithm with default parameters. CAP3 analysis indicated there were
9 contigs and 53 singletons.
Morgan et al. (2015), PeerJ, DOI 10.7717/peerj.1371 6/20
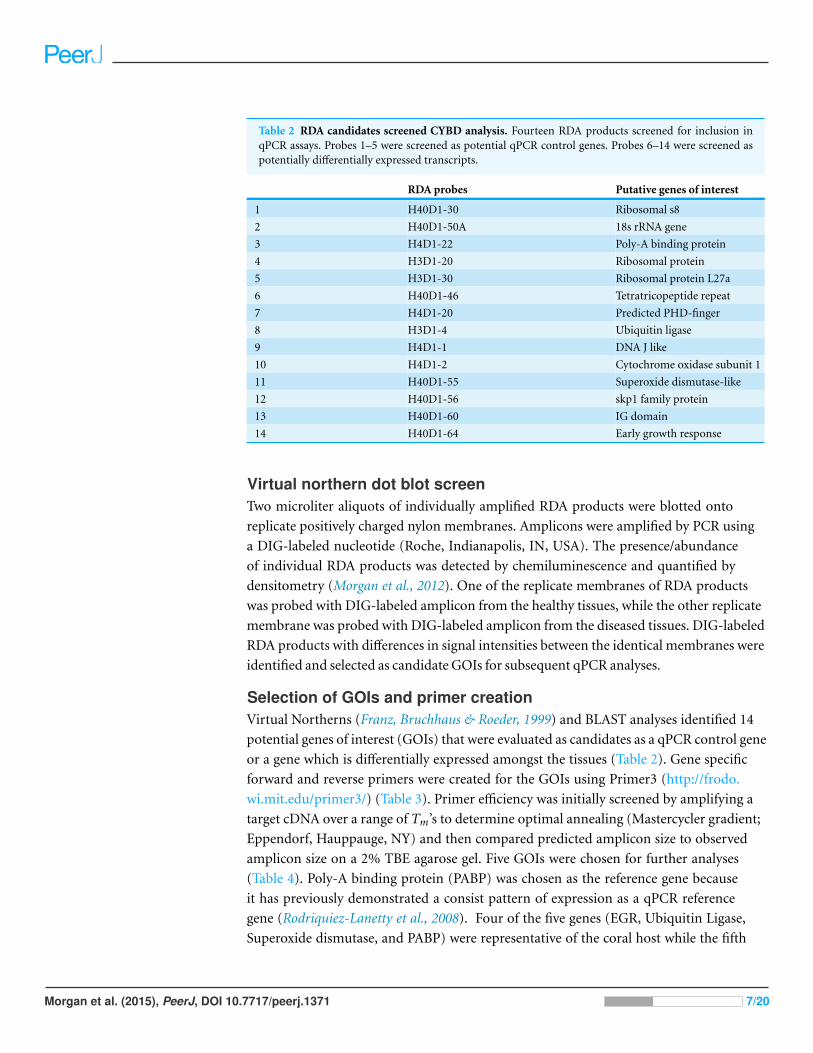
Table 2 RDA candidates screened CYBD analysis. Fourteen RDA products screened for inclusion inqPCR assays. Probes 1–5 were screened as potential qPCR control genes. Probes 6–14 were screened aspotentially differentially expressed transcripts.
RDA probes Putative genes of interest
1 H40D1-30 Ribosomal s8
2 H40D1-50A 18s rRNA gene
3 H4D1-22 Poly-A binding protein
4 H3D1-20 Ribosomal protein
5 H3D1-30 Ribosomal protein L27a
6 H40D1-46 Tetratricopeptide repeat
7 H4D1-20 Predicted PHD-finger
8 H3D1-4 Ubiquitin ligase
9 H4D1-1 DNA J like
10 H4D1-2 Cytochrome oxidase subunit 1
11 H40D1-55 Superoxide dismutase-like
12 H40D1-56 skp1 family protein
13 H40D1-60 IG domain
14 H40D1-64 Early growth response
Virtual northern dot blot screenTwo microliter aliquots of individually amplified RDA products were blotted onto
replicate positively charged nylon membranes. Amplicons were amplified by PCR using
a DIG-labeled nucleotide (Roche, Indianapolis, IN, USA). The presence/abundance
of individual RDA products was detected by chemiluminescence and quantified by
densitometry (Morgan et al., 2012). One of the replicate membranes of RDA products
was probed with DIG-labeled amplicon from the healthy tissues, while the other replicate
membrane was probed with DIG-labeled amplicon from the diseased tissues. DIG-labeled
RDA products with differences in signal intensities between the identical membranes were
identified and selected as candidate GOIs for subsequent qPCR analyses.
Selection of GOIs and primer creationVirtual Northerns (Franz, Bruchhaus & Roeder, 1999) and BLAST analyses identified 14
potential genes of interest (GOIs) that were evaluated as candidates as a qPCR control gene
or a gene which is differentially expressed amongst the tissues (Table 2). Gene specific
forward and reverse primers were created for the GOIs using Primer3 (http://frodo.
wi.mit.edu/primer3/) (Table 3). Primer efficiency was initially screened by amplifying a
target cDNA over a range of Tm’s to determine optimal annealing (Mastercycler gradient;
Eppendorf, Hauppauge, NY) and then compared predicted amplicon size to observed
amplicon size on a 2% TBE agarose gel. Five GOIs were chosen for further analyses
(Table 4). Poly-A binding protein (PABP) was chosen as the reference gene because
it has previously demonstrated a consist pattern of expression as a qPCR reference
gene (Rodriquiez-Lanetty et al., 2008). Four of the five genes (EGR, Ubiquitin Ligase,
Superoxide dismutase, and PABP) were representative of the coral host while the fifth
Morgan et al. (2015), PeerJ, DOI 10.7717/peerj.1371 7/20
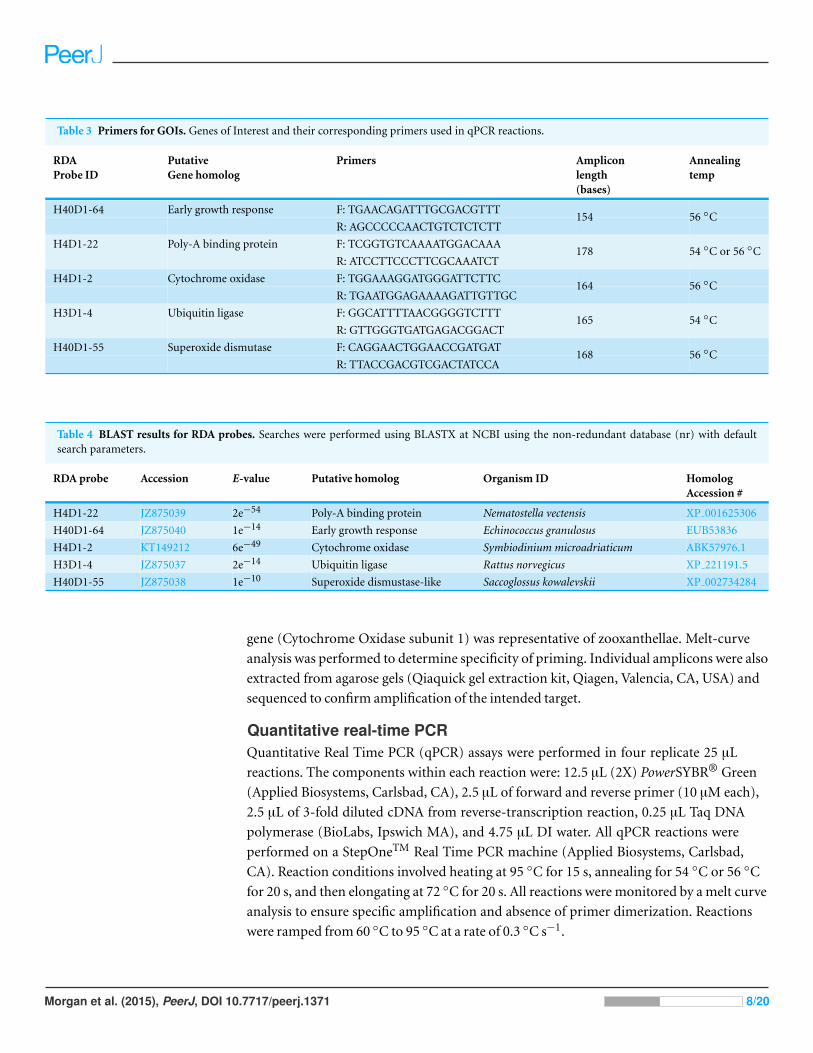
Table 3 Primers for GOIs. Genes of Interest and their corresponding primers used in qPCR reactions.
RDAProbe ID
PutativeGene homolog
Primers Ampliconlength(bases)
Annealingtemp
H40D1-64 Early growth response F: TGAACAGATTTGCGACGTTT
R: AGCCCCCAACTGTCTCTCTT154 56 ◦C
H4D1-22 Poly-A binding protein F: TCGGTGTCAAAATGGACAAA
R: ATCCTTCCCTTCGCAAATCT178 54 ◦C or 56 ◦C
H4D1-2 Cytochrome oxidase F: TGGAAAGGATGGGATTCTTC
R: TGAATGGAGAAAAGATTGTTGC164 56 ◦C
H3D1-4 Ubiquitin ligase F: GGCATTTTAACGGGGTCTTT
R: GTTGGGTGATGAGACGGACT165 54 ◦C
H40D1-55 Superoxide dismutase F: CAGGAACTGGAACCGATGAT
R: TTACCGACGTCGACTATCCA168 56 ◦C
Table 4 BLAST results for RDA probes. Searches were performed using BLASTX at NCBI using the non-redundant database (nr) with defaultsearch parameters.
RDA probe Accession E-value Putative homolog Organism ID HomologAccession #
H4D1-22 JZ875039 2e−54 Poly-A binding protein Nematostella vectensis XP 001625306
H40D1-64 JZ875040 1e−14 Early growth response Echinococcus granulosus EUB53836
H4D1-2 KT149212 6e−49 Cytochrome oxidase Symbiodinium microadriaticum ABK57976.1
H3D1-4 JZ875037 2e−14 Ubiquitin ligase Rattus norvegicus XP 221191.5
H40D1-55 JZ875038 1e−10 Superoxide dismustase-like Saccoglossus kowalevskii XP 002734284
gene (Cytochrome Oxidase subunit 1) was representative of zooxanthellae. Melt-curve
analysis was performed to determine specificity of priming. Individual amplicons were also
extracted from agarose gels (Qiaquick gel extraction kit, Qiagen, Valencia, CA, USA) and
sequenced to confirm amplification of the intended target.
Quantitative real-time PCRQuantitative Real Time PCR (qPCR) assays were performed in four replicate 25 µL
reactions. The components within each reaction were: 12.5 µL (2X) PowerSYBR® Green
(Applied Biosystems, Carlsbad, CA), 2.5 µL of forward and reverse primer (10 µM each),
2.5 µL of 3-fold diluted cDNA from reverse-transcription reaction, 0.25 µL Taq DNA
polymerase (BioLabs, Ipswich MA), and 4.75 µL DI water. All qPCR reactions were
performed on a StepOneTM Real Time PCR machine (Applied Biosystems, Carlsbad,
CA). Reaction conditions involved heating at 95 ◦C for 15 s, annealing for 54 ◦C or 56 ◦C
for 20 s, and then elongating at 72 ◦C for 20 s. All reactions were monitored by a melt curve
analysis to ensure specific amplification and absence of primer dimerization. Reactions
were ramped from 60 ◦C to 95 ◦C at a rate of 0.3 ◦C s−1.
Morgan et al. (2015), PeerJ, DOI 10.7717/peerj.1371 8/20
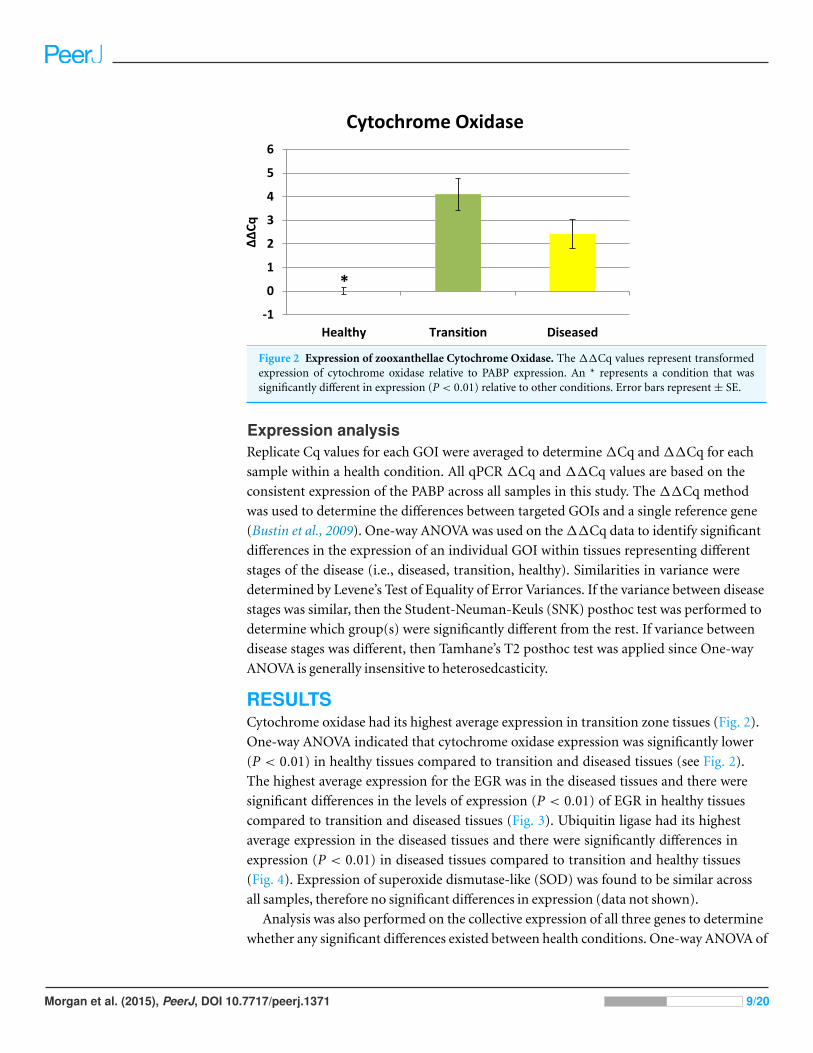
Figure 2 Expression of zooxanthellae Cytochrome Oxidase. The ΔΔCq values represent transformedexpression of cytochrome oxidase relative to PABP expression. An * represents a condition that wassignificantly different in expression (P < 0.01) relative to other conditions. Error bars represent ± SE.
Expression analysisReplicate Cq values for each GOI were averaged to determine ΔCq and ΔΔCq for each
sample within a health condition. All qPCR ΔCq and ΔΔCq values are based on the
consistent expression of the PABP across all samples in this study. The ΔΔCq method
was used to determine the differences between targeted GOIs and a single reference gene
(Bustin et al., 2009). One-way ANOVA was used on the ΔΔCq data to identify significant
differences in the expression of an individual GOI within tissues representing different
stages of the disease (i.e., diseased, transition, healthy). Similarities in variance were
determined by Levene’s Test of Equality of Error Variances. If the variance between disease
stages was similar, then the Student-Neuman-Keuls (SNK) posthoc test was performed to
determine which group(s) were significantly different from the rest. If variance between
disease stages was different, then Tamhane’s T2 posthoc test was applied since One-way
ANOVA is generally insensitive to heterosedcasticity.
RESULTSCytochrome oxidase had its highest average expression in transition zone tissues (Fig. 2).
One-way ANOVA indicated that cytochrome oxidase expression was significantly lower
(P < 0.01) in healthy tissues compared to transition and diseased tissues (see Fig. 2).
The highest average expression for the EGR was in the diseased tissues and there were
significant differences in the levels of expression (P < 0.01) of EGR in healthy tissues
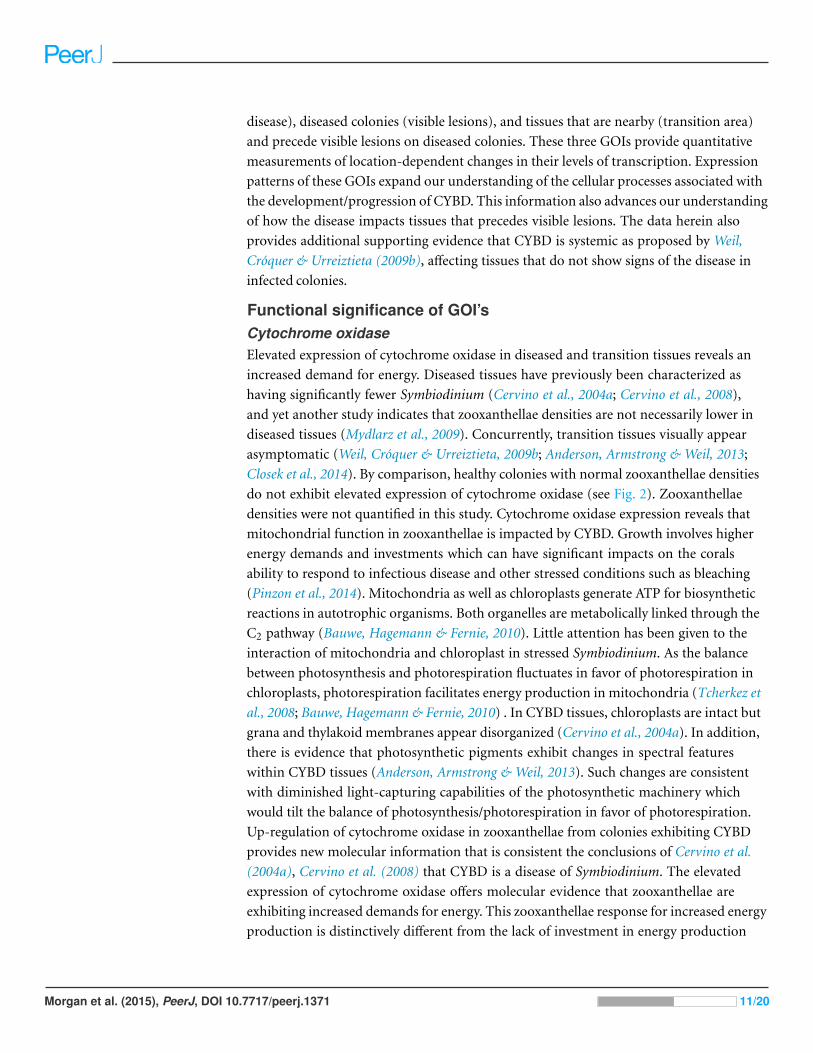
compared to transition and diseased tissues (Fig. 3). Ubiquitin ligase had its highest
average expression in the diseased tissues and there were significantly differences in
expression (P < 0.01) in diseased tissues compared to transition and healthy tissues
(Fig. 4). Expression of superoxide dismutase-like (SOD) was found to be similar across
all samples, therefore no significant differences in expression (data not shown).
Analysis was also performed on the collective expression of all three genes to determine
whether any significant differences existed between health conditions. One-way ANOVA of
Morgan et al. (2015), PeerJ, DOI 10.7717/peerj.1371 9/20
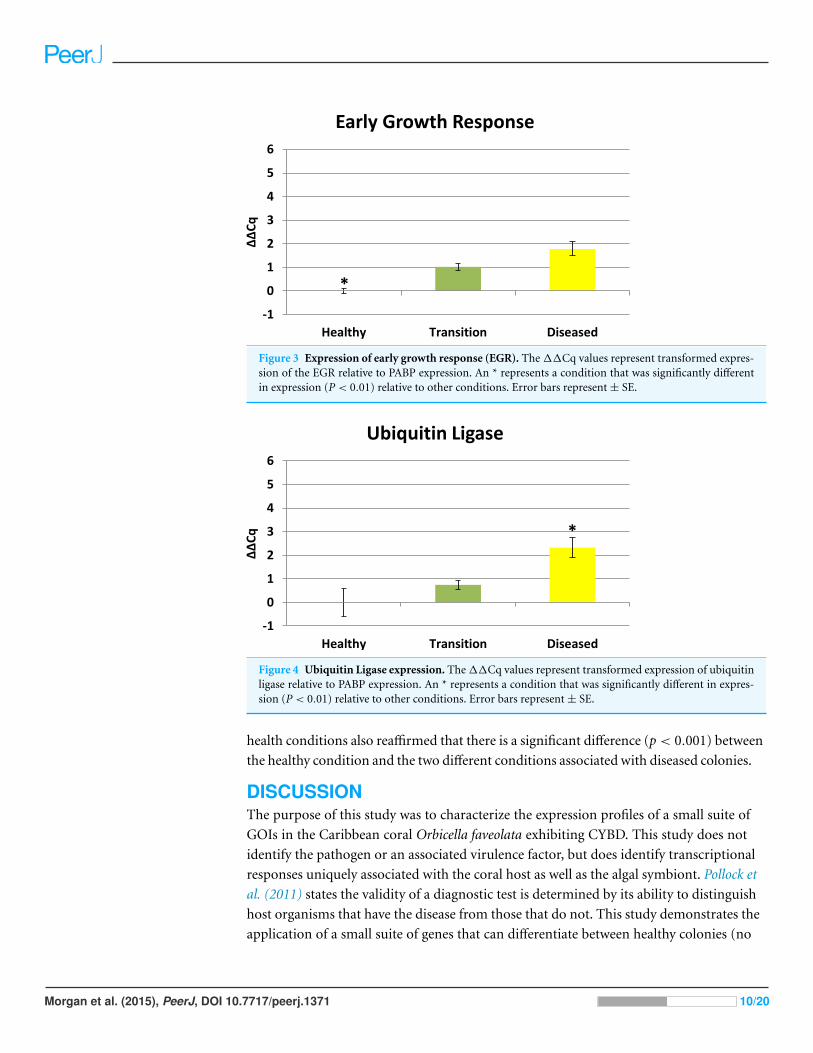
Figure 3 Expression of early growth response (EGR). The ΔΔCq values represent transformed expres-sion of the EGR relative to PABP expression. An * represents a condition that was significantly differentin expression (P < 0.01) relative to other conditions. Error bars represent ± SE.
Figure 4 Ubiquitin Ligase expression. The ΔΔCq values represent transformed expression of ubiquitinligase relative to PABP expression. An * represents a condition that was significantly different in expres-sion (P < 0.01) relative to other conditions. Error bars represent ± SE.
health conditions also reaffirmed that there is a significant difference (p < 0.001) between
the healthy condition and the two different conditions associated with diseased colonies.
DISCUSSIONThe purpose of this study was to characterize the expression profiles of a small suite of
GOIs in the Caribbean coral Orbicella faveolata exhibiting CYBD. This study does not
identify the pathogen or an associated virulence factor, but does identify transcriptional
responses uniquely associated with the coral host as well as the algal symbiont. Pollock et
al. (2011) states the validity of a diagnostic test is determined by its ability to distinguish
host organisms that have the disease from those that do not. This study demonstrates the
application of a small suite of genes that can differentiate between healthy colonies (no
Morgan et al. (2015), PeerJ, DOI 10.7717/peerj.1371 10/20
disease), diseased colonies (visible lesions), and tissues that are nearby (transition area)
and precede visible lesions on diseased colonies. These three GOIs provide quantitative
measurements of location-dependent changes in their levels of transcription. Expression
patterns of these GOIs expand our understanding of the cellular processes associated with
the development/progression of CYBD. This information also advances our understanding
of how the disease impacts tissues that precedes visible lesions. The data herein also
provides additional supporting evidence that CYBD is systemic as proposed by Weil,
Croquer & Urreiztieta (2009b), affecting tissues that do not show signs of the disease in
infected colonies.
Functional significance of GOI’sCytochrome oxidaseElevated expression of cytochrome oxidase in diseased and transition tissues reveals an
increased demand for energy. Diseased tissues have previously been characterized as
having significantly fewer Symbiodinium (Cervino et al., 2004a; Cervino et al., 2008),
and yet another study indicates that zooxanthellae densities are not necessarily lower in
diseased tissues (Mydlarz et al., 2009). Concurrently, transition tissues visually appear
asymptomatic (Weil, Croquer & Urreiztieta, 2009b; Anderson, Armstrong & Weil, 2013;
Closek et al., 2014). By comparison, healthy colonies with normal zooxanthellae densities
do not exhibit elevated expression of cytochrome oxidase (see Fig. 2). Zooxanthellae
densities were not quantified in this study. Cytochrome oxidase expression reveals that
mitochondrial function in zooxanthellae is impacted by CYBD. Growth involves higher
energy demands and investments which can have significant impacts on the corals
ability to respond to infectious disease and other stressed conditions such as bleaching
(Pinzon et al., 2014). Mitochondria as well as chloroplasts generate ATP for biosynthetic
reactions in autotrophic organisms. Both organelles are metabolically linked through the
C2 pathway (Bauwe, Hagemann & Fernie, 2010). Little attention has been given to the
interaction of mitochondria and chloroplast in stressed Symbiodinium. As the balance
between photosynthesis and photorespiration fluctuates in favor of photorespiration in
chloroplasts, photorespiration facilitates energy production in mitochondria (Tcherkez et
al., 2008; Bauwe, Hagemann & Fernie, 2010) . In CYBD tissues, chloroplasts are intact but
grana and thylakoid membranes appear disorganized (Cervino et al., 2004a). In addition,
there is evidence that photosynthetic pigments exhibit changes in spectral features
within CYBD tissues (Anderson, Armstrong & Weil, 2013). Such changes are consistent
with diminished light-capturing capabilities of the photosynthetic machinery which
would tilt the balance of photosynthesis/photorespiration in favor of photorespiration.
Up-regulation of cytochrome oxidase in zooxanthellae from colonies exhibiting CYBD
provides new molecular information that is consistent the conclusions of Cervino et al.
(2004a), Cervino et al. (2008) that CYBD is a disease of Symbiodinium. The elevated
expression of cytochrome oxidase offers molecular evidence that zooxanthellae are
exhibiting increased demands for energy. This zooxanthellae response for increased energy
production is distinctively different from the lack of investment in energy production
Morgan et al. (2015), PeerJ, DOI 10.7717/peerj.1371 11/20
by the coral host as identified by Closek et al. (2014). The cytochrome oxidase coupled
with findings from Closek et al. (2014) reaffirms the conclusions of Pinzon et al. (2014)
that energy demands are intimately linked to holobiont’s ability to responds to stressed
conditions. Quantifying expression of an algal gene (i.e., cytochrome oxidase) relative
to PABP expression of the coral host is a valid comparison because both genes are
representative of the transcriptional activity occurring in the holobiont at the time of
tissue sampling.
Early growth responsePreliminary BLASTX results suggest that RDA product H1D1-64 is an early growth
response (EGR) which is known as a transcription factor (Barshis et al., 2013). This gene
is known to be associated with the initiation of immune responses (McMahon & Monroe,
1996), mitogenesis and cell growth (Sukhatme, 1990), and tumor suppression (Huang
et al., 1997). Corals are known to have a complex repertoire of immune responses for
how corals respond to a pathogen (Sutherland, Porter & Torres, 2004; Miller et al., 2007;
Schwarz et al., 2008; Kvennefors et al., 2010; Shinzato et al., 2011; Poole & Weis, 2014).
Coral immune mechanisms include coral wound healing, hemocytosis, phagocytosis,
encapsulation, and basic immunological memory to fight off pathogens (Sutherland, Porter
& Torres, 2004; Palmer & Traylor-Knowles, 2012). EGR has also previously demonstrated
significant expression in corals responding to heat stress (Barshis et al., 2013) which is a
well-recognized stressor that can induce bleaching. There is a growing body of evidence of
linkages between bleaching and immune responses in cnidarians (Weis, 2008; Kvennefors
et al., 2010; Detournay et al., 2012; Pinzon et al., 2014; Pratte & Richardson, 2014). Elevated
EGR expression in the transition tissues (see Fig. 3) may represent an important signal
associated with a preliminary stage of infection in nearby tissues, but further studies will
need to be conducted to clarify the role of this protein in the progression of CYBD.
Ubiquitin ligaseUbiquitin ligase in this study is representative of RING-type E3 ligases. Ubiquitination
directs many cellular functions including protein degradation (Komander & Rape, 2012)
and regulating a variety of cellular processes including vesicle trafficking (Hsu et al.,
2014), cell cycle control (Skaar, Pagan & Pagano, 2013), and immune responses (Jiang
& Chen, 2012). Results herein reveal ubiquitin ligase is initially up-regulated in transition
tissues, but peaks with highest expression in visible lesion tissues (see Fig. 4). Elevated
expression of ubiquitin ligase in diseased tissues suggests this profile is representative of
a later stage in the development of the disease. Elevated expression of ubiquitin ligase in
diseased tissues is particularly interesting for a couple of reasons. Microbes are known
to highjack host ubiquitin pathways in order to manipulate host signaling to facilitate
bacterial infection and proliferation (Zhou & Zhu, 2015), and Closek et al. (2014) identified
CYBD diseased tissues having 2-3 times greater bacterial diversity compared to healthy
tissues while the transition tissues actually had the highest species richness. Ubiquitination
is also known to be associated with lysosomal degradation of plasma membrane proteins
(Komander & Rape, 2012), therefore the expression profile of ubiquitin ligase in this study
Morgan et al. (2015), PeerJ, DOI 10.7717/peerj.1371 12/20
is also consistent with elevated expression of lysosomal-like enzymes and anti-microbial
responses identified by Mydlarz et al. (2009). Ubiquitin ligase expression in this study may
represent the nexus between the microbial diversity identified by Closek et al. (2014) and
the anti-microbial responses identified by Mydlarz et al. (2009).
Expression profiles enhance findings of previous CYBD studiesResults from this study show that transition tissue 2–4 cm away from a visible lesion
exhibits a different expression profile compared to visible lesion tissues (see Figs. 2–4).
These results reaffirm conclusions of previous studies (Mydlarz et al., 2009; Weil, Croquer &
Urreiztieta, 2009b; Anderson, Armstrong & Weil, 2013; Closek et al., 2014) that characteristic
differences exists between healthy and diseased colonies, as well as differences between
diseased tissues and asymptomatic tissues that precede visible lesions on diseased colonies.
Results in this study coupled with Closek et al. (2014) findings that microbial diversity
was highest in tissues the precede visible lesions raise the intriguing possibility that
pathogen(s) responsible for CYBD may reside within the microbial community of the
transition tissues. If the etiological agent for inducing CYBD actually resides in the
microbial community of the transition tissues, then disease progression through a colony
may actually follow a pattern similar to secondary succession observed in terrestrial
communities after a disturbance such as a fire. The visible demarcation between transition
tissues and lesion tissues corresponds to “fire line” of the disturbance. Consequently,
lesion tissues behind the “fire line” are committed to subsequent degradation. Therefore
the Symbiodinium response in transition tissues represents a potential sentinel of the
approaching disturbance.
Mydlarz et al. (2009) investigated the anti-oxidant responses of prophenoloxidase
(PPO) and peroxidase (POX) in CYBD tissues. Without the presence of significant ROS,
down-regulation of PPO and POX in CYBD tissues would be expected when amounts of
reactive oxygen species (ROS) generated is minimal. As previously identified, there was
no significant up-regulated expression of SOD in coral host tissues (data not shown)
which is congruent with the down-regulation of the antioxidant enzymes quantified
by Mydlarz et al. (2009) and the absence of SOD expression identified by Closek et al.
(2014). Concurrently, the mitochondrial response of elevated cytochrome oxidase further
suggests a potential link between the absence of detectable ROS and the metabolic process
of photorespiration which integrates the functions of mitochondria, chloroplasts, and
peroxisomes through the photorespiratory C2 cycle (Bauwe, Hagemann & Fernie, 2010;
Voss et al., 2013).
CONCLUSIONSThis study has characterized CYBD in the Caribbean coral Orbicella faveolata by quantify-
ing the expression patterns of three GOIs (cytochrome oxidase, EGR, and ubiquitin ligase).
Individually, expression of these GOIs reveal altered physiology that can be attributed
to a wide variety of stressed conditions. Collectively, these GOIs represent a potential
diagnostic tool capable of differentiating between healthy and diseased colonies as well as
between two different stages of CYBD within a diseased colony. The expression profiles of
Morgan et al. (2015), PeerJ, DOI 10.7717/peerj.1371 13/20
these three GOIs in transition tissues compared to healthy and diseased tissues suggest the
initial development of this disease begins before visible lesions are evident. Quantification
of a small suite of genes by qPCR from within a complex pool of animal and algal
transcripts reaffirms the specificity of the technique previously demonstrated by Seneca
et al. (2010) and achieves the goal of sensitivity and specificity of a molecular diagnostic
tool to understand the cellular events associated with disease pathogenesis as outlined by
Pollock et al. (2011). The collective expression of these three GOIs produces expression
profiles that are uniquely different between transition, diseased, and healthy tissues.
Collectively, expression of these GOIs provides greater resolution for differences that exist
between tissues on both sides of the well-defined reference point of the transition/lesion
border of CYBD colonies. Biomarkers are most effective when they can detect stress signals
that vary in intensity (Tyler & Gretchen, 2012; Kenkel et al., 2014). Signal intensity increases
(healthy < transition < diseased) for EGR and ubiquitin ligase, but signal intensity peaks
(healthy < transition > diseased) for cytochrome oxidase. While the expression profile
of each GOI is different from the other GOIs, it is their collective expression can discern
differences that the physiological status of healthy, transitional, and diseased tissues. The
diagnostic power of these GOIs remain tentative without more extensive sampling to
account for genotypic variation of individual colonies and the distance tissues are sampled
from the visible demarcation of a lesion. Future transect sampling can provide greater
resolution about the distance from a visible lesion that these signals can be detected which
may help to further characterize the size of a “virulence wave” that precedes visible lesions.
The data in this study expands the current understanding of the molecular responses
associated with CYBD infections and the results identify significant responses associated
with different members of the holobiont. Lastly, this suite of GOIs offers an assessment tool
that may provide greater resolution to the spatial distribution of colonies susceptible to
infections of CYBD on a reef. Studies such as Soto-Santiago & Weil (2012) which quantified
the spatial distribution of CYBD at various reef locations may find greater resolution in the
distribution patterns of CYBD by incorporating these GOIs to screen for colonies in early
stages of this disease that precede visible lesions. Detection of colonies in the earliest stages
of CYBD may also help to spatially identify colonies at greatest risk of developing CYBD.
As our understanding of how environmental and anthropogenic stressors influence the
transmission of CYBD continues to expand, there will be increasing demands for rapid
assays capable providing resource managers with relevant field monitoring information
to make timely decisions. Future studies may also use these GOIs to assist in further
characterizing other stressed conditions such as bleaching. The methodologies employed
herein can be applied to studies of other coral diseases as well. Each coral disease with a
unique etiology will have its own distinctive transcriptional “finger print” representing
critical metabolic pathways that are impacted on a specific temporal/spatial scale. While
whole transcriptome analysis maybe ideal, many labs are not financially equipped to
employ such analyses. RDA represents an inexpensive alternative to transcriptome-wide
assays used to identify critical components of a specific stressed condition. Both RDA
and/or transcriptome analysis can be used to identify GOIs of critical biochemical
Morgan et al. (2015), PeerJ, DOI 10.7717/peerj.1371 14/20
pathways for CYBD or any other coral disease. Once candidate GOIs are identified,
they can be coupled with qPCR and used to generate a transcriptional profile uniquely
associated with a particular coral disease. Such assays are capable of providing valuable
transcriptional information within hours of tissue sampling.
ACKNOWLEDGEMENTSWe wish to acknowledge the laboratory assistance of Peggy Molyneux and Preston Neely.
The Department of Marine Sciences, University of Puerto Rico Mayaguez provided
logistical support and lab space.
ADDITIONAL INFORMATION AND DECLARATIONS
FundingFinancial support was provided by Berry College for the Richards Scholarships to Elizabeth
Stepp and Cydney Wilbanks; an NSF-REU (project # 0354017) awarded to Berry College
which funded Angela Poole; and the Berry College Provost’s Office for travel monies to
Kylia Goodner. Additional funding was provided by NSF IOS # 1017510 and OCE-1105143
to EW. The funders had no role in study design, data collection and analysis, decision to
publish, or preparation of the manuscript.
Grant DisclosuresThe following grant information was disclosed by the authors:
Berry College for the Richards Scholarships.
NSF-REU: # 0354017.
The Berry College Provost’s Office.
NSF IOS: # 1017510, OCE-1105143.
Competing InterestsThe authors declare there are no competing interests.
Author Contributions• Michael Morgan conceived and designed the experiments, performed the experiments,
analyzed the data, contributed reagents/materials/analysis tools, wrote the paper,
reviewed drafts of the paper, logistical support and lab space.
• Kylia Goodner and James Ross performed the experiments, analyzed the data, wrote the
paper, prepared figures and/or tables, reviewed drafts of the paper.
• Angela Z. Poole performed the experiments, analyzed the data, wrote the paper,
reviewed drafts of the paper.
• Elizabeth Stepp performed the experiments.
• Christopher H. Stuart performed the experiments, analyzed the data.
• Cydney Wilbanks performed the experiments, analyzed the data, prepared figures
and/or tables.
Morgan et al. (2015), PeerJ, DOI 10.7717/peerj.1371 15/20
• Ernesto Weil analyzed the data, contributed reagents/materials/analysis tools, wrote the
paper, reviewed drafts of the paper, logistical support and lab space.
Field Study PermissionsThe following information was supplied relating to field study approvals (i.e., approving
body and any reference numbers):
Specimens were collected under the General Collection Permit of the Department of
Marine Sciences, University of Puerto Rico, Mayaguez.
DNA DepositionThe following information was supplied regarding the deposition of DNA sequences:
GenBank accession numbers: JZ875039, JZ875040, KT149212, JZ875037, JZ875038
REFERENCESAnderson DA, Armstrong RA, Weil E. 2013. Hyperspectral sensing of disease stress in the
caribbean reef-building coral, Orbicella faveolata—perspectives for the field of coral diseasemonitoring. PLoS ONE 8(12):e81478 DOI 10.1371/journal.pone.0081478.
Barshis DJ, Ladner JT, Oliver TA, Seneca FO, Traylor-Knowles N, Palumbi SR. 2013. Genomicbasis for coral resilience to climate change. Proceedings of the National Academy of Sciences of theUnited States of America 110(4):1387–1392 DOI 10.1073/pnas.1210224110.
Bauwe H, Hagemann M, Fernie AR. 2010. Photorespiration: players, partners and origin. TrendsPlant Science 15(6):330–336 DOI 10.1016/j.tplants.2010.03.006.
Bruckner AW, Bruckner RJ. 2006. Consequences of yellow band disease (YBD) on Montastraeaannularis (species complex) populations on remote reefs off Mona Island, Puerto Rico. Diseasesof Aquatic Organisms 69(1):67–73 DOI 10.3354/dao069067.
Bruckner AW, Hill RL. 2009. Ten years of change to coral communities off Mona and DesecheoIslands, Puerto Rico, from disease and bleaching. Diseases of Aquatic Organisms 87(1–2):19–31DOI 10.3354/dao02120.
Bruno JF, Selig ER, Casey KS, Page CA, Willis BL, Harvell CD, Sweatman H, Melendy AM. 2007.Thermal stress and coral cover as drivers of coral disease outbreaks. PLoS Biology 5(6):e124DOI 10.1371/journal.pbio.0050124.
Burge CA, Mark Eakin C, Friedman CS, Froelich B, Hershberger PK, Hofmann EE, Petes LE,Prager KC, Weil E, Willis BL, Ford SE, Harvell CD. 2014. Climate change influences on marineinfectious diseases: implications for management and society. Annual Review of Marine Science6:249–277 DOI 10.1146/annurev-marine-010213-135029.
Bustin SA, Benes V, Garson JA, Hellemans J, Huggett J, Kubista M, Mueller R, Nolan T,Pfaffl MW, Shipley GL, Vandesompele J, Wittwer CT. 2009. The MIQE guidelines: minimuminformation for publication of quantitative real-time PCR experiments. Clinical Chemistry55(4):611–622 DOI 10.1373/clinchem.2008.112797.
Cervino JM, Hayes R, Goreau TJ, Smith GW. 2004a. Zooxanthellae regulation in yellowblotch/band and other coral diseases contrasted with temperature related bleaching: in situdestruction vs expulsion. Symbiosis 37(1–3):63–85.
Cervino JM, Hayes RL, Polson SW, Polson SC, Goreau TJ, Martinez RJ, Smith GW. 2004b.Relationship of Vibrio species infection and elevated temperatures to yellow blotch/banddisease in Caribbean corals. Applied and Environmental Microbiology 70(11):6855–6864DOI 10.1128/AEM.70.11.6855-6864.2004.
Morgan et al. (2015), PeerJ, DOI 10.7717/peerj.1371 16/20
Cervino JM, Thompson FL, Gomez-Gil B, Lorence EA, Goreau TJ, Hayes RL, Winiarski-Cervino KB, Smith GW, Hughen K, Bartels E. 2008. The Vibrio core group induces yellowband disease in Caribbean and Indo-Pacific reef-building corals. Journal of Applied Microbiology105(5):1658–1671 DOI 10.1111/j.1365-2672.2008.03871.x.
Closek CJ, Sunagawa S, DeSalvo MK, Piceno YM, DeSantis TZ, Brodie EL, Weber MX,Voolstra CR, Andersen GL, Medina M. 2014. Coral transcriptome and bacterial communityprofiles reveal distinct Yellow Band Disease states in Orbicella faveolata. The ISME Journal8:2411–2422 DOI 10.1038/ismej.2014.85.
Cunning JR, Thurmond JB, Smith GW, Weil E, Ritchie KB. 2008. A survey of vibrios associatedwith healthy and Yellow Band Diseased Montastraea faveolata. In: Proceedings of the 11thinternational coral reef symposium. Ft Lauderdale, USA, 206–210.
Detournay O, Schnitzler CE, Poole A, Weis VM. 2012. Regulation of cnidarian-dinoflagellatemutualisms: evidence that activation of a host TGF beta innate immune pathway promotestolerance of the symbiont. Developmental and Comparative Immunology 38(4):525–537DOI 10.1016/j.dci.2012.08.008.
Eakin CM, Morgan JA, Heron SF, Smith TB, Liu G, Alvarez-Filip L, Baca B, Bartels E,Bastidas C, Bouchon C, Brandt M, Bruckner AW, Bunkley-Williams L, Cameron A,Causey BD, Chiappone M, Christensen TR, Crabbe MJ, Day O, De la Guardia E,Diaz-Pulido G, DiResta D, Gil-Agudelo DL, Gilliam DS, Ginsburg RN, Gore S, Guzman HM,Hendee JC, Hernandez-Delgado EA, Husain E, Jeffrey CF, Jones RJ, Jordan-Dahlgren E,Kaufman LS, Kline DI, Kramer PA, Lang JC, Lirman D, Mallela J, Manfrino C, Marechal JP,Marks K, Mihaly J, Miller WJ, Mueller EM, Muller EM, Orozco Toro CA, Oxenford HA,Ponce-Taylor D, Quinn N, Ritchie KB, Rodriguez S, Ramirez AR, Romano S, Samhouri JF,Sanchez JA, Schmahl GP, Shank BV, Skirving WJ, Steiner SC, Villamizar E, Walsh SM,Walter C, Weil E, Williams EH, Roberson KW, Yusuf Y. 2010. Caribbean corals incrisis: record thermal stress, bleaching, and mortality in 2005. PLoS ONE 5(11):e13969DOI 10.1371/journal.pone.0013969.
Edman CF, Prigent SA, Schipper A, Feramisco JR. 1997. Identification of ErbB3-stimulatedgenes using modified representational difference analysis. Biochemistry Journal 323:113–118DOI 10.1042/bj3230113.
Franz O, Bruchhaus I, Roeder T. 1999. Verification of differential gene transcription using virtualnorthern blotting. Nucleic Acids Research 27(11):e3 DOI 10.1093/nar/27.11.e3.
Gil-Agudelo DL, Smith GW, Garzon-Ferreira J, Weil E, Petersen D. 2004. Dark spots disease andyellow band disease, two poorly known coral diseases with high incidence in Caribbean reefs.In: Rosenberg E, Loya Y, eds. Coral health and disease, part III, 337–349.
Hamada M, Shoguchi E, Shinzato C, Kawashima T, Miller DJ, Satoh N. 2013. The complexNOD-Like receptor repertoire of the coral acropora digitifera includes novel domaincombinations. Molecular Biology and Evolution 30(1):167–176 DOI 10.1093/molbev/mss213.
Harvell D, Altizer S, Cattadori IM, Harrington L, Weil E. 2009. Climate change and wildlifediseases: when does the host matter the most? Ecology 90(4):912–920 DOI 10.1890/08-0616.1.
Harvell CD, Kim K, Burkholder JM, Colwell RR, Epstein PR, Grimes DJ, Hofmann EE,Lipp EK, Osterhaus ADME, Overstreet RM, Porter JW, Smith GW, Vasta GR. 1999.Emerging marine diseases-climate links and anthropogenic factors. Science 285:1505–1510DOI 10.1126/science.285.5433.1505.
Harvell CD, Mitchell CE, Ward JR, Altizer S, Dobson AP, Ostfeld RS, Samuel MD. 2002. Climatewarming and disease risks for terrestrial and marine biota. Science 296(5576):2158–2162DOI 10.1126/science.1063699.
Morgan et al. (2015), PeerJ, DOI 10.7717/peerj.1371 17/20
Hoegh-Guldberg O, Mumby PJ, Hooten AJ, Steneck RS, Greenfield P, Gomez E, Harvell CD,Sale PF, Edwards AJ, Caldeira K, Knowlton N, Eakin CM, Iglesias-Prieto R, Muthiga N,Bradbury RH, Dubi A, Hatziolos ME. 2007. Coral reefs under rapid climate change and oceanacidification. Science 318(5857):1737–1742 DOI 10.1126/science.1152509.
Hsu FS, Luo X, Qiu JZ, Teng YB, Jin JP, Smolka MB, Luo ZQ, Mao YX. 2014. The Legionellaeffector SidC defines a unique family of ubiquitin ligases important for bacterial phagosomalremodeling. Proceedings of the National Academy of Sciences of the United States of America111(29):10538–10543 DOI 10.1073/pnas.1402605111.
Huang RP, Fan Y, DeBelle I, Niemeyer C, Gottardis MM, Mercola D, Adamson ED. 1997.Decreased EGR-1 expression in human, mouse and rat mammary cells and tissues correlateswith tumor formation. International Journal of Cancer 72(1):102–109DOI 10.1002/(SICI)1097-0215(19970703)72:1<102::AID-IJC15>3.0.CO;2-L.
Hubank M, Schatz DG. 1999. cDNA representational difference analysis: a sensitive and flexiblemethod for identification of differentially expressed genes. In: Weissman SM, ed. Methods inenzymology; cDNA preparation and characterization. San Diego: Academic Press, 325–349.
Jiang XM, Chen ZJJ. 2012. The role of ubiquitylation in immune defence and pathogen evasion.Nature Reviews Immunology 12(1):35–48 DOI 10.1038/nri3111.
Kenkel CD, Sheridan C, Leal MC, Bhagooli R, Castillo KD, Kurata N, McGinty E, Goulet TL,Matz MV. 2014. Diagnostic gene expression biomarkers of coral thermal stress. MolecularEcology Resources 14(4):667–678 DOI 10.1111/1755-0998.12218.
Komander D, Rape M. 2012. The ubiquitin code. Annual Review of Biochemistry 81:203–229DOI 10.1146/annurev-biochem-060310-170328.
Kvennefors ECE, Leggat W, Kerr CC, Ainsworth TD, Hoegh-Guldberg O, Barnes AC. 2010.Analysis of evolutionarily conserved innate immune components in coral links immunityand symbiosis. Developmental and Comparative Immunology 34(11):1219–1229DOI 10.1016/j.dci.2010.06.016.
Libro S, Kalaziak ST. 2013. RNA-seq profiles of immune related genes in the staghorncoral Acropora cervicornis infected with white band disease. PLoS ONE 8(11)DOI 10.1371/journal.pone.0081821.
McMahon SB, Monroe JG. 1996. The role of early growth response gene 1 (egr-1) in regulation ofthe immune response. Journal of Leukocyte Biology 60(2):159–166.
Meyer E, Weis VM. 2012. Study of cnidarian-algal symbiosis in the “omics” age. Biological Bulletin(Woods Hole) 223(1):44–65.
Miller DJ, Hemmrich G, Ball EE, Hayward DC, Khalturin K, Funayama N, Agata K, Bosch TC.2007. The innate immune repertoire in cnidaria–ancestral complexity and stochastic gene loss.Genome Biology 8(4):R59 DOI 10.1186/gb-2007-8-4-r59.
Morgan MB, Parker CC, Robinson JW, Pierce EM. 2012. Using Representational DifferenceAnalysis to detect changes in transcript expression of Aiptasia genes after laboratory exposureto lindane. Aquatic Toxicology 110:66–73 DOI 10.1016/j.aquatox.2012.01.001.
Mydlarz LD, Couch CS, Weil E, Smith G, Harvell CD. 2009. Immune defenses of healthy,bleached and diseased Montastraea faveolata during a natural bleaching event. Diseases ofAquatic Organisms 87(1–2):67–78DOI 10.3354/dao02088.
Ocampo I, Zarate-Potes A, Pizarro V, Rojas C, Vera N, Cadavid L. 2015. The immunotran-scriptome of the Caribbean reef-building coral Pseudodiploria strigosa. Immunogenetics67(9):515–530 DOI 10.1007/s00251-015-0854-1.
Morgan et al. (2015), PeerJ, DOI 10.7717/peerj.1371 18/20
Palmer CV, Traylor-Knowles N. 2012. Towards an integrated network of coral immunemechanisms. Proceedings of the Royal Society B-Biological Sciences 279(1745):4106–4114DOI 10.1098/rspb.2012.1477.
Pastorian K, Hawel L, Byus CV. 2000. Optimization of cDNA representational difference analysisfor the identification of differentially expressed mRNAs. Analytical Biochemistry 283(1):89–98DOI 10.1006/abio.2000.4622.
Pinzon CJH, Dornberger L, Beach-Letendre J, Weil E, Mydlarz LD. 2014. The link betweenimmunity and life history traits in scleractinian corals. PeerJ 2:e628 DOI 10.7717/peerj.628.
Pollock FJ, Morris PJ, Willis BL, Bourne DG. 2011. The urgent need for robust coral diseasediagnostics. PLoS Pathogens 7(10):e1002183 DOI 10.1371/journal.ppat.1002183.
Poole AZ, Weis VM. 2014. TIR-domain-containing protein repertoire of nine anthozoan speciesreveals coral-specific expansions and uncharacterized proteins. Developmental and ComparativeImmunology 46(2):480–488 DOI 10.1016/j.dci.2014.06.002.
Pratte ZA, Richardson LL. 2014. Impacts of temperature increase and acidification on thicknessof the surface mucopolysaccharide layer of the Caribbean coral Diploria spp. Coral Reefs33(2):487–496 DOI 10.1007/s00338-013-1115-0.
Rodriquiez-Lanetty M, Phillips WS, Dove S, Hoegh-Guldberg O, Weis VM. 2008. Analyticalapproach for selecting normalizing genes from a cDNA microarray platform to be usedin q-RT-PCR assays: a cnidarian case study. Journal of Biochemical and Biophysical Methods70(6):985–991 DOI 10.1016/j.jbbm.2007.08.005.
Ruiz-Moreno D, Willis BL, Page AC, Weil E, Croquer A, Vargas-Angel B, Jordan-Garza AG,Jordan-Dahlgren E, Raymundo L, Harvell CD. 2012. Global coral disease prevalence associatedwith sea temperature anomalies and local factors. Diseases of Aquatic Organisms 100(3):249–261DOI 10.3354/dao02488.
Sambrook J, Firtsch EF, Maniatia T. 2001. Molecular cloning: a laboratory manual. New York:Cold Spring Harbor Laboratory Press.
Schwarz JA, Brokstein PB, Voolstra C, Terry AY, Manohar CF, Miller DJ, Szmant AM,Coffroth MA, Medina M. 2008. Coral life history and symbiosis: functional genomic resourcesfor two reef building Caribbean corals, Acropora palmata and Montastraea faveolata. BMCGenomics 9:97 DOI 10.1186/1471-2164-9-97.
Seneca FO, Foret S, Ball EE, Smith-Keune C, Miller DJ, Van Oppen MJH. 2010. Patterns ofgene expression in a scleractinian coral undergoing natural bleaching. Marine Biotechnology12(5):594–604 DOI 10.1007/s10126-009-9247-5.
Shinzato C, Shoguchi E, Kawashima T, Hamada M, Hisata K, Tanaka M, Fujie M, Fujiwara M,Koyanagi R, Ikuta T, Fujiyama A, Miller DJ, Satoh N. 2011. Using the Acropora digitiferagenome to understand coral responses to environmental change. Nature 476(7360):320–323DOI 10.1038/nature10249.
Skaar JR, Pagan JK, Pagano M. 2013. Mechanisms and function of substrate recruitment by F-boxproteins. Nature Reviews Molecular Cell Biology 14(6):369–381 DOI 10.1038/nrm3582.
Soto-Santiago FJ, Weil E. 2012. Incidence and spatial distribution of caribbean yellowband disease in La Parguera, Puerto Rico. Journal of Marine Biology 2012:Article 510962DOI 10.1155/2012/510962.
Sukhatme VP. 1990. Early transcriptional events in cell growth—the EGR family. Journal of theAmerican Society of Nephrology 1(6):859–866.
Sutherland KP, Porter JW, Torres C. 2004. Disease and immunity in Caribbean and Indo-Pacificzooxanthellate corals. Marine Ecology Progress Series 266:273–302 DOI 10.3354/meps266273.
Morgan et al. (2015), PeerJ, DOI 10.7717/peerj.1371 19/20
Tcherkez G, Bligny R, Gout E, Mahe A, Hodges M, Cornic G. 2008. Respiratory metabolism ofilluminated leaves depends on CO2 and O2 conditions. Proceedings of the National Academy ofSciences of the United States of America 105(2):797–802 DOI 10.1073/pnas.0708947105.
Tyler GE, Gretchen EH. 2012. Defining the limits of physiological plasticity: how gene expressioncan assess and predict the consequences of ocean change. Philosophical Transactions of the RoyalSociety of London. Series B, Biological Sciences 367(1596):1733–1745DOI 10.1098/rstb.2012.0019.
Vidal-Dupiol J, Ladriere O, Destoumieux-Garzon D, Sautiere PE, Meistertzheim AL,Tambutte E, Tambutte S, Duval D, Foure L, Adjeroud M, Mitta G. 2011. Innateimmune responses of a scleractinian coral to vibriosis. Journal of Biological Chemistry286(25):22688–22698 DOI 10.1074/jbc.M110.216358.
Voss I, Sunil B, Scheibe R, Raghavendra AS. 2013. Emerging concept for the role ofphotorespiration as an important part of abiotic stress response. Plant Biology15(4, Sp. Iss. SI):713–722 DOI 10.1111/j.1438-8677.2012.00710.x.
Weil E. 2004. Coral reef diseases in the wider Caribbean. In: Rosenberg E, Loya Y, eds. Coral healthand disease. Springer Berlin Heidelberg, 35–68.
Weil E, Croquer A, Urreiztieta I. 2009a. Temporal variability and impact of coral diseasesand bleaching in La Parguera, Puerto Rico from 2003–2007. Caribbean Journal of Science45(2–3):221–246.
Weil E, Croquer A, Urreiztieta I. 2009b. Yellow band disease compromises the reproductiveoutput of the Caribbean reef-building coral Montastraea faveolata (Anthozoa, Scleractinia).Diseases of Aquatic Organisms 87(1–2):45–55 DOI 10.3354/dao02103.
Weil E, Ritchie KB, Croquer A, Cunning JR, Smith GW. 2008. Inoculation of Vibrio spp ontoMontastraea faveolata fragments to determine potential pathogenicity. In: Proceedings of the11th international coral reef symposium, 202–205.
Weil E, Rogers CS. 2011. Coral reef diseases in the Atlantic-Caribbean. Dordrecht: Springer.
Weis VM. 2008. Cellular mechanisms of Cnidarian bleaching: stress causes the collapse ofsymbiosis. Journal of Experimental Biology 211(19):3059–3066 DOI 10.1242/jeb.009597.
Wolenski FS, Garbati MR, Lubinski TJ, Traylor-Knowles N, Dresselhaus E, Stefanik DJ,Goucher H, Finnerty JR, Gilmore TD. 2011. Characterization of the core elements of theNF-kappaB signaling pathway of the sea anemone Nematostella vectensis. Molecular and CellularBiology 31(5):1076–1087 DOI 10.1128/MCB.00927-10.
Wood-Charlson EM, Hollingsworth LL, Krupp DA, Weis VM. 2006. Lectin/glycan interactionsplay a role in recognition in a coral/dinoflagellate symbiosis. Cell Microbiology 8(12):1985–1993DOI 10.1111/j.1462-5822.2006.00765.x.
Zhou Y, Zhu YQ. 2015. Diversity of bacterial manipulation of the host ubiquitin pathways. CellularMicrobiology 17(1):26–34 DOI 10.1111/cmi.12384.
Morgan et al. (2015), PeerJ, DOI 10.7717/peerj.1371 20/20