![arXiv:1605.05191v1 [math.PR] 17 May 2016CONNECTED k-TREES MICHAEL DRMOTA, EMMA YU JIN∗ AND BENEDIKT STUFLER Abstract. For any set Ω of non-negative integers such that {0,1} ⊆](https://static.fdocument.org/doc/165x107/5fda4cea5b2f3a5cdb30f1b1/arxiv160505191v1-mathpr-17-may-2016-connected-k-trees-michael-drmota-emma.jpg)
Developing an in vitro cellular model for Fabry Disease Part II Project Emma Brewer 31.01.2007.
20
Developing an Developing an in vitro in vitro cellular model for cellular model for Fabry Disease Fabry Disease Part II Project Part II Project Emma Brewer Emma Brewer 31.01.2007 31.01.2007
-
Upload
ferdinand-matthews -
Category
Documents
-
view
218 -
download
1
Transcript of Developing an in vitro cellular model for Fabry Disease Part II Project Emma Brewer 31.01.2007.
Developing an Developing an in vitroin vitro cellular model for cellular model for
Fabry DiseaseFabry Disease
Part II ProjectPart II ProjectEmma BrewerEmma Brewer
31.01.200731.01.2007
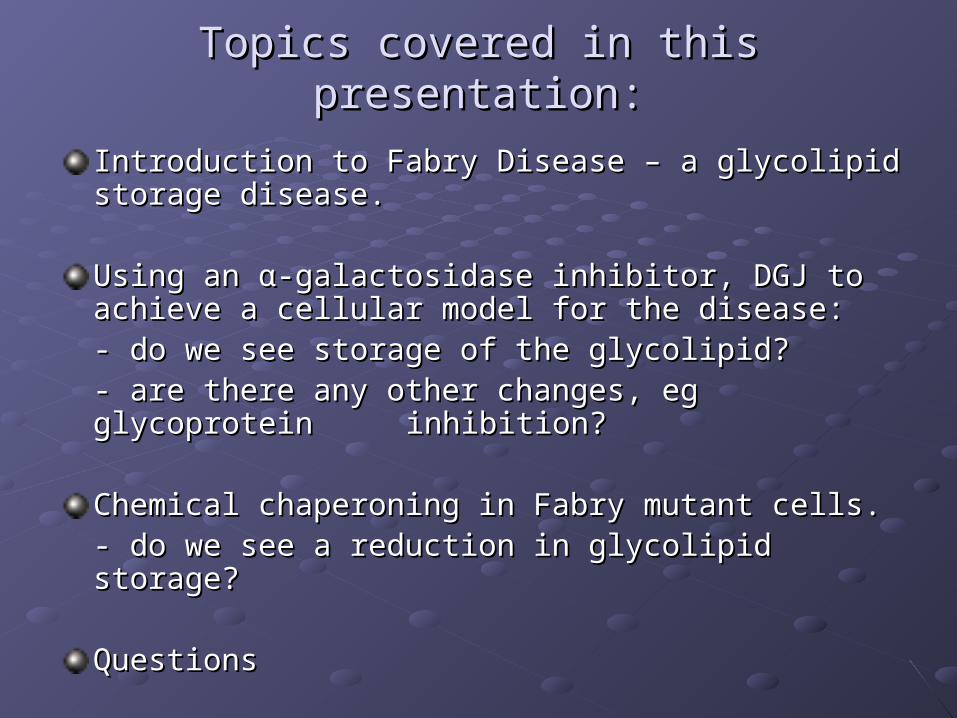
Topics covered in this presentation:Topics covered in this presentation:
Introduction to Fabry Disease – a glycolipid storage Introduction to Fabry Disease – a glycolipid storage disease.disease.
Using an Using an αα--galactosidase inhibitor, DGJ to achieve a galactosidase inhibitor, DGJ to achieve a cellular model for the disease:cellular model for the disease:
- do we see storage of the glycolipid?- do we see storage of the glycolipid?- are there any other changes, eg glycoprotein - are there any other changes, eg glycoprotein inhibition? inhibition?
Chemical chaperoning in Fabry mutant cells. Chemical chaperoning in Fabry mutant cells. - do we see a reduction in glycolipid storage?- do we see a reduction in glycolipid storage?
QuestionsQuestions
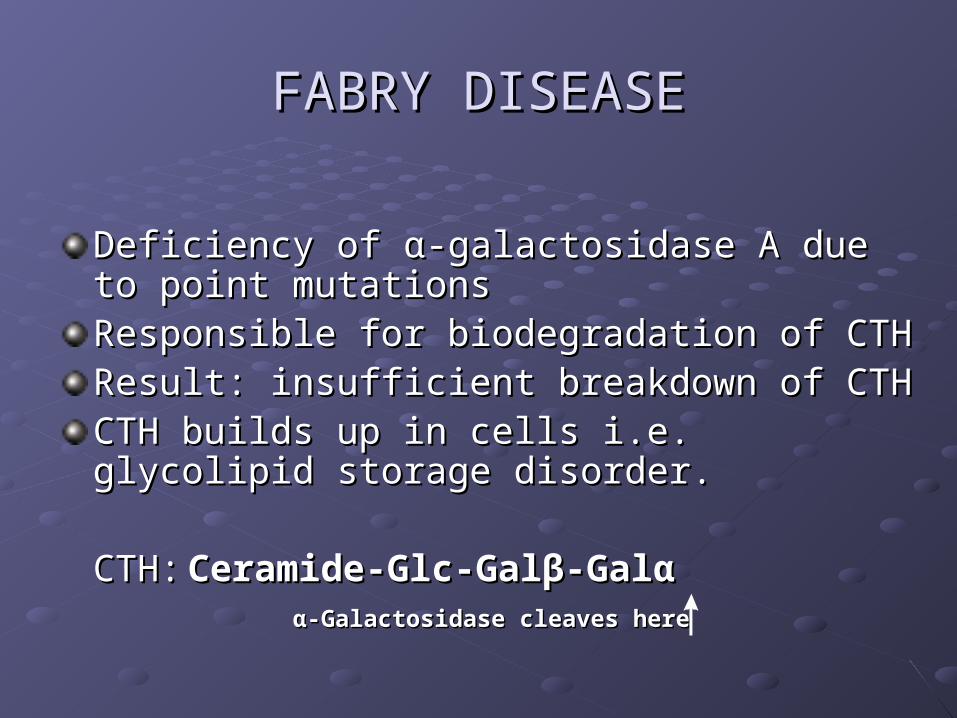
FABRY DISEASEFABRY DISEASE
Deficiency of Deficiency of αα--galactosidase A due to point galactosidase A due to point mutationsmutationsResponsible for biodegradation of CTHResponsible for biodegradation of CTHResult: insufficient breakdown of CTHResult: insufficient breakdown of CTHCTH builds up in cells i.e. glycolipid storage CTH builds up in cells i.e. glycolipid storage disorder.disorder.
CTH:CTH: Ceramide-Glc-Galβ-GalαCeramide-Glc-Galβ-Galα α-Galactosidase cleaves hereα-Galactosidase cleaves here
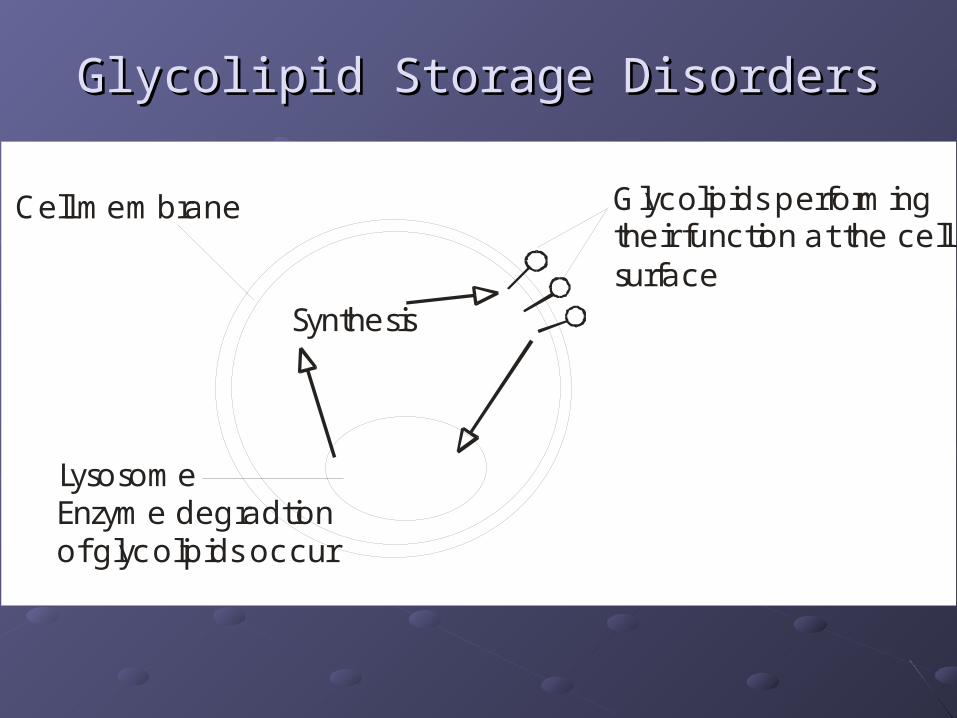
Glycolipid Storage DisordersGlycolipid Storage Disorders
LysosomeEnzyme degradtion of glycolipids occur
Cell membrane Glycolipids performingtheir function at the cellsurface
Synthesis
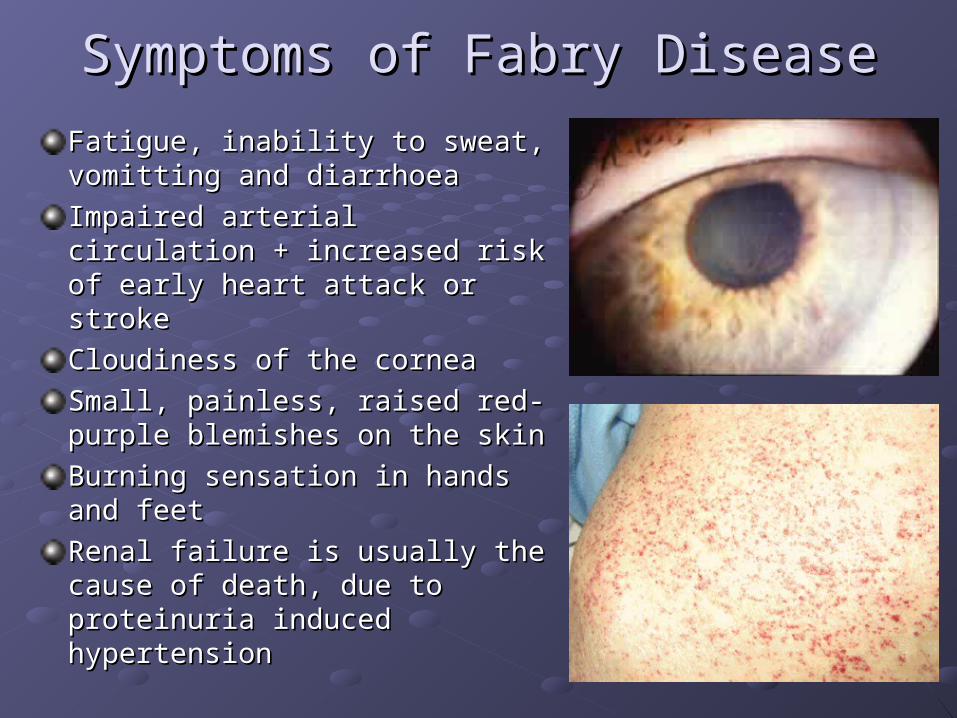
Symptoms of Fabry DiseaseSymptoms of Fabry Disease
Fatigue, inability to sweat, Fatigue, inability to sweat, vomitting and diarrhoeavomitting and diarrhoea
Impaired arterial circulation + Impaired arterial circulation + increased risk of early heart attack increased risk of early heart attack or strokeor stroke
Cloudiness of the corneaCloudiness of the cornea
Small, painless, raised red-purple Small, painless, raised red-purple blemishes on the skinblemishes on the skin
Burning sensation in hands and Burning sensation in hands and feetfeet
Renal failure is usually the cause Renal failure is usually the cause of death, due to proteinuria of death, due to proteinuria induced hypertensioninduced hypertension
More about Fabry DiseaseMore about Fabry DiseaseIt is an X-linked disease, and so is far more common in It is an X-linked disease, and so is far more common in men, although women carriers often show some men, although women carriers often show some symptomssymptoms
Long term accumulation of the glycolipid means that Long term accumulation of the glycolipid means that severity of symptoms increases over timeseverity of symptoms increases over time
Patients typically live into their early fortiesPatients typically live into their early forties
TherapyTherapyEnzyme replacement therapy can be successful – Enzyme replacement therapy can be successful – involves an intravenous infusion to replace the deficient involves an intravenous infusion to replace the deficient enzyme – up to twice weeklyenzyme – up to twice weekly
Substrate Reduction Therapy (SRT)Substrate Reduction Therapy (SRT)
Molecular Chaperone Therapy / Chaperone-Mediated Molecular Chaperone Therapy / Chaperone-Mediated Therapy (CMT)Therapy (CMT)
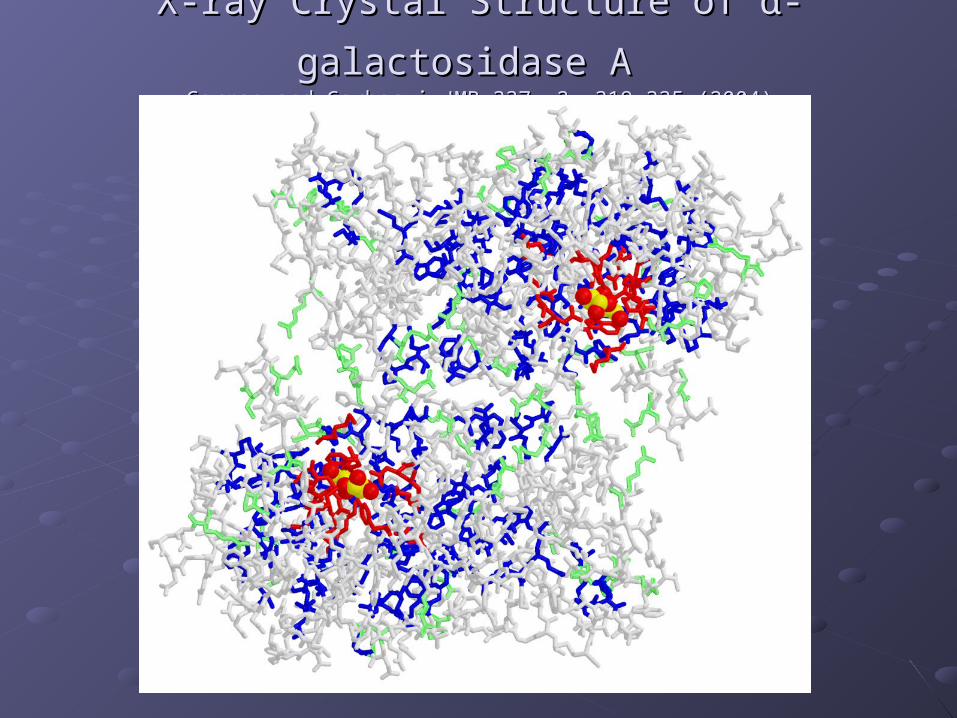
X-ray Crystal Structure of X-ray Crystal Structure of αα--galactosidase Agalactosidase A Garman and Garboczi JMBGarman and Garboczi JMB 337, 2, 319-335 (2004)337, 2, 319-335 (2004)
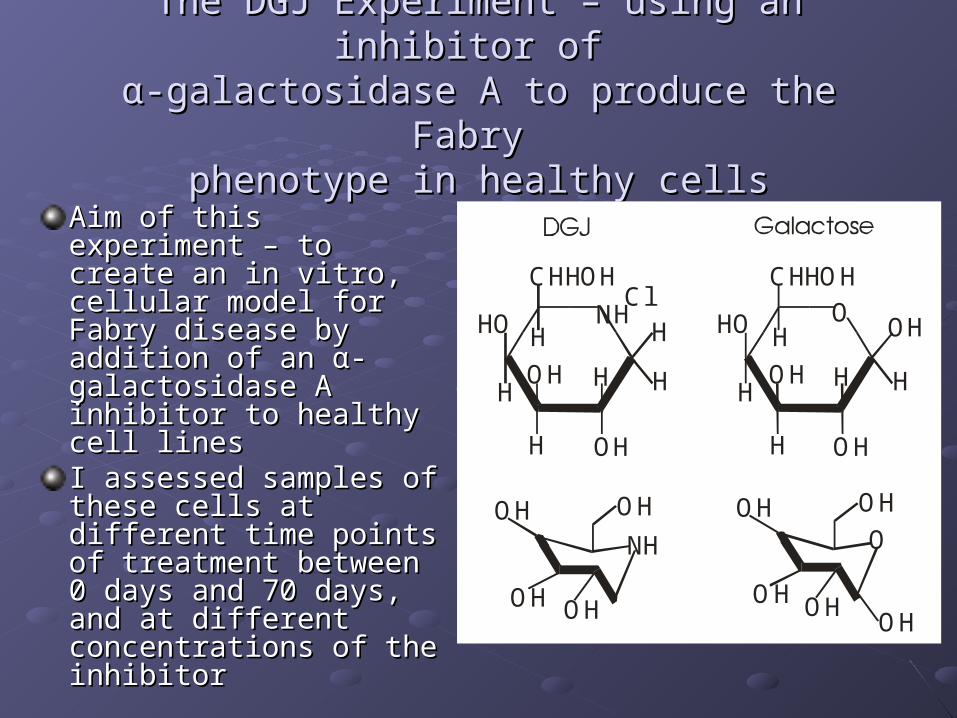
The DGJ Experiment – using an inhibitor of The DGJ Experiment – using an inhibitor of αα--galactosidase A to produce the Fabry galactosidase A to produce the Fabry
phenotype in healthy cellsphenotype in healthy cells
Aim of this experiment – Aim of this experiment – to create an in vitro, to create an in vitro, cellular model for Fabry cellular model for Fabry disease by addition of an disease by addition of an αα--galactosidase A inhibitor galactosidase A inhibitor to healthy cell linesto healthy cell linesI assessed samples of I assessed samples of these cells at different these cells at different time points of treatment time points of treatment between 0 days and 70 between 0 days and 70 days, and at different days, and at different concentrations of the concentrations of the inhibitorinhibitor
HO
OH
OH
H
H
H
H
H
CHHOH
NH HO
OH
OH
H
H
H
H
H
CHHOHO OH
OH
OHOH
OH
NH
OH
OHOH
OHO
OH
HCl
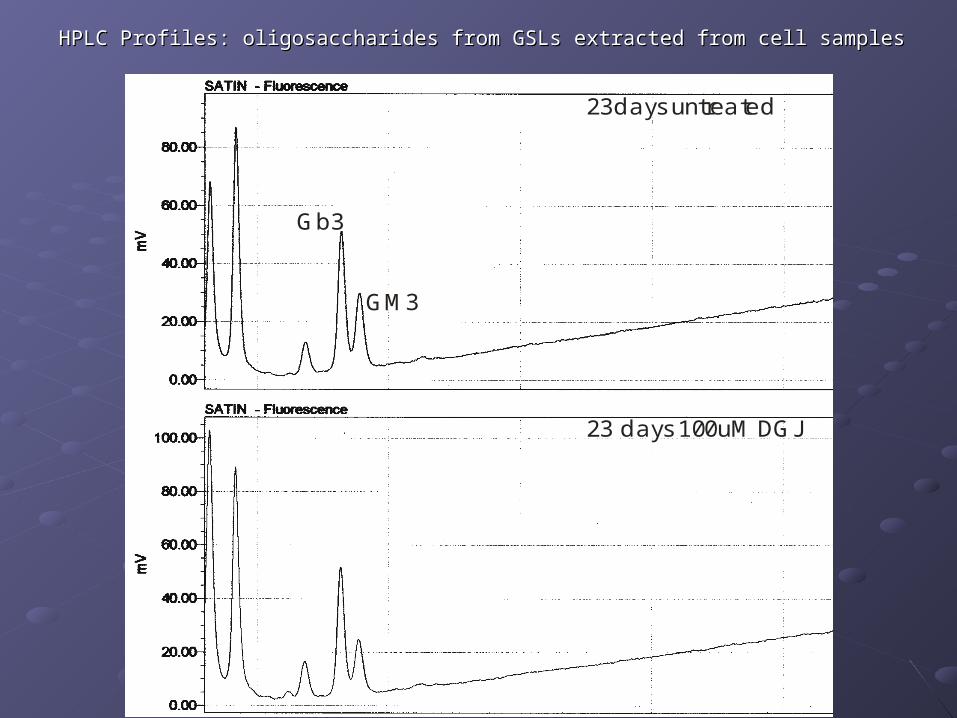
HPLC Profiles: oligosaccharides from GSLs extracted from cell samplesHPLC Profiles: oligosaccharides from GSLs extracted from cell samples
23days untreated
23 days 100uM DGJ
Gb3
GM3
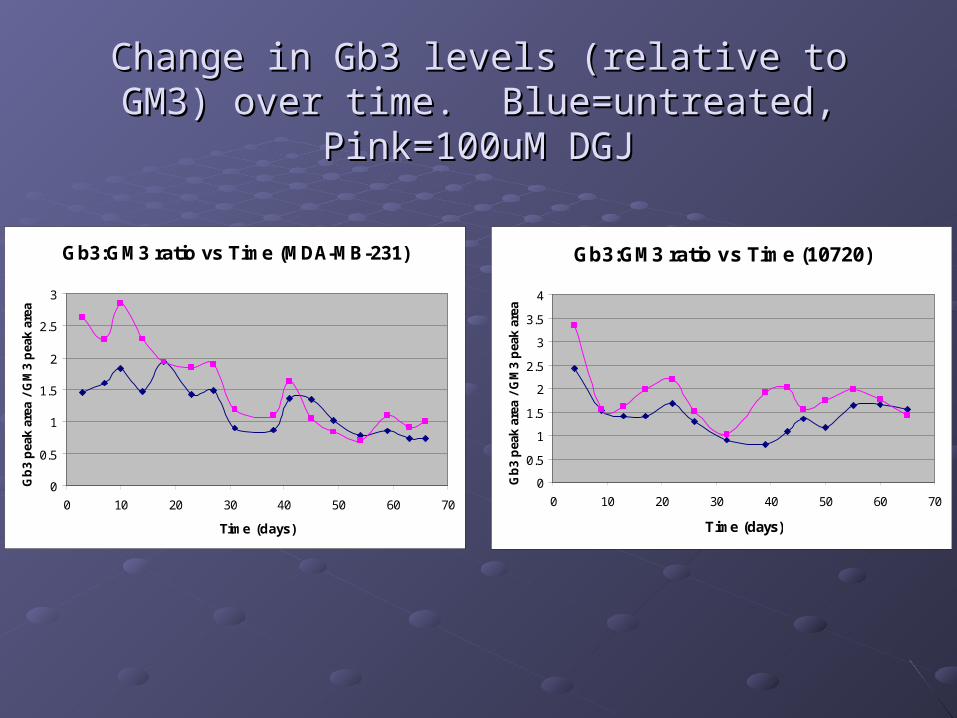
Change in Gb3 levels (relative to GM3) over time. Change in Gb3 levels (relative to GM3) over time. Blue=untreated, Pink=100uM DGJBlue=untreated, Pink=100uM DGJ
Gb3:GM3 ratio vs Time (MDA-MB-231)
0
0.5
1
1.5
2
2.5
3
0 10 20 30 40 50 60 70
Time (days)
Gb
3 p
eak
area
/ G
M3
pea
k ar
ea
Gb3:GM3 ratio vs Time (10720)
0
0.5
1
1.5
2
2.5
3
3.5
4
0 10 20 30 40 50 60 70
Time (days)G
b3
pea
k ar
ea /
GM
3 p
eak
area
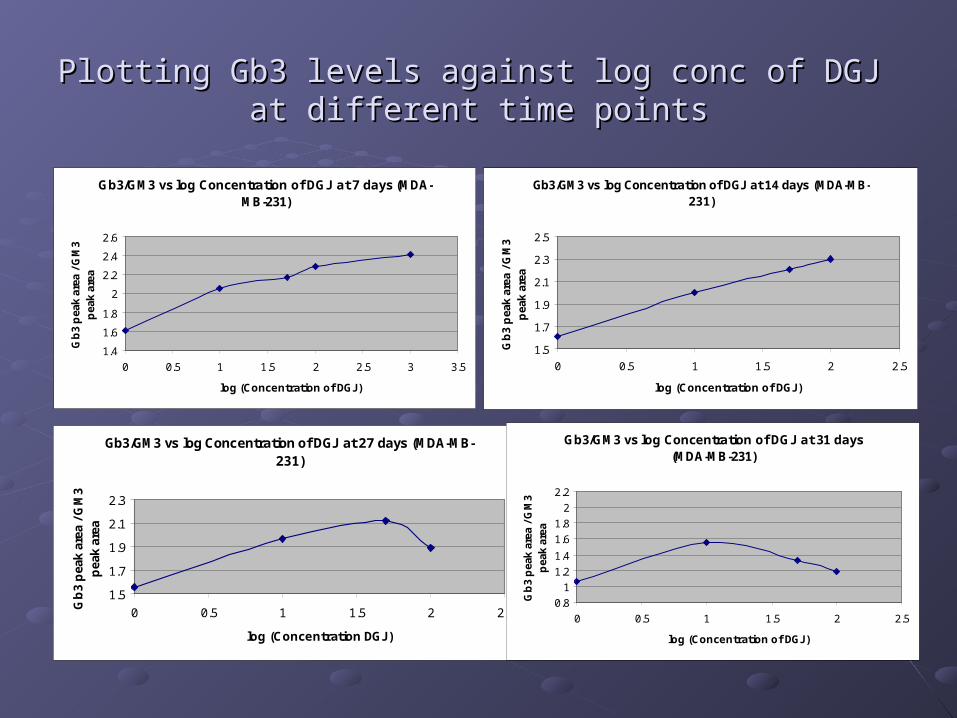
Plotting Gb3 levels against log conc of DGJ Plotting Gb3 levels against log conc of DGJ at different time pointsat different time points
Gb3/GM3 vs log Concentration of DGJ at 7 days (MDA-MB-231)
1.4
1.6
1.8
2
2.2
2.4
2.6
0 0.5 1 1.5 2 2.5 3 3.5
log (Concentration of DGJ)
Gb
3 p
eak
area
/ G
M3
pea
k ar
ea
Gb3/GM3 vs log Concentration of DGJ at 14 days (MDA-MB-231)
1.5
1.7
1.9
2.1
2.3
2.5
0 0.5 1 1.5 2 2.5
log (Concentration of DGJ)
Gb
3 p
eak
area
/ G
M3
pea
k ar
ea
Gb3/GM3 vs log Concentration of DGJ at 27 days (MDA-MB-231)
1.5
1.7
1.9
2.1
2.3
0 0.5 1 1.5 2 2.5
log (Concentration DGJ)
Gb
3 p
eak
area
/ G
M3
pea
k ar
ea
Gb3/GM3 vs log Concentration of DGJ at 31 days (MDA-MB-231)
0.8
1
1.2
1.4
1.6
1.8
2
2.2
0 0.5 1 1.5 2 2.5
log (Concentration of DGJ)
Gb
3 p
eak
area
/ G
M3
pea
k ar
ea
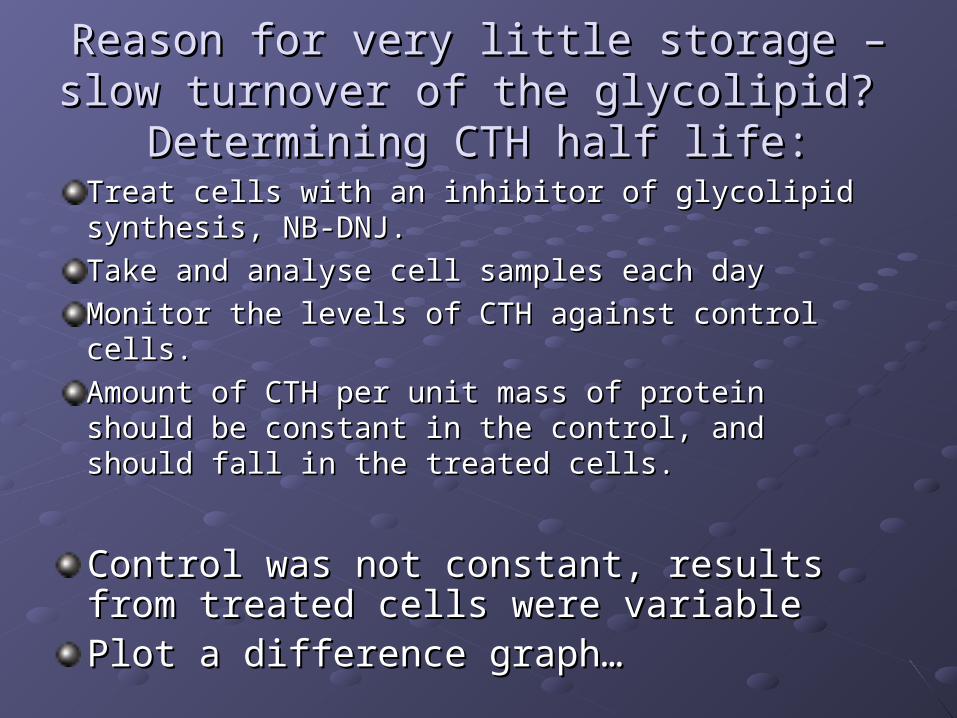
Reason for very little storage – slow turnover Reason for very little storage – slow turnover of the glycolipid? Determining CTH half life:of the glycolipid? Determining CTH half life:
Treat cells with an inhibitor of glycolipid synthesis, Treat cells with an inhibitor of glycolipid synthesis, NB-DNJ. NB-DNJ.
Take and analyse cell samples each dayTake and analyse cell samples each day
Monitor the levels of CTH against control cells.Monitor the levels of CTH against control cells.
Amount of CTH per unit mass of protein should be Amount of CTH per unit mass of protein should be constant in the control, and should fall in the constant in the control, and should fall in the treated cells.treated cells.
Control was not constant, results from treated Control was not constant, results from treated cells were variablecells were variablePlot a difference graph…Plot a difference graph…
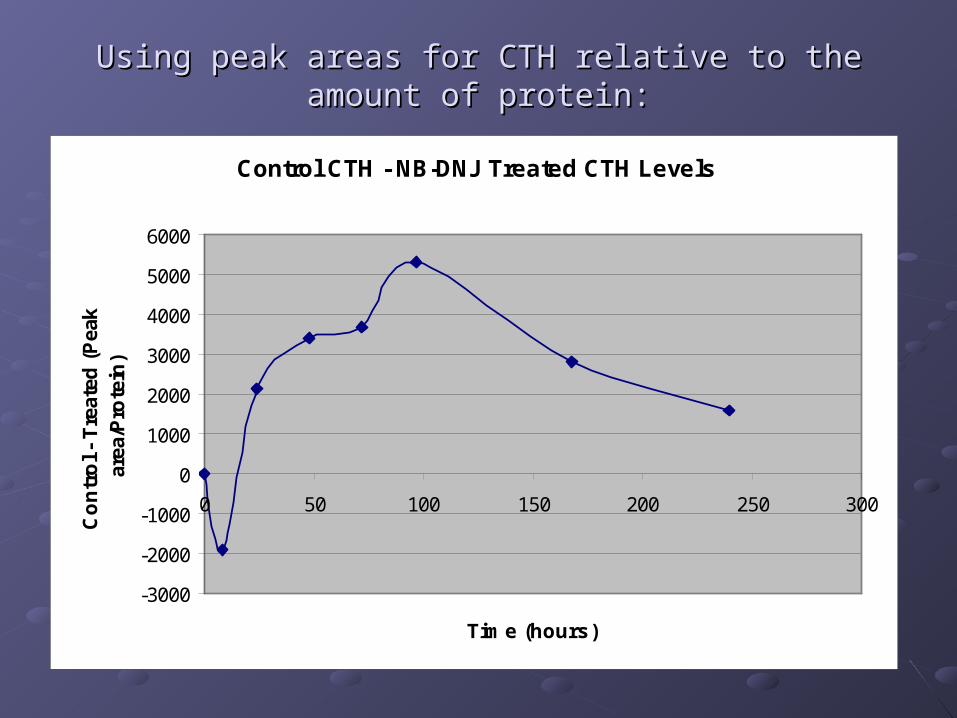
Using peak areas for CTH relative to the amount of protein:Using peak areas for CTH relative to the amount of protein:
Control CTH - NB-DNJ Treated CTH Levels
-3000
-2000
-1000
0
1000
2000
3000
4000
5000
6000
0 50 100 150 200 250 300
Time (hours)
Contr
ol -
Tre
ated
(Pea
k ar
ea/P
rote
in)
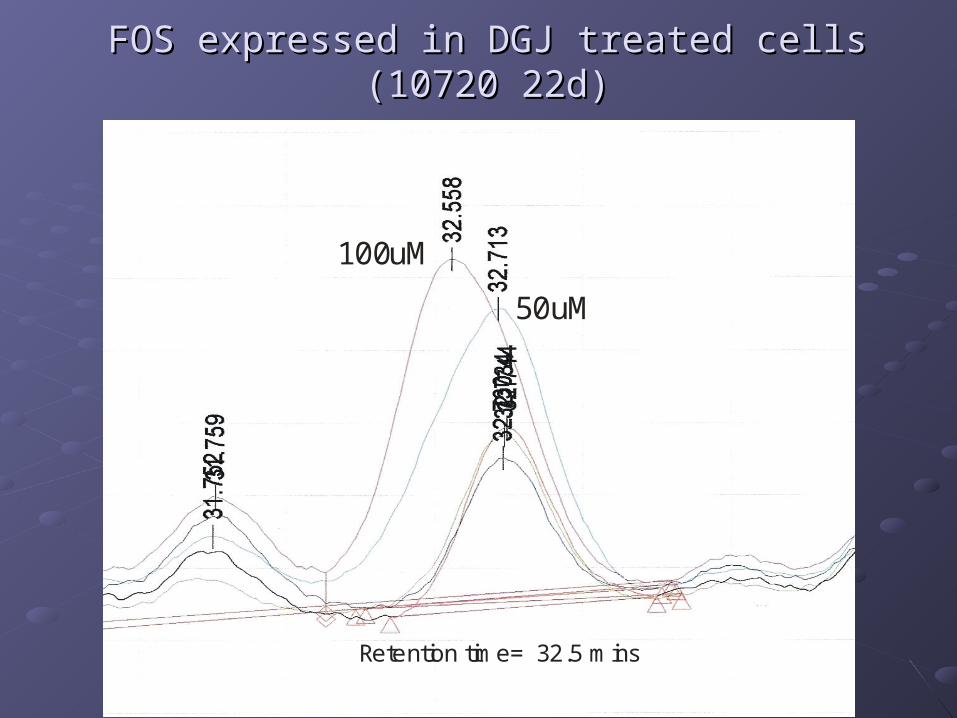
FOS expressed in DGJ treated cells (10720 22d)FOS expressed in DGJ treated cells (10720 22d)
100uM
50uM
Retention time= 32.5 mins
Looking at FB17 cellsLooking at FB17 cells
FB17 cells have a Fabry mutation, results in stored CTHFB17 cells have a Fabry mutation, results in stored CTH
Cell fractionation showed this CTH to be in the lysosomeCell fractionation showed this CTH to be in the lysosome
Does DGJ treatment decrease the amount of stored Does DGJ treatment decrease the amount of stored CTH?CTH?
Molecular Chaperone TherapyMolecular Chaperone Therapy
Chaperone vs inhibitor - concentration is crucial!Chaperone vs inhibitor - concentration is crucial!
Incubate FB17 cells with different concentrations of DGJ Incubate FB17 cells with different concentrations of DGJ and collect samples at various time pointsand collect samples at various time points
Analyse samples for GSLs and FOSAnalyse samples for GSLs and FOS
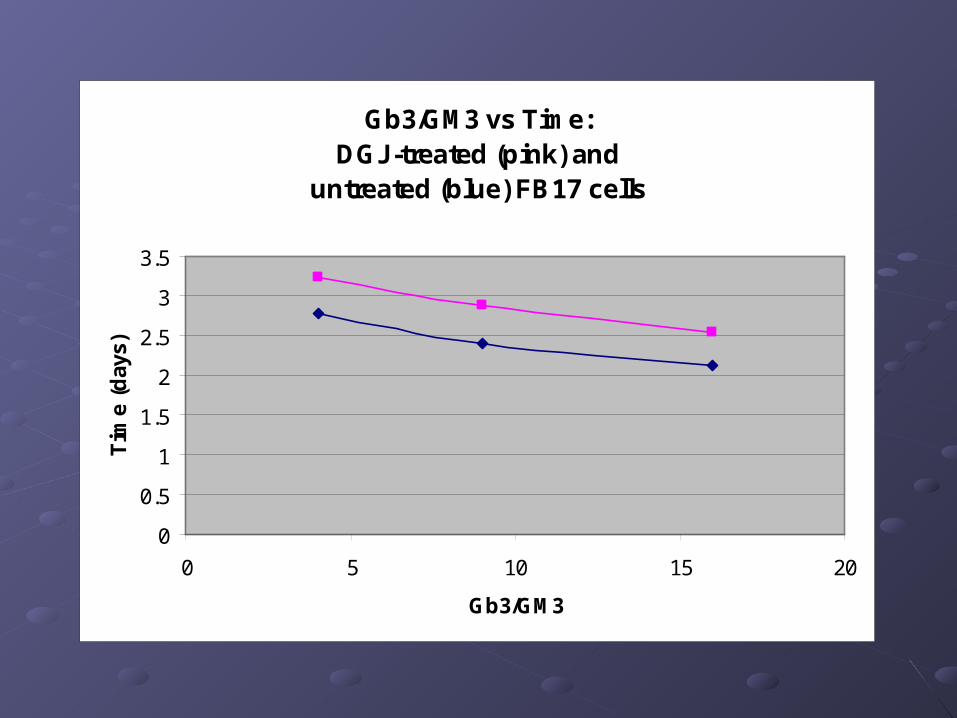
Gb3/GM3 vs Time: DGJ-treated (pink) and
untreated (blue) FB17 cells
0
0.5
1
1.5
2
2.5
3
3.5
0 5 10 15 20
Gb3/GM3
Tim
e (d
ays)
Conclusions:Conclusions:
At earlier time points, up to 20 days, DGJ At earlier time points, up to 20 days, DGJ treatment does result in a clear rise in the treatment does result in a clear rise in the levels of CTH in MDA-MB-231 cells, and levels of CTH in MDA-MB-231 cells, and to a lesser degree in 10720 cells. to a lesser degree in 10720 cells.
Treating FB17 Fabry mutant cells with Treating FB17 Fabry mutant cells with DGJ for up to 16 days does not result in DGJ for up to 16 days does not result in any decrease in the amount of stored any decrease in the amount of stored CTH.CTH.
References:References:
Butters, T.D., Dwek R.A., Platt F.M. (2005) Imino sugar inhibitors for Butters, T.D., Dwek R.A., Platt F.M. (2005) Imino sugar inhibitors for treating lysosomal glycosphingolipidoses. Glycobiology, 15, 43-52.treating lysosomal glycosphingolipidoses. Glycobiology, 15, 43-52.Garman, S.C., Garboczi, D.N. (2004) The molecular defect leading Garman, S.C., Garboczi, D.N. (2004) The molecular defect leading to Fabry disease: structure of human to Fabry disease: structure of human αα--galactosidase. JMB 337, galactosidase. JMB 337, 319-335.319-335.Asano, N., Ishii, S., Kizu, H. (2000) Asano, N., Ishii, S., Kizu, H. (2000) In vitroIn vitro inhibition and intracellular inhibition and intracellular enhancement of lysosomal enhancement of lysosomal αα--galactosidase A activity in Fabry galactosidase A activity in Fabry lymphoblasts by 1-deoxygalactonojirimycin and its derivatives. Eur. lymphoblasts by 1-deoxygalactonojirimycin and its derivatives. Eur. J. Biochem, 267, 4179-4186.J. Biochem, 267, 4179-4186.Brady, R. O. (2006) Emerging strategies for the treatment of Brady, R. O. (2006) Emerging strategies for the treatment of hereditary metabolic storage disorders. Rejuvenation Research, 9, hereditary metabolic storage disorders. Rejuvenation Research, 9, 237-244.237-244.Yam, G., Bosshard, N., Zuber, C. Pharmacological chaperone Yam, G., Bosshard, N., Zuber, C. Pharmacological chaperone corrects lysosomal storage in Fabry disease caused by trafficking-corrects lysosomal storage in Fabry disease caused by trafficking-incompetent variants. (2005) incompetent variants. (2005) Am J Physiol Cell Physiol 290.Am J Physiol Cell Physiol 290.Online Mendelian Inheritance in ManOnline Mendelian Inheritance in Manhttp://www.mssm.edu/genetics/fabry/http://www.mssm.edu/genetics/fabry/
With Thanks To:With Thanks To:
Dr. Terry ButtersDr. Terry Butters
Miss Stephanie BoomkampMiss Stephanie Boomkamp
Dr. David NevilleDr. David Neville
Dr. Gabrielle Dr. Gabrielle ReinkensmeierReinkensmeier
Prof. Raymond DwekProf. Raymond Dwek

Thanks for listening!Thanks for listening!
Any questions?Any questions?


![SS-25[i] [i]via solid state fermentation on brewer spent grain ...](https://static.fdocument.org/doc/165x107/58a1a32e1a28aba5438b9481/ss-25i-ivia-solid-state-fermentation-on-brewer-spent-grain-.jpg)