Density Void Analysis · Percent voids in mix vs. bitumen content Percent aggregate voids filled...
19
Density Void Analysis The following quantities are worked out by carrying out density voids analysis Bulk density (γ ) / specific gravity (G) of the specimen Average specific gravity of aggregates (G a ) Theoretical maximum specific gravity (G t ) Percent air voids in the final mix (V V ) Percent air voids in mineral aggregates (VMA) Percent aggregate voids filled with bitumen (VFB)
Transcript of Density Void Analysis · Percent voids in mix vs. bitumen content Percent aggregate voids filled...
Density Void Analysis
�The following quantities are worked out by carrying out density voids analysis
�Bulk density (γ ) / specific gravity (G) of the specimen
�Average specific gravity of aggregates (Ga)
�Theoretical maximum specific gravity (Gt)
�Percent air voids in the final mix (VV)
�Percent air voids in mineral aggregates (VMA)
�Percent aggregate voids filled with bitumen (VFB)
Bulk Density Determination
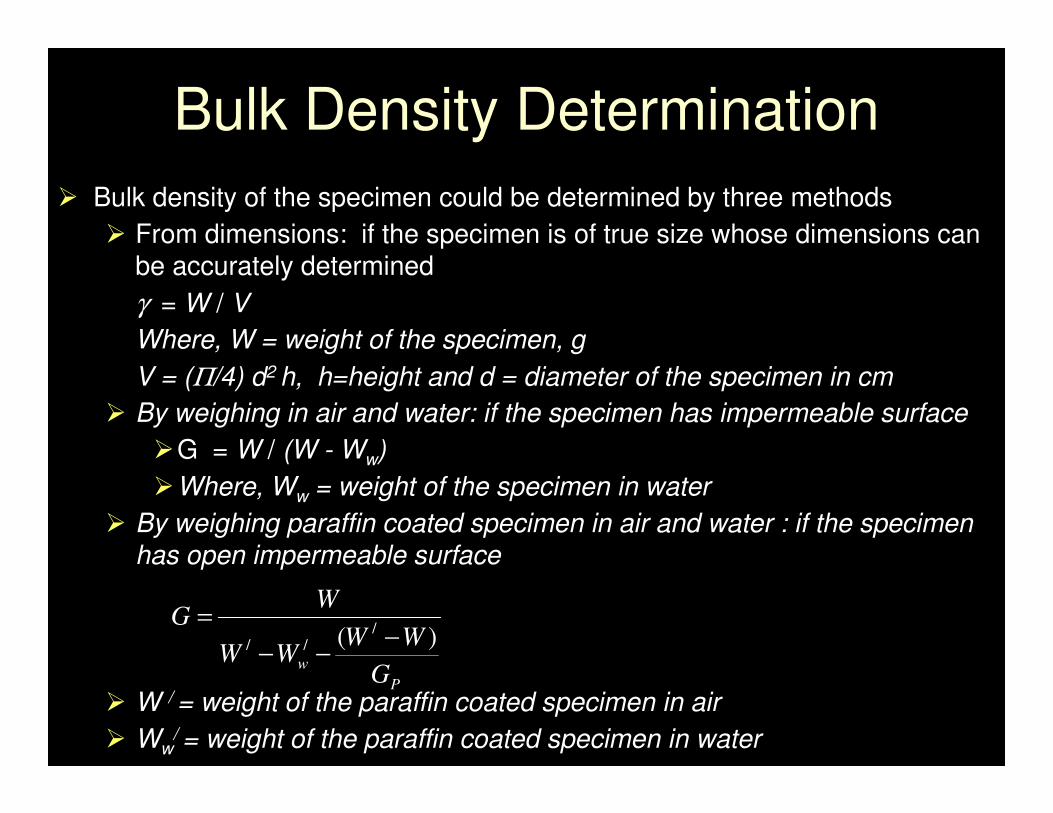
� Bulk density of the specimen could be determined by three methods
� From dimensions: if the specimen is of true size whose dimensions can be accurately determined
γ = W / V
Where, W = weight of the specimen, g
V = (Π/4) d2 h, h=height and d = diameter of the specimen in cm
� By weighing in air and water: if the specimen has impermeable surface
�G = W / (W - Ww)
�Where, Ww = weight of the specimen in water
� By weighing paraffin coated specimen in air and water : if the specimen has open impermeable surface
� W / = weight of the paraffin coated specimen in air
� Ww/ = weight of the paraffin coated specimen in water
P
wG
WWWW
WG
)( /// −−−
=
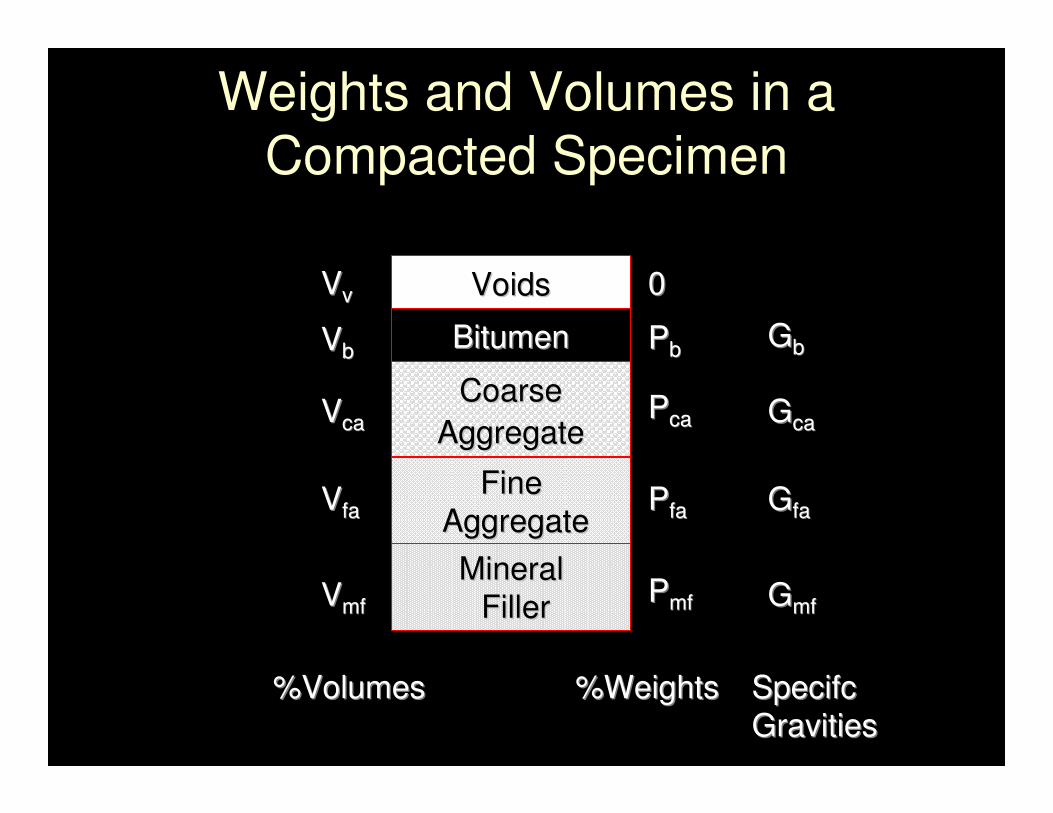
Weights and Volumes in a
Compacted Specimen
VoidsVoids
BitumenBitumen
Coarse Coarse
AggregateAggregate
FineFine
AggregateAggregate
MineralMineral
FillerFiller PPmfmf
PPfafa
PPcaca
PPbb
00
VVmfmf
VVfafa
VVcaca
VVbb
VVvv
%Volumes %Weights %Volumes %Weights SpecifcSpecifc
GravitiesGravities
GGmfmf
GGfafa
GGcaca
GGbb
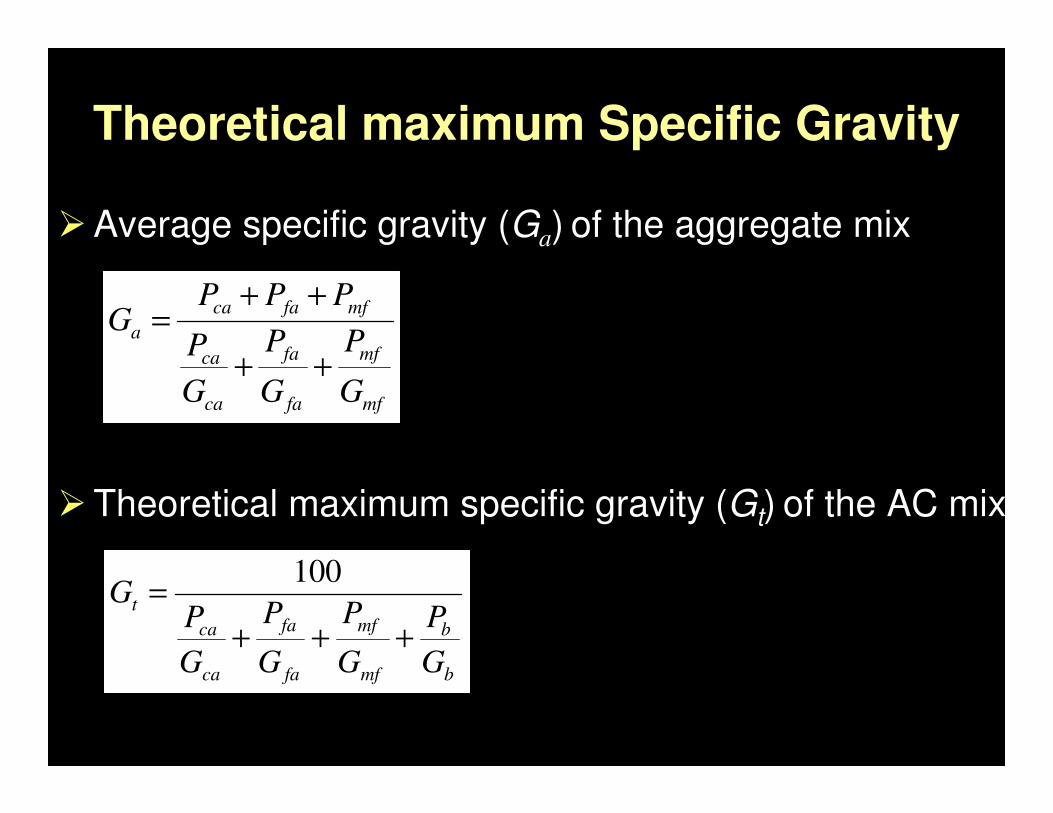
Theoretical maximum Specific Gravity
�Average specific gravity (Ga) of the aggregate mix
mf
mf
fa
fa
ca
ca
mffaca
a
G
P
G
P
G
P
PPPG
++
++=
�Theoretical maximum specific gravity (Gt) of the AC mix
b
b
mf
mf
fa
fa
ca
ca
t
G
P
G
P
G
P
G
PG
+++
=100
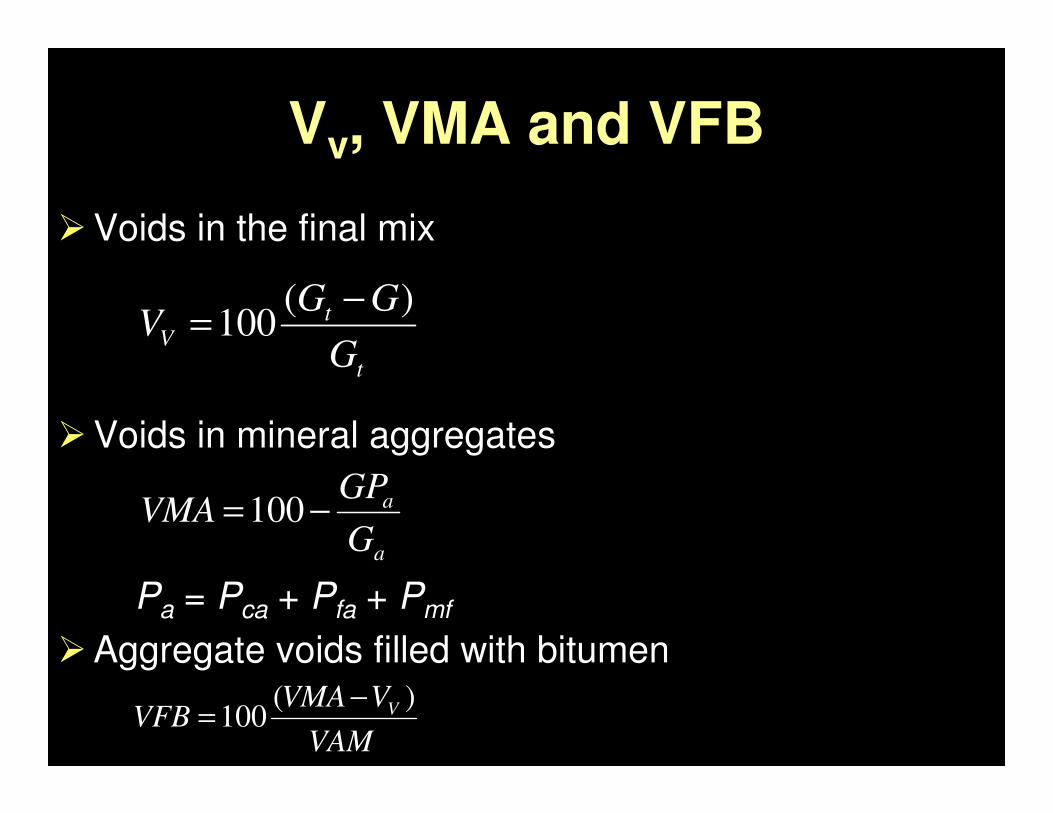
Vv, VMA and VFB
�Voids in the final mix
�Voids in mineral aggregates
Pa = Pca + Pfa + Pmf
�Aggregate voids filled with bitumen
a
a
G
GPVMA −=100
t
tV
G
GGV
)(100
−=
VAM
VVMAVFB V )(
100−
=
Marshall Stability and Flow
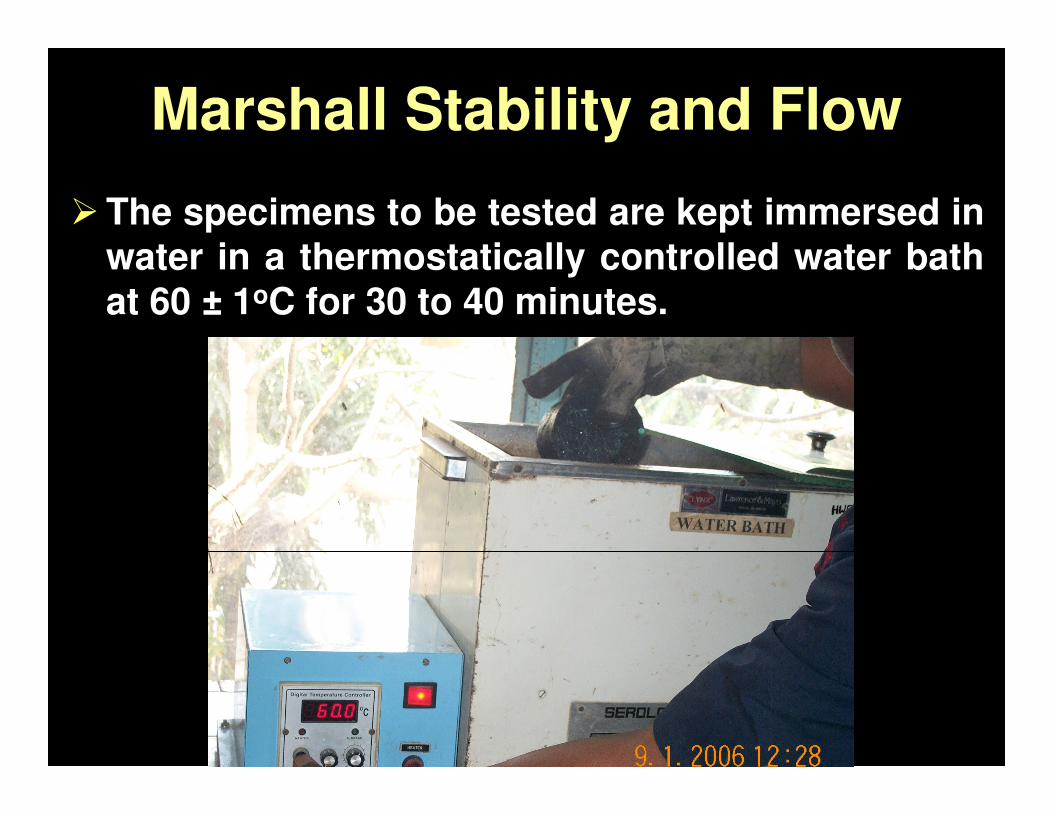
�The specimens to be tested are kept immersed in
water in a thermostatically controlled water bath
at 60 ± 1oC for 30 to 40 minutes.
Marshall Stability and Flow
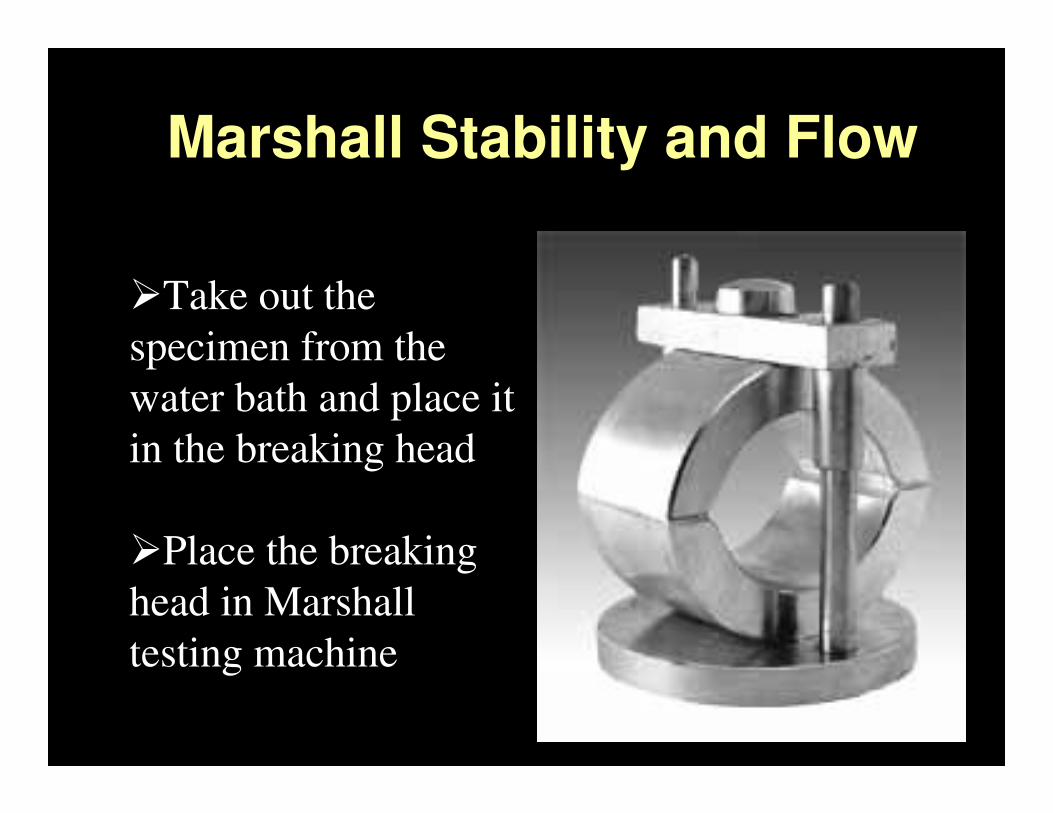
�Take out the
specimen from the
water bath and place it
in the breaking head
�Place the breaking
head in Marshall
testing machine
Marshall Stability and Flow
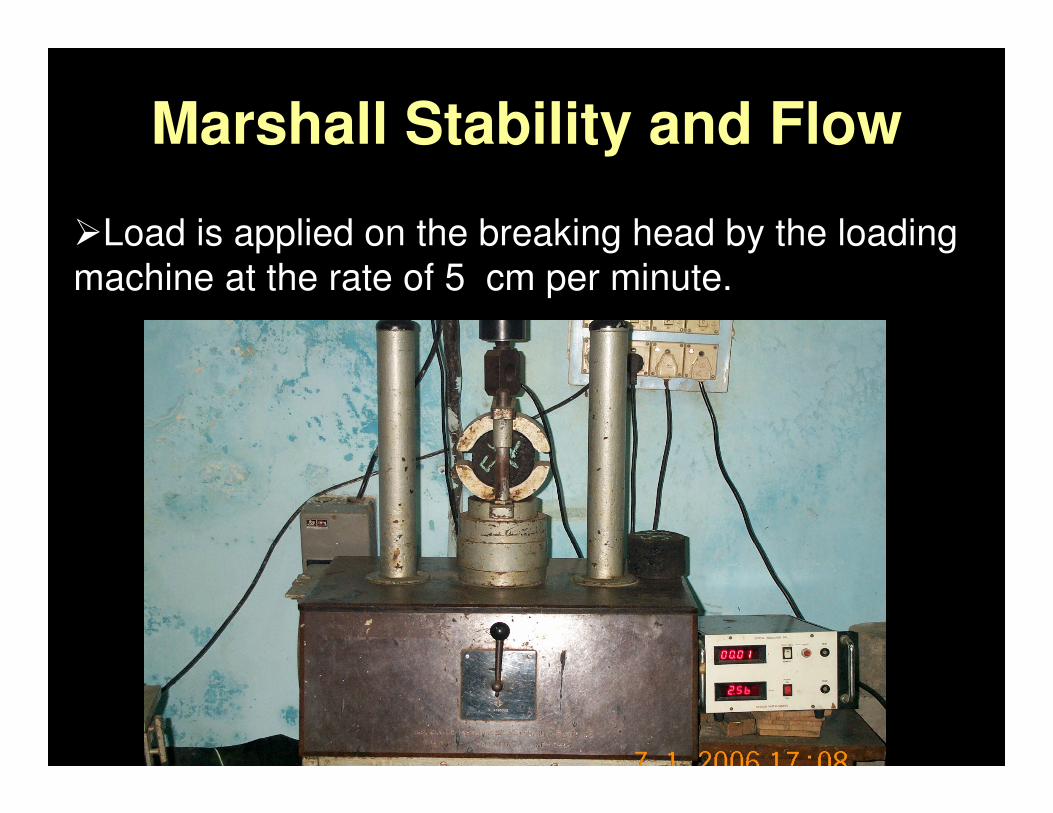
�Load is applied on the breaking head by the loading
machine at the rate of 5 cm per minute.
Marshall Stability and Flow
�Stability value is the load taken by the specimen at failure.
�Flow value is the deformation of the specimen at failure
�Record stability either by proving ring or load cell display unit.
�Record the flow by the dial gauge or displacement cell attached to the breaking head
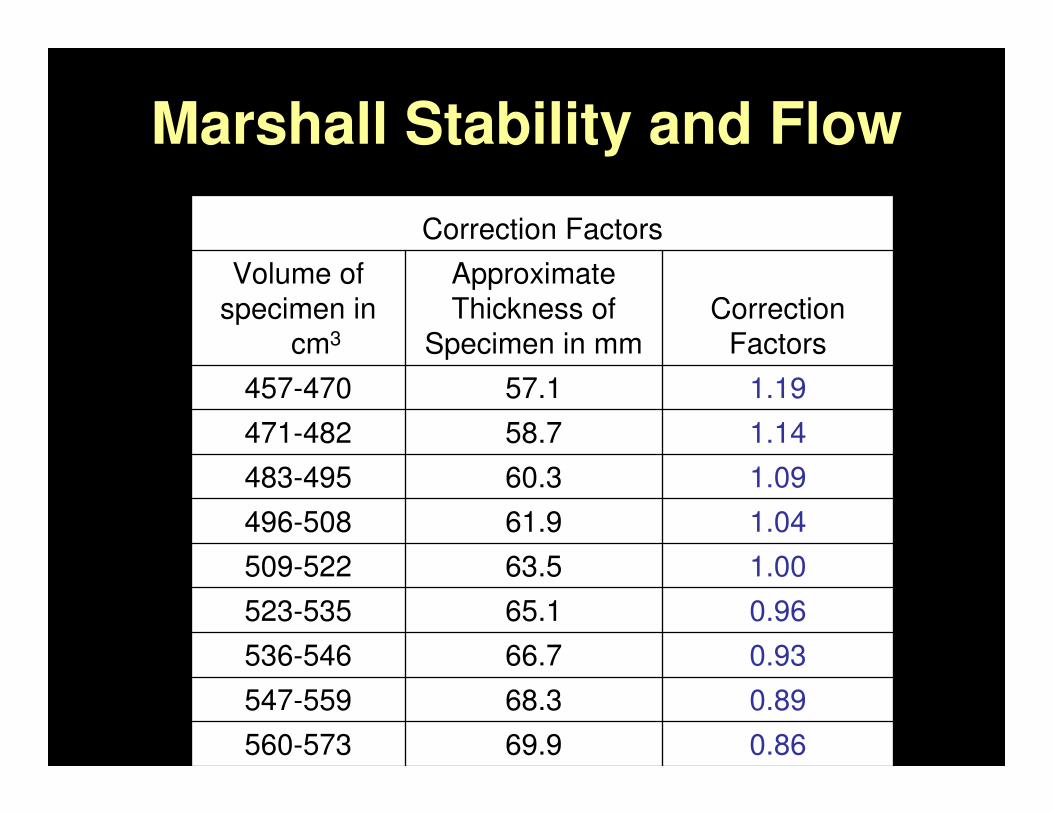
�Apply correction factor to the stability value if the height of specimen is different from 6.35 cm
Marshall Stability and Flow
0.8669.9560-573
0.8968.3547-559
0.9366.7536-546
0.9665.1523-535
1.0063.5509-522
1.0461.9496-508
1.0960.3483-495
1.1458.7471-482
1.1957.1457-470
CorrectionFactors
Approximate
Thickness ofSpecimen in mm
Volume of
specimen in cm3
Correction Factors
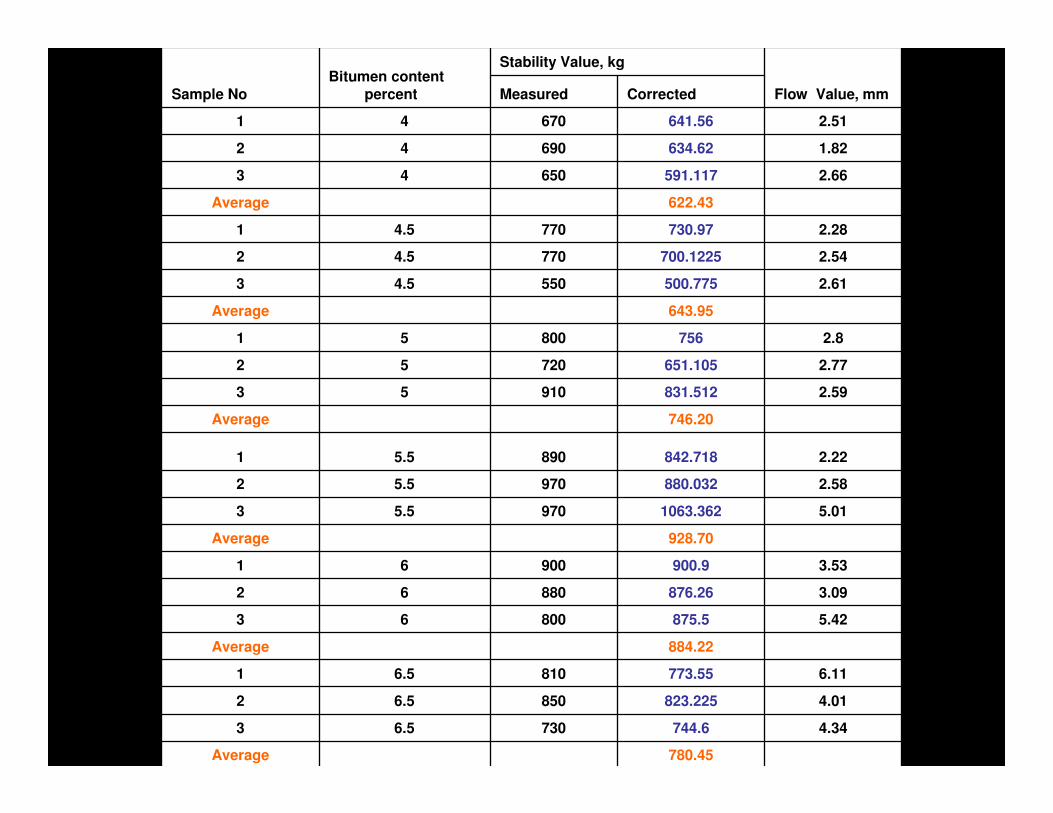
780.45Average
4.34744.67306.53
4.01823.2258506.52
6.11773.558106.51
884.22Average
5.42875.580063
3.09876.2688062
3.53900.990061
928.70Average
5.011063.3629705.53
2.58880.0329705.52
2.22842.7188905.51
746.20Average
2.59831.51291053
2.77651.10572052
2.875680051
643.95Average
2.61500.7755504.53
2.54700.12257704.52
2.28730.977704.51
622.43Average
2.66591.11765043
1.82634.6269042
2.51641.5667041
CorrectedMeasured Flow Value, mm
Stability Value, kgBitumen content
percentSample No
Optimum Content of Bitumen
The following graphs are plotted
�Unit weight vs. bitumen content
�Marshall stability vs. bitumen content
�Percent voids in mix vs. bitumen content
�Percent aggregate voids filled with bitumen vs.
bitumen content
�Flow Values vs. bitumen content
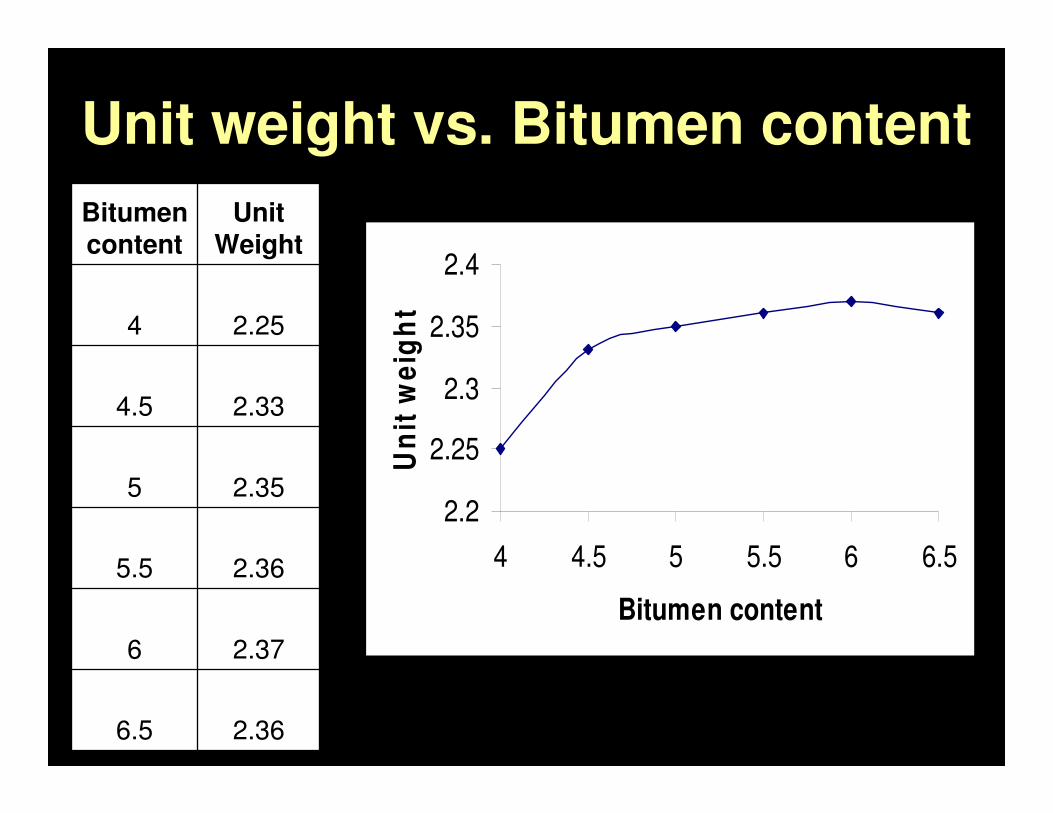
Unit weight vs. Bitumen content
2.366.5
2.376
2.365.5
2.355
2.334.5
2.254
UnitWeight
Bitumencontent
2.24
2.26
2.28
2.3
2.32
2.34
2.36
2.38
0 2 4 6 8
% of Bitumen
Un
it w
eig
ht
2.2
2.25
2.3
2.35
2.4
4 4.5 5 5.5 6 6.5
Bitumen content
Un
it w
eig
ht
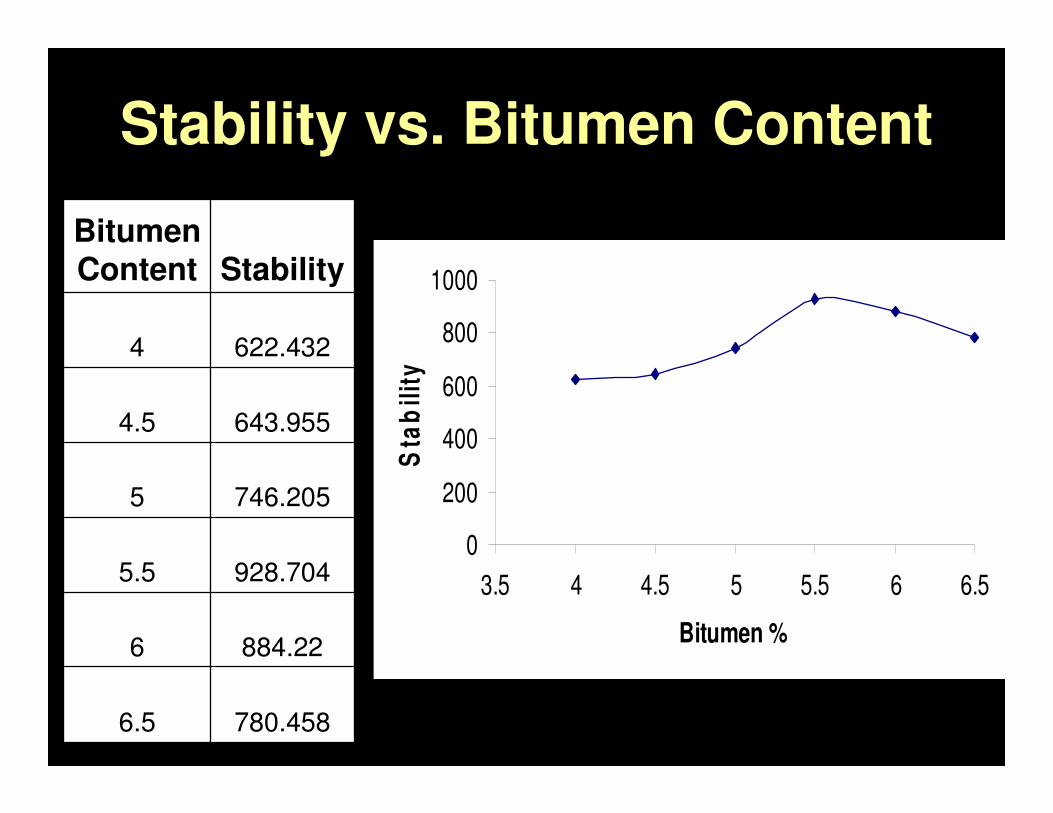
Stability vs. Bitumen Content
780.4586.5
884.226
928.7045.5
746.2055
643.9554.5
622.4324
StabilityBitumenContent
0
200
400
600
800
1000
3.5 4 4.5 5 5.5 6 6.5
Bitumen %
Sta
bil
ity
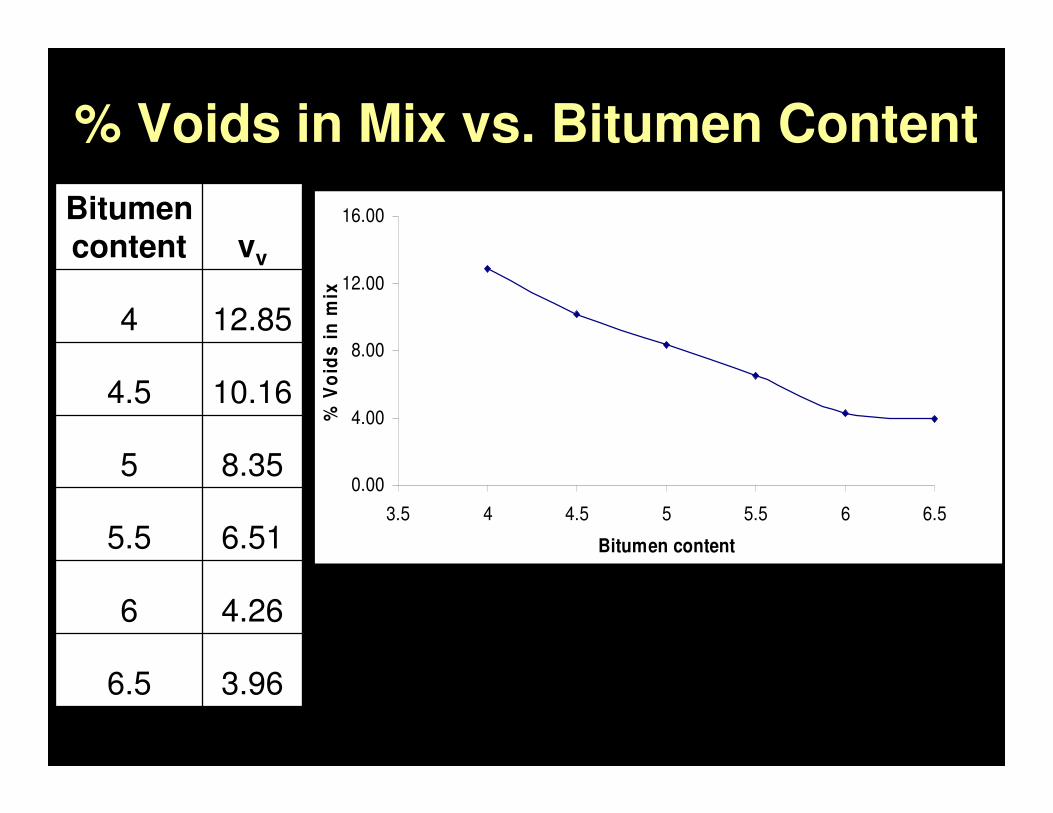
% Voids in Mix vs. Bitumen Content
3.966.5
4.266
6.515.5
8.355
10.164.5
12.854
vv
Bitumencontent
0.00
4.00
8.00
12.00
16.00
3.5 4 4.5 5 5.5 6 6.5
Bitumen content
% V
oid
s i
n m
ix
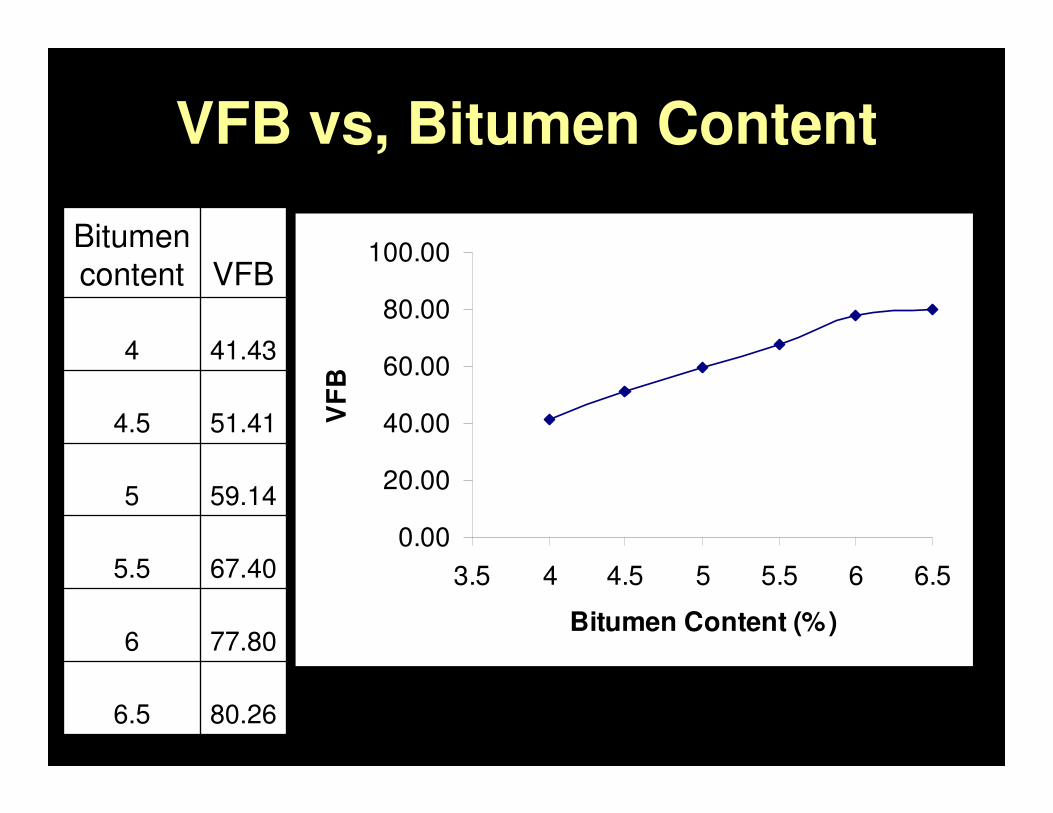
VFB vs, Bitumen Content
80.266.5
77.806
67.405.5
59.145
51.414.5
41.434
VFBBitumencontent
0.00
20.00
40.00
60.00
80.00
100.00
3.5 4 4.5 5 5.5 6 6.5
Bitumen Content (%)
VF
B
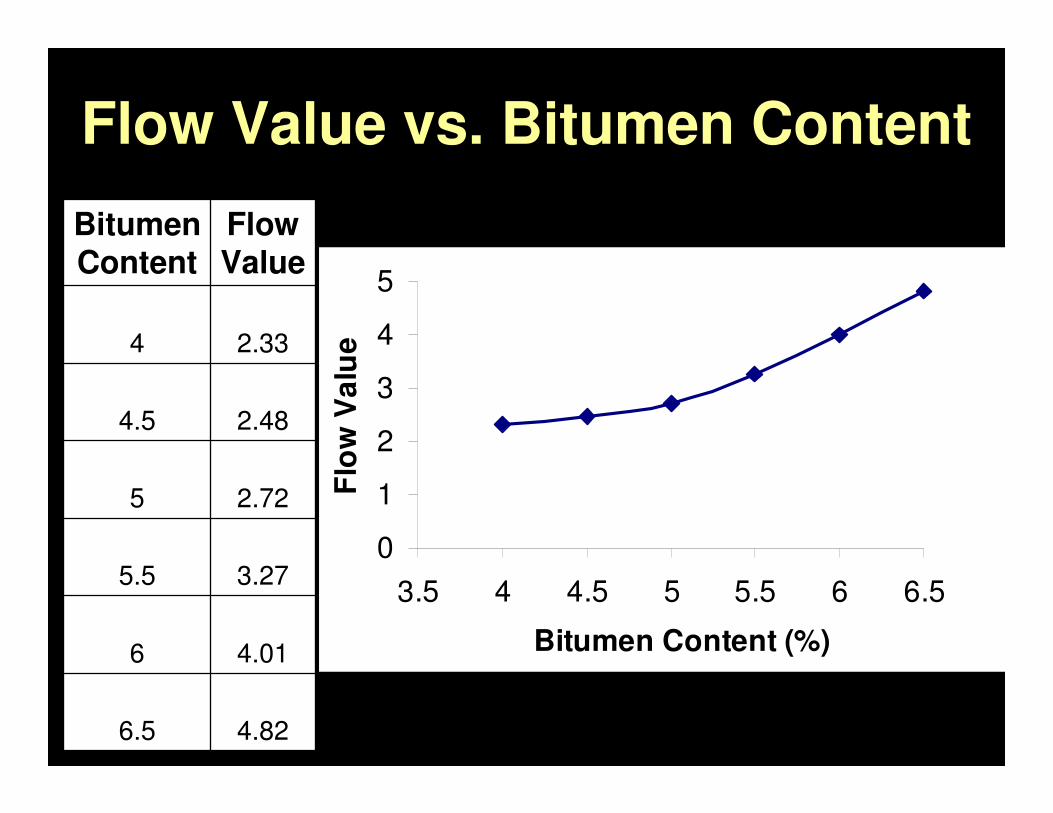
Flow Value vs. Bitumen Content
4.826.5
4.016
3.275.5
2.725
2.484.5
2.334
FlowValue
BitumenContent
0
1
2
3
4
5
3.5 4 4.5 5 5.5 6 6.5
Bitumen Content (%)
Flo
w V
alu
e
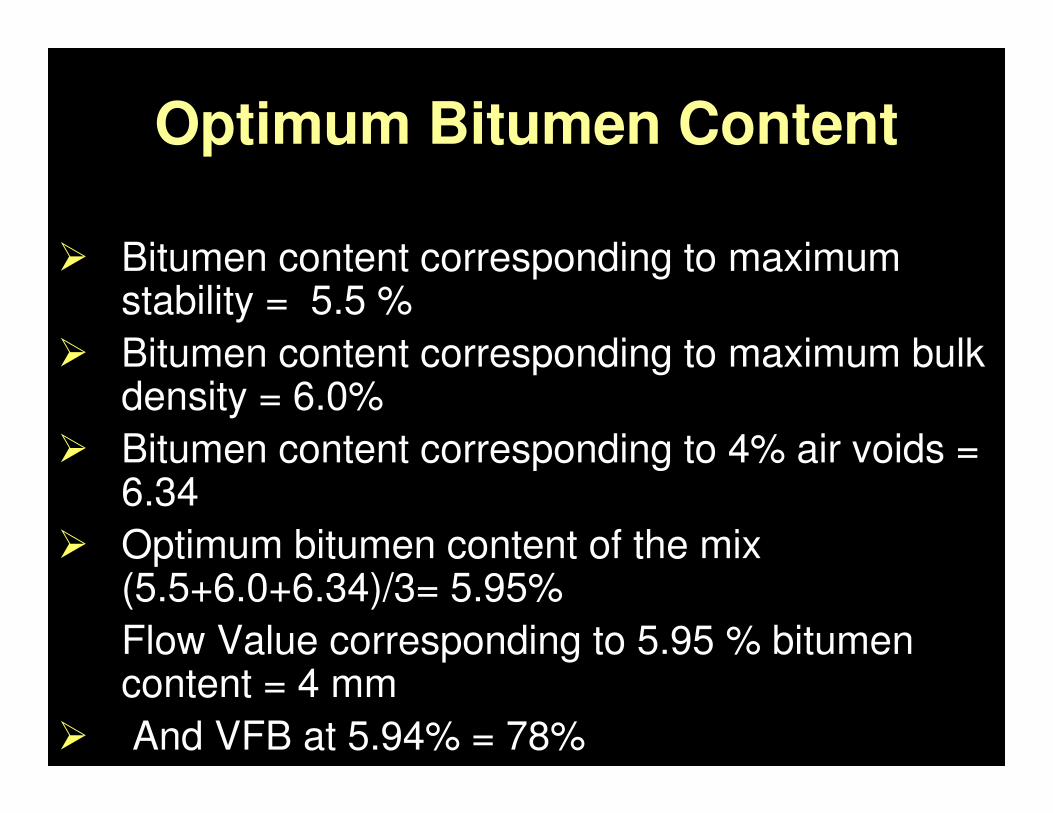
Optimum Bitumen Content
� Bitumen content corresponding to maximum stability = 5.5 %
� Bitumen content corresponding to maximum bulk density = 6.0%
� Bitumen content corresponding to 4% air voids = 6.34
� Optimum bitumen content of the mix (5.5+6.0+6.34)/3= 5.95%
Flow Value corresponding to 5.95 % bitumen content = 4 mm
� And VFB at 5.94% = 78%
Brittle Mixes
�Mixes with very high Marshall stability values and very low Flow values are not desirable as the pavements of such mixes may be brittle and are likely to crack under heavy traffic