Criteria to Mitigate Rudder Overcontrol in Transport Aircraft Rudder/AIAA Rudder Paper.pdf ·...
23
DRAFT Criteria to Mitigate Rudder Overcontrol in Transport Aircraft Roger H. Hoh, Thomas K. Nicoll – Hoh Aeronautics, Inc. Paul Desrochers – Test Pilot, Inc. Atmospheric Flight Mechanics Conf. Portland, OR, July 2011 Nomenclature A i Sum of sine wave amplitude component (ft/s) Y C β Non-dimensional Change in vehicle side force due to change in sideslip (deg -1 ) r Y C δ Non-dimensional Change in vehicle side force due rudder deflection (deg -1 ) F 3σ peak Largest expected vertical stabilizer force from simulation trials (lbs) F bo Pedal force due to pedal breakout (lbs) F bofs Pedal force due to the breakout feel spring (lbs) F cf Pedal force due to Coloumb friction (lbs) F hb Pedal force due to holdback (lbs) F lim Pedal force at maximum pedal displacement (lbs) F ped Force of pilot input measured at the pedal (lbs) F v Force on the vertical stabilizer (lbs) F β-max Maximum force imparted on the vertical stabilizer in accordance (lbs) K SF Sum of sine wave gust gain (na) LI Linearity Index (na) L β Change in vehicle rolling moment due to sideslip (ft-lbs/deg) N i Sum of sine wave number of cycles (cycles) p Body axis roll rate (deg/s) r Body axis yaw rate (deg/s) ROP Rudder overcontrol parameter S Wing planform area (ft2) V CAS Calibrated vehicle airspeed (ft/s or kts) V MC Minimum Controllable Airspeed (ft/s or kts) V T True vehicle airspeed (ft/s or kts) X C Sum of sine wave rolling gust (deg/s) YD A Yaw damper implementation A (na) YD B Yaw damper implementation B (na) YD LIM Yaw damper authority (deg) Y β Change in vehicle side force due to change in sideslip (lbs/deg) Y δr Change in vehicle side force due to rudder deflection (lbs/deg)
Transcript of Criteria to Mitigate Rudder Overcontrol in Transport Aircraft Rudder/AIAA Rudder Paper.pdf ·...
DRAFT
Criteria to Mitigate Rudder Overcontrol in Transport Aircraft Roger H. Hoh, Thomas K. Nicoll – Hoh Aeronautics, Inc.
Paul Desrochers – Test Pilot, Inc. Atmospheric Flight Mechanics Conf. Portland, OR, July 2011
Nomenclature
Ai Sum of sine wave amplitude component (ft/s)
YCβ
Non-dimensional Change in vehicle side force due to change in sideslip (deg-1)
rYCδ
Non-dimensional Change in vehicle side force due rudder deflection (deg-1) F3σ peak Largest expected vertical stabilizer force from simulation trials (lbs) Fbo Pedal force due to pedal breakout (lbs) Fbofs Pedal force due to the breakout feel spring (lbs) Fcf Pedal force due to Coloumb friction (lbs) Fhb Pedal force due to holdback (lbs) Flim Pedal force at maximum pedal displacement (lbs) Fped Force of pilot input measured at the pedal (lbs) Fv Force on the vertical stabilizer (lbs) Fβ-max Maximum force imparted on the vertical stabilizer in accordance (lbs) KSF Sum of sine wave gust gain (na) LI Linearity Index (na) Lβ Change in vehicle rolling moment due to sideslip (ft-lbs/deg) Ni Sum of sine wave number of cycles (cycles) p Body axis roll rate (deg/s) r Body axis yaw rate (deg/s) ROP Rudder overcontrol parameter S Wing planform area (ft2) VCAS Calibrated vehicle airspeed (ft/s or kts) VMC Minimum Controllable Airspeed (ft/s or kts) VT True vehicle airspeed (ft/s or kts) XC Sum of sine wave rolling gust (deg/s) YD A Yaw damper implementation A (na) YD B Yaw damper implementation B (na) YDLIM Yaw damper authority (deg) Yβ Change in vehicle side force due to change in sideslip (lbs/deg) Yδr Change in vehicle side force due to rudder deflection (lbs/deg)
Page 2
β Vehicle sideslip (deg) βss-max Equilibrium sideslip angle at maximum rudder deflection (deg) ΔFEF Excess force on vertical stabilizer over FAA requirement (lbs) δlim Maximum pedal travel measured from detent to pedal stop (in) δped Pedal deflection (in) δr-YD Rudder deflection commanded by the yaw damper (deg) ρ0 Reference free-stream air density (slug/ft3) φo Sum of sine wave phase component (rad or deg) ωi Sum of sine wave frequency component (rad/s or deg/s)
Abstract Key factors are identified that result in increased potential for rudder overcontrol leading to structural failure of the vertical stabilizer in transport aircraft in up-and-away flight. Rudder sizing and travel are typically defined by requirements for minimum controllable airspeeds following an engine failure (VMC), and crosswind limits for takeoff and landing. The rudder authority that results from these requirements can impose excessive loads on the vertical stabilizer at high airspeeds. Therefore, rudder travel is limited as airspeed increases. The method used to limit rudder travel, can have an impact on the tendency to overcontrol, and varies significantly among and within manufacturers. Two piloted simulations were conducted on the NASA Ames Vertical Motion Simulator. The results showed that the primary factor leading to a tendency for rudder overcontrol was short pedal-throw. All other factors were found to be of less significance. Increasing the pedal force did not compensate for short pedal-throw, and nonlinearity in the load-feel curve such as would result from high breakout and low maximum pedal force was not found to be a significant factor for overcontrol. Rudder overcontrol results in very high vertical stabilizer loads only if accompanied by a large sideslip angle. These piloted simulations showed that there is a tendency to achieve slightly higher sideslip angles for configurations with short pedal-throw, but that other factors must be in play to accomplish the magnitude of sideslip that could cause failure of the vertical stabilizer. Preliminary analysis suggests that these factors consist of loss of yaw damper functionality when saturated and high rudder control power in combination with low effective dihedral.
1 Introduction
1.1 Background This work was motivated by the American Airlines Flight 587 accident in November 2001 wherein the vertical stabilizer of an Airbus A300-600 failed during climb at an airspeed of 250 kts resulting in loss of control and a fatal crash. The NTSB attributed the accident as being primarily due to piloted overcontrol of rudder (Reference 1). The accident aircraft encountered a wake vortex just prior to the structural failure. However the NTSB conducted simulations that showed that the aircraft motions that resulted in structural failure were entirely due to the pilot’s control inputs with essentially no effect attributed to the wake vortex itself. That is, the only role of the wake vortex was as a trigger to the overcontrol event.
Page 3
The objective of this program is to identify characteristics of the rudder flight control system that result in a tendency for piloted overcontrol or pilot induced oscillation (PIO) in up-and-away flight and to develop criteria to mitigate such a tendency. The program was accomplished in two piloted simulation sessions on the NASA Ames Vertical Motion Simulator (VMS). The detailed results of these Phase 1 and Phase 2 simulations are given in Reference 2 and Reference 3
Rudder sizing and travel for transport aircraft are typically defined by requirements for minimum controllable airspeeds following an engine failure (VMC), and crosswind limits for takeoff and landing. The design of the rudder flight control system is optimized by airframe manufacturers to provide good handling qualities for these tasks. The rudder authority that results from these considerations can impose excessive loads on the vertical stabilizer at high airspeeds, resulting in a requirement to progressively limit rudder travel as airspeed increases. The method used to limit rudder travel varies significantly among and within manufacturers and has been identified as a potential factor in the tendency to overcontrol (e.g., Reference
respectively.
1).
1.2 Scope Two piloted simulations were conducted on the NASA Ames Vertical Motion Simulator (VMS) to investigate the tendency for rudder overcontrol. The piloting task was representative of up-and-away flight and all pilot subjects were type rated in large transport aircraft.
2 Context of Study Prior to the American Airlines flight 587 accident, pilots were generally trained to minimize the use of the rudder pedals in up-and-away flight. However, some training programs did encourage the use of coordinated aileron and rudder as necessary to recover from an upset.
Subsequent to that accident, all transport pilot training emphasizes that the rudder control should not be used in up-and-away flight. It could therefore be argued that there is no need to develop criteria for rudder overcontrol. The counter-argument is that, in the presence of an uncommanded rolling motion that cannot be quickly arrested with full aileron, the pilot will instinctively use rudder to augment aileron, regardless of training. A recent rudder overcontrol event with an Airbus A319 operating as Air Canada Flight 190 in January of 2008 (Reference 4
This study is based on the position that if a pilot feels compelled to use rudder, the flight control system and aircraft response should have characteristics that are resistant to an overcontrol event that could cause failure of the vertical stabilizer. For these simulations, a series of random-appearing rolling disturbances were developed so that the peak values slightly exceeded the aileron control power. In this environment all of the 20 test subjects felt compelled to use rudder to augment aileron, thereby validating this assumption.
) provides some support for this premise.
3 Rudder Overcontrol The loads on the vertical stabilizer result from a combination of sideslip and rudder deflection as illustrated in Figure 1.
Page 4
β βV V
δr δrRegion of Overcontrol
Force due to rudder deflection,F( r) adds to forcedue to sideslip, F( ).
and r have opposite sign (leads to large| - r|).
δβ
β δβ δ
Force due to rudder deflection, F( r) subtracts from force due to sideslip, F( ).
and r have the same sign (leads to reduced| - r|).
δβ
β δβ δ
Negative rudderdeflection
Positive sideslip
Airspeed VectorAirspeed Vector
Positive sideslip
Positive rudderdeflection
F( r)δF( r)δ
F( )β F( )β
a) Rudder Deflected in Direction to Increase Sideslip
b) Rudder Deflected in Direction to Reduce Sideslip
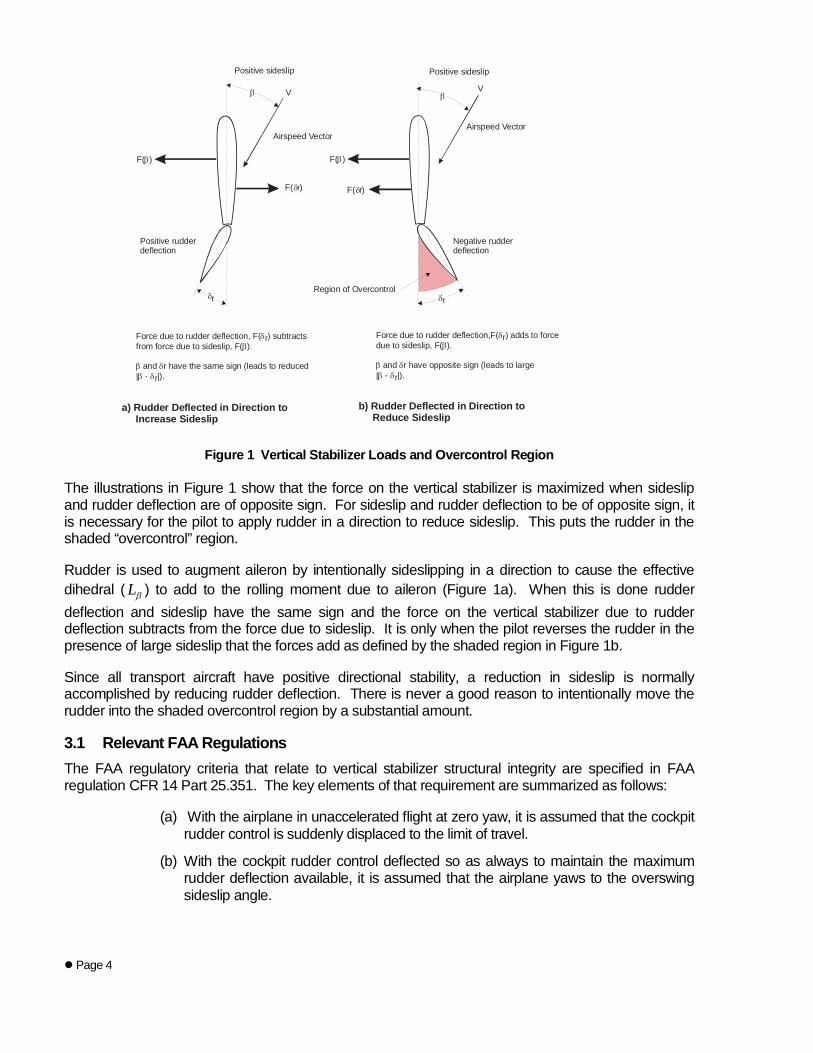
Figure 1 Vertical Stabilizer Loads and Overcontrol Region The illustrations in Figure 1 show that the force on the vertical stabilizer is maximized when sideslip and rudder deflection are of opposite sign. For sideslip and rudder deflection to be of opposite sign, it is necessary for the pilot to apply rudder in a direction to reduce sideslip. This puts the rudder in the shaded “overcontrol” region.
Rudder is used to augment aileron by intentionally sideslipping in a direction to cause the effective dihedral ( Lβ ) to add to the rolling moment due to aileron (Figure 1a). When this is done rudder deflection and sideslip have the same sign and the force on the vertical stabilizer due to rudder deflection subtracts from the force due to sideslip. It is only when the pilot reverses the rudder in the presence of large sideslip that the forces add as defined by the shaded region in Figure 1b.
Since all transport aircraft have positive directional stability, a reduction in sideslip is normally accomplished by reducing rudder deflection. There is never a good reason to intentionally move the rudder into the shaded overcontrol region by a substantial amount.
3.1 Relevant FAA Regulations The FAA regulatory criteria that relate to vertical stabilizer structural integrity are specified in FAA regulation CFR 14 Part 25.351. The key elements of that requirement are summarized as follows:
(a) With the airplane in unaccelerated flight at zero yaw, it is assumed that the cockpit rudder control is suddenly displaced to the limit of travel.
(b) With the cockpit rudder control deflected so as always to maintain the maximum rudder deflection available, it is assumed that the airplane yaws to the overswing sideslip angle.
Page 5
(c) With the airplane yawed to the static equilibrium sideslip angle, it is assumed that the cockpit rudder control is held so as to achieve the maximum rudder deflection available.
(d) With the airplane yawed to the static equilibrium sideslip angle of paragraph (c) of this section, it is assumed that the cockpit rudder control is suddenly returned to neutral.
14 CFR Part 25.351 specifies that the airplane must be design to withstand the loads resulting from the above maneuvers from the minimum control airspeed (VMC) to the maximum dive speed (VD).
14 CFR Part 25.351(d) is normally the most critical input because the forces due to sideslip are always higher than the force due to rudder (for example, see equation 4 below).
The objective of this work is to identify characteristics of the rudder flight control system that make it more likely that rudder usage would result in forces higher than required by CFR 14 Part 25.351(d).
3.2 Vertical Stabilizer Loads The primary loads on the vertical stabilizer are a result of sideslip and rudder deflection.
( )2
2r r
o CASv r Y Y r
S VF Y Y C Cβ δβ δ
ρβ δ β δ≈ + = + (1)
Generic values of aircraft derivatives that are representative of large transport aircraft and a representative wing area (S) is used in equation 3 as follows:
.0211/ deg .00651/ degrY YC and C
β δ≈ − =
( ) 20.034 .01v r CASF Vβ δ= − + (2)
Where sideslip and rudder deflection are in degrees, airspeed is in ft/sec, Fv is in lbs, and sideslip is positive with wind from the right, and rudder deflection is positive trailing edge left (standard NASA sign conventions).
Equation 4 does not provide values for any single aircraft, but does give the correct proportions of force due to sideslip and force due to rudder deflection for a typical transport aircraft. By using this expression for all the tested configurations, it is possible to compare the forces on the vertical stabilizer that result from different rudder flight control system mechanizations.
The force on the vertical stabilizer resulting from the maneuver specified by 14 CFR Part 25.351(d), maxFβ , is defined when sideslip is at its maximum steady-state value, maxssβ , and rudder deflection is
zero. From equation 1,
( )2
max max 2o CAS
Y ssS VF C
ββρβ= (3)
If the rudder structure is designed in accordance with 25.351(d), forces exceeding maxFβ will result in exceedance of the limit load on the vertical stabilizer. This excess stabilizer force is expressed as a percentage over the limit load as follows.
Page 6
3
max
1 100peakEF
FF
Fσ
β
∆ = −
(4)
Where 3 peakF σ is defined as the largest expected force on the vertical stabilizer.
Note that if a vertical stabilizer structure is designed so that the design limit load is defined by maxFβ ,
the ultimate load (1.5 times the limit load) would be defined when 50%EFF∆ = . Forces above maxFβ can only occur if the rudder enters the shaded overcontrol region in Figure 1 in the presence of significant sideslip.
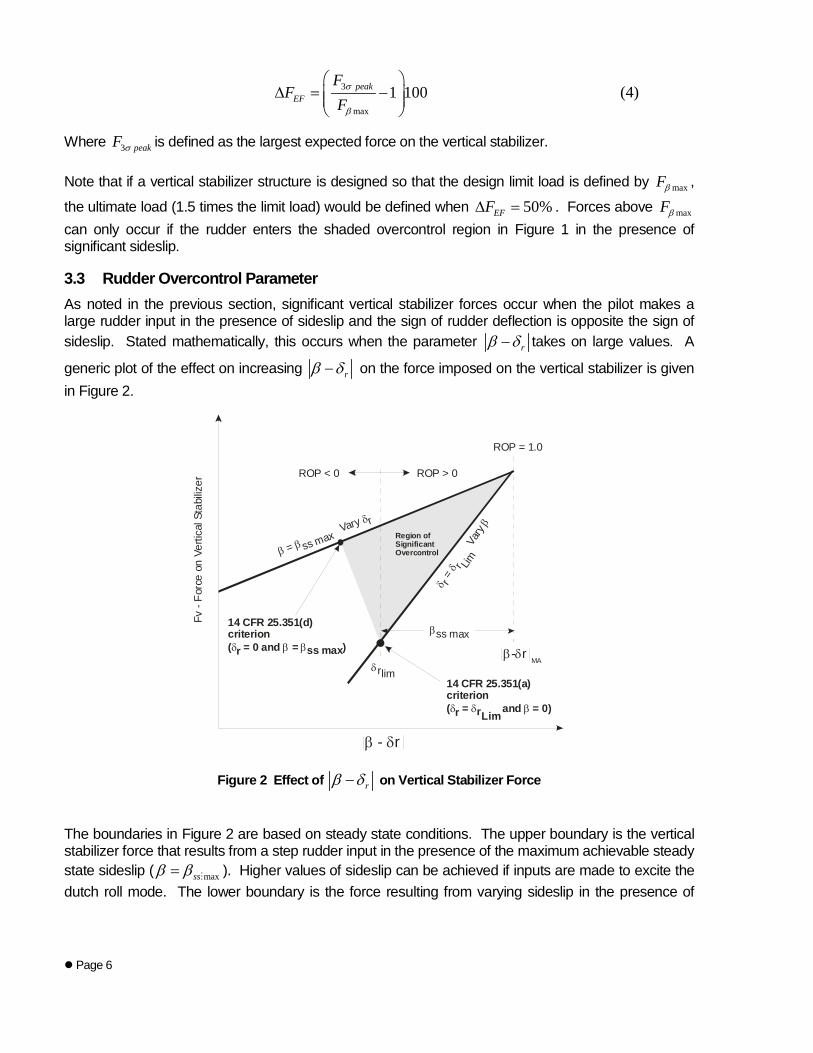
3.3 Rudder Overcontrol Parameter As noted in the previous section, significant vertical stabilizer forces occur when the pilot makes a large rudder input in the presence of sideslip and the sign of rudder deflection is opposite the sign of sideslip. Stated mathematically, this occurs when the parameter rβ δ− takes on large values. A
generic plot of the effect on increasing rβ δ− on the force imposed on the vertical stabilizer is given in Figure 2.
β δ- r
δrlim
β β
δ
= ss max Vary r
βss max
δδ
β
r = r Lim
Var
y
β δ- rMA
Fv -
Forc
e on
Ver
tical
Sta
biliz
er
Region ofSignificantOvercontrol
ROP > 0
ROP = 1.0
ROP < 0
14 CFR 25.351(d)criterion( r = 0 and = ss max)δ β β
14 CFR 25.351(a)criterion( r = rLim
and = 0)δ δ β
Figure 2 Effect of rβ δ− on Vertical Stabilizer Force
The boundaries in Figure 2 are based on steady state conditions. The upper boundary is the vertical stabilizer force that results from a step rudder input in the presence of the maximum achievable steady state sideslip ( maxssβ β=
). Higher values of sideslip can be achieved if inputs are made to excite the dutch roll mode. The lower boundary is the force resulting from varying sideslip in the presence of
Page 7
maximum rudder deflection ( r Limδ ). The curves intersect when rβ δ− is at its maximum achievable
value r MAβ δ− (defined when maxss r r LIMandβ β δ δ= = and rsign signβ δ≠ ).
The CFR 14 Part 25 351(d) criterion plots at a point on the upper boundary where the steady sideslip is maximum and the rudder deflection is zero, and the Part 25.351(a) criterion plots at a point on the lower boundary where rudder deflection is maximum and sideslip is zero.
The possibility for high vertical stabilizer loads is seen to increase significantly when the terms in
rβ δ− are of opposite sign (i.e., are additive) - shown as the shaded region in Figure 1 and Figure 2.
Note that for a given value of rβ δ− , the force on the vertical stabilizer is highest when sideslip is the dominant contributor (upper boundary in Figure 2).
The region of rudder overcontrol is well approximated by values of rβ δ− greater than r Limδ (see
Figure 2). The tendency for rudder reversals that result in limr rβ δ δ− ≥ may be quantified by positive values of a rudder overcontrol parameter, ROP that is defined as:
3 3
max
r r Lim r r Limpeak peak
r r Lim ssMA
ROP σ σβ δ δ β δ δ
β δ δ β
− − − −= =
− − (5)
3r peakσβ δ− is defined as the maximum expected value of rβ δ− , and r MA
β δ− is defined when
maxss r r LIMandβ β δ δ= = and rsign signβ δ≠ (see Figure 2).
ROP is normalized by the condition where sideslip and rudder are at their maximum achievable values without dynamic overshoot. This is done to minimize the effect of rudder control power so that ROP is primarily a measure of the tendency for rudder reversals into the overcontrol region in Figure 2.
The following connections may be established between ROP and rudder overcontrol events:
ROP > 0
For small sideslip: The force on the vertical stabilizer is equal to or greater than can be achieved with rudder alone (i.e. greater than specified by 14 CFR Part 25.351(a)).
For large sideslip: The force on the vertical stabilizer is greater than can be achieved at maximum sideslip and zero rudder deflection (i.e. greater than specified by 14 CFR Part 25.351(d))
ROP = 1 The maximum force that can be achieved at steady sideslip. Accomplished by achieving the maximum steady sideslip with full rudder and rapidly reversing the rudder to the opposite limit.
ROP > 1 Forces exceed what can be achieved at steady sideslip – indicates rudder reversal at a sideslip angle greater than can be achieved in steady state.
Page 8
3r peakσβ δ− was calculated from the simulation data as follows:
1. Identify and store the peak (maximum) value of vertical stabilizer force ( r peakβ δ− ) for
a group of runs that is under study, e.g., for all runs where lim 60F lbs= and
max1.2pedδ = inches.
2. Calculate the average r peakβ δ− for all runs from step 1.
3. Calculate the standard deviation of r peakβ δ− for all runs
4. Finally, ( )33*r r rpeak avg peak peak
std devσ
β δ β δ β δ− = − + −
It is shown in Reference 3 that the r peakβ δ− data from the simulation is well described by a normal
distribution and therefore using the 3σ value is a reasonable estimate of the maximum expected value.
The intent of the rudder overcontrol criterion is to provide a metric to distinguish between rudder control systems that are prone to overcontrol from those that are not. Note that it is possible to experience rudder deflections in the region of overcontrol without exerting exceptional forces on vertical stabilizer if sideslip is low when the rudder is over controlled (lower portion of shaded region in Figure 2). Therefore ROP can be quite large without experiencing excessive vertical stabilizer load. Values of ROP greater than zero indicate a tendency to overcontrol, and it is conceptually just a matter of time until such an excursion will occur in the presence of large sideslip.
4 Design of Experiment
4.1 Feel System Definitions Rudder flight control system definitions used in this study are shown in Figure 3.
Page 9
.
-2 -1.5 -1 -0.5 0 0.5 1 1.5 2-40
-30
-20
-10
0
10
20
30
40
Ped
al F
orce
, Fpe
d (lb
s)
δ lim
Flim
Pedal Deflection, ped (inches)δ
2FcfFbo = Fbofs + Fcf
-Fbo = -(Fbofs + Fcf)
Fhb = Fbofs - Fcf-Fhb = -(Fbofs - Fcf )
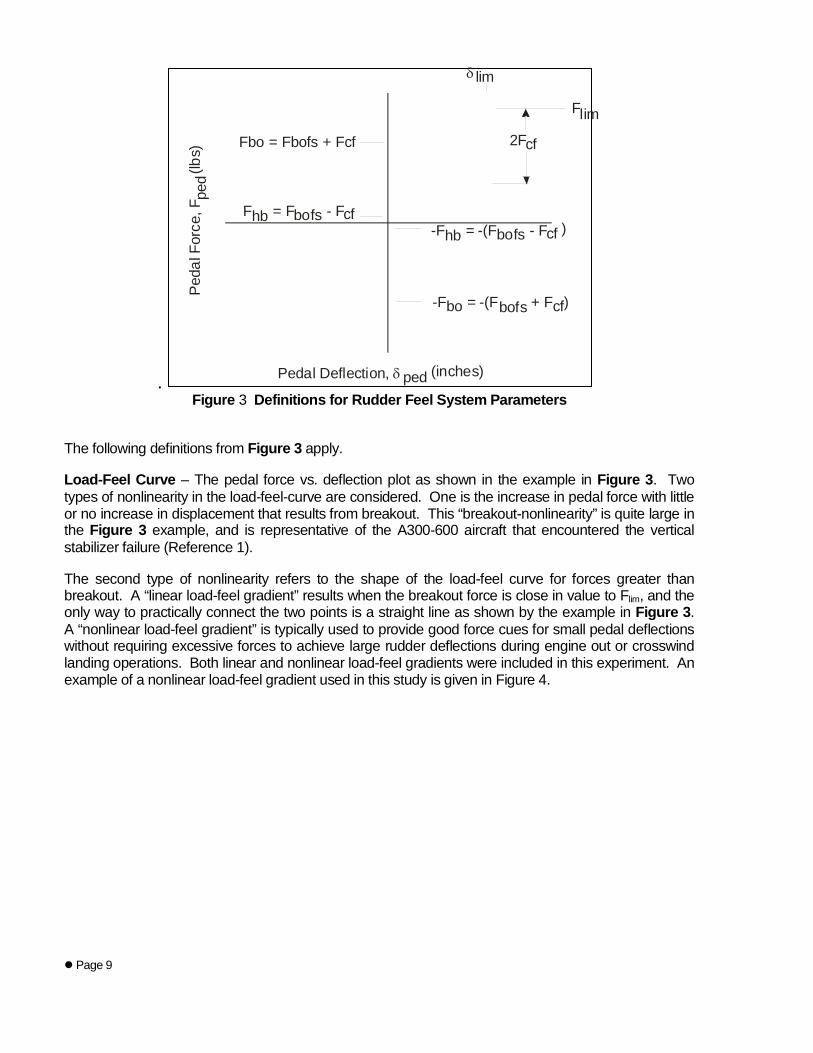
Figure 3 Definitions for Rudder Feel System Parameters
The following definitions from Figure 3 apply.
Load-Feel Curve – The pedal force vs. deflection plot as shown in the example in Figure 3. Two types of nonlinearity in the load-feel-curve are considered. One is the increase in pedal force with little or no increase in displacement that results from breakout. This “breakout-nonlinearity” is quite large in the Figure 3 example, and is representative of the A300-600 aircraft that encountered the vertical stabilizer failure (Reference 1).
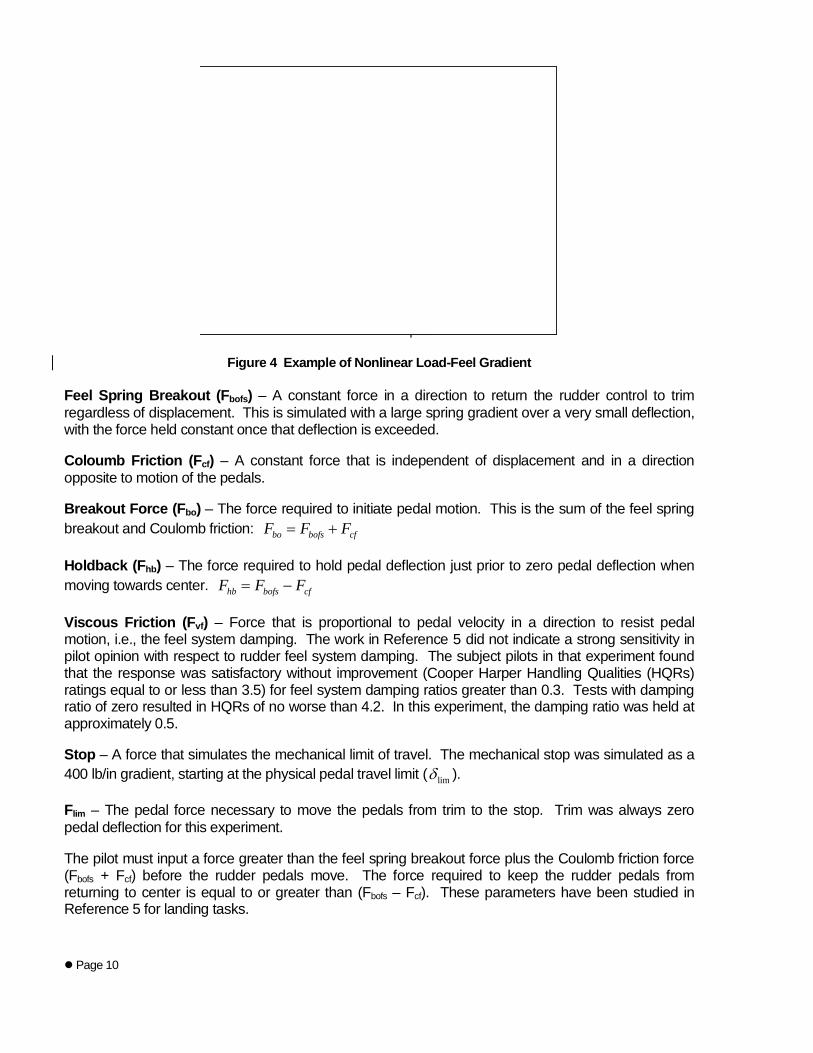
The second type of nonlinearity refers to the shape of the load-feel curve for forces greater than breakout. A “linear load-feel gradient” results when the breakout force is close in value to Flim, and the only way to practically connect the two points is a straight line as shown by the example in Figure 3. A “nonlinear load-feel gradient” is typically used to provide good force cues for small pedal deflections without requiring excessive forces to achieve large rudder deflections during engine out or crosswind landing operations. Both linear and nonlinear load-feel gradients were included in this experiment. An example of a nonlinear load-feel gradient used in this study is given in Figure 4.
Page 10
Ped
al F
orce
, Fpe
d (lb
s)
Pedal Deflection, ped (inches)δ-3 -2 -1 0 1 2 3
-80
-60
-40
-20
0
20
40
60
80
Figure 4 Example of Nonlinear Load-Feel Gradient Feel Spring Breakout (Fbofs) – A constant force in a direction to return the rudder control to trim regardless of displacement. This is simulated with a large spring gradient over a very small deflection, with the force held constant once that deflection is exceeded.
Coloumb Friction (Fcf) – A constant force that is independent of displacement and in a direction opposite to motion of the pedals.
Breakout Force (Fbo) – The force required to initiate pedal motion. This is the sum of the feel spring breakout and Coulomb friction: bo bofs cfF F F= +
Holdback (Fhb) – The force required to hold pedal deflection just prior to zero pedal deflection when moving towards center. hb bofs cfF F F= −
Viscous Friction (Fvf) – Force that is proportional to pedal velocity in a direction to resist pedal motion, i.e., the feel system damping. The work in Reference 5
Stop – A force that simulates the mechanical limit of travel. The mechanical stop was simulated as a 400 lb/in gradient, starting at the physical pedal travel limit (
did not indicate a strong sensitivity in pilot opinion with respect to rudder feel system damping. The subject pilots in that experiment found that the response was satisfactory without improvement (Cooper Harper Handling Qualities (HQRs) ratings equal to or less than 3.5) for feel system damping ratios greater than 0.3. Tests with damping ratio of zero resulted in HQRs of no worse than 4.2. In this experiment, the damping ratio was held at approximately 0.5.
limδ ).
Flim – The pedal force necessary to move the pedals from trim to the stop. Trim was always zero pedal deflection for this experiment.
The pilot must input a force greater than the feel spring breakout force plus the Coulomb friction force (Fbofs + Fcf) before the rudder pedals move. The force required to keep the rudder pedals from returning to center is equal to or greater than (Fbofs – Fcf). These parameters have been studied in Reference 5 for landing tasks.
Page 11
4.2 Rudder Limiters Three generic rudder flight control system limiting strategies were employed in this study: Variable gearing, variable stop, and force limit. These are described below and in more detail in Reference 3.
The rudder pedals and rudder surface are mechanically limited as a function of airspeed. The control gearing between rudder surface and rudder pedal remains constant. This results in short pedal travel as airspeed is increased. This design was used to simulate all configurations where the pedal travel was limited to less than 3.5 inches.
Variable Stop
Reduced rudder surface travel at high airspeeds is achieved by decreasing the gearing between the pedals and the rudder as airspeed is increased. This design was employed to simulate the configurations with 3.5 inch (long pedal-throw) configurations.
Variable Gearing
The rudder travel is limited so as to not exceed a defined value of sensed rudder hinge moment. This configuration was investigated in Phase 1 where it was found to be surprisingly resistant to overcontrol. Due to time limitations this mechanization was not studied in Phase 2.
Force Limit
4.3 Experimental Variables The objective of the Phase 2 piloted simulation was to accomplish a systematic variation of the parameters that define the rudder feel system at up-and-away flight conditions. These are: limit force, breakout force, and maximum pedal-throw (Flim, Fbo, and δlim). The baseline testing consisted of three values of pedal travel (1.2, 2.4, and 3.5 inches), two values of limit force (35 lbs and 65 lbs) and 7 values of breakout between 4 and 45 lbs.
The effects of increased rudder control power and implementation of the yaw damper were also studied. Increased rudder control power was simulated by increasing the maximum rudder travel from a nominal 9o to 120.
Large values of breakout nonlinearity (i.e., large lim/boF F ) are known to produce tendencies for degraded handling qualities and pilot induced oscillations (PIO) for closed loop tracking tasks. Reference 6
1
identified feel system nonlinearity as a likely source of the A300-600 rudder overcontrol in terms of a linearity index, and focused exclusively on breakout nonlinearity (the load-feel gradients were linear in that study). The NTSB report of the A300-600 vertical stabilizer failure (Reference ) identified large values lim/boF F as a potential factor that may have contributed to the fatal overcontrol. Finally, the initial results obtained in Phase 1 of these tests seemed to indicate that the tendency for rudder overcontrol might be correlated with lim/boF F . Based on this evidence, the Phase 2 simulation was oriented toward a systematic variation of lim/boF F from low to high values. The tested values of
lim/boF F were constrained to be within a range known to provide acceptable handling qualities for tasks such as crosswind landings and engine-out yaw control. Such limits were obtained from the piloted simulator study reported in Reference 5.
Page 12
The achievable values of lim/boF F are limited by the holdback force, hbF , which is calculated as: 2hb bo cfF F F= − , where cfF is the coulomb friction force. A holdback force of 2 lbs was used for most
of the configurations, because it allowed the maximum variation in lim/boF F for a given limF . Physically, the holdback force is the force that exists when returning the pedals to neutral, just prior to the pedals being centered.
The Reference 5 rudder study showed that values of holdback between 0 and 8 lbs were acceptable. A brief study of the effect of holdback was conducted with some of the subject pilots. Those pilots did not feel that the difference between 2 lbs and 8 lbs of holdback was significant (see more detailed results in Reference 5).
The coulomb friction force ( cfF ) and the feel spring breakout force ( fsboF ) were calculated as a
function of the total breakout force ( boF ) and the holdback force ( hbF ) as follows.
(6)
The holdback force was set to 2 lbs unless otherwise noted.
The breakout force was varied to values as high as 45 lbs. This was done to achieve large values of lim/boF F when the limit force was 60 lbs. Values of breakout above 28 lbs may not be certifiable for
precision rudder tasks such as crosswind landings based on the results of the Reference 5 rudder study that showed Cooper-Harper handling qualities ratings (HQR) of greater than 5 when breakout was above 28 lbs1
The full test matrix used in the Phase 2 simulation is given Reference
. Nonetheless, the test matrix included breakout values of 35 lbs and 45 lbs as a means to investigate trends for all combinations of limit force and maximum pedal travel.
3. The configuration designation used in this study is (Flim-Fbo-δlim), where maximum pedal deflection is rounded down. For example, a configuration with a limit force of 35 lbs, a breakout of 10 lbs, and a maximum pedal travel of 1.2 inches is indicated by (35-10-1). The three major areas of study were baseline configurations, control power variation, and yaw damper variation. Most of the runs were made to populate the baseline configurations.
To summarize, the experimental variables for the Phase 2 simulation were:
• Baseline configurations – 27 configurations – Pedal travel 1.2, 2.4, and 3.5 inches – Maximum pedal forces, 35 and 65 lbs – Breakout – from 4 to 45 lbs – Holdback nominally 2 lbs but also tested 8 lbs
• Rudder control power – Maximum travel: 9 and 12 deg – 11 high control power configurations
• Yaw Damper – before and after rudder limit • No variation in aircraft dynamics - generic transport (like B767)
1 The results of the Phase 1 simulation (Reference 2) showed that the probability of certification
is less than 50% for HQR > 5.
2 2bo hb bo hb
cf fsboF F F FF F− +
= =
Page 13
There were 11 pilot subjects in Phase 2, and each pilot flew each configuration at least 3 times. The pilot was requested to move the pedals full travel in each direction prior to the run to become familiar with the feel system characteristics.
The configurations were presented in random order and the pilot was required to rate the configuration after only one run. This is contrary to conventional wisdom for handling qualities experiments where it is known that at least three trials are required for the pilot to adapt to a new configuration. In a rudder overcontrol scenario, the pilot is “plowing new ground” in that there is no training for this, and most airline pilots fly an entire career without ever moving the rudders full travel in up-and-away flight. The lack of time to adapt to the configuration may in fact a key element of an overcontrol event.
4.4 Pilot Task A lateral disturbance profile was developed that required the pilot to use rudder to augment aileron in order to keep the wings near level and the aircraft on a constant heading ± 10o. The disturbance consisted of a random appearing sum of sine waves that had the appearance of rolling gusts such as might occur in a wake vortex upset. The magnitude of the inputs was set to momentarily exceed lateral control power during the peaks of the disturbance. This was done to require the subject pilots to use rudder to compensate for the lack of aileron control power. One subject pilot attempted to fly the task with aileron alone in accordance with currently accepted pilot technique, and noted that this was not possible. He noted that his technique was to avoid use of rudder until absolutely necessary. Most pilots noted that the disturbance input had the appearance of rolling gusts such as might occur in a wake vortex upset, except that it lasted longer than a typical wake vortex encounter (approximately one minute).
The equation for the sum of sine-wave inputs used in the simulations is given as follows.
01
sin( )n
C SF i ii
X K A tω φ=
= +∑ (7)
Where n = 7 and the values for frequency and amplitude of the input sine-waves for each of the tasks are given in Reference 3.
KSF is a scale factor to allow adjustment of the magnitude of all the input sine-waves simultaneously. This was varied empirically during the simulator checkout with the result that the scale factor for the roll task was set to 1.0. All efforts were made to keep the simulator motion gains as high as possible.
The phase angle, oφ , and the sign of KSF were varied from run-to-run to maximize the random appearance of the disturbance.
The task is illustrated by the diagram in Figure 5
Page 14
pilot
rudderfeelsystem
aircraftdynamics
δ rcom
++
+-
δped
δ rYD
δ rYfr
Ypφ
Ycf
Yfaaileronfeelsystem
φc = 0 δwδa φ
Yawdamper
aypilot
to motion
pgust
(rolling gusts)
Figure 5 Pilot-in-the-Loop Representation of Roll Task
There was no attempt to simulate an actual wake vortex encounter with the roll tracking task. However, all pilots agreed that the task was a realistic simulation of a wake vortex upset. The pilots were briefed that this was not a roll control study, and that the focus was on rudder control. They were asked to focus on the use of rudder to augment roll control when assigning subjective pilot ratings.
All runs were made at a nominal airspeed of 250 KIAS and an altitude of 2000 ft in VMC conditions.
The simulated aircraft consisted of a generic transport model that existed at the NASA Ames Research Center simulation facility. That model was used in research studies involving transport aircraft, and was well accepted by the subject pilots as a realistic simulation. Several pilots with transport aircraft experience flew the model during checkout for the present study, and all agreed that it was representative of a medium sized twin engine transport aircraft at the test flight condition. The test flight condition consisted of cruise flight at 250 KIAS at 2000 ft altitude. This flight condition was similar to what existed when the Airbus A-300-600 vertical stabilizer failed.
4.5 Simulator The piloted simulation was accomplished on the NASA Ames Research Center Vertical Motion Simulator (VMS). The VMS is a six degree of freedom motion base simulator with a lateral travel of 40 ft. For this simulation, the cab initial condition was close to the center of the lateral travel thereby providing ± 20 ft of lateral travel during the runs. Vertical travel was ± 30 ft. and longitudinal travel was ± 4 ft.
The VMS simulator was used based on the results of the Phase 1 study (Reference 2) that showed better correlation with pilot opinion with full VMS lateral motion, than with motion that was produced by simulating a hexapod motion system. However, the quantitative data from Phase 1 showed that the pilot’s tracking behavior did not vary between small and large lateral motion. This included pilot describing functions derived from a closed-loop sideslip tracking task (see Reference 2 for details).
Standard transport cockpit flight controls were provided in the simulator cab, consisting of a transport style yoke with maximum travel of ± 90 deg and rudder pedals with a maximum travel of ± 3.5 inches. Throttles were consistent with a twin–engine transport aircraft.
Page 15
5 Results
5.1 Pedal Travel and Breakout The basic hypothesis of the Phase 2 simulation test plan was that rudder overcontrol is strongly dependent on magnitude of the “breakout nonlinearity” of the load-feel curve (e.g., Figure 3). A simple measure of the breakout nonlinearity is the breakout force divided by the limit force, lim/boF F .
Hess in Reference 6 proposed a Linearity Index parameter (LI) as a measure of the breakout-nonlinearity of the load-feel curve. It is shown in Reference 3 that LI is very well approximated by
lim1 /boLI F F≈ − .
The results of the Phase 2 simulation in terms of lim/boF F and the value of ROP taken as an average across all pilots for each baseline configuration are plotted in Figure 6.
0.20
0.40
0.60
0.80
0.00 0.20 0.40 0.60 0.80
Rud
der O
verc
ontr
ol P
aram
eter
, RO
P
Fbo/Flim
35-XX-1
35-XX-2
35-XX-3
60-XX-1
60-XX-2
60-XX-3
All Pilots: Std Dev |β-δr|Peak = 1.18 deg (N = 1014)
Figure 6 Rudder Overcontrol Parameter as a Function of lim/boF F for Baseline Configurations
These results are based on the use of a standard deviation of 1.18 deg to calculate 3r peakσ
β δ− to
calculate ROP (Equation (5)). As noted earlier, the calculation of the standard deviation of rβ δ− is based on all runs for all configurations in the test matrix.
The baseline data were plotted vs. the Reference 6 Linearity Index and, as expected, show identical results as shown in Figure 6 when the data is plotted vs. lim(1 / )boF F− .
Each configuration was run an average of 22 times with each pilot nominally evaluating three randomly inserted repeat runs for each configuration. The minimum number of runs for a given configuration was 20 and the maximum was 38. This is judged to be a significantly large sample to provide reliable trends.
Page 16
The most significant finding from the data in Figure 6 is that the tendency to overcontrol with rudder is primarily dependent on rudder pedal travel. The 3.5 inch “long pedal-throw” configurations (circle symbols) were consistently and significantly less prone to overcontrol than the 1.2 inch “short pedal-throw” configurations (diamond symbols).
Other conclusions from the Figure 6 data are:
• The configurations with high limit force, long throw, and lim/boF F between 0.25 and 0.42 (60-15-3 and 60-25-3) exhibited the lowest values of ROP indicating a strong resistance to rudder overcontrol.
• Increasing the pedal limit force did not significantly alleviate the tendency for overcontrol for the short throw configurations (compare open and filled diamonds).
• The ratio of lim/boF F had little effect on the tendency for overcontrol with the following exceptions.
o A significant decrease in ROP occurred when lim/boF F was set equal to 0.25 for the short pedal-throw configuration 60-15-1. This seemingly anomalous trend was noticed during the simulation and extra runs were made to determine if this effect was real. A total of 23 runs with a standard deviation of 1.1o suggests that this was not a random effect. This was the only case where a reduction in
lim/boF F resulted in a large and beneficial effect on ROP (albeit, not as good as increasing the travel to 3.5 inches).
o Decreasing the breakout to 5 lbs ( lim/ 0.10boF F < ) resulted in a noticeable increase in ROP for some configurations. The pilot’s complained of a “mushy feel” for this low value of breakout. This result suggests that there is a minimum value of breakout to ensure that ROP is minimized.
o A slight increase in ROP resulted from increasing lim/boF F to values greater than 0.42 for the long throw (3.5 inch) configurations.
The lack of correlation between ROP and lim/boF F suggests that rudder usage in the simulated environment is not accomplished as a closed loop tracking task. It is more likely that rudder is employed as an open-loop crossfeed (as illustrated in Figure 5), which is consistent with the idea the rudder is being used to augment aileron control power. Given that overcontrol is not a result of closed loop tracking task, the possibility that a pilot induced oscillation (PIO) is the root cause is eliminated. This was further verified by running a sideslip tracking task with rudder as part of the Phase 1 piloted simulation. Even for this closed-loop rudder tracking task, there was no evidence of a resonant peak in the derived pilot transfer functions in any of the configurations, such as would exist if there were a tendency for PIO (see Reference 2).
5.2 Excess Force on Vertical Stabilizer Rudder overcontrol is hazardous only to the extent that it results in excessive force on the vertical stabilizer beyond the limits for which it was designed. This is represented by the parameter
EFF∆ (Equation (4)).
Page 17
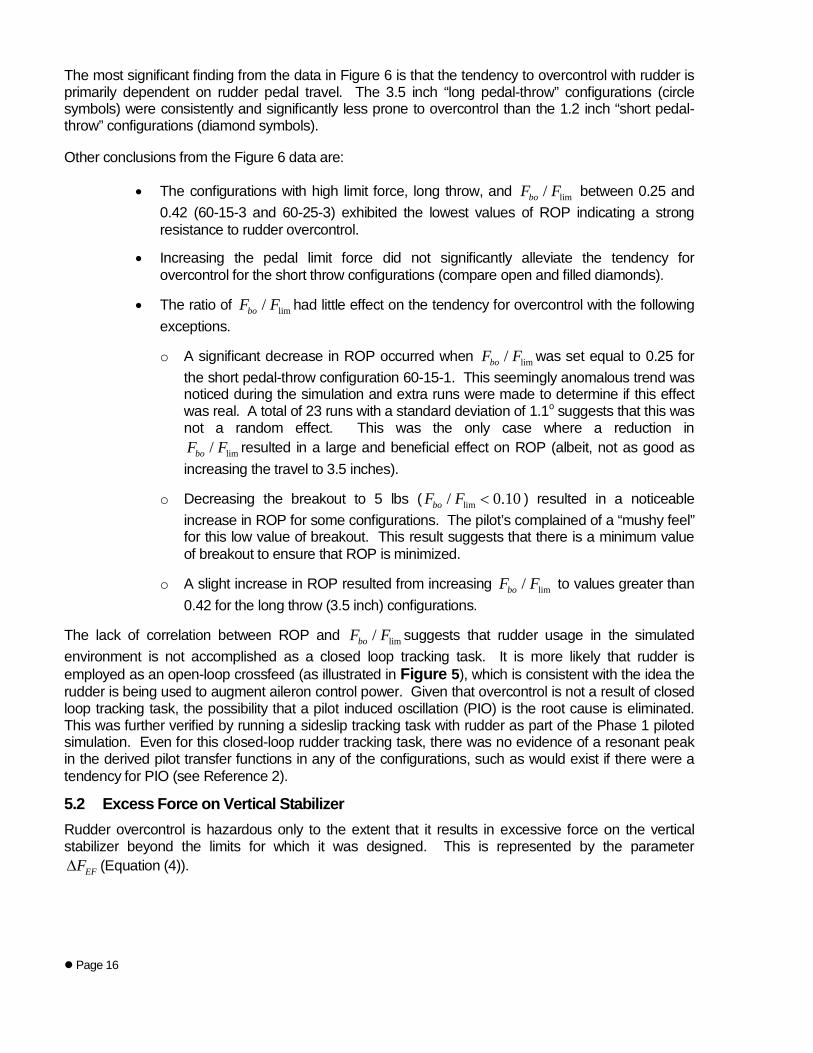
EFF∆ was calculated by averaging v peakF across all pilots and configurations at each of the three tested pedal displacements. The excess vertical stabilizer force is plotted vs. the maximum pedal throw in Figure 7.
0
5
10
15
20
25
0 1 2 3 4
ΔFE
F(%
)
Maximum Pedal Displacement, δP-LIM (in)
35-XX-X
60-XX-X
Figure 7 Excess Vertical Stabilizer Force vs. Pedal-Throw These data indicate that EFF∆ exhibits the same trend as ROP in that the short pedal-throw configurations are more prone to high vertical stabilizer loads, and pedal force plays a less significant role.
The worst-case configuration (short pedal-throw and low force) exceeded the 14CFR part 25.351(d) criterion on average by 21% and the best configuration (long pedal-throw and high force) exceeded the criterion by 8%. That is, all the configurations exceeded the criterion limit, but the short pedal-throw configurations were prone to a significantly higher exceedance.
To put these results in context, a full rudder reversal from a maximum steady sideslip conditions would result in EFF∆ = 50%.
The A300-600 accident aircraft vertical stabilizer failed with. 10 , 11 , 250o o
r and Airspeed ktsβ δ= = − = 2
maxFβ
. Substituting these values into the estimated vertical stabilizer force equation (Equation (2)) results in a force on the vertical stabilizer of 80,327 lbs. The CFR 14 Part 25.351(d) limit ( ) is calculated from equation (2) by setting
4.4 , 0 , 250o or and Airspeed ktsβ δ= = = , resulting in a value of 26,705 lbs. Therefore the
estimated value of EFF∆ at the point of failure was 200%. This is an order of magnitude greater than what was experienced in the Phase 1 or Phase 2 VMS simulations.
2 It is not known why the flight data recorder showed a rudder deflection of -11o when the rudder should
have been mechanically limited to 9o based on the data in Reference 1.
Page 18
As will be discussed in Section 5.5, the less than expected vertical stabilizer loads encountered in the simulation are due to the fact that sideslip excursions were much less than was seen in the accident scenario. Note from equation (2) and Figure 2 that sideslip is the major contributor to vertical stabilizer force. 5.3 Rudder Control Power The effect of increased control power was investigated by increasing the rudder authority from 9o to 12o degrees for some runs.
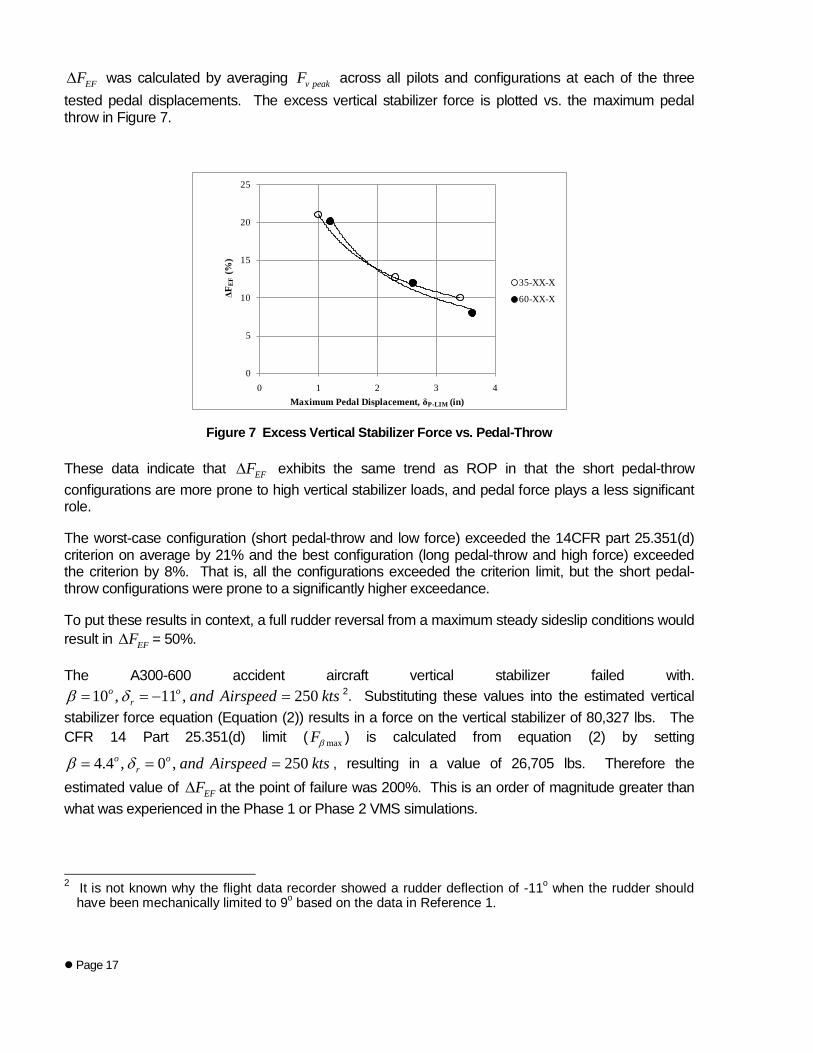
The effect of increased control power on excess force on the vertical stabilizer and the rudder overcontrol parameter is shown in Figure 8.
-40.0
-30.0
-20.0
-10.0
0.0
10.0
20.0
30.0
-0.60 -0.40 -0.20 0.00 0.20 0.40 0.60 0.80 1.00
ΔFEF (%)
Rudder Overcontrol Parameter - ROP
δr-LIM = 9 degδr-LIM = 12 deg
All Pilots: Std Dev |Fv|Peak = 3975 lbs (N = 1014)Std Dev |β-δr|Peak = 1.18 deg (N = 1014)
Figure 8 Effect of Rudder Control Power
These results indicate that there is less tendency for overcontrol and therefore lower excess force on the vertical stabilizer for larger values of rudder control power. This is due to two factors:
1. The 14 CFR Part 25.351(d) normalizing force ( maxFβ ) is higher by virtue of the fact that larger steady sideslip angles can be achieved.
2. The pilots were able to achieve the desired effect of augmenting aileron with less rudder input.
These results should not be interpreted to mean that increased rudder control power is desirable because the increase in maxFβ that goes with increased authority translates into a requirement for increased structural strength and therefore increased weight.
Page 19
5.4 Yaw Damper Implementation A yaw damper with conventional lateral acceleration, yaw rate, and bank angle feedback was implemented as representative of most transport aircraft. The response of the simulated aircraft to rudder doublets with yaw damper engaged was deadbeat, and there was very little sideslip contamination during aileron-only turns. The yaw damper output was limited to ± 3o. Details of the yaw damper implementation are given in Reference 3.
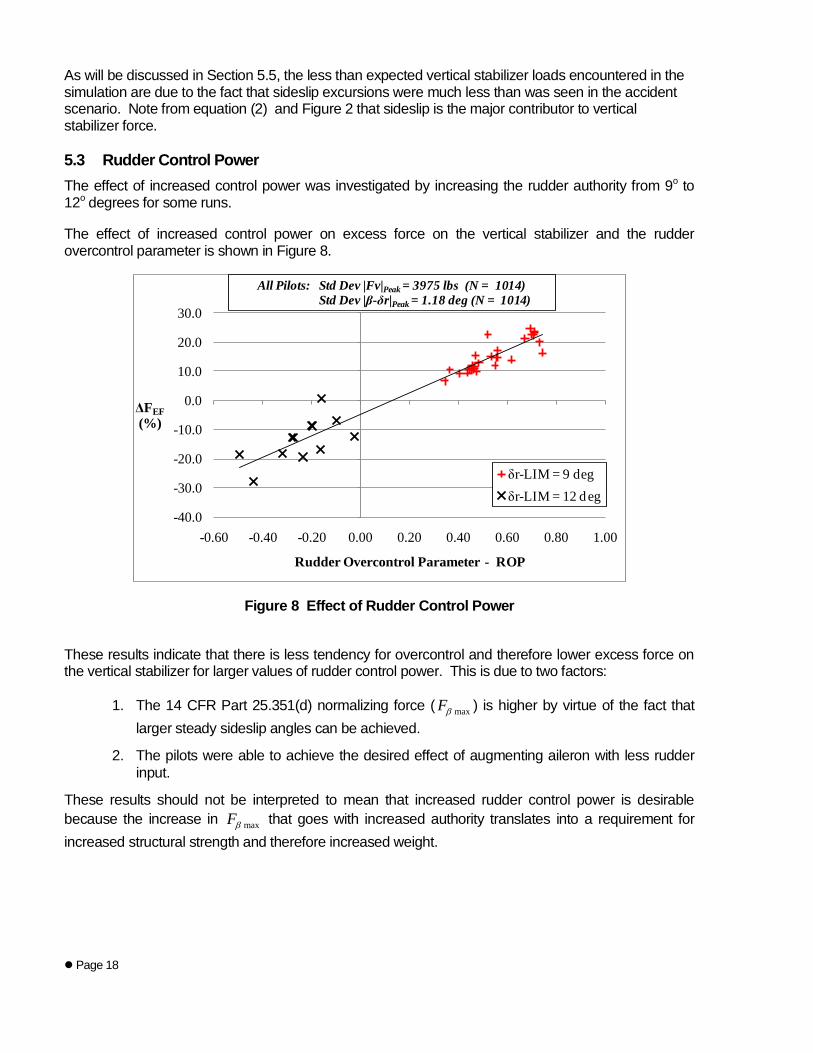
For the baseline configurations, the yaw damper was inserted in the control loop as shown in Figure 9 and designated YD A.
FeelSystem
Pilot rudderinput
Yaw damperoutput to rudder
PCU
δr YD
δrcom
δr
Note: Yaw damper input to rudder is restricted by magnitude of pilot input
Rudder
Rudder pedal
Rudder Limiter
+- YDLIM
++
Figure 9 Baseline yaw damper Implementation (YD A)
The pilot input pedal gearing was set so that maximum pedal deflection commanded the rudder limit. For baseline cases, this was set to 9o. With this implementation, if the pilot applied full rudder pedal, the yaw damper decreased rudder by as much as 3o, so that only 6o of deflection was available. This occurred because the yaw damper functioned to decrease the yaw rate and sideslip that resulted from a large rudder pedal inputs.
For large pedal deflections YD A operation was essentially one-sided in that it could decrease rudder deflection, but could not increase rudder deflection. This had the effect of decreasing rudder control power in a favorable way so as to limit undesirable sideslip excursions if the rudder was over-controlled.
An alternative yaw damper implementation (YD B) was tested wherein the rudder limiter was moved upstream of the summer in Figure 9 and thereby limited the pilot’s rudder command ( rcomδ ). The YD B input to the rudder differs from YD A in that it is possible for the yaw damper to add to and subtract from the limited rudder. For example, if the rudder limit is 9o and the yaw damper is limited to 3o, then it is possible to achieve rudder deflections as high as 12o.
Due to limitations on simulator time, it was not possible to populate all of the YD B configurations with a statistically significant number of runs (taken to be at least 20 runs with at least 6 different pilots). Given that the long pedal-throw cases inherently represent YD B, efforts were focused on the short pedal-throw cases, and it was possible to get data for three series of configurations (35-XX-1, 60-XX-1, and 35-XX-2). A comparison of ROP vs. lim/boF F for YD A vs. YD B for these configurations is given in Figure 10 (YD B cases are represented as dashed lines).
Page 20
0.40
0.60
0.80
0.00 0.20 0.40 0.60 0.80
Rud
der O
verc
ontr
ol P
aram
eter
-R
OP
Fbo/Flim
35-XX-1
35-XX-2
60-XX-1
35-XX-1 (YDB)
35-XX-2 (YDB)
60-XX-1 (YDB)
All Pilots: Std Dev |Fv|Peak = 3975 lbs (N = 1014)
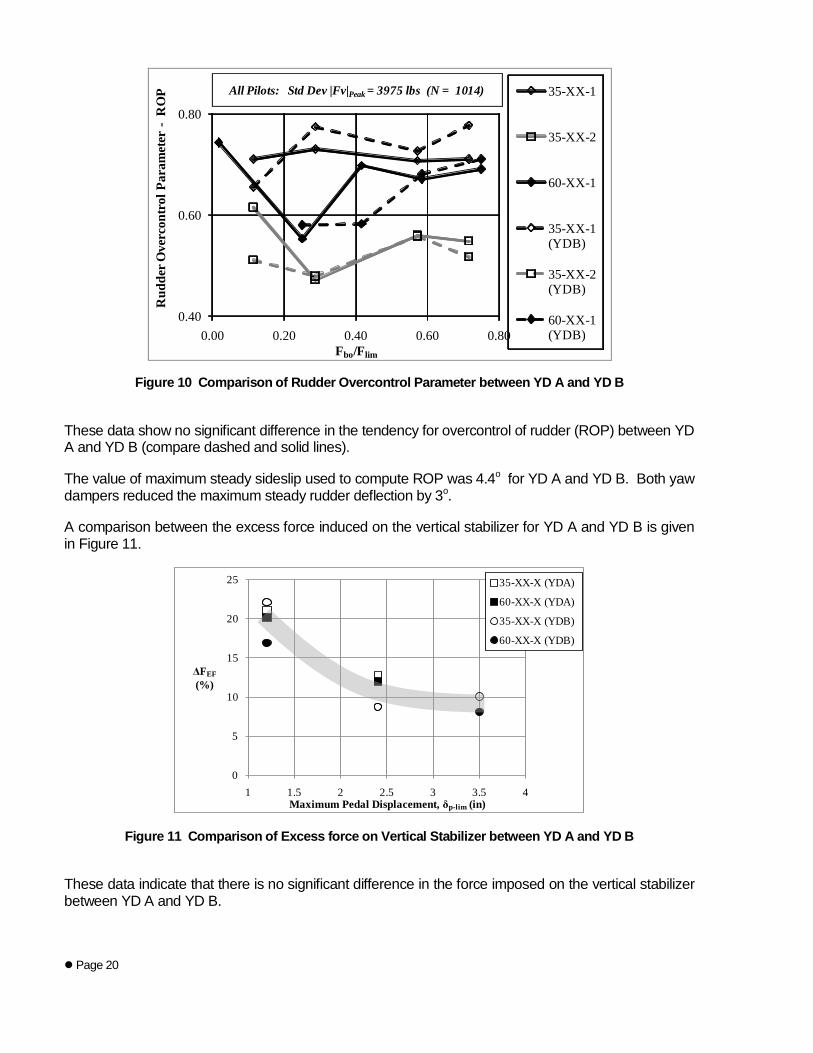
Figure 10 Comparison of Rudder Overcontrol Parameter between YD A and YD B
These data show no significant difference in the tendency for overcontrol of rudder (ROP) between YD A and YD B (compare dashed and solid lines).
The value of maximum steady sideslip used to compute ROP was 4.4o for YD A and YD B. Both yaw dampers reduced the maximum steady rudder deflection by 3o.
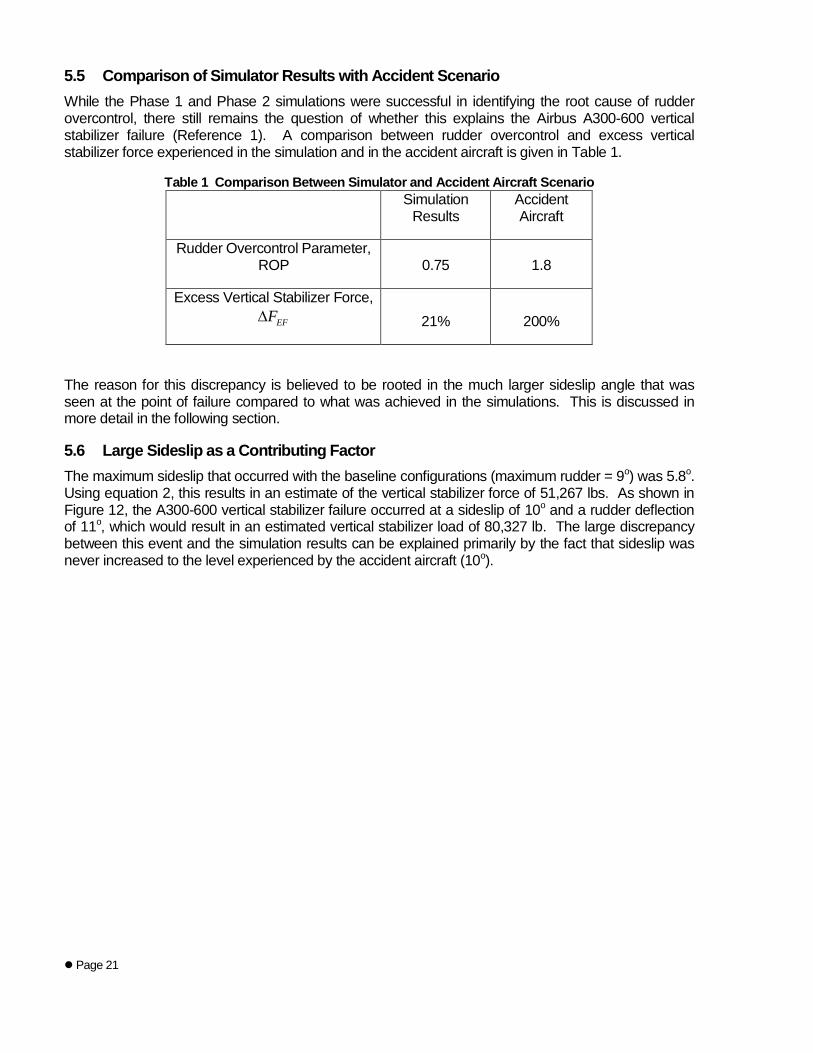
A comparison between the excess force induced on the vertical stabilizer for YD A and YD B is given in Figure 11.
0
5
10
15
20
25
1 1.5 2 2.5 3 3.5 4
ΔFEF(%)
Maximum Pedal Displacement, δp-lim (in)
35-XX-X (YDA)
60-XX-X (YDA)
35-XX-X (YDB)
60-XX-X (YDB)
Figure 11 Comparison of Excess force on Vertical Stabilizer between YD A and YD B
These data indicate that there is no significant difference in the force imposed on the vertical stabilizer between YD A and YD B.
Page 21
5.5 Comparison of Simulator Results with Accident Scenario While the Phase 1 and Phase 2 simulations were successful in identifying the root cause of rudder overcontrol, there still remains the question of whether this explains the Airbus A300-600 vertical stabilizer failure (Reference 1). A comparison between rudder overcontrol and excess vertical stabilizer force experienced in the simulation and in the accident aircraft is given in Table 1.
Table 1 Comparison Between Simulator and Accident Aircraft Scenario
Simulation
Results Accident Aircraft
Rudder Overcontrol Parameter, ROP 0.75 1.8
Excess Vertical Stabilizer Force, EFF∆ 21% 200%
The reason for this discrepancy is believed to be rooted in the much larger sideslip angle that was seen at the point of failure compared to what was achieved in the simulations. This is discussed in more detail in the following section.
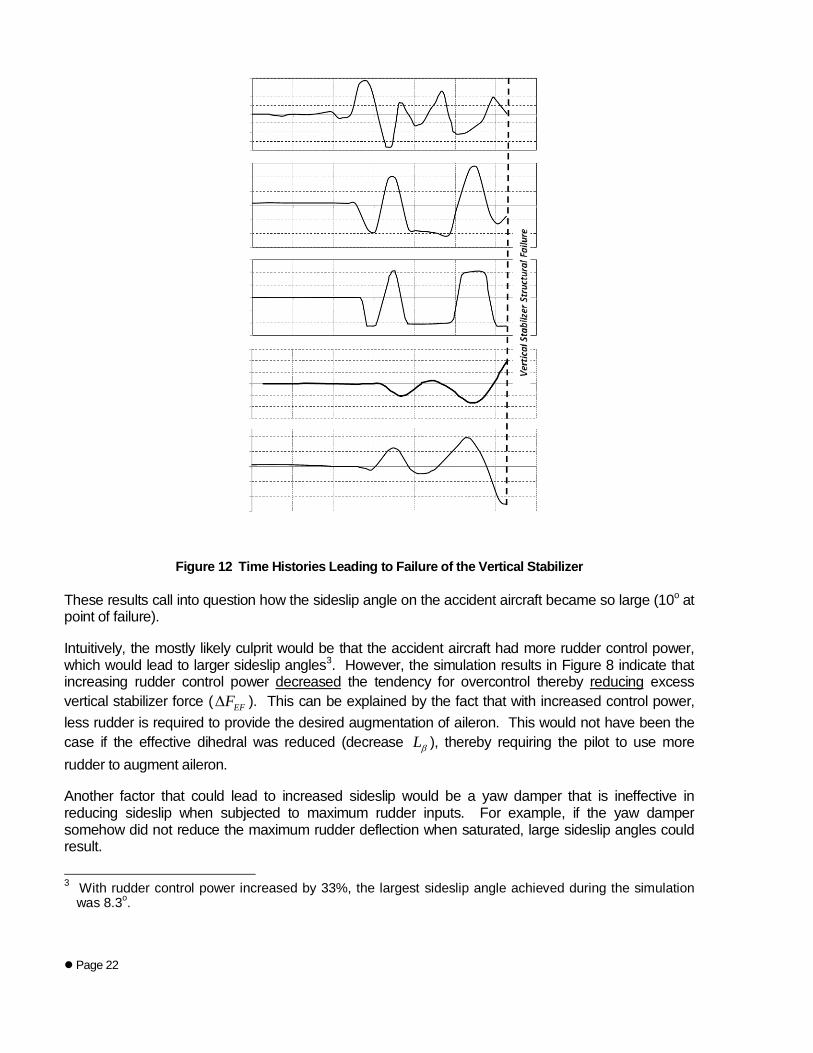
5.6 Large Sideslip as a Contributing Factor The maximum sideslip that occurred with the baseline configurations (maximum rudder = 9o) was 5.8o. Using equation 2, this results in an estimate of the vertical stabilizer force of 51,267 lbs. As shown in Figure 12, the A300-600 vertical stabilizer failure occurred at a sideslip of 10o and a rudder deflection of 11o, which would result in an estimated vertical stabilizer load of 80,327 lb. The large discrepancy between this event and the simulation results can be explained primarily by the fact that sideslip was never increased to the level experienced by the accident aircraft (10o).
Page 22
Figure 12 Time Histories Leading to Failure of the Vertical Stabilizer These results call into question how the sideslip angle on the accident aircraft became so large (10o at point of failure).
Intuitively, the mostly likely culprit would be that the accident aircraft had more rudder control power, which would lead to larger sideslip angles3 Figure 8. However, the simulation results in indicate that increasing rudder control power decreased the tendency for overcontrol thereby reducing
EFF∆ excess
vertical stabilizer force ( ). This can be explained by the fact that with increased control power, less rudder is required to provide the desired augmentation of aileron. This would not have been the case if the effective dihedral was reduced (decrease Lβ ), thereby requiring the pilot to use more rudder to augment aileron.
Another factor that could lead to increased sideslip would be a yaw damper that is ineffective in reducing sideslip when subjected to maximum rudder inputs. For example, if the yaw damper somehow did not reduce the maximum rudder deflection when saturated, large sideslip angles could result.
3 With rudder control power increased by 33%, the largest sideslip angle achieved during the simulation
was 8.3o.
Page 23
In summary, a combination of high ROP, high control power in combination with low effective dihedral, and an ineffective yaw damper when saturated, are all potential contributing factors that would lead to large sideslip angles and high vertical stabilizer forces.
6 Conclusions Short pedal throw has been identified as the primary factor that leads to rudder overcontrol. The use of an increased force gradient does not compensate for short pedal throw.
Tendencies for rudder overcontrol are minimized with a pedal throw of at least 3.5 inches and limit forces on the order of 60 lbs.
Nonlinearities in the load-feel curve such as quantified by the ratio of breakout-to-limit force ( lim/boF F ) or the Linearity Index (LI) are not a significant factor for rudder overcontrol.
Increased rudder control power does not lead to excess force on the vertical stabilizer as long as the requirements of 14 CFR Part 25.351 are met.
Excess force on the vertical stabilizer of magnitudes that could compromise the structure, result from a combination of rudder overcontrol and ability to achieve sideslip angles much larger than can be achieved in steady state during an overcontrol event.
The root cause of the tendency for overcontrol has been identified as short pedal throw. However, the root cause of the tendency to achieve very large sideslip overshoots during an overcontrol event with an aircraft with otherwise acceptable handling qualities is unknown.
1 Anon, “In-flight Separation of Vertical Stabilizer American Airlines Flight 587 Airbus Industrie A300-605R”, N14053 Belle Harbor, New York November 12, 2001, NTSB/AAR-0404, PB2004-910404, Notation 7439B, October 12, 2004. 2 Hoh, Roger H., Thomas K. Nicoll, and Paul Desrochers, “Piloted Simulation Study to Develop Transport Aircraft Rudder Control System Requirements – Phase 1: Simulator Motion Requirements and Initial Results”, DOT/FAA/AR-09/5 March 2009. 3 Hoh, Roger H., Thomas K. Nicoll, and Paul Desrochers, “Piloted Simulation Study to Develop Transport Aircraft Rudder Control System Requirements – Phase 2: Develop Criteria for Rudder Overcontrol, DOT/FAA/AR-xx/xx, December 2009. 4 Anon, “Encounter with Wake Turbulence – Air Canada Airbus A319-114C-GBHZ – Washington State, United States, 10 January 2008”, Aviation Investigation Report A08W0007, Transportation Board of Canada. 5 Lee, B, and V. Rodchenko, et. al., “Effect of Pedal Feel System Characteristics on Aircraft HQ”, Proceedings of AIAA Atmospheric Flight Mechanics Conference, 15–18 August, 2005, San Francisco, CA, AIAA 2005-6034 6 Hess, Ronald A. “Rudder Control Strategies and Force/Feel System Designs in Transport Aircraft”. Journal of Guidance, Control, and Dynamics, Vol 28 Number 6, Pages 1251-1262, Dec 2005

![· Web view[Π2] ‘Civil Aircraft Protection Against Ice – CAPRI’, BRITE / AERONAUTICS (1990-92). Εργάστηκα με ανάθεση έργου, στην ανάπτυξη](https://static.fdocument.org/doc/165x107/5e979407baeeee3f083c4f16/web-view-2-acivil-aircraft-protection-against-ice-a-capria-brite-aeronautics.jpg)