Copyright 2011 Elsevier Inc. All rights reserved. Chapter 1 Jin W. Lee.
17
Copyright 2011 Elsevier Inc. All rights reserved. Chapter 1 Jin W. Lee
-
Upload
kimberly-clayton -
Category
Documents
-
view
245 -
download
2
Transcript of Copyright 2011 Elsevier Inc. All rights reserved. Chapter 1 Jin W. Lee.

Copyright 2011 Elsevier Inc. All rights reserved.
Chapter 1
Jin W. Lee
Copyright 2011 Elsevier Inc. All rights reserved.
FIGURE 1.1 Snapshots from MD simulation of the collision between a bullet particle (dark blob) and a contaminant particle (light blob) at three different times for two different
bullet velocities: (a) Vx = Vz = 2.0(ε/m)1/2 (316 m/s); (b) Vx = Vz =3.0(ε/m)1/2 (474 m/s)
Copyright 2011 Elsevier Inc. All rights reserved.
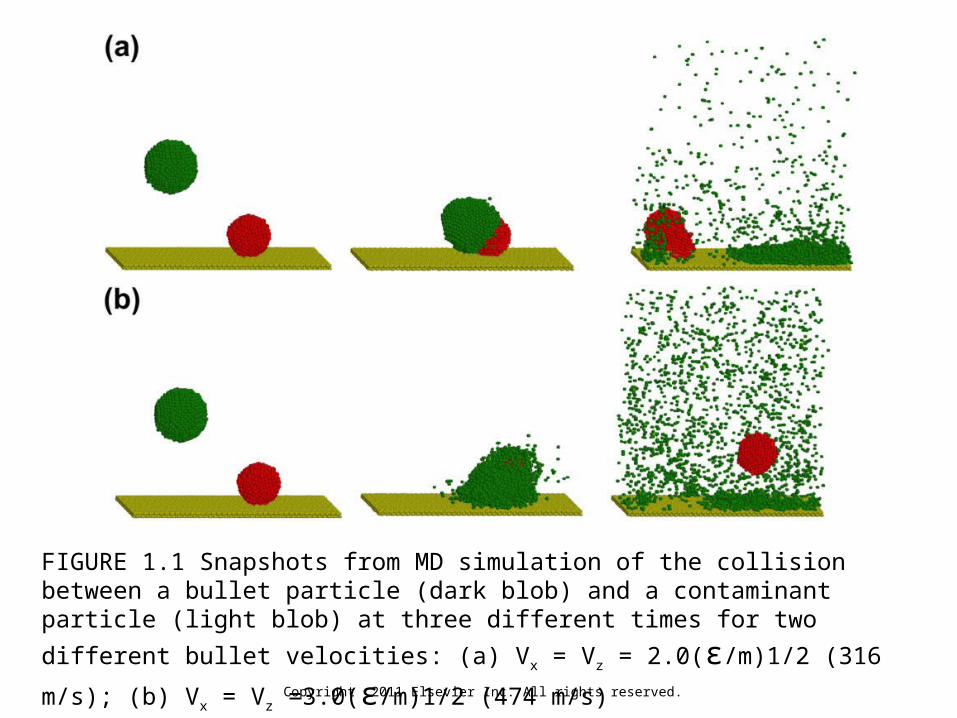
FIGURE 1.2 Snapshots from MD simulation of the collision between a bullet particle (dark blob) and a contaminant particle (light blob) at three different times, when the bullet kinetic energy is twice as high as in Figure 1.1 but at three different combinations of mass
and velocity: (a) 2m and V0; (b) m and 2V0; (c) m/2 and 2V0
Copyright 2011 Elsevier Inc. All rights reserved.
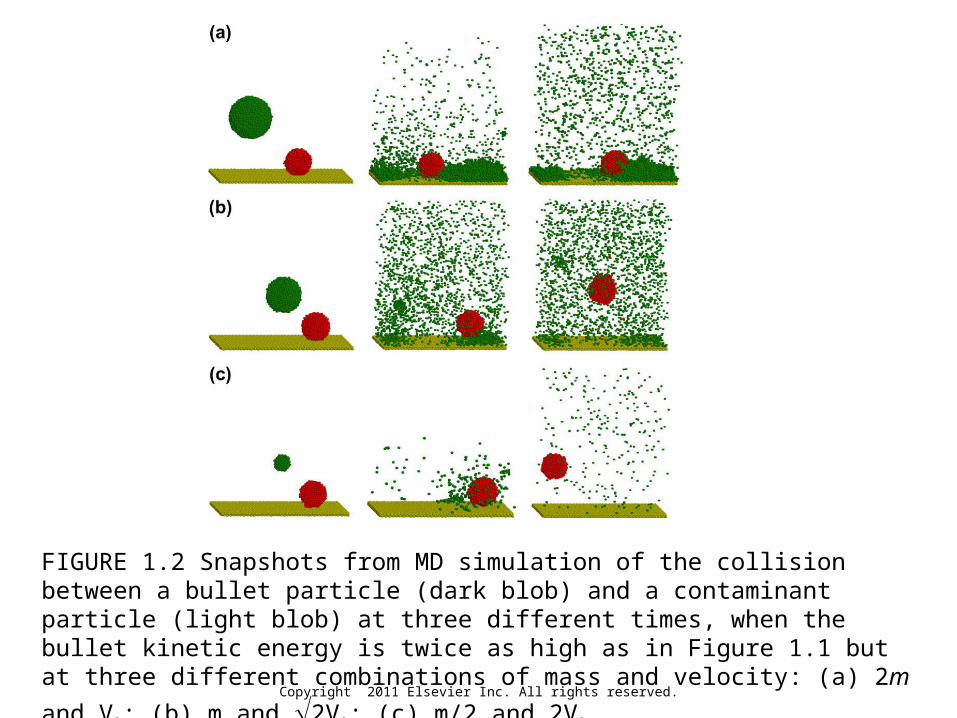
FIGURE 1.3 Time variation of kinetic energy of bullet and contaminant particles (a) and the center of mass velocity of the contaminant particle before and after collision (b); 45, Vx = 3.0 (474 m/s) and Vz = -3.0. 1 = 2.15 ps. ‘CP’ refers to contaminant particle, and in (a) the solid black line is for a fragile bullet and the dotted line is for an artificial hard bullet
Copyright 2011 Elsevier Inc. All rights reserved.
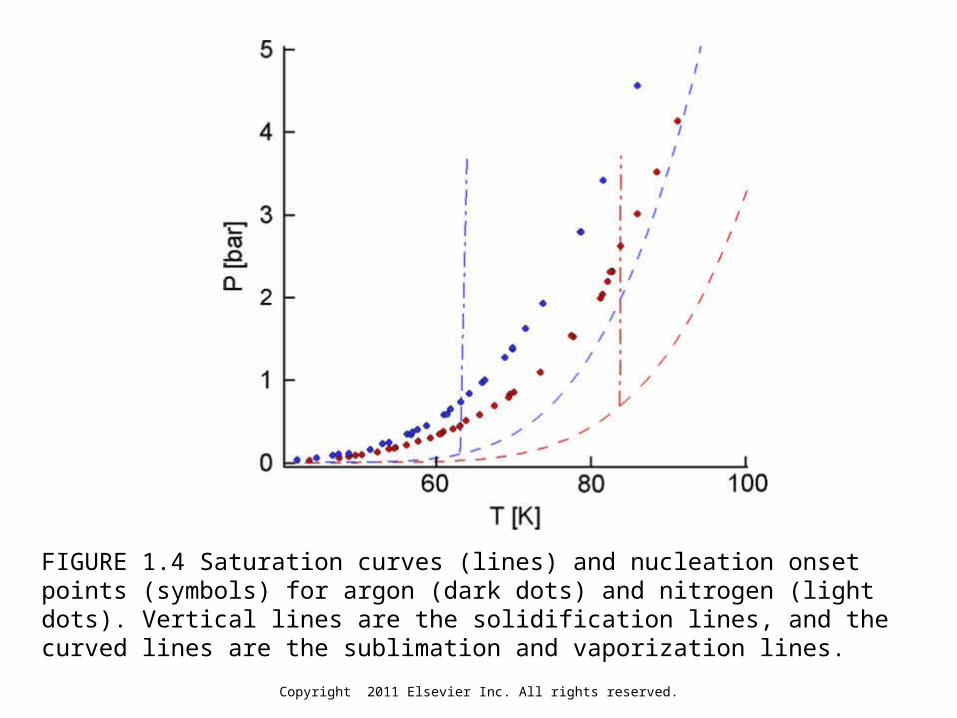
FIGURE 1.4 Saturation curves (lines) and nucleation onset points (symbols) for argon (dark dots) and nitrogen (light dots). Vertical lines are the solidification lines, and the curved lines are the sublimation and vaporization lines.
Copyright 2011 Elsevier Inc. All rights reserved.
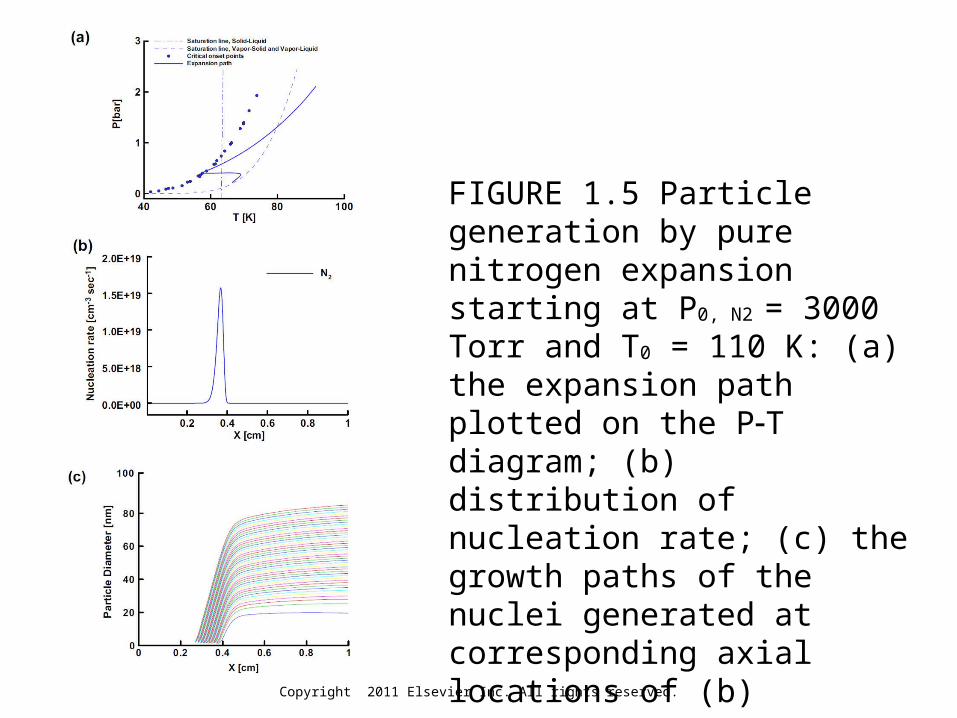
FIGURE 1.5 Particle generation by pure nitrogen expansion starting at P0, N2 = 3000 Torr and T0 = 110 K: (a) the expansion path plotted on the PT diagram; (b) distribution of nucleation rate; (c) the growth paths of the nuclei generated at corresponding axial locations of (b)
Copyright 2011 Elsevier Inc. All rights reserved.
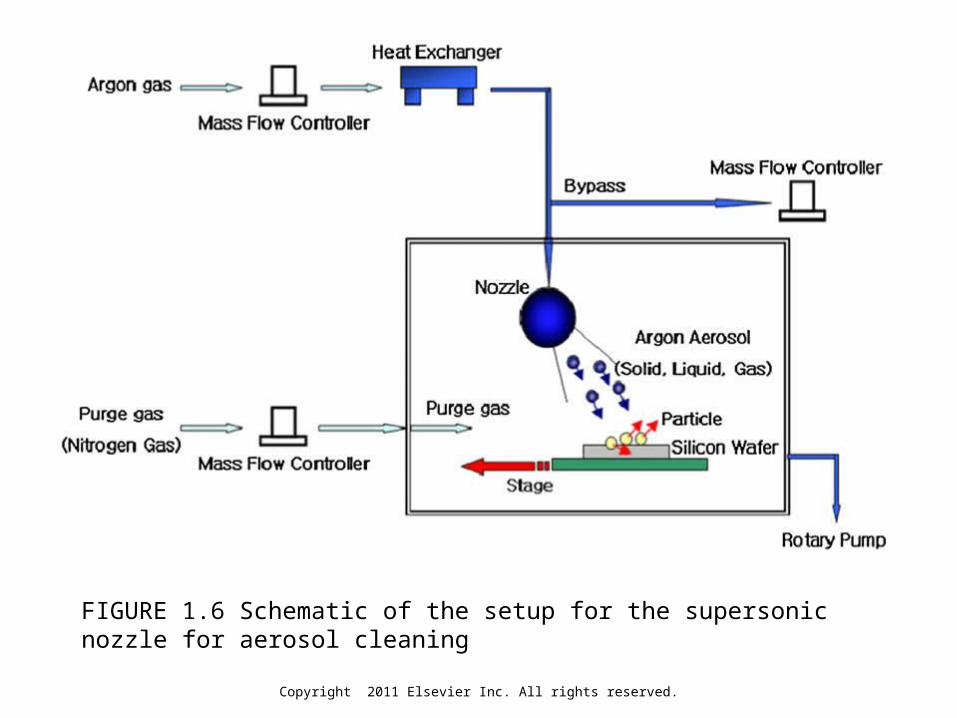
FIGURE 1.6 Schematic of the setup for the supersonic nozzle for aerosol cleaning
Copyright 2011 Elsevier Inc. All rights reserved.
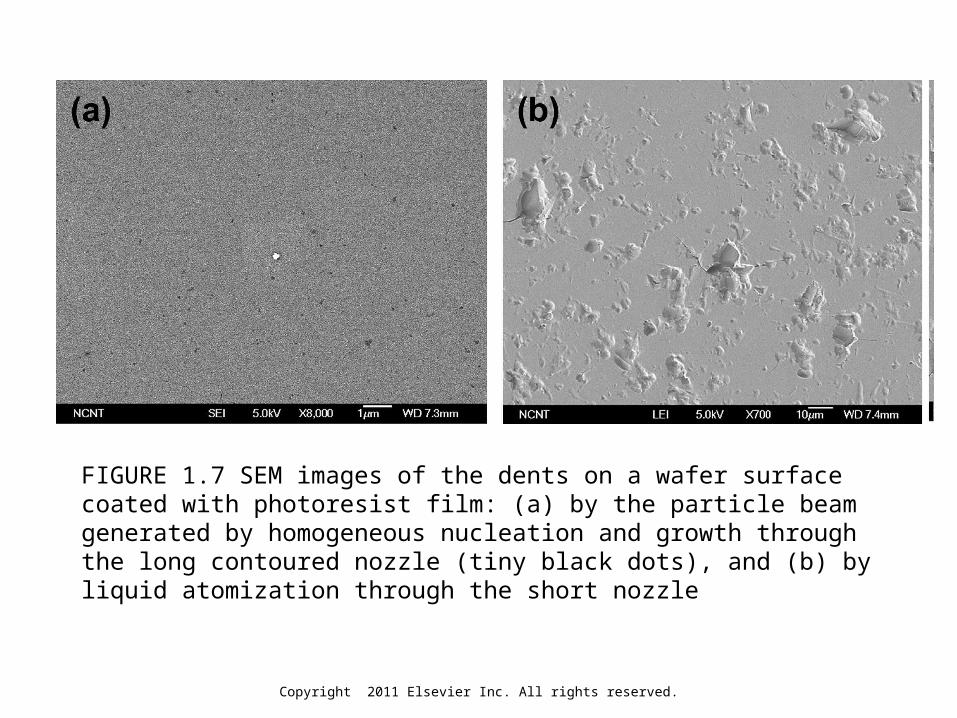
FIGURE 1.7 SEM images of the dents on a wafer surface coated with photoresist film: (a) by the particle beam generated by homogeneous nucleation and growth through the long contoured nozzle (tiny black dots), and (b) by liquid atomization through the short nozzle
Copyright 2011 Elsevier Inc. All rights reserved.
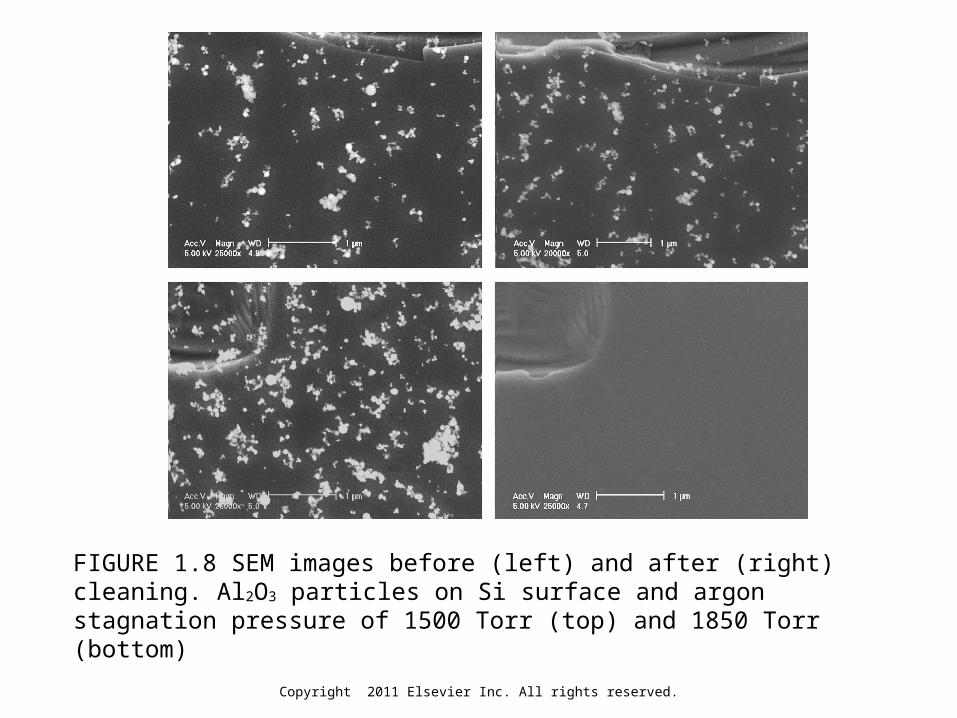
FIGURE 1.8 SEM images before (left) and after (right) cleaning. Al2O3 particles on Si surface and argon stagnation pressure of 1500 Torr (top) and 1850 Torr (bottom)
Copyright 2011 Elsevier Inc. All rights reserved.
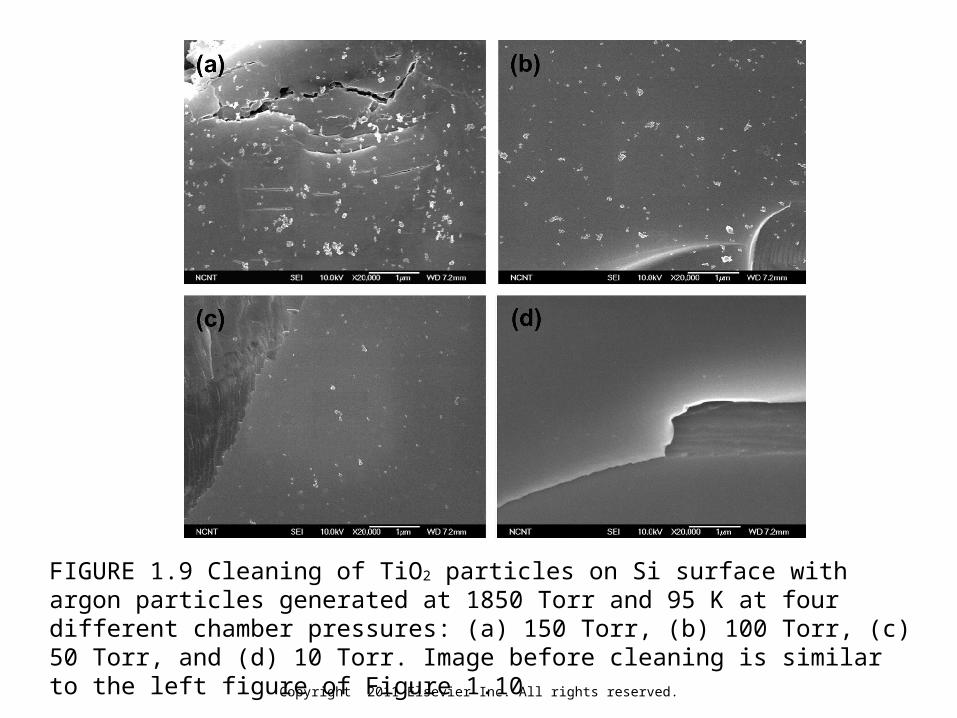
FIGURE 1.9 Cleaning of TiO2 particles on Si surface with argon particles generated at 1850 Torr and 95 K at four different chamber pressures: (a) 150 Torr, (b) 100 Torr, (c) 50 Torr, and (d) 10 Torr. Image before cleaning is similar to the left figure of Figure 1.10
Copyright 2011 Elsevier Inc. All rights reserved.
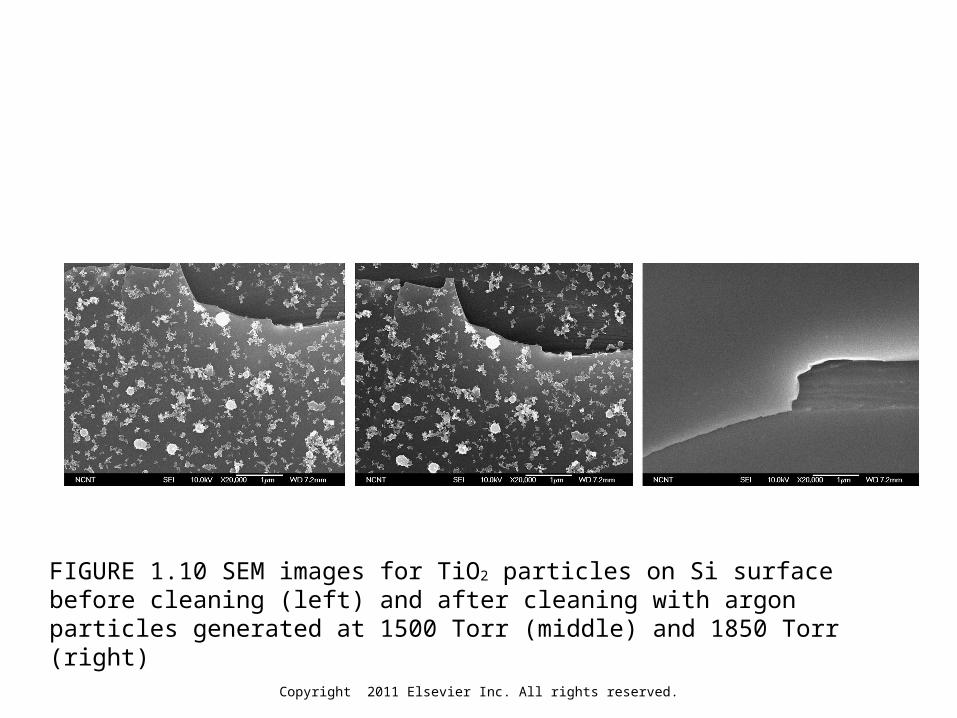
FIGURE 1.10 SEM images for TiO2 particles on Si surface before cleaning (left) and after cleaning with argon particles generated at 1500 Torr (middle) and 1850 Torr (right)
Copyright 2011 Elsevier Inc. All rights reserved.
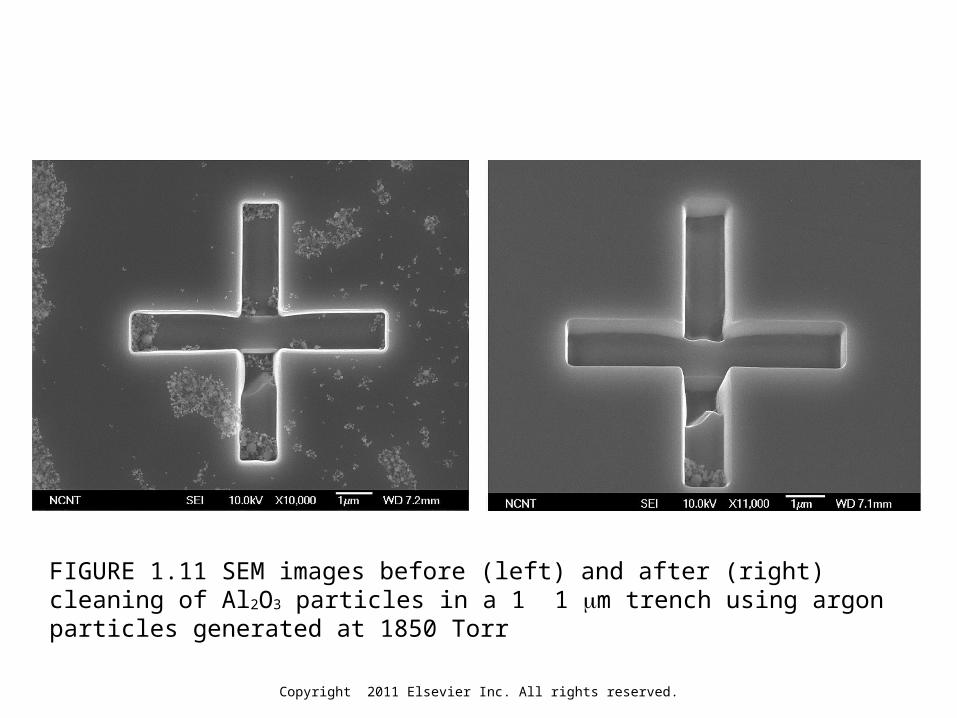
FIGURE 1.11 SEM images before (left) and after (right) cleaning of Al2O3 particles in a 1 1 m trench using argon particles generated at 1850 Torr
Copyright 2011 Elsevier Inc. All rights reserved.
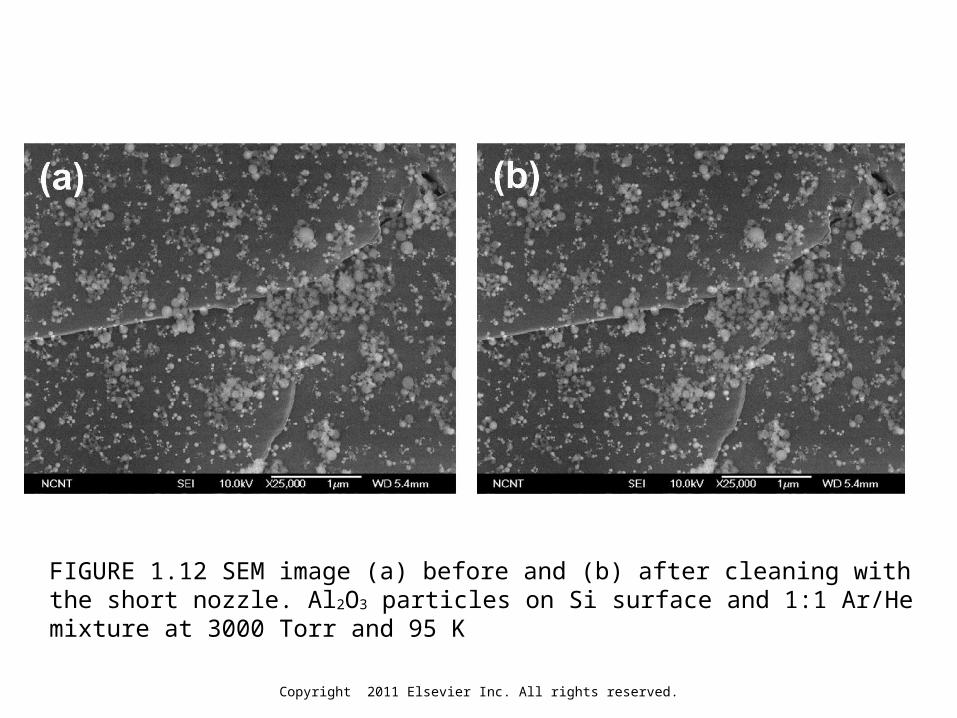
FIGURE 1.12 SEM image (a) before and (b) after cleaning with the short nozzle. Al2O3 particles on Si surface and 1:1 Ar/He mixture at 3000 Torr and 95 K
Copyright 2011 Elsevier Inc. All rights reserved.
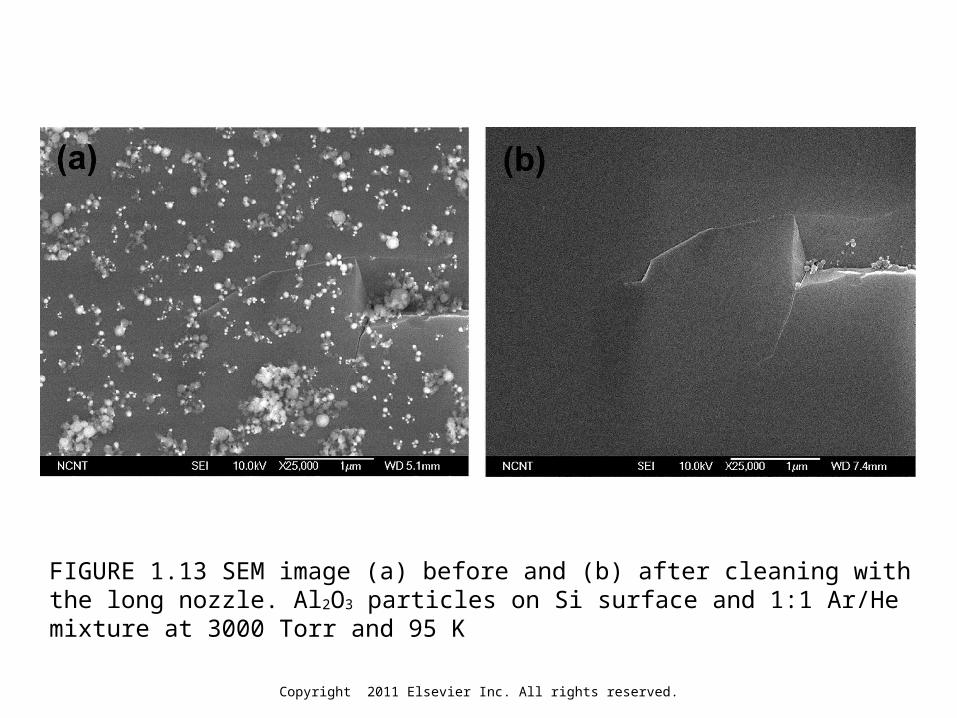
FIGURE 1.13 SEM image (a) before and (b) after cleaning with the long nozzle. Al2O3 particles on Si surface and 1:1 Ar/He mixture at 3000 Torr and 95 K
Copyright 2011 Elsevier Inc. All rights reserved.
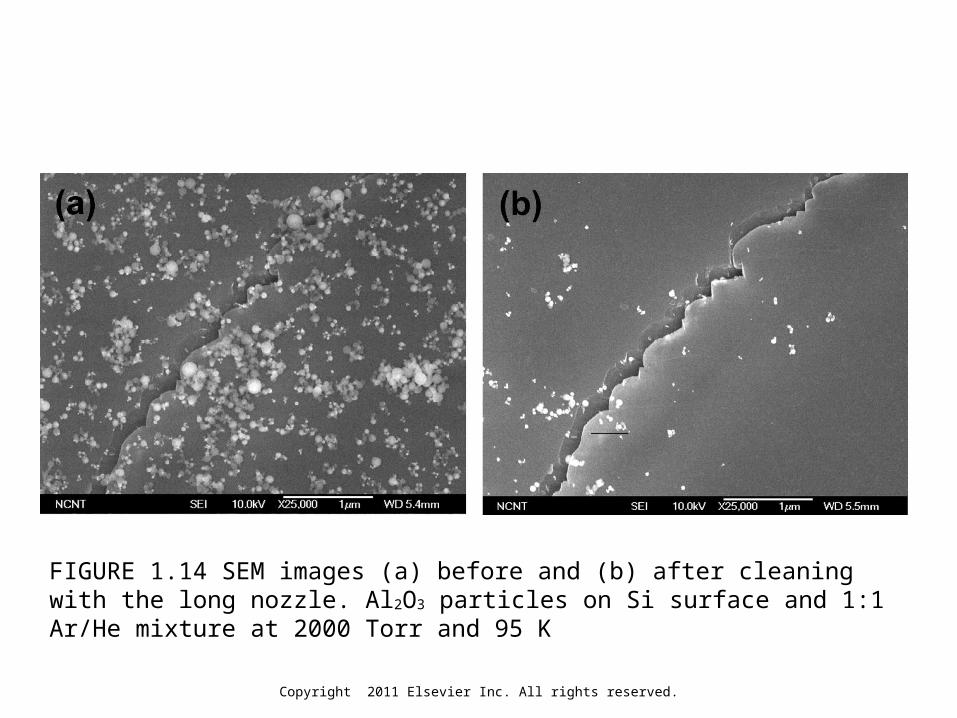
FIGURE 1.14 SEM images (a) before and (b) after cleaning with the long nozzle. Al2O3 particles on Si surface and 1:1 Ar/He mixture at 2000 Torr and 95 K
Copyright 2011 Elsevier Inc. All rights reserved.
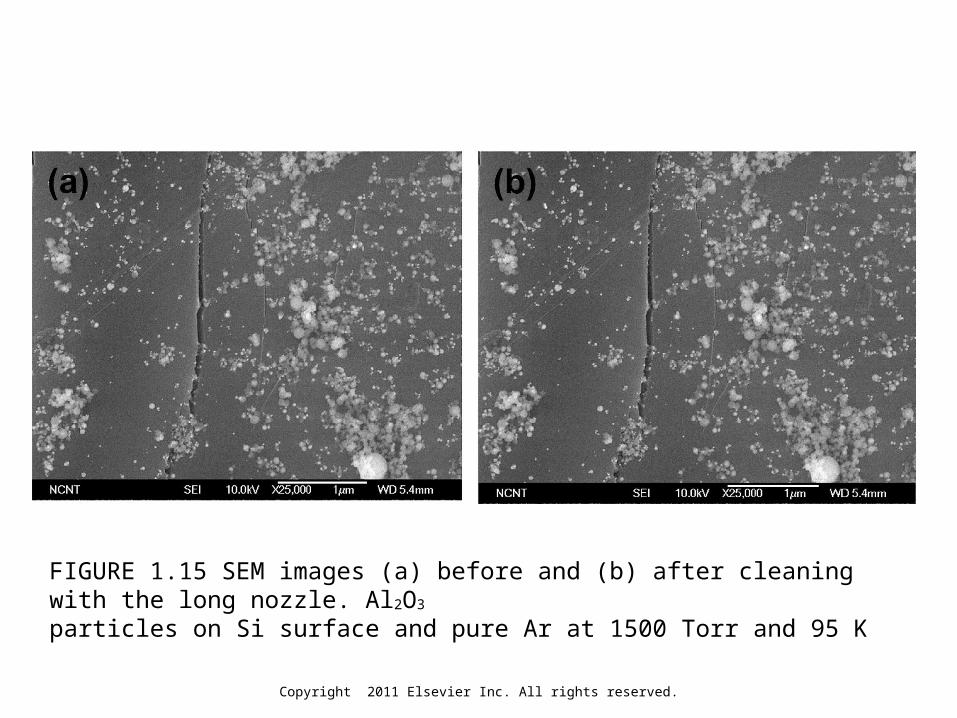
FIGURE 1.15 SEM images (a) before and (b) after cleaning with the long nozzle. Al2O3
particles on Si surface and pure Ar at 1500 Torr and 95 K
Copyright 2011 Elsevier Inc. All rights reserved.
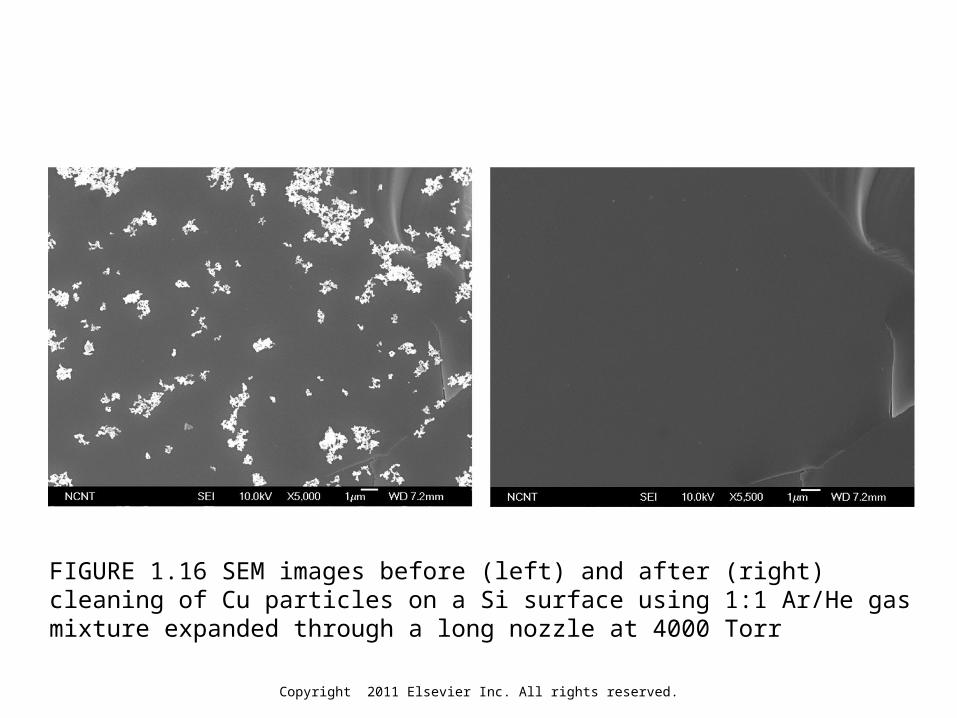
FIGURE 1.16 SEM images before (left) and after (right) cleaning of Cu particles on a Si surface using 1:1 Ar/He gas mixture expanded through a long nozzle at 4000 Torr