Consider a liquid chromatography experiment
35
§ Consider a liquid chromatography experiment à in which the column has an inner diameter of 0.60 cm à and the mobile phase occupies 20% of the column volume. § Each centimeter of column length à has a volume of πr 2 × length = π(0.30 cm) 2 (1 cm) = 0.283 mL, à of which 20% (0.056 5 mL) is mobile phase (solvent). § For example, the volume flow rate = 0.30 mL/min § Because 1 cm of column length contains 0.056 5 mL of mobile phase, à 0.30 mL would occupy (0.30 mL)/(0.056 5 mL/cm) = 5.3 cm of column length. § The linear flow rate corresponding to 0.30 mL/min à 5.3 cm/min.
Transcript of Consider a liquid chromatography experiment
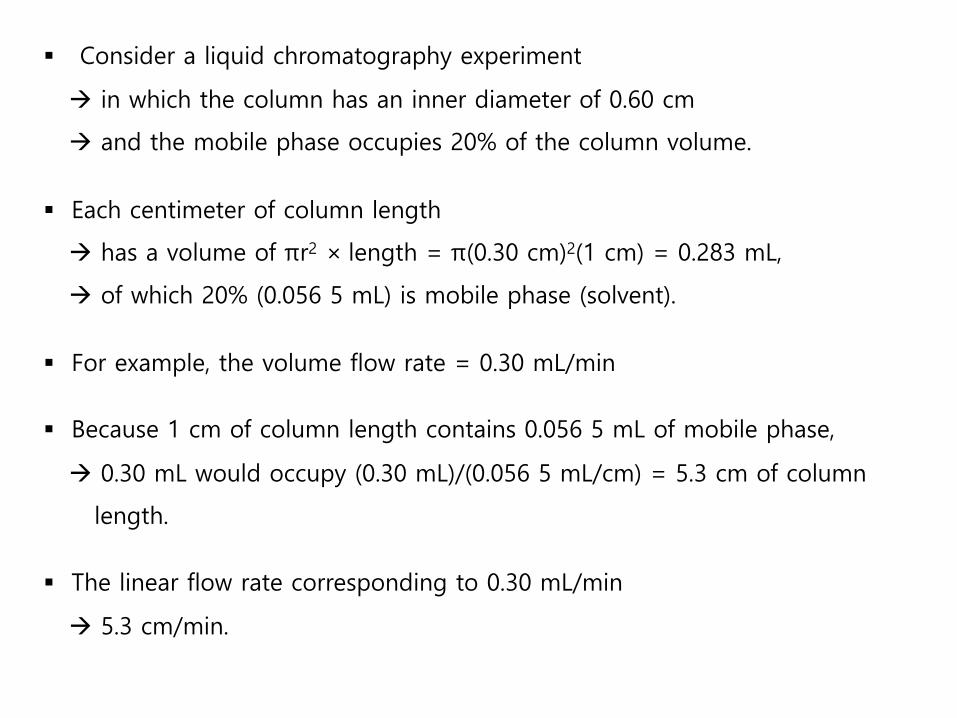
§ Consider a liquid chromatography experiment
à in which the column has an inner diameter of 0.60 cm
à and the mobile phase occupies 20% of the column volume.
§ Each centimeter of column length
à has a volume of πr2 × length = π(0.30 cm)2(1 cm) = 0.283 mL,
à of which 20% (0.056 5 mL) is mobile phase (solvent).
§ For example, the volume flow rate = 0.30 mL/min
§ Because 1 cm of column length contains 0.056 5 mL of mobile phase,
à 0.30 mL would occupy (0.30 mL)/(0.056 5 mL/cm) = 5.3 cm of column
length.
§ The linear flow rate corresponding to 0.30 mL/min
à 5.3 cm/min.
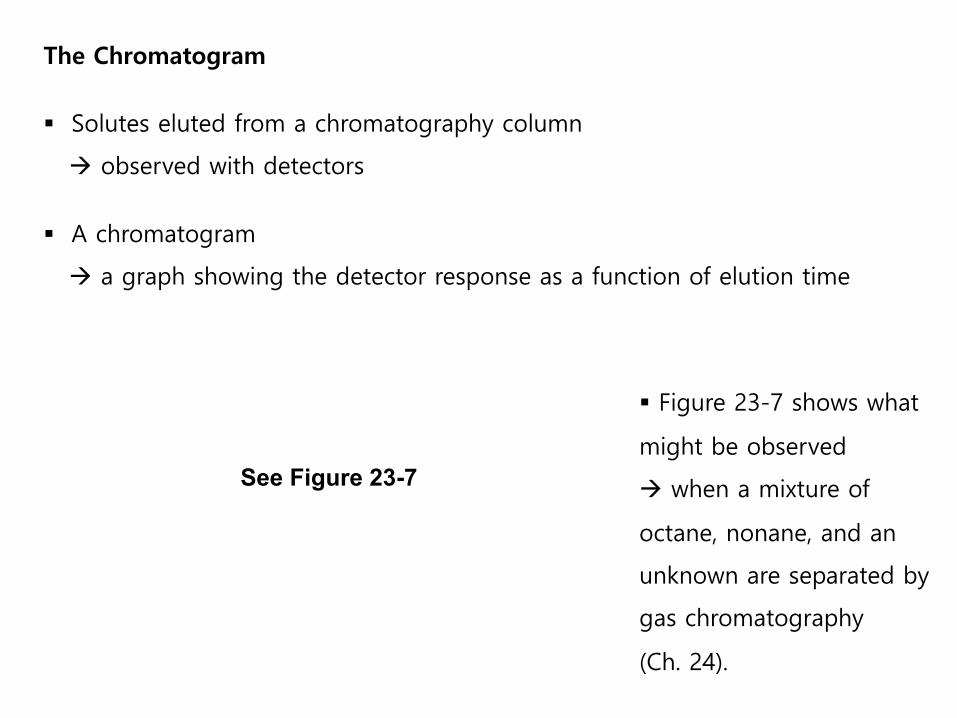
The Chromatogram
§ Solutes eluted from a chromatography column
à observed with detectors
§ A chromatogram
à a graph showing the detector response as a function of elution time
§ Figure 23-7 shows what
might be observed
à when a mixture of
octane, nonane, and an
unknown are separated by
gas chromatography
(Ch. 24).
See Figure 23-7
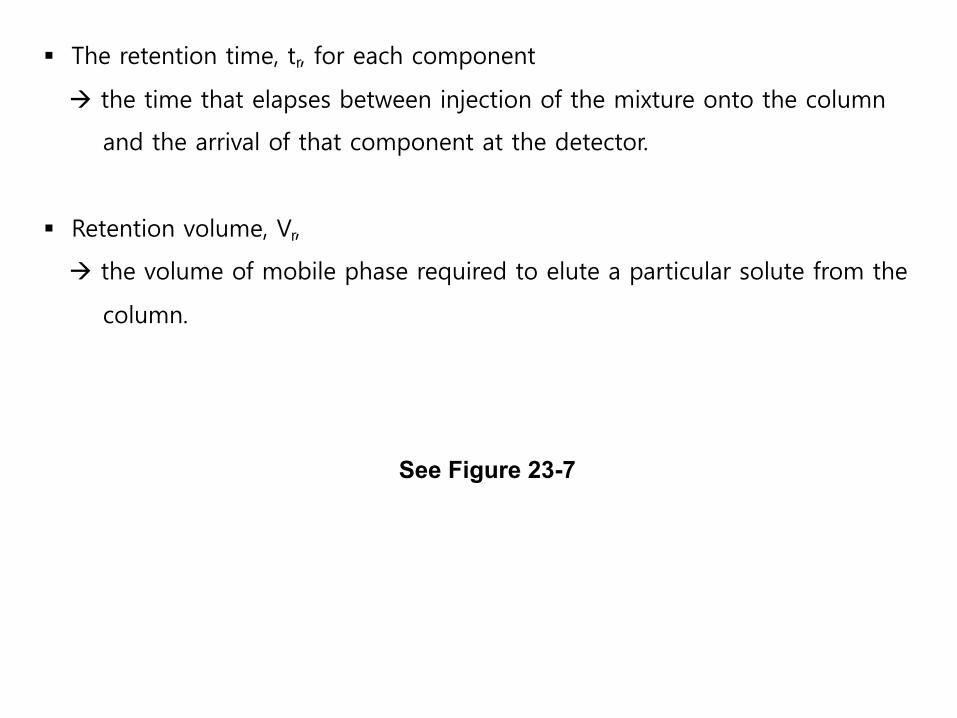
§ The retention time, tr, for each component
à the time that elapses between injection of the mixture onto the column
and the arrival of that component at the detector.
§ Retention volume, Vr,
à the volume of mobile phase required to elute a particular solute from the
column.
See Figure 23-7
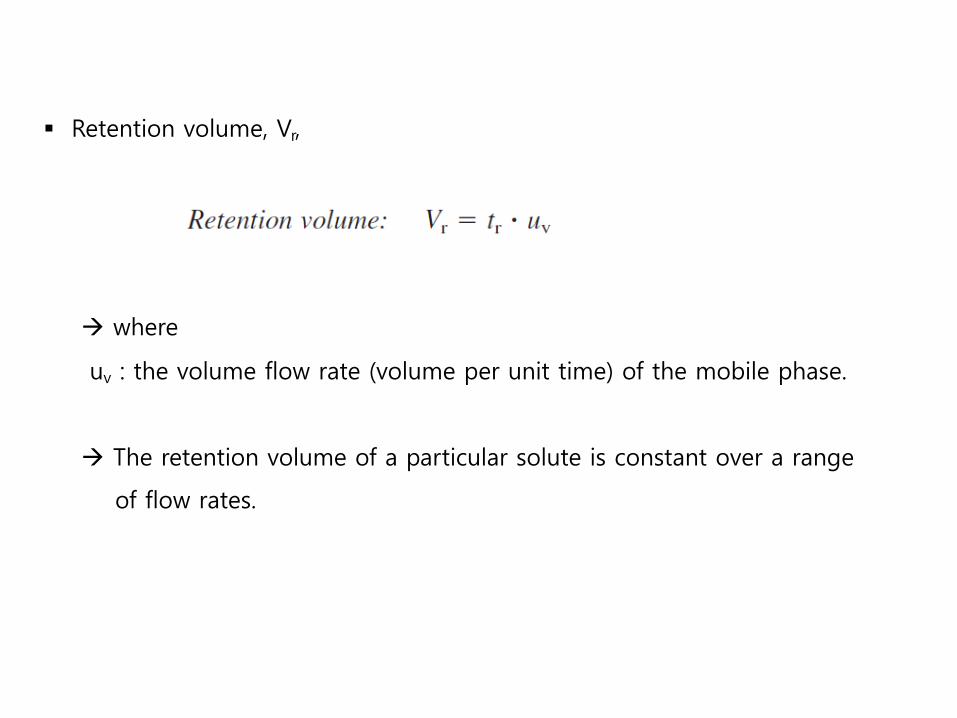
§ Retention volume, Vr,
à where
uv : the volume flow rate (volume per unit time) of the mobile phase.
à The retention volume of a particular solute is constant over a range
of flow rates.
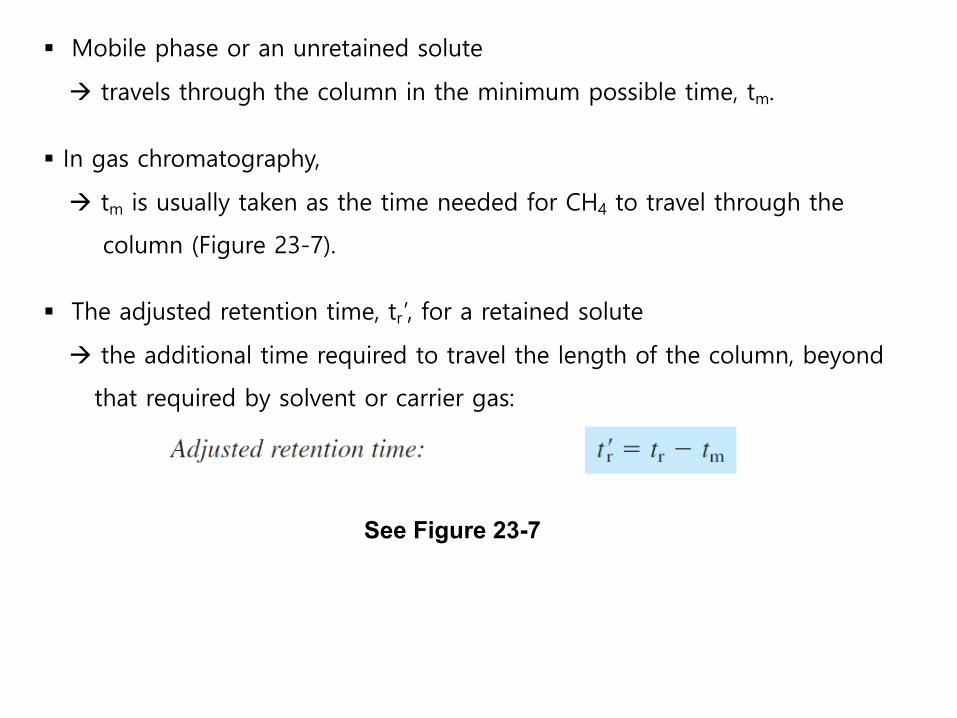
§ Mobile phase or an unretained solute
à travels through the column in the minimum possible time, tm.
§ In gas chromatography,
à tm is usually taken as the time needed for CH4 to travel through the
column (Figure 23-7).
§ The adjusted retention time, tr’, for a retained solute
à the additional time required to travel the length of the column, beyond
that required by solvent or carrier gas:
See Figure 23-7
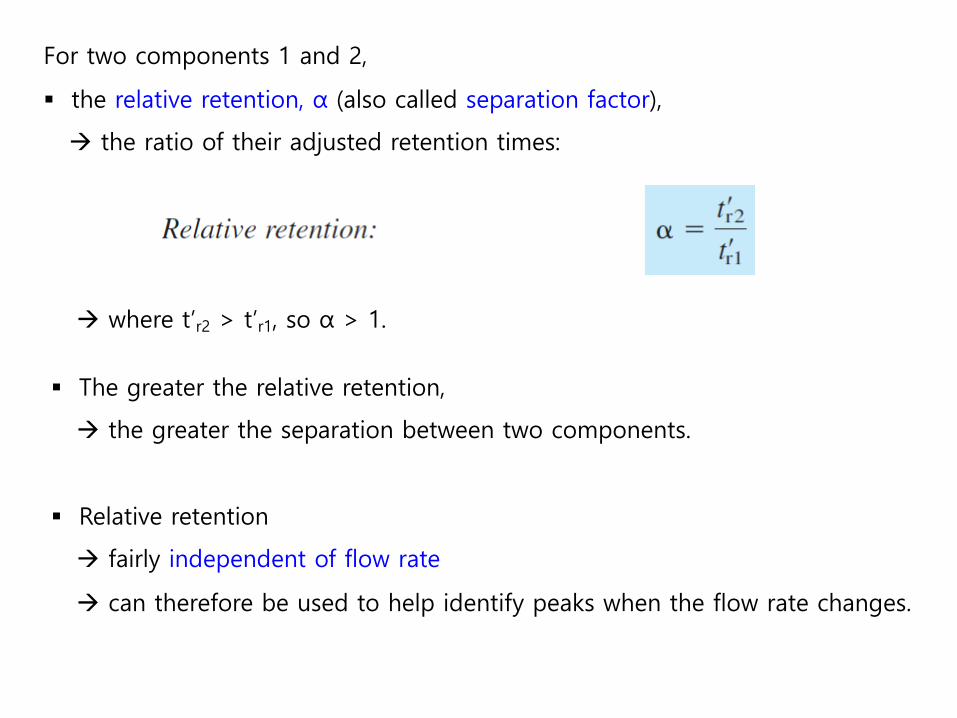
For two components 1 and 2,
§ the relative retention, α (also called separation factor),
à the ratio of their adjusted retention times:
à where t’r2 > t’r1, so α > 1.
§ The greater the relative retention,
à the greater the separation between two components.
§ Relative retention
à fairly independent of flow rate
à can therefore be used to help identify peaks when the flow rate changes.
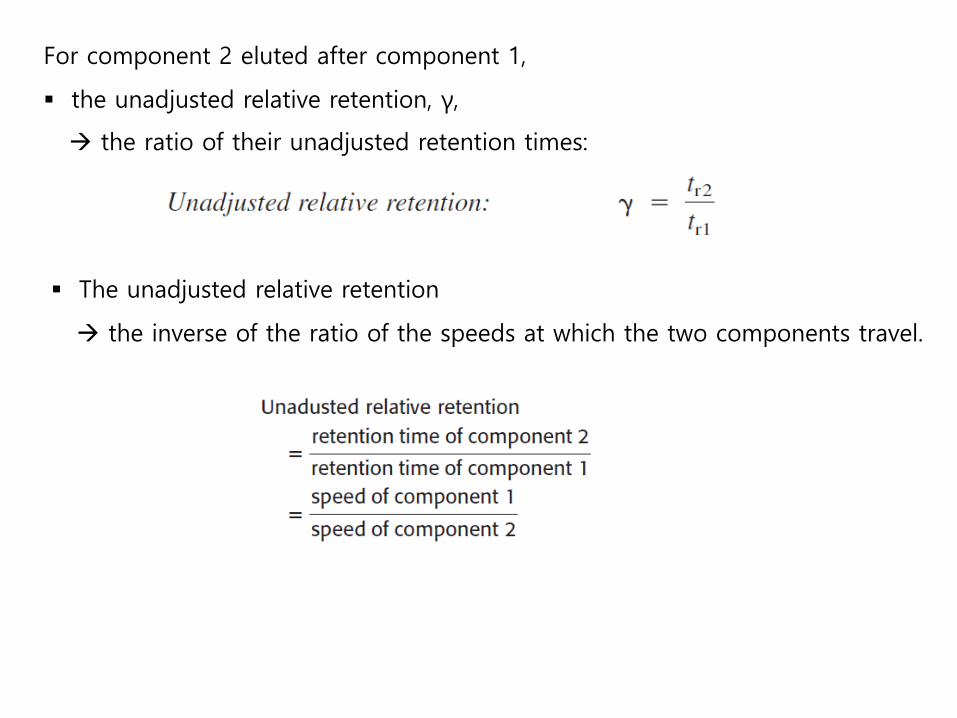
For component 2 eluted after component 1,
§ the unadjusted relative retention, γ,
à the ratio of their unadjusted retention times:
§ The unadjusted relative retention
à the inverse of the ratio of the speeds at which the two components travel.
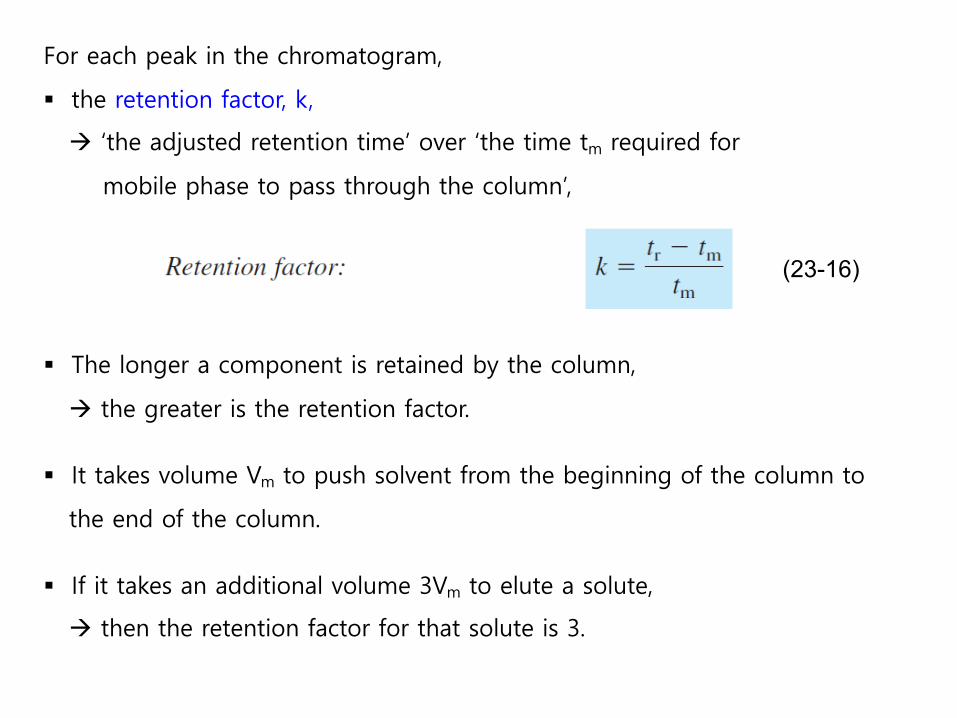
§ The longer a component is retained by the column,
à the greater is the retention factor.
§ It takes volume Vm to push solvent from the beginning of the column to
the end of the column.
§ If it takes an additional volume 3Vm to elute a solute,
à then the retention factor for that solute is 3.
For each peak in the chromatogram,
§ the retention factor, k,
à ‘the adjusted retention time’ over ‘the time tm required for
mobile phase to pass through the column’,
(23-16)
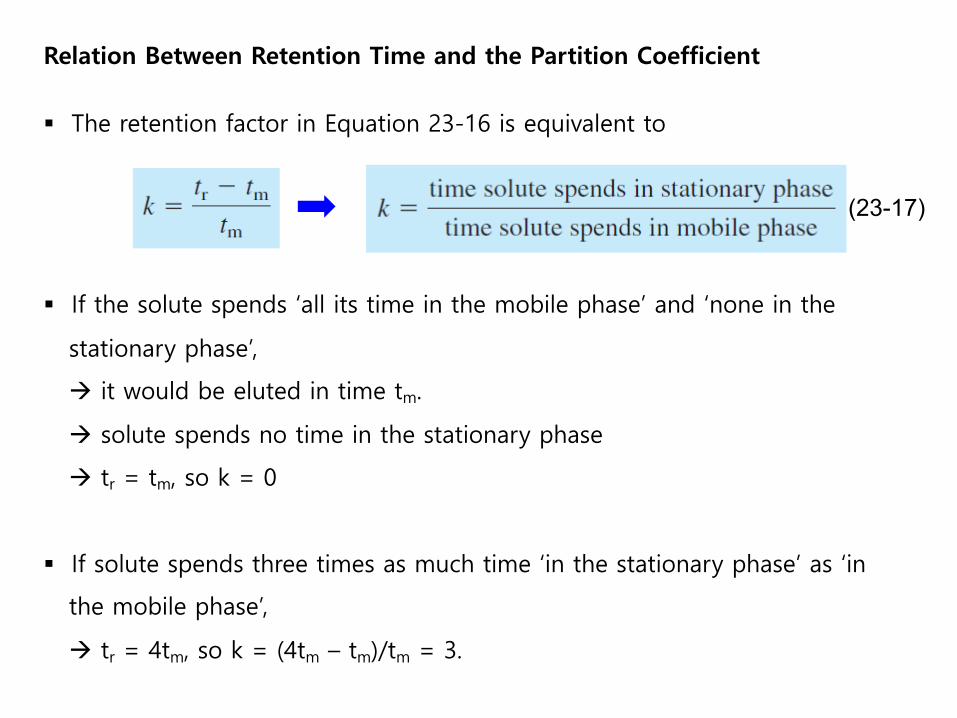
Relation Between Retention Time and the Partition Coefficient
§ The retention factor in Equation 23-16 is equivalent to
§ If the solute spends ‘all its time in the mobile phase’ and ‘none in the
stationary phase’,
à it would be eluted in time tm.
à solute spends no time in the stationary phase
à tr = tm, so k = 0
§ If solute spends three times as much time ‘in the stationary phase’ as ‘in
the mobile phase’,
à tr = 4tm, so k = (4tm – tm)/tm = 3.
(23-17)
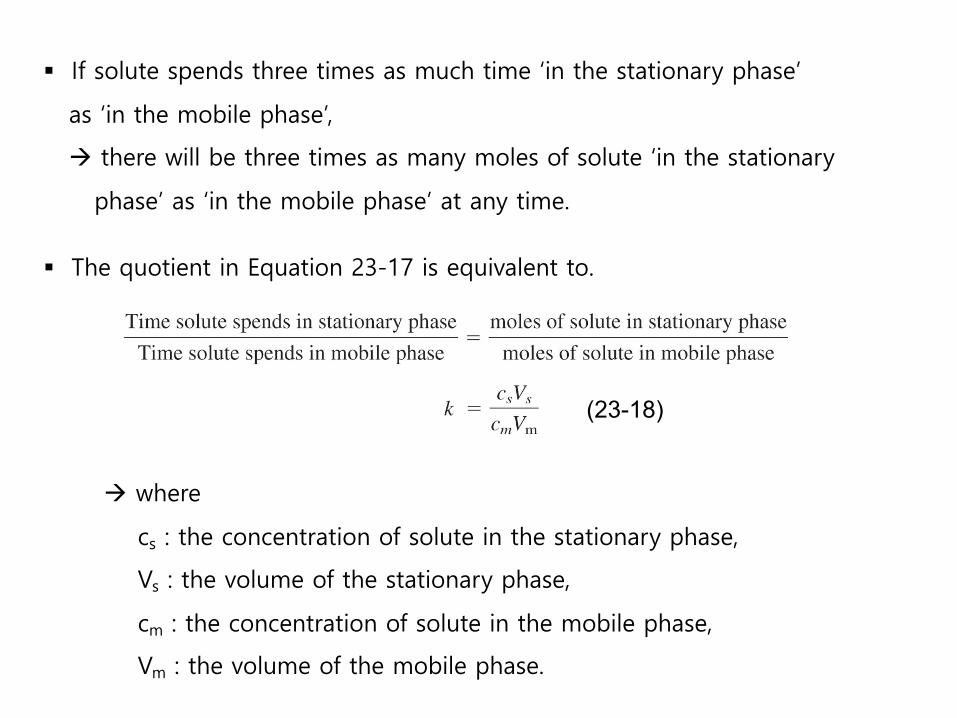
§ If solute spends three times as much time ‘in the stationary phase’
as ‘in the mobile phase’,
à there will be three times as many moles of solute ‘in the stationary
phase’ as ‘in the mobile phase’ at any time.
§ The quotient in Equation 23-17 is equivalent to.
à where
cs : the concentration of solute in the stationary phase,
Vs : the volume of the stationary phase,
cm : the concentration of solute in the mobile phase,
Vm : the volume of the mobile phase.
(23-18)
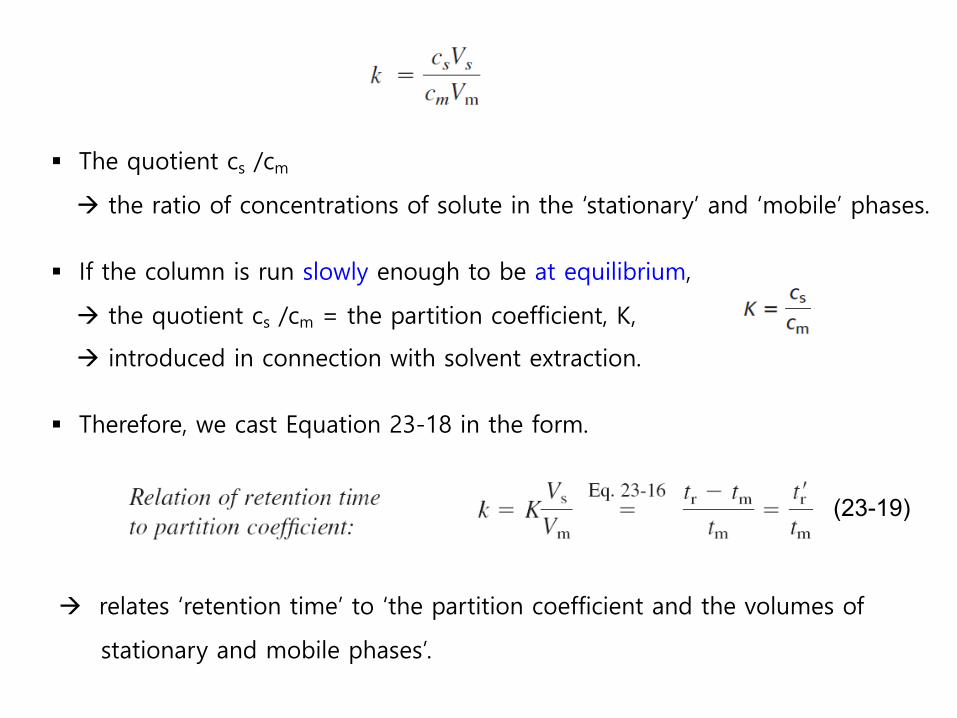
§ The quotient cs /cm
à the ratio of concentrations of solute in the ‘stationary’ and ‘mobile’ phases.
§ If the column is run slowly enough to be at equilibrium,
à the quotient cs /cm = the partition coefficient, K,
à introduced in connection with solvent extraction.
§ Therefore, we cast Equation 23-18 in the form.
à relates ‘retention time’ to ‘the partition coefficient and the volumes of
stationary and mobile phases’.
(23-19)
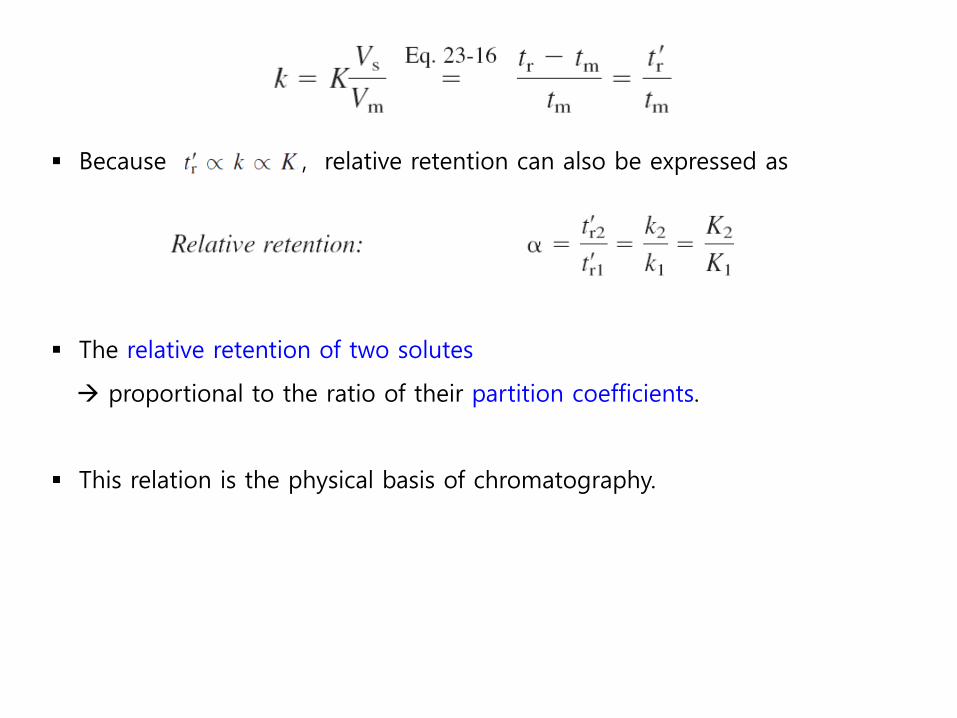
§ Because , relative retention can also be expressed as
§ The relative retention of two solutes
à proportional to the ratio of their partition coefficients.
§ This relation is the physical basis of chromatography.
23.4 Efficiency of Separation
§ Two factors contribute to how well compounds are separated by
chromatography.
1) The difference in elution times between peaks:
à The farther apart, the better their separation.
2) The other factor is how broad the peaks are:
à the wider the peaks, the poorer their separation.
§ This section discusses how we measure the efficiency of a separation.
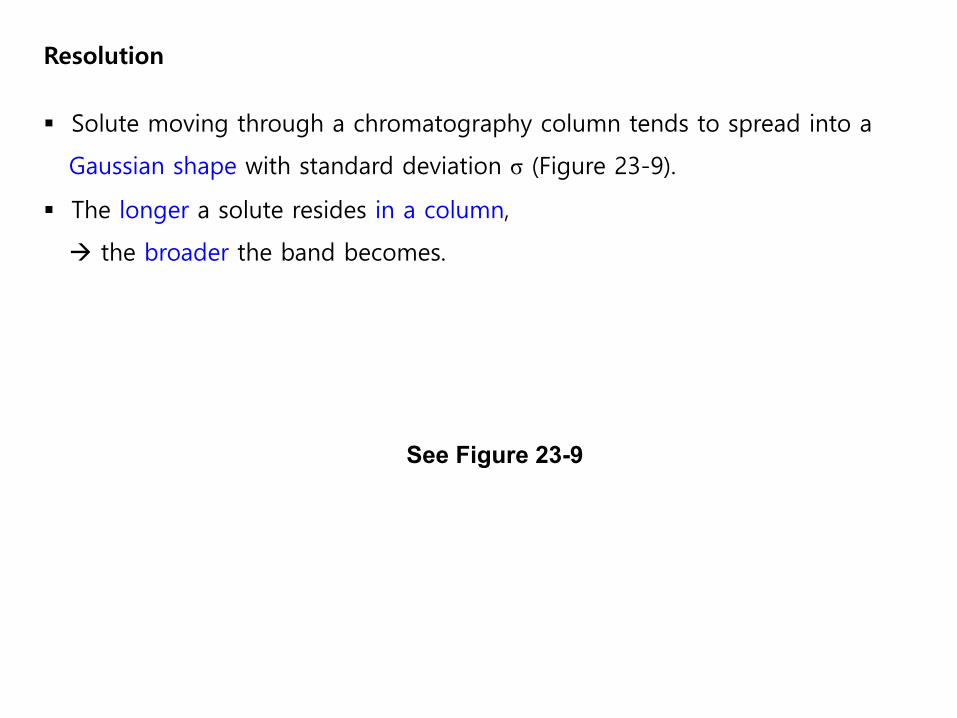
Resolution
§ Solute moving through a chromatography column tends to spread into a
Gaussian shape with standard deviation σ (Figure 23-9).
§ The longer a solute resides in a column,
à the broader the band becomes.
See Figure 23-9
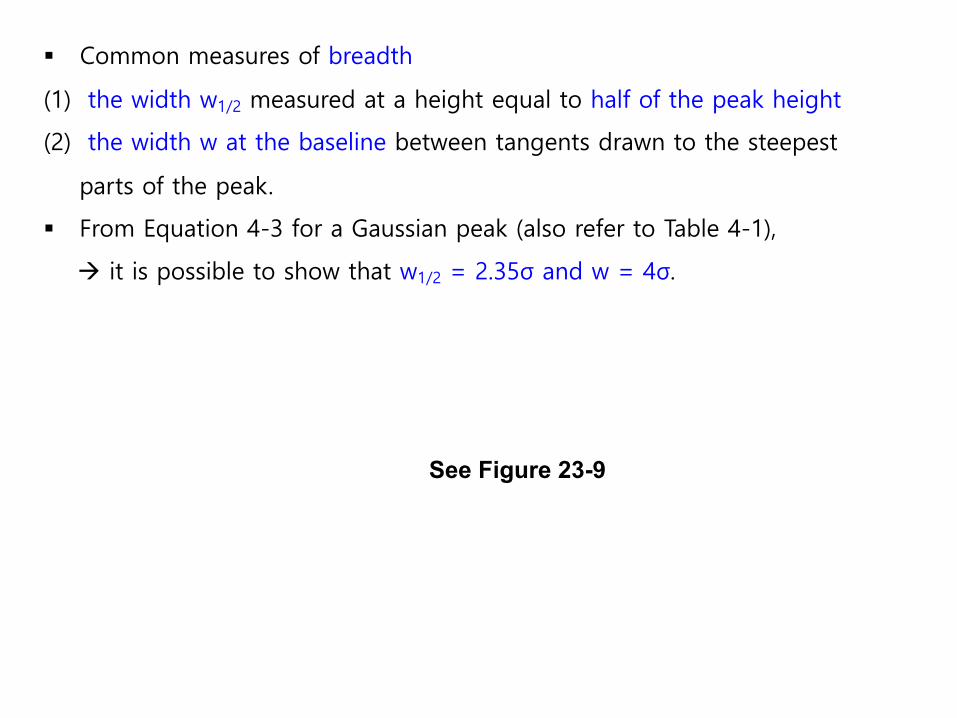
§ Common measures of breadth
(1) the width w1/2 measured at a height equal to half of the peak height
(2) the width w at the baseline between tangents drawn to the steepest
parts of the peak.
§ From Equation 4-3 for a Gaussian peak (also refer to Table 4-1),
à it is possible to show that w1/2 = 2.35σ and w = 4σ.
See Figure 23-9
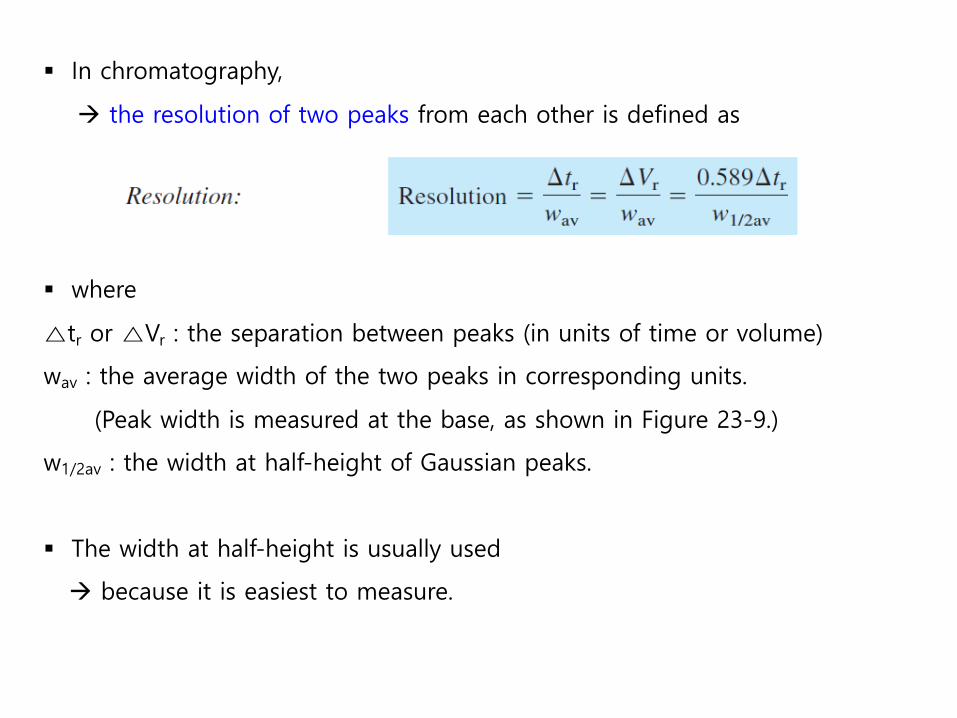
§ In chromatography,
à the resolution of two peaks from each other is defined as
§ where
△tr or △Vr : the separation between peaks (in units of time or volume)
wav : the average width of the two peaks in corresponding units.
(Peak width is measured at the base, as shown in Figure 23-9.)
w1/2av : the width at half-height of Gaussian peaks.
§ The width at half-height is usually used
à because it is easiest to measure.
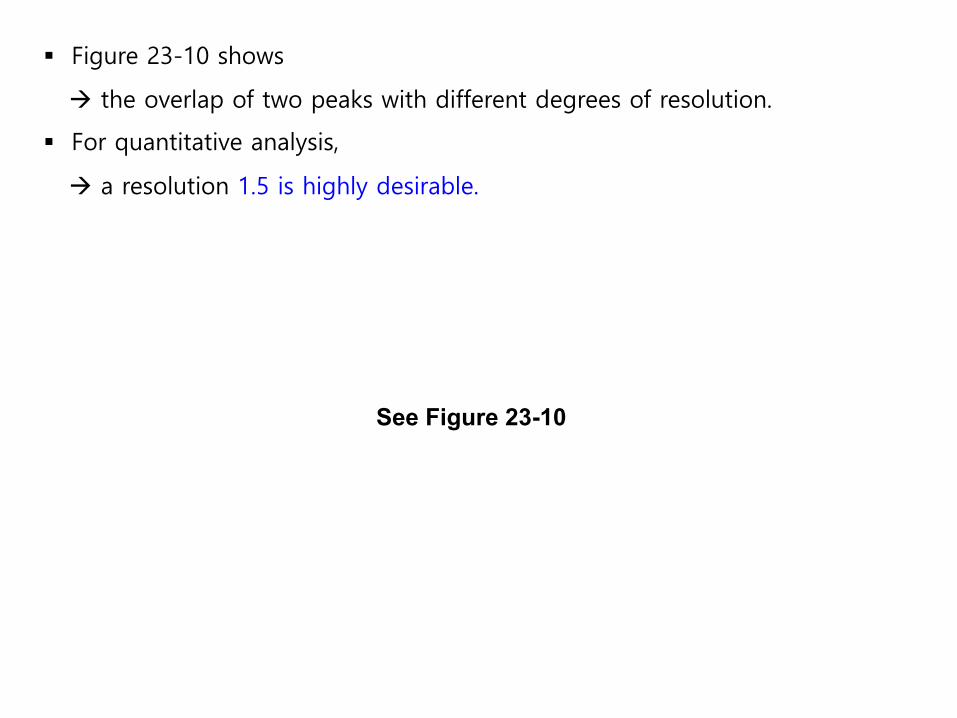
§ Figure 23-10 shows
à the overlap of two peaks with different degrees of resolution.
§ For quantitative analysis,
à a resolution 1.5 is highly desirable.
See Figure 23-10
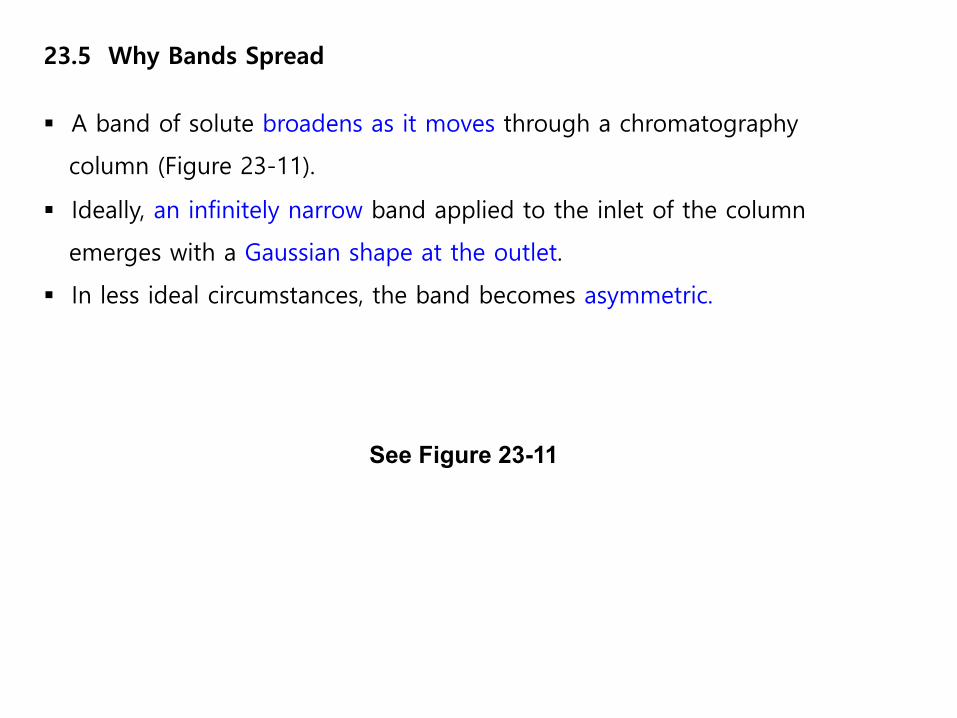
23.5 Why Bands Spread
§ A band of solute broadens as it moves through a chromatography
column (Figure 23-11).
§ Ideally, an infinitely narrow band applied to the inlet of the column
emerges with a Gaussian shape at the outlet.
§ In less ideal circumstances, the band becomes asymmetric.
See Figure 23-11
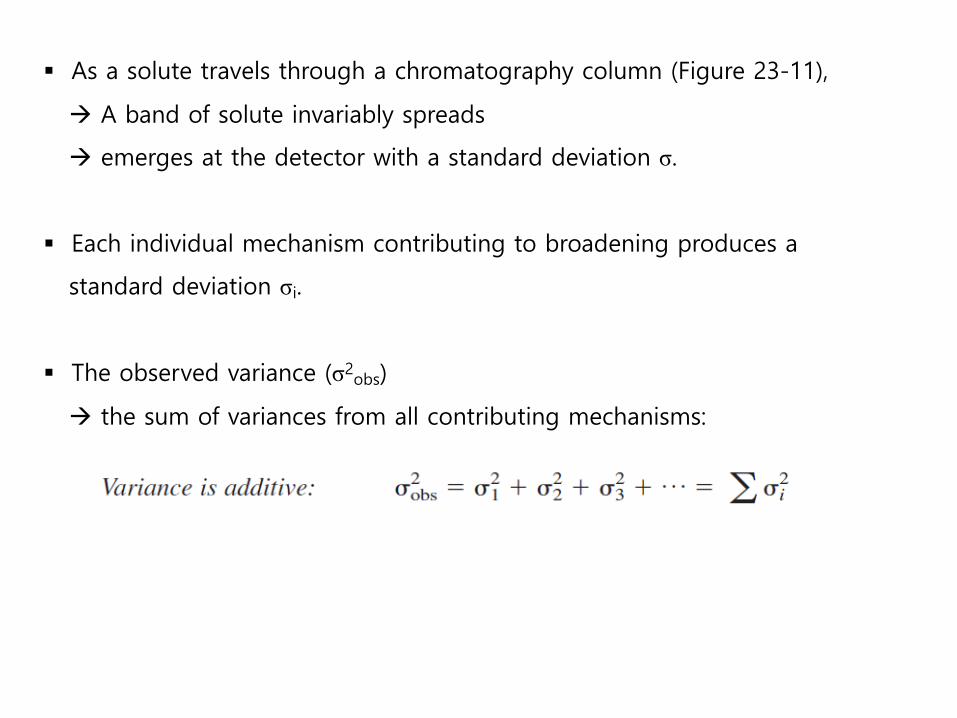
§ As a solute travels through a chromatography column (Figure 23-11),
à A band of solute invariably spreads
à emerges at the detector with a standard deviation σ.
§ Each individual mechanism contributing to broadening produces a
standard deviation σi.
§ The observed variance (σ2obs)
à the sum of variances from all contributing mechanisms:
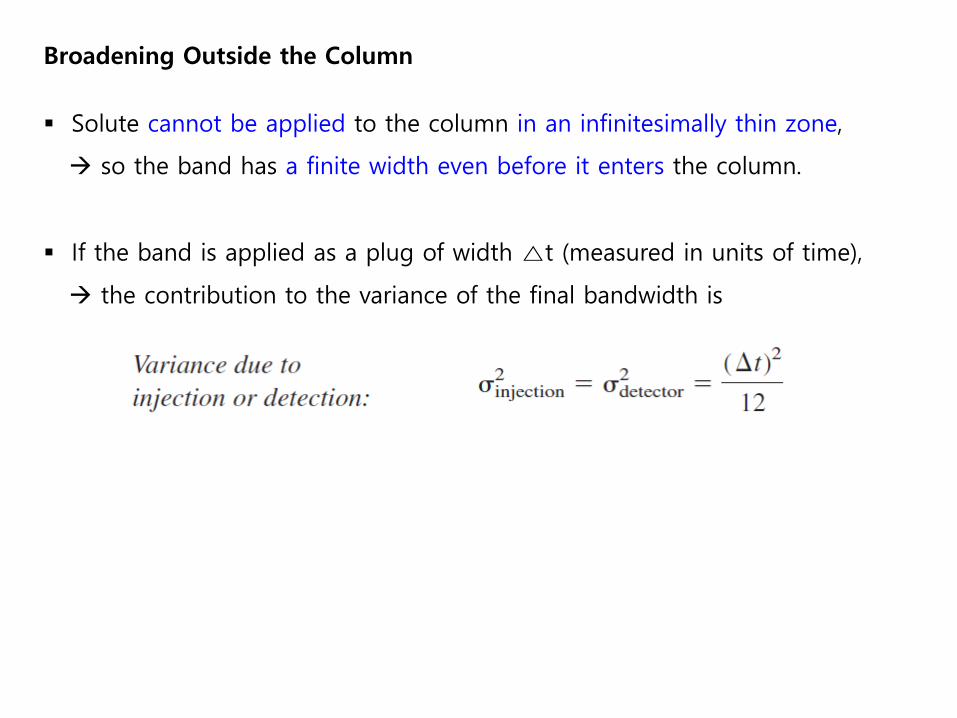
Broadening Outside the Column
§ Solute cannot be applied to the column in an infinitesimally thin zone,
à so the band has a finite width even before it enters the column.
§ If the band is applied as a plug of width △t (measured in units of time),
à the contribution to the variance of the final bandwidth is
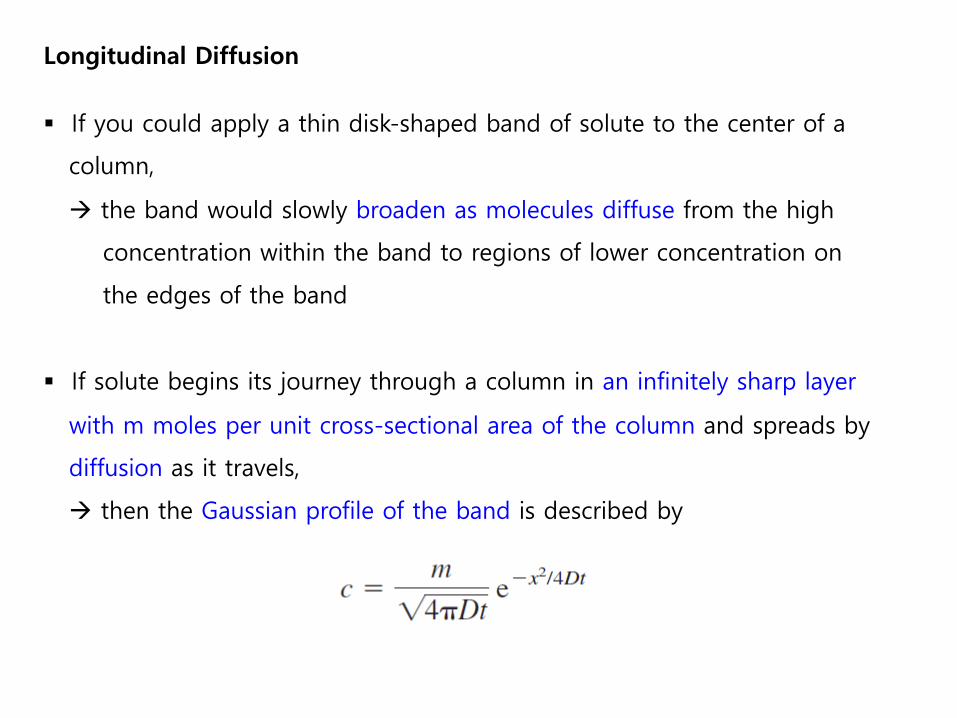
Longitudinal Diffusion
§ If you could apply a thin disk-shaped band of solute to the center of a
column,
à the band would slowly broaden as molecules diffuse from the high
concentration within the band to regions of lower concentration on
the edges of the band
§ If solute begins its journey through a column in an infinitely sharp layer
with m moles per unit cross-sectional area of the column and spreads by
diffusion as it travels,
à then the Gaussian profile of the band is described by
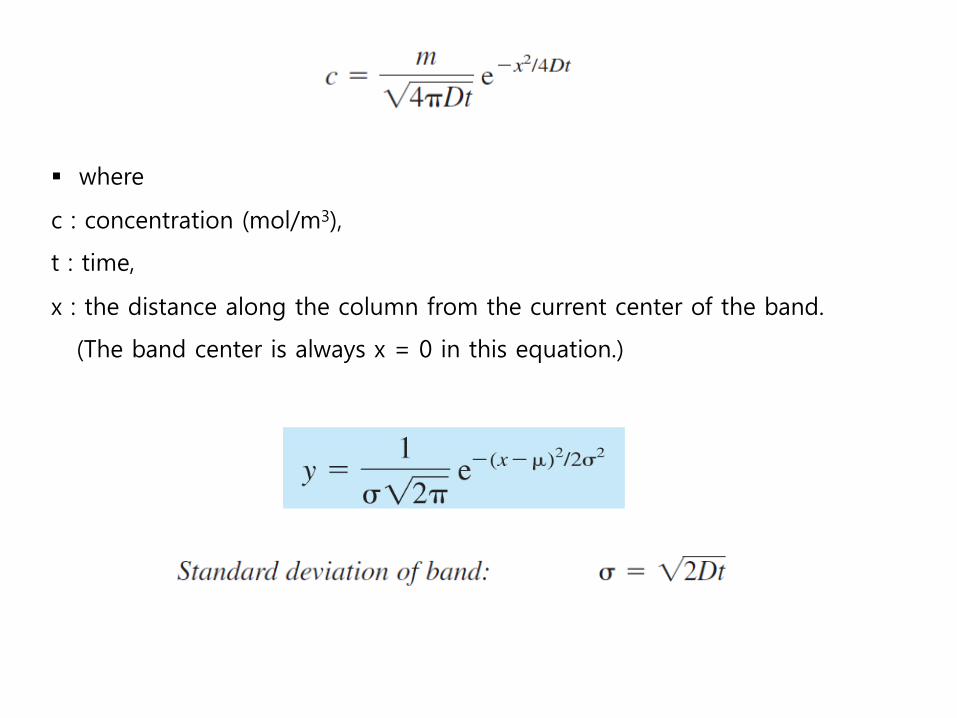
§ where
c : concentration (mol/m3),
t : time,
x : the distance along the column from the current center of the band.
(The band center is always x = 0 in this equation.)
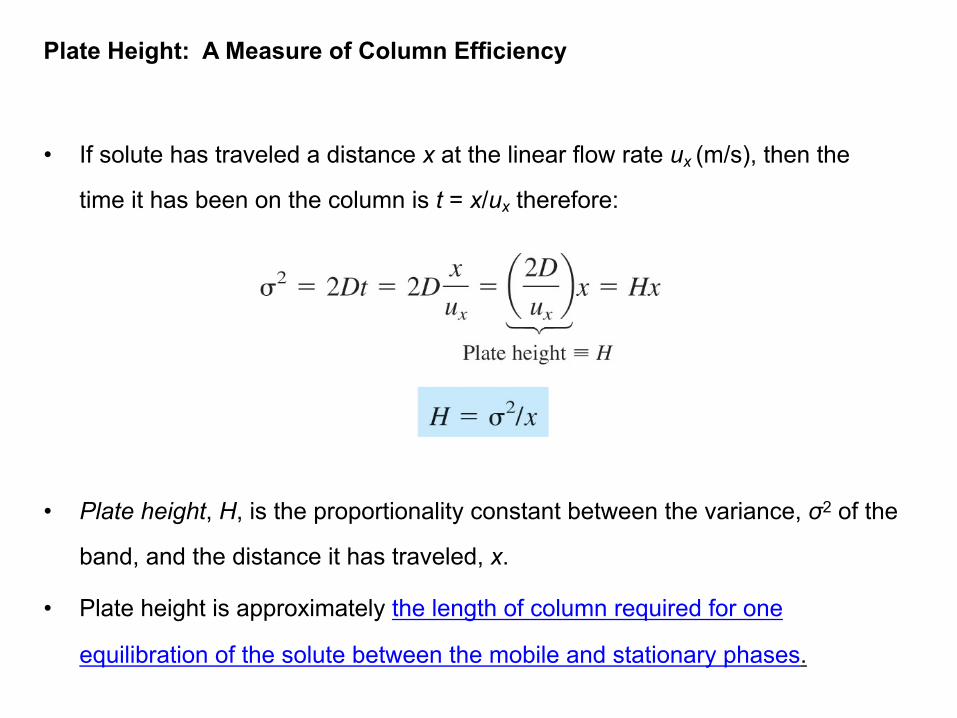
Plate Height: A Measure of Column Efficiency
• If solute has traveled a distance x at the linear flow rate ux (m/s), then the
time it has been on the column is t = x/ux therefore:
• Plate height, H, is the proportionality constant between the variance, σ2 of the
band, and the distance it has traveled, x.
• Plate height is approximately the length of column required for one
equilibration of the solute between the mobile and stationary phases.
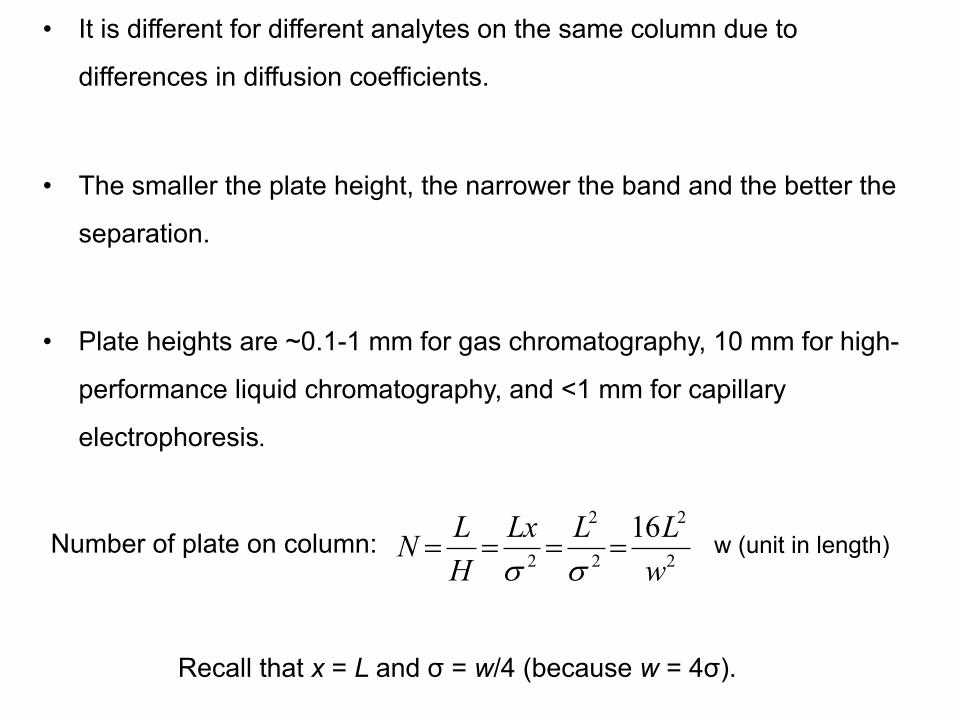
• It is different for different analytes on the same column due to
differences in diffusion coefficients.
• The smaller the plate height, the narrower the band and the better the
separation.
• Plate heights are ~0.1-1 mm for gas chromatography, 10 mm for high-
performance liquid chromatography, and <1 mm for capillary
electrophoresis.
Recall that x = L and σ = w/4 (because w = 4σ).
2
2
2
2
2
16wLLLx
HLN ====
ssw (unit in length)Number of plate on column:
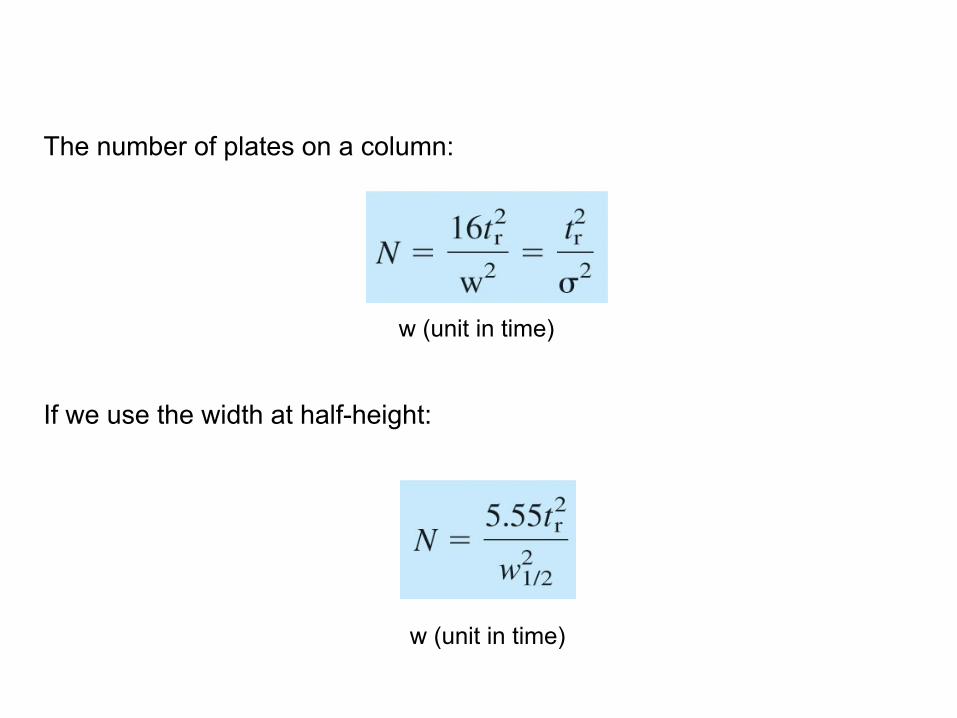
The number of plates on a column:
If we use the width at half-height:
w (unit in time)
w (unit in time)
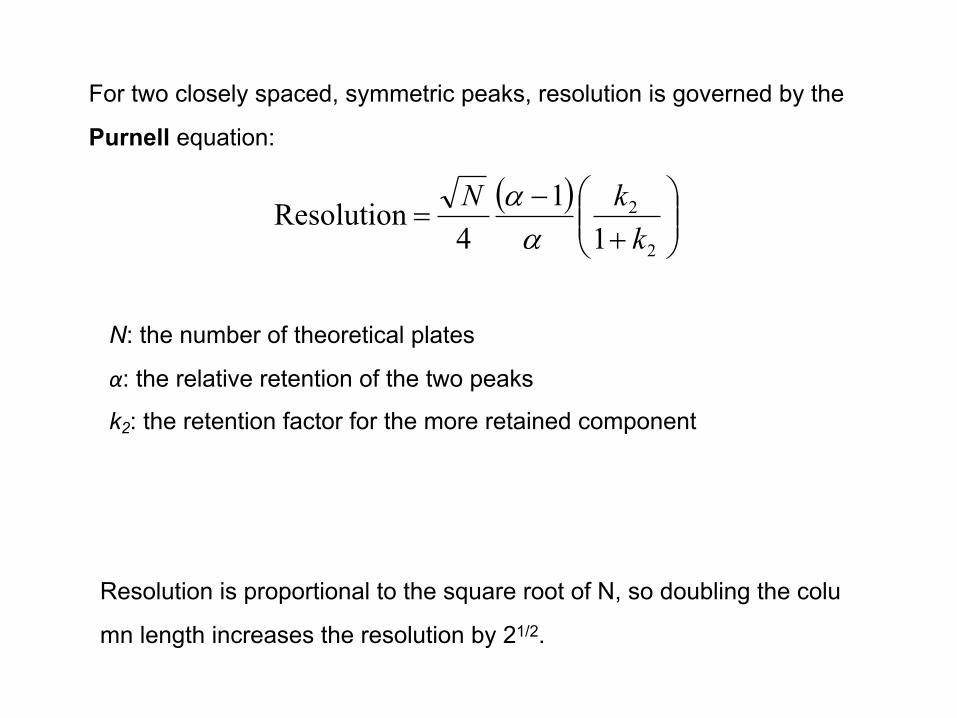
For two closely spaced, symmetric peaks, resolution is governed by the
Purnell equation:
( )÷÷ø
öççè
æ+
-=
2
2
11
4 Resolution
kkN
aa
Resolution is proportional to the square root of N, so doubling the colu
mn length increases the resolution by 21/2.
N: the number of theoretical plates
α: the relative retention of the two peaks
k2: the retention factor for the more retained component
§ Diffusional broadening of a band occurs
à while the band is transported along the column by the flow of solvent
§ called longitudinal diffusion
à because it takes place along the axis of the column
Back to “Longitudinal diffusion”
See Figure 23-18
Finite Equilibration Time Between Phases
§ Another broadening comes from the finite time required for solute to
equilibrate between mobile and stationary phases
§ Although some solute is stuck in the stationary phase, the
remainder in the mobile phase moves forward, spreading the overall zone
of solute (Figure 23-19).
See Figure 23-19
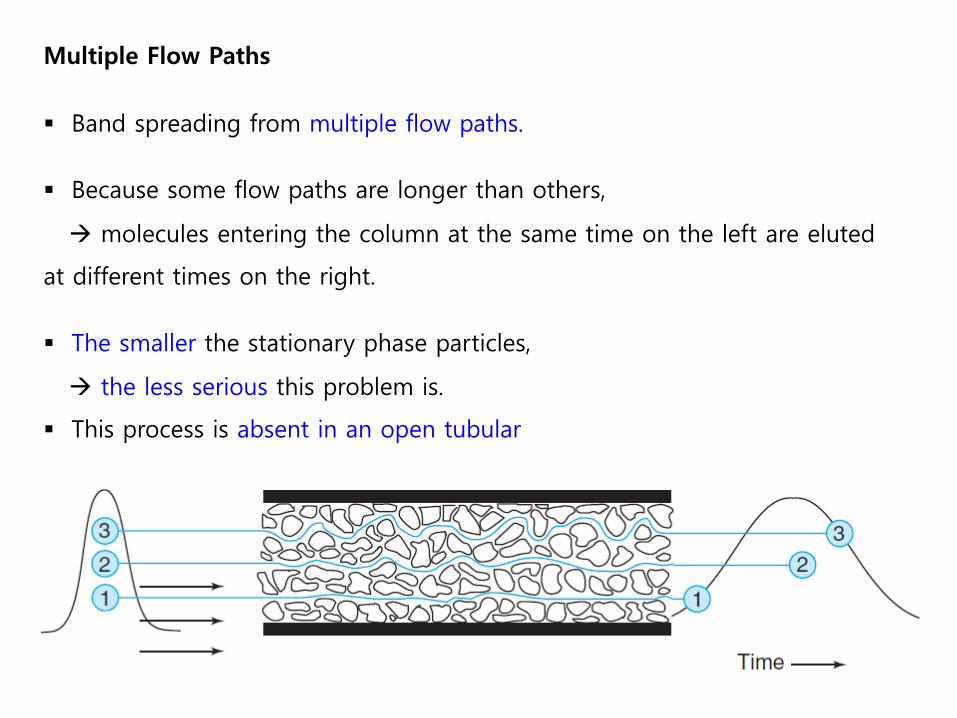
Multiple Flow Paths
§ Band spreading from multiple flow paths.
§ Because some flow paths are longer than others,
à molecules entering the column at the same time on the left are eluted
at different times on the right.
§ The smaller the stationary phase particles,
à the less serious this problem is.
§ This process is absent in an open tubular
Asymmetric Bandshapes
§ A long tail occurs when some sites retain solute more strongly than other
sites.
§ Silica surfaces of columns and stationary phase particles have hydroxyl
groups that form hydrogen bonds with polar solutes,
à thereby leading to serious tailing.
See Figure 23-14
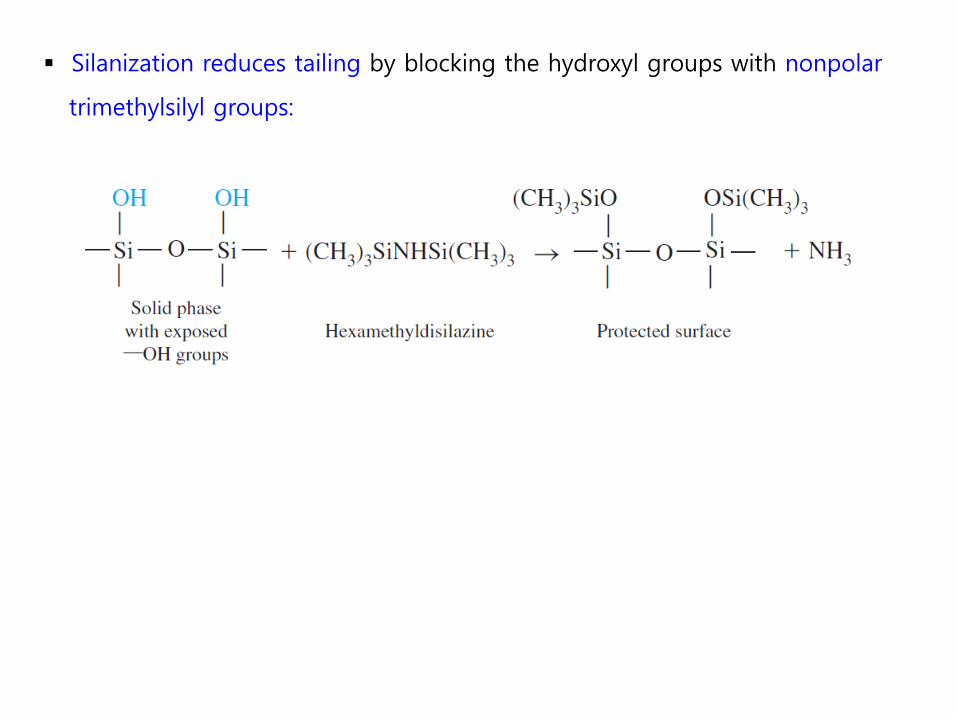
§ Silanization reduces tailing by blocking the hydroxyl groups with nonpolar
trimethylsilyl groups:
Analytical Chemistry
Chapter 24. Gas Chromatography
§ This chapter discusses
à discuss specific chromatographic methods and instrumentation.
§ The goal
à to understand how chromatographic methods work
à and what parameters you can control for best results.
24.1 The separation process in gas chromatography
§ Gas chromatography:
à mobile phase: gas
à stationary phase: usually a nonvolatile liquid, but sometimes a solid
à analyte: gas or volatile liquid
§ In gas chromatography,
à gaseous analyte is transported through the column by a gaseous mobile
phase, called the carrier gas.
In the schematic gas chromatograph,
§ volatile liquid or gaseous sample
à injected through a septum (a rubber disk) into a heated port,
à in which it rapidly evaporates.
§ Vapor is swept through the column by He, N2, or H2 carrier gas,
See Figure 24-1