
COMPRESSED AIR ENERGY STORAGE AND GEOGRAPHIC AGGREGATION: MUTUALLY REINFORCING ... · PDF...
8
COMPRESSED AIR ENERGY STORAGE AND GEOGRAPHIC AGGREGATION: MUTUALLY REINFORCING STRATEGIES FOR INTEGRATING WIND POWER Samir Succar 1 and Robert H. Williams 2 1 Natural Resources Defense Council, Washington, D.C. USA 2 Princeton Environmental Institute, Princeton University, Princeton, NJ USA By leveraging the geographic diversity of wind energy resources, the cost and emissions of baseload wind systems can be significantly reduced as a result of reduced capital cost requirements for balancing aggregated wind resources. Specifically, re-optimizing the CAES configuration, including the relative capacity of the compression and turboexpander trains as well as the storage capacity of the geologic reservoir, in response to changes in wind resource characteristics yields significant capital cost reductions for the CAES system which translates into lower levelized costs for baseload power from wind/CAES as well as reduced carbon emission intensities. Keywords: Compressed air energy storage, optimization, power systems economics, stochastic systems, wind energy NOMENCLATURE Parameters CWP Wind turbine array capital cost CF Capacity factor of combined system CFC CAES output capacity factor CFT Transmisssion Line Input CFT,l Transmission Line Losses CFWd Capacity factor contribution, direct wind CFWt Wind capacity factor, delivered CFWs Wind capacity factor, input to CAES CFWc Curtailed Wind Fraction EGHG GHG emission rate F Fuel Costs hy Hours per period l s CAES inventory M f Fixed Operations and Maintenance M v Variable Operations and Maintenance N T Number of wind turbines PL Target power delivered to load PW Aggregate wind turbine array output PWC Curtailed wind power PWP Total wind nameplate capacity PC CAES compressor input power PG CAES turboexpander output power PSC Simple cycle nameplate capacity PCC Combined cycle nameplate capacity PT Total power delivered Pwr Wind turbine rated capacity vr Wind turbine rated windspeed vavg Annual mean wind speed γ C CAES compressor minimum loading fraction γ G CAES turboexpander minimum loading fraction δ2 Diameter squared wind turbine array spacing η C CAES compressor efficiency η G CAES turboexpander efficiency η CER CAES charging energy ratio η A Wind turbine array efficiency τ FP Firm Power Fraction χ Levelized capital charge rate Variables hs Duration of storage at full output capacity rr Wind turbine rating ratio rf Wind turbine array relative capacity rC CAES compressor chain relative capacity rG CAES turboexpander relative capacity INTRODUCTION As the share of electricity produced by wind generation continues to grow, the impacts of wind’s variability will be increasingly felt on the grid [1, 2]. Electrical energy storage can be an important source of flexibility to help facilitate the integration of wind into the electric grid and can serve a wide range of grid support applications as well [3-5]. Although the integration of renewable energy can be facilitated by means of numerous sources of flexibility [6, 7], coupling of wind with energy storage can be an attractive strategy, especially where penetration levels of wind are high and transmission capacity is constrained [8]. Furthermore, colocation of wind and storage enables wind to serve baseload markets and maximizes utilization of transmission infrastructure for wind [9]. This analysis will focus on the economics of large- scale, electrical energy storage for producing baseload power from wind. A wide array of electrical energy storage technologies exist today, but bulk storage technologies scalable to the 100’s of megawatts and gigawatt-hours of energy storage capacity needed to provide firm power at utility scale are currently limited to pumped hydroelectric storage (PHS) and compressed air energy storage (CAES) [5]. The focus of this analysis will be on wind turbine arrays coupled with CAES due to the relatively low cost and potential for widespread availability of this type of energy storage in areas with high quality wind resources [10]. The role of electrical energy storage explored in this analysis is of directly coupled operation with a single wind facility to
Transcript of COMPRESSED AIR ENERGY STORAGE AND GEOGRAPHIC AGGREGATION: MUTUALLY REINFORCING ... · PDF...
COMPRESSED AIR ENERGY STORAGE AND GEOGRAPHIC AGGREGATION: MUTUALLY REINFORCING STRATEGIES FOR INTEGRATING WIND POWER
Samir Succar1 and Robert H. Williams2 1 Natural Resources Defense Council, Washington, D.C. USA
2 Princeton Environmental Institute, Princeton University, Princeton, NJ USA
By leveraging the geographic diversity of wind energy resources, the cost and emissions of baseload wind systems can be significantly reduced as a result of reduced capital cost requirements for balancing aggregated wind resources. Specifically, re-optimizing the CAES configuration, including the relative capacity of the compression and turboexpander trains as well as the storage capacity of the geologic reservoir, in response to changes in wind resource characteristics yields significant capital cost reductions for the CAES system which translates into lower levelized costs for baseload power from wind/CAES as well as reduced carbon emission intensities.
Keywords: Compressed air energy storage, optimization, power systems economics, stochastic systems, wind energy
NOMENCLATURE
Parameters
CWP Wind turbine array capital cost
CF Capacity factor of combined system
CFC CAES output capacity factor
CFT Transmisssion Line Input
CFT,l Transmission Line Losses
CFWd Capacity factor contribution, direct wind
CFWt Wind capacity factor, delivered
CFWs Wind capacity factor, input to CAES
CFWc Curtailed Wind Fraction
EGHG GHG emission rate
F Fuel Costs
hy Hours per period
ls CAES inventory
Mf Fixed Operations and Maintenance
Mv Variable Operations and Maintenance
NT Number of wind turbines
PL Target power delivered to load
PW Aggregate wind turbine array output
PWC Curtailed wind power
PWP Total wind nameplate capacity
PC CAES compressor input power
PG CAES turboexpander output power
PSC Simple cycle nameplate capacity
PCC Combined cycle nameplate capacity
PT Total power delivered
Pwr Wind turbine rated capacity
vr Wind turbine rated windspeed
vavg Annual mean wind speed
γC CAES compressor minimum loading fraction
γG CAES turboexpander minimum loading fraction
δ2 Diameter squared wind turbine array spacing
ηC CAES compressor efficiency
ηG CAES turboexpander efficiency
ηCER CAES charging energy ratio
ηA Wind turbine array efficiency
τFP Firm Power Fraction
χ Levelized capital charge rate
Variables
hs Duration of storage at full output capacity
rr Wind turbine rating ratio
rf Wind turbine array relative capacity
rC CAES compressor chain relative capacity
rG CAES turboexpander relative capacity
INTRODUCTION
As the share of electricity produced by wind generation continues to grow, the impacts of wind’s variability will be increasingly felt on the grid [1, 2]. Electrical energy storage can be an important source of flexibility to help facilitate the integration of wind into the electric grid and can serve a wide range of grid support applications as well [3-5]. Although the integration of renewable energy can be facilitated by means of numerous sources of flexibility [6, 7], coupling of wind with energy storage can be an attractive strategy, especially where penetration levels of wind are high and transmission capacity is constrained [8]. Furthermore, colocation of wind and storage enables wind to serve baseload markets and maximizes utilization of transmission infrastructure for wind [9].
This analysis will focus on the economics of large-scale, electrical energy storage for producing baseload power from wind. A wide array of electrical energy storage technologies exist today, but bulk storage technologies scalable to the 100’s of megawatts and gigawatt-hours of energy storage capacity needed to provide firm power at utility scale are currently limited to pumped hydroelectric storage (PHS) and compressed air energy storage (CAES) [5]. The focus of this analysis will be on wind turbine arrays coupled with CAES due to the relatively low cost and potential for widespread availability of this type of energy storage in areas with high quality wind resources [10]. The role of electrical energy storage explored in this analysis is of directly coupled operation with a single wind facility to
produce baseload power. This analysis does not attempt to reflect the many other market functions that energy storage can provide on a system [4, 5, 11-14], but rather to analyze the economic value of co-optimization of storage and wind rating ratio within the context of a specific operational mode.
The backup requirements needed to provide baseload power from wind depend critically on the variability of the wind resource. Aggregation of multiple wind sites over a broad geographic region can substantially mitigate this variability by reducing the frequency of both high and low wind speed events [15]. This paper will investigate the impacts of this resource aggregation on the backup requirements for producing baseload power from wind/storage systems.
METHODOLOGY
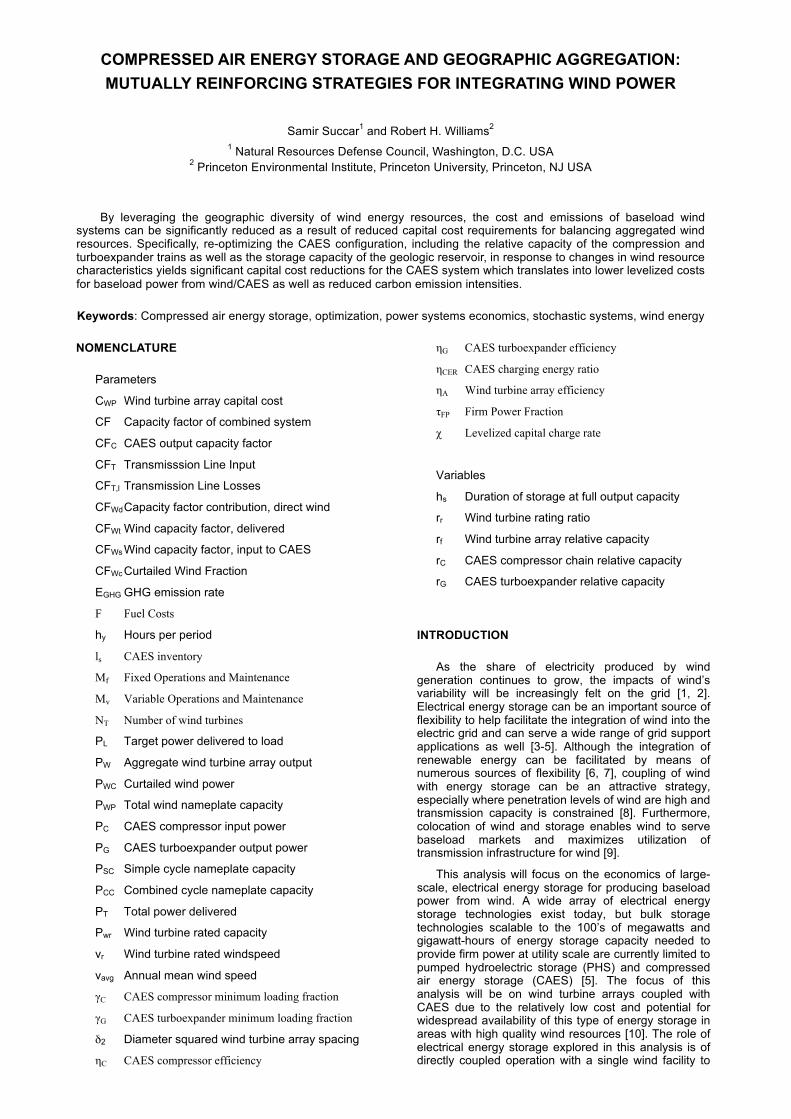
The cost dynamics of baseload wind systems are described here as a function of wind resource diversity and choice of backup technology. Baseload power subject to constant 2000 MW demand (i.e. 14.9 TWh/y) is modeled as a remote wind resource 750km from load with backup available through either CAES collocated with wind or stand-alone natural gas fired capacity at the load (see Error! Reference source not found.). Although the model allows wind to be backed by any combination of storage and natural gas capacity, the cost optimization does not ultimately favor a dual-backup solution. Because systems with both storage and dispatchable generation backing wind imply some degree of redundant capacity, the model always chooses to either back wind entirely with local natural gas capacity or collocated CAES.
Figure 1 Schematic diagram of the model This simplification allows the cost comparison to be
framed as a three-way competition between a reference conventional baseload technology (CCGT), Wind/Gas (wind backed by local CCGT and SCGT capacity) and Wind/CAES (wind backed by compressed air energy storage) [9].
The optimization model is formulated to minimize the levelized cost of energy of the combined system as defined in equation (1) below.
minCn ⋅ χ +Mn, f
hy+Mn,v +Fn
"
#$$
%
&''n
∑ ⋅PLPT ,tt
∑ (1)
With respect the optimization of the Wind/CAES system configuration, the cost optimization is carried out subject to the following constraints:
PT ,t = PW ,t −PC,t −PWC,t +PG,t ≤ PL (2)
PT ,tPLt
∑ ≥ τ FP (3)
p(PT ≥ PL ) ≥ τ FP (4)
γGrGPL ≤ PG,t ≤ rGPL (5)
γCrCPL ≤ PC,t ≤ rCPL (6)
PC,t ≤ PW ,t −PL (7)
PG,t ≤ PL −PW ,t (8)
ls,t = ls,t−1 +PC,t ⋅ηC −PG,t ⋅ηG (9)
ηCER =ηG
ηC
(10)
0 ≤ ls,t ≤ hsrGPL (11)
The constraint in equation (2) defines the total power delivered from the Wind/CAES system as the net wind power output plus the contribution from CAES subject to a fixed upper bound. In this case, the net wind output refers to the wind output delivered directly and excludes the curtailed wind generation and the wind generation used to run the CAES compressor train.
The constraints in (3) and (4) describe how the firm power fraction is applied. The firm power fraction is used to ensure that the capacity value of the Wind/CAES system is equivalent to that of a conventional baseload unit. In this reduced form cost optimization model, the calculation of loss of load expectation that would be necessary to calculate the effective load capability of the unit is not feasible [16, 17]. The alternative methodology adopted in this case it to apply the firm power fraction as a capacity factor constraint in (3) and a threshold point for the power duration curve of the system meeting the target nameplate capacity of the system where the x-axis is normalized to include values from zero to unity [9]. The latter constraint is expressed in equation (4) in terms of a special case of the cumulative probability distribution function where the integral is taken from PL,to positive infinity, which is the inverse of the system power duration curve. Because the power duration curve is a monotonically decreasing function, the formulation in equation (4) is functionally equivalent to a minimum power duration curve value at a given x-intercept.
Equations (5)-(8) define the output constraints and minimum loading limits for the compressor and expander trains described previously by Greenblatt et al [9]. Finally, equations (9)-(12) describe the storage inventory management and constraints as well as the charging energy ratio for the CAES system [10].
The optimization of the Wind/Gas system is carried out in much the same way but in simplified form. When conventional gas units are used to provide backup, the only degree of freedom in the optimization is the combined nameplate capacity need to meet the baseload power requirements in equations (3) and (4) and the cost-optimal mix of simple cycle (SC) and combined cycle (CC) capacity as determined by the shape of the power duration curve for the natural gas backup block.
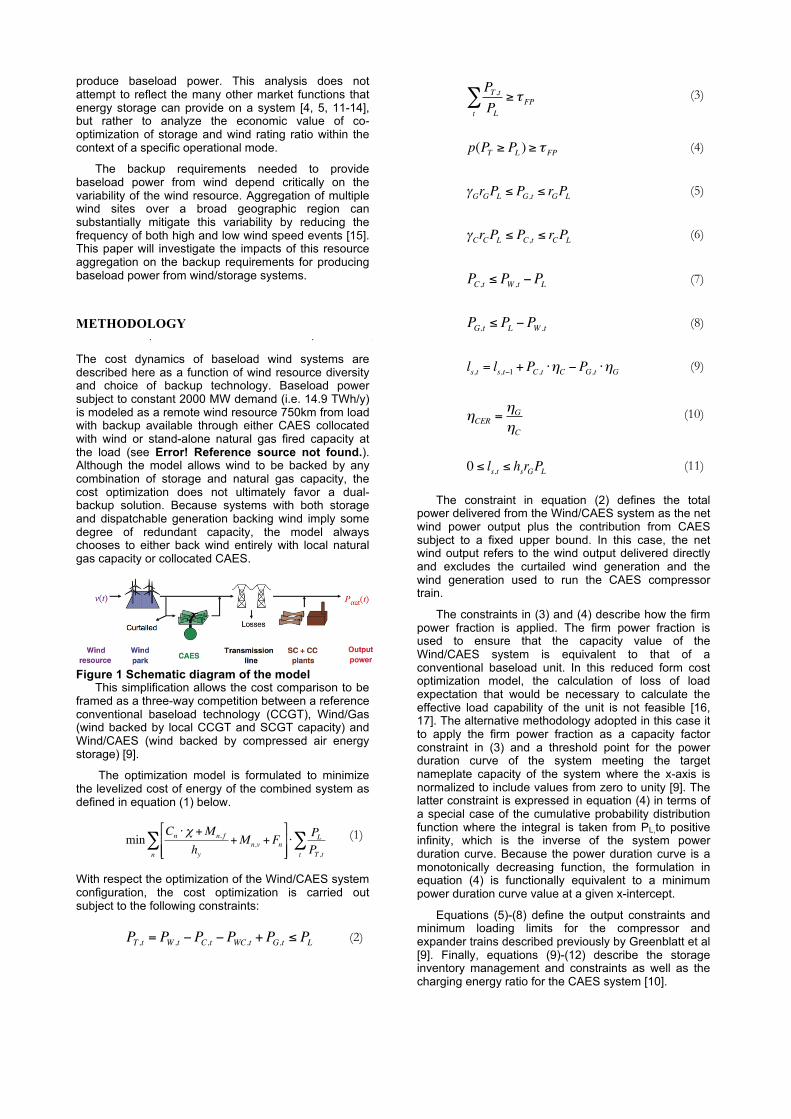
The power duration curves in Figure 2 depict the sources of power and cumulative output for these three systems, each of which is constrained to deliver a minimum capacity factor of 85%. The natural gas fired generation is local to load and it is assumed that wind and CAES are collocated and served by a 750km, 500kV HVDC transmission line. Base modeling assumptions are presented in Table 1.
Table 1. Base case parameters
Parameter Value Units Ref
Load power PL 2.0 GW
Firm power fraction τFP 85 %
Levelized capital
charge ratea
χ 11.5 %/yr
Natural gas pricea pNGeff 5.5 $/GJ HHV [18]
GHG intensity,
natural gasa ,b
66.0
(55.6)
kgCO2/GJ
(GJ/tCe.)
[19]
Wind OCC CWP,0 2140 $/kW [20]
Wind FOM MW,F 28.07 $/kW-yr [18]
Wind VOM CW,V 0 $/MWh [18]
CAES BOP ratiod RBOP 63 % [5, 21]
CAES heat ratea HRC 4220 kJ/kWh [5, 21]
CAES comp d CM 280 $/kW [5, 21]
CAES exp td CE 310 $/kW [5, 21]
CAES storage e CS 2.09 $/kWh [5, 22]
CAES FOM MC,F 4.79 $/kW-yr [5, 21]
CAES VOM MC,V 3.59 $/MWh [5, 21]
a Thermal content stated in LHV basis, except energy prices are on a higher heating value (HHV) basis—the norm for US energy pricing.
b Natural gas carbon dioxide content of 55.6 kgCO2/GJ LHV [23] and upstream GHG emissions (10.4 kgCO2/GJ LHV) [19].
c Extrapolated from 10 m reference Class 4 wind speed (5.77 m/s) using 1/7 scaling exponent to assumed hub height of 120 m.
d Costs determined from information provided by EPRI and DOE [5, 21] and commercial vendors.
e Storage cost for solution mined domal salt or porous rock formations.
The cost optimization results in three baseload systems that rely on a combination of wind and natural gas to deliver baseload power. Because the heat rate of
the storage system is relatively low (4220 versus 6700 kJ LHV/kWh for CCGT) and because Wind/CAES delivers the largest fraction of its power from wind directly, this system represents the plant with the lowest greenhouse gas (GHG) emission rate of the three considered here (83.9 gCO2/kWh). By comparison, the CCGT option has a GHG emission rate of approximately 440 gCO2/kWh, while Wind/Gas generates 265 gCO2/kWh. The result is a cost of energy competition between the three systems that depends on the price of fuel, or alternatively GHG emissions price.
Because all the systems in this analysis use natural gas as their fuel, changes in GHG emissions price pGHG (with a constant, nominal fuel price pNG=$5.5/GJ HHV [23]) can be equivalently expressed in terms of changes in fuel price pNG (with a constant, nominal GHG emissions price pGHG=$0/tCe). The equivalence between pNG and pGHG is established by the nominal value of each parameter and the greenhouse gas emissions intensity of the fuel. The value used here is the sum of the carbon content of natural gas (55.6kg CO2/GJ LHV [23]) and the upstream emission rate (10.4 kgCO2/GJ LHV [19]), which means a $30/tCO2 increase in pGHG is equivalent to an “effective” fuel price increase of $1.78/GJ HHV. Thus, we can describe changes in effective fuel price in terms of pGHG or pNG.
Figure 2 Power duration curves for three alternative baseload systems: CCGT (top left), Wind/Gas (top right), Wind/CAES (bottom left), N=1
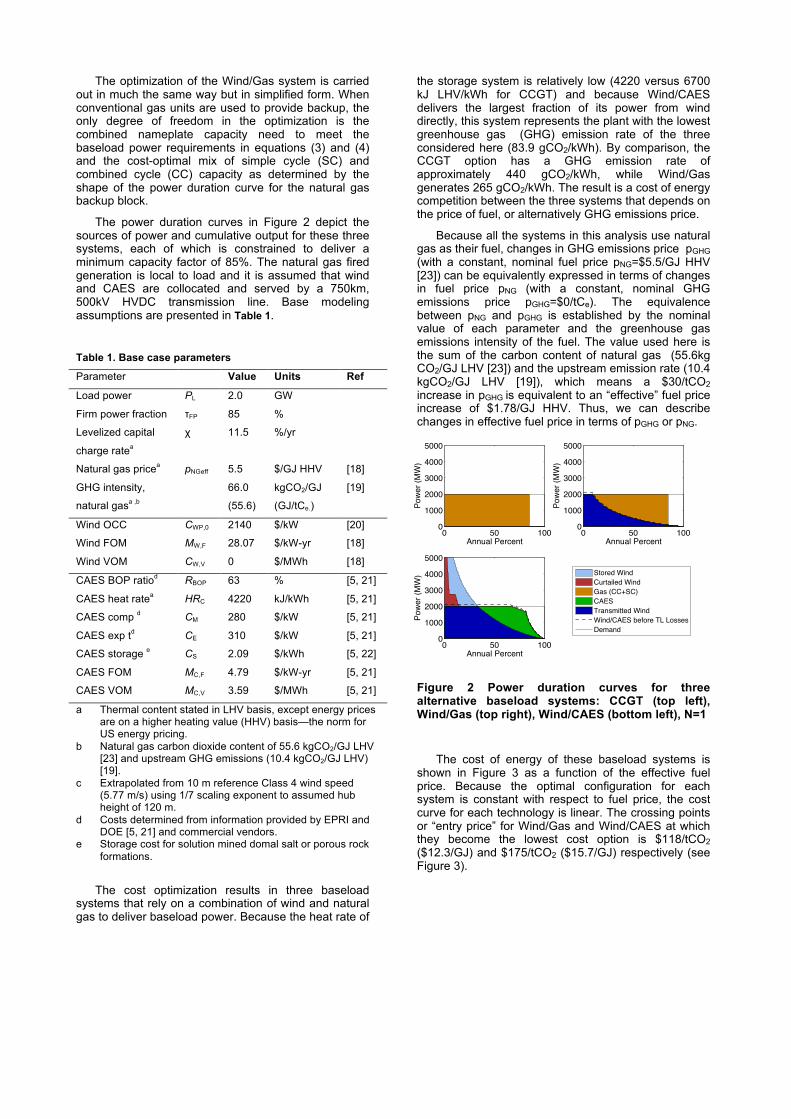
The cost of energy of these baseload systems is shown in Figure 3 as a function of the effective fuel price. Because the optimal configuration for each system is constant with respect to fuel price, the cost curve for each technology is linear. The crossing points or “entry price” for Wind/Gas and Wind/CAES at which they become the lowest cost option is $118/tCO2 ($12.3/GJ) and $175/tCO2 ($15.7/GJ) respectively (see Figure 3).
0 50 1000
1000
2000
3000
4000
5000
Annual Percent
Pow
er (M
W)
0 50 1000
1000
2000
3000
4000
5000
Annual PercentPo
wer
(MW
)
0 50 1000
1000
2000
3000
4000
5000
Annual Percent
Pow
er (M
W) Stored Wind
Curtailed WindGas (CC+SC)CAESTransmitted WindWind/CAES before TL LossesDemand
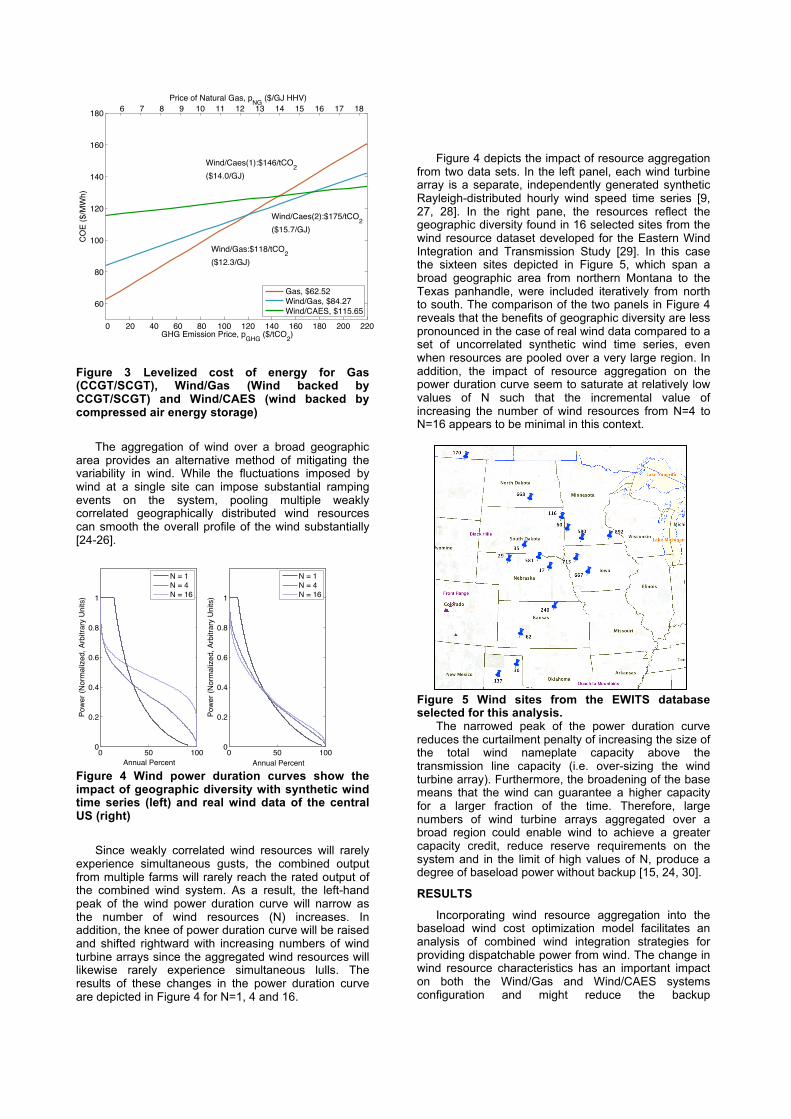
Figure 3 Levelized cost of energy for Gas (CCGT/SCGT), Wind/Gas (Wind backed by CCGT/SCGT) and Wind/CAES (wind backed by compressed air energy storage)
The aggregation of wind over a broad geographic area provides an alternative method of mitigating the variability in wind. While the fluctuations imposed by wind at a single site can impose substantial ramping events on the system, pooling multiple weakly correlated geographically distributed wind resources can smooth the overall profile of the wind substantially [24-26].
Figure 4 Wind power duration curves show the impact of geographic diversity with synthetic wind time series (left) and real wind data of the central US (right)
Since weakly correlated wind resources will rarely experience simultaneous gusts, the combined output from multiple farms will rarely reach the rated output of the combined wind system. As a result, the left-hand peak of the wind power duration curve will narrow as the number of wind resources (N) increases. In addition, the knee of power duration curve will be raised and shifted rightward with increasing numbers of wind turbine arrays since the aggregated wind resources will likewise rarely experience simultaneous lulls. The results of these changes in the power duration curve are depicted in Figure 4 for N=1, 4 and 16.
Figure 4 depicts the impact of resource aggregation from two data sets. In the left panel, each wind turbine array is a separate, independently generated synthetic Rayleigh-distributed hourly wind speed time series [9, 27, 28]. In the right pane, the resources reflect the geographic diversity found in 16 selected sites from the wind resource dataset developed for the Eastern Wind Integration and Transmission Study [29]. In this case the sixteen sites depicted in Figure 5, which span a broad geographic area from northern Montana to the Texas panhandle, were included iteratively from north to south. The comparison of the two panels in Figure 4 reveals that the benefits of geographic diversity are less pronounced in the case of real wind data compared to a set of uncorrelated synthetic wind time series, even when resources are pooled over a very large region. In addition, the impact of resource aggregation on the power duration curve seem to saturate at relatively low values of N such that the incremental value of increasing the number of wind resources from N=4 to N=16 appears to be minimal in this context.
Figure 5 Wind sites from the EWITS database selected for this analysis.
The narrowed peak of the power duration curve reduces the curtailment penalty of increasing the size of the total wind nameplate capacity above the transmission line capacity (i.e. over-sizing the wind turbine array). Furthermore, the broadening of the base means that the wind can guarantee a higher capacity for a larger fraction of the time. Therefore, large numbers of wind turbine arrays aggregated over a broad region could enable wind to achieve a greater capacity credit, reduce reserve requirements on the system and in the limit of high values of N, produce a degree of baseload power without backup [15, 24, 30].
RESULTS
Incorporating wind resource aggregation into the baseload wind cost optimization model facilitates an analysis of combined wind integration strategies for providing dispatchable power from wind. The change in wind resource characteristics has an important impact on both the Wind/Gas and Wind/CAES systems configuration and might reduce the backup
6 7 8 9 10 11 12 13 14 15 16 17 18Price of Natural Gas, pNG ($/GJ HHV)
0 20 40 60 80 100 120 140 160 180 200 220
60
80
100
120
140
160
180
GHG Emission Price, pGHG ($/tCO2)
CO
E ($
/MW
h)
Wind/Gas:$118/tCO2($12.3/GJ)
Wind/Caes(2):$175/tCO2($15.7/GJ)
Wind/Caes(1):$146/tCO2($14.0/GJ)
Gas, $62.52Wind/Gas, $84.27Wind/CAES, $115.65
0 50 1000
0.2
0.4
0.6
0.8
1
Annual Percent
Pow
er (N
orm
aliz
ed, A
rbitr
ary
Uni
ts)
0 50 1000
0.2
0.4
0.6
0.8
1
Annual Percent
Pow
er (N
orm
aliz
ed, A
rbitr
ary
Uni
ts)
N = 1N = 4N = 16
N = 1N = 4N = 16
requirements needed to meet baseload power requirements. Therefore this combined approach of both mitigating wind variability through resource aggregation and firming output with backup capacity might result in super-additive cost benefits for baseload wind systems in this analysis and for wind integration more broadly.
For the N=1 case, the rated capacity of the wind turbine array in the Wind/Gas system was matched to the transmission line capacity in order to minimize wind curtailment (see Figure 2). However, as the system takes advantage of greater resource diversity, the wind output can be increasingly oversized with respect to the line at minimal curtailment penalty (see Figure 6). By comparison, for the N=16 case, the wind capacity can be sized to 1.45 times the transmission.
The over-sizing of the wind system enhances the utilization of the long distance transmission line since a greater fraction of the full system output comes from the remote wind rather than the local natural gas backup. In this case transmission line capacity factor increases from 35% for a single wind site, to 49% and 52% for N = 4 and 16 respectively (curtailed output accounted for <2% of delivered energy). Because resource aggregation enables a greater fraction of the 85% capacity factor to be delivered from wind and reduces reliance on backup generation, it also results in a 30% reduction in greenhouse gas emissions for the system as a whole (see Figure 6).
Figure 6 Power duration curves for Wind/Gas (top) and Wind/CAES (bottom) for N=1 (left), N=4 (center) and N=16 (right).
Combining the output from multiple wind resources also has significant impacts on the Wind/CAES system. Although prior studies have suggested that CAES is not economic on the system when wind resources are pooled over a large region [31], these results do not capture the benefits of re-optimizing the storage system for changing wind resource dynamics. The storage system for the Wind/CAES system described above is optimized for backing a single Rayleigh-distributed wind resource (N=1). The different output characteristics for the aggregated wind resource system allow the compressor, expander and storage reservoir of the storage system to be scaled down considerably. Therefore, applying an N=1 CAES system to the N>1 case results in a suboptimal system configuration.
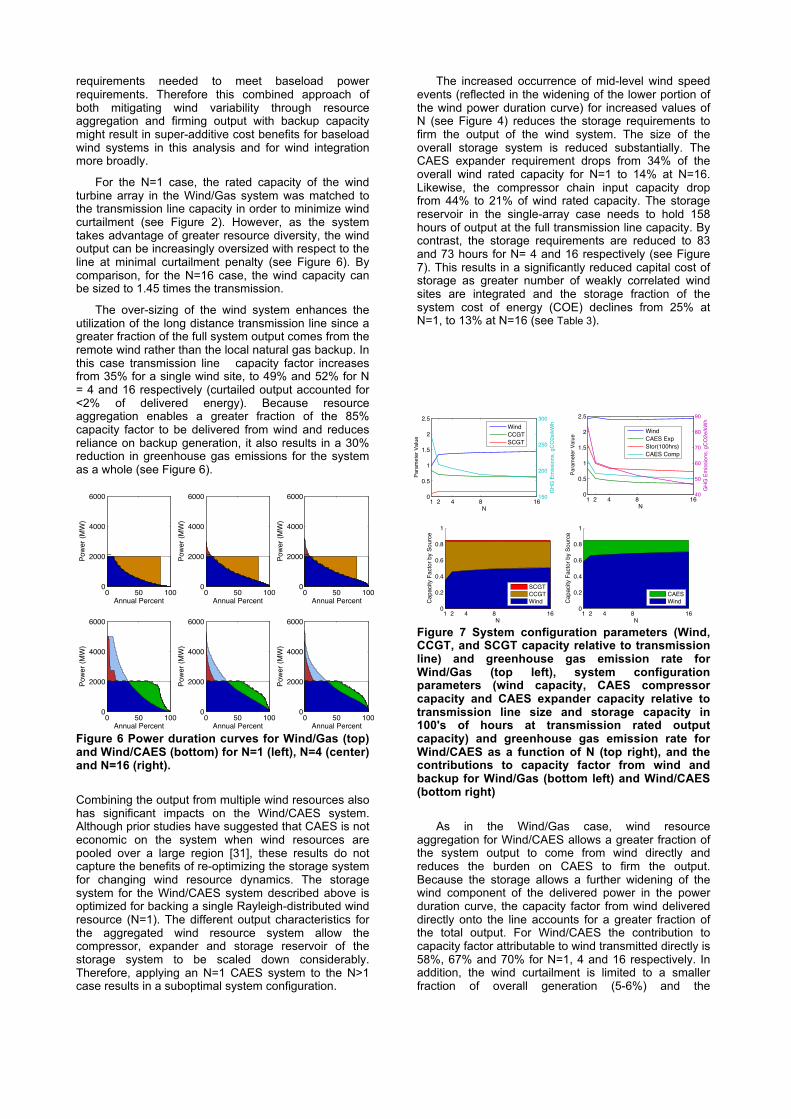
The increased occurrence of mid-level wind speed events (reflected in the widening of the lower portion of the wind power duration curve) for increased values of N (see Figure 4) reduces the storage requirements to firm the output of the wind system. The size of the overall storage system is reduced substantially. The CAES expander requirement drops from 34% of the overall wind rated capacity for N=1 to 14% at N=16. Likewise, the compressor chain input capacity drop from 44% to 21% of wind rated capacity. The storage reservoir in the single-array case needs to hold 158 hours of output at the full transmission line capacity. By contrast, the storage requirements are reduced to 83 and 73 hours for N= 4 and 16 respectively (see Figure 7). This results in a significantly reduced capital cost of storage as greater number of weakly correlated wind sites are integrated and the storage fraction of the system cost of energy (COE) declines from 25% at N=1, to 13% at N=16 (see Table 3).
Figure 7 System configuration parameters (Wind, CCGT, and SCGT capacity relative to transmission line) and greenhouse gas emission rate for Wind/Gas (top left), system configuration parameters (wind capacity, CAES compressor capacity and CAES expander capacity relative to transmission line size and storage capacity in 100's of hours at transmission rated output capacity) and greenhouse gas emission rate for Wind/CAES as a function of N (top right), and the contributions to capacity factor from wind and backup for Wind/Gas (bottom left) and Wind/CAES (bottom right)
As in the Wind/Gas case, wind resource aggregation for Wind/CAES allows a greater fraction of the system output to come from wind directly and reduces the burden on CAES to firm the output. Because the storage allows a further widening of the wind component of the delivered power in the power duration curve, the capacity factor from wind delivered directly onto the line accounts for a greater fraction of the total output. For Wind/CAES the contribution to capacity factor attributable to wind transmitted directly is 58%, 67% and 70% for N=1, 4 and 16 respectively. In addition, the wind curtailment is limited to a smaller fraction of overall generation (5-6%) and the
0 50 1000
2000
4000
6000
Annual Percent
Pow
er (M
W)
0 50 1000
2000
4000
6000
Annual Percent
Pow
er (M
W)
0 50 1000
2000
4000
6000
Annual Percent
Pow
er (M
W)
0 50 1000
2000
4000
6000
Annual Percent
Pow
er (M
W)
0 50 1000
2000
4000
6000
Annual Percent
Pow
er (M
W)
0 50 1000
2000
4000
6000
Annual Percent
Pow
er (M
W)
1 2 4 8 160
0.5
1
1.5
2
2.5Pa
ram
eter
Val
ue
N
150
200
250
300
GH
G E
mis
sion
s, g
CO
2e/k
WhWind
CCGTSCGT
1 2 4 8 160
0.5
1
1.5
2
2.5
Para
met
er V
alue
N
40
50
60
70
80
90
GH
G E
mis
sion
s, g
CO
2e/k
Wh
WindCAES ExpStor(100hrs)CAES Comp
1 2 4 8 160
0.2
0.4
0.6
0.8
1
N
Cap
acity
Fac
tor b
y So
urce
SCGTCCGTWind
1 2 4 8 160
0.2
0.4
0.6
0.8
1
N
Cap
acity
Fac
tor b
y So
urce
CAESWind
greenhouse gas emission rate declines rapidly (see Table 2)
As N increases, the wind capacities of Wind/Gas increases by 45% from N=1 (2.1 GW) to N=16 (3.03 GW) as shown in Figure 7. The Wind/CAES system on the other hand experience a small decrease in installed wind capacity for larger N. Therefore, although both systems benefit from reduced backup requirements at higher N values, the large increase in wind capacity needed in the Wind/Gas case offsets some of the cost reductions and therefore the benefit from geographic diversity to the system with storage backup capacity is greater.
Table 2. Wind/CAES Optimization results.
Unit N=1 N=4 N=16
Variables
PWP GW 5.11 5.03 5.06
NWT 1059 1120 1162
rf 2.44 2.40 2.41
PC GW 2.27 1.34 1.08
PG GW 1.74 0.90 0.73
hs h 158 83 73
rG 0.83 0.43 0.35
rC 1.08 0.64 0.51
Outputs
CFWd % 58.4% 66.8% 70.3%
CFC % 17.7% 12.2% 9.8%
CFWc % 9.1% 5.8% 5.7%
CFWs % 26.6% 18.2% 14.7%
CFT % 88.9% 88.8% 88.8%
CFT,l % 3.9% 3.8% 3.8%
CF % 85.0% 85.0% 85.0%
EGHG gCO2./
kWh
83.9 57.5 46.5
The impact of geographic diversity on overall system costs for baseload wind systems has critical implications for the cost and performance of these facilities. Since the variability in the resource is mitigated to a substantial degree, the capital cost required to achieve baseload performance is significantly reduced.
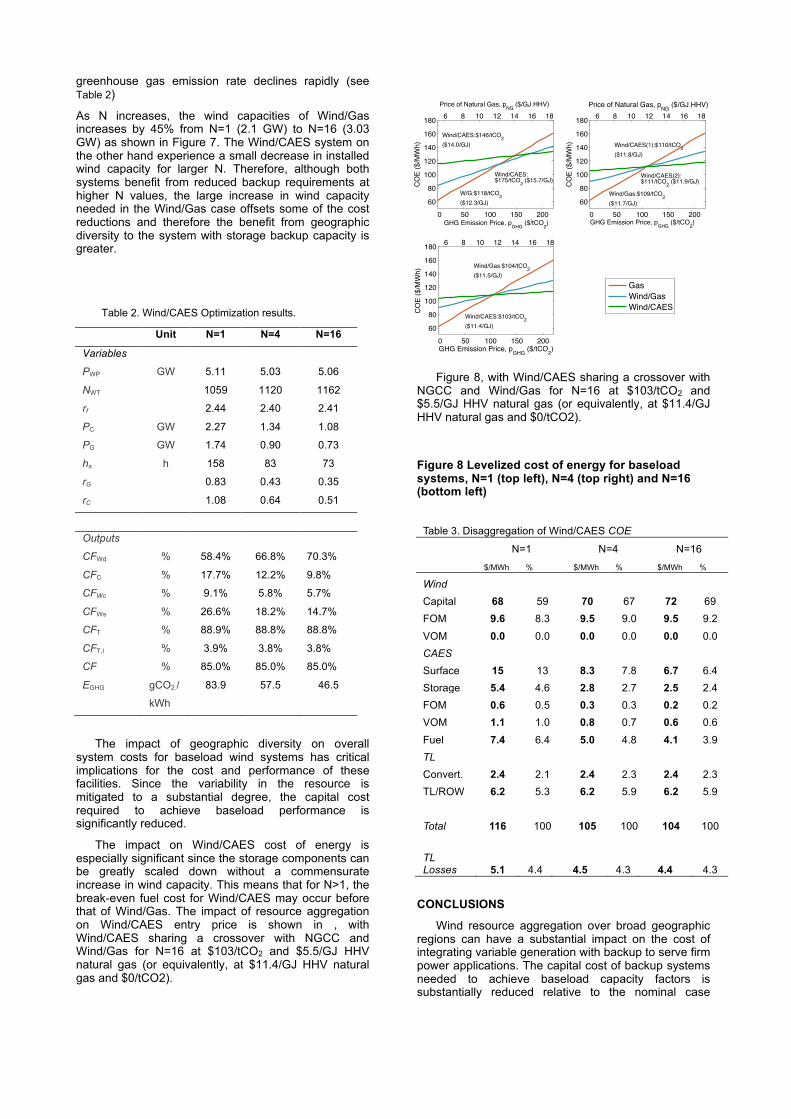
The impact on Wind/CAES cost of energy is especially significant since the storage components can be greatly scaled down without a commensurate increase in wind capacity. This means that for N>1, the break-even fuel cost for Wind/CAES may occur before that of Wind/Gas. The impact of resource aggregation on Wind/CAES entry price is shown in , with Wind/CAES sharing a crossover with NGCC and Wind/Gas for N=16 at $103/tCO2 and $5.5/GJ HHV natural gas (or equivalently, at $11.4/GJ HHV natural gas and $0/tCO2).
Figure 8, with Wind/CAES sharing a crossover with
NGCC and Wind/Gas for N=16 at $103/tCO2 and $5.5/GJ HHV natural gas (or equivalently, at $11.4/GJ HHV natural gas and $0/tCO2).
Figure 8 Levelized cost of energy for baseload systems, N=1 (top left), N=4 (top right) and N=16 (bottom left)
Table 3. Disaggregation of Wind/CAES COE
N=1 N=4 N=16
$/MWh % $/MWh % $/MWh %
Wind Capital 68 59 70 67 72 69 FOM 9.6 8.3 9.5 9.0 9.5 9.2
VOM 0.0 0.0 0.0 0.0 0.0 0.0 CAES 0.0 0.0 0.0 0.0 0.0 0.0 Surface 15 13 8.3 7.8 6.7 6.4 Storage 5.4 4.6 2.8 2.7 2.5 2.4 FOM 0.6 0.5 0.3 0.3 0.2 0.2 VOM 1.1 1.0 0.8 0.7 0.6 0.6
Fuel 7.4 6.4 5.0 4.8 4.1 3.9 TL 0.0 0.0 0.0 0.0 0.0 0.0 Convert. 2.4 2.1 2.4 2.3 2.4 2.3 TL/ROW 6.2 5.3 6.2 5.9 6.2 5.9
0.0 0.0 0.0 0.0 0.0 0.0
Total 116 100 105 100 104 100
0.0 0.0 0.0 0.0 0.0 0.00
TL Losses 5.1 4.4 4.5 4.3 4.4 4.3
CONCLUSIONS
Wind resource aggregation over broad geographic regions can have a substantial impact on the cost of integrating variable generation with backup to serve firm power applications. The capital cost of backup systems needed to achieve baseload capacity factors is substantially reduced relative to the nominal case
6 8 10 12 14 16 18Price of Natural Gas, pNG ($/GJ HHV)
0 50 100 150 20060
80
100
120
140
160
180
GHG Emission Price, pGHG ($/tCO2)
CO
E ($
/MW
h)
W/G:$118/tCO2($12.3/GJ)
Wind/CAES:$175/tCO2 ($15.7/GJ)
Wind/CAES:$146/tCO2($14.0/GJ)
GasWind/GasWind/CAES
6 8 10 12 14 16 18Price of Natural Gas, pNG ($/GJ HHV)
0 50 100 150 20060
80
100
120
140
160
180
GHG Emission Price, pGHG ($/tCO2)
CO
E ($
/MW
h)
Wind/Gas:$109/tCO2($11.7/GJ)
Wind/CAES(2):$111/tCO2 ($11.9/GJ)
Wind/CAES(1):$110/tCO2($11.8/GJ)
6 8 10 12 14 16 18
0 50 100 150 20060
80
100
120
140
160
180
CO
E ($
/MW
h)
Wind/Gas:$104/tCO2($11.5/GJ)
Wind/CAES:$103/tCO2($11.4/GJ)
GHG Emission Price, pGHG ($/tCO2)
resulting in a higher fraction of generation from wind, lower greenhouse gas emission rates, and reduced entry fuel/carbon prices relative to conventional baseload generation. The impacts of resource aggregation on levelized cost are especially critical for wind systems backed by energy storage. Since, in the case of Wind/CAES, a larger fraction of the generation supplied by the baseload system comes from wind, the impact of mitigating the variability of the resource allows for storage to be scaled down considerably without a large increase in wind capacity. This implies a 10.0% decrease in COE at the reference price of natural gas (pNG=$5.5/GJ HHV) and an 45% reduction in GHG emission rate. The combination of these factors reduces the entry price carbon relative to CCGT from $146/tCO2 at N=1 to $103/tCO2 at N=16. This has significant implications, not only for the production of baseload power from wind, but also for wind integration as a whole. Resource aggregation is an effective strategy for mitigating variability of the resource and will have significant benefits for maintaining system reliability and minimizing wind integration costs at all penetration levels. In addition, the mitigation of variability will be relevant for the enhanced utilization of transmission capacity and for the decarbonization of the grid as a whole. This analysis further suggests that integration strategies should not be viewed as mutual exclusive but rather can be mutual reinforcing by leverage important advantages when pursued as part of a coordinated strategy for achieving high penetrations of variable generation on the grid,
REFERENCES
[1] H. Holttinen, P. Meibom, A. Orths, F. v. Hulle, B. Lange, M. O’Malley, J. Pierik, B. Ummels, J. O. Tande, A. Estanqueiro, M. Matos, E. Gomez, L. Söder, G. Strbac, A. Shakoor, J. o. Ricardo, J. C. Smith, M. Milligan, and E. Ela, "Impacts of large amounts of wind power on design and operation of power systems, results of IEA collaboration.," presented at the 8th International Workshop on LargeScale Integration of Wind Power into Power Systems as well as on Transmission Networks of Offshore Wind Farms, Bremen, Germany, 2009.
[2] J. C. Smith, M. R. Milligan, E. A. DeMeo, and B. Parsons, "Utility wind integration and operating impact state of the art," IEEE Transactions on Power Systems, vol. 22, pp. 900-908, 2007.
[3] P. Denholm, E. Ela, B. Kirby, and M. Milligan, "The Role of Energy Storage with Renewable Electricity Generation," National Renewable Energy Laboratory, Golden, CO NREL/TP-6A2-47187, January 2010.
[4] J. Eyer and G. Corey, "Energy Storage for the Electricity Grid: Benefits and Market Potential Assessment Guide: A Study for the DOE Energy Storage Systems Program," Sandia National Laboratories, Albuquerque, New Mexico SAND2010-0815, February 2010.
[5] D. Rastler, "Electricity Energy Storage Technology Options: A White Paper Primer on Applications, Costs and Benefits," Electric Power
Research Institute, Palo Alto, CA 1020676, December 2010.
[6] M. Milligan, K. Porter, E. DeMeo, P. Denholm, H. Holttinen, B. Kirby, N. Miller, A. Mills, M. O'Malley, M. Schuerger, and L. Soder, "Wind power myths debunked," IEEE Power and Energy Magazine, vol. 7, pp. 89-99, 2009.
[7] B. V. Mathiesen and H. Lund, "Comparative analyses of seven technologies to facilitate the integration of fluctuating renewable energy sources," IET Renewable Power Generation, vol. 3, pp. 190-204, 2009.
[8] P. Denholm and R. Sioshansi, "The value of compressed air energy storage with wind in transmission-constrained electric power systems," Energy Policy, vol. 37, pp. 3149-3158, 2009.
[9] J. B. Greenblatt, S. Succar, D. C. Denkenberger, R. H. Williams, and R. H. Socolow, "Baseload wind energy: modeling the competition between gas turbines and compressed air energy storage for supplemental generation," Energy Policy, vol. 35, pp. 1474-1492, Mar 2007.
[10] S. Succar and R. H. Williams, "Compressed Air Energy Storage: Theory, Operation and Applications," Princeton Environmental Institute, Princeton University, Princeton, NJ April 2008.
[11] E. Drury, P. Denholm, and R. Sioshansi, "The value of compressed air energy storage in energy and reserve markets," Energy, vol. 36, pp. 4959-4973, 2011.
[12] R. Walawalkar, J. Apt, and R. Mancini, "Economics of electric energy storage for energy arbitrage and regulation in New York," Energy Policy, vol. 35, pp. 2558-2568, Apr 2007.
[13] H. Lund, G. Salgi, B. Elmegaard, and A. N. Andersen, "Optimal operation strategies of compressed air energy storage (CAES) on electricity spot markets with fluctuating prices," Applied Thermal Engineering, vol. 29, pp. 799-806, 2009.
[14] H. Lund and G. Salgi, "The role of compressed air energy storage (CAES) in future sustainable energy systems," Energy Conversion and Management, vol. 50, pp. 1172-1179, 2009.
[15] IEA, "Variability of Wind Power and other Renewables: Management Options and Strategies," International Energy Agency, Paris, FranceJune 2005.
[16] L. L. Garver, "Effective load carrying capability of generating units," Ieee Transactions on Power Apparatus and Systems, vol. PAS-85, pp. 910-919, 1966.
[17] M. Milligan and K. Porter, "Wind capacity credit in the United States," in 2008 IEEE Power & Energy Society General Meeting, 20-24 July 2008, Piscataway, NJ, USA, 2008, p. 5 pp.
[18] EIA, "Annual Energy Outlook 2011 With Projections to 2035," Office of Integrated Analysis and Forecasting, Energy Information Administration, US
Department of Energy, Washington, D.C. DOE/EIA-0383(2011), 2011.
[19] M. Q. Wang, "GREET 1.5 - Transport Fuel-Cycle Model," Center for Transporation Research, Energy Systems Division, Argonne Natinoal Laboratory, Argonne, IL ANL/ESD-39, Vol. 2, August 1999.
[20] R. Wiser and M. Bolinger, "2010 Wind Technologies Market Report," U.S. Department of Energy June 2011.
[21] EPRI-DOE, "Handbook of Energy Storage for Transmission and Distribution Applications," EPRI, DOE, Palo Alto, CA, Washington, DC2003.
[22] EPRI-DOE, "Energy Storage for Grid Connected Wind Generation Applications," EPRI, DOE, Palo Alto, CA, Washington, DC 1008703, 2004.
[23] EIA, "Annual Energy Outlook 2007 With Projections to 2030," Office of Integrated Analysis and Forecasting, Energy Information Administration, US Department of Energy, Washington, D.C. DOE/EIA-0383(2007), February 2007.
[24] C. L. Archer and M. Z. Jacobson, "Supplying baseload power and reducing transmission requirements by interconnecting wind farms," Journal of Applied Meteorology and Climatology, vol. 46, pp. 1701-1717, 2007.
[25] P. Nørgaard, "MAWIPOC - A Model to Simulate the Aggregated Wind Power Time Series For an Area," presented at the European Wind Energy Conference EWEC '04, London, UK, 2004.
[26] J. Soens, J. Driesen, and R. Belmans, "Estimation of Fluctuation of Wind Power Generation in Belgium," presented at the Fifth International Workshop On Large-Scale Integration Of Wind Power And Transmission Networks For Offshore Wind Farms, Glasgow, 2005.
[27] A. R. McFarlane, P. S. Veers, and L. L. Schluter, "Simulating high frequency wind for long durations," in Proceedings of the Energy-Sources Technology Conference, New Orleans, LA, USA, 1994, pp. 175-180.
[28] A. J. Cavallo and M. B. Keck, "Cost effective seasonal storage of wind energy," in American Society of Mechanical Engineers, Solar Energy Division (Publication) SED, Houston, TX, USA, 1995, pp. 119-125.
[29] NREL, "Eastern Wind Integration and Transmission Study," Prepared by Enernex Corporation for the National Renewable Energy Laboratory, Knoxville, Tennessee NREL/SR-550-47086, January, 2010 2010.
[30] W. Katzenstein, E. Fertig, and J. Apt, "The variability of interconnected wind plants," Energy Policy, vol. 38, pp. 4400-4410, 2010.
[31] J. F. DeCarolis and D. W. Keith, "The economics of large-scale wind power in a carbon constrained world," Energy Policy, vol. 34, pp. 395-410, Mar 2006.


![Maynard Owen Williams - War-torn Greece looks ahead With 11 illustrations 21 natural color phtographs [1949-12-ΔΕΚ-National Geographic-ΤΧ#96.6-ΣΕΛ-711-744] [National Geographic](https://static.fdocument.org/doc/165x107/55720d29497959fc0b8c571a/maynard-owen-williams-war-torn-greece-looks-ahead-with-11-illustrations-21-natural-color-phtographs-1949-12-national-geographic-966-711-744-national-geographic-society-1949-national-geographic-civil-war-greece2.jpg)