Comprehensive Report - ICAP GROUP SA · Comprehensive Report Confidential: This document contain...
14
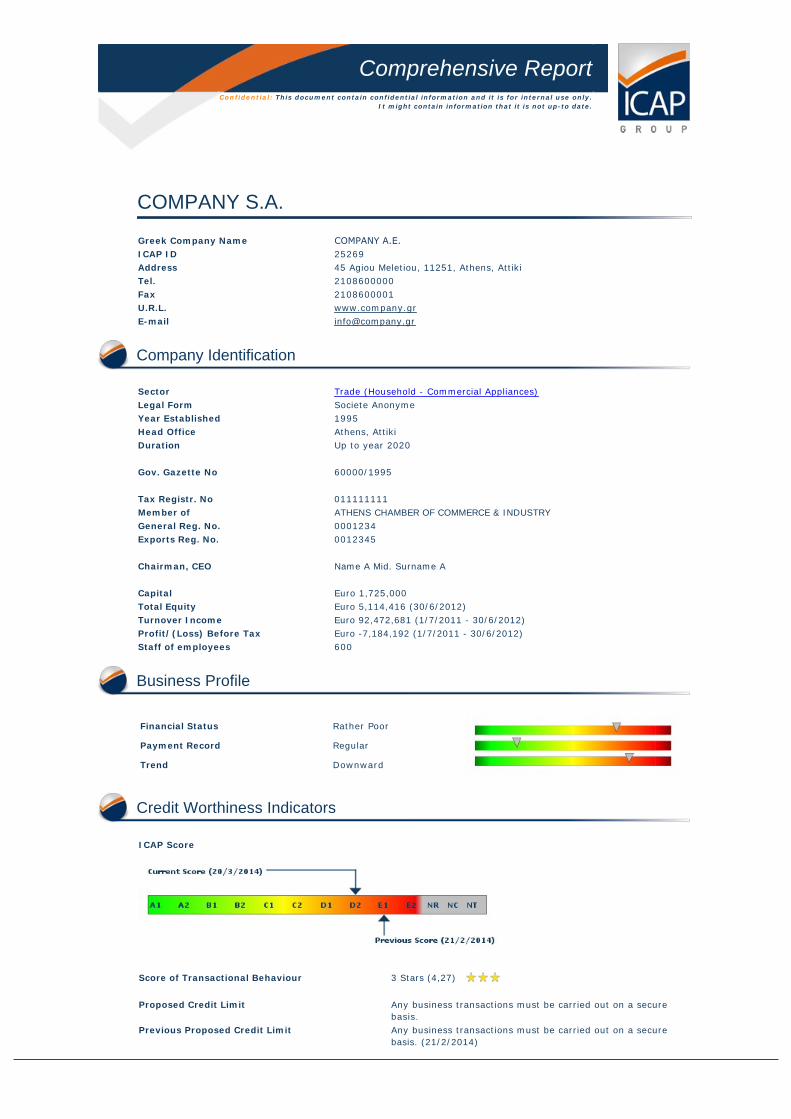
Comprehensive Report Confidential: This document contain confidential information and it is for internal use only. It might contain information that it is not up-to date. COMPANY S.A. Greek Company Name COMPANY Α.Ε. ICAP ID 25269 Address 45 Agiou Meletiou, 11251, Athens, Attiki Tel. 2108600000 Fax 2108600001 U.R.L. www.company.gr E-mail [email protected] Company Identification Sector Trade (Household - Commercial Appliances) Legal Form Societe Anonyme Year Established 1995 Head Office Athens, Attiki Duration Up to year 2020 Gov. Gazette No 60000/1995 Tax Registr. No 011111111 Member of ATHENS CHAMBER OF COMMERCE & INDUSTRY General Reg. No. 0001234 Exports Reg. No. 0012345 Chairman, CEO Name A Mid. Surname A Capital Euro 1,725,000 Total Equity Euro 5,114,416 (30/6/2012) Turnover Income Euro 92,472,681 (1/7/2011 - 30/6/2012) Profit/(Loss) Before Tax Euro -7,184,192 (1/7/2011 - 30/6/2012) Staff of employees 600 Business Profile Financial Status Rather Poor Payment Record Regular Trend Downward Credit Worthiness Indicators ICAP Score Score of Transactional Behaviour 3 Stars (4,27) Proposed Credit Limit Any business transactions must be carried out on a secure basis. Previous Proposed Credit Limit Any business transactions must be carried out on a secure basis. (21/2/2014)
Transcript of Comprehensive Report - ICAP GROUP SA · Comprehensive Report Confidential: This document contain...
Comprehensive Report
Confidential: This document contain confidential information and it is for internal use only.
It might contain information that it is not up-to date.
COMPANY S.A.
Greek Company Name COMPANY Α.Ε.ICAP ID 25269
Address 45 Agiou Meletiou, 11251, Athens, Attiki
Tel. 2108600000
Fax 2108600001
U.R.L. www.company.gr
E-mail [email protected]
Company Identification
Sector Trade (Household - Commercial Appliances)
Legal Form Societe Anonyme
Year Established 1995
Head Office Athens, Attiki
Duration Up to year 2020
Gov. Gazette No 60000/1995
Tax Registr. No 011111111
Member of ATHENS CHAMBER OF COMMERCE & INDUSTRY
General Reg. No. 0001234
Exports Reg. No. 0012345
Chairman, CEO Name A Mid. Surname A
Capital Euro 1,725,000
Total Equity Euro 5,114,416 (30/6/2012)
Turnover Income Euro 92,472,681 (1/7/2011 - 30/6/2012)
Profit/(Loss) Before Tax Euro -7,184,192 (1/7/2011 - 30/6/2012)
Staff of employees 600
Business Profile
Financial Status Rather Poor
Payment Record Regular
Trend Downward
Credit Worthiness Indicators
ICAP Score
Score of Transactional Behaviour 3 Stars (4,27)
Proposed Credit Limit Any business transactions must be carried out on a secure
basis.
Previous Proposed Credit Limit Any business transactions must be carried out on a secure
basis. (21/2/2014)
Special Events
Subject's shares are under supervision trading status from the Athens Stock Exchange.
Transaction Behaviour Index
Subject
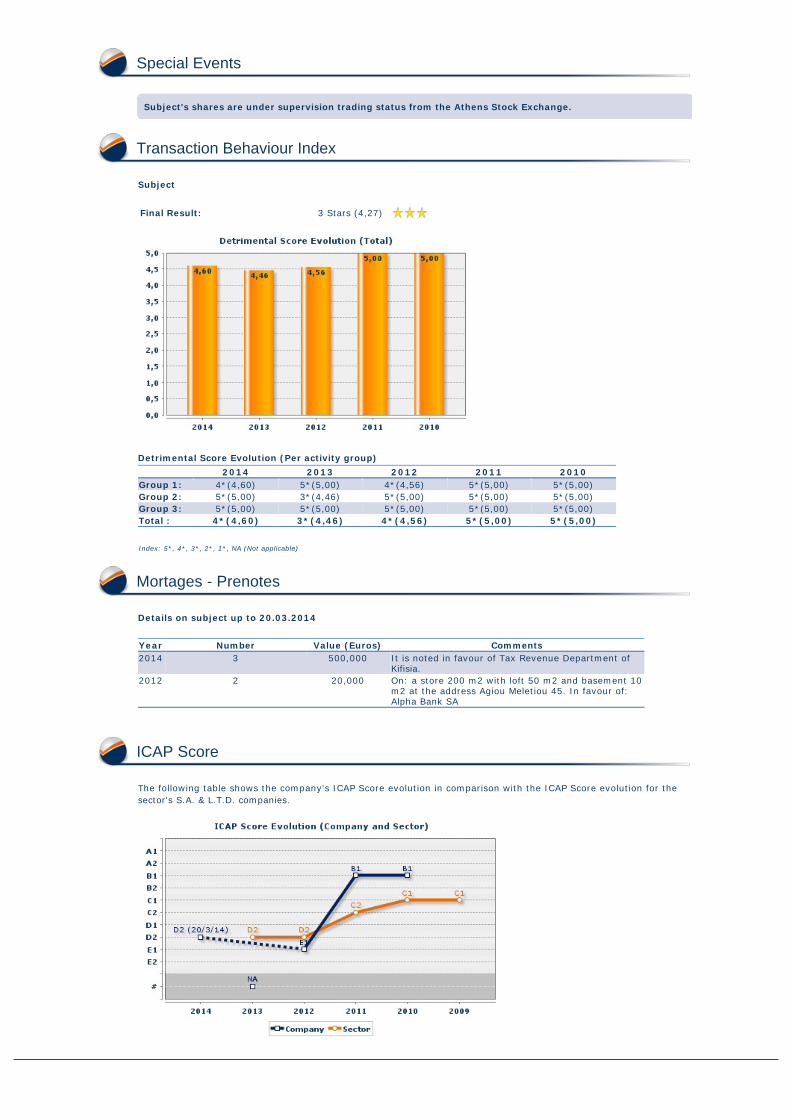
Final Result: 3 Stars (4,27)
Detrimental Score Evolution (Per activity group)
2014 2013 2012 2011 2010
Group 1: 4*(4,60) 5*(5,00) 4*(4,56) 5*(5,00) 5*(5,00)
Group 2: 5*(5,00) 3*(4,46) 5*(5,00) 5*(5,00) 5*(5,00)
Group 3: 5*(5,00) 5*(5,00) 5*(5,00) 5*(5,00) 5*(5,00)
Total : 4*(4,60) 3*(4,46) 4*(4,56) 5*(5,00) 5*(5,00)
Index: 5*, 4*, 3*, 2*, 1*, NA (Not applicable)
Mortages - Prenotes
Details on subject up to 20.03.2014
Year Number Value (Euros) Comments
2014 3 500,000 It is noted in favour of Tax Revenue Department ofKifisia.
2012 2 20,000 On: a store 200 m2 with loft 50 m2 and basement 10m2 at the address Agiou Meletiou 45. In favour of:Alpha Bank SA
ICAP Score
The following table shows the company's ICAP Score evolution in comparison with the ICAP Score evolution for the
sector's S.A. & L.T.D. companies.
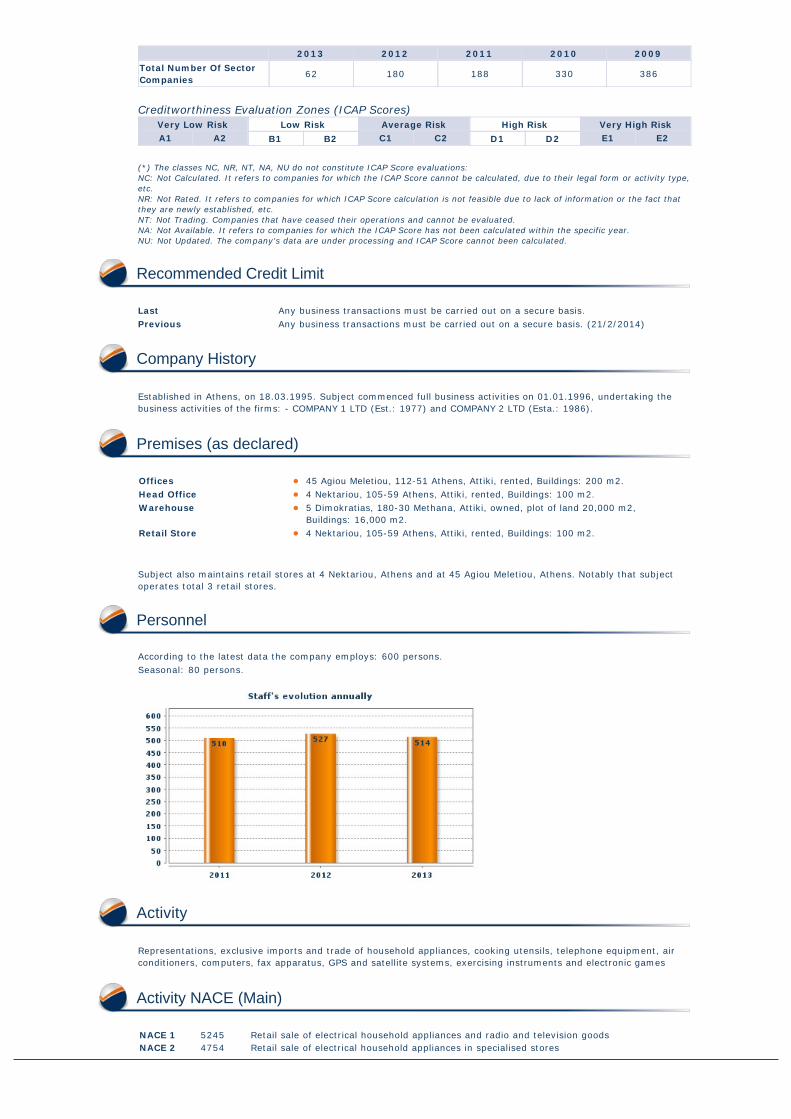
2013 2012 2011 2010 2009
Total Number Of Sector
Companies62 180 188 330 386
Creditworthiness Evaluation Zones (ICAP Scores)
Very Low Risk Low Risk Average Risk High Risk Very High Risk
A1 A2 B1 B2 C1 C2 D1 D2 E1 E2
(*) The classes NC, NR, NT, NA, NU do not constitute ICAP Score evaluations:
NC: Not Calculated. It refers to companies for which the ICAP Score cannot be calculated, due to their legal form or activity type,
etc.
NR: Not Rated. It refers to companies for which ICAP Score calculation is not feasible due to lack of information or the fact that
they are newly established, etc.
NT: Not Trading. Companies that have ceased their operations and cannot be evaluated.
NA: Not Available. It refers to companies for which the ICAP Score has not been calculated within the specific year.
NU: Not Updated. The company's data are under processing and ICAP Score cannot been calculated.
Recommended Credit Limit
Last Any business transactions must be carried out on a secure basis.
Previous Any business transactions must be carried out on a secure basis. (21/2/2014)
Company History
Established in Athens, on 18.03.1995. Subject commenced full business activities on 01.01.1996, undertaking the
business activities of the firms: - COMPANY 1 LTD (Est.: 1977) and COMPANY 2 LTD (Esta.: 1986).
Premises (as declared)
Offices • 45 Agiou Meletiou, 112-51 Athens, Attiki, rented, Buildings: 200 m2.
Head Office • 4 Nektariou, 105-59 Athens, Attiki, rented, Buildings: 100 m2.
Warehouse • 5 Dimokratias, 180-30 Methana, Attiki, owned, plot of land 20,000 m2,
Buildings: 16,000 m2.
Retail Store • 4 Nektariou, 105-59 Athens, Attiki, rented, Buildings: 100 m2.
Subject also maintains retail stores at 4 Nektariou, Athens and at 45 Agiou Meletiou, Athens. Notably that subject
operates total 3 retail stores.
Personnel
According to the latest data the company employs: 600 persons.
Seasonal: 80 persons.
Activity
Representations, exclusive imports and trade of household appliances, cooking utensils, telephone equipment, air
conditioners, computers, fax apparatus, GPS and satellite systems, exercising instruments and electronic games
Activity NACE (Main)
NACE 1 5245 Retail sale of electrical household appliances and radio and television goods
NACE 2 4754 Retail sale of electrical household appliances in specialised stores
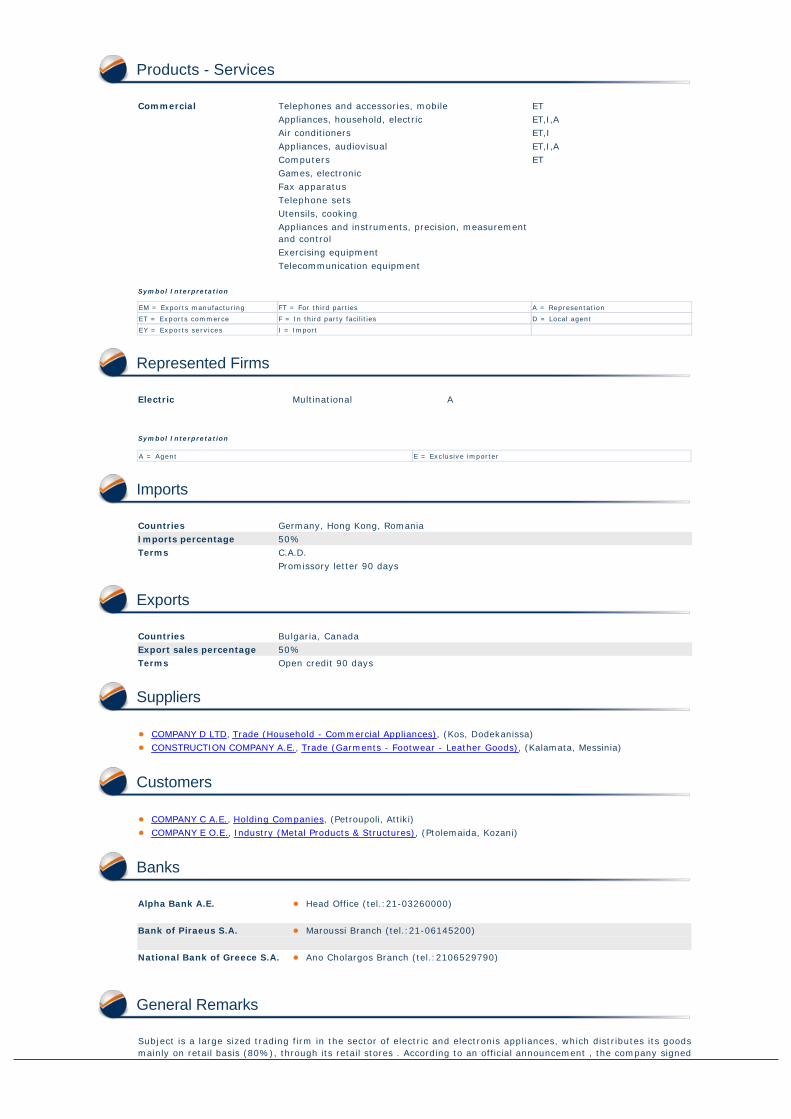
Products - Services
Commercial Telephones and accessories, mobile ET
Appliances, household, electric ET,I,A
Air conditioners ET,I
Appliances, audiovisual ET,I,A
Computers ET
Games, electronic
Fax apparatus
Telephone sets
Utensils, cooking
Appliances and instruments, precision, measurement
and control
Exercising equipment
Telecommunication equipment
Symbol Interpretation
EM = Exports manufacturing FT = For third parties A = Representation
ET = Exports commerce F = In third party facilities D = Local agent
EY = Exports services I = Import
Represented Firms
Electric Multinational A
Symbol Interpretation A = Agent E = Exclusive importer
Imports
Countries Germany, Hong Kong, Romania
Imports percentage 50%
Terms C.A.D.
Promissory letter 90 days
Exports
Countries Bulgaria, Canada
Export sales percentage 50%
Terms Open credit 90 days
Suppliers
• COMPANY D LTD, Trade (Household - Commercial Appliances), (Kos, Dodekanissa)
• CONSTRUCTION COMPANY A.E., Trade (Garments - Footwear - Leather Goods), (Kalamata, Messinia)
Customers
• COMPANY C A.E., Holding Companies, (Petroupoli, Attiki)
• COMPANY E O.E., Industry (Metal Products & Structures), (Ptolemaida, Kozani)
Banks
Alpha Bank A.E. • Head Office (tel.:21-03260000)
Bank of Piraeus S.A. • Maroussi Branch (tel.:21-06145200)
National Bank of Greece S.A. • Ano Cholargos Branch (tel.:2106529790)
General Remarks
Subject is a large sized trading firm in the sector of electric and electronis appliances, which distributes its goods
mainly on retail basis (80%), through its retail stores . According to an official announcement , the company signed
an agreement with its main creditor banks to refinance existing short-term borrowing. Moreover, the company
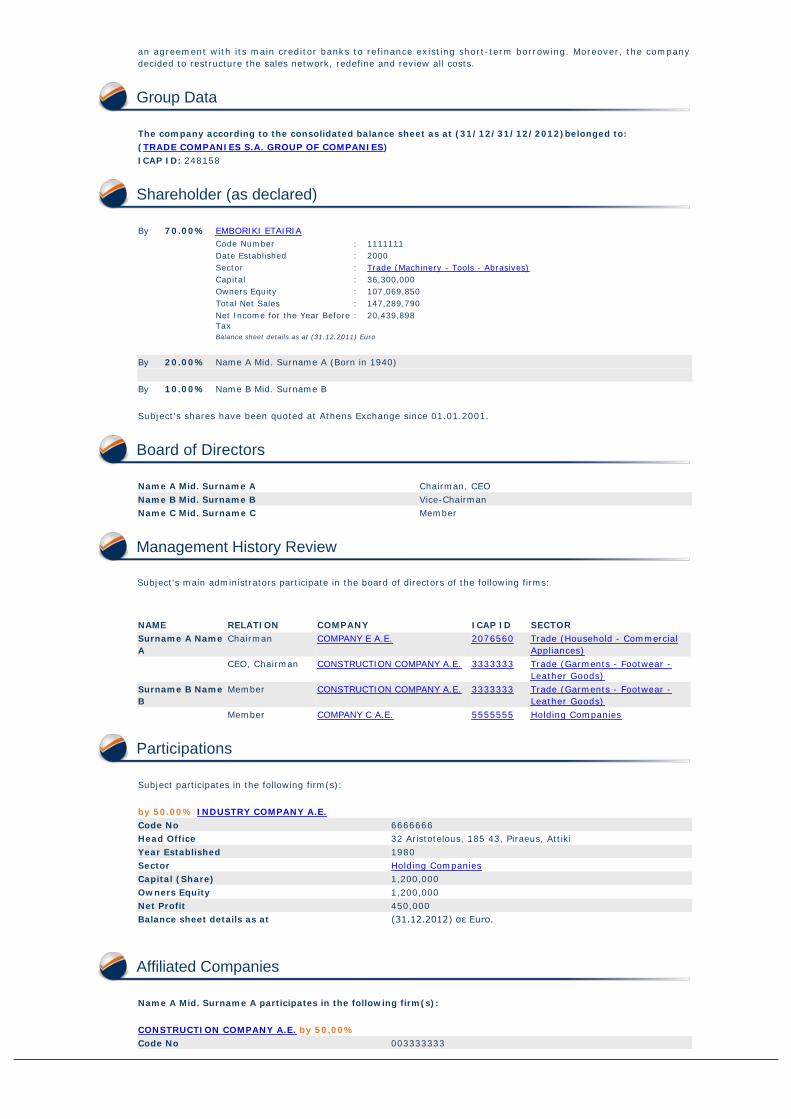
decided to restructure the sales network, redefine and review all costs.
Group Data
The company according to the consolidated balance sheet as at (31/12/31/12/2012)belonged to:
(TRADE COMPANIES S.A. GROUP OF COMPANIES)
ICAP ID: 248158
Shareholder (as declared)
By 70.00% EMBORIKI ETAIRIA
Code Number : 1111111
Date Established : 2000
Sector : Trade (Machinery - Tools - Abrasives)
Capital : 36,300,000
Owners Equity : 107,069,850
Total Net Sales : 147,289,790
Net Income for the Year Before
Tax
: 20,439,898
Balance sheet details as at (31.12.2011) Euro
By 20.00% Name A Mid. Surname A (Born in 1940)
By 10.00% Name B Mid. Surname B
Subject's shares have been quoted at Athens Exchange since 01.01.2001.
Board of Directors
Name A Mid. Surname A Chairman, CEO
Name B Mid. Surname B Vice-Chairman
Name C Mid. Surname C Member
Management History Review
Subject's main administrators participate in the board of directors of the following firms:
NAME RELATION COMPANY ICAP ID SECTOR
Surname A Name
A
Chairman COMPANY E A.E. 2076560 Trade (Household - Commercial
Appliances)
CEO, Chairman CONSTRUCTION COMPANY A.E. 3333333 Trade (Garments - Footwear -
Leather Goods)
Surname B Name
B
Member CONSTRUCTION COMPANY A.E. 3333333 Trade (Garments - Footwear -
Leather Goods)
Member COMPANY C A.E. 5555555 Holding Companies
Participations
Subject participates in the following firm(s):
by 50.00% INDUSTRY COMPANY A.E.
Code No 6666666
Head Office 32 Aristotelous, 185 43, Piraeus, Attiki
Year Established 1980
Sector Holding Companies
Capital (Share) 1,200,000
Owners Equity 1,200,000
Net Profit 450,000
Balance sheet details as at (31.12.2012) σε Euro.
Affiliated Companies
Name A Mid. Surname A participates in the following firm(s):
CONSTRUCTION COMPANY A.E. by 50,00%
Code No 003333333
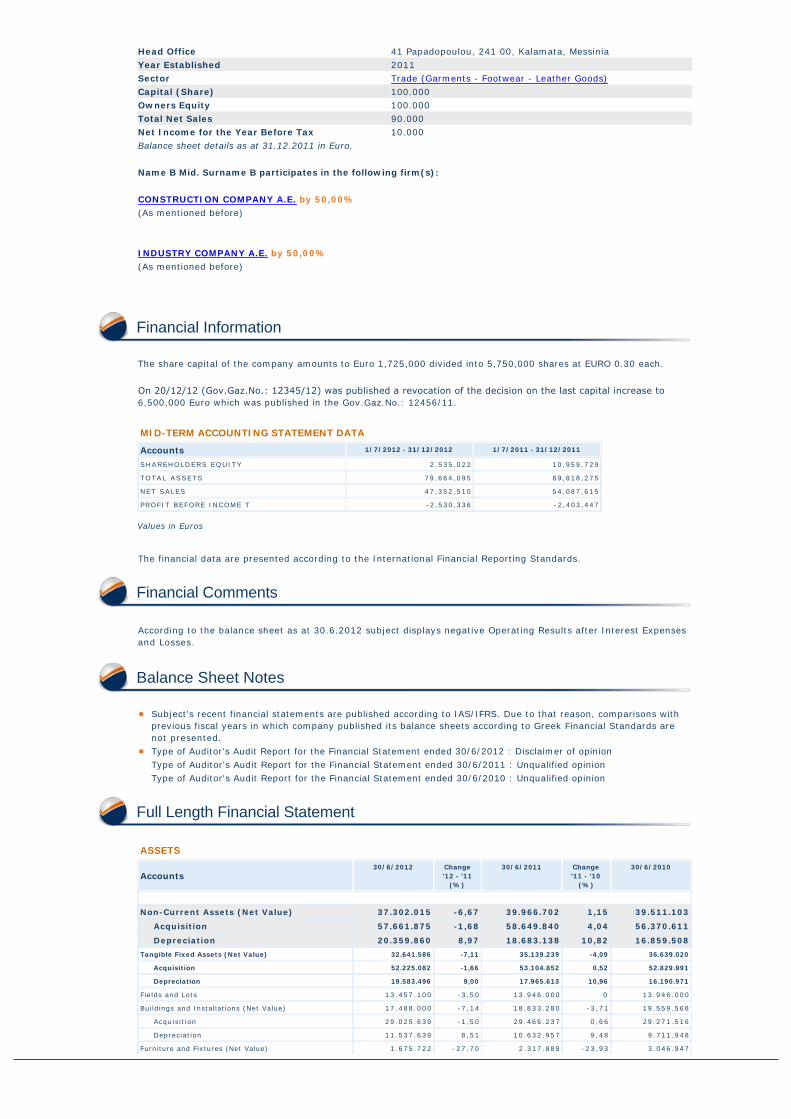
Head Office 41 Papadopoulou, 241 00, Kalamata, Messinia
Year Established 2011
Sector Trade (Garments - Footwear - Leather Goods)
Capital (Share) 100.000
Owners Equity 100.000
Total Net Sales 90.000
Net Income for the Year Before Tax 10.000
Balance sheet details as at 31.12.2011 in Euro.
Name B Mid. Surname B participates in the following firm(s):
CONSTRUCTION COMPANY A.E. by 50,00%
(As mentioned before)
INDUSTRY COMPANY A.E. by 50,00%
(As mentioned before)
Financial Information
The share capital of the company amounts to Euro 1,725,000 divided into 5,750,000 shares at EURO 0.30 each.
On 20/12/12 (Gov.Gaz.Νο.: 12345/12) was published a revocation of the decision on the last capital increase to6,500,000 Euro which was published in the Gov.Gaz.No.: 12456/11.
MID-TERM ACCOUNTING STATEMENT DATA
Accounts 1/7/2012 - 31/12/2012 1/7/2011 - 31/12/2011
SHAREHOLDERS EQUITY 2,535,022 10,959,729
TOTAL ASSETS 79,664,095 89,818,275
NET SALES 47,352,510 54,087,615
PROFIT BEFORE INCOME T -2,530,336 -2,403,447
Values in Euros
The financial data are presented according to the International Financial Reporting Standards.
Financial Comments
According to the balance sheet as at 30.6.2012 subject displays negative Operating Results after Interest Expenses
and Losses.
Balance Sheet Notes
• Subject's recent financial statements are published according to IAS/IFRS. Due to that reason, comparisons with
previous fiscal years in which company published its balance sheets according to Greek Financial Standards are
not presented.
• Type of Auditor's Audit Report for the Financial Statement ended 30/6/2012 : Disclaimer of opinion
Type of Auditor's Audit Report for the Financial Statement ended 30/6/2011 : Unqualified opinion
Type of Auditor's Audit Report for the Financial Statement ended 30/6/2010 : Unqualified opinion
Full Length Financial Statement
ASSETS
Accounts30/6/2012 Change
'12 - '11
(%)
30/6/2011 Change
'11 - '10
(%)
30/6/2010
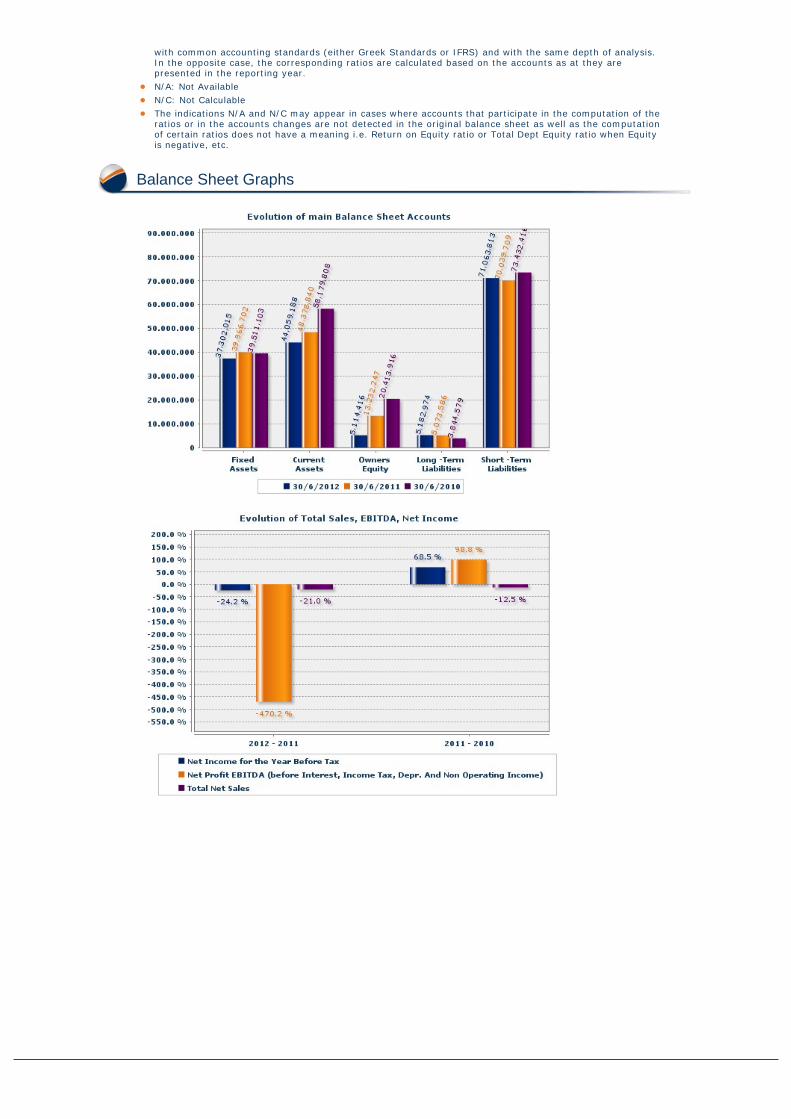
Non-Current Assets (Net Value) 37.302.015 -6,67 39.966.702 1,15 39.511.103
Acquisition 57.661.875 -1,68 58.649.840 4,04 56.370.611
Depreciation 20.359.860 8,97 18.683.138 10,82 16.859.508
Tangible Fixed Assets (Net Value) 32.641.586 -7,11 35.139.239 -4,09 36.639.020
Acquisition 52.225.082 -1,66 53.104.852 0,52 52.829.991
Depreciation 19.583.496 9,00 17.965.613 10,96 16.190.971
Fields and Lots 13.457.100 -3,50 13.946.000 0 13.946.000
Buildings and Installations (Net Value) 17.488.000 -7,14 18.833.280 -3,71 19.559.568
Acquisition 29.025.639 -1,50 29.466.237 0,66 29.271.516
Depreciation 11.537.639 8,51 10.632.957 9,48 9.711.948
Furniture and Fixtures (Net Value) 1.675.722 -27,70 2.317.888 -23,93 3.046.947
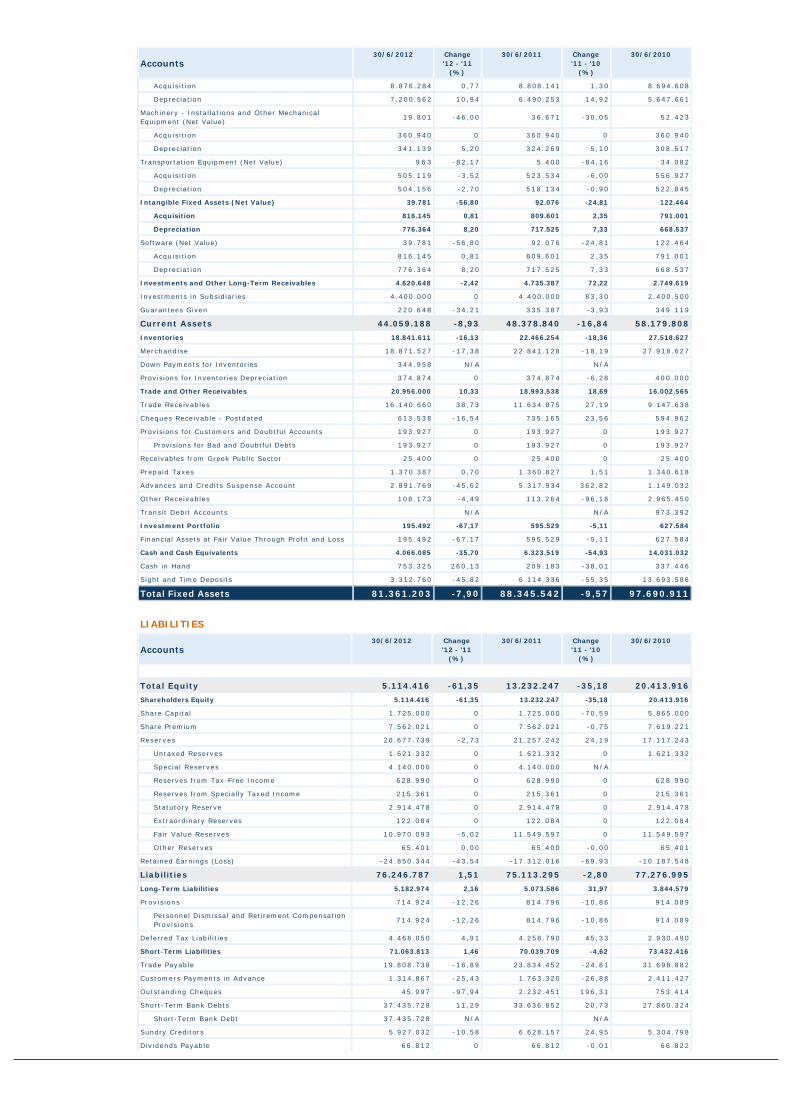
Accounts30/6/2012 Change
'12 - '11
(%)
30/6/2011 Change
'11 - '10
(%)
30/6/2010
Acquisition 8.876.284 0,77 8.808.141 1,30 8.694.608
Depreciation 7.200.562 10,94 6.490.253 14,92 5.647.661
Machinery - Installations and Other Mechanical
Equipment (Net Value)19.801 -46,00 36.671 -30,05 52.423
Acquisition 360.940 0 360.940 0 360.940
Depreciation 341.139 5,20 324.269 5,10 308.517
Transportation Equipment (Net Value) 9 6 3 -82,17 5.400 -84,16 34.082
Acquisition 505.119 -3,52 523.534 -6,00 556.927
Depreciation 504.156 -2,70 518.134 -0,90 522.845
Intangible Fixed Assets (Net Value) 39.781 -56,80 92.076 -24,81 122.464
Acquisition 816.145 0,81 809.601 2,35 791.001
Depreciation 776.364 8,20 717.525 7,33 668.537
Software (Net Value) 39.781 -56,80 92.076 -24,81 122.464
Acquisition 816.145 0,81 809.601 2,35 791.001
Depreciation 776.364 8,20 717.525 7,33 668.537
Investments and Other Long-Term Receivables 4.620.648 -2,42 4.735.387 72,22 2.749.619
Investments in Subsidiaries 4.400.000 0 4.400.000 83,30 2.400.500
Guarantees Given 220.648 -34,21 335.387 -3,93 349.119
Current Assets 44.059.188 -8,93 48.378.840 -16,84 58.179.808
Inventories 18.841.611 -16,13 22.466.254 -18,36 27.518.627
Merchandise 18.871.527 -17,38 22.841.128 -18,19 27.918.627
Down Payments for Inventories 344.958 N/A N /A
Provisions for Inventories Depreciation 374.874 0 374.874 -6,28 400.000
Trade and Other Receivables 20.956.000 10,33 18.993.538 18,69 16.002.565
Trade Receivables 16.140.660 38,73 11.634.875 27,19 9.147.638
Cheques Receivable - Postdated 613.538 -16,54 735.165 23,56 594.962
Provisions for Customers and Doubtful Accounts 193.927 0 193.927 0 193.927
Provisions for Bad and Doubtful Debts 193.927 0 193.927 0 193.927
Receivables from Greek Public Sector 25.400 0 25.400 0 25.400
Prepaid Taxes 1.370.387 0,70 1.360.827 1,51 1.340.618
Advances and Credits Suspense Account 2.891.769 -45,62 5.317.934 362,82 1.149.032
Other Receivables 108.173 -4,49 113.264 -96,18 2.965.450
Transit Debit Accounts N /A N /A 973.392
Investment Portfolio 195.492 -67,17 595.529 -5,11 627.584
Financial Assets at Fair Value Through Profit and Loss 195.492 -67,17 595.529 -5,11 627.584
Cash and Cash Equivalents 4.066.085 -35,70 6.323.519 -54,93 14.031.032
Cash in Hand 753.325 260,13 209.183 -38,01 337.446
Sight and Time Deposits 3.312.760 -45,82 6.114.336 -55,35 13.693.586
Total Fixed Assets 81.361.203 -7,90 88.345.542 -9,57 97.690.911
LIABILITIES
Accounts30/6/2012 Change
'12 - '11
(%)
30/6/2011 Change
'11 - '10
(%)
30/6/2010
Total Equity 5.114.416 -61,35 13.232.247 -35,18 20.413.916
Shareholders Equity 5.114.416 -61,35 13.232.247 -35,18 20.413.916
Share Capital 1.725.000 0 1.725.000 -70,59 5.865.000
Share Premium 7.562.021 0 7.562.021 -0,75 7.619.221
Reserves 20.677.739 -2,73 21.257.242 24,19 17.117.243
Untaxed Reserves 1.621.332 0 1.621.332 0 1.621.332
Special Reserves 4.140.000 0 4.140.000 N/A
Reserves from Tax-Free Income 628.990 0 628.990 0 628.990
Reserves from Specially Taxed Income 215.361 0 215.361 0 215.361
Statutory Reserve 2.914.478 0 2.914.478 0 2.914.478
Extraordinary Reserves 122.084 0 122.084 0 122.084
Fair Value Reserves 10.970.093 -5,02 11.549.597 0 11.549.597
Other Reserves 65.401 0,00 65.400 -0,00 65.401
Retained Earnings (Loss) -24.850.344 -43,54 -17.312.016 -69,93 -10.187.548
Liabilities 76.246.787 1,51 75.113.295 -2,80 77.276.995
Long-Term Liabilities 5.182.974 2,16 5.073.586 31,97 3.844.579
Provisions 714.924 -12,26 814.796 -10,86 914.089
Personnel Dismissal and Retirement Compensation
Provisions714.924 -12,26 814.796 -10,86 914.089
Deferred Tax Liabilities 4.468.050 4,91 4.258.790 45,33 2.930.490
Short-Term Liabilities 71.063.813 1,46 70.039.709 -4,62 73.432.416
Trade Payable 19.808.738 -16,89 23.834.452 -24,81 31.698.882
Customers Payments in Advance 1.314.867 -25,43 1.763.320 -26,88 2.411.427
Outstanding Cheques 45.997 -97,94 2.232.451 196,31 753.414
Short-Term Bank Debts 37.435.728 11,29 33.636.852 20,73 27.860.324
Short-Term Bank Debt 37.435.728 N/A N /A
Sundry Creditors 5.927.032 -10,58 6.628.157 24,95 5.304.798
Dividends Payable 66.812 0 66.812 -0,01 66.822
Accounts30/6/2012 Change
'12 - '11
(%)
30/6/2011 Change
'11 - '10
(%)
30/6/2010
Obligations to Third Party N /A 1.000.000 N/A
Taxes and Contributions Payable N /A 261.487 -23,04 339.769
Tax Payable 363.195 -6,02 386.475 -55,42 866.837
Tax and Duties 61.627 N/A N /A
Social Security Payable 219.383 N/A N /A
Short-Term Provisions N /A N /A 512.500
Other Short-Term Liabilities 5.587.661 3.603,68 150.868 -95,74 3.539.400
Transit Credit Accounts 232.773 195,27 78.835 0,76 78.243
Earned Expenses 232.773 195,27 78.835 0,76 78.243
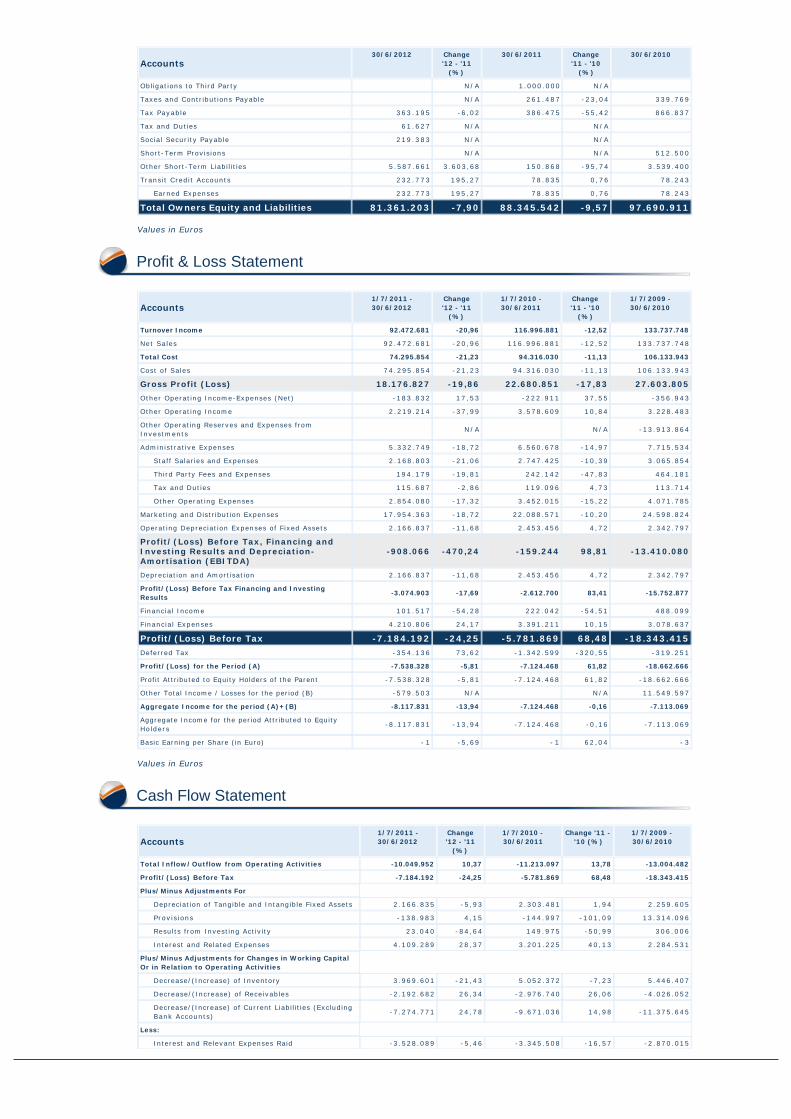
Total Owners Equity and Liabilities 81.361.203 -7,90 88.345.542 -9,57 97.690.911
Values in Euros
Profit & Loss Statement
Accounts1/7/2011 -
30/6/2012
Change
'12 - '11
(%)
1/7/2010 -
30/6/2011
Change
'11 - '10
(%)
1/7/2009 -
30/6/2010
Turnover Income 92.472.681 -20,96 116.996.881 -12,52 133.737.748
Net Sales 92.472.681 -20,96 116.996.881 -12,52 133.737.748
Total Cost 74.295.854 -21,23 94.316.030 -11,13 106.133.943
Cost of Sales 74.295.854 -21,23 94.316.030 -11,13 106.133.943
Gross Profit (Loss) 18.176.827 -19,86 22.680.851 -17,83 27.603.805
Other Operating Income-Expenses (Net) -183.832 17,53 -222.911 37,55 -356.943
Other Operating Income 2.219.214 -37,99 3.578.609 10,84 3.228.483
Other Operating Reserves and Expenses from
Investments N /A N /A -13.913.864
Administrative Expenses 5.332.749 -18,72 6.560.678 -14,97 7.715.534
Staff Salaries and Expenses 2.168.803 -21,06 2.747.425 -10,39 3.065.854
Third Party Fees and Expenses 194.179 -19,81 242.142 -47,83 464.181
Tax and Duties 115.687 -2,86 119.096 4,73 113.714
Other Operating Expenses 2.854.080 -17,32 3.452.015 -15,22 4.071.785
Marketing and Distribution Expenses 17.954.363 -18,72 22.088.571 -10,20 24.598.824
Operating Depreciation Expenses of Fixed Assets 2.166.837 -11,68 2.453.456 4,72 2.342.797
Profit/(Loss) Before Tax, Financing andInvesting Results and Depreciation-Amortisation (EBITDA)
-908.066 -470,24 -159.244 98,81 -13.410.080
Depreciation and Amortisation 2.166.837 -11,68 2.453.456 4,72 2.342.797
Profit/(Loss) Before Tax Financing and Investing
Results-3.074.903 -17,69 -2.612.700 83,41 -15.752.877
Financial Income 101.517 -54,28 222.042 -54,51 488.099
Financial Expenses 4.210.806 24,17 3.391.211 10,15 3.078.637
Profit/(Loss) Before Tax -7.184.192 -24,25 -5.781.869 68,48 -18.343.415
Deferred Tax -354.136 73,62 -1.342.599 -320,55 -319.251
Profit/(Loss) for the Period (A) -7.538.328 -5,81 -7.124.468 61,82 -18.662.666
Profit Attributed to Equity Holders of the Parent -7.538.328 -5,81 -7.124.468 61,82 -18.662.666
Other Total Income / Losses for the period (B) -579.503 N/A N /A 11.549.597
Aggregate Income for the period (A)+(B) -8.117.831 -13,94 -7.124.468 -0,16 -7.113.069
Aggregate Income for the period Attributed to Equity
Holders-8.117.831 -13,94 -7.124.468 -0,16 -7.113.069
Basic Earning per Share (in Euro) - 1 -5,69 - 1 62,04 - 3
Values in Euros
Cash Flow Statement
Accounts1/7/2011 -
30/6/2012
Change
'12 - '11
(%)
1/7/2010 -
30/6/2011
Change '11 -
'10 (%)
1/7/2009 -
30/6/2010
Total Inflow/Outflow from Operating Activities -10.049.952 10,37 -11.213.097 13,78 -13.004.482
Profit/(Loss) Before Tax -7.184.192 -24,25 -5.781.869 68,48 -18.343.415
Plus/Minus Adjustments For Depreciation of Tangible and Intangible Fixed Assets 2.166.835 -5,93 2.303.481 1,94 2.259.605
Provisions -138.983 4,15 -144.997 -101,09 13.314.096
Results from Investing Activity 23.040 -84,64 149.975 -50,99 306.006
Interest and Related Expenses 4.109.289 28,37 3.201.225 40,13 2.284.531
Plus/Minus Adjustments for Changes in Working Capital
Or in Relation to Operating Activities
Decrease/(Increase) of Inventory 3.969.601 -21,43 5.052.372 -7,23 5.446.407
Decrease/(Increase) of Receivables -2.192.682 26,34 -2.976.740 26,06 -4.026.052
Decrease/(Increase) of Current Liabilities (Excluding
Bank Accounts)-7.274.771 24,78 -9.671.036 14,98 -11.375.645
Less: Interest and Relevant Expenses Raid -3.528.089 -5,46 -3.345.508 -16,57 -2.870.015
Accounts1/7/2011 -
30/6/2012
Change
'12 - '11
(%)
1/7/2010 -
30/6/2011
Change '11 -
'10 (%)
1/7/2009 -
30/6/2010
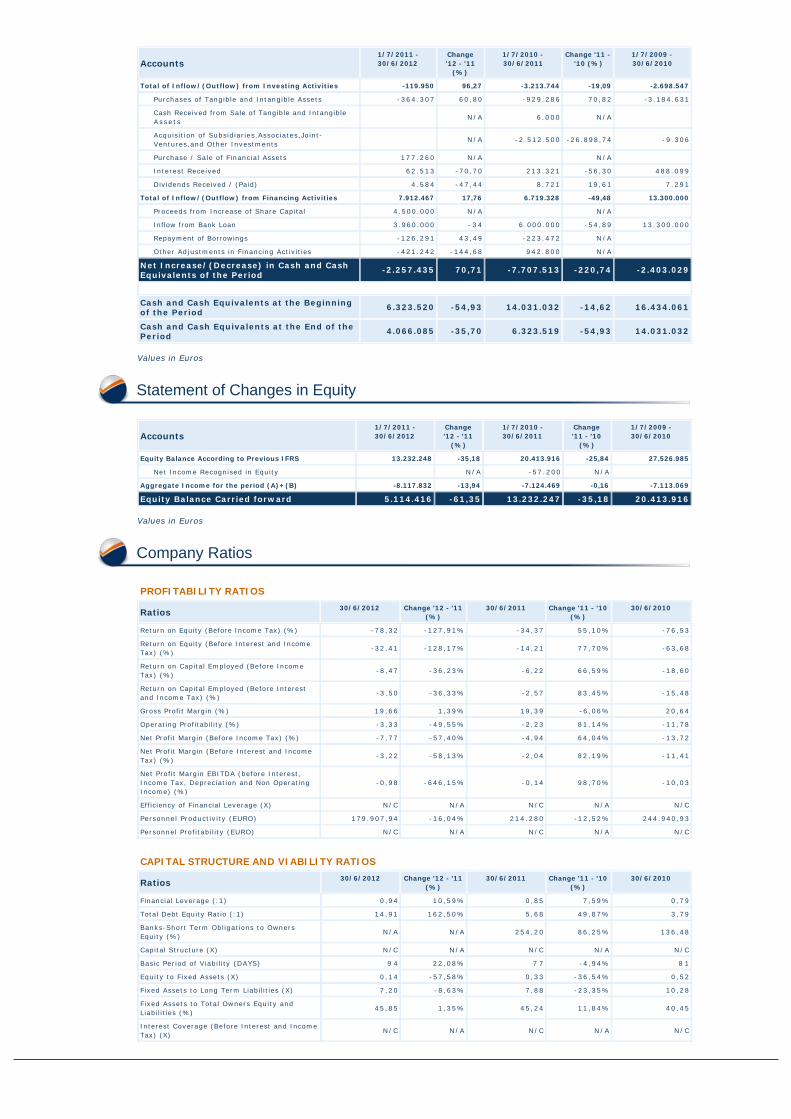
Total of Inflow/(Outflow) from Investing Activities -119.950 96,27 -3.213.744 -19,09 -2.698.547
Purchases of Tangible and Intangible Assets -364.307 60,80 -929.286 70,82 -3.184.631
Cash Received from Sale of Tangible and Intangible
Asse t s N /A 6.000 N/A
Acquisition of Subsidiaries,Associates,Joint-
Ventures,and Other Investments N /A -2.512.500 -26.898,74 -9.306
Purchase / Sale of Financial Assets 177.260 N/A N /A
Interest Received 62.513 -70,70 213.321 -56,30 488.099
Dividends Received / (Paid) 4.584 -47,44 8.721 19,61 7.291
Total of Inflow/(Outflow) from Financing Activities 7.912.467 17,76 6.719.328 -49,48 13.300.000
Proceeds from Increase of Share Capital 4.500.000 N/A N /A
Inflow from Bank Loan 3.960.000 - 3 4 6.000.000 -54,89 13.300.000
Repayment of Borrowings -126.291 43,49 -223.472 N/A
Other Adjustments in Financing Activities -421.242 -144,68 942.800 N/A
Net Increase/(Decrease) in Cash and CashEquivalents of the Period
-2.257.435 70,71 -7.707.513 -220,74 -2.403.029
Cash and Cash Equivalents at the Beginningof the Period
6.323.520 -54,93 14.031.032 -14,62 16.434.061
Cash and Cash Equivalents at the End of thePeriod
4.066.085 -35,70 6.323.519 -54,93 14.031.032
Values in Euros
Statement of Changes in Equity
Accounts1/7/2011 -
30/6/2012
Change
'12 - '11
(%)
1/7/2010 -
30/6/2011
Change
'11 - '10
(%)
1/7/2009 -
30/6/2010
Equity Balance According to Previous IFRS 13.232.248 -35,18 20.413.916 -25,84 27.526.985
Net Income Recognised in Equity N /A -57.200 N/A
Aggregate Income for the period (A)+(B) -8.117.832 -13,94 -7.124.469 -0,16 -7.113.069
Equity Balance Carried forward 5.114.416 -61,35 13.232.247 -35,18 20.413.916
Values in Euros
Company Ratios
PROFITABILITY RATIOS
Ratios30/6/2012 Change '12 - '11
(%)
30/6/2011 Change '11 - '10
(%)
30/6/2010
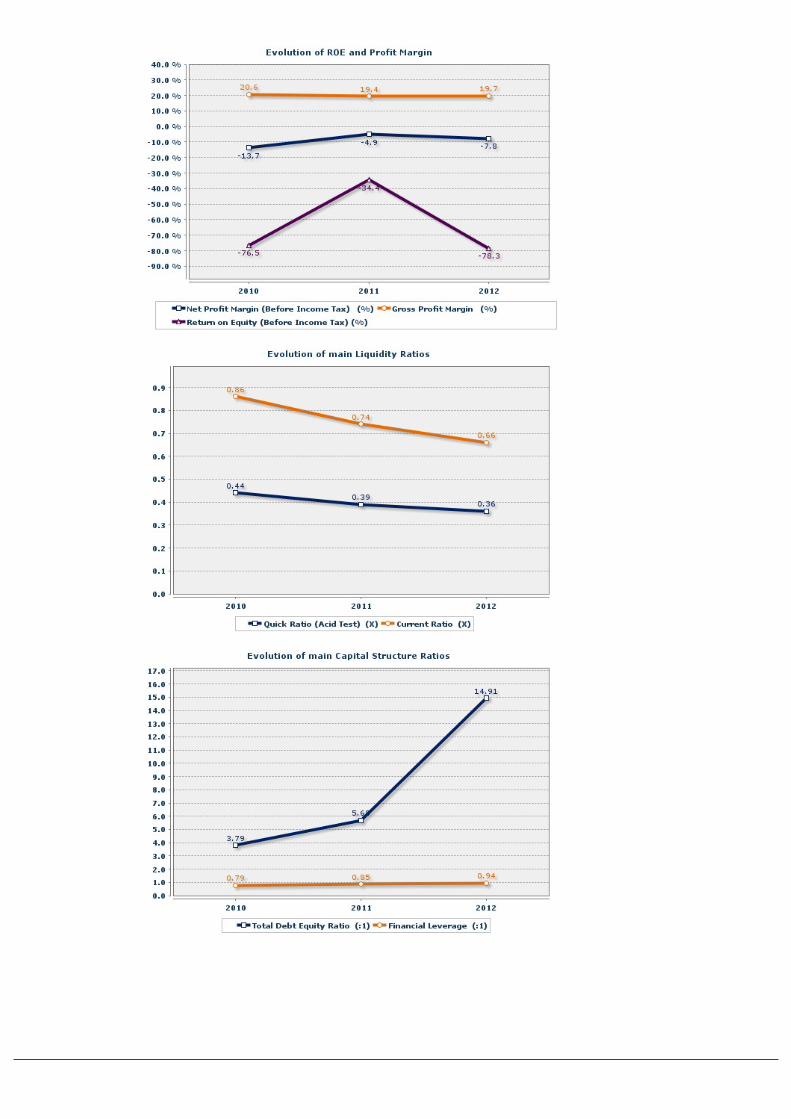
Return on Equity (Before Income Tax) (%) -78,32 -127,91% -34,37 55,10% -76,53
Return on Equity (Before Interest and Income
Tax) (%)-32,41 -128,17% -14,21 77,70% -63,68
Return on Capital Employed (Before Income
Tax) (%)-8,47 -36,23% -6,22 66,59% -18,60
Return on Capital Employed (Before Interest
and Income Tax) (%)-3,50 -36,33% -2,57 83,45% -15,48
Gross Profit Margin (%) 19,66 1,39% 19,39 -6,06% 20,64
Operating Profitability (%) -3,33 -49,55% -2,23 81,14% -11,78
Net Profit Margin (Before Income Tax) (%) -7,77 -57,40% -4,94 64,04% -13,72
Net Profit Margin (Before Interest and Income
Tax) (%)-3,22 -58,13% -2,04 82,19% -11,41
Net Profit Margin EBITDA (before Interest,
Income Tax, Depreciation and Non Operating
Income) (%)
-0,98 -646,15% -0,14 98,70% -10,03
Efficiency of Financial Leverage (X) N/C N/A N/C N/A N/C
Personnel Productivity (EURO) 179.907,94 -16,04% 214.280 -12,52% 244.940,93
Personnel Profitability (EURO) N/C N/A N/C N/A N/C
CAPITAL STRUCTURE AND VIABILITY RATIOS
Ratios30/6/2012 Change '12 - '11
(%)
30/6/2011 Change '11 - '10
(%)
30/6/2010
Financial Leverage (:1) 0,94 10,59% 0,85 7,59% 0,79
Total Debt Equity Ratio (:1) 14,91 162,50% 5,68 49,87% 3,79
Banks-Short Term Obligations to Owners
Equity (%)N/A N/A 254,20 86,25% 136,48
Capital Structure (X) N/C N/A N/C N/A N/C
Basic Period of Viability (DAYS) 9 4 22,08% 7 7 -4,94% 8 1
Equity to Fixed Assets (X) 0,14 -57,58% 0,33 -36,54% 0,52
Fixed Assets to Long Term Liabilities (X) 7,20 -8,63% 7,88 -23,35% 10,28
Fixed Assets to Total Owners Equity and
Liabilities (%)45,85 1,35% 45,24 11,84% 40,45
Interest Coverage (Before Interest and Income
Tax) (X)N/C N/A N/C N/A N/C
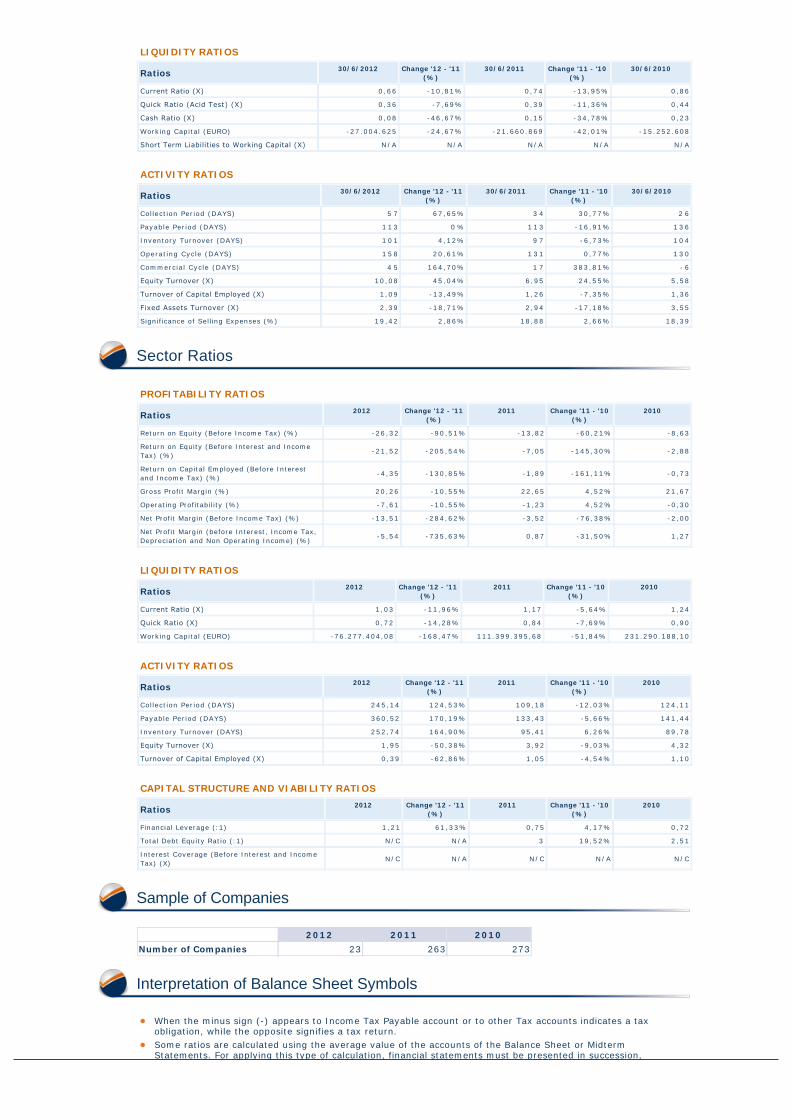
LIQUIDITY RATIOS
Ratios30/6/2012 Change '12 - '11
(%)
30/6/2011 Change '11 - '10
(%)
30/6/2010
Current Ratio (Χ) 0,66 -10,81% 0,74 -13,95% 0,86
Quick Ratio (Acid Test) (Χ) 0,36 -7,69% 0,39 -11,36% 0,44
Cash Ratio (Χ) 0,08 -46,67% 0,15 -34,78% 0,23
Working Capital (EURO) -27.004.625 -24,67% -21.660.869 -42,01% -15.252.608
Short Term Liabilities to Working Capital (Χ) N/A N/A N/A N/A N/A
ACTIVITY RATIOS
Ratios30/6/2012 Change '12 - '11
(%)
30/6/2011 Change '11 - '10
(%)
30/6/2010
Collection Period (DAYS) 5 7 67,65% 3 4 30,77% 2 6
Payable Period (DAYS) 1 1 3 0 % 1 1 3 -16,91% 1 3 6
Inventory Turnover (DAYS) 1 0 1 4,12% 9 7 -6,73% 1 0 4
Operating Cycle (DAYS) 1 5 8 20,61% 1 3 1 0,77% 1 3 0
Commercial Cycle (DAYS) 4 5 164,70% 1 7 383,81% - 6
Equity Turnover (Χ) 10,08 45,04% 6,95 24,55% 5,58
Turnover of Capital Employed (Χ) 1,09 -13,49% 1,26 -7,35% 1,36
Fixed Assets Turnover (Χ) 2,39 -18,71% 2,94 -17,18% 3,55
Significance of Selling Expenses (%) 19,42 2,86% 18,88 2,66% 18,39
Sector Ratios
PROFITABILITY RATIOS
Ratios2012 Change '12 - '11
(%)
2011 Change '11 - '10
(%)
2010
Return on Equity (Before Income Tax) (%) -26,32 -90,51% -13,82 -60,21% -8,63
Return on Equity (Before Interest and Income
Tax) (%)-21,52 -205,54% -7,05 -145,30% -2,88
Return on Capital Employed (Before Interest
and Income Tax) (%)-4,35 -130,85% -1,89 -161,11% -0,73
Gross Profit Margin (%) 20,26 -10,55% 22,65 4,52% 21,67
Operating Profitability (%) -7,61 -10,55% -1,23 4,52% -0,30
Net Profit Margin (Before Income Tax) (%) -13,51 -284,62% -3,52 -76,38% -2,00
Net Profit Margin (before Interest, Income Tax,
Depreciation and Non Operating Income) (%)-5,54 -735,63% 0,87 -31,50% 1,27
LIQUIDITY RATIOS
Ratios2012 Change '12 - '11
(%)
2011 Change '11 - '10
(%)
2010
Current Ratio (Χ) 1,03 -11,96% 1,17 -5,64% 1,24
Quick Ratio (Χ) 0,72 -14,28% 0,84 -7,69% 0,90
Working Capital (EURO) -76.277.404,08 -168,47% 111.399.395,68 -51,84% 231.290.188,10
ACTIVITY RATIOS
Ratios2012 Change '12 - '11
(%)
2011 Change '11 - '10
(%)
2010
Collection Period (DAYS) 245,14 124,53% 109,18 -12,03% 124,11
Payable Period (DAYS) 360,52 170,19% 133,43 -5,66% 141,44
Inventory Turnover (DAYS) 252,74 164,90% 95,41 6,26% 89,78
Equity Turnover (Χ) 1,95 -50,38% 3,92 -9,03% 4,32
Turnover of Capital Employed (Χ) 0,39 -62,86% 1,05 -4,54% 1,10
CAPITAL STRUCTURE AND VIABILITY RATIOS
Ratios2012 Change '12 - '11
(%)
2011 Change '11 - '10
(%)
2010
Financial Leverage (:1) 1,21 61,33% 0,75 4,17% 0,72
Total Debt Equity Ratio (:1) N/C N/A 3 19,52% 2,51
Interest Coverage (Before Interest and Income
Tax) (X)N/C N/A N/C N/A N/C
Sample of Companies
2012 2011 2010
Number of Companies 23 263 273
Interpretation of Balance Sheet Symbols
• When the minus sign (-) appears to Income Tax Payable account or to other Tax accounts indicates a taxobligation, while the opposite signifies a tax return.
• Some ratios are calculated using the average value of the accounts of the Balance Sheet or MidtermStatements. For applying this type of calculation, financial statements must be presented in succession,
with common accounting standards (either Greek Standards or IFRS) and with the same depth of analysis.In the opposite case, the corresponding ratios are calculated based on the accounts as at they arepresented in the reporting year.
• N/A: Not Available
• N/C: Not Calculable
• The indications N/A and N/C may appear in cases where accounts that participate in the computation of theratios or in the accounts changes are not detected in the original balance sheet as well as the computationof certain ratios does not have a meaning i.e. Return on Equity ratio or Total Dept Equity ratio when Equityis negative, etc.
Balance Sheet Graphs
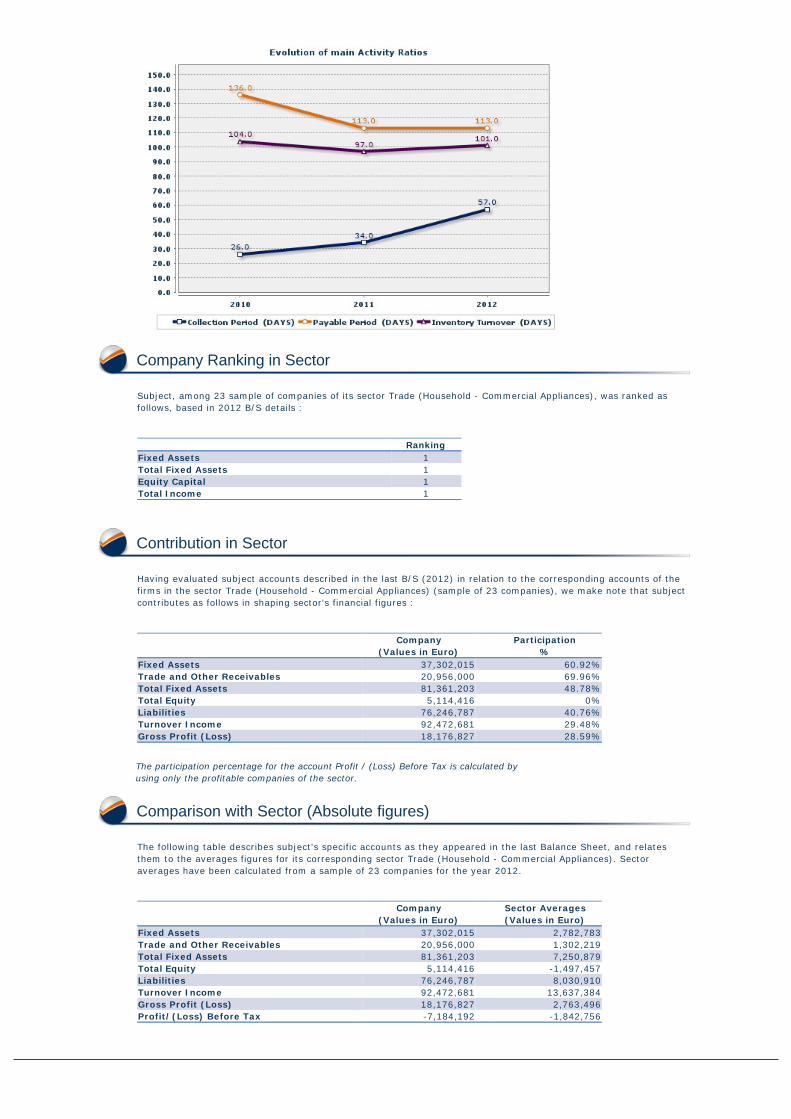
Company Ranking in Sector
Subject, among 23 sample of companies of its sector Trade (Household - Commercial Appliances), was ranked as
follows, based in 2012 B/S details :
Ranking
Fixed Assets 1
Total Fixed Assets 1
Equity Capital 1
Total Income 1
Contribution in Sector
Having evaluated subject accounts described in the last B/S (2012) in relation to the corresponding accounts of the
firms in the sector Trade (Household - Commercial Appliances) (sample of 23 companies), we make note that subject
contributes as follows in shaping sector's financial figures :
Company Participation
(Values in Euro) %
Fixed Assets 37,302,015 60.92%
Trade and Other Receivables 20,956,000 69.96%
Total Fixed Assets 81,361,203 48.78%
Total Equity 5,114,416 0%
Liabilities 76,246,787 40.76%
Turnover Income 92,472,681 29.48%
Gross Profit (Loss) 18,176,827 28.59%
The participation percentage for the account Profit / (Loss) Before Tax is calculated by
using only the profitable companies of the sector.
Comparison with Sector (Absolute figures)
The following table describes subject's specific accounts as they appeared in the last Balance Sheet, and relates
them to the averages figures for its corresponding sector Trade (Household - Commercial Appliances). Sector
averages have been calculated from a sample of 23 companies for the year 2012.
Company Sector Averages
(Values in Euro) (Values in Euro)
Fixed Assets 37,302,015 2,782,783
Trade and Other Receivables 20,956,000 1,302,219
Total Fixed Assets 81,361,203 7,250,879
Total Equity 5,114,416 -1,497,457
Liabilities 76,246,787 8,030,910
Turnover Income 92,472,681 13,637,384
Gross Profit (Loss) 18,176,827 2,763,496
Profit/(Loss) Before Tax -7,184,192 -1,842,756
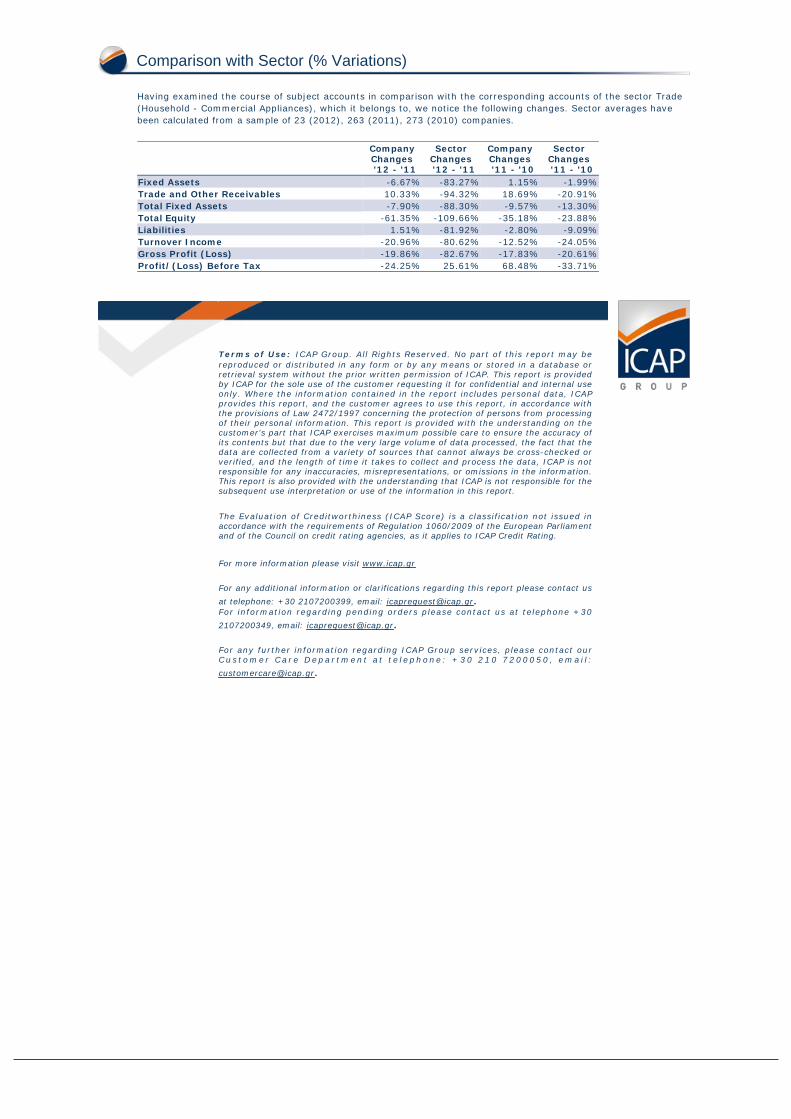
Comparison with Sector (% Variations)
Having examined the course of subject accounts in comparison with the corresponding accounts of the sector Trade
(Household - Commercial Appliances), which it belongs to, we notice the following changes. Sector averages have
been calculated from a sample of 23 (2012), 263 (2011), 273 (2010) companies.
CompanyChanges
'12 - '11
SectorChanges
'12 - '11
CompanyChanges
'11 - '10
SectorChanges
'11 - '10
Fixed Assets -6.67% -83.27% 1.15% -1.99%
Trade and Other Receivables 10.33% -94.32% 18.69% -20.91%
Total Fixed Assets -7.90% -88.30% -9.57% -13.30%
Total Equity -61.35% -109.66% -35.18% -23.88%
Liabilities 1.51% -81.92% -2.80% -9.09%
Turnover Income -20.96% -80.62% -12.52% -24.05%
Gross Profit (Loss) -19.86% -82.67% -17.83% -20.61%
Profit/(Loss) Before Tax -24.25% 25.61% 68.48% -33.71%
Terms of Use: ICAP Group. All Rights Reserved. No part of this report may be
reproduced or distributed in any form or by any means or stored in a database orretrieval system without the prior written permission of ICAP. This report is providedby ICAP for the sole use of the customer requesting it for confidential and internal useonly. Where the information contained in the report includes personal data, ICAPprovides this report, and the customer agrees to use this report, in accordance withthe provisions of Law 2472/1997 concerning the protection of persons from processingof their personal information. This report is provided with the understanding on thecustomer's part that ICAP exercises maximum possible care to ensure the accuracy ofits contents but that due to the very large volume of data processed, the fact that thedata are collected from a variety of sources that cannot always be cross-checked orverified, and the length of time it takes to collect and process the data, ICAP is notresponsible for any inaccuracies, misrepresentations, or omissions in the information.This report is also provided with the understanding that ICAP is not responsible for thesubsequent use interpretation or use of the information in this report.
The Evaluation of Creditworthiness (ICAP Score) is a classification not issued inaccordance with the requirements of Regulation 1060/2009 of the European Parliamentand of the Council on credit rating agencies, as it applies to ICAP Credit Rating.
For more information please visit www.icap.gr
For any additional information or clarifications regarding this report please contact us
at telephone: +30 2107200399, email: [email protected] information regarding pending orders please contact us at telephone +30
2107200349, email: [email protected].
For any further information regarding ICAP Group services, please contact ourC u s t o m e r C a r e D e p a r t m e n t a t t e l e p h o n e : + 3 0 2 1 0 7 2 0 0 0 5 0 , e m a i l :