MOMP from Campylobacter jejuni Is a Trimer of 18-Stranded β ...
Codon populations in single-stranded whole human genome DNA are fractal and fine-tuned by the Golden Ratio 1.618
Jean-claude Perez φ
Abstract: This new bioinformatics research bridges Genomics and Mathematics. We propose a universal “Fractal Genome Code Law”: The frequency of each of the 64 codons across the entire human genome is controlled by the codon's position in the Universal Genetic Code table. We analyze the frequency of distribution of the 64 codons (codon usage) within single-stranded DNA sequences. Concatenating 24 Human chromosomes, we show that the entire human genome employs the well known universal genetic code table as a macro structural model. The position of each codon within this table precisely dictates its population. So the Universal Genetic Code Table not only maps codons to amino acids, but serves as a global checksum matrix. Frequencies of the 64 codons in the whole human genome scale are a self-similar fractal expansion of the universal genetic code. The original genetic code kernel governs not only the micro scale but the macro scale as well. Particularly, the 6 folding steps of codon populations modeled by the binary divisions of the “Dragon fractal paper folding curve” show evidence of 2 attractors. The numerical relationship between the attractors is derived from the Golden Ratio. We demonstrate that:
1. The whole Human Genome Structure uses the Universal Genetic Code Table as a tuning model. It pre-determines global codons proportions and populations. The Universal Genetic Code Table governs both micro and macro behavior of the genome.2. We extend the Chargaff's second rule from the domain of single TCAG nucleotides to the larger domain of codon triplets.3. Codon frequencies in the human genome are clustered around 2 fractal-like attractors, strongly linked to the golden ratio 1.618.
Keywords: Interdisciplinary, Bioinformatics, Mathematics, Human Genome decoding, Universal Genetic Code, Chargaff's rules, Noncoding DNA, Symmetry, Chaos Theory, Fractals, Golden Ratio, Checksum, Cellular automata, DNA strands atomic weights balance.
1 IntroductionAside from a few obscure papers, fractals and the golden ratio have not been considered relevant to DNA or the study of the human genome. However, two major papers in the journal Science in October 2009 and January 2010 have stimulated the genetics community to pursue new lines of inquiry within these concepts.First, in October 2009, in a prominent paper (Lieberman-Aiden et al., 2009), E. Lieberman-Aiden used HI-C mass technology to probe the three-dimensional architecture of the whole genome. They explored the chromatin conformation folding of the whole human genome on a megabase scale. Their research reveals it to be consistent with a fractal globule model. The cover of Science Magazine (Lander, 2009) showed a folding Hilbert fractal curve. Dr. Eric Lander (Science Adviser to the President and Director of the Broad Institute) enthusiastically announced: “Mr. President, the Genome is Fractal!”For the first time, they proved at a physical level, the fractal nature (Mandelbrot, 1953) of human genome DNA molecule, including chromatin (DNA + proteins, i.e. Histones). “Since the PHYSICAL structure was found fractal (providing enormous amount of untangled compression), it is reasonable that the LOGICAL sequence and function of the genome are also fractal.” (Pellionisz, A., 2009, personal communication: From the Principle of Recursive
φ Email: j [email protected] Jean-claude Perez 7 avenue de terre-rouge F33127 Martignas France, 33-0950507849.
Genome Function to Interpretation of HoloGenome Regulation by Personal Genome Computers. Cold Spring Harbor Laboratory. Personal Genomes Conference, Sept. 14-17, 2009). Secondly, in January 2010, the journal Science reported that the golden ratio is present in the atomic scale of the magnetic resonance of spins of cobalt niobate atoms (Coldea et al., 2010). When applying a magnetic field at right angles to an aligned spin, the magnetic chain shifts into a new state called “quantum critical.” New properties emerge from Heisenberg's Uncertainly Principle.
For the last 20 years, whole genomes have revealed traces of fractal behavior as various publications studied the logical level of both elementary gene-coding or non-coding TCAG single DNA sequences. In Nature in 1992, C.K. Peng found trace evidence of fractals in analyzing DNA sequences (Peng et al., 1992). Models of fractal integer patterns, like Fibonacci or Lucas numbers, have been proposed: In 1991 we proposed that Golden Ratio Fibonacci/Lucas integer numbers define strong relationships between DNA gene-coding region sequences and Fibonacci's embedded TCAG gene sequence patterns (Perez, 1991). We also prove the optimality of these patterns (Perez, 1997) in the book L'ADN décrypté (“Deciphering DNA”) @. Examples involving evolution and pathogen analysis include genes or small genes-rich genomes §
especially the HIV genome. Then, in 2007, Yamagishi proposed evidence of Fibonacci based organization and verified it at a statistical global level across the whole human genome. (Yamagishi et al., 2008).For several years, other researchers like A. Pellionisz advocated ways to analyze and detect fractal defects within whole genomes. This is based on recursive fractal exploration methods and artificial neural network technologies (Pellionisz, 2008).
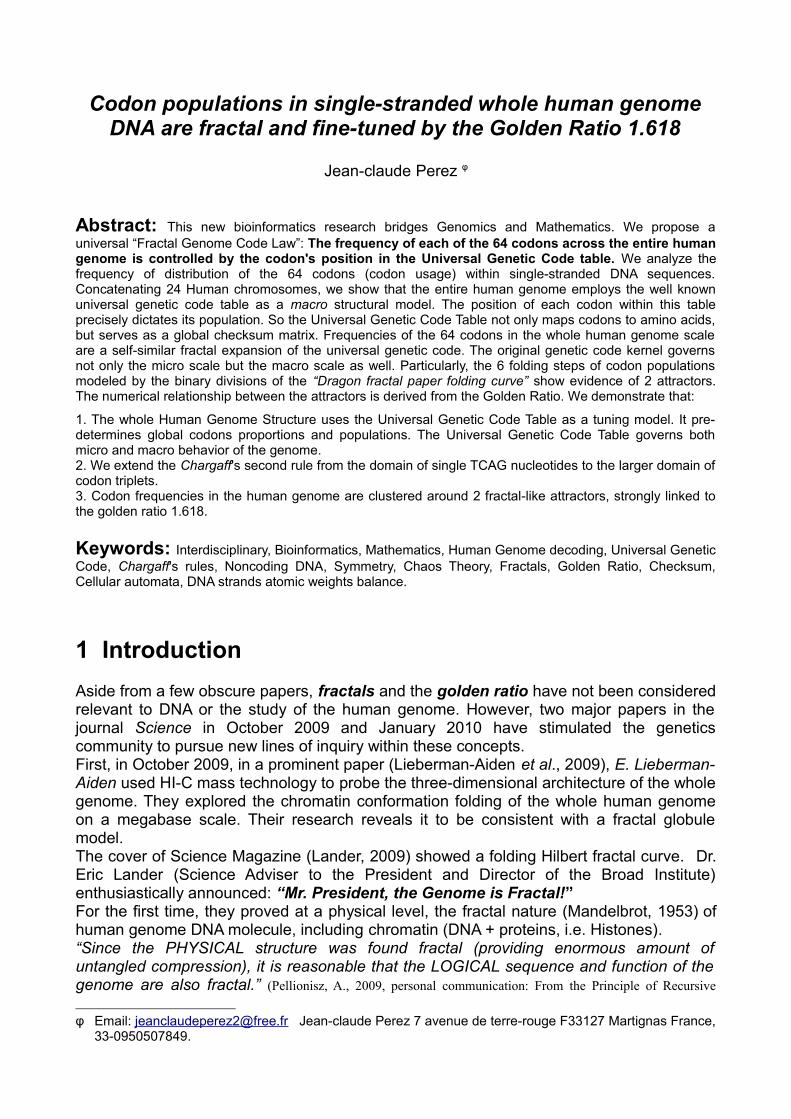
Then finally, simultaneously with the (Lander, 2009) October 2009 paper, we showed in the book Codex Biogenesis (Perez, 2009) a convergence of evidence for whole genome fractal organization. This comes from analyzing whole genomes not at a physical level, but at the logical level of TCAG single stranded sequenced DNA. These findings were obtained primarily by analyzing the finalized human genome sequence (Baltimore, 2001).The goal of the present paper is show fractal behavior in the genome at the logical DNA analysis level. We provide an exhaustive analysis of codon frequencies on a whole human genome scale. This analysis classifies the 64 codon populations combined with various embedded foldings of the universal genetic code map. This is based on the DRAGON curve (Gardner, 1967) also called the “folding paper curve” (see figure a). It reveals the fractal structure of the whole human genome at the DNA sequential information scale. This analysis reveals that codon frequencies are oriented around 2 numerical attractors. The distance separating the attractors is “1/2Phi”, where Phi is the “Golden ratio”. These discoveries simultaneously extend the reach of Chargaff's second rule for single-stranded DNA of the whole Human Genome.
@ This book explores a numerical property called « DNA Supracode » consisting of an exhaustive combinatorial research of « resonances » within gene-coding DNA sequences: a resonance is an exact Fibonacci/Lucas nucleotide number harmonious proportion. For example: 144 contiguous TCAG nucleotides have exactly 55 T nucleotides and 89 A or C or G nucleotides. Then a resonance exists with an exact Golden ratio proportion as defined in the Methods section: 55, 89 and 144 are consecutive Fibonacci numbers following the Golden Ratio. Gene-rich genomes like HIV have thousands « resonances », where the longer ones are overlapping 2/3rds of the whole genome length.§ Research on HIV-SIV isolates genomic diversity with the support of Pr Luc Montagnier, FMPRS (World
Foundation for AIDS research and Prevention (UNESCO), 1 rue Miollis, 75015, Paris, France).
Figure a- The Dragon curve or “paper folding” embedded fractal dynamics.
2 MethodsHuman genome release analysed with Dragon curve folding.
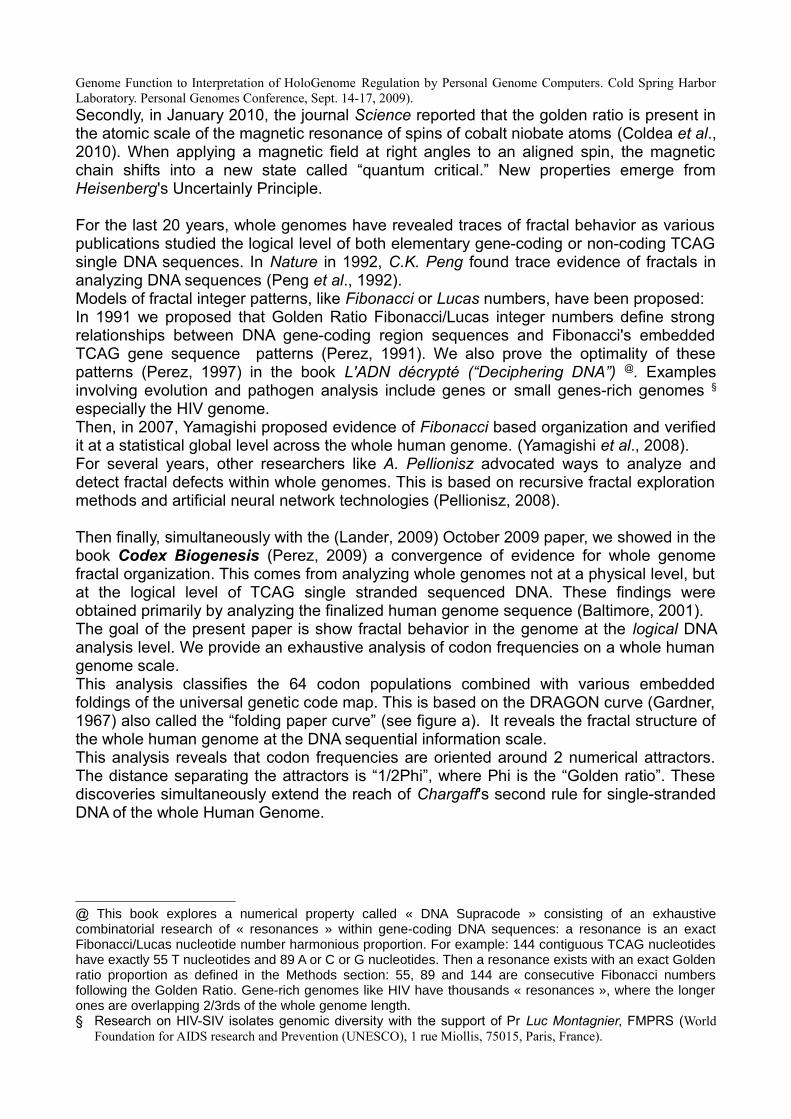
We analyzed the entirety of the whole human genome from the 2003 “BUILD34” finalized release #. We considered only the main single strand of the DNA sequence. Within this sequence, we computed, for each of the 3 possible codon reading frames, the cumulative number of each of the 64 genetic code codons &. This process £ analyzes the sequence of 24 human chromosomes. Then all 64 codon populations are totaled, adding the 3 codon reading frames and the 24 chromosomes. The total count is exactly of 2.843.411.612 codons. Now the 64 codon populations are arranged according to the 4 columns of the well known Universal Genetic Code map (column T, then column C, then column A, then column G). Then this list is partitioned successively 6 ways according to the 6 binary splits of the dragon curve dynamical folding (see figure b):Dragon1: 2 partitions of 32 codons each.Dragon2: 4 partitions of 16 codons each. Dragon3: 8 partitions of 8 codons each.Dragon4: 16 partitions of 4 codons each.Dragon5: 32 partitions of 2 codons each.Dragon6: 64 partitions of 1 codon each.
# Human genome finalized BUILD34. Build 34 finished human genome assembly (hg16, Jul 2003). http://hgdownload.cse.ucsc.edu/goldenPath/hg16/chromosomes/& The full detailed data relating codon populations for the 3 codon reading frame and for the 24 human
chromosomes is available in supplementary materials.£ Computer language used for this research was the parallel interactive mathematical language APL+WIN
(APL language – A Programming Language – invented by K.E. Iverson in 1957 at Harvard University began as a mathematical notation for manipulating arrays that he taught to his students. Then, in 1964, APL was implemented in computers by IBM).
Figure b- Six Dragon curve folds of the whole human genome 64 codon populations.
Golden ratio overview.
“Phi”, the Golden ratio, is an irrational number. Its value is approximately 1.618. It was introduced initially by Euclid (Euclid, 1533 first printed Edition). He provides the first known written definition of Phi: "A straight line is said to have been cut in extreme and mean ratio when, as the whole line is to the greater segment, so is the greater to the less".To summarize: if “a+b” is the whole line, and “a” is the larger segment and “b” is the smaller segment, then:
( a + b ) / a = a / b = PhiThe numerical value of the Golden ratio is 1.6180339887...The golden ratio has fascinated people of diverse interests for at least 2,400 years. But in scientific research it's considered more of an intellectual curiosity than a source of rigorous technical insight. Many are unsure of how to apply it. But it is observed in many major scientific disciplines: for example, in artificial neural networks (Perez, 1990), superconductors (Perez, 1994), and quantum physics:
− Coldea describes his discovery of Golden ratio in quantum Physics at the beginning of his paper (Coldea et al., 2010): “To analyze these nanoscale quantum effects researchers have chosen the cobalt niobate material consisting of linked magnetic atoms, which form thin chains one atom wide. This model is useful to describe ferromagnetism on the nanoscale in solid matter. Applying a magnetic field on aligned spin from the magnetic chain will transform it into a new matter state called quantum critica, which recalls the quantum version of a fractal pattern. Then, the system reaches a kind of quantum uncertain Schrödinger cat state.”
Dr. Radu Coldea from Oxford University, who is the principal author of the paper, explains: "Here the tension comes from the interaction between spins causing them to magnetically resonate. For these interactions we found a series (scale) of resonant notes: The first two notes show a perfect relationship with each other. Their frequencies (pitch) are in the ratio of 1.618…, which is the golden ratio famous in art and architecture." There is no coincidence. "It reflects a beautiful property of the quantum system – a hidden symmetry. Actually quite a special one called E8 by mathematicians, and this is its first observation in a material.”
− In other fields, the Golden ratio was also recently discovered within a magnetic compound (Affleck, 2010). The introductory paper abstract is typical in its ambiguous assessment of the Golden Ratio's scientific merit: “The golden ratio — an exact 'magic' number often claimed to be observed when taking ratios of distances in ancient and modern architecture, sculpture and painting — has been spotted in a magnetic compound.”
− In (Calleman, 2009), the author reports that « Golden Ratio is also involved in the universal Bohr radius formula measuring a single electron orbits hydrogen's atom nucleus and its smallest possible orbit, with lowest energy, which is the most likely position of the electron ».
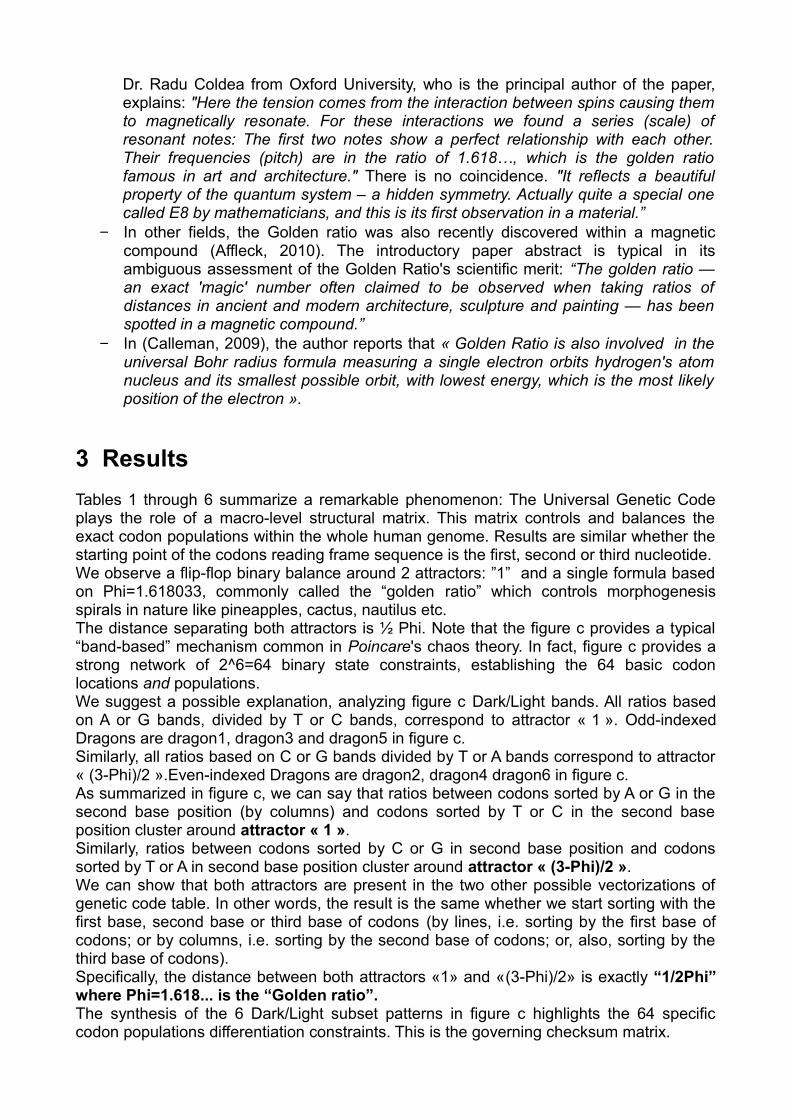
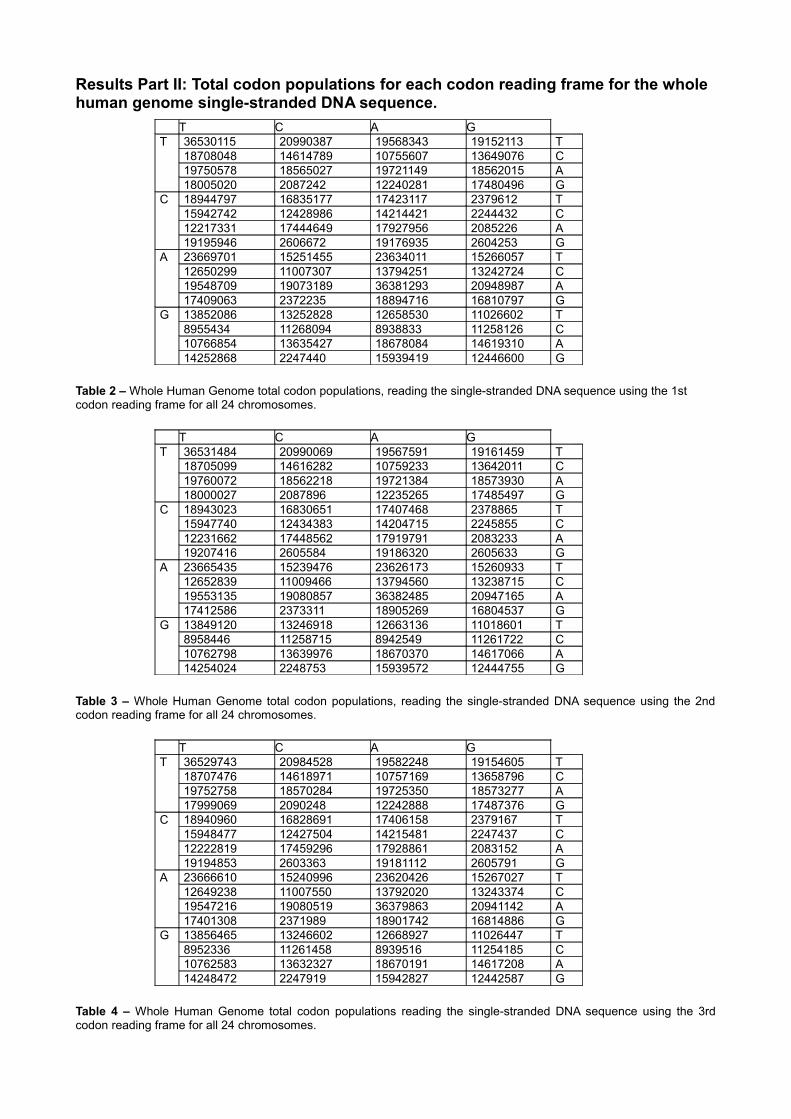
3 ResultsTables 1 through 6 summarize a remarkable phenomenon: The Universal Genetic Code plays the role of a macro-level structural matrix. This matrix controls and balances the exact codon populations within the whole human genome. Results are similar whether the starting point of the codons reading frame sequence is the first, second or third nucleotide.We observe a flip-flop binary balance around 2 attractors: ”1” and a single formula based on Phi=1.618033, commonly called the “golden ratio” which controls morphogenesis spirals in nature like pineapples, cactus, nautilus etc. The distance separating both attractors is ½ Phi. Note that the figure c provides a typical “band-based” mechanism common in Poincare's chaos theory. In fact, figure c provides a strong network of 2^6=64 binary state constraints, establishing the 64 basic codon locations and populations. We suggest a possible explanation, analyzing figure c Dark/Light bands. All ratios based on A or G bands, divided by T or C bands, correspond to attractor « 1 ». Odd-indexed Dragons are dragon1, dragon3 and dragon5 in figure c. Similarly, all ratios based on C or G bands divided by T or A bands correspond to attractor « (3-Phi)/2 ».Even-indexed Dragons are dragon2, dragon4 dragon6 in figure c. As summarized in figure c, we can say that ratios between codons sorted by A or G in the second base position (by columns) and codons sorted by T or C in the second base position cluster around attractor « 1 ». Similarly, ratios between codons sorted by C or G in second base position and codons sorted by T or A in second base position cluster around attractor « (3-Phi)/2 ». We can show that both attractors are present in the two other possible vectorizations of genetic code table. In other words, the result is the same whether we start sorting with the first base, second base or third base of codons (by lines, i.e. sorting by the first base of codons; or by columns, i.e. sorting by the second base of codons; or, also, sorting by the third base of codons). Specifically, the distance between both attractors «1» and «(3-Phi)/2» is exactly “1/2Phi” where Phi=1.618... is the “Golden ratio”.The synthesis of the 6 Dark/Light subset patterns in figure c highlights the 64 specific codon populations differentiation constraints. This is the governing checksum matrix.
Now we can reformulate our introductory sentence as follows: “Populations of each of the 64 codons within whole human genome single-stranded DNA sequence are controlled by the positions of these same codons in the Universal Genetic Code table... and finally by the nucleotide compositions of these elementary codons”.
Results Part I: Total codon populations, adding the 3 codon reading frames for the whole human genome single-stranded DNA sequence.
SECOND NUCLEOTIDET C A G
FIRST
NUCLEOTIDE
T TTT 1095913422.4667
TCT 629649841.4172
TAT 587181821.3216
TGT 574681771.2935
T
THIRD
NUCLEOTIDE
TTC 561206231.2632
TCC 438500420.9870
TAC 322720090.7264
TGC 409498830.9217
C
TTA 592634081.3339
TCA 556975291.2536
TAA 591678831.3318
TGA 557092221.2539
A
TTG 540041161.2155
TCG 62653860.1410
TAG 367184340.8265
TGG 524533691.1806
G
C CTT 568287801.2791
CCT 504945191.1365
CAT 522367431.1758
CGT 71376440.1607
T
CTC 478389591.0768
CCC 372908730.8393
CAC 426346170.9596
CGC 67377240.1517
C
CTA 366718120.8254
CCA 523525071.1784
CAA 537766081.2104
CGA 62516110.1407
A
CTG 575982151.2964
CCG 78156190.1759
CAG 575443671.2952
CGG 78156770.1759
G
A ATT 710017461.5981
ACT 457319271.0293
AAT 708806101.5954
AGT 457940171.0307
T
ATC 379523760.8542
ACC 330243230.7433
AAC 413808310.9314
AGC 397248130.8941
C
ATA 586490601.3201
ACA 572345651.2882
AAA 1091436412.4566
AGA 628372941.4144
A
ATG 522229571.1754
ACG 71175350.1602
AAG 567017271.2763
AGG 504302201.1351
G
G GTT 415576710.9354
GCT 397463480.8946
GAT 379905930.8551
GGT 330716500.7444
T
GTC 268662160.6047
GCC 337882670.7605
GAC 268208980.6037
GGC 337740330.7602
C
GTA 322922350.7268
GCA 409077300.9208
GAA 560186451.2609
GGA 438535840.9871
A
GTG 427553640.9623
GCG 67441120.1518
GAG 478218181.0764
GGG 373339420.8403
G
Table 1 - The 64 codon populations of the whole human genome for the 3 codon reading frames of single stranded DNA (2843411612 codons). In this figure, the 3 values in each cell are: the codon label, the codon's total population, the “Codon Frequency Ratio” (CFR). CFR is computed as: codon population x 64 / 2.843.411.612. (where 2.843.411.612 is the whole genome cumulated codons). Then, if CFR < 1, the codon is rare, if CFR>1, the codon is frequent.
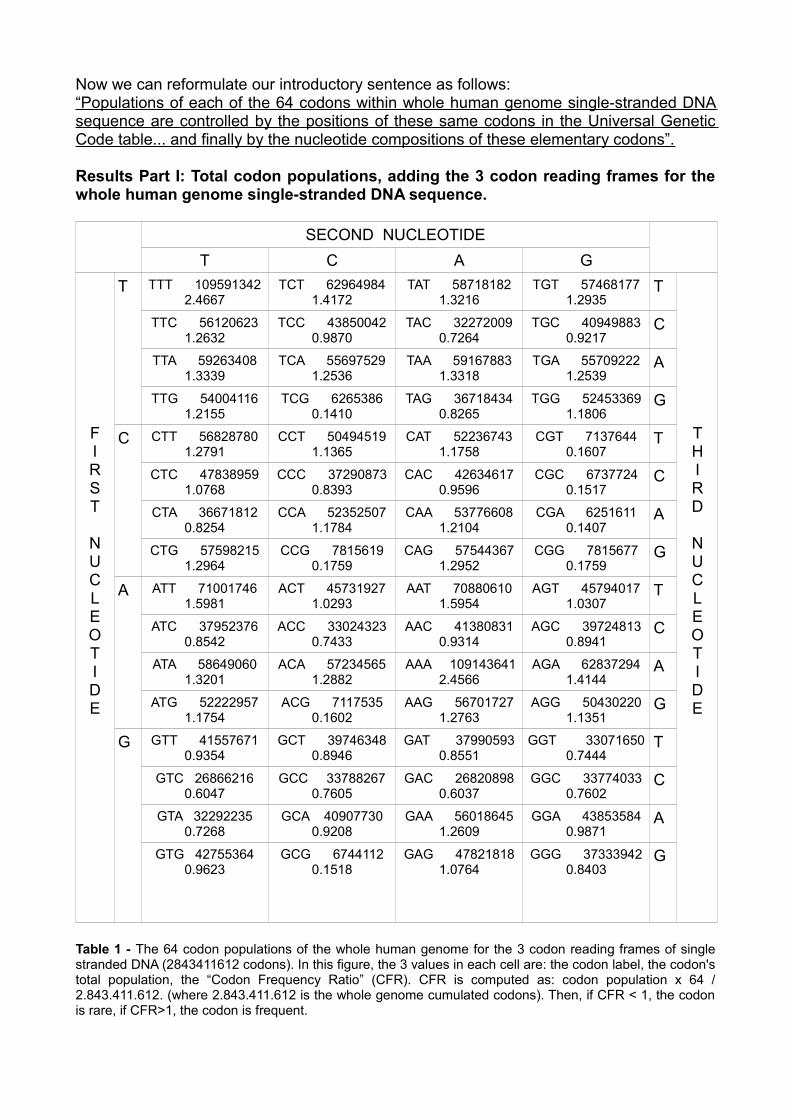
Results Part II: Total codon populations for each codon reading frame for the whole human genome single-stranded DNA sequence.
T C A GT 36530115 20990387 19568343 19152113 T
18708048 14614789 10755607 13649076 C19750578 18565027 19721149 18562015 A18005020 2087242 12240281 17480496 G
C 18944797 16835177 17423117 2379612 T15942742 12428986 14214421 2244432 C12217331 17444649 17927956 2085226 A19195946 2606672 19176935 2604253 G
A 23669701 15251455 23634011 15266057 T12650299 11007307 13794251 13242724 C19548709 19073189 36381293 20948987 A17409063 2372235 18894716 16810797 G
G 13852086 13252828 12658530 11026602 T8955434 11268094 8938833 11258126 C10766854 13635427 18678084 14619310 A14252868 2247440 15939419 12446600 G
Table 2 – Whole Human Genome total codon populations, reading the single-stranded DNA sequence using the 1st codon reading frame for all 24 chromosomes.
T C A GT 36531484 20990069 19567591 19161459 T
18705099 14616282 10759233 13642011 C19760072 18562218 19721384 18573930 A18000027 2087896 12235265 17485497 G
C 18943023 16830651 17407468 2378865 T15947740 12434383 14204715 2245855 C12231662 17448562 17919791 2083233 A19207416 2605584 19186320 2605633 G
A 23665435 15239476 23626173 15260933 T12652839 11009466 13794560 13238715 C19553135 19080857 36382485 20947165 A17412586 2373311 18905269 16804537 G
G 13849120 13246918 12663136 11018601 T8958446 11258715 8942549 11261722 C10762798 13639976 18670370 14617066 A14254024 2248753 15939572 12444755 G
Table 3 – Whole Human Genome total codon populations, reading the single-stranded DNA sequence using the 2nd codon reading frame for all 24 chromosomes.
T C A GT 36529743 20984528 19582248 19154605 T
18707476 14618971 10757169 13658796 C19752758 18570284 19725350 18573277 A17999069 2090248 12242888 17487376 G
C 18940960 16828691 17406158 2379167 T15948477 12427504 14215481 2247437 C12222819 17459296 17928861 2083152 A19194853 2603363 19181112 2605791 G
A 23666610 15240996 23620426 15267027 T12649238 11007550 13792020 13243374 C19547216 19080519 36379863 20941142 A17401308 2371989 18901742 16814886 G
G 13856465 13246602 12668927 11026447 T8952336 11261458 8939516 11254185 C10762583 13632327 18670191 14617208 A14248472 2247919 15942827 12442587 G
Table 4 – Whole Human Genome total codon populations reading the single-stranded DNA sequence using the 3rd codon reading frame for all 24 chromosomes.
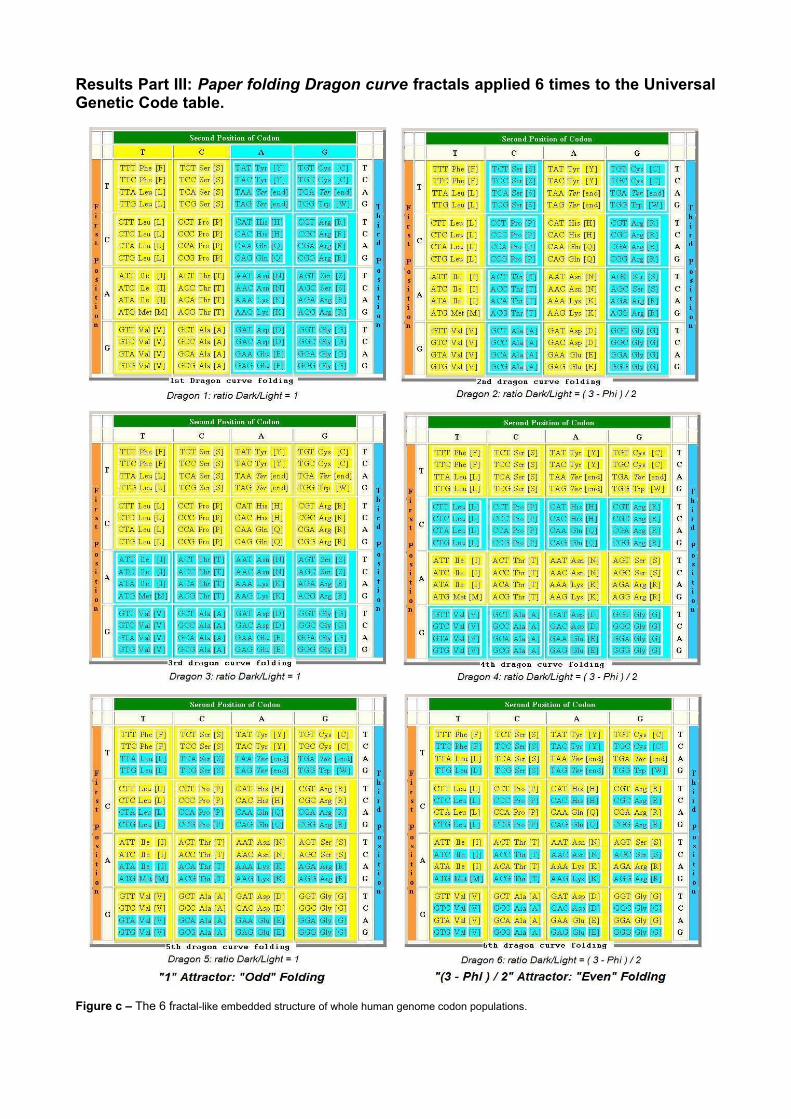
Results Part III: Paper folding Dragon curve fractals applied 6 times to the Universal Genetic Code table.
Figure c – The 6 fractal-like embedded structure of whole human genome codon populations.
Fractal Embedded Foldings
Total Odd (ODD)
Total Even(EVEN)
Ratios Odd/Even
Ratios Even/Odd
Attractors
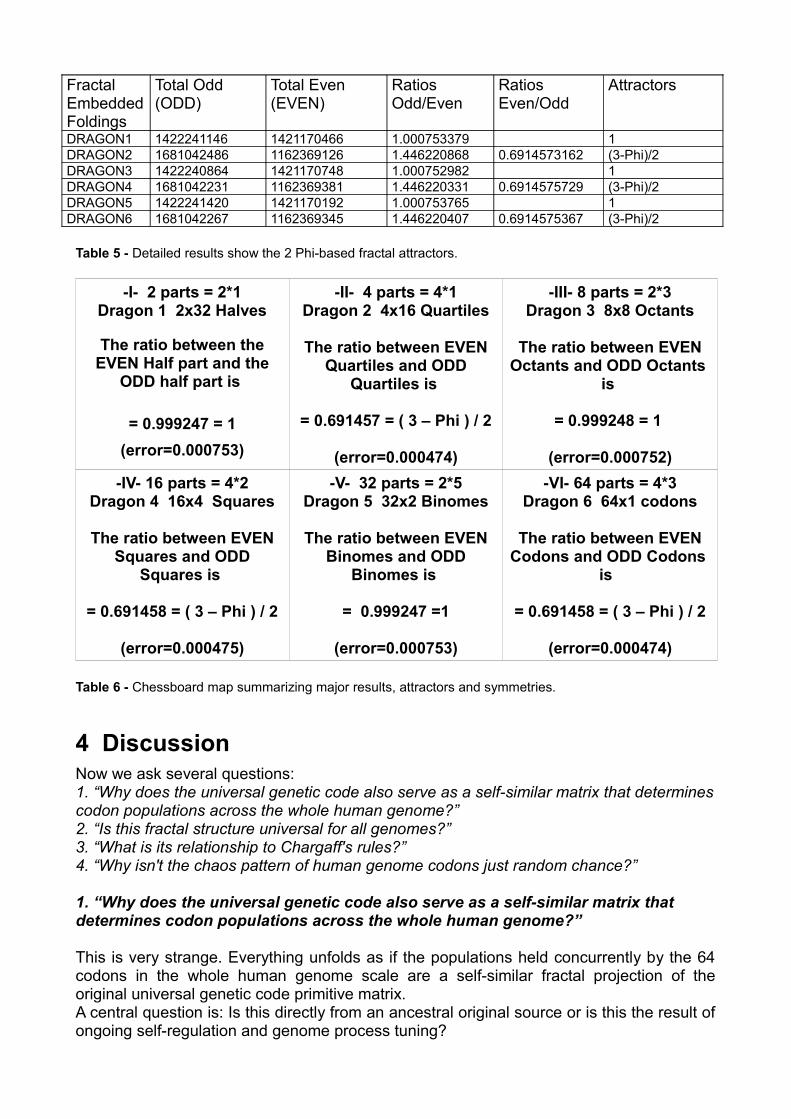
DRAGON1 1422241146 1421170466 1.000753379 1DRAGON2 1681042486 1162369126 1.446220868 0.6914573162 (3-Phi)/2DRAGON3 1422240864 1421170748 1.000752982 1DRAGON4 1681042231 1162369381 1.446220331 0.6914575729 (3-Phi)/2DRAGON5 1422241420 1421170192 1.000753765 1DRAGON6 1681042267 1162369345 1.446220407 0.6914575367 (3-Phi)/2
Table 5 - Detailed results show the 2 Phi-based fractal attractors.
-I- 2 parts = 2*1Dragon 1 2x32 Halves
The ratio between the EVEN Half part and the
ODD half part is
= 0.999247 = 1(error=0.000753)
-II- 4 parts = 4*1Dragon 2 4x16 Quartiles
The ratio between EVEN Quartiles and ODD
Quartiles is
= 0.691457 = ( 3 – Phi ) / 2
(error=0.000474)
-III- 8 parts = 2*3Dragon 3 8x8 Octants
The ratio between EVEN Octants and ODD Octants
is
= 0.999248 = 1
(error=0.000752)-IV- 16 parts = 4*2
Dragon 4 16x4 Squares
The ratio between EVEN Squares and ODD
Squares is
= 0.691458 = ( 3 – Phi ) / 2
(error=0.000475)
-V- 32 parts = 2*5Dragon 5 32x2 Binomes
The ratio between EVEN Binomes and ODD
Binomes is
= 0.999247 =1
(error=0.000753)
-VI- 64 parts = 4*3Dragon 6 64x1 codons
The ratio between EVEN Codons and ODD Codons
is
= 0.691458 = ( 3 – Phi ) / 2
(error=0.000474)
Table 6 - Chessboard map summarizing major results, attractors and symmetries.
4 DiscussionNow we ask several questions: 1. “Why does the universal genetic code also serve as a self-similar matrix that determines codon populations across the whole human genome?” 2. “Is this fractal structure universal for all genomes?” 3. “What is its relationship to Chargaff's rules?”4. “Why isn't the chaos pattern of human genome codons just random chance?”
1. “Why does the universal genetic code also serve as a self-similar matrix that determines codon populations across the whole human genome?”
This is very strange. Everything unfolds as if the populations held concurrently by the 64 codons in the whole human genome scale are a self-similar fractal projection of the original universal genetic code primitive matrix. A central question is: Is this directly from an ancestral original source or is this the result of ongoing self-regulation and genome process tuning?
We believe this serves as a checksum matrix which ensures that harmful mutations can be regulated and corrected. This is not unlike checksums in computer programs. Perry Marshall suggested to me that perhaps it goes further than that, supervising the structure of genome rearrangement and transpositions. Finally, the big question that remains is: “How did the human genome structure discover and select natural symmetries from Universal Genetic Code map to use as a checksum mechanism?” This question takes us to the very frontiers of science!
-2- “Is this fractal structure universal for all genomes?”
We analyzed whole genomes using the same method. From the analysis of about twenty various species like eukaryotes, viruses etc. (Perez, 2009, chapter 19), it appears that: If we sort the codon populations according to the genetic code table forming 8 clusters of 8 codons each, then: 3 parameters – involved in a cellular automata generation process - define codon populations within these genomes to a precision of 99%, and often 99.999%. These 3 parameters are: the number "1", and two other parameters which are always linked to the Golden ratio Phi. For the human and chimpanzee genomes, codon frequencies are 99.99% correlated. These 3 parameters are “1, 2 and Phi”. We remark that these 3 specific numbers establish a distance of ½ Phi separating both attractors, as discovered in this study.
-3- “What is the relationship to Chargaff's rules?”
This is probably the most interesting relationship we explore in this paper. Chargaff's two parity rules are:
− First Chargaff parity rule: in double-stranded DNA, %T=%A and %C=%G.− Second Chargaff parity rule (Rudner et al., 1968): in a single-stranded DNA, %T=
%A and %C=%G.
Are there links between our discovery of single-stranded whole human genome sequence codon populations and Chargaff's rules? One might be tempted to judge that our results are a trivial consequence of Chargaff's second rule. But in reality, these new results extend Chargaff's second rule from the simple TCAG nucleotide level to the codon triplet level as well.In 2006, Albrecht-Buehler suggests that Chargaff's second rule appears to be the consequence of a more complex parity rule (Albrecht-Buehler, 2006). Combining large quantities of data and checking for triplet oligonucleotides, Albrecht-Buehler has suggested that this possible extension of Chargaff's second rule to triplet oligonucleotides might be a consequence of genomic evolution, particularly transposon activity.
Computing Chargaff's second rule for the whole human genome nucleotide level.
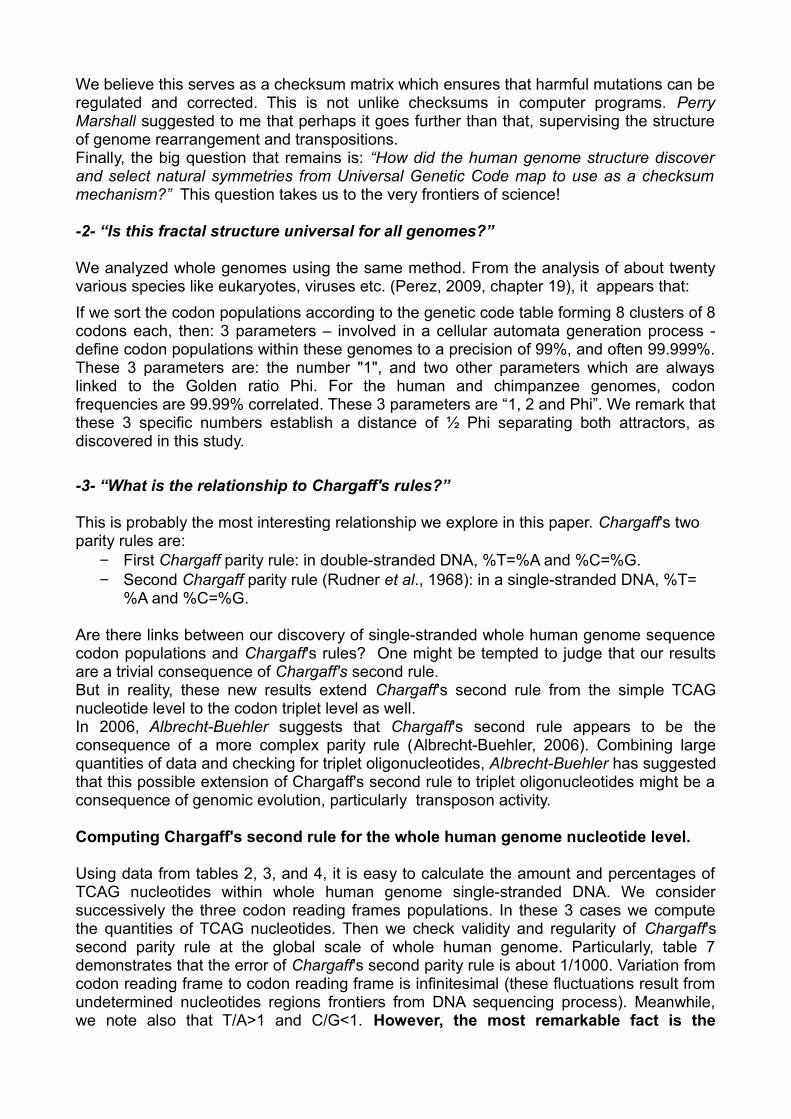
Using data from tables 2, 3, and 4, it is easy to calculate the amount and percentages of TCAG nucleotides within whole human genome single-stranded DNA. We consider successively the three codon reading frames populations. In these 3 cases we compute the quantities of TCAG nucleotides. Then we check validity and regularity of Chargaff's second parity rule at the global scale of whole human genome. Particularly, table 7 demonstrates that the error of Chargaff's second parity rule is about 1/1000. Variation from codon reading frame to codon reading frame is infinitesimal (these fluctuations result from undetermined nucleotides regions frontiers from DNA sequencing process). Meanwhile, we note also that T/A>1 and C/G<1. However, the most remarkable fact is the
presence of both attractors «(3-Phi)/2» and «1» at the global T C A G nucleotide scale, as computed from line 1 in Table 7. In effect, attractor «1» corresponds to Chargaff's second rule T=A and C=G which we have just demonstrated here. The second attractor «(3-Phi)/2» is seen when we compute ratios T/C=1.447808424, A/G=1.444633555 and (T+A)/(C+G)=1.446220557. When you compare these results with those of Table 5, they are extremely close to the ideal value 2 / (3-Phi) =1.447213595.
Verifying Chargaff's second rule within single stranded DNA whole human genome T C A G T/A C/G
1st frame 841214808 581026325 839827524 581342944 1.001651868 0.99945536622nd frame 841214825 581026348 839827527 581342943 1.001651884 0.99945540753rd frame 841214769 581026355 839827531 581342937 1.001651813 0.9994554299
Table 7 – checking for Chargaff's second parity rule at the whole human genome scale.
Towards a codon level generalization of Chargaff's second rule.
We can reorganize the 2D data codon populations of the Table 1 into a 3D array of 4x4x4 cells, according to the three TCAG codons positions.Then we can construct this cubic array for each of the 3 codon positions as follows:
Codon total populations T codons C codons A codons G codons3rd position 841214933 581026487 839827334 5813428582nd position 841214880 581026266 839827606 5813428601st position 841214589 581026275 839827642 581343106
Table 8 – A Chargaff-like second parity rule is verified at the “codon scale level” analyzing the total codon population of the 3 codon reading frames within the single-stranded whole human genome DNA sequence.
In the first left column, the first cell cumulates codons of type « xyT », the second cell cumulates codons of type « xTy » and the last cell cumulates codons of type « Txy » and so on. The same process applied to only one codon reading frame (i.e. data from Tables 2 or 3 or 4) produces similar results.Finally we can extend the scope of Chargaff's second rule from the single nucleotide TCAG level to the global level of codon triplets.
Now we suggest a new codon-level Chargaff second parity rule:In the whole human genome simple-stranded DNA sequence, Chargaff's second rule can be extended to all triplets codons as follows:
− Codon populations where first base position is T are identical to codon populations where first base position is A, therefore: « codons Twx = codons Ayz ».
− Codon populations where first base position is C are identical to codon populations where first base position is G, therefore: « codons Cwx = codons Gyz ».
− Codon populations where 2nd base position is T are identical to codon populations where second base position is A, therefore: « codons wTx = codons yAz ».
− Codon populations where 2nd base position is C are identical to codon populations where second base position is G, therefore: « codons wCx = codons yGz ».
− Codon populations where third base position is T are identical to codon populations where third base position is A, therefore: « codons wxT = chdons yzA ».
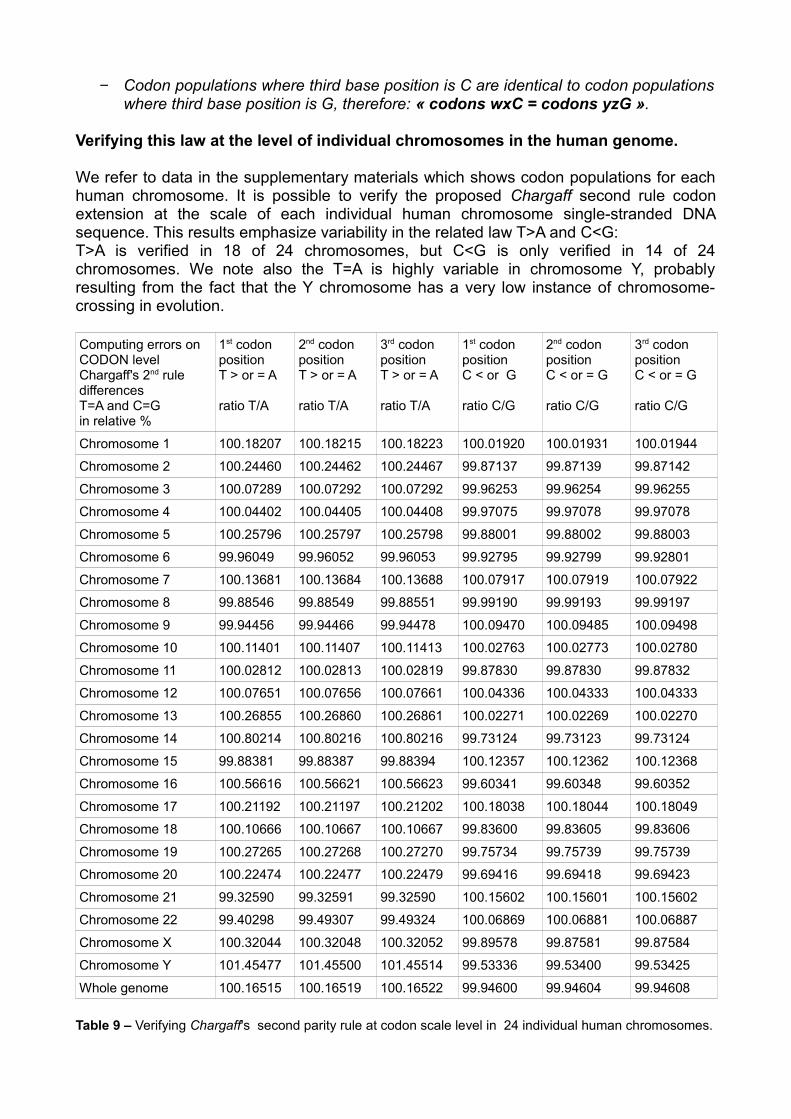
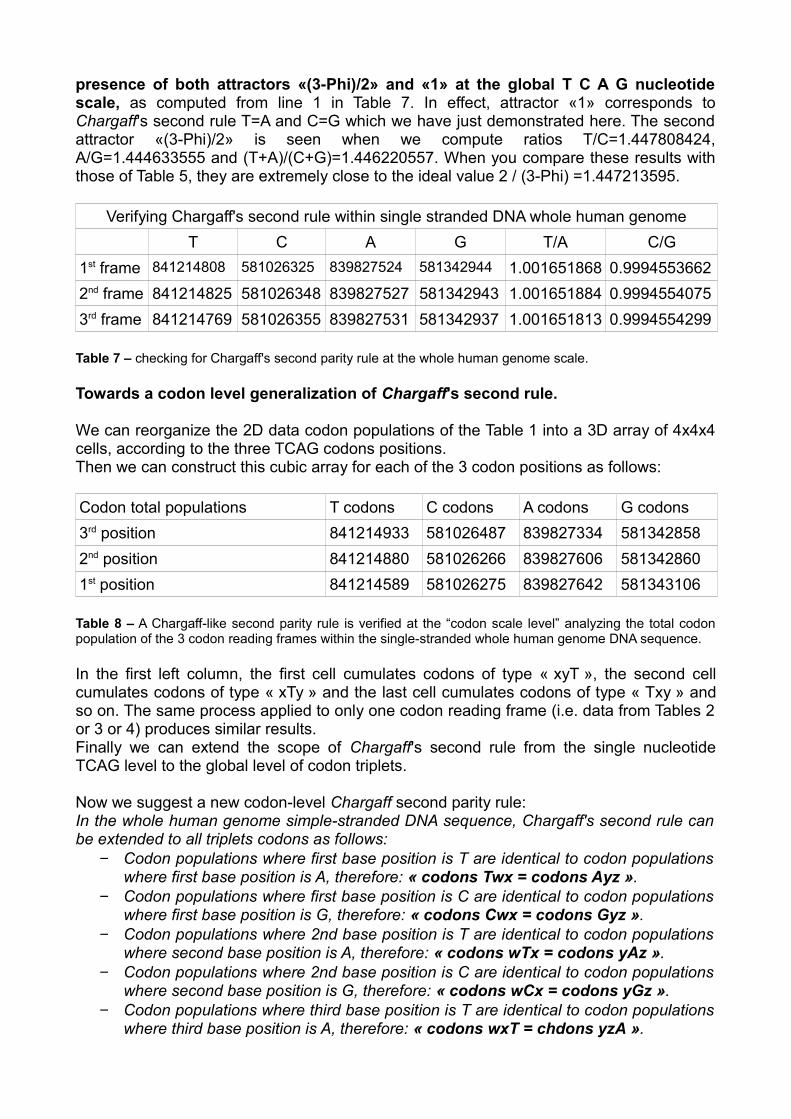
− Codon populations where third base position is C are identical to codon populations where third base position is G, therefore: « codons wxC = codons yzG ».
Verifying this law at the level of individual chromosomes in the human genome.
We refer to data in the supplementary materials which shows codon populations for each human chromosome. It is possible to verify the proposed Chargaff second rule codon extension at the scale of each individual human chromosome single-stranded DNA sequence. This results emphasize variability in the related law T>A and C<G: T>A is verified in 18 of 24 chromosomes, but C<G is only verified in 14 of 24 chromosomes. We note also the T=A is highly variable in chromosome Y, probably resulting from the fact that the Y chromosome has a very low instance of chromosome-crossing in evolution.
Computing errors on CODON level Chargaff's 2nd rule differences T=A and C=Gin relative %
1st codon positionT > or = A
ratio T/A
2nd codon positionT > or = A
ratio T/A
3rd codon positionT > or = A
ratio T/A
1st codon positionC < or G
ratio C/G
2nd codon positionC < or = G
ratio C/G
3rd codon positionC < or = G
ratio C/G
Chromosome 1 100.18207 100.18215 100.18223 100.01920 100.01931 100.01944
Chromosome 2 100.24460 100.24462 100.24467 99.87137 99.87139 99.87142
Chromosome 3 100.07289 100.07292 100.07292 99.96253 99.96254 99.96255
Chromosome 4 100.04402 100.04405 100.04408 99.97075 99.97078 99.97078
Chromosome 5 100.25796 100.25797 100.25798 99.88001 99.88002 99.88003
Chromosome 6 99.96049 99.96052 99.96053 99.92795 99.92799 99.92801
Chromosome 7 100.13681 100.13684 100.13688 100.07917 100.07919 100.07922
Chromosome 8 99.88546 99.88549 99.88551 99.99190 99.99193 99.99197
Chromosome 9 99.94456 99.94466 99.94478 100.09470 100.09485 100.09498
Chromosome 10 100.11401 100.11407 100.11413 100.02763 100.02773 100.02780
Chromosome 11 100.02812 100.02813 100.02819 99.87830 99.87830 99.87832
Chromosome 12 100.07651 100.07656 100.07661 100.04336 100.04333 100.04333
Chromosome 13 100.26855 100.26860 100.26861 100.02271 100.02269 100.02270
Chromosome 14 100.80214 100.80216 100.80216 99.73124 99.73123 99.73124
Chromosome 15 99.88381 99.88387 99.88394 100.12357 100.12362 100.12368
Chromosome 16 100.56616 100.56621 100.56623 99.60341 99.60348 99.60352
Chromosome 17 100.21192 100.21197 100.21202 100.18038 100.18044 100.18049
Chromosome 18 100.10666 100.10667 100.10667 99.83600 99.83605 99.83606
Chromosome 19 100.27265 100.27268 100.27270 99.75734 99.75739 99.75739
Chromosome 20 100.22474 100.22477 100.22479 99.69416 99.69418 99.69423
Chromosome 21 99.32590 99.32591 99.32590 100.15602 100.15601 100.15602
Chromosome 22 99.40298 99.49307 99.49324 100.06869 100.06881 100.06887
Chromosome X 100.32044 100.32048 100.32052 99.89578 99.87581 99.87584
Chromosome Y 101.45477 101.45500 101.45514 99.53336 99.53400 99.53425
Whole genome 100.16515 100.16519 100.16522 99.94600 99.94604 99.94608
Table 9 – Verifying Chargaff's second parity rule at codon scale level in 24 individual human chromosomes.
Beyond Chargaff's second rule: Do other kinds of symmetries exist?
Analysing the “Codon Frequency Ratio” (CFR) in the Table 1 (at the top of the paper), we note strange pairs of correlations: [TTT (2.4667) AAA ( 2.4566)], [TCT (1.4172) AGA (1.4144)], [CCC (0.8393) GGG (0.8403)], etc.Here we classify populations of codons according to the universal genetic code table. Meanwhile, other kinds of classifications are possible. The simplest comes by sorting the 64 codon populations from most frequent to least frequent. (arranging in decreasing order of codon population frequencies).
Several chapters of the book Codex Biogenesis are dedicated to this topic (Perez, 2009). They elaborate on the discovery that for instance across the 32 codon populations, the most frequent is exactly 2X as numerous as the least frequent of the 32 codons. The exact ratio was 1.995859355. They also prove that total atomic weights of each of the 2 simple DNA strands exhibit the same perfect symmetry: For the whole human genome, the balance ratio between both DNA strands is exactly = 1.000000456. Also, we noticed that this equilibrium has increased as the whole human genome sequence has grown in precision (successive releases of the draft human genomes sequences of April 2001, November 2002 and finally August 2003). All these studies come from a "mosaic" human genome, a hybrid fusion of the genomes of numerous individuals. It is very likely that the specific genome from any individual would show even greater precision. We also believe that telomeres and centromeres regions within chromosomes, which cannot be technologically sequenced, further contribute to optimize this already perfect balance.
Various other complementary symmetries and codon/nucleotide ratios are reported in the book Codex Biogenesis (Perez, 2009), demonstrating the evidence of other embedded levels of symmetry.
What kinds of symmetries?
Sorting codons in decreasing population frequency makes the phenomenon obvious: codons are ordered in pairs of similar frequency. The curve of figure d below shows this clearly.What are the labels of these codon pairs? Why do they behave this way?In Table 10, we sort codons by diminishing populations. The first line includes the first 2 codons of the 64. To the left the classified codon is first (TTT) and to the right the classified codon is second (AAA). Their respective populations are very close and their CFRs (Codon Frequency Ratios) are almost identical. Finally, note that these 2 codons are complementary (AAA is the complementary codon of TTT using Crick and Watson's base pairing law). Within this codon pairing scheme, we also see that the first 16 pairs (exactly half of the 64 codon labels) are very frequent (CFR > 1), while the 16 remaining pairs are least frequent (CFR < 1).
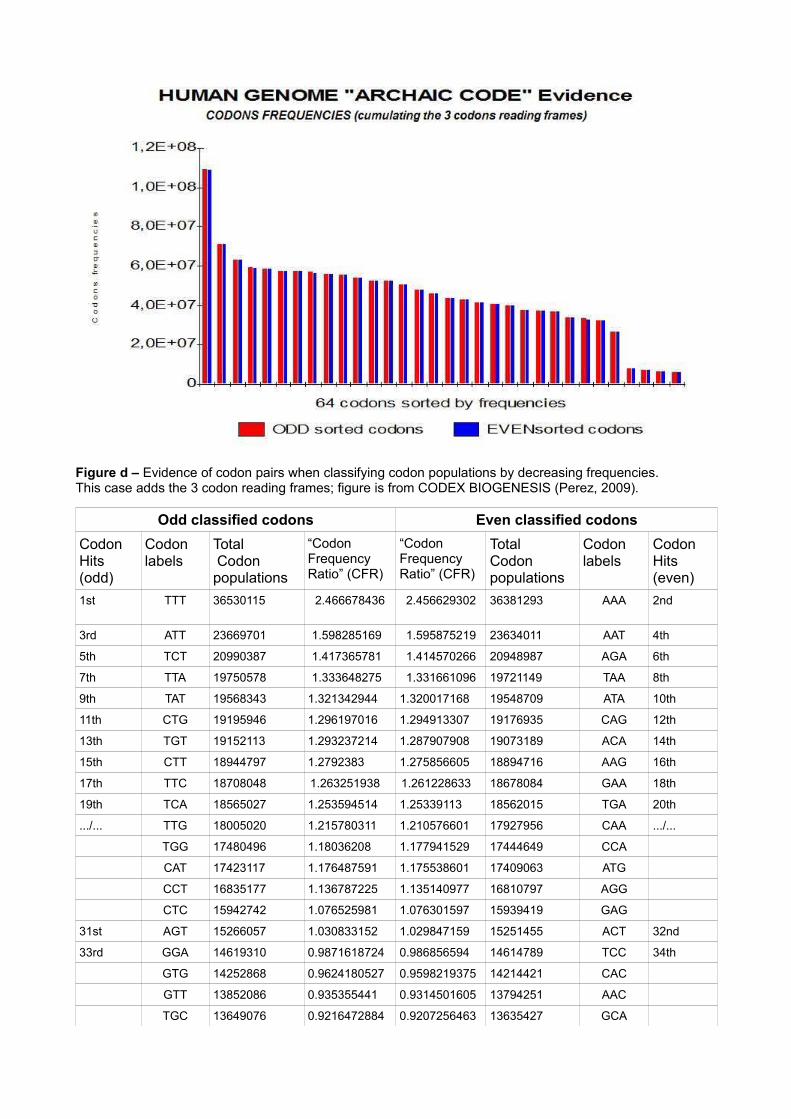
Figure d – Evidence of codon pairs when classifying codon populations by decreasing frequencies.This case adds the 3 codon reading frames; figure is from CODEX BIOGENESIS (Perez, 2009).
Odd classified codons Even classified codonsCodon Hits (odd)
Codonlabels
Total Codonpopulations
“CodonFrequency Ratio” (CFR)
“Codon Frequency Ratio” (CFR)
TotalCodonpopulations
Codonlabels
CodonHits (even)
1st TTT 36530115 2.466678436 2.456629302 36381293 AAA 2nd
3rd ATT 23669701 1.598285169 1.595875219 23634011 AAT 4th
5th TCT 20990387 1.417365781 1.414570266 20948987 AGA 6th
7th TTA 19750578 1.333648275 1.331661096 19721149 TAA 8th
9th TAT 19568343 1.321342944 1.320017168 19548709 ATA 10th
11th CTG 19195946 1.296197016 1.294913307 19176935 CAG 12th
13th TGT 19152113 1.293237214 1.287907908 19073189 ACA 14th
15th CTT 18944797 1.2792383 1.275856605 18894716 AAG 16th
17th TTC 18708048 1.263251938 1.261228633 18678084 GAA 18th
19th TCA 18565027 1.253594514 1.25339113 18562015 TGA 20th
.../... TTG 18005020 1.215780311 1.210576601 17927956 CAA .../...
TGG 17480496 1.18036208 1.177941529 17444649 CCA
CAT 17423117 1.176487591 1.175538601 17409063 ATG
CCT 16835177 1.136787225 1.135140977 16810797 AGG
CTC 15942742 1.076525981 1.076301597 15939419 GAG
31st AGT 15266057 1.030833152 1.029847159 15251455 ACT 32nd
33rd GGA 14619310 0.9871618724 0.986856594 14614789 TCC 34th
GTG 14252868 0.9624180527 0.9598219375 14214421 CAC
GTT 13852086 0.935355441 0.9314501605 13794251 AAC
TGC 13649076 0.9216472884 0.9207256463 13635427 GCA
GCT 13252828 0.8948908329 0.8942085652 13242724 AGC
GAT 12658530 0.8547611465 0.8542053522 12650299 ATC
GGG 12446600 0.8404506752 0.8392612984 12428986 CCC
TAG 12240281 0.826519084 0.8249693963 12217331 CTA
GCC 11268094 0.7608726247 0.7601995403 11258126 GGC
GGT 11026602 0.7445659936 0.743263108 11007307 ACC
.../... GTA 10766854 0.7270266349 0.7262671867 10755607 TAC .../...
55th GTC 8955434 0.6047113712 0.6035903966 8938833 GAC 56th
57th CCG 2606672 0.1760142724 0.1758509306 2604253 CGG 58th
59th CGT 2379612 0.1606821551 0.1601840268 2372235 ACG 60th
61st GCG 2247440 0.1517573044 0.1515541907 2244432 CGC 62nd
63rd TCG 2087242 0.1409400116 0.1408038822 2085226 CGA 64th
Total Odd
474337193 473466674 Total Even
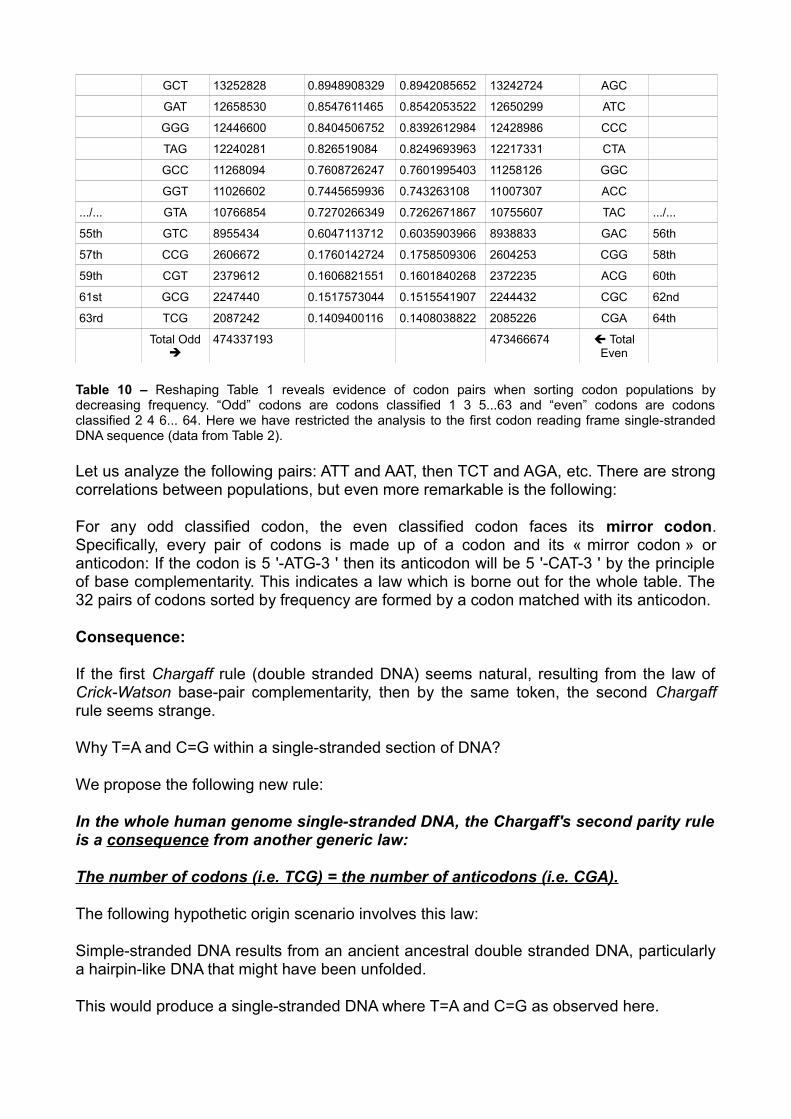
Table 10 – Reshaping Table 1 reveals evidence of codon pairs when sorting codon populations by decreasing frequency. “Odd” codons are codons classified 1 3 5...63 and “even” codons are codons classified 2 4 6... 64. Here we have restricted the analysis to the first codon reading frame single-stranded DNA sequence (data from Table 2).
Let us analyze the following pairs: ATT and AAT, then TCT and AGA, etc. There are strong correlations between populations, but even more remarkable is the following:
For any odd classified codon, the even classified codon faces its mirror codon. Specifically, every pair of codons is made up of a codon and its « mirror codon » or anticodon: If the codon is 5 '-ATG-3 ' then its anticodon will be 5 '-CAT-3 ' by the principle of base complementarity. This indicates a law which is borne out for the whole table. The 32 pairs of codons sorted by frequency are formed by a codon matched with its anticodon.
Consequence:
If the first Chargaff rule (double stranded DNA) seems natural, resulting from the law of Crick-Watson base-pair complementarity, then by the same token, the second Chargaff rule seems strange.
Why T=A and C=G within a single-stranded section of DNA?
We propose the following new rule:
In the whole human genome single-stranded DNA, the Chargaff's second parity rule is a consequence from another generic law:
The number of codons (i.e. TCG) = the number of anticodons (i.e. CGA).
The following hypothetic origin scenario involves this law:
Simple-stranded DNA results from an ancient ancestral double stranded DNA, particularly a hairpin-like DNA that might have been unfolded.
This would produce a single-stranded DNA where T=A and C=G as observed here.
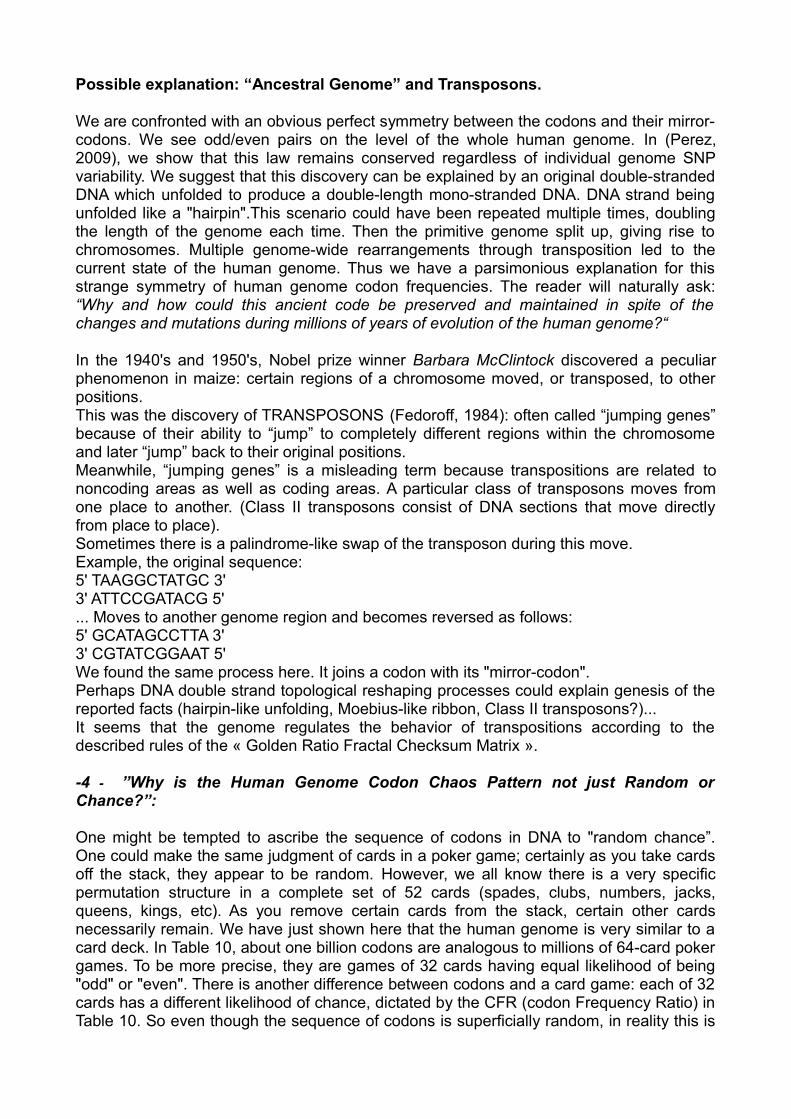
Possible explanation: “Ancestral Genome” and Transposons.
We are confronted with an obvious perfect symmetry between the codons and their mirror-codons. We see odd/even pairs on the level of the whole human genome. In (Perez, 2009), we show that this law remains conserved regardless of individual genome SNP variability. We suggest that this discovery can be explained by an original double-stranded DNA which unfolded to produce a double-length mono-stranded DNA. DNA strand being unfolded like a "hairpin".This scenario could have been repeated multiple times, doubling the length of the genome each time. Then the primitive genome split up, giving rise to chromosomes. Multiple genome-wide rearrangements through transposition led to the current state of the human genome. Thus we have a parsimonious explanation for this strange symmetry of human genome codon frequencies. The reader will naturally ask: “Why and how could this ancient code be preserved and maintained in spite of the changes and mutations during millions of years of evolution of the human genome?“
In the 1940's and 1950's, Nobel prize winner Barbara McClintock discovered a peculiar phenomenon in maize: certain regions of a chromosome moved, or transposed, to other positions. This was the discovery of TRANSPOSONS (Fedoroff, 1984): often called “jumping genes” because of their ability to “jump” to completely different regions within the chromosome and later “jump” back to their original positions. Meanwhile, “jumping genes” is a misleading term because transpositions are related to noncoding areas as well as coding areas. A particular class of transposons moves from one place to another. (Class II transposons consist of DNA sections that move directly from place to place). Sometimes there is a palindrome-like swap of the transposon during this move. Example, the original sequence:5' TAAGGCTATGC 3'3' ATTCCGATACG 5'... Moves to another genome region and becomes reversed as follows:5' GCATAGCCTTA 3'3' CGTATCGGAAT 5'We found the same process here. It joins a codon with its "mirror-codon". Perhaps DNA double strand topological reshaping processes could explain genesis of the reported facts (hairpin-like unfolding, Moebius-like ribbon, Class II transposons?)...It seems that the genome regulates the behavior of transpositions according to the described rules of the « Golden Ratio Fractal Checksum Matrix ».
-4 - ”Why is the Human Genome Codon Chaos Pattern not just Random or Chance?”:
One might be tempted to ascribe the sequence of codons in DNA to "random chance”. One could make the same judgment of cards in a poker game; certainly as you take cards off the stack, they appear to be random. However, we all know there is a very specific permutation structure in a complete set of 52 cards (spades, clubs, numbers, jacks, queens, kings, etc). As you remove certain cards from the stack, certain other cards necessarily remain. We have just shown here that the human genome is very similar to a card deck. In Table 10, about one billion codons are analogous to millions of 64-card poker games. To be more precise, they are games of 32 cards having equal likelihood of being "odd" or "even". There is another difference between codons and a card game: each of 32 cards has a different likelihood of chance, dictated by the CFR (codon Frequency Ratio) in Table 10. So even though the sequence of codons is superficially random, in reality this is
not so. Rather, just as in a card game, the total composition of codon population obeys this explicit checksum structure, a «hidden order». There is a very definite «order within the chaos».
5 SpeculationsTwo questions remain unanswered:
Is the human genome sequence really fractal?
And why does it use the Golden Ratio in particular, since an infinite number of schemes are theoretically possible?
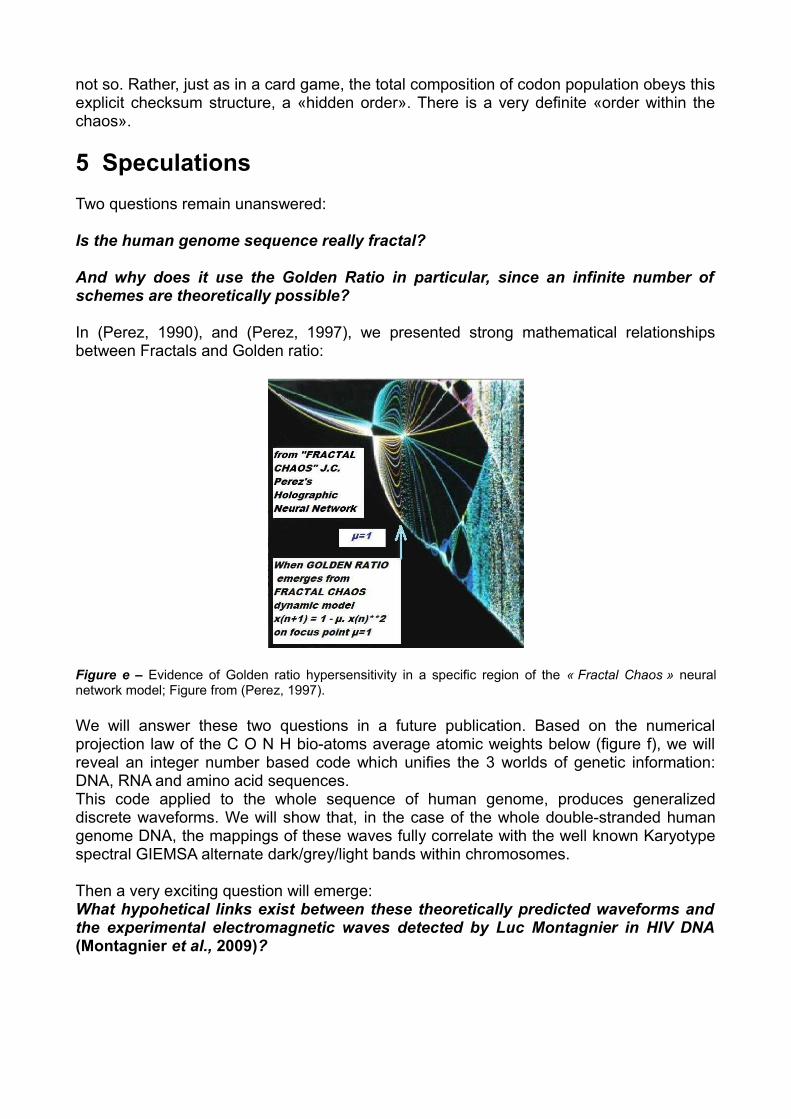
In (Perez, 1990), and (Perez, 1997), we presented strong mathematical relationships between Fractals and Golden ratio:
Figure e – Evidence of Golden ratio hypersensitivity in a specific region of the « Fractal Chaos » neural network model; Figure from (Perez, 1997).
We will answer these two questions in a future publication. Based on the numerical projection law of the C O N H bio-atoms average atomic weights below (figure f), we will reveal an integer number based code which unifies the 3 worlds of genetic information: DNA, RNA and amino acid sequences.This code applied to the whole sequence of human genome, produces generalized discrete waveforms. We will show that, in the case of the whole double-stranded human genome DNA, the mappings of these waves fully correlate with the well known Karyotype spectral GIEMSA alternate dark/grey/light bands within chromosomes.
Then a very exciting question will emerge: What hypohetical links exist between these theoretically predicted waveforms and the experimental electromagnetic waves detected by Luc Montagnier in HIV DNA (Montagnier et al., 2009)?
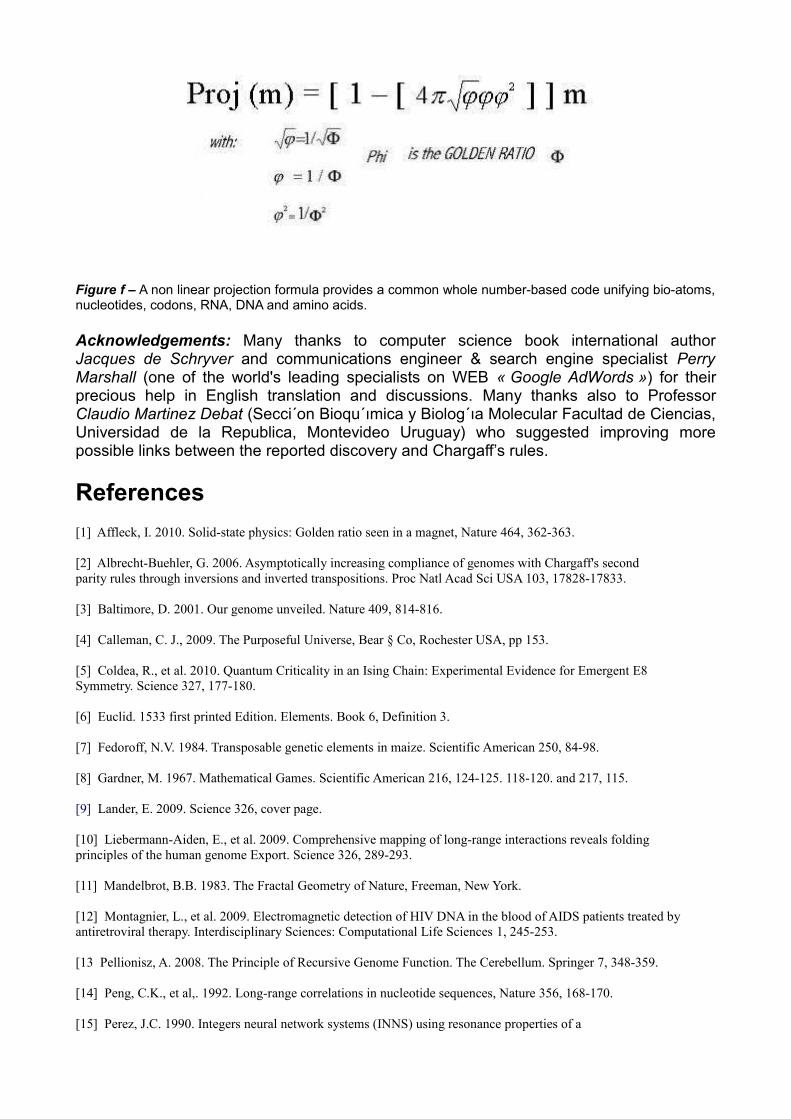
Figure f – A non linear projection formula provides a common whole number-based code unifying bio-atoms, nucleotides, codons, RNA, DNA and amino acids.
Acknowledgements: Many thanks to computer science book international author Jacques de Schryver and communications engineer & search engine specialist Perry Marshall (one of the world's leading specialists on WEB « Google AdWords ») for their precious help in English translation and discussions. Many thanks also to Professor Claudio Martinez Debat (Secci´on Bioqu´ımica y Biolog´ıa Molecular Facultad de Ciencias, Universidad de la Republica, Montevideo Uruguay) who suggested improving more possible links between the reported discovery and Chargaff’s rules.
References[1] Affleck, I. 2010. Solid-state physics: Golden ratio seen in a magnet, Nature 464, 362-363.
[2] Albrecht-Buehler, G. 2006. Asymptotically increasing compliance of genomes with Chargaff's secondparity rules through inversions and inverted transpositions. Proc Natl Acad Sci USA 103, 17828-17833.
[3] Baltimore, D. 2001. Our genome unveiled. Nature 409, 814-816.
[4] Calleman, C. J., 2009. The Purposeful Universe, Bear § Co, Rochester USA, pp 153.
[5] Coldea, R., et al. 2010. Quantum Criticality in an Ising Chain: Experimental Evidence for Emergent E8Symmetry. Science 327, 177-180.
[6] Euclid. 1533 first printed Edition. Elements. Book 6, Definition 3.
[7] Fedoroff, N.V. 1984. Transposable genetic elements in maize. Scientific American 250, 84-98.
[8] Gardner, M. 1967. Mathematical Games. Scientific American 216, 124-125. 118-120. and 217, 115.
[9] Lander, E. 2009. Science 326, cover page.
[10] Liebermann-Aiden, E., et al. 2009. Comprehensive mapping of long-range interactions reveals foldingprinciples of the human genome Export. Science 326, 289-293.
[11] Mandelbrot, B.B. 1983. The Fractal Geometry of Nature, Freeman, New York.
[12] Montagnier, L., et al. 2009. Electromagnetic detection of HIV DNA in the blood of AIDS patients treated byantiretroviral therapy. Interdisciplinary Sciences: Computational Life Sciences 1, 245-253.
[13 Pellionisz, A. 2008. The Principle of Recursive Genome Function. The Cerebellum. Springer 7, 348-359.
[14] Peng, C.K., et al,. 1992. Long-range correlations in nucleotide sequences, Nature 356, 168-170.
[15] Perez, J.C. 1990. Integers neural network systems (INNS) using resonance properties of a
Fibonacci's chaotic golden neuron. Neural Networks 1, 859-865.
[16] Perez, J.C. 1991. Chaos, DNA, and Neuro-computers: a golden link: the hidden language of genes,global language and order in the human genome. Speculations in Science and Technology 14, 336-346.
[17] Perez, J.C. 1994. Method for the functional optimization of high temperature superconductors bycontrolling the morphological proportions of their thin layers. (PCT/FR93/00782). International Européen PCT(Patent Cooperation Treaty) number WO94/03932.
[18] Perez, J.C. 1997. L'ADN décrypté, Resurgence, Liège Belgium.
[19] Perez, J.C. 2009. Codex Biogenesis, Resurgence, Liège Belgium.
[20] Rudner, R., Karkas, J.D., Chargaff, E. 1968. Separation of B. subtilis DNA into complementary strands. III.Direct Analysis. Proc Natl Acad Sci USA 60, 931-922.
[21] Yamagishi, M.E.B., Shimabukuro, A.I. 2008. Nucleotides frequencies in human genome andFibonacci numbers. Bulletin of Mathematical Biology 70, 643-653.