
COATING OF La1-xSrxCo1-yFeyO3-δ FILMS ON ZIRCONIA...
69
COATING OF La 1-x Sr x Co 1-y Fe y O 3-δ FILMS ON ZIRCONIA AND CGO (CERIUM GADOLINIUM OXIDE) BY ELECTROSTATIC SPRAY DEPOSITION (ESD) A Thesis Submitted to the Graduate School of Engineering and Sciences of İzmir Institute of Technology in Partial Fulfillment of the Requirements for the Degree of MASTER OF SCIENCE in Materials Science and Engineering by Hande BÜYÜKKEBABÇI December 2010 İZMİR
Transcript of COATING OF La1-xSrxCo1-yFeyO3-δ FILMS ON ZIRCONIA...
COATING OF La1-xSrxCo1-yFeyO3-δ FILMS ON
ZIRCONIA AND CGO (CERIUM GADOLINIUM
OXIDE) BY ELECTROSTATIC SPRAY
DEPOSITION (ESD)
A Thesis Submitted to the Graduate School of Engineering and Sciences of
İzmir Institute of Technology in Partial Fulfillment of the Requirements for the Degree of
MASTER OF SCIENCE
in Materials Science and Engineering
by Hande BÜYÜKKEBABÇI
December 2010 İZMİR
ii
We approve the thesis of Hande BÜYÜKKEBABÇI __________________________ Prof. Dr. Sedat AKKURT Supervisor ______________________ Prof. Dr. Muhsin ÇİFTÇİOĞLU Committee Member __________________________ Prof. Dr. Mustafa GÜDEN Committee Member 22 December 2010 __________________________ __________________________ Assoc. Prof. Dr. Mustafa M. DEMİR Prof. Dr. Sedat AKKURT Head of the Department of Dean of the Graduate School of Materials Science and Engineering Engineering and Sciences

iii
ACKNOWLEDGEMENTS
I would like to express the Materials Science and Engineering Department at
Izmir Institute of Technology for accepting me into their program and giving me the
opportunity to attain an M.S degree in this field. I would like to thank my gratitude to
my advisor Prof. Dr. Sedat Akkurt for his supervision, support and help during my
studies.
I would like to thank to Daniel Marinha, Said Obbade, Elisabeth Djurado and the
technical staff in LEPMI Laboratory in Grenoble, France for their help, patience and
friendship during the laboratory works.
My special thanks go to my family for their support, tolerance and
understanding.
iv
ABSTRACT
COATING OF La1-x SrxCo1-yFeyO3-δ FILMS ON ZIRCONIA AND CGO (CERIUM GADOLINIUM OXIDE) BY ELECTROSTATIC SPRAY
DEPOSITION (ESD)
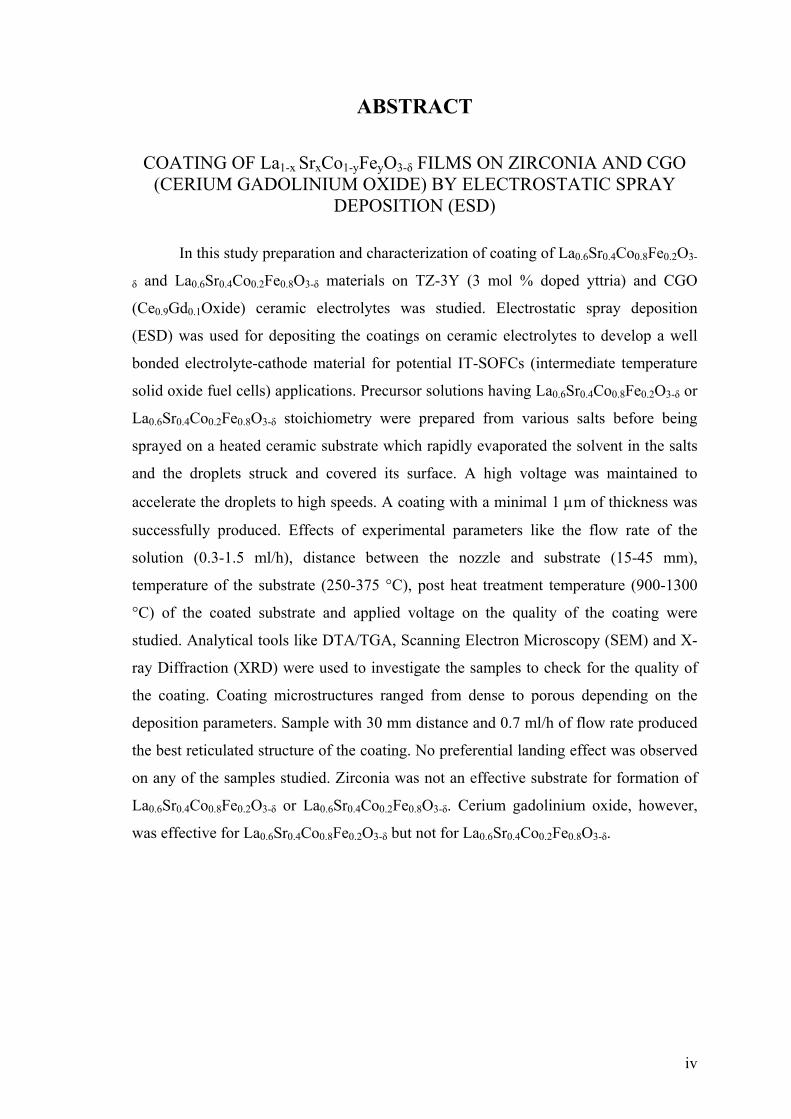
In this study preparation and characterization of coating of La0.6Sr0.4Co0.8Fe0.2O3-
δ and La0.6Sr0.4Co0.2Fe0.8O3-δ materials on TZ-3Y (3 mol % doped yttria) and CGO
(Ce0.9Gd0.1Oxide) ceramic electrolytes was studied. Electrostatic spray deposition
(ESD) was used for depositing the coatings on ceramic electrolytes to develop a well
bonded electrolyte-cathode material for potential IT-SOFCs (intermediate temperature
solid oxide fuel cells) applications. Precursor solutions having La0.6Sr0.4Co0.8Fe0.2O3-δ or
La0.6Sr0.4Co0.2Fe0.8O3-δ stoichiometry were prepared from various salts before being
sprayed on a heated ceramic substrate which rapidly evaporated the solvent in the salts
and the droplets struck and covered its surface. A high voltage was maintained to
accelerate the droplets to high speeds. A coating with a minimal 1 µm of thickness was
successfully produced. Effects of experimental parameters like the flow rate of the
solution (0.3-1.5 ml/h), distance between the nozzle and substrate (15-45 mm),
temperature of the substrate (250-375 °C), post heat treatment temperature (900-1300
°C) of the coated substrate and applied voltage on the quality of the coating were
studied. Analytical tools like DTA/TGA, Scanning Electron Microscopy (SEM) and X-
ray Diffraction (XRD) were used to investigate the samples to check for the quality of
the coating. Coating microstructures ranged from dense to porous depending on the
deposition parameters. Sample with 30 mm distance and 0.7 ml/h of flow rate produced
the best reticulated structure of the coating. No preferential landing effect was observed
on any of the samples studied. Zirconia was not an effective substrate for formation of
La0.6Sr0.4Co0.8Fe0.2O3-δ or La0.6Sr0.4Co0.2Fe0.8O3-δ. Cerium gadolinium oxide, however,
was effective for La0.6Sr0.4Co0.8Fe0.2O3-δ but not for La0.6Sr0.4Co0.2Fe0.8O3-δ.
v
ÖZET
ELEKTROSTATİK SPREY KAPLAMA (ESD) METODU İLE ZİRKONYA VE CGO (SERYUM GADOLİNYUM OKSİT) ÜZERİNE
La1-x SrxCo1-yFeyO3-δ FİLMLERİNİN KAPLANMASI
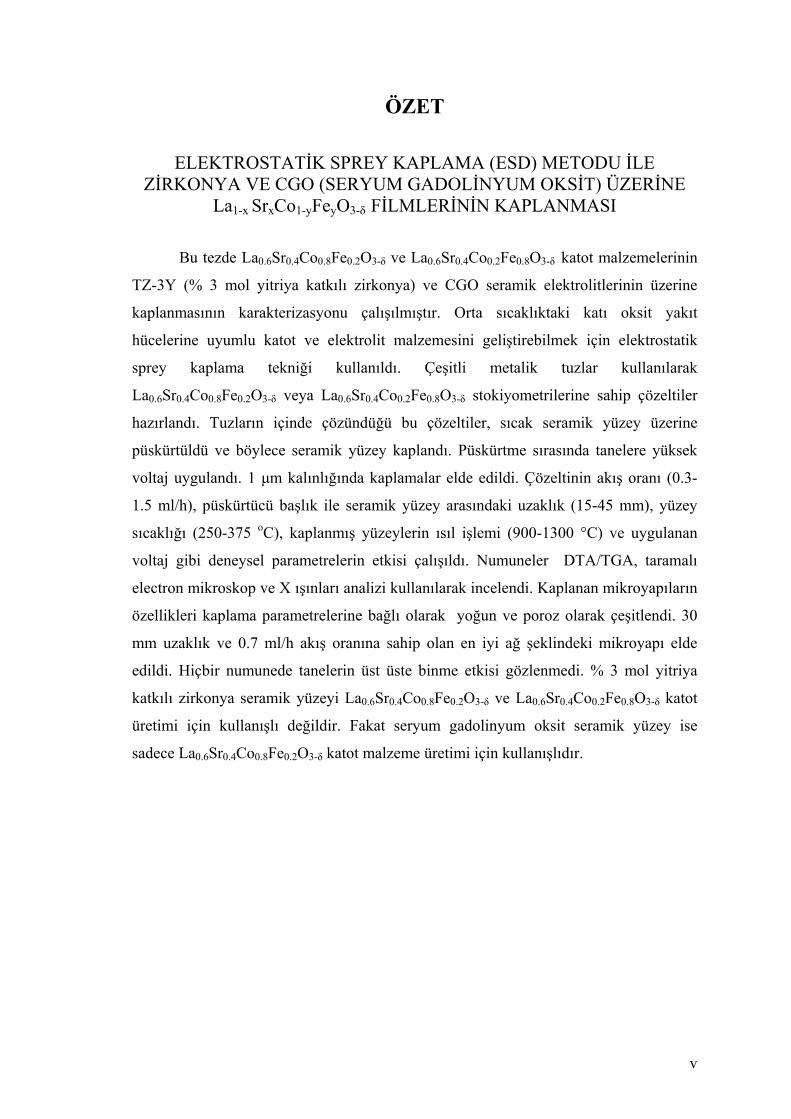
Bu tezde La0.6Sr0.4Co0.8Fe0.2O3-δ ve La0.6Sr0.4Co0.2Fe0.8O3-δ katot malzemelerinin
TZ-3Y (% 3 mol yitriya katkılı zirkonya) ve CGO seramik elektrolitlerinin üzerine
kaplanmasının karakterizasyonu çalışılmıştır. Orta sıcaklıktaki katı oksit yakıt
hücelerine uyumlu katot ve elektrolit malzemesini geliştirebilmek için elektrostatik
sprey kaplama tekniği kullanıldı. Çeşitli metalik tuzlar kullanılarak
La0.6Sr0.4Co0.8Fe0.2O3-δ veya La0.6Sr0.4Co0.2Fe0.8O3-δ stokiyometrilerine sahip çözeltiler
hazırlandı. Tuzların içinde çözündüğü bu çözeltiler, sıcak seramik yüzey üzerine
püskürtüldü ve böylece seramik yüzey kaplandı. Püskürtme sırasında tanelere yüksek
voltaj uygulandı. 1 µm kalınlığında kaplamalar elde edildi. Çözeltinin akış oranı (0.3-
1.5 ml/h), püskürtücü başlık ile seramik yüzey arasındaki uzaklık (15-45 mm), yüzey
sıcaklığı (250-375 oC), kaplanmış yüzeylerin ısıl işlemi (900-1300 °C) ve uygulanan
voltaj gibi deneysel parametrelerin etkisi çalışıldı. Numuneler DTA/TGA, taramalı
electron mikroskop ve X ışınları analizi kullanılarak incelendi. Kaplanan mikroyapıların
özellikleri kaplama parametrelerine bağlı olarak yoğun ve poroz olarak çeşitlendi. 30
mm uzaklık ve 0.7 ml/h akış oranına sahip olan en iyi ağ şeklindeki mikroyapı elde
edildi. Hiçbir numunede tanelerin üst üste binme etkisi gözlenmedi. % 3 mol yitriya
katkılı zirkonya seramik yüzeyi La0.6Sr0.4Co0.8Fe0.2O3-δ ve La0.6Sr0.4Co0.2Fe0.8O3-δ katot
üretimi için kullanışlı değildir. Fakat seryum gadolinyum oksit seramik yüzey ise
sadece La0.6Sr0.4Co0.8Fe0.2O3-δ katot malzeme üretimi için kullanışlıdır.
vi
TABLE OF CONTENTS
LIST OF FIGURES ..................................................................................................... . viii
LIST OF TABLES.......................................................................................................... xi
CHAPTER 1. INTRODUCTION .................................................................................... 1
CHAPTER 2. LITERATURE SEARCH.......................................................................... 3
2.1. Fuel Cells .............................................................................................. 3
2.1.1. Fuel Cell Types ............................................................................... 4
2.1.1.1. Solid Oxide Fuel Cells (SOFCs) ............................................ 5
2.1.1.1.1. Electrolytes ................................................................ 8
2.1.1.1.2. Cathodes ..................................................................... 9
2.1.1.1.3. Anodes ....................................................................... 9
2.1.1.1.4. SOFC Materials ....................................................... 10
2.2. Electrostatic Spray Deposition ............................................................. 10
2.2.1. Spray Formation ............................................................................. 13
2.2.2. Droplet Transport, Evaporation and Disruption ............................. 13
2.2.3. Preferential Landing of Droplets .................................................... 13
2.2.4. Droplet Spreading and Drying ....................................................... 14
2.2.5. Surface Diffusion, Reaction ........................................................... 14
2.2.6. The Morphology Parameters .......................................................... 14
2.2.6.1. Deposition Temperature ....................................................... 14
2.2.6.2. Nozzle to Substrate Distance ................................................ 15
2.2.6.3. Precursor Solution Flow Rate ............................................... 15
2.2.6.4. Precursors and Solvents ....................................................... 15
CHAPTER 3. EXPERIMENTAL .................................................................................. 17
3.1. Powder Properties ............................................................................... 17
3.1.1. Powder Used in Preparation of Substrate ........................................ 17
3.1.2. Precursor Solutions for Coating of Cathode ................................... 19
3.2. Method .................................................................................................. 19
vii
3.2.1. Preparation of the Substrate ............................................................ 19
3.2.2. Preparation of Precursor Solutions for Cathode .............................. 19
3.2.3. Experimental Setup ......................................................................... 21
3.2.4. Experimental Plan ........................................................................... 23
3.3. Characterization .................................................................................... 23
3.3.1. Electrical Conductivity .................................................................... 24
3.3.2. Differential Thermal Analysis ......................................................... 24
3.3.3. Scanning Electron Microscopy ....................................................... 24
3.3.4. X-ray Diffraction Analysis .............................................................. 24
CHAPTER 4. RESULTS AND DISCUSSION ............................................................. 26
4.1. Electrical Conductivity Measurement ................................................. 27
4.2. Differential Thermal Analysis (DTA/TGA) ........................................ 28
4.3. Electrostatic Spray Deposition (ESD).................................................. 31
4.4. Post Heat Treatment ............................................................................ 31
4.5. Scanning Electron Microscopy ........................................................... 31
4.5.1. Influence of the Nozzle to Substrate Distance .............................. 32
4.5.2. Influence of Precursor Solution Flow Rate ................................... 35
4.5.3. Influence of Deposition Temperature ........................................... 38
4.5.4. Influence of Heat Treatment ......................................................... 40
4.6. X-ray Diffraction Analysis .................................................................. 44
CHAPTER 5. CONCLUSIONS .................................................................................... 54
REFERENCES .............................................................................................................. 55
viii
LIST OF FIGURES
Figure Page
Figure 2.1. Schematic picture of a fuel cell ...................................................................4
Figure 2.2. Schematic picture of a solid oxide fuel cell ................................................6
Figure 2.3. Schematic representation of structure of perovskite ...................................8
Figure 2.4. Schematic ESD process ............................................................................11
Figure 2.5. Various modes of electrospraying ............................................................12
Figure 2.6. The steps of ESD process .........................................................................12
Figure 2.7. A liquid droplet spreading on a flat, smooth surface ................................14
Figure 3.1. Simplified schematic of the coating process .............................................17
Figure 3.2. Flowchart of experimantal work followed in this thesis ...........................18
Figure 3.3. Samples of pressed ceramic electrolyte dics .............................................20
Figure 3.4. Schematic drawing of the ESD setup used in sample generation .............21
Figure 3.5. The photograph of ESD setup used in sample generation ........................22
Figure 3.6. Samples after coating and sintering: (a) CGO sample, (b) TZ-3Y
sample .......................................................................................................23
Figure 4.1. XRD diagrams of Ce0.9Gd0.1Oxide powder ..............................................26
Figure 4.2. The mixtures prepared from three solvents ..............................................28
Figure 4.3. DTA analyses of 82-820 and 28-820 solutions performed under
atmospheric conditions at a heating rate of 10 °C/min .............................29
Figure 4.4. TGA analyses of 82-820 and 28-820 solutions performed under
atmospheric conditions at a heating rate of 10 °C/min .............................29
Figure 4.5. DTA analyses of 82-306 and 28-306 solutions performed under
atmospheric conditions at a heating rate of 10 °C/min .............................30
Figure 4.6. TGA analyses of 82-306 and 28-306 solutions performed under
atmospheric conditions at a heating rate of 10 °C/min .............................30
Figure 4.7. SEM micrographs of the surface of the film, (a) before and (b) after
annealing at 900 °C for 2h and applied voltage is 14 kV .........................32
Figure 4.8. SEM micrographs of La0.6Sr0.4Co0.8Fe0.2O3-δ films deposited on
CGO substrate using three different flow rates of 0.3 ml/h, 0.7 ml/h
and 1.5 ml/h for 1 h and at a constant temperature 250 °C for three
different nozzle to substrate distances of 15 mm (first line), 30 mm
ix
(second line) and 45 mm (last line). Applied voltage was kept
constant at 14 kV ......................................................................................33
Figure 4.9. EDS analysis of La0.6Sr0.4Co0.8Fe0.2O3-δ on CGO substrate ......................34
Figure 4.10. EDS analysis of La0.6Sr0.4Co0.8Fe0.2O3-δ on TZ-3Y substrate ...................34
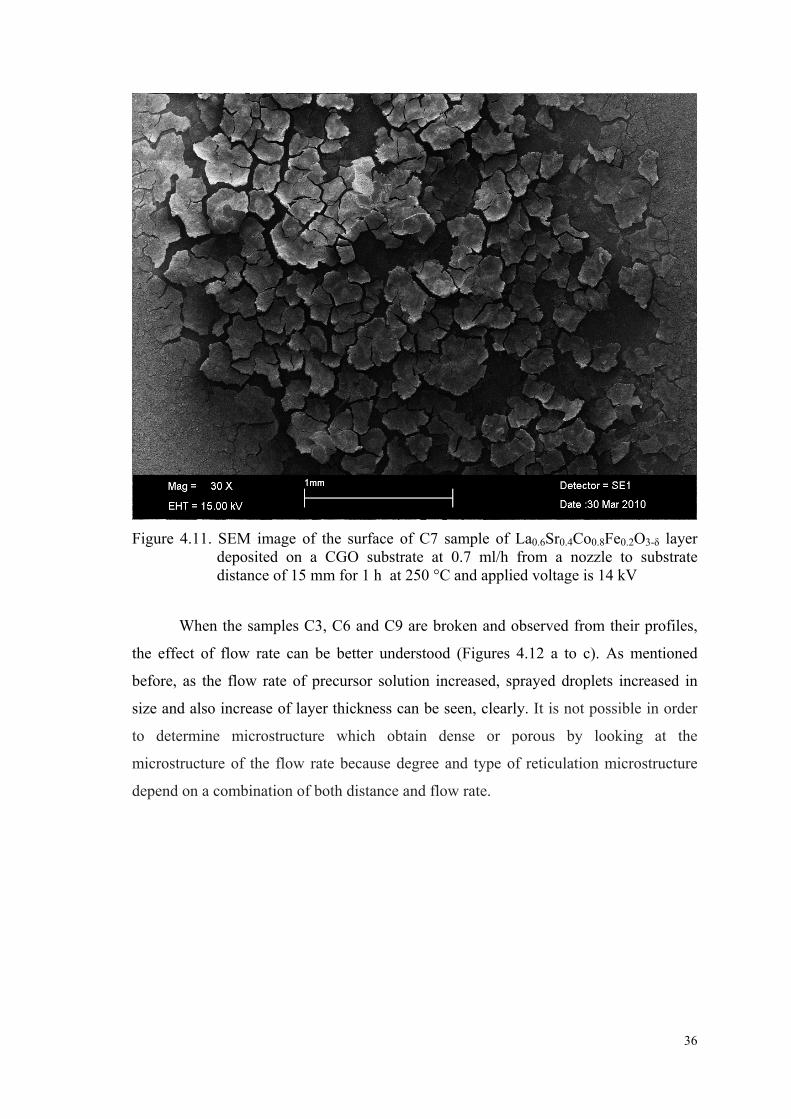
Figure 4.11. SEM image of the surface of C7 sample of La0.6Sr0.4Co0.8Fe0.2O3-δ
layer deposited on a CGO substrate at 0.7 ml/h from a nozzle to
substrate distance of 15 mm for 1 h at 250 °C and applied voltage is
14 kV..........................................................................................................36
Figure 4.12. SEM images of the fracture surfaces of La0.6Sr0.4Co0.8Fe0.2O3-δ films
deposited on a CGO substrate at (a) 0.3 (b) 0.7 and (c) 1.5 ml/h from
a nozzle to substrate distance of 45 mm for 1 h at 250 °C (samples
C3, C6 and C9) by using 14 kV ................................................................37
Figure 4.13. Steps of a particle production by electrospraying ....................................38
Figure 4.14. SEM micrographs of La0.6Sr0.4Co0.8Fe0.2O3-δ coated samples of CGO
substrates using different temperatures (a) sample C10 at 300oC,
(b) sample C11 at 350°C and (c) sample C12 at 375°C. All runs were
done at 14 kV.............................................................................................39
Figure 4.15. SEM micrographs of sample RC4 showing a well developed
reticulated structure by applying 5 kV ......................................................40
Figure 4.16. Influence of heat treatment temperature of La0.6Sr0.4Co0.8Fe0.2O3-δ
films on CGO (samples C13, C14 and C15 on left column) and TZ-
3Y (samples Z1, Z2 and Z3 on right column) by applying 15kV ............41
Figure 4.17. Fracture surfaces of cross sections of (a) sample C13 and (b)
sample Z1 coatings that were both annealed at 900°C .............................42
Figure 4.18 Fracture surfaces of cross sections of (a) sample C15 and (b) sample
Z3 coatings that were both annealed at 1300°C. Glassy structure of
the coating is evident in both SEM photomicrographs .............................42
Figure 4.19. SEM micrographs of fracture surfaces of (a) CGO and (b) TZ-3Y
substrates after coating and subsequent thermal treatment at 900°C ........43
Figure 4.20. SEM micrographs of fracture surfaces of (a) CGO and (b) TZ-3Y
substrates after coating and subsequent thermal treatment at 1300°C ......43
Figure 4.21. XRD chart for sample C13 .......................................................................44
x
Figure 4.22. HTXRD result of La0.6Sr0.4Co0.8Fe0.2O3-δ on CGO. This sample
was prepared under the same conditions with C13 but without the
post heat treatment ....................................................................................47
Figure 4.23. XRD chart for sample C15 .......................................................................48
Figure 4.24. XRD chart for sample Z1...........................................................................48
Figure 4.25. XRD chart for sample Z3...........................................................................49
Figure 4.26. HTXRD analysis chart for sample with La0.6Sr0.4Co0.8Fe0.2O3-δ
coating on TZ-3Y substrate. Stronger peaks belong to ZrO2 from the
substrate ....................................................................................................50
Figure 4.27. HTXRD analysis chart for sample with La0.6Sr0.4Co0.2Fe0.8O3-δ
coating on TZ-3Y substrate. Stronger peaks belong to ZrO2 from the
substrate ....................................................................................................51
Figure 4.28. XRD chart for sample C16 .......................................................................52
Figure 4.29. XRD chart for sample C18 .......................................................................53
xi
LIST OF TABLES
Table Page
Table 2.1. Classification of fuel cells .............................................................................. 5
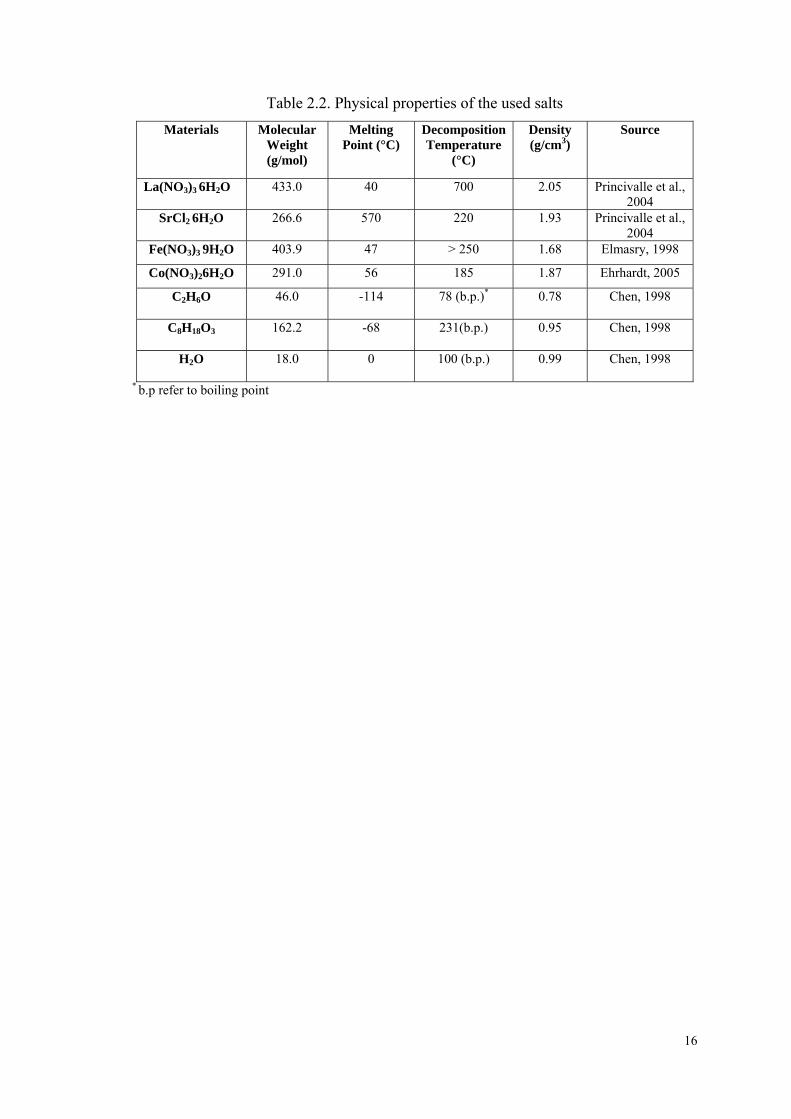
Table 2.2. Physical properties of using salts ................................................................. 16
Table 3.1. Proportion of salts and solvent for all solutions .......................................... 21
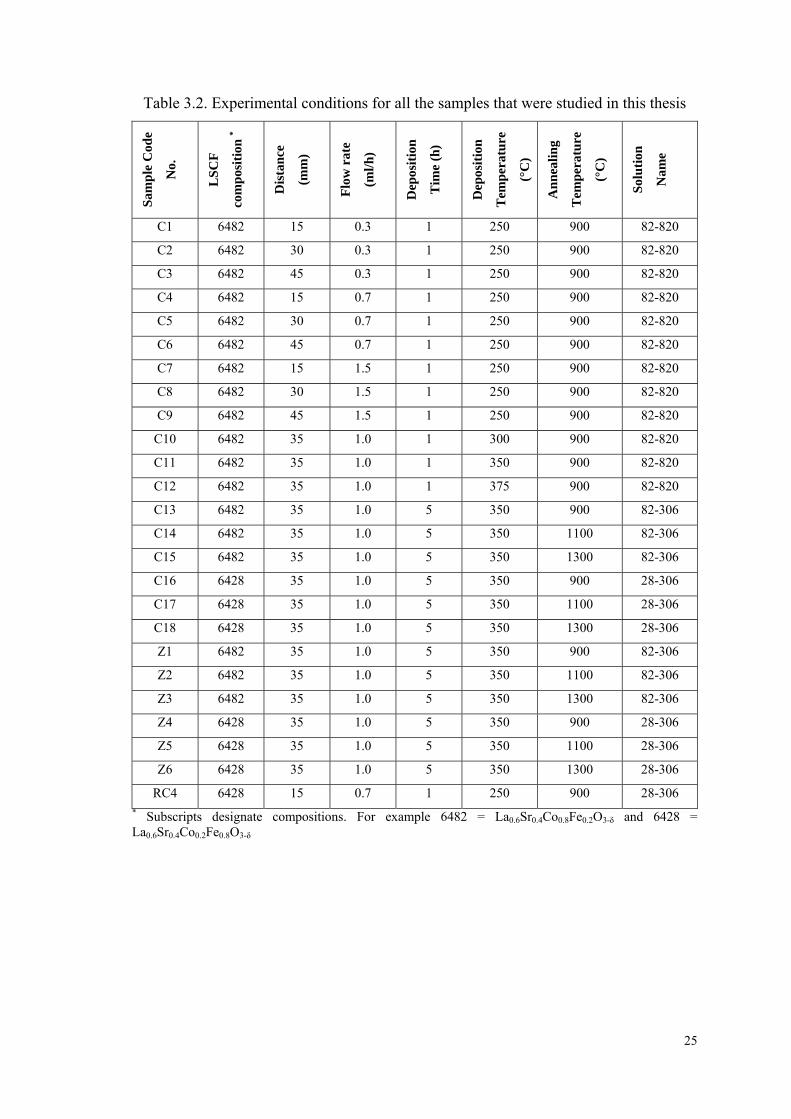
Table 3.2. Experimental conditions for all the samples that were studied in
this thesis ...................................................................................................... 25
Table 4.1. Conductivity values of all precursor solutions ............................................ 27
Table 4.2. EDS analysis results of chemical compositions of
La0.6Sr0.4Co0.8Fe 0.2O3-δ films ...................................................................... 35
Table 4.3. EDS analysis results of chemical compositions of
La0.6Sr0.4Co0.2Fe 0.8O3-δ films ....................................................................... 35
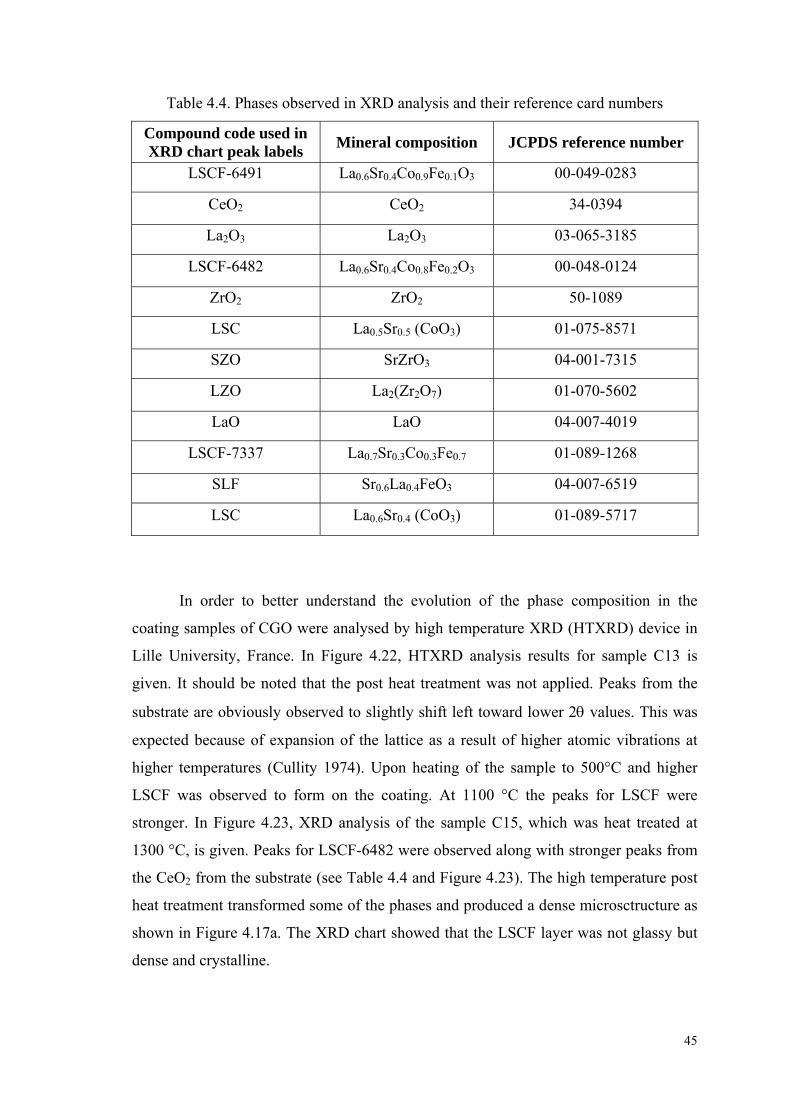
Table 4.4. Phases observed in XRD analysis and their reference card numbers .......... 45
1
CHAPTER 1
INTRODUCTION
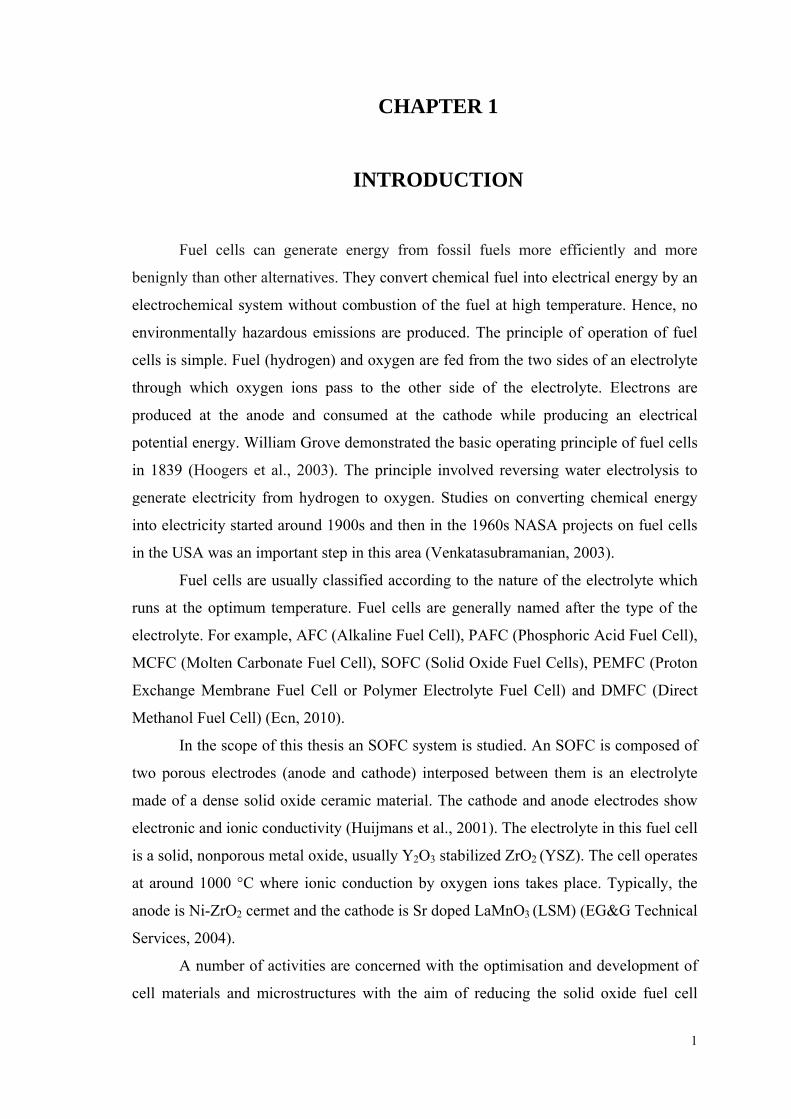
Fuel cells can generate energy from fossil fuels more efficiently and more
benignly than other alternatives. They convert chemical fuel into electrical energy by an
electrochemical system without combustion of the fuel at high temperature. Hence, no
environmentally hazardous emissions are produced. The principle of operation of fuel
cells is simple. Fuel (hydrogen) and oxygen are fed from the two sides of an electrolyte
through which oxygen ions pass to the other side of the electrolyte. Electrons are
produced at the anode and consumed at the cathode while producing an electrical
potential energy. William Grove demonstrated the basic operating principle of fuel cells
in 1839 (Hoogers et al., 2003). The principle involved reversing water electrolysis to
generate electricity from hydrogen to oxygen. Studies on converting chemical energy
into electricity started around 1900s and then in the 1960s NASA projects on fuel cells
in the USA was an important step in this area (Venkatasubramanian, 2003).
Fuel cells are usually classified according to the nature of the electrolyte which
runs at the optimum temperature. Fuel cells are generally named after the type of the
electrolyte. For example, AFC (Alkaline Fuel Cell), PAFC (Phosphoric Acid Fuel Cell),
MCFC (Molten Carbonate Fuel Cell), SOFC (Solid Oxide Fuel Cells), PEMFC (Proton
Exchange Membrane Fuel Cell or Polymer Electrolyte Fuel Cell) and DMFC (Direct
Methanol Fuel Cell) (Ecn, 2010).
In the scope of this thesis an SOFC system is studied. An SOFC is composed of
two porous electrodes (anode and cathode) interposed between them is an electrolyte
made of a dense solid oxide ceramic material. The cathode and anode electrodes show
electronic and ionic conductivity (Huijmans et al., 2001). The electrolyte in this fuel cell
is a solid, nonporous metal oxide, usually Y2O3 stabilized ZrO2 (YSZ). The cell operates
at around 1000 °C where ionic conduction by oxygen ions takes place. Typically, the
anode is Ni-ZrO2 cermet and the cathode is Sr doped LaMnO3 (LSM) (EG&G Technical
Services, 2004).
A number of activities are concerned with the optimisation and development of
cell materials and microstructures with the aim of reducing the solid oxide fuel cell
2
(SOFC) operating temperature down from 1000 °C (Huijmans et al., 1998). This group
of SOFC is called intermediate temperature solide oxide fuel cells (IT-SOFC) which are
better the lower the operating temperature. One of the most important reasons for
lowering the temperature is the reduced cost of the system. Moreover, the use of lower
temperature can increase the lifetime of the fuel cell (Marinha et al., 2009). Decreasing
the operating temperature leads to increased ohmic losses. To minimize the ohmic drop
through the electrolyte research efforts are underway (Wilhelm et al., 2005). The
development of new electrolytes with high ionic conductivity as well as efforts to
reduce the thickness of the electrolyte are tested to decrease the ohmic resistance (Steele
et al., 2000). Scandia stabilized zirconia (ScSZ) (Yamamato et al., 1998), TZ-2Y
(Nguyen et al., 2001), Cerium gadolinium oxide (CGO) (Taniguchi et al., 2003;
Marinha et al., 2009, respectively) are examples for tests on different electrolyte
materials in order to minimize the ohmic losses. The cathode material used in the
electrode naturally depends on the type of the electrolyte material. Therefore for SOFC
material development, the whole system should be considered, not the performance of
individual components (Tietz et al., 2008). Significant expertise is built now on the
assembly of these components into an SOFC stack which produces the desired power
(Ecn, 2010). In this thesis, the deposition of LSCF cathode material on CGO and yttria doped
3% mol zirconia (TZ-3Y) electrolyte was tested. The deposition of LSCF cathode
material on CGO was investigated earlier by Taniguchi et al and Marinha et al like
mentioned above (Taniguchi et al., 2003; Marinha et al., 2009). In addition, LSCF films
coated on either TZ-3Y or CGO were compared in this study.
Electrostatic spray deposition (ESD) is a modern technique of depositing films
on substrates. This process provides many advantages: experimental devices are simple
and inexpensive, a wide range of precursor, depositing, a good control of morphology
and stoichiometric deposited layers. Moreover, the depositing process can be done
under air. In chapter 2 of this thesis, a description of the principle operation of ESD, its
scope and processes on deposits of TZ-3Y and CGO will be presented. The
experimental procedure and the results of this study are given and discussed in Chapters
3 and 4, respectively, while the conclusions are stated in the last chapter.
3
CHAPTER 2
LITERATURE SEARCH
2.1. Fuel Cells
Worldwide efforts to commercialize SOFCs involve numerous investigation.
Complete cells for SOFC typically are produced by one method: electrolyte supported
cells in which an electrolyte foil carries an anode and a cathode on opposing sides
(Primdahl et al., 2000).
A fuel cell is an electrochemical cell, which can convert the chemical energy of
a fuel and an oxidant to electrical energy by a process involving electrode-electrolyte
system. The chemical energy is provided by a fuel and an oxidant stored outside the cell
in the fuel cell. Electricial energy is produced continuously as long as this cycle
continues (Venkatasubramanian, 2003). In case of effcient, clean, modular and reliable
nature of fuel cells makes them interesting candidates for energy generation (Bauen et
al., 2000). Although fuel cells show some similarities with batteries, fuel cell do not
need recharging, but not batteries (Hoogers et al., 2003). Fuel cells are capable of
converting 40 % of the available fuel to electricity. This can be raised to 80 % with heat
recovery. The fuel cell itself has no moving parts, offering a quiet and reliable source of
power. (EG&G Technical Services, 2004).
Fuel cells use common fuels or hydrogen as a reductant and air as the oxidant
though fuel cells has a wide variety of fuels and oxidants (EG&G Technical Services,
2004). Because, hydrogen has can be obtained from common fuels such as hydrocarbon,
alcohols or coal. Oxygen is the most common oxidant because it is economically
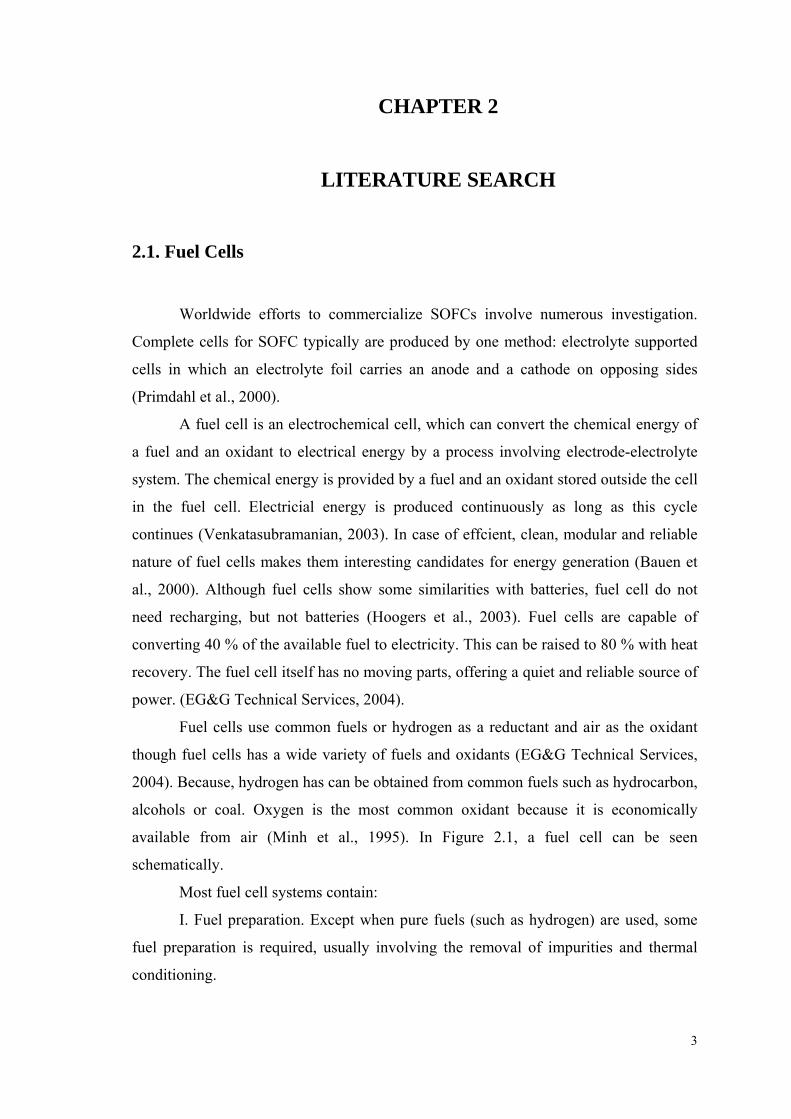
available from air (Minh et al., 1995). In Figure 2.1, a fuel cell can be seen
schematically.
Most fuel cell systems contain:
I. Fuel preparation. Except when pure fuels (such as hydrogen) are used, some
fuel preparation is required, usually involving the removal of impurities and thermal
conditioning.
4
II. Air supply. In most practical fuel cell systems, this includes air compressors
or blowers as well as air filters.
III. Thermal management. All fuel cell systems require careful management of
the fuel cell stack temperature.
IV. Water management. Water is needed in some parts of the fuel cell, while
overall water is a reaction product (EG&G Technical Services, 2004).
Figure 2.1. Schematic picture of a fuel cell
(Source: Sørensen, 2005)
2.1.1. Fuel Cell Types
There are many different types of fuel cells. These can distinguish by commerce
area, degree of suitability for applications and material costs (Larminie et al., 2003).
Moreover, fuel cells vary according to using electrolyte and applying temperature.
Table 2.1 shows the different types of fuel cells along with electrolyte used, operating
temperature and electrode reactions.
5
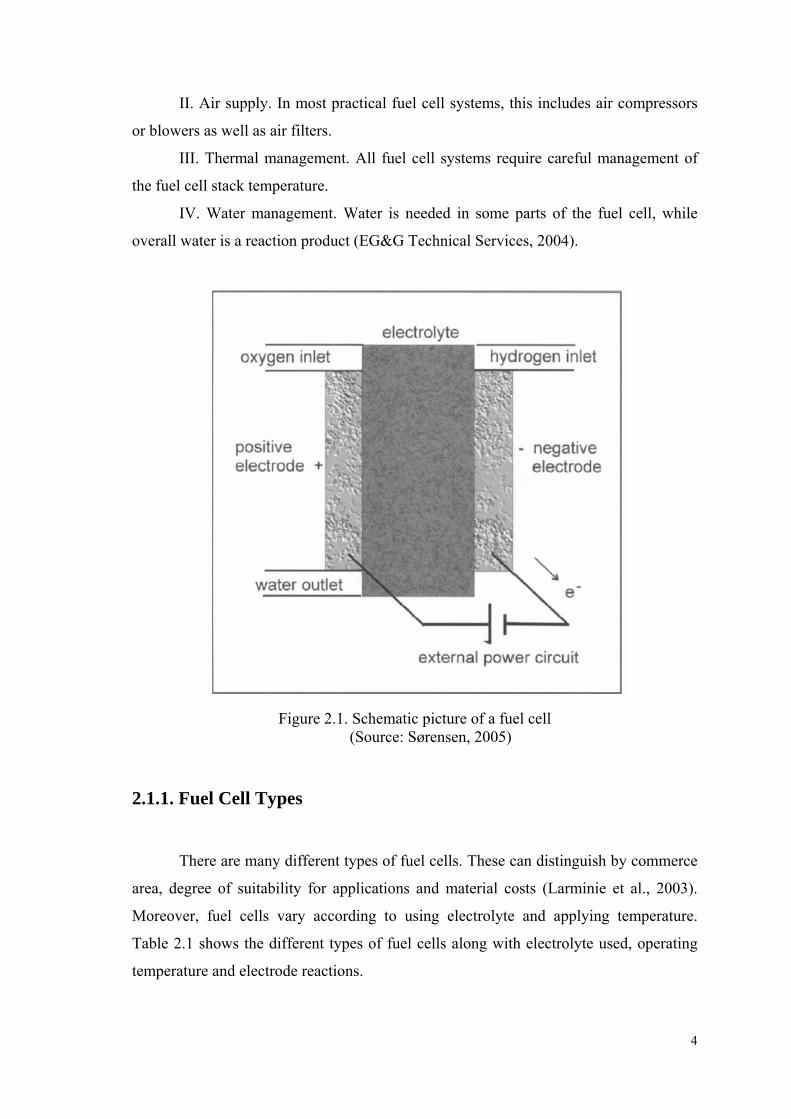
Each type of fuel cell has some advantages and disadvantages. For example,
alkaline fuel cells allow the use of nonprecious metal catalysts but suffer from the
problem of liquid electrolyte management and electrolyte degradation. Molten
carbonate fuel cells can tolerate high concentrations of carbon monoxide in the fuel
stream (CO is a fuel for such fuel cells), but their high operating temperature precludes
rapid start-up and sealing remains an issue (Ramani, 2006). Polymer electrolyte cells
work at quite low temperature, so the problem of slow reaction rates is addressed. Direct
methanol fuel cells use methanol as the fuel. Solid oxide fuel cells offer high
performance owing to operating in the region of 600-1000 °C. In this way, high reaction
rates can be achieved without expensive catalysts (Larminie et al., 2003). However,
higher temperatures are necessary for the electrolytes to be sufficiently conductive to
sustain fuel cell operation at reasonable power levels. Hence, these systems suffer from
materials related problems such as system cost and lifetime (Rosa et al., 2009).
Table 2.1. Classification of fuel cells (Source: Ramani, 2006)
2.1.1.1. Solid Oxide Fuel Cells (SOFCs)
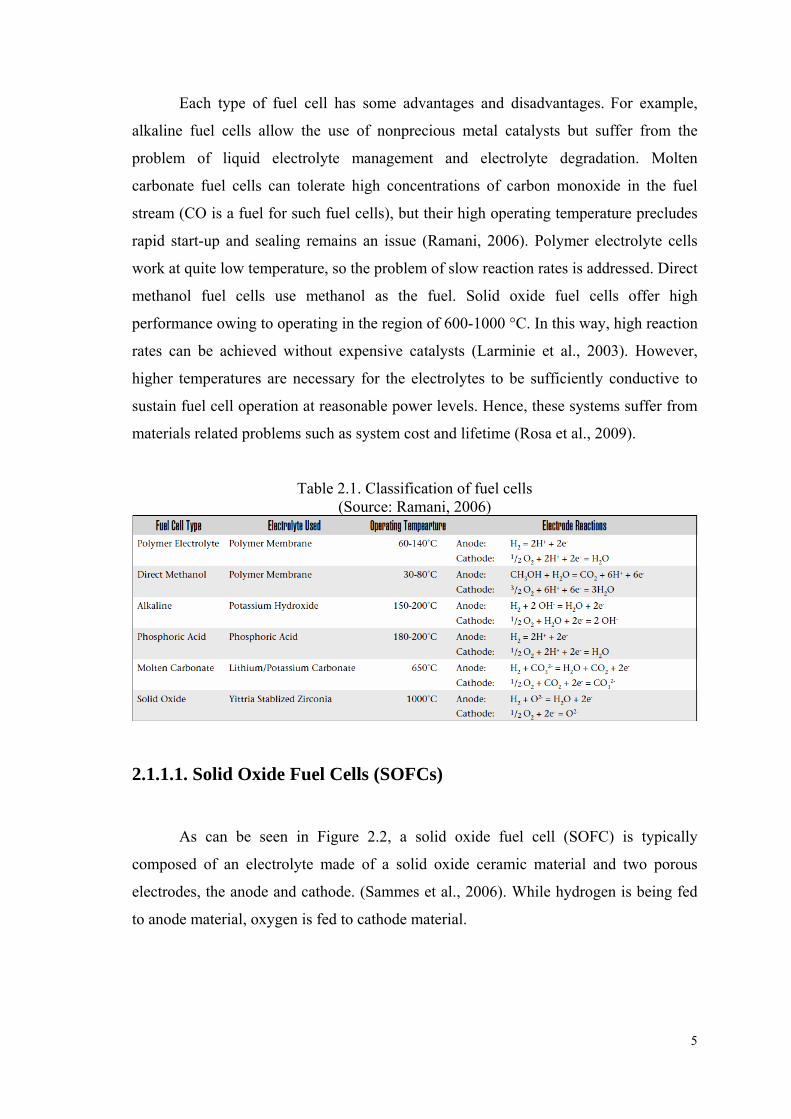
As can be seen in Figure 2.2, a solid oxide fuel cell (SOFC) is typically
composed of an electrolyte made of a solid oxide ceramic material and two porous
electrodes, the anode and cathode. (Sammes et al., 2006). While hydrogen is being fed
to anode material, oxygen is fed to cathode material.
6
Figure 2.2. Schematic picture of a solid oxide fuel cell
(Source: Sammes et al., 2006)
Thanks to cathode and anode porous materials, oxygen ions migrate from the
cathode to the anode. At this time the reduction of oxygen occurs at the cathode. At the
anode, oxygen ions reacts with hydrogen and produce water as can be seen these steps
in equations 2.2, 2.3 and 2.4. As reaction occurs, electrons are released at the anode and
migrate from the cathode to an external electric circuit. In this way, an electric current
generate (Sammes et al., 2006).
(2.2)
(2.3)
(2.4)
Some important properties are expected from fuel cells such as high conversion
efficiency, enviromental compatibility and multifuel capability. When this properties is
considering, ceramic fuel cells are appropriate devices because they prevent material
corrosion and electrolyte management problems. Ceramic fuel cells are defined as
SOFCs (Minh et al., 1995).
Energy conversion using SOFCs is a highly efficient and a benign technology
for environmental. It reduces the emission of pollutants, such as NOx, SOx, CO2 and
dust. However, the development of SOFC for efficient power generation has still failed
to reach commercial viability because of high operating temperature SOFCs and due to
7
the longterm degradation problems. Therefore, the development of intermediate-
temperature SOFCs (IT-SOFCs) has been started at 500-700 °C. Since the operation at
intermediate temperatures causes an increase in the interfacial polarization losses of a
solid state cell, as well as ohmic loss in the electrolyte, the performance of IT-SOFCs is
strongly dependent on both the electrolyte and the cathode electrolyte interface
(Taniguchi et al., 2003).
Ohmic losses can be described by Ohm’s law. The correlation between voltage
and current can be explained by resistivity. Hence, oxygen ions transition from the
cathode to the electrolyte and transition of electrons through the cathode to the anode
are run by ionic resistivity and electronic resistivities, respectively. Owing to these
ohmic resistances at a given current, there is a voltage losses.
The electrolyte causes more ohmic losses, especially in thick electrolyte
supported cells in IT-SOFCs because, ionic resisitivity of the electrolyte is greater than
electronic resistivity of the cathode and the anode. That is why, electrolyte material
which has high ionic conductivity has been searched (Singhal et al., 2003).
Polarization losses are associated with the electrochemical reactions taking place
at the interface between the electrodes and the electrolyte. The kinetics of the electrode
reactions (equations 2.2 and 2.3) play significant role in determining polarizaiton losses
in SOFCs. In practical applications, SOFCs may use gaseous mixtures that contain. For
example, coal gas and natural gas in addition to hydrogen. These gas mixtures may
contain sulfide impurities and the presence of significant levels of sulfur may cause an
unacceptable loss of cell voltage (Singhal et al., 2003).
The operation of a SOFC is based on electrical conduction in the ceramic
components. The electrolyte conducts ions between the anode and cathode. Therefore,
electrical conduction processes in ceramics are important for the operation of the SOFC.
Emphasis is placed on the discussion of electrical conduction perovskite oxides which is
the common type of oxide used in SOFCs. Perovskite type oxides of general formula is
ABO3, A is a large cations, B is a small cations (Singhal et al., 2003). These perovskites
are used as cathode material for ceramic fuel cells. (Minh et al., 1995).

8
Figure 2.3. Schematic representation of structure of perovskite (ABO3)
(Singhal et al., 2003)
2.1.1.1.1. Electrolytes
The electrolyte must be chemically and morphologically stable both reducing
and oxidizing environments and must have high ionic conductivity. Its ionic
conductivity must be as high as possible to minimize ohmic losses. The electrolyte must
possess low electronic conductivity to prevent voltage losses because of the electronic
current flowing through the electrolyte for SOFCs (Minh et al., 1995). Generally, yttria
stabilized zirconia (YSZ) which has fluorite structure, has been the most favoured
electrolyte. Pure ZrO2 exhibits negligible ionic conductivity at 1000°C. However,
doping with several percent of a lower valent metal oxide Y2O3, considerably improves
the situation. For example, since the excess charge introduced Y3+onto Zr4+ sites are
compensated by oxygen vacancies, the high vacancy concentration leads to an ionic
conductivity of 0.1 S/cm at 1000 °C for a Y2O3 content of 8 mol %. Therefore YSZ are
often used (Fleig et al., 2003).
Moreover, doped ceria electrolyte materials which has generally fluorite
structure and also perovskite and hexagonal structure are used for SOFCs (Ishihara et
al., 1994). At 1000 °C, CeO2 doped with 10 % Gd exhibits (CGO) a conductivity of
0.25 S/cm which exceeds that of zirconia (Fleig et al., 2003). CGO achieves the
required conductivity at 500 °C and therefore could be used in IT-SOFC operating at
this temperature (Nicholas et al., 2007).
9
2.1.1.1.2. Cathodes
Cathodes have to possess many properties such as high electrical conductivity to
support electron flow in oxidizing environment. Also cathodes must be compatible with
other components and interdiffusion between the cathode and adjacent components
must be limited to avoid unacceptable formation as secondary phases. In order to allow
gas transport, cathodes must have porosity structure (Minh et al., 1995).
Platinum was used in the early stages as cathode for SOFC development, since it
is expensive, it is not appropriate. Then the first perovskite LaCoO3 was studied by
Tedmon et al. Because of some problems, investigation of cathode materials were
continued. Lanthanum manganite was tried (Minh et al., 1995). LaMnO3 is one of the
typical cathode materials (Fleig et al., 2003). Strontium doped lanthanum manganite
(LSM) is shown good performance for cathode material (Larminie et al., 2003).
Perovskite structured oxides that exhibit high ionic conductivity have attracted
considerable attention due to their various applications in IT-SOFCs (Yashima et al.,
2008). Therefore, the Sr and Fe co-doped lanthanum cobaltites (LSCF) perovskite
material has been developed for especially intermediate temperature (IT) SOFCs (Han
et al., 1993). La1-xSrxCo1-yFeyO3-δ (LSCF) perovskite materials offer high electronic and
ionic conductivities. These important properties make possible applications of LSCF
perovskites as cathodes for solid oxide fuel cells operating temperatures (700–800 °C)
are preferred (SOFC) (Petric et al., 2000).
2.1.1.1.3. Anodes
The anode must combine catalytic activity with electrical conductivity. Catalytic
properties of anode are necessary for the fuel oxidation with the oxide ions coming
through the solid electrolyte. Also, ionic conductivity allows the anode to spread the
oxide ions and electrical conductivity must be to convey the electrons resulting from the
electrode reaction out into the external circuit (Singhal et al., 2003). The Ni/YSZ cermet
anode used by most SOFC developers commonly is produced by reducing an NiO/YSZ
anode. The anode must have sufficient porosity to allow gas transport to the reaction
sites (Minh et al., 1995).
10
2.1.1.1.4. SOFC Materials
Desired characteristics properties for using materials consist of chemical
stability under the operational conditions, high electrical conductivity for the electrodes
and electrical interconnects, high ionic conductivity and almost zero electrical
conductivity for the electrolyte and low cost (Sammes et al., 2006). TZ-3Y (TOSOH)
with uniform dispersion of 3 mol % yttria and cerium gadolinium oxide
(Ce0.9Gd0.1Oxide) (PRAXAIR) powders were used as electrolyte in this thesis.
. TZ-3Y exhibits superior sintering properties and higher aging resistance. TZ-
3Y show a fine crystal grain structure resulting in great improvements in strength,
fracture toughness, as well as resistance to wear and aging. Because of these properties,
TZ-3Y is good choice for SOFC (Tosoh, 2010).
Ceria based ceramics are ionic conductors and are highly oxygen conductive
when subjected to temperatures of around 600 °C. Therefore, it is desirable to reduce
SOFC operating temperature to an intermediate temperature, while still maintaining the
power density achieved at high temperature (Laukaitis et al., 2007).
2.2. Electrostatic Spray Deposition (ESD)
Electrostatic spray deposition (electrohydrodynamic spraying) is a method of
liquid atomization by means of electrical forces (Jaworek et al., 2008). Electrostatic
spray deposition technique compared to other film deposition techniques bears the
advantage of high deposition efficiency (up to 80 %) as the droplets are transported by
electrical forces (Siefert et al., 1984). The schematics of the ESD set-up are presented in
Figure 2.3. A precursor solution is atomized by an electric field to an aerosol which is
then directed to a heated substrate where a thin film is deposited. This process is well
appropriated to deposit nanostructured thin and dense electrolyte films and
nanostructured cathode films with controlled microstructures (Princivalle et al., 2008).
ESD system have several advantages. The droplet sizes of electrospraying can
range from hundreds micrometers down to several tens of nanometer. The size
distribution of the droplets can be nearly monodisperse. Droplet generation and droplet
size can be controlled to some extent via the flow rate of the liquid and the voltage at
the capillary nozzle. The fact that the droplets are electrically charged facilitates control
11
of their motion (including their deflection and focusing) by means of an electric field
(Jaworek et al., 2008). In addition, the process has very simple set-up, low cost and
working under air (Marinha et al., 2009).
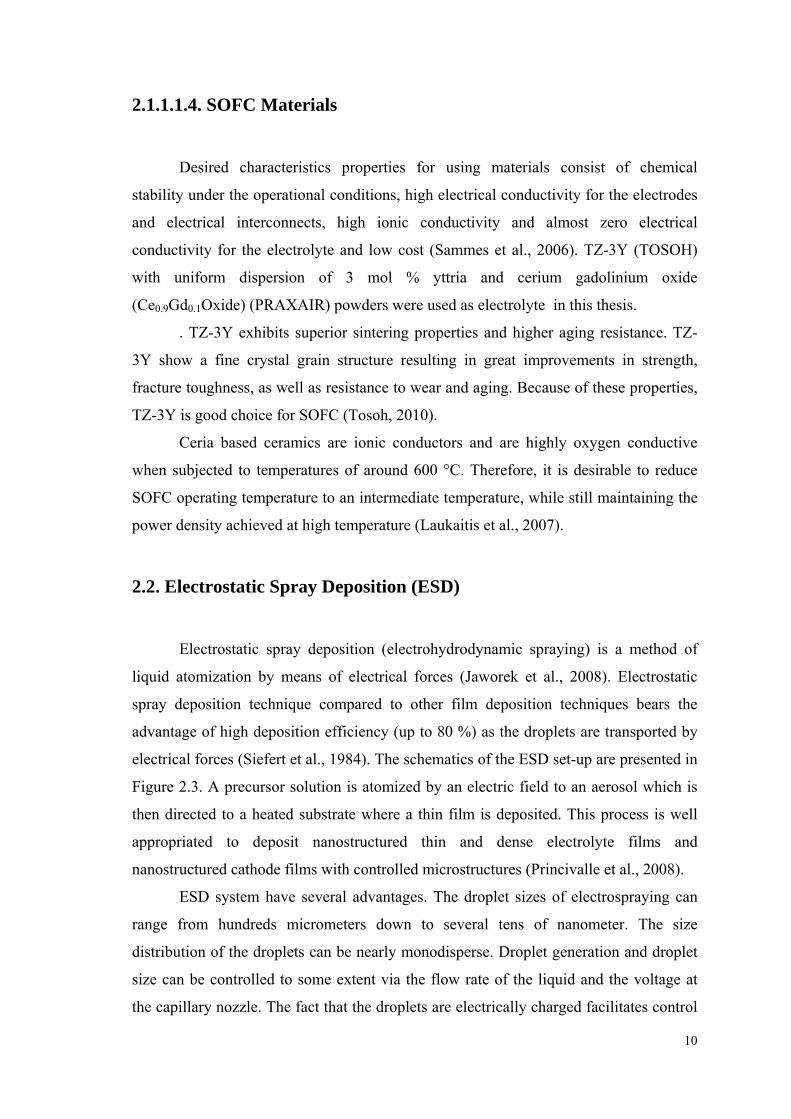
Figure 2.4. Schematic ESD process
(Source: Neagu et al., 2005)
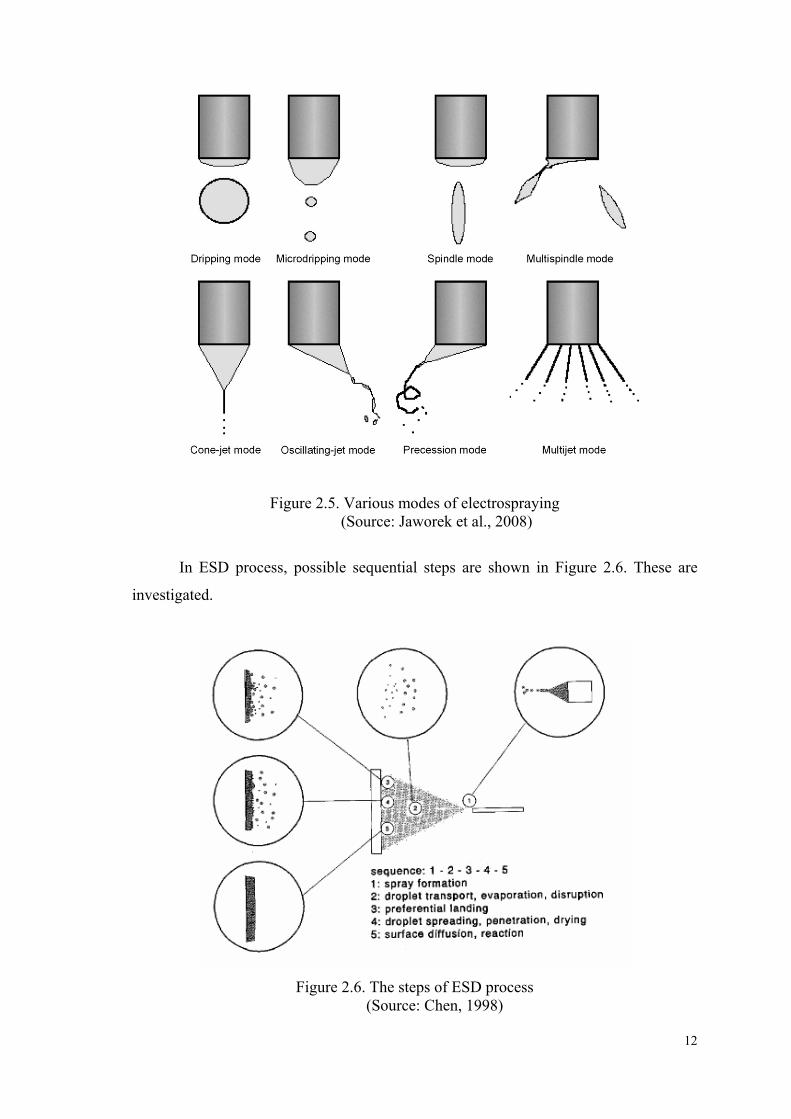
Spray modes is significant to obtain homogeneous structure. The precursor
solution can be atomised in many different spray modes. Basically, a liquid is forced to
flow through a metal nozzle which is subjected to an electric field, the liquid will leave
the outlet of the nozzle in different modes (Chen, 1998). Types of spray modes depend
on the applied voltage, the flow rate, and the physical properties of the liquid. Several
attempts have been undertaken to classify the modes of electrostatic spraying. In Figure
2.5, some different types of modes can be seen. Usually the cone jet mode is preferred,
because it produces single-sized droplets in the range of several micrometers (Neagu,
2005). In the among the different cone jets, single jet mode is more appropriate than the
others, because the cone with a straight generatrix is called Taylor cone with 49.3 ° half
angle at the apex of the cone (Chen, 1998).
12
Figure 2.5. Various modes of electrospraying (Source: Jaworek et al., 2008)
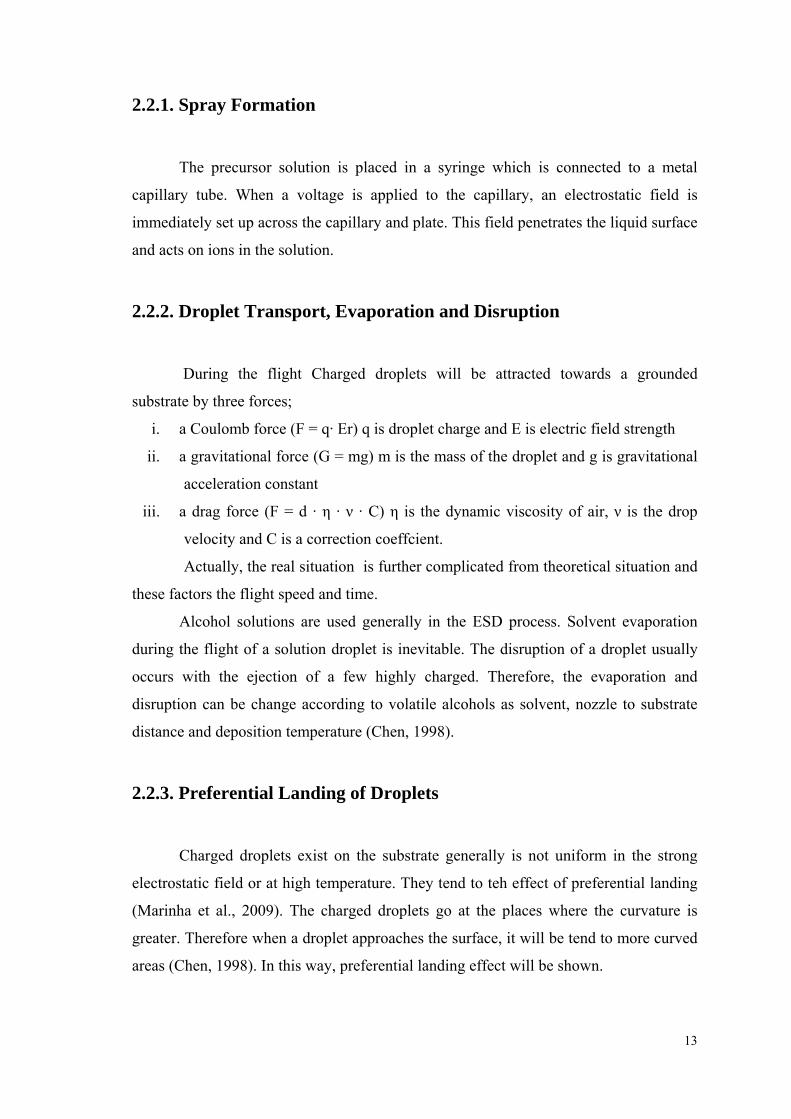
In ESD process, possible sequential steps are shown in Figure 2.6. These are
investigated.
Figure 2.6. The steps of ESD process
(Source: Chen, 1998)
13
2.2.1. Spray Formation
The precursor solution is placed in a syringe which is connected to a metal
capillary tube. When a voltage is applied to the capillary, an electrostatic field is
immediately set up across the capillary and plate. This field penetrates the liquid surface
and acts on ions in the solution.
2.2.2. Droplet Transport, Evaporation and Disruption
During the flight Charged droplets will be attracted towards a grounded
substrate by three forces;
i. a Coulomb force (F = q· Er) q is droplet charge and E is electric field strength
ii. a gravitational force (G = mg) m is the mass of the droplet and g is gravitational
acceleration constant
iii. a drag force (F = d · η · ν · C) η is the dynamic viscosity of air, ν is the drop
velocity and C is a correction coeffcient.
Actually, the real situation is further complicated from theoretical situation and
these factors the flight speed and time.
Alcohol solutions are used generally in the ESD process. Solvent evaporation
during the flight of a solution droplet is inevitable. The disruption of a droplet usually
occurs with the ejection of a few highly charged. Therefore, the evaporation and
disruption can be change according to volatile alcohols as solvent, nozzle to substrate
distance and deposition temperature (Chen, 1998).
2.2.3. Preferential Landing of Droplets
Charged droplets exist on the substrate generally is not uniform in the strong
electrostatic field or at high temperature. They tend to teh effect of preferential landing
(Marinha et al., 2009). The charged droplets go at the places where the curvature is
greater. Therefore when a droplet approaches the surface, it will be tend to more curved
areas (Chen, 1998). In this way, preferential landing effect will be shown.
14
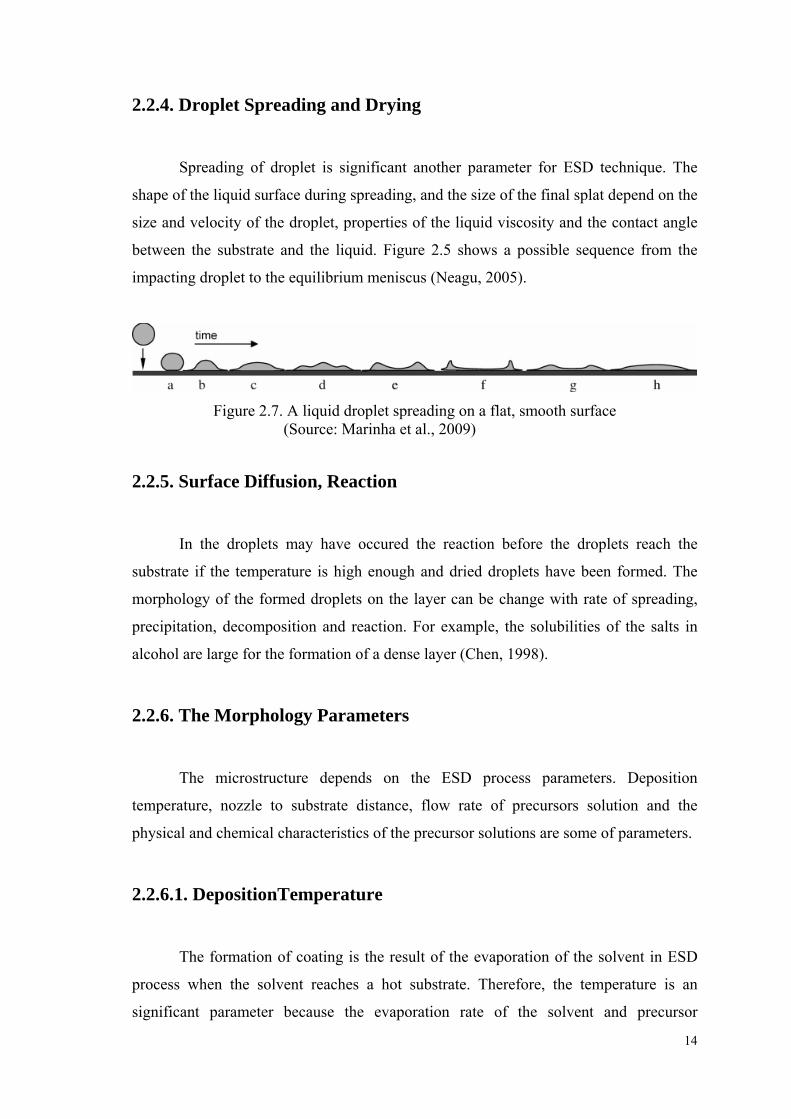
2.2.4. Droplet Spreading and Drying
Spreading of droplet is significant another parameter for ESD technique. The
shape of the liquid surface during spreading, and the size of the final splat depend on the
size and velocity of the droplet, properties of the liquid viscosity and the contact angle
between the substrate and the liquid. Figure 2.5 shows a possible sequence from the
impacting droplet to the equilibrium meniscus (Neagu, 2005).
Figure 2.7. A liquid droplet spreading on a flat, smooth surface
(Source: Marinha et al., 2009)
2.2.5. Surface Diffusion, Reaction
In the droplets may have occured the reaction before the droplets reach the
substrate if the temperature is high enough and dried droplets have been formed. The
morphology of the formed droplets on the layer can be change with rate of spreading,
precipitation, decomposition and reaction. For example, the solubilities of the salts in
alcohol are large for the formation of a dense layer (Chen, 1998).
2.2.6. The Morphology Parameters
The microstructure depends on the ESD process parameters. Deposition
temperature, nozzle to substrate distance, flow rate of precursors solution and the
physical and chemical characteristics of the precursor solutions are some of parameters.
2.2.6.1. DepositionTemperature
The formation of coating is the result of the evaporation of the solvent in ESD
process when the solvent reaches a hot substrate. Therefore, the temperature is an
significant parameter because the evaporation rate of the solvent and precursor
15
decomposition depend on the temperature (Djurado et al., 2005).
2.2.6.2. Nozzle to Substrate Distance
Changing the nozzle to subsrate distance is associated with greater solvent
evaporation because droplet takes longer time to reach the substrate.According to high
or low distances, droplet size will be larger or slower and drier, respectively (Marinha et
al., 2009). On the other hand, when same quantity of solution is sprayed to the substrate,
droplet cover a larger area if the the distance is increased or vice versa (Djurado et al.,
2005).
2.2.6.3. Precursor Solution Flow Rate
The precursor solution flow rate determines the amount of the liquid at the tip of
the nozzle and thereby determines droplet size. When the amount of the accumulation
liquid is increased, larged sized droplets will be generated. These droplets take longer
time to dry (Marinha et al., 2009).
2.2.6.4 Precursors and Solvents
One of the advantages of the ESD technique is the largely choice of precursors.
In order to prepare precursor solutions, some metallic nitrates and strontium chloride
were used as salt and ethanol, butyl carbitol and water were used as solvents in this
study. Some features of these salts and solvents are given Table 2.2.
In ESD process, precursors must be soluble in an alcohol solvent, it must be
decomposed and converted into a desired product at the deposition temperature, it
should not contaminant or impurity.
Moreover, a solvent must be proper physico- chemical properties for atomization
of the precursor solution.
16
Table 2.2. Physical properties of the used salts Materials Molecular
Weight (g/mol)
Melting Point (°C)
Decomposition Temperature
(°C)
Density (g/cm3)
Source
La(NO3)3 6H2O 433.0 40 700 2.05 Princivalle et al., 2004
SrCl2 6H2O 266.6 570 220 1.93 Princivalle et al., 2004
Fe(NO3)3 9H2O 403.9 47 > 250 1.68 Elmasry, 1998
Co(NO3)26H2O 291.0 56 185 1.87 Ehrhardt, 2005
C2H6O 46.0 -114 78 (b.p.)* 0.78 Chen, 1998
C8H18O3 162.2 -68 231(b.p.) 0.95 Chen, 1998
H2O 18.0 0 100 (b.p.) 0.99 Chen, 1998
* b.p refer to boiling point
17
CHAPTER 3
EXPERIMENTAL
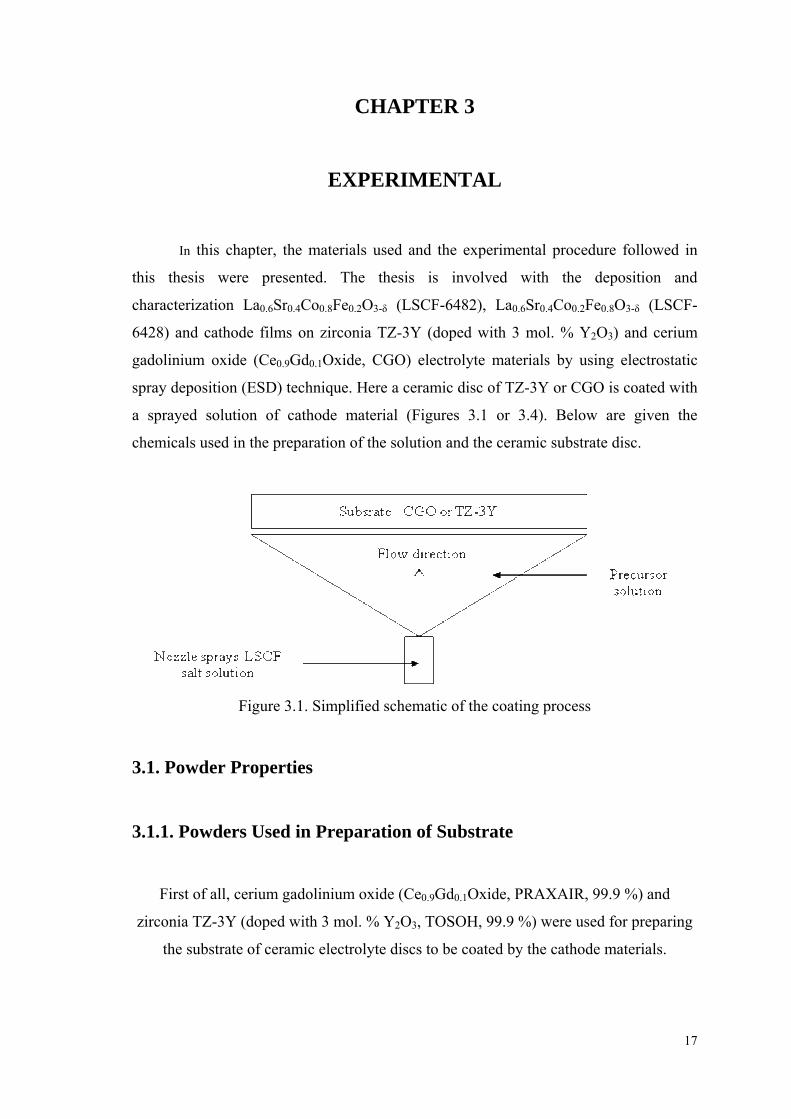
In this chapter, the materials used and the experimental procedure followed in
this thesis were presented. The thesis is involved with the deposition and
characterization La0.6Sr0.4Co0.8Fe0.2O3-δ (LSCF-6482), La0.6Sr0.4Co0.2Fe0.8O3-δ (LSCF-
6428) and cathode films on zirconia TZ-3Y (doped with 3 mol. % Y2O3) and cerium
gadolinium oxide (Ce0.9Gd0.1Oxide, CGO) electrolyte materials by using electrostatic
spray deposition (ESD) technique. Here a ceramic disc of TZ-3Y or CGO is coated with
a sprayed solution of cathode material (Figures 3.1 or 3.4). Below are given the
chemicals used in the preparation of the solution and the ceramic substrate disc.
Figure 3.1. Simplified schematic of the coating process
3.1. Powder Properties
3.1.1. Powders Used in Preparation of Substrate
First of all, cerium gadolinium oxide (Ce0.9Gd0.1Oxide, PRAXAIR, 99.9 %) and
zirconia TZ-3Y (doped with 3 mol. % Y2O3, TOSOH, 99.9 %) were used for preparing
the substrate of ceramic electrolyte discs to be coated by the cathode materials.
18
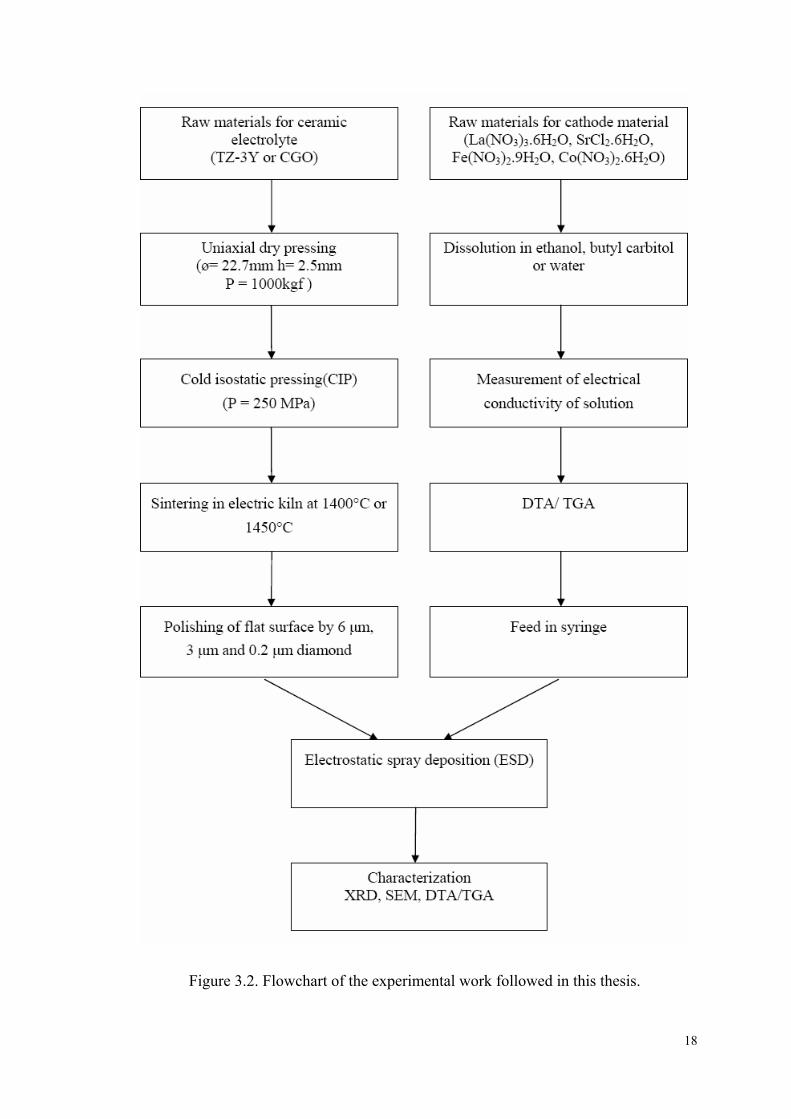
Figure 3.2. Flowchart of the experimental work followed in this thesis.
19
3.1.2. Precursor Solutions for Coating of Cathode
Precursor solutions were prepared from mixtures of lanthanum nitrate,
hexahydrate (RECTAPUR, 99.99 %), iron III nitrate, nonahydrate (SIGMA-
ALDRICH, 99.99 %), cobalt II nitrate, hexahydrate (SIGMA-ALDRICH, 99.999 %)
and strontium chloride hexahydrate (STREM CHEMICALS, 99 %) salts. The solvents
used for dissolving these salts were either ethanol (SIGMA-ALDRICH, 99.8 %) in
water or diethylene glycol monobutyl ether (butyl carbitol, ACROS ORGANICS, 99+
%).
3.2. Method
3.2.1. Preparation of the Substrate
The CGO powders to be used for pellet preparation were first calcined
(Carbolite Furnace HTC 1000) at 700 °C for 7 h. TZ-3Y and CGO powders were
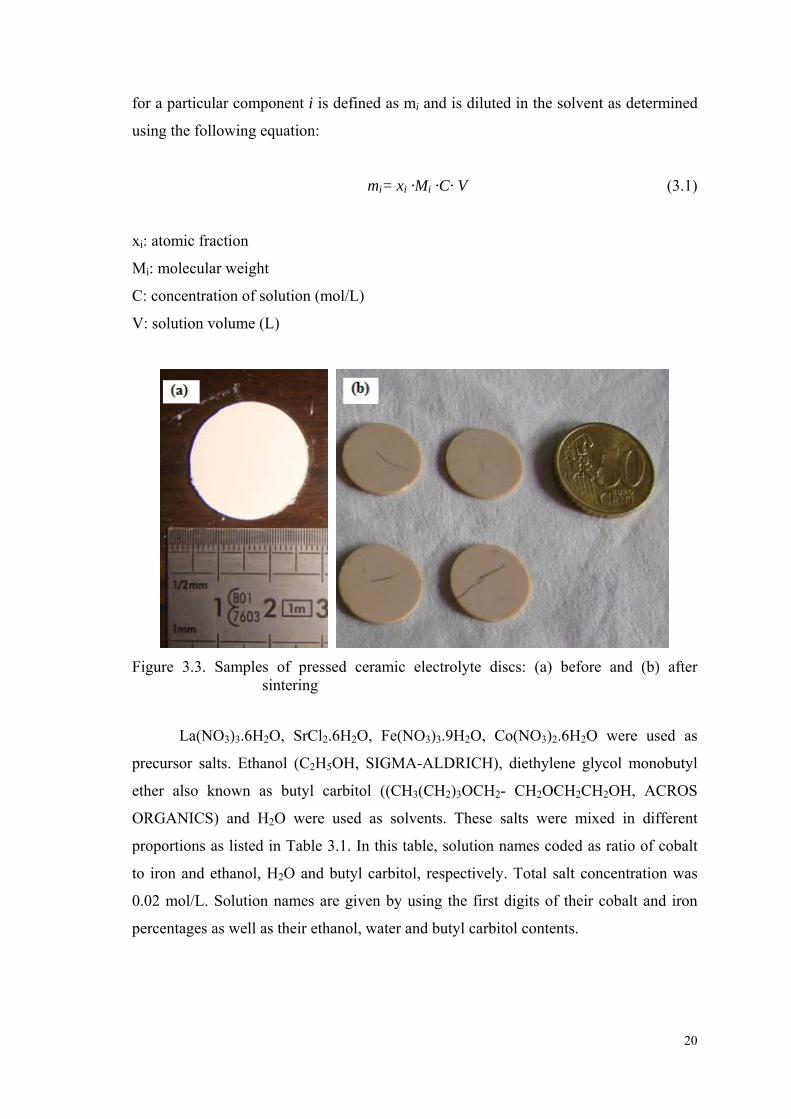
compacted by uniaxial pressing in a stainless steel die (Φ= 22.7mm) at 1000 kgf, then
by CIP (Cold Isostatic Pressing) at 250 MPa (Figure 3.3). Samples were placed in a
plastic bag under vacuum to avoid penetration of oil during the CIP process. The
samples were sintered (Carbolite Furnace HTC 1500) at 1400 °C and 1450 °C for 2 and
4 hours in air, respectively. Heating rates were 1.6 and 5 oC/min respectively. The
surfaces of all densified substrates were machined to produce a straight polished
surface. 6 µm, 3 µm and 0.2 µm diamond suspensions were used in polishing to obtain
uniform surface (Presi, Mecapol 200). Finally, samples around 19 mm of diameter and
1.2 mm of thickness, were obtained. These samples were then ready for ESD coating
process.
3.2.2. Preparation of Precursor Solutions for Cathode
As can be seen in Figures 3.1, 3.4 and 3.5, a solution is sprayed up through a
nozzle on the heated ceramic substrate. This solution is prepared from different salts to
produce the final desired stoichiometry of the cathode. The weight of the precursor salt
20
for a particular component i is defined as mi and is diluted in the solvent as determined
using the following equation:
mi= xi ·Mi ·C· V (3.1)
xi: atomic fraction
Mi: molecular weight
C: concentration of solution (mol/L)
V: solution volume (L)
Figure 3.3. Samples of pressed ceramic electrolyte discs: (a) before and (b) after
sintering
La(NO3)3.6H2O, SrCl2.6H2O, Fe(NO3)3.9H2O, Co(NO3)2.6H2O were used as
precursor salts. Ethanol (C2H5OH, SIGMA-ALDRICH), diethylene glycol monobutyl
ether also known as butyl carbitol ((CH3(CH2)3OCH2- CH2OCH2CH2OH, ACROS
ORGANICS) and H2O were used as solvents. These salts were mixed in different
proportions as listed in Table 3.1. In this table, solution names coded as ratio of cobalt
to iron and ethanol, H2O and butyl carbitol, respectively. Total salt concentration was
0.02 mol/L. Solution names are given by using the first digits of their cobalt and iron
percentages as well as their ethanol, water and butyl carbitol contents.
21
Table 3.1. Proportion of salts and solvent for all solutions. Amounts of lanthanum nitrate and strontium chloride were constant.
Solution
Name
Cobalt Iron Ethanol H2O Butyl
carbitol
Conductivity
(mS/cm)
82-820 80 20 80 20 0 1.085 28-820 20 80 80.0 20 0 1.749 82-306 80 20 33.3 0 66.7 0.041 28-306 20 80 33.3 0 66.7 0.050
3.2.3. Experimental Setup
All LSCF films were deposited using a vertical electrostatic spray deposition
(ESD) system located in LEPMI, Grenoble, France. Installation is vertical to avoid the
drops and any flow of the precursors solution on the substrate. The experimental setup
is used for depositing of the coating is shown in Figures 3.4 and 3.5.
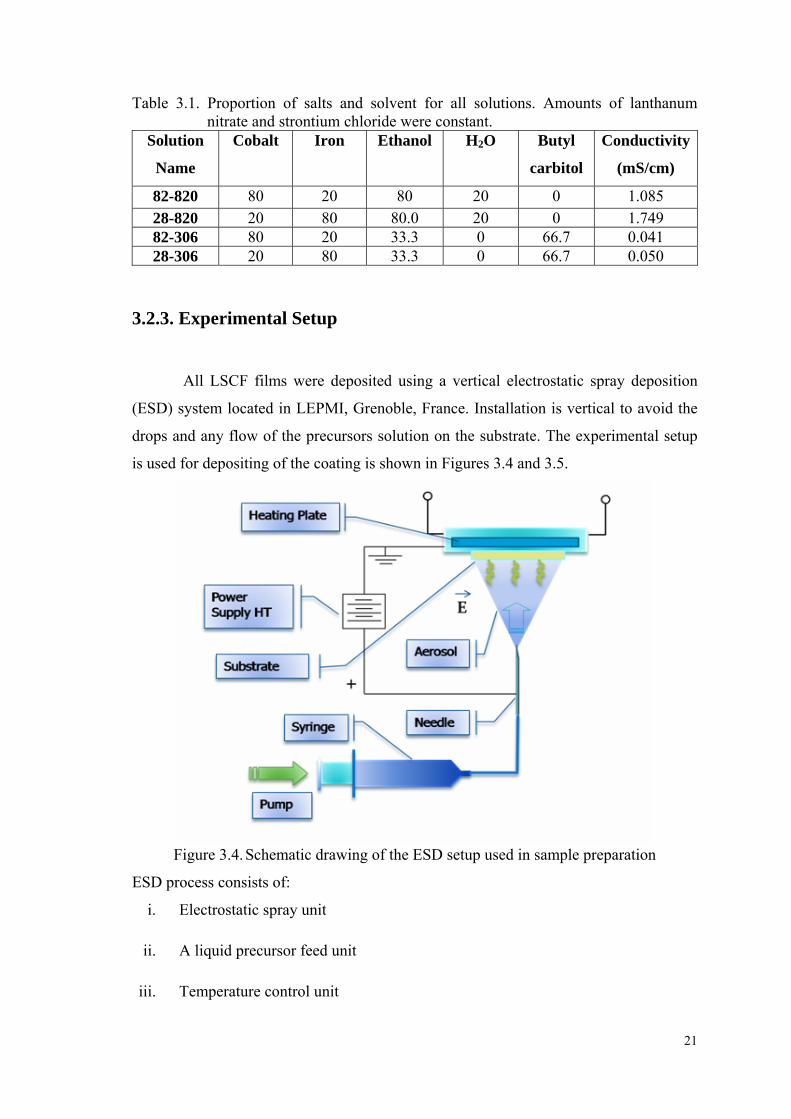
Figure 3.4. Schematic drawing of the ESD setup used in sample preparation
ESD process consists of:
i. Electrostatic spray unit
ii. A liquid precursor feed unit
iii. Temperature control unit
22
The electrostatic spray unit comprises a high voltage power supply, a stainless
steel nozzle and a grounded substrate holder. The liquid-precursor feed unit consists of
syringe and a syringe pump (Kd Scientific M361). The temperature control unit for the
deposition temperature includes a heating plate and a temperature controller connected
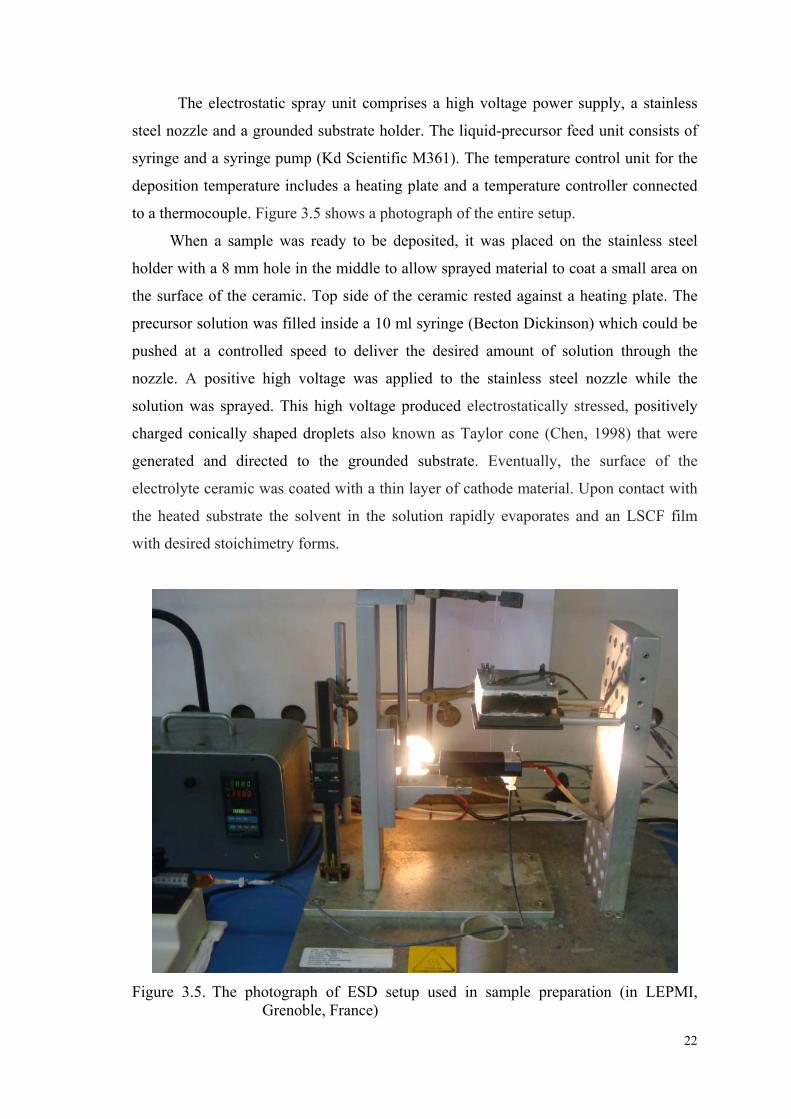
to a thermocouple. Figure 3.5 shows a photograph of the entire setup.
When a sample was ready to be deposited, it was placed on the stainless steel
holder with a 8 mm hole in the middle to allow sprayed material to coat a small area on
the surface of the ceramic. Top side of the ceramic rested against a heating plate. The
precursor solution was filled inside a 10 ml syringe (Becton Dickinson) which could be
pushed at a controlled speed to deliver the desired amount of solution through the
nozzle. A positive high voltage was applied to the stainless steel nozzle while the
solution was sprayed. This high voltage produced electrostatically stressed, positively
charged conically shaped droplets also known as Taylor cone (Chen, 1998) that were
generated and directed to the grounded substrate. Eventually, the surface of the
electrolyte ceramic was coated with a thin layer of cathode material. Upon contact with
the heated substrate the solvent in the solution rapidly evaporates and an LSCF film
with desired stoichimetry forms.
Figure 3.5. The photograph of ESD setup used in sample preparation (in LEPMI,
Grenoble, France)
23
The following ESD process deposition conditions were recorded:
i. Nozzle to substrate distance
ii. Precursor solution flow rate
iii. Deposition temperature
iv. Heat treatment
3.2.4. Experimental Plan
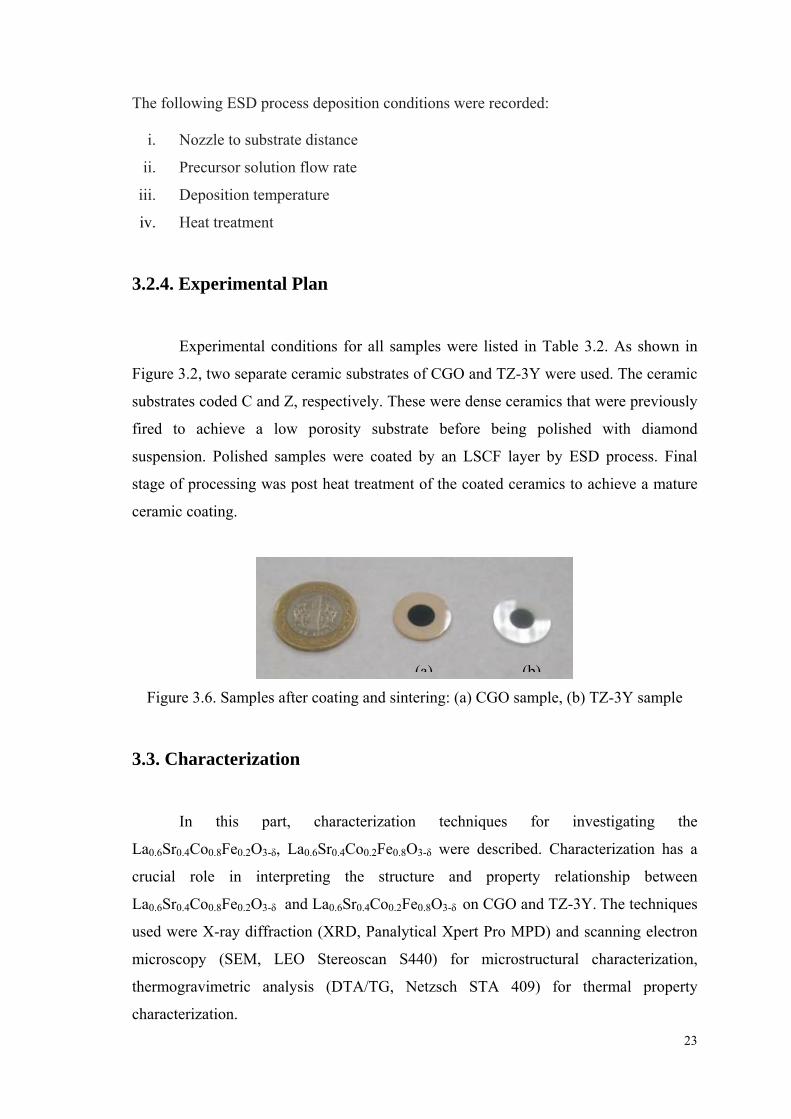
Experimental conditions for all samples were listed in Table 3.2. As shown in
Figure 3.2, two separate ceramic substrates of CGO and TZ-3Y were used. The ceramic
substrates coded C and Z, respectively. These were dense ceramics that were previously
fired to achieve a low porosity substrate before being polished with diamond
suspension. Polished samples were coated by an LSCF layer by ESD process. Final
stage of processing was post heat treatment of the coated ceramics to achieve a mature
ceramic coating.
Figure 3.6. Samples after coating and sintering: (a) CGO sample, (b) TZ-3Y sample
3.3. Characterization
In this part, characterization techniques for investigating the
La0.6Sr0.4Co0.8Fe0.2O3-δ, La0.6Sr0.4Co0.2Fe0.8O3-δ were described. Characterization has a
crucial role in interpreting the structure and property relationship between
La0.6Sr0.4Co0.8Fe0.2O3-δ and La0.6Sr0.4Co0.2Fe0.8O3-δ on CGO and TZ-3Y. The techniques
used were X-ray diffraction (XRD, Panalytical Xpert Pro MPD) and scanning electron
microscopy (SEM, LEO Stereoscan S440) for microstructural characterization,
thermogravimetric analysis (DTA/TG, Netzsch STA 409) for thermal property
characterization.
(a) (b)
24
3.3.1. Electrical Conductivity
The electrical conductivity of the precursor solutions was measured using a
Tacussel CDRV 62 conductometer.
3.3.2. Differential Thermal Analysis (DTA/ TGA)
In order to determine the thermal decomposition temperatures,
thermogravimetric analysis (TGA) was performed on La0.6Sr0.4Co0.8Fe0.2O3-δ,
La0.6Sr0.4Co0.2Fe0.8O3-δ solutions with DTA/TGA (Netzsch STA 409) under ambient
atmosphere. Solutions of 100-130 mg were heated from room temperature to 690 °C at
a heating rate of 10 °C/min.
3.3.3. Scanning Electron Microscopy
Scanning electron microscope (SEM, LEO Stereoscan S440) was used to
investigate the surfaces of LSCF films and for interpreting the porous and dense
microstructures.
3.3.4. X-Ray Diffraction Analysis
X-ray diffraction analysis (XRD) was performed using a PANalytical X’Pert Pro
MPD diffractometer in the Bragg–Brentano geometry from 10 ° to 120 °, step size and
step time were 0.017 ° and 241.3 sec, respectively.
25
Table 3.2. Experimental conditions for all the samples that were studied in this thesis
Sam
ple
Cod
e
No.
LSC
F
com
posi
tion
*
Dis
tanc
e
(mm
)
Flow
rat
e
(ml/h
)
Dep
ositi
on
Tim
e (h
)
Dep
ositi
on
Tem
pera
ture
(°C
)
Ann
ealin
g
Tem
pera
ture
(°C
)
Solu
tion
Nam
e
C1 6482 15 0.3 1 250 900 82-820
C2 6482 30 0.3 1 250 900 82-820
C3 6482 45 0.3 1 250 900 82-820
C4 6482 15 0.7 1 250 900 82-820
C5 6482 30 0.7 1 250 900 82-820
C6 6482 45 0.7 1 250 900 82-820
C7 6482 15 1.5 1 250 900 82-820
C8 6482 30 1.5 1 250 900 82-820
C9 6482 45 1.5 1 250 900 82-820
C10 6482 35 1.0 1 300 900 82-820
C11 6482 35 1.0 1 350 900 82-820
C12 6482 35 1.0 1 375 900 82-820
C13 6482 35 1.0 5 350 900 82-306
C14 6482 35 1.0 5 350 1100 82-306
C15 6482 35 1.0 5 350 1300 82-306
C16 6428 35 1.0 5 350 900 28-306
C17 6428 35 1.0 5 350 1100 28-306
C18 6428 35 1.0 5 350 1300 28-306
Z1 6482 35 1.0 5 350 900 82-306
Z2 6482 35 1.0 5 350 1100 82-306
Z3 6482 35 1.0 5 350 1300 82-306
Z4 6428 35 1.0 5 350 900 28-306
Z5 6428 35 1.0 5 350 1100 28-306
Z6 6428 35 1.0 5 350 1300 28-306
RC4 6428 15 0.7 1 250 900 28-306 * Subscripts designate compositions. For example 6482 = La0.6Sr0.4Co0.8Fe0.2O3-δ and 6428 = La0.6Sr0.4Co0.2Fe0.8O3-δ
26
CHAPTER 4
RESULTS AND DISCUSSION
In this study, the results of experiments aimed at depositing
La0.6Sr0.4Co0.8Fe0.2O3-δ, La0.6Sr0.4Co0.2Fe0.8O3-δ films on CGO and TZ-3Y substrates
were presented. In order to understand the process mechanisms and to interprete
structural characterizations, the effect of nozzle to substrate distance, precursor solution
flow rate, deposition temperature and applied voltage were tested. Also, electrical
conductivity measurements of La0.6Sr0.4Co0.8Fe0.2O3-δ, La0.6Sr0.4Co0.2Fe0.8O3-δ precursor
solutions were made to understand the degree of dissolution of the components.
Moreover, thermal analysis of the precursor solutions are presented in this chapter.
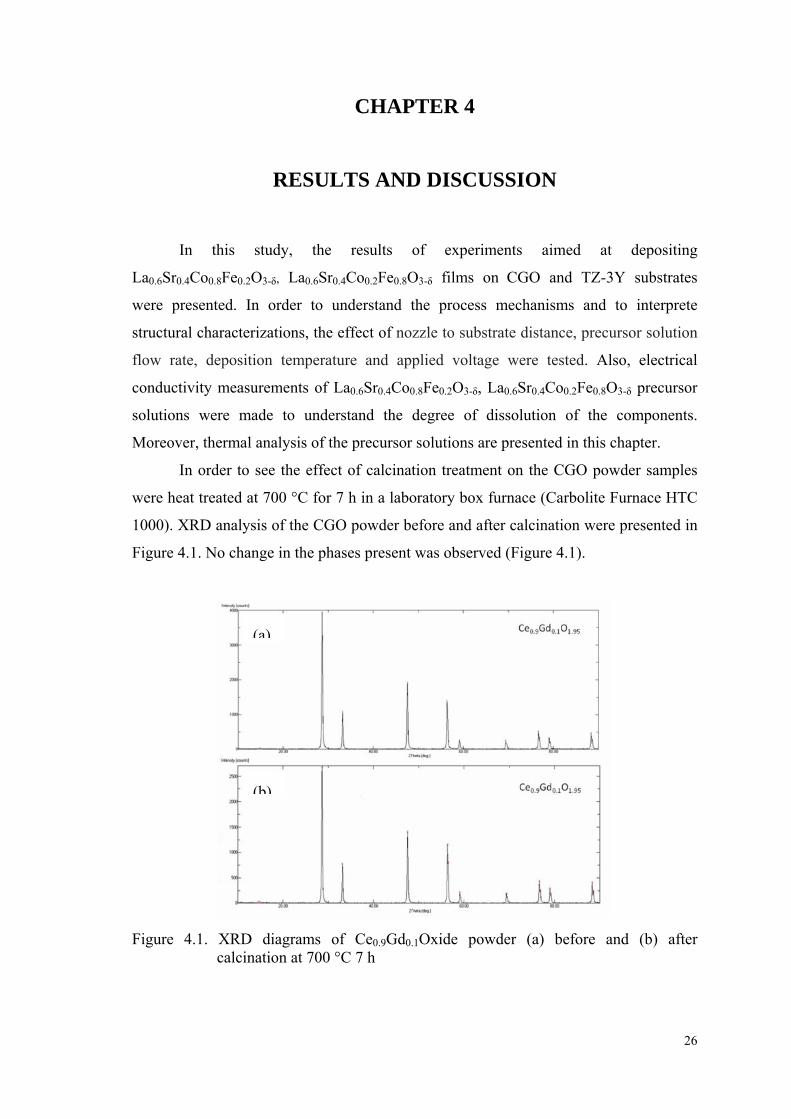
In order to see the effect of calcination treatment on the CGO powder samples
were heat treated at 700 °C for 7 h in a laboratory box furnace (Carbolite Furnace HTC
1000). XRD analysis of the CGO powder before and after calcination were presented in
Figure 4.1. No change in the phases present was observed (Figure 4.1).
Figure 4.1. XRD diagrams of Ce0.9Gd0.1Oxide powder (a) before and (b) after
calcination at 700 °C 7 h
(a)
(b)
27
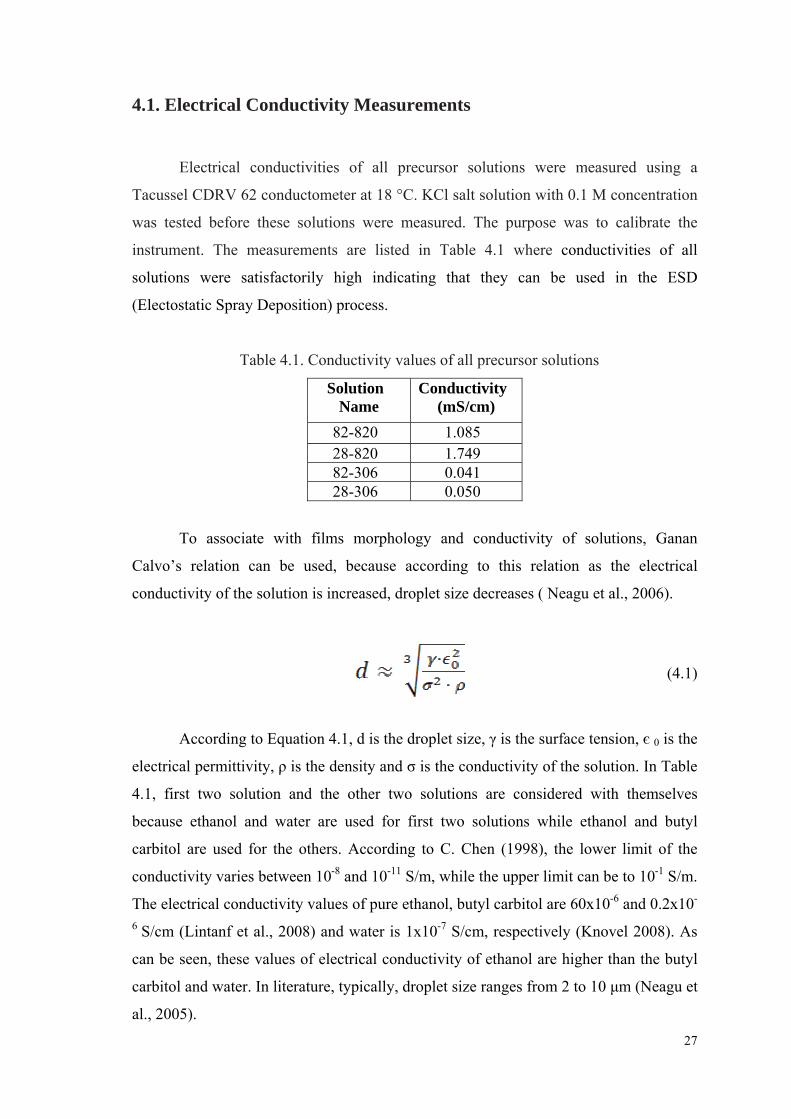
4.1. Electrical Conductivity Measurements
Electrical conductivities of all precursor solutions were measured using a
Tacussel CDRV 62 conductometer at 18 °C. KCl salt solution with 0.1 M concentration
was tested before these solutions were measured. The purpose was to calibrate the
instrument. The measurements are listed in Table 4.1 where conductivities of all
solutions were satisfactorily high indicating that they can be used in the ESD
(Electostatic Spray Deposition) process.
Table 4.1. Conductivity values of all precursor solutions
Solution Name
Conductivity (mS/cm)
82-820 1.085 28-820 1.749 82-306 0.041 28-306 0.050
To associate with films morphology and conductivity of solutions, Ganan
Calvo’s relation can be used, because according to this relation as the electrical
conductivity of the solution is increased, droplet size decreases ( Neagu et al., 2006).
(4.1)
According to Equation 4.1, d is the droplet size, γ is the surface tension, є 0 is the
electrical permittivity, ρ is the density and σ is the conductivity of the solution. In Table
4.1, first two solution and the other two solutions are considered with themselves
because ethanol and water are used for first two solutions while ethanol and butyl
carbitol are used for the others. According to C. Chen (1998), the lower limit of the
conductivity varies between 10-8 and 10-11 S/m, while the upper limit can be to 10-1 S/m.
The electrical conductivity values of pure ethanol, butyl carbitol are 60x10-6 and 0.2x10-
6 S/cm (Lintanf et al., 2008) and water is 1x10⁻⁷ S/cm, respectively (Knovel 2008). As
can be seen, these values of electrical conductivity of ethanol are higher than the butyl
carbitol and water. In literature, typically, droplet size ranges from 2 to 10 µm (Neagu et
al., 2005).
28
4.2. Differential Thermal Analysis (DTA/ TGA)
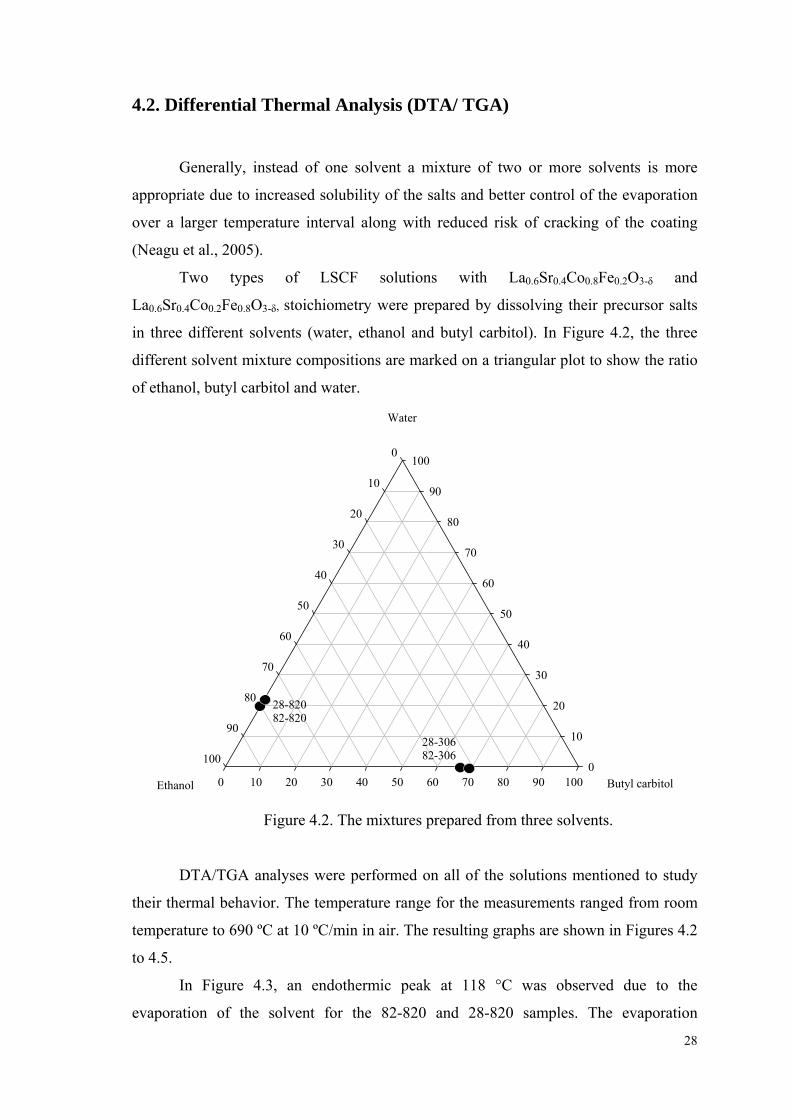
Generally, instead of one solvent a mixture of two or more solvents is more
appropriate due to increased solubility of the salts and better control of the evaporation
over a larger temperature interval along with reduced risk of cracking of the coating
(Neagu et al., 2005).
Two types of LSCF solutions with La0.6Sr0.4Co0.8Fe0.2O3-δ and
La0.6Sr0.4Co0.2Fe0.8O3-δ, stoichiometry were prepared by dissolving their precursor salts
in three different solvents (water, ethanol and butyl carbitol). In Figure 4.2, the three
different solvent mixture compositions are marked on a triangular plot to show the ratio
of ethanol, butyl carbitol and water.
Butyl carbitol0 10 20 30 40 50 60 70 80 90 100
Water
0
10
20
30
40
50
60
70
80
90
100
Ethanol
0
10
20
30
40
50
60
70
80
90
100
28-82082-820
28-30682-306
Figure 4.2. The mixtures prepared from three solvents.
DTA/TGA analyses were performed on all of the solutions mentioned to study
their thermal behavior. The temperature range for the measurements ranged from room
temperature to 690 ºC at 10 ºC/min in air. The resulting graphs are shown in Figures 4.2
to 4.5.
In Figure 4.3, an endothermic peak at 118 °C was observed due to the
evaporation of the solvent for the 82-820 and 28-820 samples. The evaporation
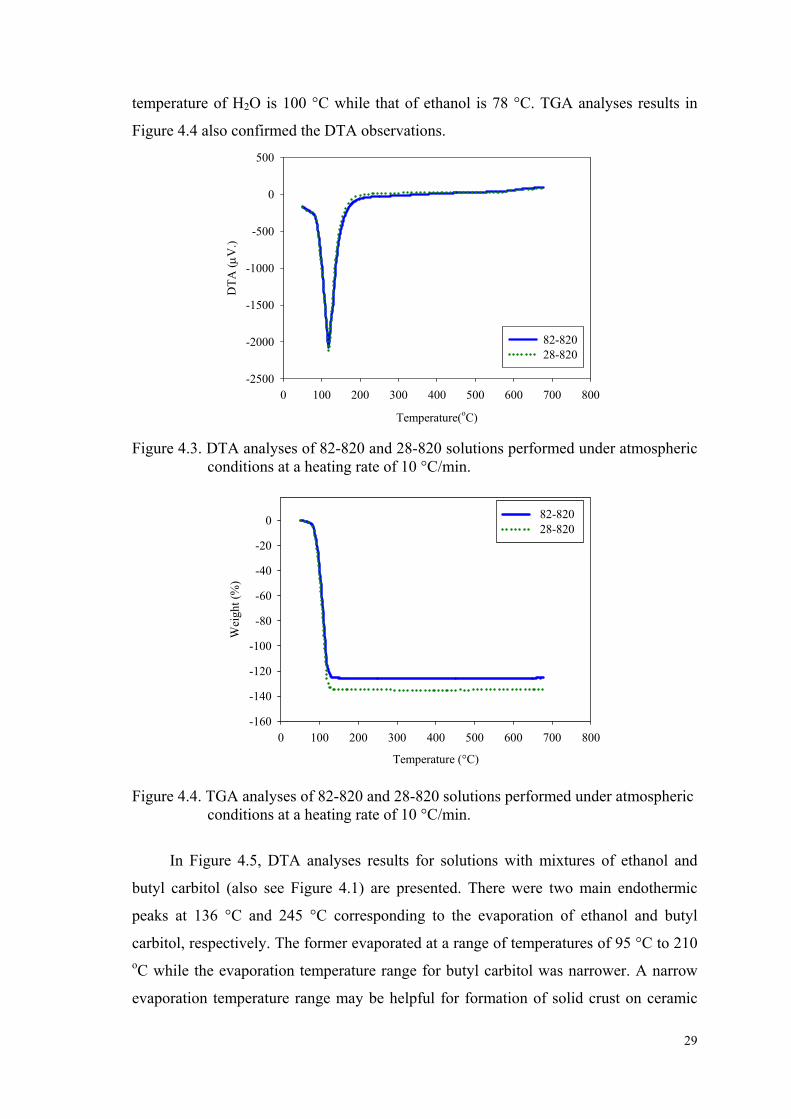
29
temperature of H2O is 100 °C while that of ethanol is 78 °C. TGA analyses results in
Figure 4.4 also confirmed the DTA observations.
Temperature(oC)
0 100 200 300 400 500 600 700 800
DTA
( µV
.)
-2500
-2000
-1500
-1000
-500
0
500
82-82028-820
Figure 4.3. DTA analyses of 82-820 and 28-820 solutions performed under atmospheric conditions at a heating rate of 10 °C/min.
Temperature (°C)
0 100 200 300 400 500 600 700 800
Wei
ght (
%)
-160
-140
-120
-100
-80
-60
-40
-20
0 82-820 28-820
Figure 4.4. TGA analyses of 82-820 and 28-820 solutions performed under atmospheric
conditions at a heating rate of 10 °C/min.
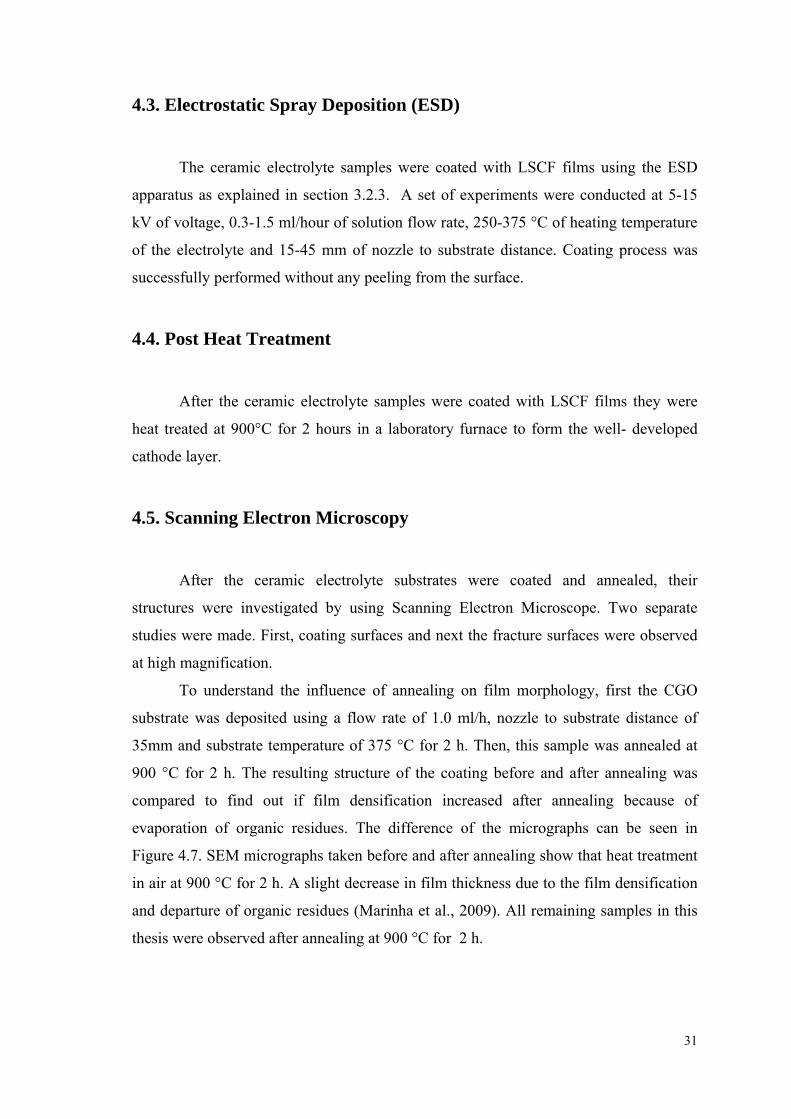
In Figure 4.5, DTA analyses results for solutions with mixtures of ethanol and
butyl carbitol (also see Figure 4.1) are presented. There were two main endothermic
peaks at 136 °C and 245 °C corresponding to the evaporation of ethanol and butyl
carbitol, respectively. The former evaporated at a range of temperatures of 95 °C to 210 oC while the evaporation temperature range for butyl carbitol was narrower. A narrow
evaporation temperature range may be helpful for formation of solid crust on ceramic
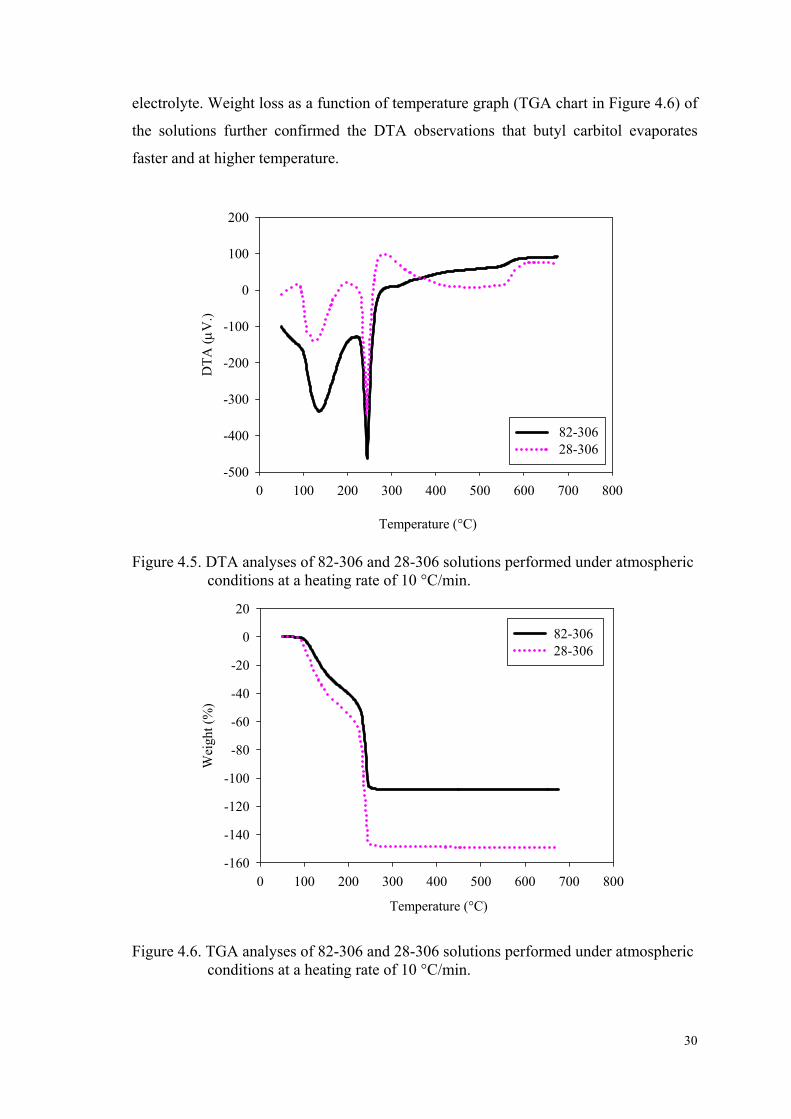
30
electrolyte. Weight loss as a function of temperature graph (TGA chart in Figure 4.6) of
the solutions further confirmed the DTA observations that butyl carbitol evaporates
faster and at higher temperature.
0 100 200 300 400 500 600 700 800
DTA
( µV
.)
-500
-400
-300
-200
-100
0
100
200
82-306 28-306
Temperature (°C)
Figure 4.5. DTA analyses of 82-306 and 28-306 solutions performed under atmospheric conditions at a heating rate of 10 °C/min.
Temperature (°C)
0 100 200 300 400 500 600 700 800
Wei
ght (
%)
-160
-140
-120
-100
-80
-60
-40
-20
0
20
82-30628-306
Figure 4.6. TGA analyses of 82-306 and 28-306 solutions performed under atmospheric
conditions at a heating rate of 10 °C/min.
31
4.3. Electrostatic Spray Deposition (ESD)
The ceramic electrolyte samples were coated with LSCF films using the ESD
apparatus as explained in section 3.2.3. A set of experiments were conducted at 5-15
kV of voltage, 0.3-1.5 ml/hour of solution flow rate, 250-375 °C of heating temperature
of the electrolyte and 15-45 mm of nozzle to substrate distance. Coating process was
successfully performed without any peeling from the surface.
4.4. Post Heat Treatment
After the ceramic electrolyte samples were coated with LSCF films they were
heat treated at 900°C for 2 hours in a laboratory furnace to form the well- developed
cathode layer.
4.5. Scanning Electron Microscopy
After the ceramic electrolyte substrates were coated and annealed, their
structures were investigated by using Scanning Electron Microscope. Two separate
studies were made. First, coating surfaces and next the fracture surfaces were observed
at high magnification.
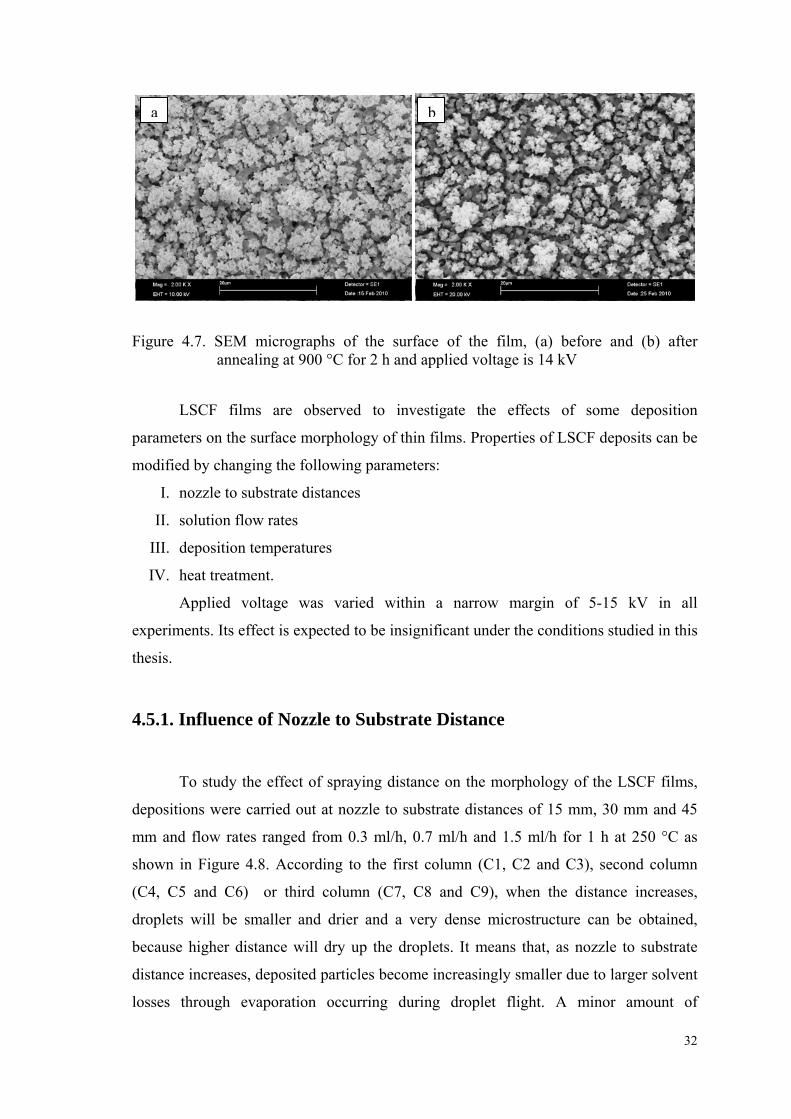
To understand the influence of annealing on film morphology, first the CGO
substrate was deposited using a flow rate of 1.0 ml/h, nozzle to substrate distance of
35mm and substrate temperature of 375 °C for 2 h. Then, this sample was annealed at
900 °C for 2 h. The resulting structure of the coating before and after annealing was
compared to find out if film densification increased after annealing because of
evaporation of organic residues. The difference of the micrographs can be seen in
Figure 4.7. SEM micrographs taken before and after annealing show that heat treatment
in air at 900 °C for 2 h. A slight decrease in film thickness due to the film densification
and departure of organic residues (Marinha et al., 2009). All remaining samples in this
thesis were observed after annealing at 900 °C for 2 h.
32
Figure 4.7. SEM micrographs of the surface of the film, (a) before and (b) after annealing at 900 °C for 2 h and applied voltage is 14 kV
LSCF films are observed to investigate the effects of some deposition
parameters on the surface morphology of thin films. Properties of LSCF deposits can be
modified by changing the following parameters:
I. nozzle to substrate distances
II. solution flow rates
III. deposition temperatures
IV. heat treatment.
Applied voltage was varied within a narrow margin of 5-15 kV in all
experiments. Its effect is expected to be insignificant under the conditions studied in this
thesis.
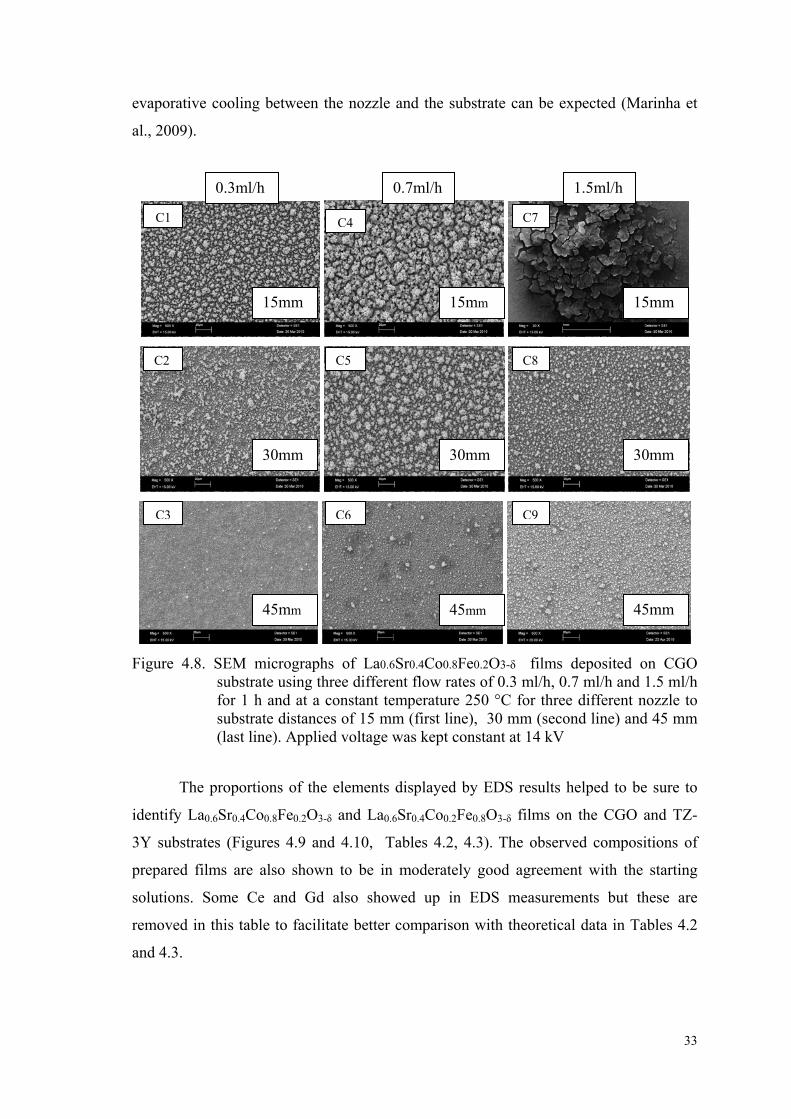
4.5.1. Influence of Nozzle to Substrate Distance
To study the effect of spraying distance on the morphology of the LSCF films,
depositions were carried out at nozzle to substrate distances of 15 mm, 30 mm and 45
mm and flow rates ranged from 0.3 ml/h, 0.7 ml/h and 1.5 ml/h for 1 h at 250 °C as
shown in Figure 4.8. According to the first column (C1, C2 and C3), second column
(C4, C5 and C6) or third column (C7, C8 and C9), when the distance increases,
droplets will be smaller and drier and a very dense microstructure can be obtained,
because higher distance will dry up the droplets. It means that, as nozzle to substrate
distance increases, deposited particles become increasingly smaller due to larger solvent
losses through evaporation occurring during droplet flight. A minor amount of
a b
33
evaporative cooling between the nozzle and the substrate can be expected (Marinha et
al., 2009).
Figure 4.8. SEM micrographs of La0.6Sr0.4Co0.8Fe0.2O3-δ films deposited on CGO
substrate using three different flow rates of 0.3 ml/h, 0.7 ml/h and 1.5 ml/h for 1 h and at a constant temperature 250 °C for three different nozzle to substrate distances of 15 mm (first line), 30 mm (second line) and 45 mm (last line). Applied voltage was kept constant at 14 kV
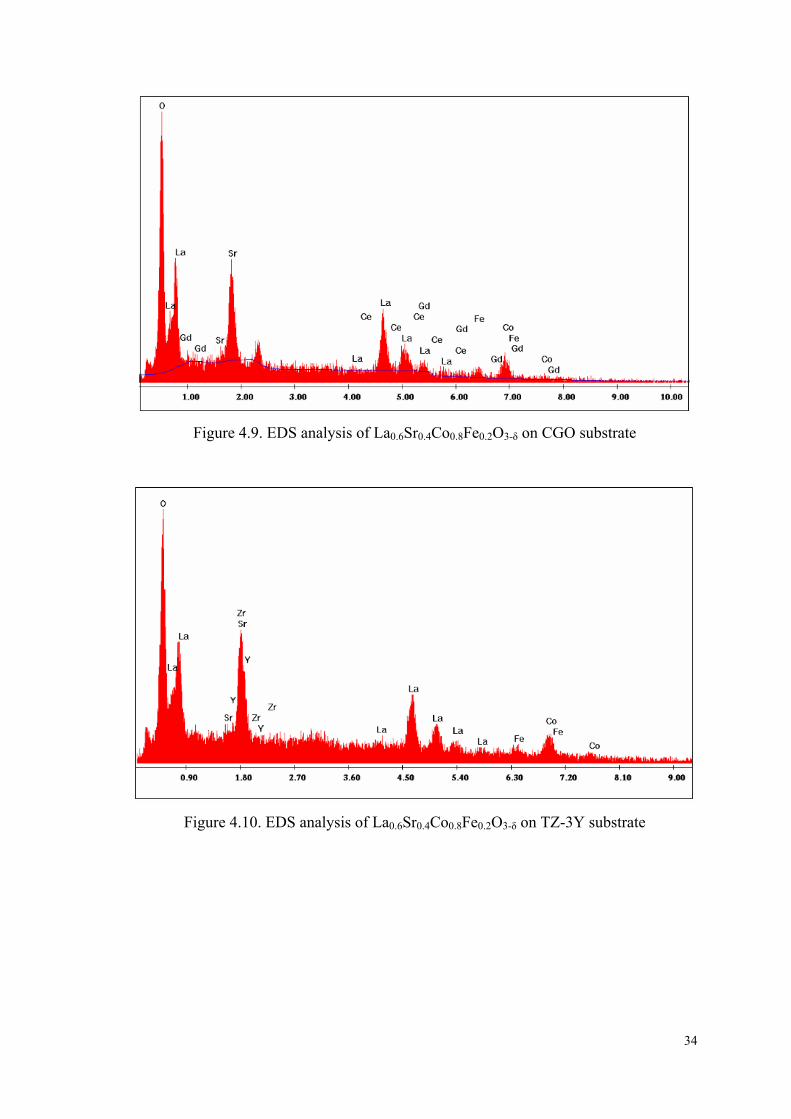
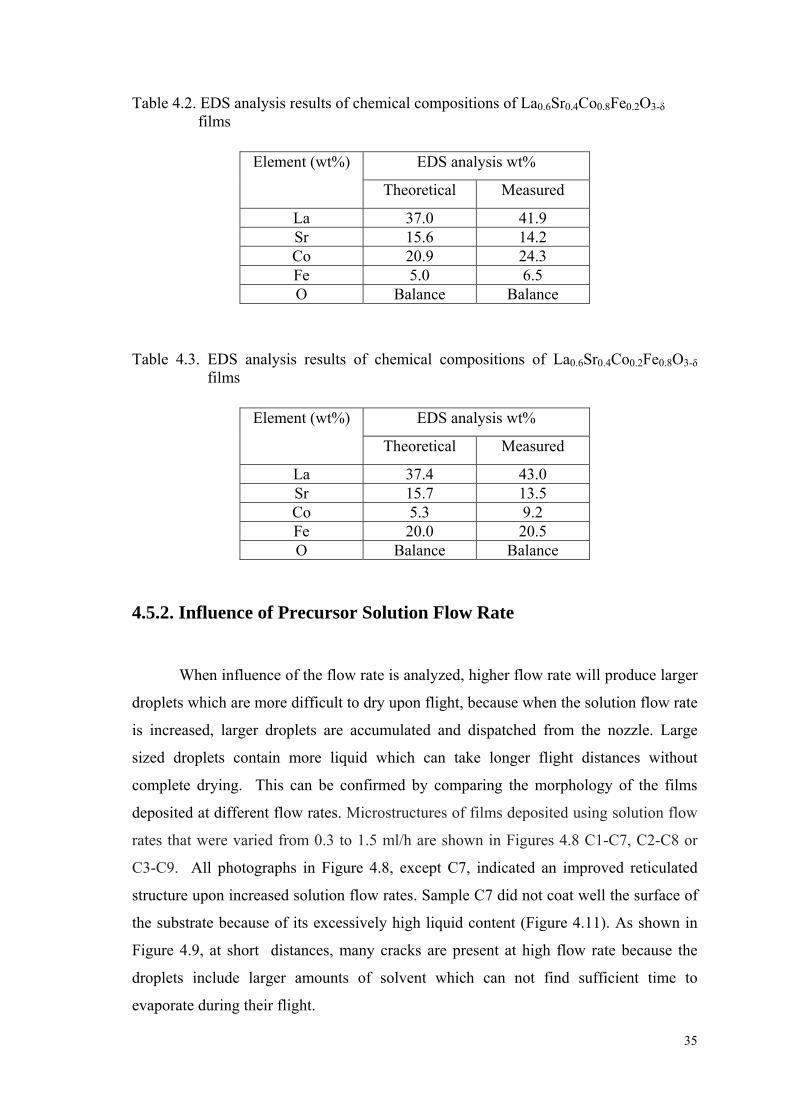
The proportions of the elements displayed by EDS results helped to be sure to
identify La0.6Sr0.4Co0.8Fe0.2O3-δ and La0.6Sr0.4Co0.2Fe0.8O3-δ films on the CGO and TZ-
3Y substrates (Figures 4.9 and 4.10, Tables 4.2, 4.3). The observed compositions of
prepared films are also shown to be in moderately good agreement with the starting
solutions. Some Ce and Gd also showed up in EDS measurements but these are
removed in this table to facilitate better comparison with theoretical data in Tables 4.2
and 4.3.
30mm
45mm
0.3ml/h 1.5ml/h 0.7ml/h
C4C1
C2
C7
C8C5
C3 C6 C9
15mm
30mm30mm
15mm
45mm
15mm
45mm
34
Figure 4.9. EDS analysis of La0.6Sr0.4Co0.8Fe0.2O3-δ on CGO substrate
Figure 4.10. EDS analysis of La0.6Sr0.4Co0.8Fe0.2O3-δ on TZ-3Y substrate
35
Table 4.2. EDS analysis results of chemical compositions of La0.6Sr0.4Co0.8Fe0.2O3-δ films
EDS analysis wt% Element (wt%)
Theoretical Measured
La 37.0 41.9 Sr 15.6 14.2 Co 20.9 24.3 Fe 5.0 6.5 O Balance Balance
Table 4.3. EDS analysis results of chemical compositions of La0.6Sr0.4Co0.2Fe0.8O3-δ
films
EDS analysis wt% Element (wt%)
Theoretical Measured
La 37.4 43.0 Sr 15.7 13.5 Co 5.3 9.2 Fe 20.0 20.5 O Balance Balance
4.5.2. Influence of Precursor Solution Flow Rate
When influence of the flow rate is analyzed, higher flow rate will produce larger
droplets which are more difficult to dry upon flight, because when the solution flow rate
is increased, larger droplets are accumulated and dispatched from the nozzle. Large
sized droplets contain more liquid which can take longer flight distances without
complete drying. This can be confirmed by comparing the morphology of the films
deposited at different flow rates. Microstructures of films deposited using solution flow
rates that were varied from 0.3 to 1.5 ml/h are shown in Figures 4.8 C1-C7, C2-C8 or
C3-C9. All photographs in Figure 4.8, except C7, indicated an improved reticulated
structure upon increased solution flow rates. Sample C7 did not coat well the surface of
the substrate because of its excessively high liquid content (Figure 4.11). As shown in
Figure 4.9, at short distances, many cracks are present at high flow rate because the
droplets include larger amounts of solvent which can not find sufficient time to
evaporate during their flight.
36
Figure 4.11. SEM image of the surface of C7 sample of La0.6Sr0.4Co0.8Fe0.2O3-δ layer
deposited on a CGO substrate at 0.7 ml/h from a nozzle to substrate distance of 15 mm for 1 h at 250 °C and applied voltage is 14 kV
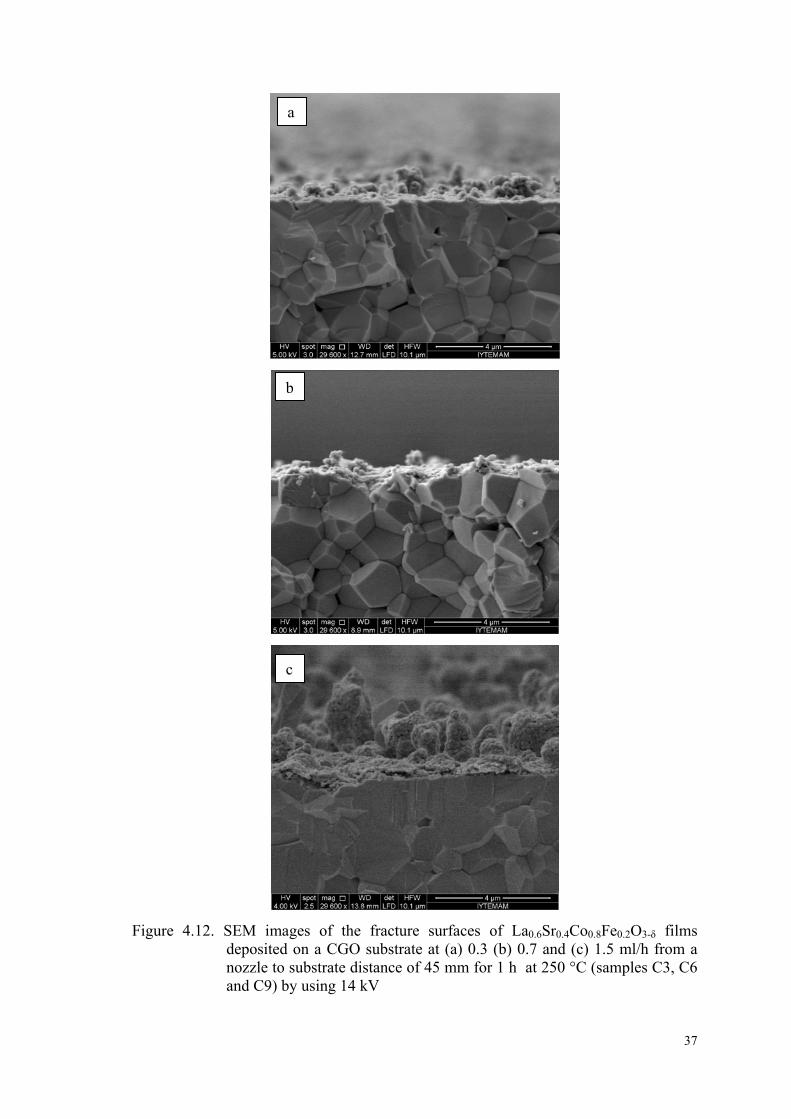
When the samples C3, C6 and C9 are broken and observed from their profiles,
the effect of flow rate can be better understood (Figures 4.12 a to c). As mentioned
before, as the flow rate of precursor solution increased, sprayed droplets increased in
size and also increase of layer thickness can be seen, clearly. It is not possible in order
to determine microstructure which obtain dense or porous by looking at the
microstructure of the flow rate because degree and type of reticulation microstructure
depend on a combination of both distance and flow rate.
37
Figure 4.12. SEM images of the fracture surfaces of La0.6Sr0.4Co0.8Fe0.2O3-δ films
deposited on a CGO substrate at (a) 0.3 (b) 0.7 and (c) 1.5 ml/h from a nozzle to substrate distance of 45 mm for 1 h at 250 °C (samples C3, C6 and C9) by using 14 kV
a
b
c
38
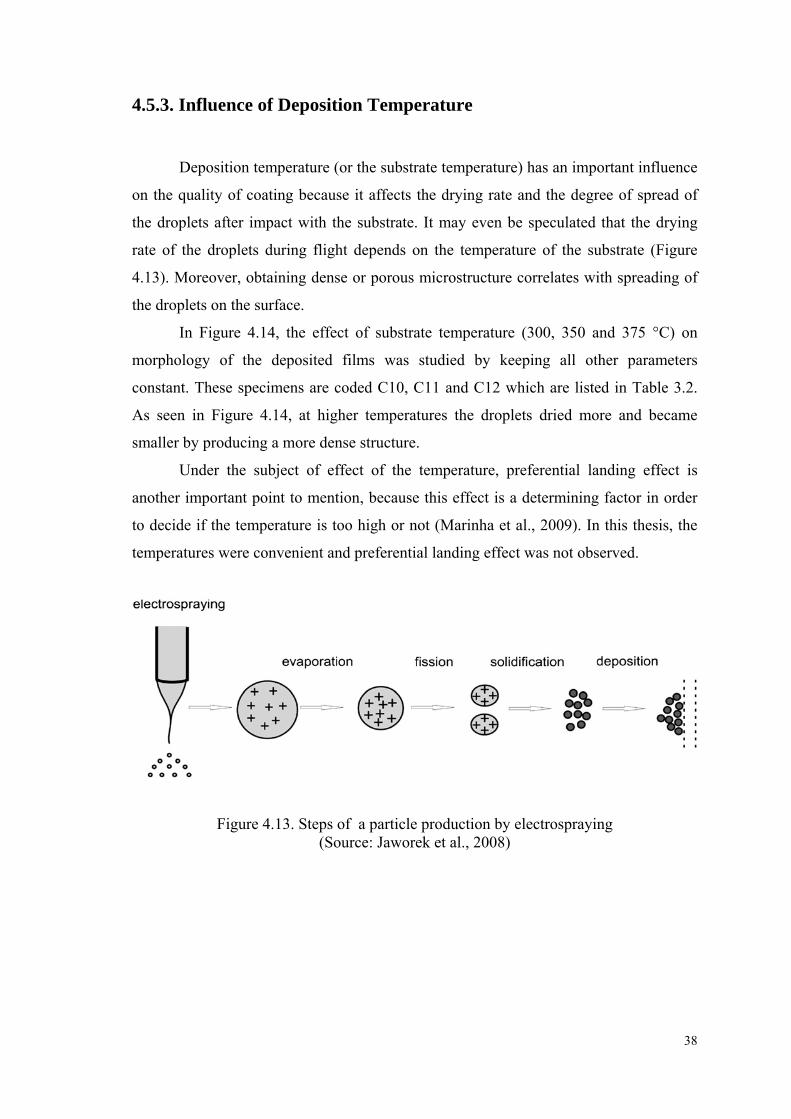
4.5.3. Influence of Deposition Temperature
Deposition temperature (or the substrate temperature) has an important influence
on the quality of coating because it affects the drying rate and the degree of spread of
the droplets after impact with the substrate. It may even be speculated that the drying
rate of the droplets during flight depends on the temperature of the substrate (Figure
4.13). Moreover, obtaining dense or porous microstructure correlates with spreading of
the droplets on the surface.
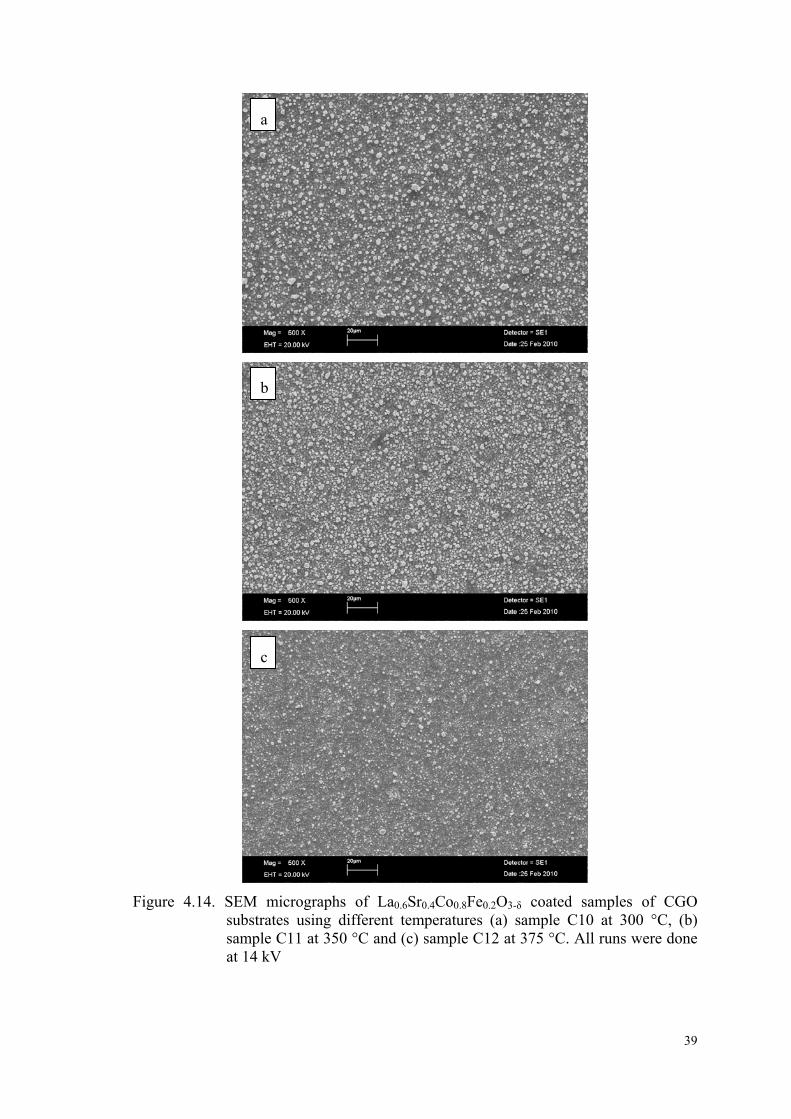
In Figure 4.14, the effect of substrate temperature (300, 350 and 375 °C) on
morphology of the deposited films was studied by keeping all other parameters
constant. These specimens are coded C10, C11 and C12 which are listed in Table 3.2.
As seen in Figure 4.14, at higher temperatures the droplets dried more and became
smaller by producing a more dense structure.
Under the subject of effect of the temperature, preferential landing effect is
another important point to mention, because this effect is a determining factor in order
to decide if the temperature is too high or not (Marinha et al., 2009). In this thesis, the
temperatures were convenient and preferential landing effect was not observed.
Figure 4.13. Steps of a particle production by electrospraying (Source: Jaworek et al., 2008)
39
Figure 4.14. SEM micrographs of La0.6Sr0.4Co0.8Fe0.2O3-δ coated samples of CGO
substrates using different temperatures (a) sample C10 at 300 °C, (b) sample C11 at 350 °C and (c) sample C12 at 375 °C. All runs were done at 14 kV
a
c
b
40
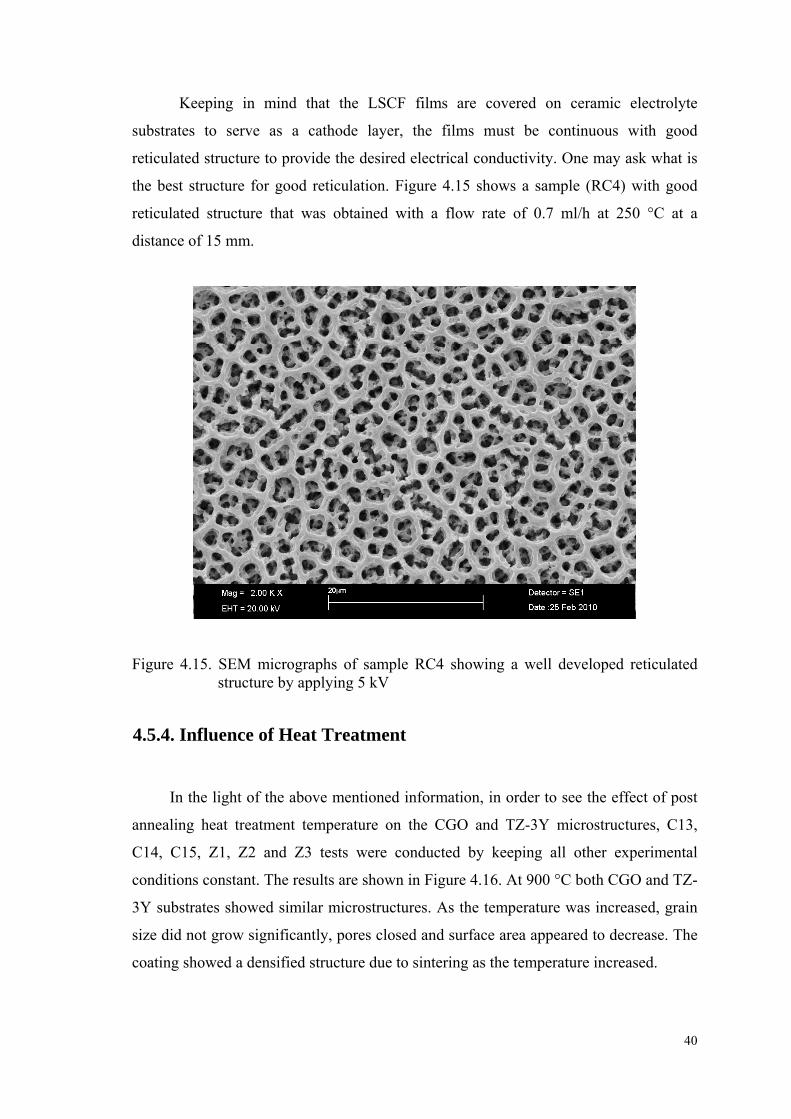
Keeping in mind that the LSCF films are covered on ceramic electrolyte
substrates to serve as a cathode layer, the films must be continuous with good
reticulated structure to provide the desired electrical conductivity. One may ask what is
the best structure for good reticulation. Figure 4.15 shows a sample (RC4) with good
reticulated structure that was obtained with a flow rate of 0.7 ml/h at 250 °C at a
distance of 15 mm.
Figure 4.15. SEM micrographs of sample RC4 showing a well developed reticulated structure by applying 5 kV
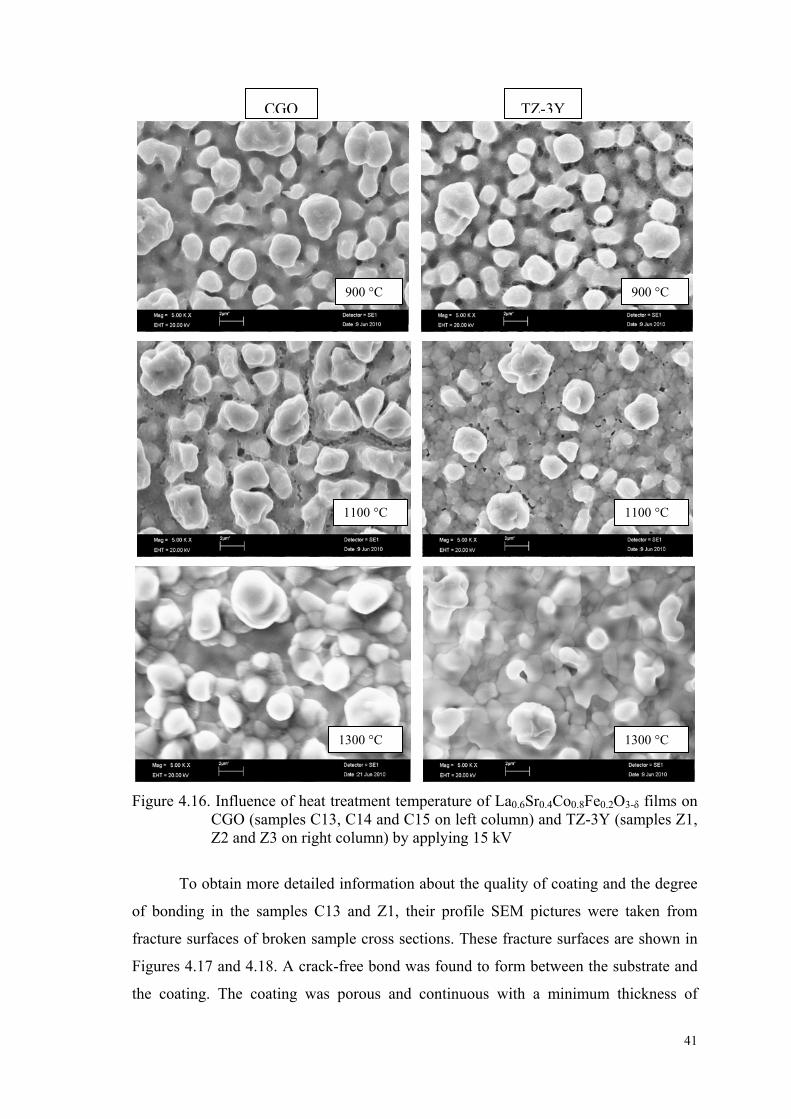
4.5.4. Influence of Heat Treatment
In the light of the above mentioned information, in order to see the effect of post
annealing heat treatment temperature on the CGO and TZ-3Y microstructures, C13,
C14, C15, Z1, Z2 and Z3 tests were conducted by keeping all other experimental
conditions constant. The results are shown in Figure 4.16. At 900 °C both CGO and TZ-
3Y substrates showed similar microstructures. As the temperature was increased, grain
size did not grow significantly, pores closed and surface area appeared to decrease. The
coating showed a densified structure due to sintering as the temperature increased.
41
Figure 4.16. Influence of heat treatment temperature of La0.6Sr0.4Co0.8Fe0.2O3-δ films on CGO (samples C13, C14 and C15 on left column) and TZ-3Y (samples Z1, Z2 and Z3 on right column) by applying 15 kV
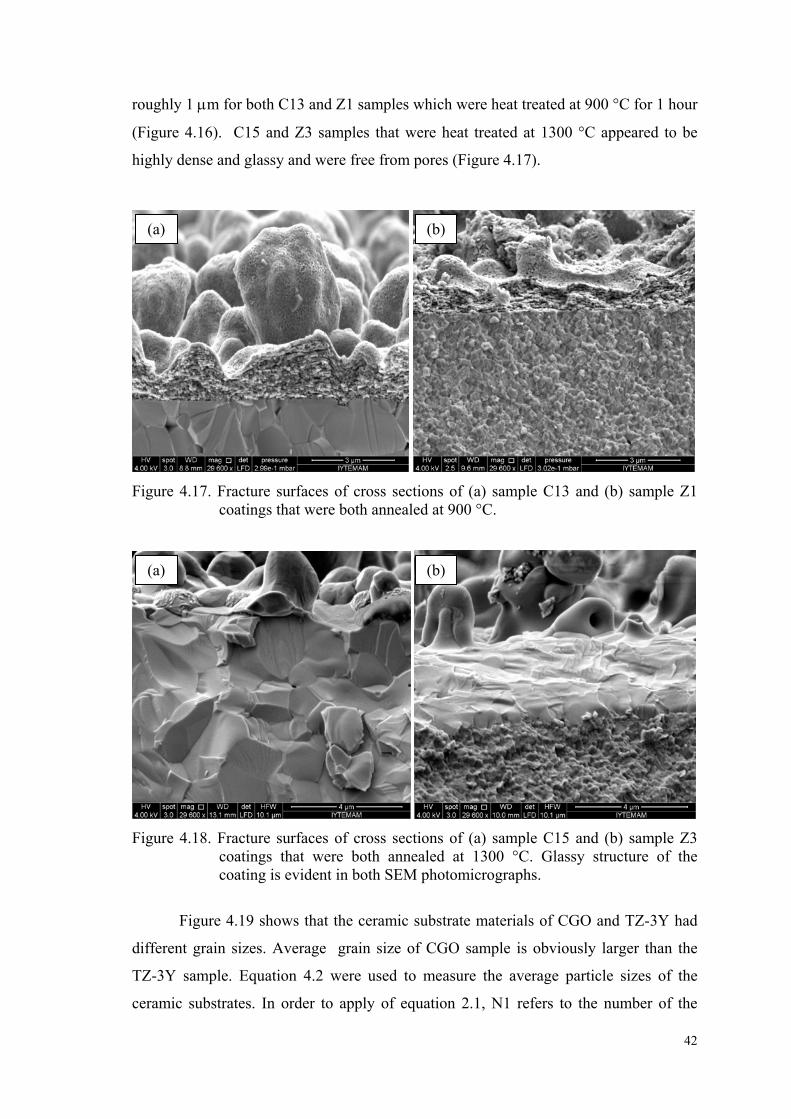
To obtain more detailed information about the quality of coating and the degree
of bonding in the samples C13 and Z1, their profile SEM pictures were taken from
fracture surfaces of broken sample cross sections. These fracture surfaces are shown in
Figures 4.17 and 4.18. A crack-free bond was found to form between the substrate and
the coating. The coating was porous and continuous with a minimum thickness of
CGO TZ-3Y
900 °C
1300 °C
1100 °C
900 °C
1100 °C
1300 °C
42
roughly 1 µm for both C13 and Z1 samples which were heat treated at 900 °C for 1 hour
(Figure 4.16). C15 and Z3 samples that were heat treated at 1300 °C appeared to be
highly dense and glassy and were free from pores (Figure 4.17).
Figure 4.17. Fracture surfaces of cross sections of (a) sample C13 and (b) sample Z1 coatings that were both annealed at 900 °C.
Figure 4.18. Fracture surfaces of cross sections of (a) sample C15 and (b) sample Z3 coatings that were both annealed at 1300 °C. Glassy structure of the coating is evident in both SEM photomicrographs.
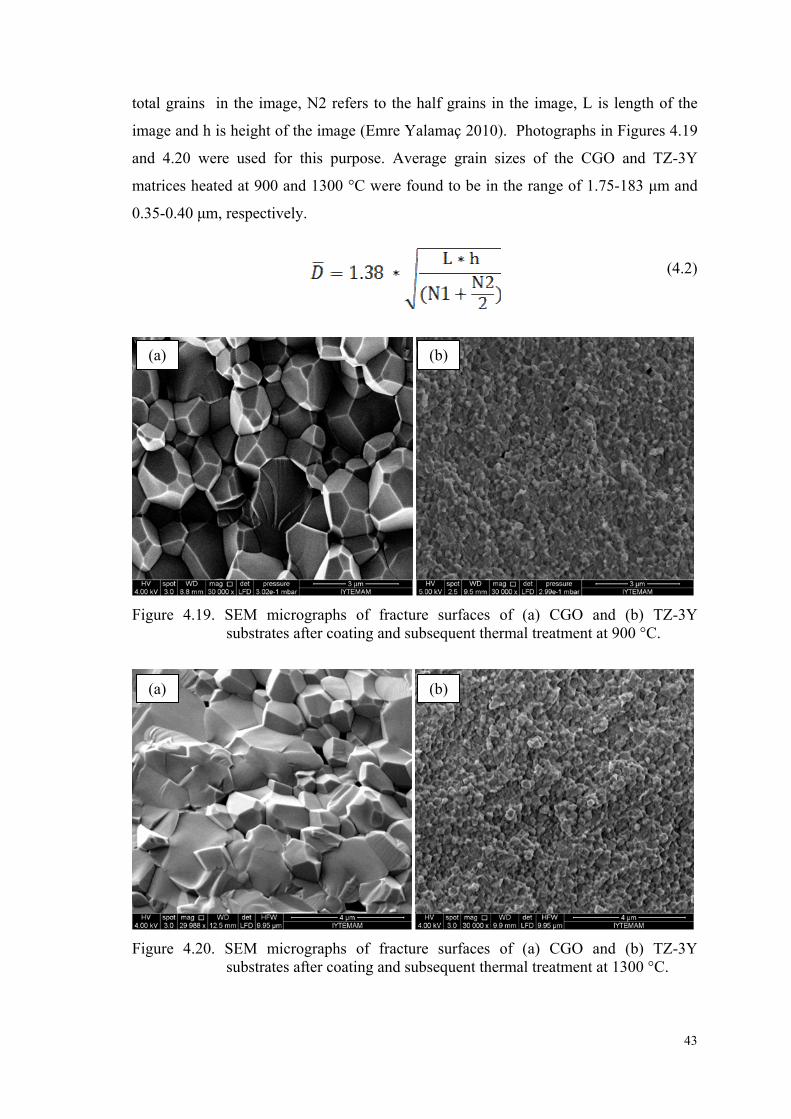
Figure 4.19 shows that the ceramic substrate materials of CGO and TZ-3Y had
different grain sizes. Average grain size of CGO sample is obviously larger than the
TZ-3Y sample. Equation 4.2 were used to measure the average particle sizes of the
ceramic substrates. In order to apply of equation 2.1, N1 refers to the number of the
(a) (b)
(a) (b)
43
total grains in the image, N2 refers to the half grains in the image, L is length of the
image and h is height of the image (Emre Yalamaç 2010). Photographs in Figures 4.19
and 4.20 were used for this purpose. Average grain sizes of the CGO and TZ-3Y
matrices heated at 900 and 1300 °C were found to be in the range of 1.75-183 µm and
0.35-0.40 µm, respectively.
(4.2)
Figure 4.19. SEM micrographs of fracture surfaces of (a) CGO and (b) TZ-3Y
substrates after coating and subsequent thermal treatment at 900 °C.
Figure 4.20. SEM micrographs of fracture surfaces of (a) CGO and (b) TZ-3Y
substrates after coating and subsequent thermal treatment at 1300 °C.
(a) (b)
(a) (b)
44
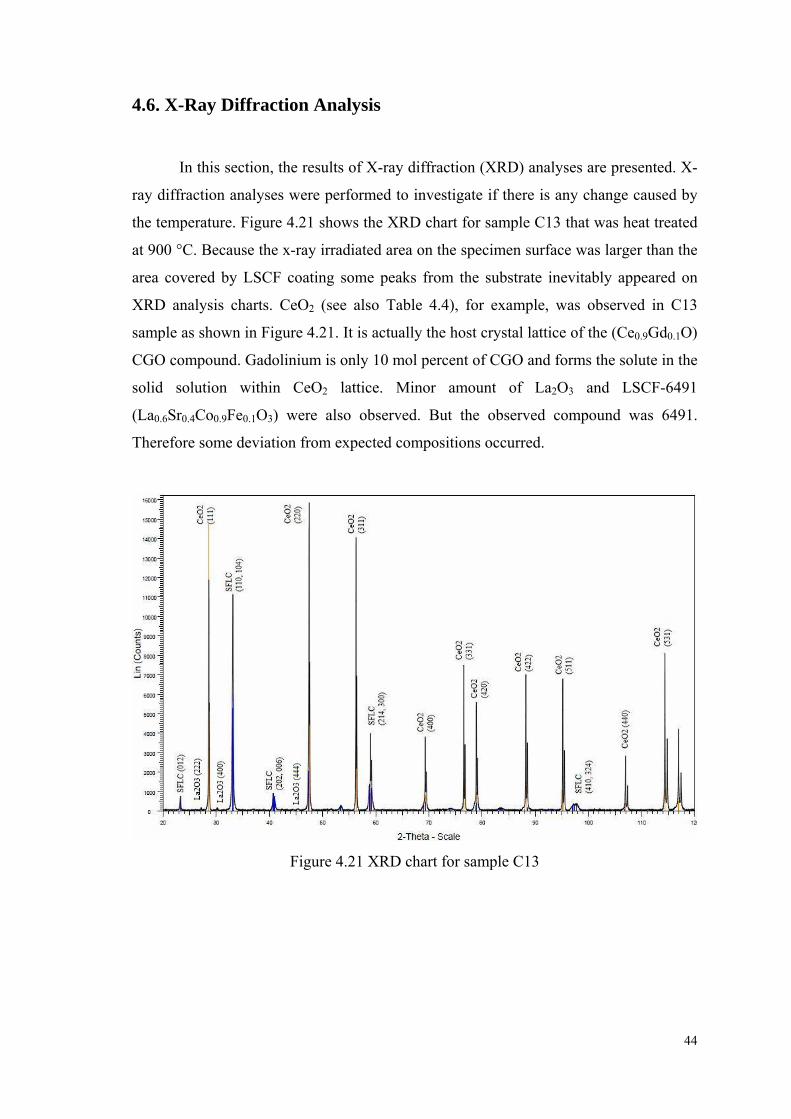
4.6. X-Ray Diffraction Analysis
In this section, the results of X-ray diffraction (XRD) analyses are presented. X-
ray diffraction analyses were performed to investigate if there is any change caused by
the temperature. Figure 4.21 shows the XRD chart for sample C13 that was heat treated
at 900 °C. Because the x-ray irradiated area on the specimen surface was larger than the
area covered by LSCF coating some peaks from the substrate inevitably appeared on
XRD analysis charts. CeO2 (see also Table 4.4), for example, was observed in C13
sample as shown in Figure 4.21. It is actually the host crystal lattice of the (Ce0.9Gd0.1O)
CGO compound. Gadolinium is only 10 mol percent of CGO and forms the solute in the
solid solution within CeO2 lattice. Minor amount of La2O3 and LSCF-6491
(La0.6Sr0.4Co0.9Fe0.1O3) were also observed. But the observed compound was 6491.
Therefore some deviation from expected compositions occurred.
Figure 4.21 XRD chart for sample C13
45
Table 4.4. Phases observed in XRD analysis and their reference card numbers
Compound code used in XRD chart peak labels Mineral composition JCPDS reference number
LSCF-6491 La0.6Sr0.4Co0.9Fe0.1O3 00-049-0283
CeO2 CeO2 34-0394
La2O3 La2O3 03-065-3185
LSCF-6482 La0.6Sr0.4Co0.8Fe0.2O3 00-048-0124
ZrO2 ZrO2 50-1089
LSC La0.5Sr0.5 (CoO3) 01-075-8571
SZO SrZrO3 04-001-7315
LZO La2(Zr2O7) 01-070-5602
LaO LaO 04-007-4019
LSCF-7337 La0.7Sr0.3Co0.3Fe0.7 01-089-1268
SLF Sr0.6La0.4FeO3 04-007-6519
LSC La0.6Sr0.4 (CoO3) 01-089-5717
In order to better understand the evolution of the phase composition in the
coating samples of CGO were analysed by high temperature XRD (HTXRD) device in
Lille University, France. In Figure 4.22, HTXRD analysis results for sample C13 is
given. It should be noted that the post heat treatment was not applied. Peaks from the
substrate are obviously observed to slightly shift left toward lower 2θ values. This was
expected because of expansion of the lattice as a result of higher atomic vibrations at
higher temperatures (Cullity 1974). Upon heating of the sample to 500°C and higher
LSCF was observed to form on the coating. At 1100 °C the peaks for LSCF were
stronger. In Figure 4.23, XRD analysis of the sample C15, which was heat treated at
1300 °C, is given. Peaks for LSCF-6482 were observed along with stronger peaks from
the CeO2 from the substrate (see Table 4.4 and Figure 4.23). The high temperature post
heat treatment transformed some of the phases and produced a dense microsctructure as
shown in Figure 4.17a. The XRD chart showed that the LSCF layer was not glassy but
dense and crystalline.
46
Figure 4.24 shows the XRD analysis result for sample Z1, which was made to
produce LSCF coating on TZ-3Y substrate. But the post heat treatment temperature was
900°C and some of the salts in the coating dissociated to produce an intermediate
compound La0.5Sr0.5 (CoO3). Apparently iron was not yet accommodated in the
structure to enable formation of LSCF. When the same sample was heated to 1300oC
after coating LSCF-7337 (La0.7Sr0.3Co0.3Fe0.7) as well as SZO (SrZrO3), LZO
(La2(Zr2O7) and LaO were observed in Figure 4.25. Notice that the LSCF was still not
the intended 6482 composition but a La and Fe-rich phase formed instead. While there
was no iron in Figure 4.24 in the LSC composition at 900oC heated sample, sample Z3
in Figure 4.26 was able to produce an Fe-rich LSCF compound. Sample Z1, for
example, contained CeO2 and LSC phases without much iron. When the same sample
was heated to 1300 °C (sample Z3) iron took part in the reaction and LSCF was
identified (Figure 4.25). Another significant observation from Figure 4.25 is that
zirconia stole some of the La and Sr and therefore an LSCF compound with 7337
stoichiometry formed instead of the desired 6482 compound. The substrate CGO, on the
other hand, was able to produce complete LSCF-6482 stoichiometry after 1300 °C heat
treatment (sample C15). A lower temperature heat treatment was insufficient to achieve
the desired stoichiometry (sample C13).
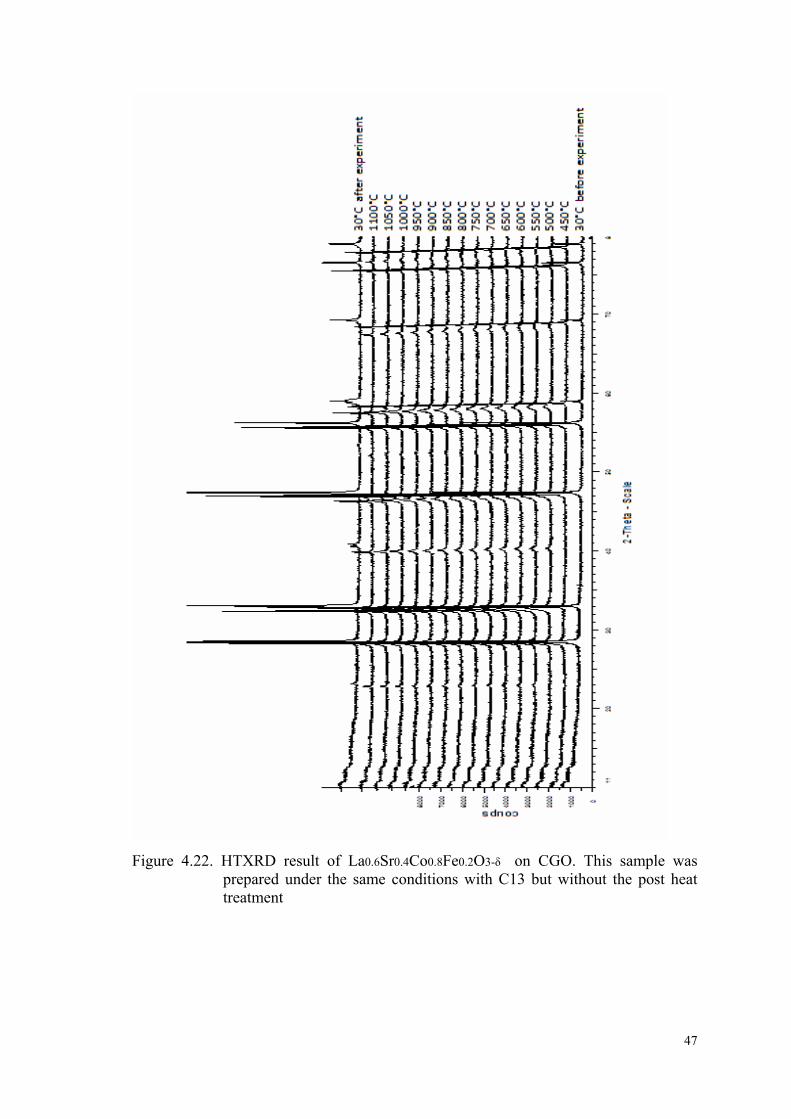
47
Figure 4.22. HTXRD result of La0.6Sr0.4Co0.8Fe0.2O3-δ on CGO. This sample was prepared under the same conditions with C13 but without the post heat treatment
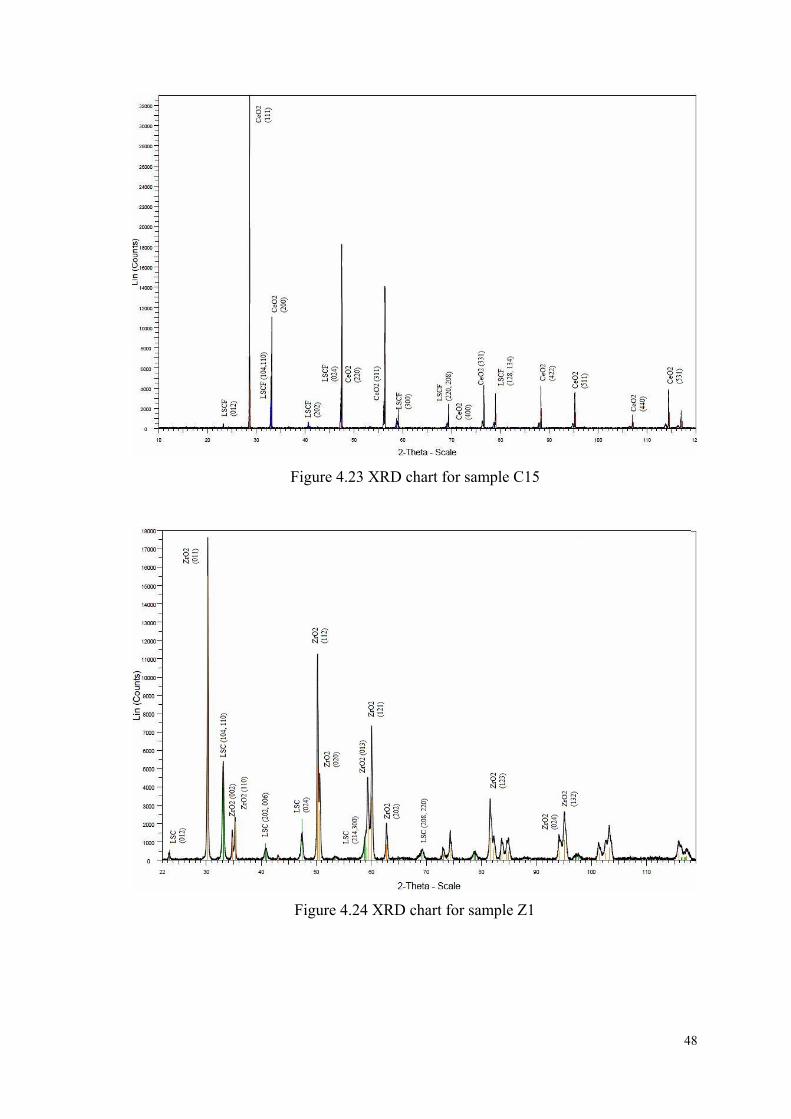
48
Figure 4.23 XRD chart for sample C15
Figure 4.24 XRD chart for sample Z1
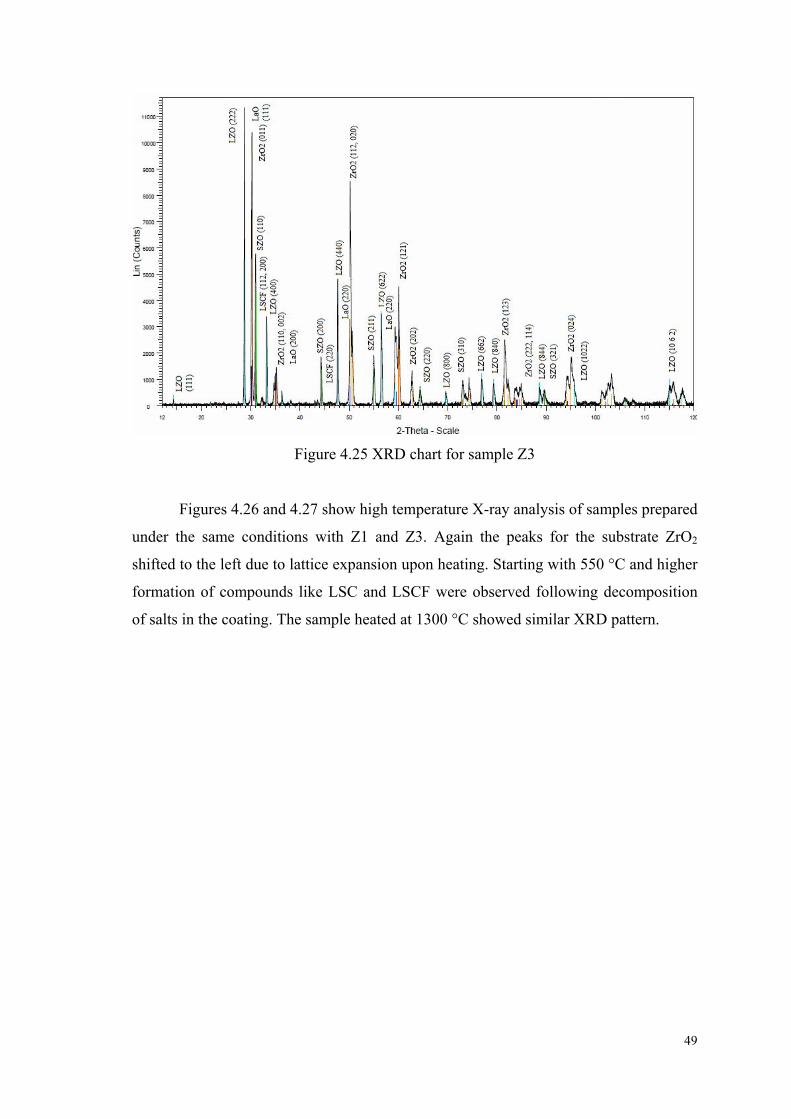
49
Figure 4.25 XRD chart for sample Z3
Figures 4.26 and 4.27 show high temperature X-ray analysis of samples prepared
under the same conditions with Z1 and Z3. Again the peaks for the substrate ZrO2
shifted to the left due to lattice expansion upon heating. Starting with 550 °C and higher
formation of compounds like LSC and LSCF were observed following decomposition
of salts in the coating. The sample heated at 1300 °C showed similar XRD pattern.
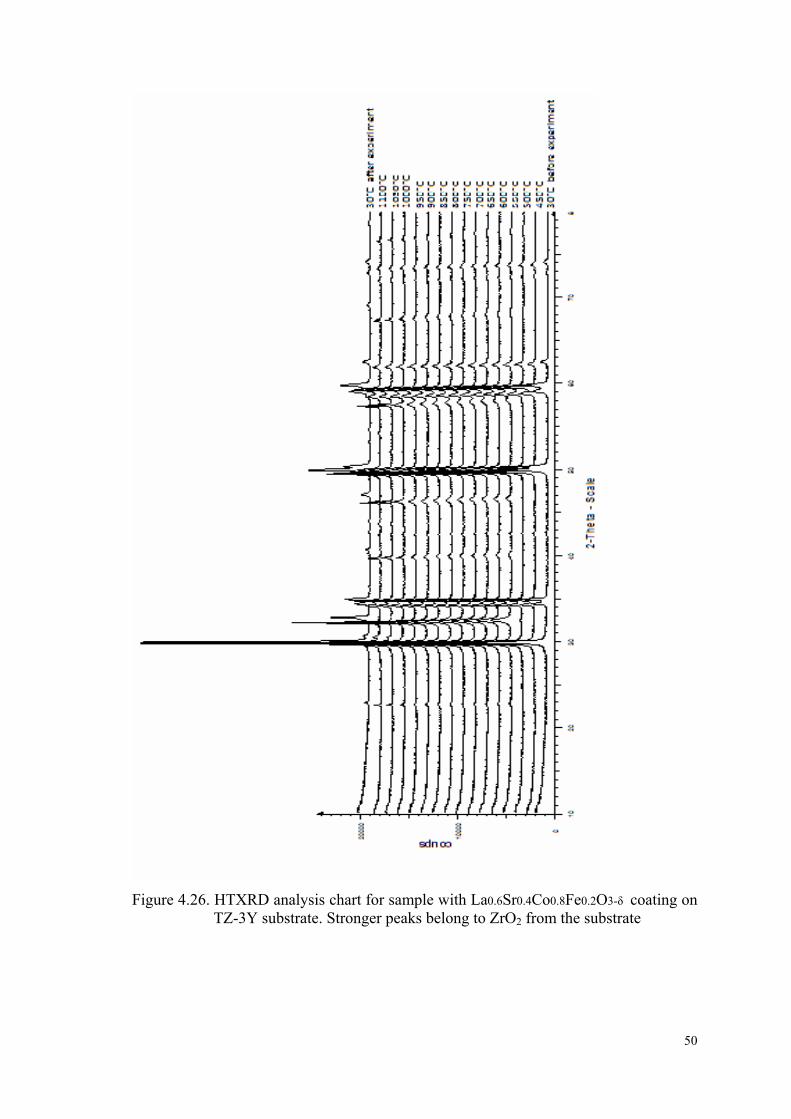
50
Figure 4.26. HTXRD analysis chart for sample with La0.6Sr0.4Co0.8Fe0.2O3-δ coating on TZ-3Y substrate. Stronger peaks belong to ZrO2 from the substrate
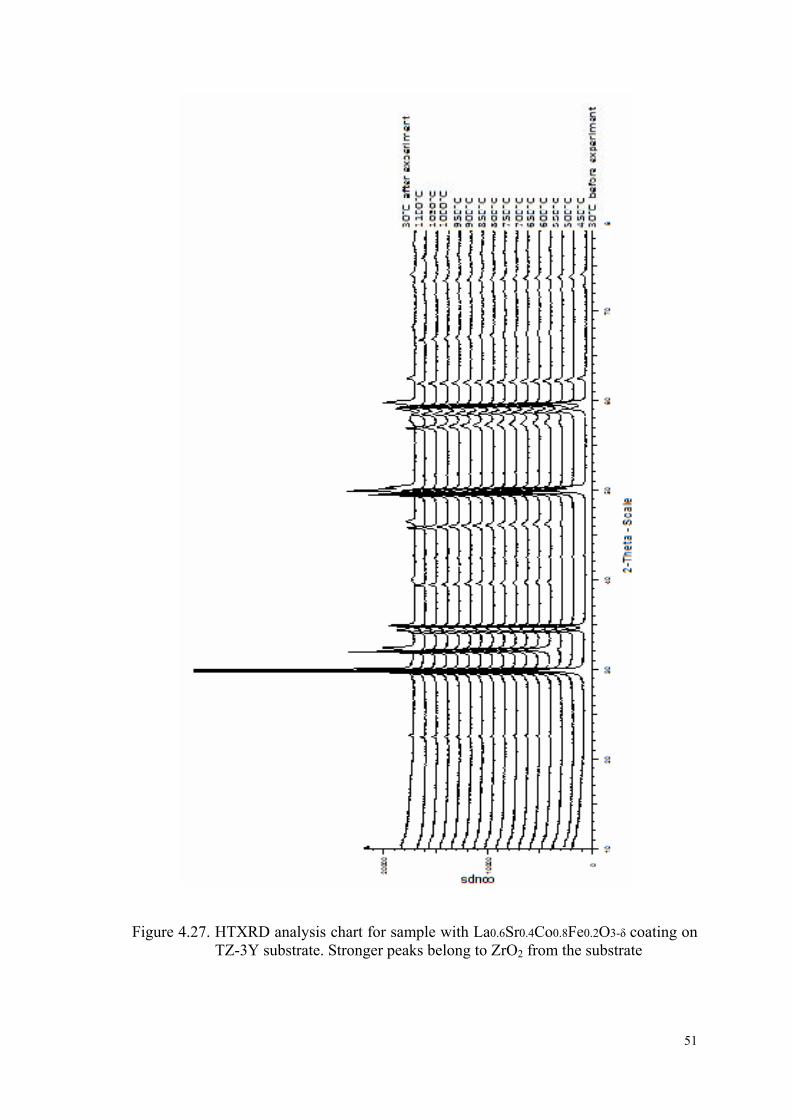
51
Figure 4.27. HTXRD analysis chart for sample with La0.6Sr0.4Co0.8Fe0.2O3-δ coating on TZ-3Y substrate. Stronger peaks belong to ZrO2 from the substrate
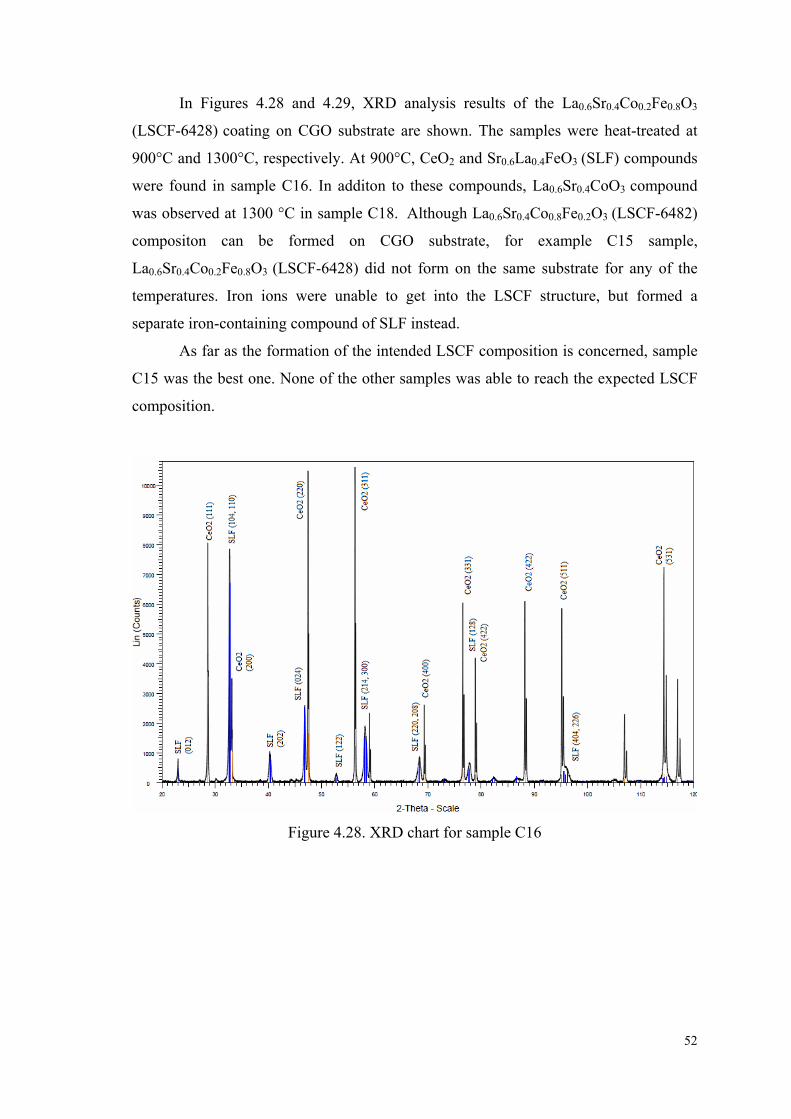
52
In Figures 4.28 and 4.29, XRD analysis results of the La0.6Sr0.4Co0.2Fe0.8O3
(LSCF-6428) coating on CGO substrate are shown. The samples were heat-treated at
900°C and 1300°C, respectively. At 900°C, CeO2 and Sr0.6La0.4FeO3 (SLF) compounds
were found in sample C16. In additon to these compounds, La0.6Sr0.4CoO3 compound
was observed at 1300 °C in sample C18. Although La0.6Sr0.4Co0.8Fe0.2O3 (LSCF-6482)
compositon can be formed on CGO substrate, for example C15 sample,
La0.6Sr0.4Co0.2Fe0.8O3 (LSCF-6428) did not form on the same substrate for any of the
temperatures. Iron ions were unable to get into the LSCF structure, but formed a
separate iron-containing compound of SLF instead.
As far as the formation of the intended LSCF composition is concerned, sample
C15 was the best one. None of the other samples was able to reach the expected LSCF
composition.
Figure 4.28. XRD chart for sample C16
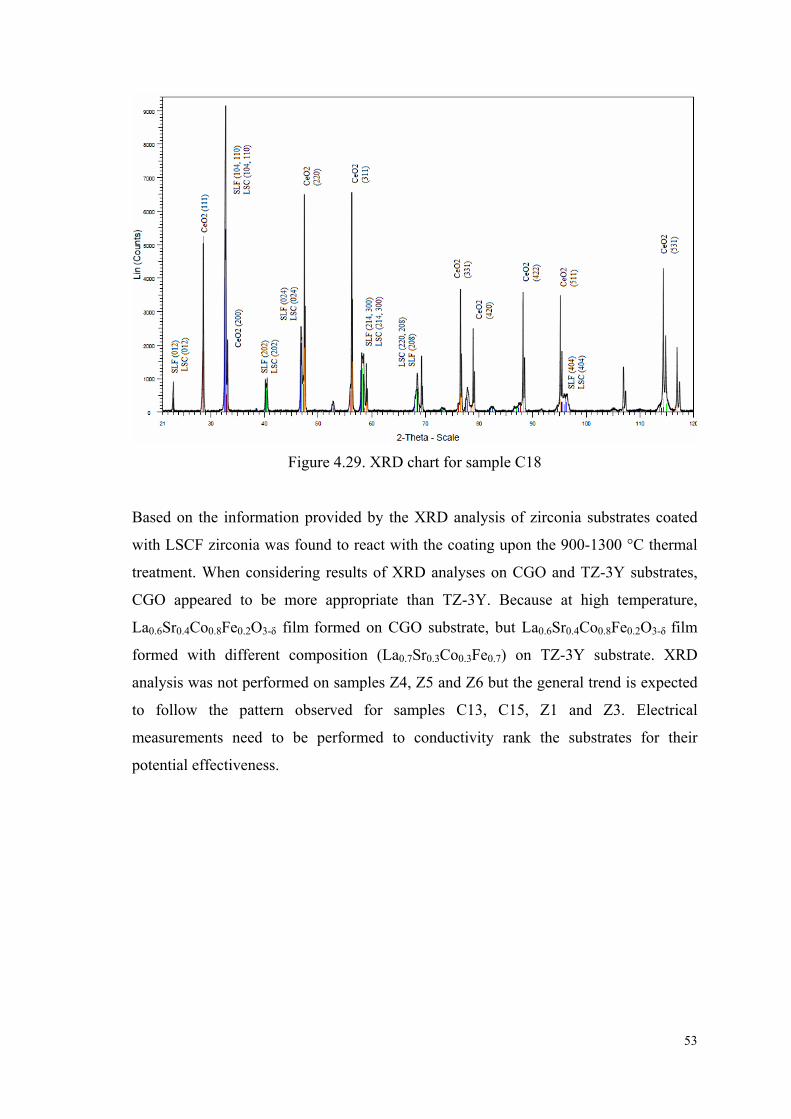
53
Figure 4.29. XRD chart for sample C18
Based on the information provided by the XRD analysis of zirconia substrates coated
with LSCF zirconia was found to react with the coating upon the 900-1300 °C thermal
treatment. When considering results of XRD analyses on CGO and TZ-3Y substrates,
CGO appeared to be more appropriate than TZ-3Y. Because at high temperature,
La0.6Sr0.4Co0.8Fe0.2O3-δ film formed on CGO substrate, but La0.6Sr0.4Co0.8Fe0.2O3-δ film
formed with different composition (La0.7Sr0.3Co0.3Fe0.7) on TZ-3Y substrate. XRD
analysis was not performed on samples Z4, Z5 and Z6 but the general trend is expected
to follow the pattern observed for samples C13, C15, Z1 and Z3. Electrical
measurements need to be performed to conductivity rank the substrates for their
potential effectiveness.
54
CHAPTER 5
CONCLUSIONS
LSCF coating on CGO and TZ-3Y substrates was successfully accomplished.
Initially, a solution with the correct stoichiometry for La0.6Sr0.4Co0.8Fe0.2O3-δ (LSCF-
6482) was prepared by dissolving mixtures of salts of La(NO3)3.6H2O, SrCl2.6H2O,
Fe(NO3)3.9H2O, Co(NO3)2.6H2O in ethanol-water or butyl carbitol-ethanol solvents.
Different compositions of solvent mixtures were tested. Electrical conductivities of the
solutions were also measured to make sure that the salts were completely dissolved. An
ESD (electrostatic spray deposition) setup was used to spray-coat the LSCF solutions on
heated substrates. The ceramic samples were found to be successfully coated with good
reticulated structure in most of the samples. Especially the samples coated at 15 mm
distance, 0.7 ml/h of flow rate and 250 °C of substrate heating temperature were
observed to be coated best. The coating layer was continuous over the surface of the
substrate with a minimum thickness of 1µm when they were post heat treated at 900 °C.
The substrate type did not make any difference on the coating structure. When this heat
treatment temperature was increased to 1300 °C the coating was found to have a fully
dense structure with no porosity. This dense structure was not amorphous but was
crystalline as determined by XRD to be largely composed of crystals of LSCF-6482.
TZ-3Y was found to react with the coating and to modify its composition to deviate
from LSCF-6482. CGO substrate appeared to be better in terms of compatibility with
the coating during thermal treatment step. Electrical measurements need to be done to
reach conclusions about the potential service performance of the system.
It is suggested that electrical conductivity measurements be done on the samples.
Another topic for potential future study is to study interface reactions between prepared
LSCF coating and the substrate on furnace heated samples instead of ESD coated
samples. Thermodynamic assessment of potential reactions between substrate and
coating must be done to obtain predictive information about the suitability of different
substrate and coating systems.
55
REFERENCES
Chen C. Thin Films Components For Lithium Ion Batteries. Ph.D. Delft University of
Technology, Netherlands, 1998.
EG&G Technical Services, Inc. Fuel Cell Handbook, 7th ed.; U.S. Department of
Energy Office of Fossil Energy National Energy Technology Laboratory, West
Virginia, 2004.
Hoogers G. Fuel Cell Technology Handbook, 2nd.; CRC Press, 2003.
ECN, Energy Research Centre of the Netherlands. http://www.ecn.nl (accessed 2010).
Huijmans J. P. P., Van Berkel F. P. F., Christie G.M. Intermediate Temperature SOFC-
a Promise For the 21st Century. Journal of Power Sources 1998, 71, 107-110.
Huijmans J. P. P. Ceramics In Solid Oxide Fuel Cells. Solid State & Materials
Science. 2001, 5, 317-323.
Ishihara T, Matsuda H. and Takita Y. Doped LaGaO3 Perovskite Type Oxide as a New
Oxide Ionic Conductor. J. American Chem. Soc., 1994, 116, 3801.
Jaworek A., Sobczyk A. T. Electrospraying Route to Nanotechnology: An overview
Journal of Electrostatics 2008, 66, 197-219.
Larminie J., Dicks A. Fuel Cell Systems Explained. John Wiley 2003.
Marinha D., Rossignol, C.; Djurado, E. Influence of Electrospraying Parameters on
the Microstructure of La0.6Sr0.4Co0.2Fe0.8O3-δ Films for SOFCs. Journal of Solid
State Chemistry 2009, 182, 1742-1748.
Minh N. Q., Takahashi T. Science and Technology of Ceramic Fuel Cells
Elsevier Science 1995.
56
Neagu R. Elaboration de Films Minces d’electrolyte par une Technique Innovative:
L’atomisation Electrostatique. Instıtut National Polytechnique de Grenoble
2005.
Neagu R., Perednis D., Princivalle A., Djurado E. Influence of The Process
Parameters on the ESD Synthesis of Thin Film YSZ Electrolyte. Solid State
Ionics 2006, 177, 1981-1984.
Nguyen T., Djurado E. Deposition and Characterization of Nanocrystalline
Tetragonal Zirconia Films Using Electrostatic Spray Deposition 2001, 138, 191-
197.
Nicolas J. D. Low Temperature Constrained Sintering of Cerium Gadolinium Oxide
for Solid Oxide Fuel Cell Applications 2007.
Petric A., Huang P., Tietz F. Evaluation of La- Sr-Co- Fe- O Perovskites for Solid
Oxide Fuel Cell and Gas Preparation. Solid State Ionics 2000, 135, 719-725.
Primdahl S., Sørensen B. F., Mogensen M. Effect of Nickel Oxide/ Yttria-
Stabilized Zirconia Anode Precursor Sintering Temperature on the Properties
of Solid Oxide Fuel Cells. Journal of American Ceramic Society 2000, 83, 489-
494.
Princivalle A., Perednis D., Neagu R. and Djurado E. Microstructural Investigations of
Nanostructured La(Sr)MnO3-δ Films Deposited by Electrostatic Spray
Deposition. Chem. Mater. 2004, 16, 3733-3739.
Ramani V. Fuel Cells. Electrochemical Society Interface 2006.
Rosa D. L., Massimiliano F. L., Monforte G., Antonucci V., Arico A. Comparison of
The Electrochemical Properties of Intermediate Temperature Solid Oxide Fuel
Cells Based on Protonic and Anionic Electrolytes. Journal Application
Electrochemistry 2009, 39, 477-483.
57
Sammes N. Fuel Cell Technology: Reaching Towards Commercialization.
Springer 2006.
Siefert W. Corona spray pyrolysis: A New Coating Technique with an Extremely
Enhanced Deposition Effciency. Thin Solid Films 1984, 120, 267–274.
Singhal S. C., Kendall K. High Temperature Solid Oxide Fuel Cells: Fundamentals,
Design and Application 2003.
Somiya S. Handbook of Advanced Ceramics. Ceramic Fuel Cells; Fleig J., Kreuer K.
D., Maier J.; Elsevier, 2003; Vol. 2.
Steele B. C. H. Materials for IT-SOFC Stacks 35 Years R&D: The Inevitability of
Gradualness. Solid State Ionics 2000, 134, 3-20.
Søcrensen B. Hydrogen and Fuel cells, illustrated ed.; Elsevier Academic Press 2005.
Taniguchi I., Landschoot R. C. V., Schoonman J. Fabrication of La1-xSrxCo1-yFeyO3
Thin Films by Electrostatic Spray Deposition 2003, 156, 1-13.
Tietz F., Mai A., Stöver D. From Powder Properties to Fuel Cell Performance- A
Holistic Approach for SOFC Cathode Development. Solid State Ionics 2008,
179, 1509-1515.
Venkatasubramanian V. Fuel Cells. Ph.D. Indian Institute of Technology, Madras,
India, 2003.
Tosoh Corporation, The Chemistry of Innovation, www.tosoh.com (accessed 2010).
Wilhelm O., Pratsinis S. E., Perednis D., Gauckler L. J. Electrospray and Pressurized
Spray Deposition of Yttria- Stabilized Zirconia Films 2005, 479, 121-129.
Yamamoto O, Arati Y, Takeda Y, Imanishi N, Mizutani Y, Kawai M and Nakamura Y.
Electrical Conductivity of Stabilized Zirconia with Ytterbia and Scandia Solid
State Ionics 1995, 79, 137–142.

58
Yashima M., Kamioka T. Neutron Diffraction Study of The Perovskite-type Lanthanum
Cobaltite La0.6Sr0.4Co0.8Fe0.2O3-δ at 1260 °C and 394 °C. Solid State Ionics 2008,
178, 1939-1943.
![Advanced Ceramics Progress Research Article · cerium oxide (Ce2O3) [10, 11]. In some cases, the tetragonal phase can be metastable. If quantities of the metastable tetragonal phase](https://static.fdocument.org/doc/165x107/60643817275b9976cf6d2768/advanced-ceramics-progress-research-cerium-oxide-ce2o3-10-11-in-some-cases.jpg)