City of Revelstoke 2015-2019 Financial Plan
28
F P F Fina Plan February 16, 2 anci n 2015 ial φτ τυω‐ ‐φτ τυύ City Rev y of velstoke e
-
Upload
alexcooperrtr -
Category
Documents
-
view
561 -
download
1
description
The City of Revelstoke 2015-19 draft financial plan.
Transcript of City of Revelstoke 2015-2019 Financial Plan
FPF
FinaPlanFebruary 16, 2
ancin2015
ial
‐‐ CityRevyofvelstokee
2015‐2019FinancialPlan
i
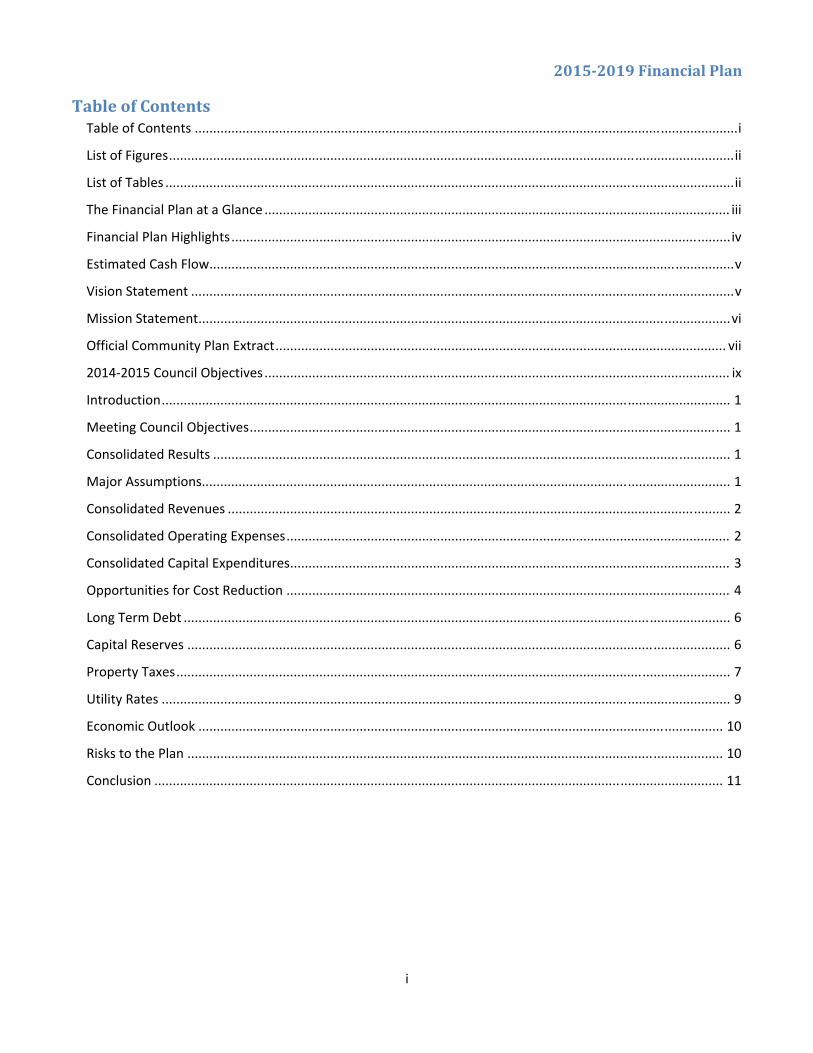
TableofContentsTable of Contents .................................................................................................................................................... i
List of Figures .......................................................................................................................................................... ii
List of Tables ........................................................................................................................................................... ii
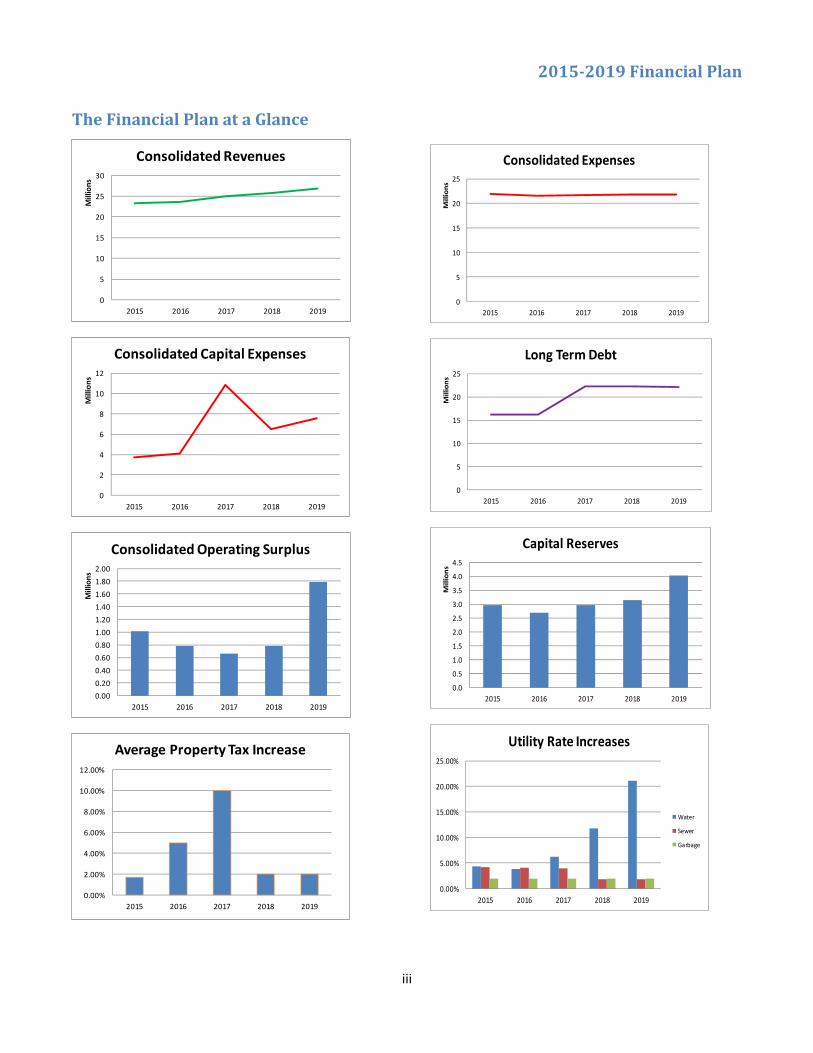
The Financial Plan at a Glance ............................................................................................................................... iii
Financial Plan Highlights ........................................................................................................................................ iv
Estimated Cash Flow ............................................................................................................................................... v
Vision Statement .................................................................................................................................................... v
Mission Statement ................................................................................................................................................. vi
Official Community Plan Extract ........................................................................................................................... vii
2014‐2015 Council Objectives ............................................................................................................................... ix
Introduction ........................................................................................................................................................... 1
Meeting Council Objectives ................................................................................................................................... 1
Consolidated Results ............................................................................................................................................. 1
Major Assumptions................................................................................................................................................ 1
Consolidated Revenues ......................................................................................................................................... 2
Consolidated Operating Expenses ......................................................................................................................... 2
Consolidated Capital Expenditures ........................................................................................................................ 3
Opportunities for Cost Reduction ......................................................................................................................... 4
Long Term Debt ..................................................................................................................................................... 6
Capital Reserves .................................................................................................................................................... 6
Property Taxes ....................................................................................................................................................... 7
Utility Rates ........................................................................................................................................................... 9
Economic Outlook ............................................................................................................................................... 10
Risks to the Plan .................................................................................................................................................. 10
Conclusion ........................................................................................................................................................... 11
2015‐2019FinancialPlan
ii
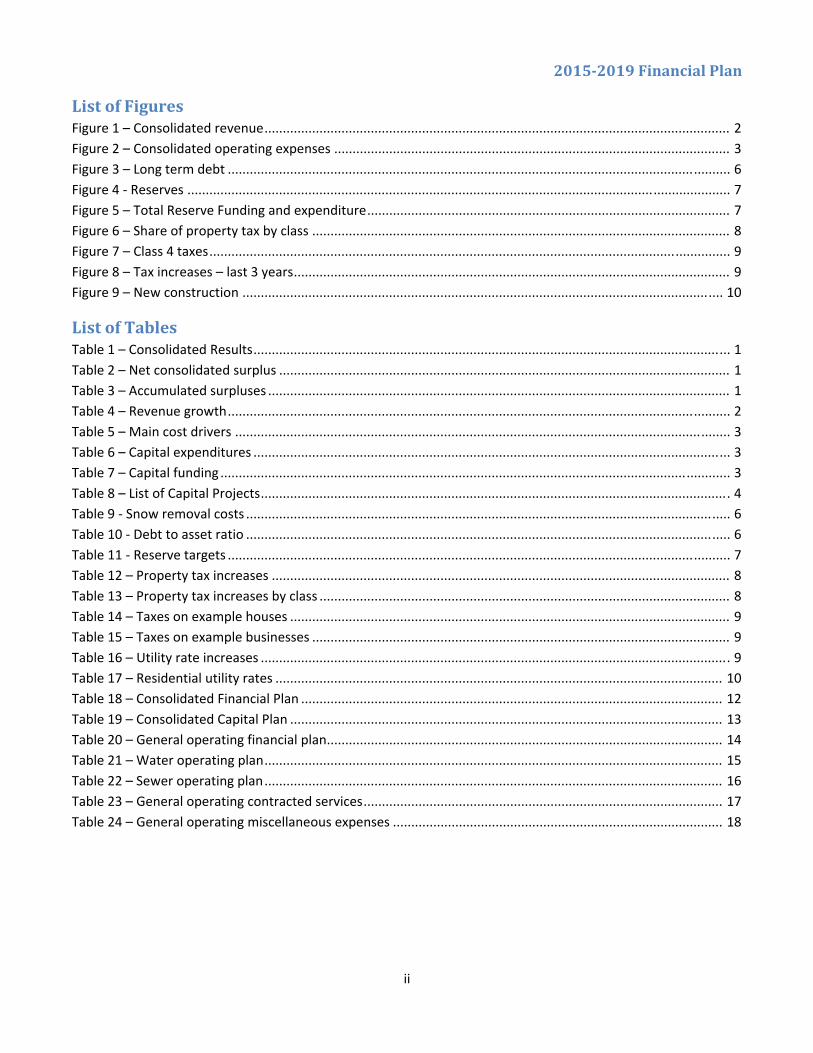
ListofFiguresFigure 1 – Consolidated revenue ............................................................................................................................... 2
Figure 2 – Consolidated operating expenses ............................................................................................................ 3
Figure 3 – Long term debt ......................................................................................................................................... 6
Figure 4 ‐ Reserves .................................................................................................................................................... 7
Figure 5 – Total Reserve Funding and expenditure ................................................................................................... 7
Figure 6 – Share of property tax by class .................................................................................................................. 8
Figure 7 – Class 4 taxes .............................................................................................................................................. 9
Figure 8 – Tax increases – last 3 years ....................................................................................................................... 9
Figure 9 – New construction ................................................................................................................................... 10
ListofTablesTable 1 – Consolidated Results .................................................................................................................................. 1
Table 2 – Net consolidated surplus ........................................................................................................................... 1
Table 3 – Accumulated surpluses .............................................................................................................................. 1
Table 4 – Revenue growth ......................................................................................................................................... 2
Table 5 – Main cost drivers ....................................................................................................................................... 3
Table 6 – Capital expenditures .................................................................................................................................. 3
Table 7 – Capital funding ........................................................................................................................................... 3
Table 8 – List of Capital Projects ................................................................................................................................ 4
Table 9 ‐ Snow removal costs .................................................................................................................................... 6
Table 10 ‐ Debt to asset ratio .................................................................................................................................... 6
Table 11 ‐ Reserve targets ......................................................................................................................................... 7
Table 12 – Property tax increases ............................................................................................................................. 8
Table 13 – Property tax increases by class ................................................................................................................ 8
Table 14 – Taxes on example houses ........................................................................................................................ 9
Table 15 – Taxes on example businesses .................................................................................................................. 9
Table 16 – Utility rate increases ................................................................................................................................ 9
Table 17 – Residential utility rates .......................................................................................................................... 10
Table 18 – Consolidated Financial Plan ................................................................................................................... 12
Table 19 – Consolidated Capital Plan ...................................................................................................................... 13
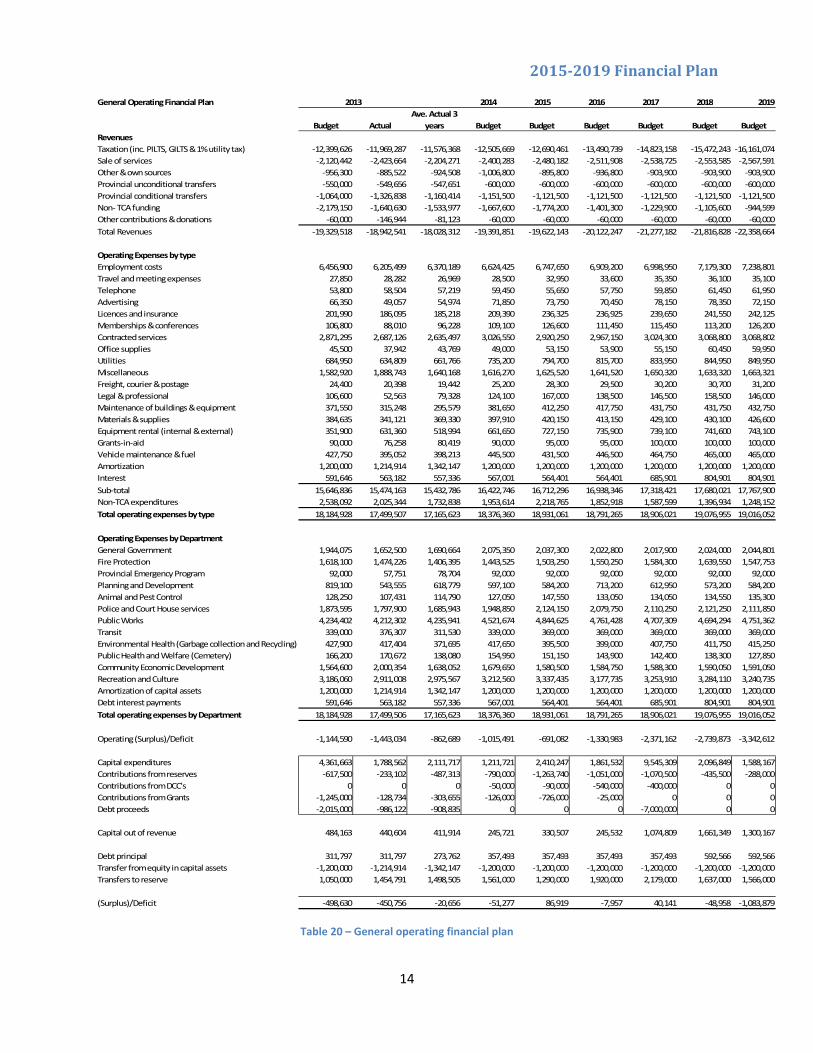
Table 20 – General operating financial plan ............................................................................................................ 14
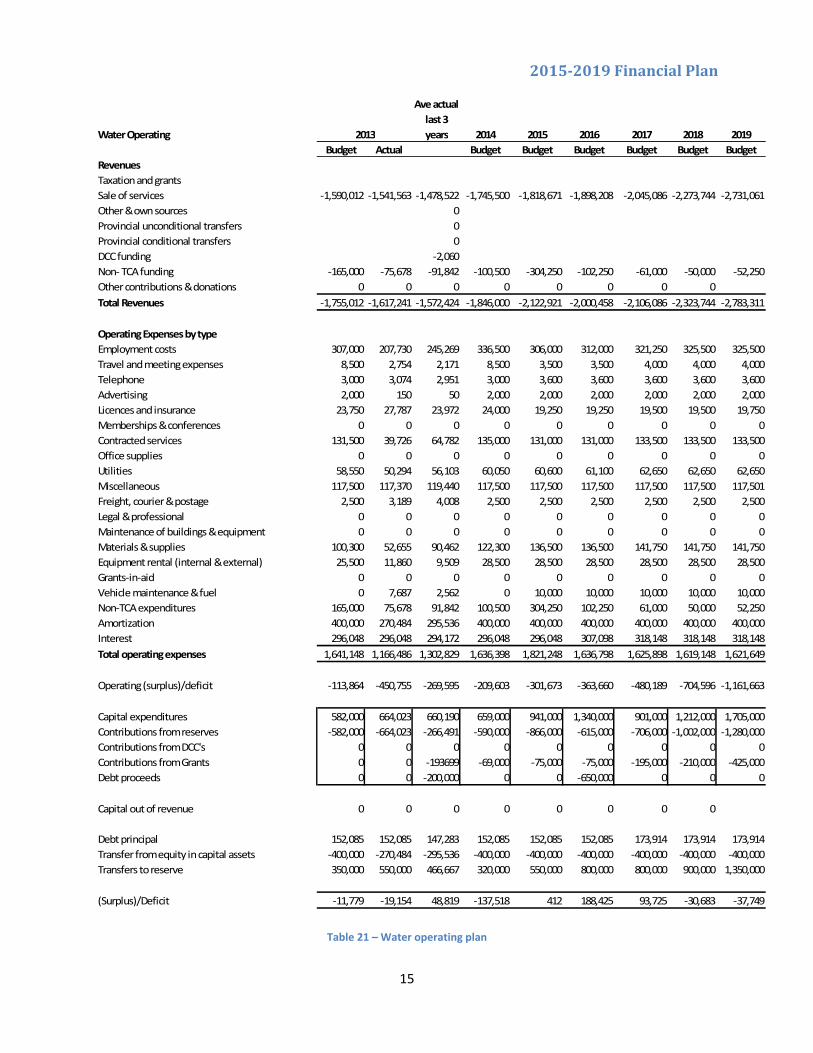
Table 21 – Water operating plan ............................................................................................................................. 15
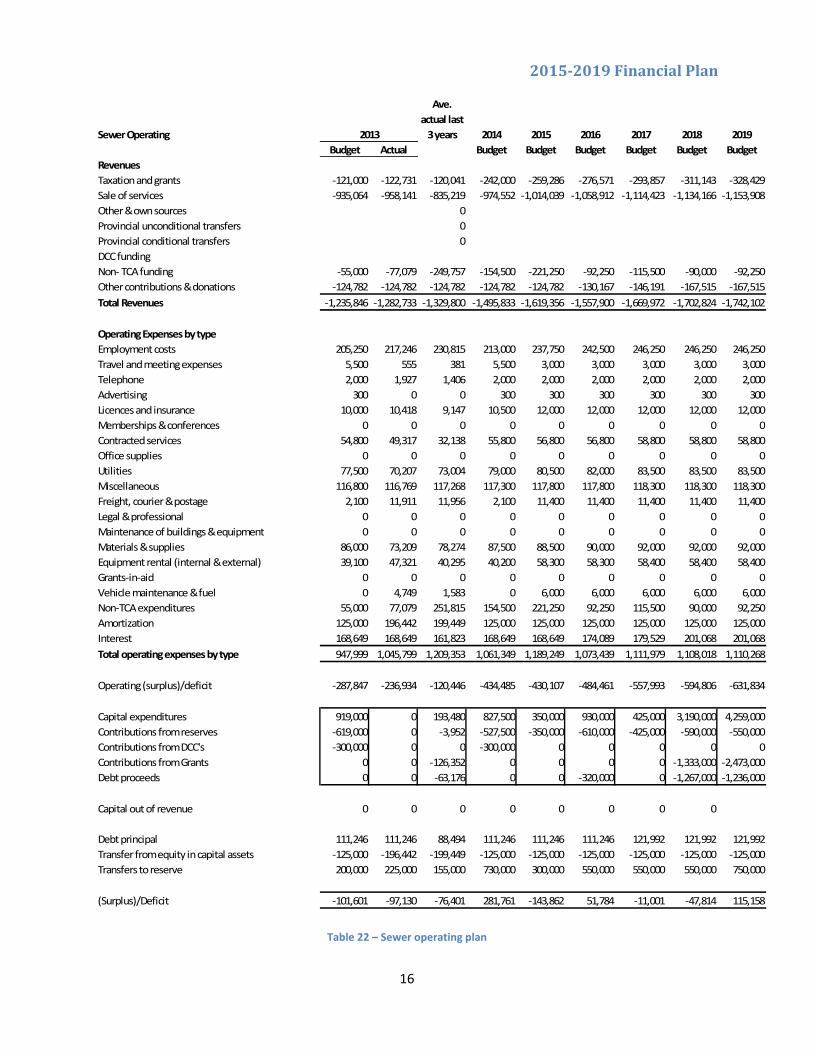
Table 22 – Sewer operating plan ............................................................................................................................. 16
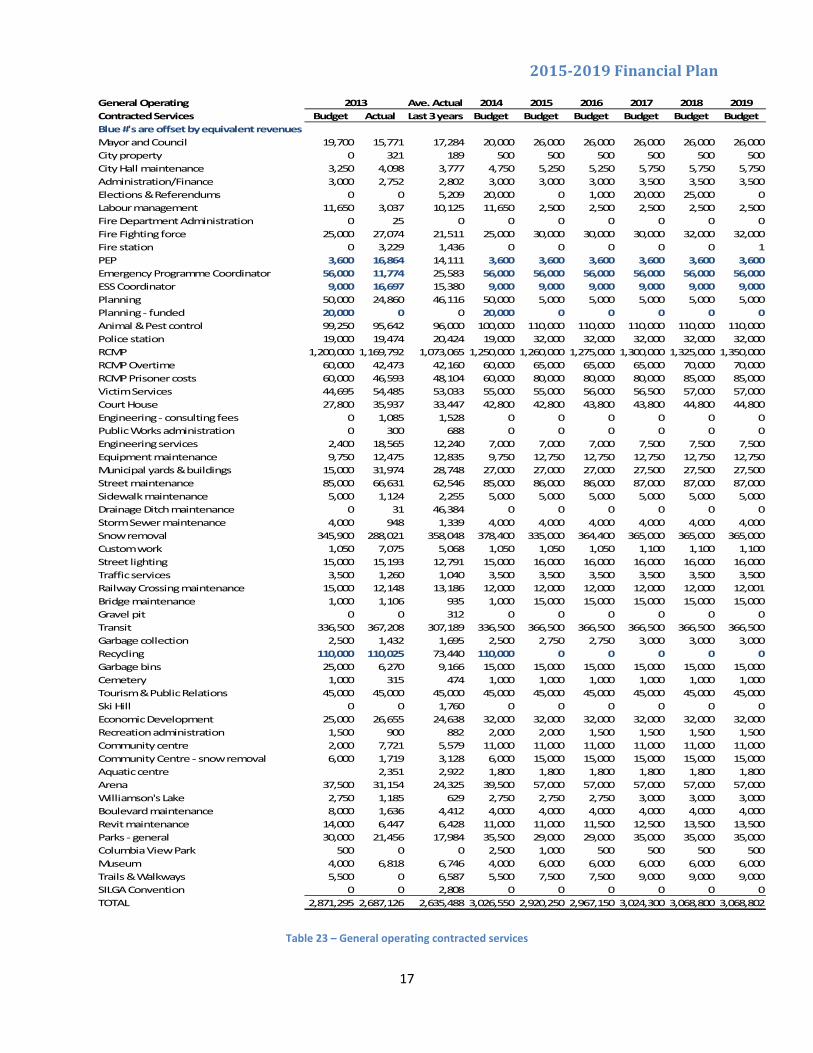
Table 23 – General operating contracted services .................................................................................................. 17
Table 24 – General operating miscellaneous expenses .......................................................................................... 18
2015‐2019FinancialPlan
iii
TheFinancialPlanataGlance
0
5
10
15
20
25
30
2015 2016 2017 2018 2019
Millions
Consolidated Revenues
0
2
4
6
8
10
12
2015 2016 2017 2018 2019
Millions
Consolidated Capital Expenses
0.00
0.20
0.40
0.60
0.80
1.00
1.20
1.40
1.60
1.80
2.00
2015 2016 2017 2018 2019
Millions
Consolidated Operating Surplus
0.00%
2.00%
4.00%
6.00%
8.00%
10.00%
12.00%
2015 2016 2017 2018 2019
Average Property Tax Increase
0
5
10
15
20
25
2015 2016 2017 2018 2019
Millions
Consolidated Expenses
0
5
10
15
20
25
2015 2016 2017 2018 2019
Millions
Long Term Debt
0.0
0.5
1.0
1.5
2.0
2.5
3.0
3.5
4.0
4.5
2015 2016 2017 2018 2019
Millions
Capital Reserves
0.00%
5.00%
10.00%
15.00%
20.00%
25.00%
2015 2016 2017 2018 2019
Utility Rate Increases
Water
Sewer
Garbage
2015‐2019FinancialPlan
iv
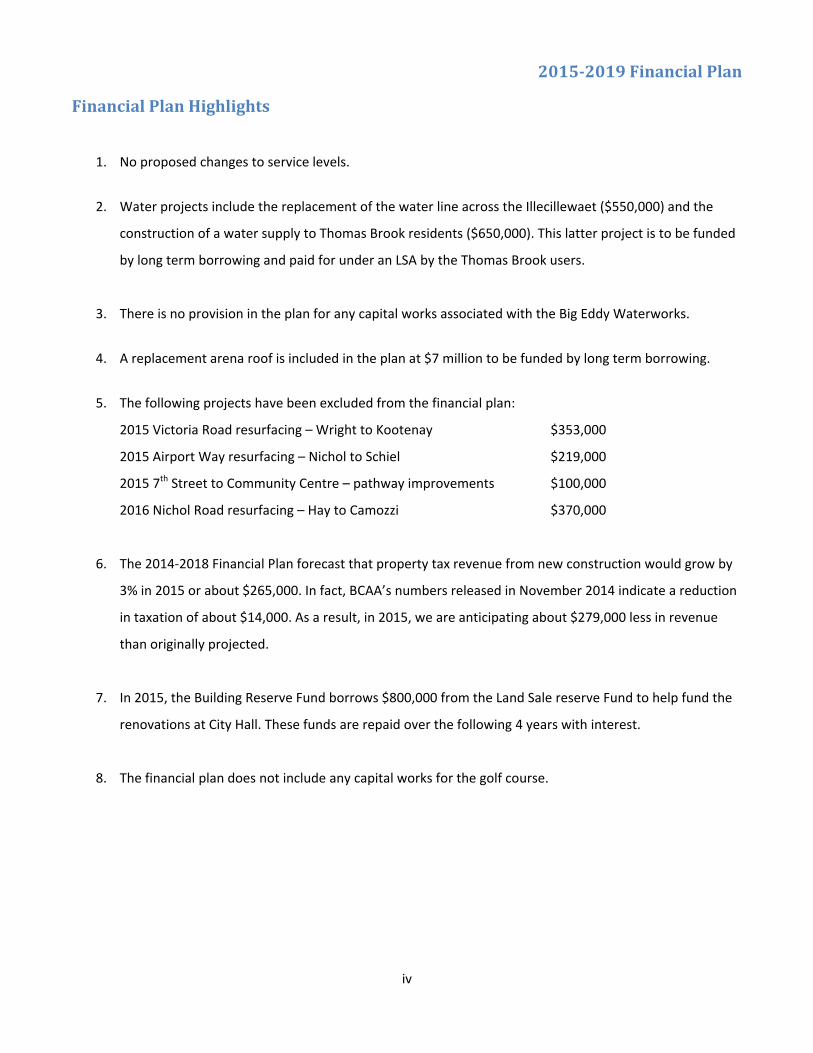
FinancialPlanHighlights
1. No proposed changes to service levels.
2. Water projects include the replacement of the water line across the Illecillewaet ($550,000) and the
construction of a water supply to Thomas Brook residents ($650,000). This latter project is to be funded
by long term borrowing and paid for under an LSA by the Thomas Brook users.
3. There is no provision in the plan for any capital works associated with the Big Eddy Waterworks.
4. A replacement arena roof is included in the plan at $7 million to be funded by long term borrowing.
5. The following projects have been excluded from the financial plan:
2015 Victoria Road resurfacing – Wright to Kootenay $353,000
2015 Airport Way resurfacing – Nichol to Schiel $219,000
2015 7th Street to Community Centre – pathway improvements $100,000
2016 Nichol Road resurfacing – Hay to Camozzi $370,000
6. The 2014‐2018 Financial Plan forecast that property tax revenue from new construction would grow by
3% in 2015 or about $265,000. In fact, BCAA’s numbers released in November 2014 indicate a reduction
in taxation of about $14,000. As a result, in 2015, we are anticipating about $279,000 less in revenue
than originally projected.
7. In 2015, the Building Reserve Fund borrows $800,000 from the Land Sale reserve Fund to help fund the
renovations at City Hall. These funds are repaid over the following 4 years with interest.
8. The financial plan does not include any capital works for the golf course.
2015‐2019FinancialPlan
v
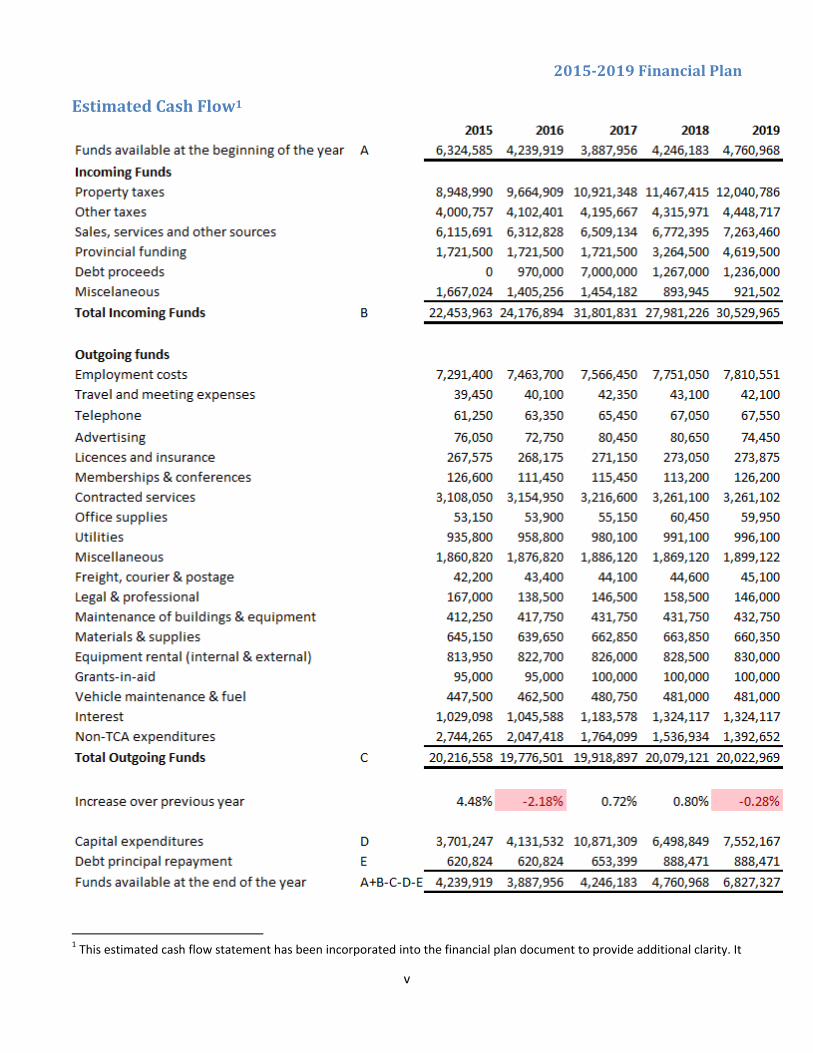
EstimatedCashFlow1
1 This estimated cash flow statement has been incorporated into the financial plan document to provide additional clarity. It
2015‐2019FinancialPlan
vi
VisionStatementRevelstoke will be a leader in achieving a sustainable community by balancing environmental, social and
economic values within a local, regional and global context. Building on its rich heritage and natural beauty, this
historic mountain community will pursue quality and excellence.
Revelstoke will be seen as vibrant, healthy, clean, hospitable, resilient and forward thinking. It will be
committed to exercising its rights with respect to decisions affecting the North Columbia Mountain Region.
Community priorities include: opportunities for youth; economic growth and stability; environmental
citizenship; personal safety and security; a responsible and caring social support system; a first‐class education
system; local access to life‐long learning; spiritual and cultural values; and diverse forms of recreation. All
residents and visitors shall have access to the opportunities afforded by this community.
MissionStatementOur mission is to provide optimum quality services and security to our community and our visitors, in a fiscally
responsible manner.
We will endeavor to provide cooperative, well‐informed and innovative leadership in order to sustain our
uniquely superior quality of life.
We are committed to fostering a strong sense of community in Revelstoke, and we will be responsive and
adaptive to changing social, political and economical conditions.
does not meet the regulatory requirements of PSAB or the province for financial plan presentation. Please refer to Table 18 for the actual consolidated financial plan.
2015‐2019FinancialPlan
vii
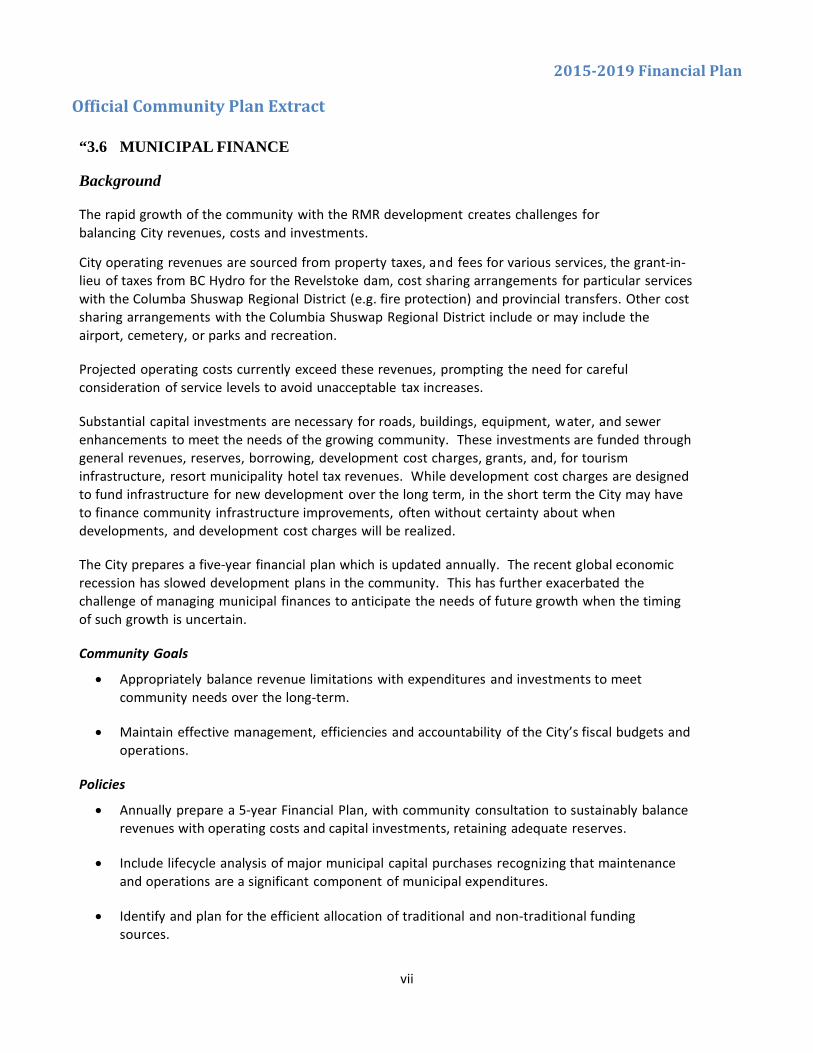
OfficialCommunityPlanExtract “3.6 MUNICIPAL FINANCE
Background
The rapid growth of the community with the RMR development creates challenges for
balancing City revenues, costs and investments. City operating revenues are sourced from property taxes, and fees for various services, the grant‐in‐lieu of taxes from BC Hydro for the Revelstoke dam, cost sharing arrangements for particular services
with the Columba Shuswap Regional District (e.g. fire protection) and provincial transfers. Other cost sharing arrangements with the Columbia Shuswap Regional District include or may include the
airport, cemetery, or parks and recreation. Projected operating costs currently exceed these revenues, prompting the need for careful consideration of service levels to avoid unacceptable tax increases.
Substantial capital investments are necessary for roads, buildings, equipment, water, and sewer
enhancements to meet the needs of the growing community. These investments are funded through general revenues, reserves, borrowing, development cost charges, grants, and, for tourism
infrastructure, resort municipality hotel tax revenues. While development cost charges are designed to fund infrastructure for new development over the long term, in the short term the City may have
to finance community infrastructure improvements, often without certainty about when developments, and development cost charges will be realized.
The City prepares a five‐year financial plan which is updated annually. The recent global economic
recession has slowed development plans in the community. This has further exacerbated the challenge of managing municipal finances to anticipate the needs of future growth when the timing
of such growth is uncertain. Community Goals
Appropriately balance revenue limitations with expenditures and investments to meet
community needs over the long‐term.
Maintain effective management, efficiencies and accountability of the City’s fiscal budgets and operations.
Policies
Annually prepare a 5‐year Financial Plan, with community consultation to sustainably balance
revenues with operating costs and capital investments, retaining adequate reserves.
Include lifecycle analysis of major municipal capital purchases recognizing that maintenance
and operations are a significant component of municipal expenditures.
Identify and plan for the efficient allocation of traditional and non‐traditional funding sources.
2015‐2019FinancialPlan
viii
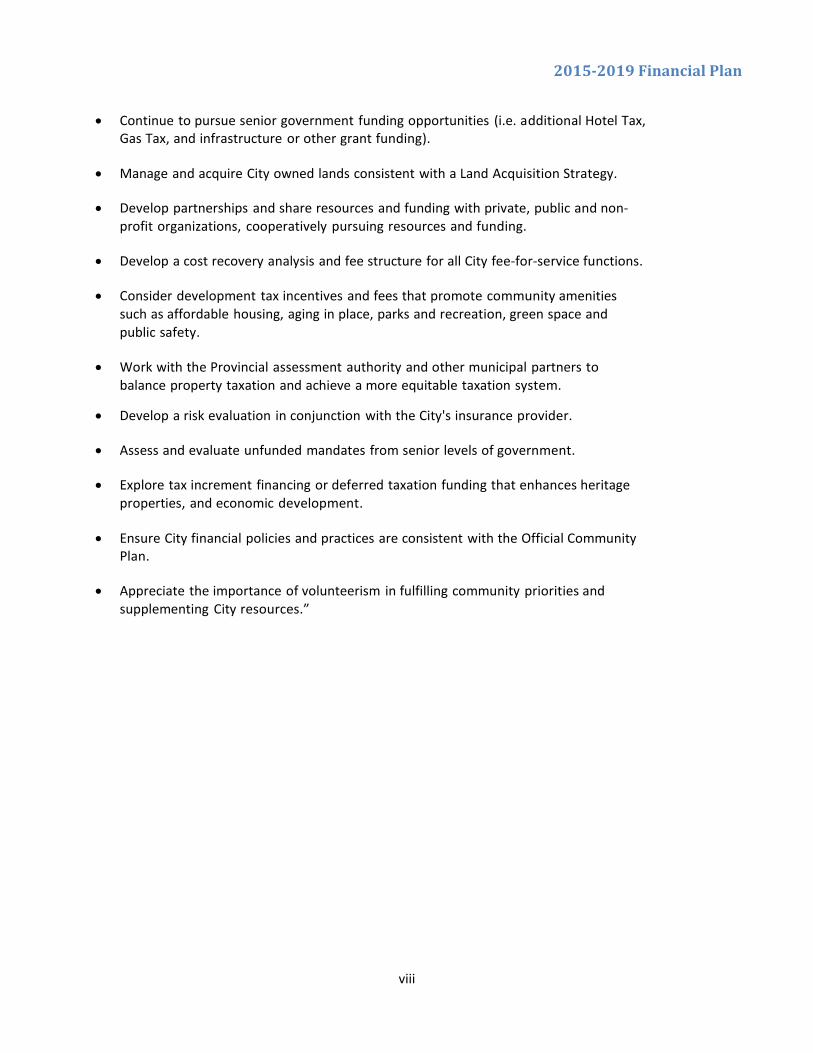
Continue to pursue senior government funding opportunities (i.e. additional Hotel Tax,
Gas Tax, and infrastructure or other grant funding).
Manage and acquire City owned lands consistent with a Land Acquisition Strategy.
Develop partnerships and share resources and funding with private, public and non‐profit organizations, cooperatively pursuing resources and funding.
Develop a cost recovery analysis and fee structure for all City fee‐for‐service functions.
Consider development tax incentives and fees that promote community amenities
such as affordable housing, aging in place, parks and recreation, green space and
public safety.
Work with the Provincial assessment authority and other municipal partners to balance property taxation and achieve a more equitable taxation system.
Develop a risk evaluation in conjunction with the City's insurance provider.
Assess and evaluate unfunded mandates from senior levels of government.
Explore tax increment financing or deferred taxation funding that enhances heritage
properties, and economic development.
Ensure City financial policies and practices are consistent with the Official Community Plan.
Appreciate the importance of volunteerism in fulfilling community priorities and
supplementing City resources.”
2015‐2019FinancialPlan
ix
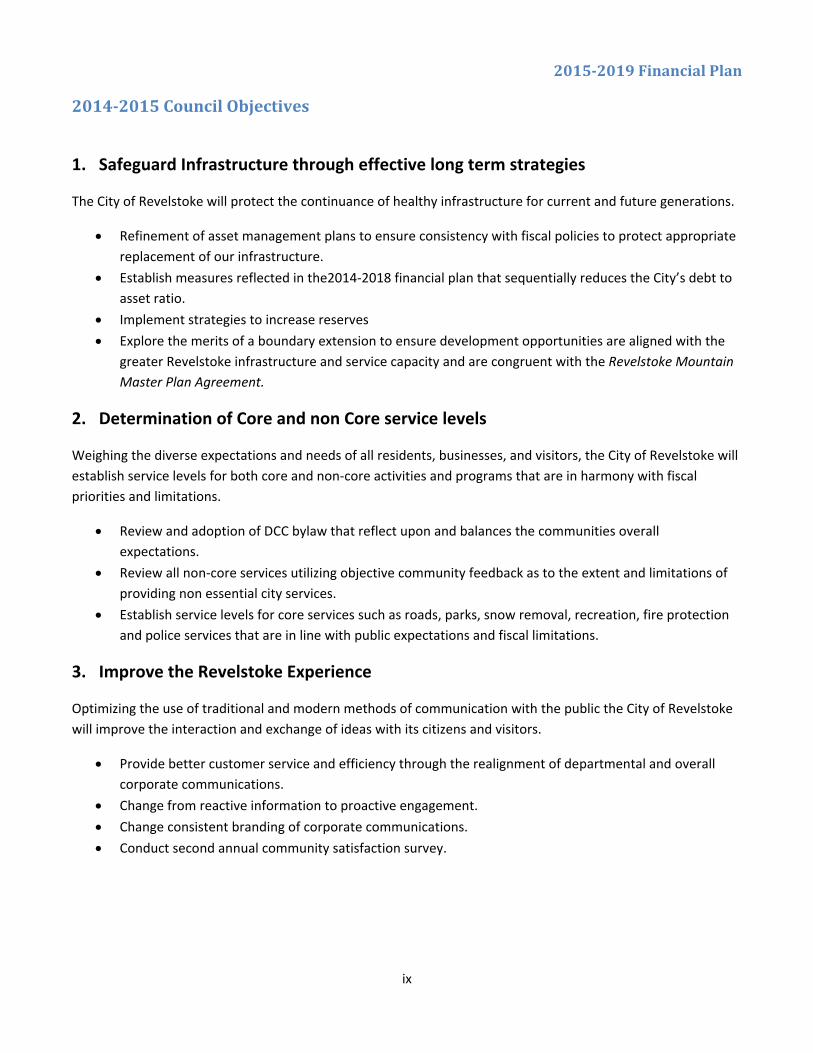
2014‐2015CouncilObjectives
1. Safeguard Infrastructure through effective long term strategies
The City of Revelstoke will protect the continuance of healthy infrastructure for current and future generations.
Refinement of asset management plans to ensure consistency with fiscal policies to protect appropriate
replacement of our infrastructure.
Establish measures reflected in the2014‐2018 financial plan that sequentially reduces the City’s debt to
asset ratio.
Implement strategies to increase reserves
Explore the merits of a boundary extension to ensure development opportunities are aligned with the
greater Revelstoke infrastructure and service capacity and are congruent with the Revelstoke Mountain
Master Plan Agreement.
2. Determination of Core and non Core service levels
Weighing the diverse expectations and needs of all residents, businesses, and visitors, the City of Revelstoke will
establish service levels for both core and non‐core activities and programs that are in harmony with fiscal
priorities and limitations.
Review and adoption of DCC bylaw that reflect upon and balances the communities overall
expectations.
Review all non‐core services utilizing objective community feedback as to the extent and limitations of
providing non essential city services.
Establish service levels for core services such as roads, parks, snow removal, recreation, fire protection
and police services that are in line with public expectations and fiscal limitations.
3. Improve the Revelstoke Experience
Optimizing the use of traditional and modern methods of communication with the public the City of Revelstoke
will improve the interaction and exchange of ideas with its citizens and visitors.
Provide better customer service and efficiency through the realignment of departmental and overall
corporate communications.
Change from reactive information to proactive engagement.
Change consistent branding of corporate communications.
Conduct second annual community satisfaction survey.
2015‐2019FinancialPlan
1
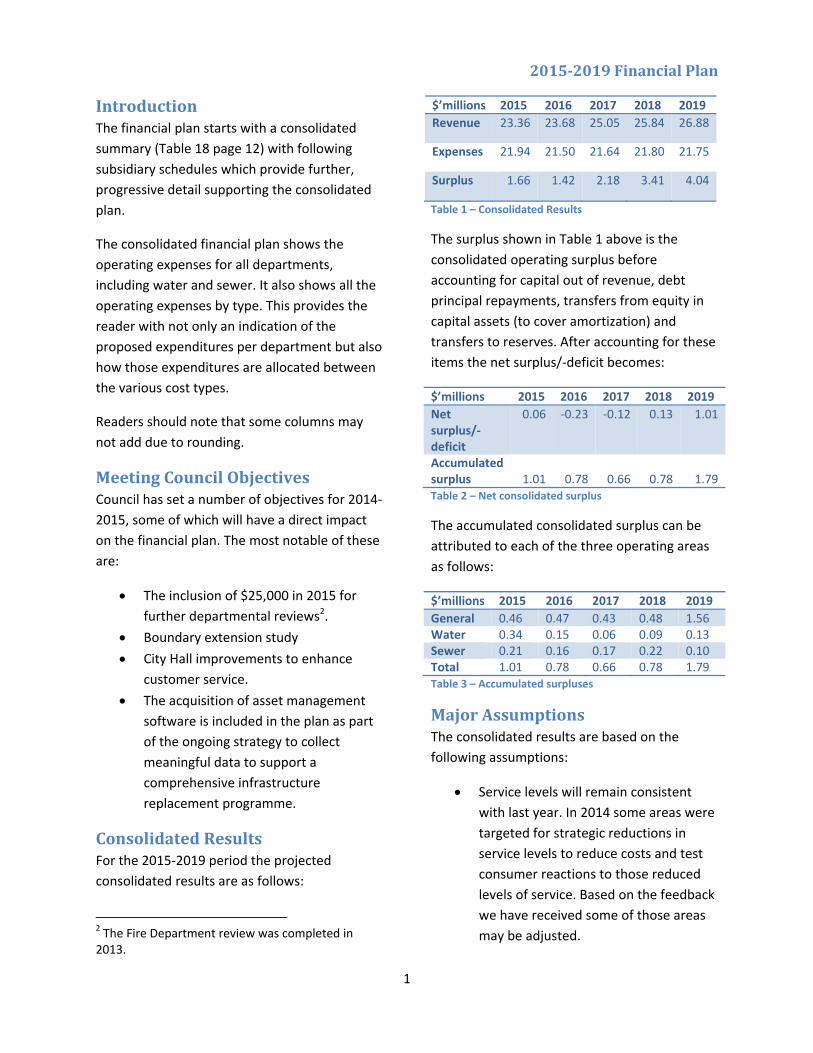
IntroductionThe financial plan starts with a consolidated
summary (Table 18 page 12) with following
subsidiary schedules which provide further,
progressive detail supporting the consolidated
plan.
The consolidated financial plan shows the
operating expenses for all departments,
including water and sewer. It also shows all the
operating expenses by type. This provides the
reader with not only an indication of the
proposed expenditures per department but also
how those expenditures are allocated between
the various cost types.
Readers should note that some columns may
not add due to rounding.
MeetingCouncilObjectivesCouncil has set a number of objectives for 2014‐
2015, some of which will have a direct impact
on the financial plan. The most notable of these
are:
The inclusion of $25,000 in 2015 for
further departmental reviews2.
Boundary extension study
City Hall improvements to enhance
customer service.
The acquisition of asset management
software is included in the plan as part
of the ongoing strategy to collect
meaningful data to support a
comprehensive infrastructure
replacement programme.
ConsolidatedResultsFor the 2015‐2019 period the projected
consolidated results are as follows:
2 The Fire Department review was completed in 2013.
$’millions 2015 2016 2017 2018 2019
Revenue 23.36 23.68 25.05 25.84 26.88
Expenses 21.94 21.50 21.64 21.80 21.75
Surplus 1.66 1.42 2.18 3.41 4.04
Table 1 – Consolidated Results
The surplus shown in Table 1 above is the
consolidated operating surplus before
accounting for capital out of revenue, debt
principal repayments, transfers from equity in
capital assets (to cover amortization) and
transfers to reserves. After accounting for these
items the net surplus/‐deficit becomes:
$’millions 2015 2016 2017 2018 2019
Net surplus/‐deficit
0.06 ‐0.23 ‐0.12 0.13 1.01
Accumulatedsurplus 1.01 0.78 0.66 0.78 1.79 Table 2 – Net consolidated surplus
The accumulated consolidated surplus can be
attributed to each of the three operating areas
as follows:
$’millions 2015 2016 2017 2018 2019
General 0.46 0.47 0.43 0.48 1.56Water 0.34 0.15 0.06 0.09 0.13Sewer 0.21 0.16 0.17 0.22 0.10Total 1.01 0.78 0.66 0.78 1.79Table 3 – Accumulated surpluses
MajorAssumptionsThe consolidated results are based on the
following assumptions:
Service levels will remain consistent
with last year. In 2014 some areas were
targeted for strategic reductions in
service levels to reduce costs and test
consumer reactions to those reduced
levels of service. Based on the feedback
we have received some of those areas
may be adjusted.
2015‐2019FinancialPlan
2
CPI will continue generally in the 2%
range3.
Property taxes will increase at an
average of 1.69% in 2015.4
Property tax growth from new
construction will average 3% a year
commencing 20165.
Fees and charges rates will increase
approximately in line with CPI.
Utility rates will increase generally at a
higher rate than CPI to meet
operational and capital requirements.
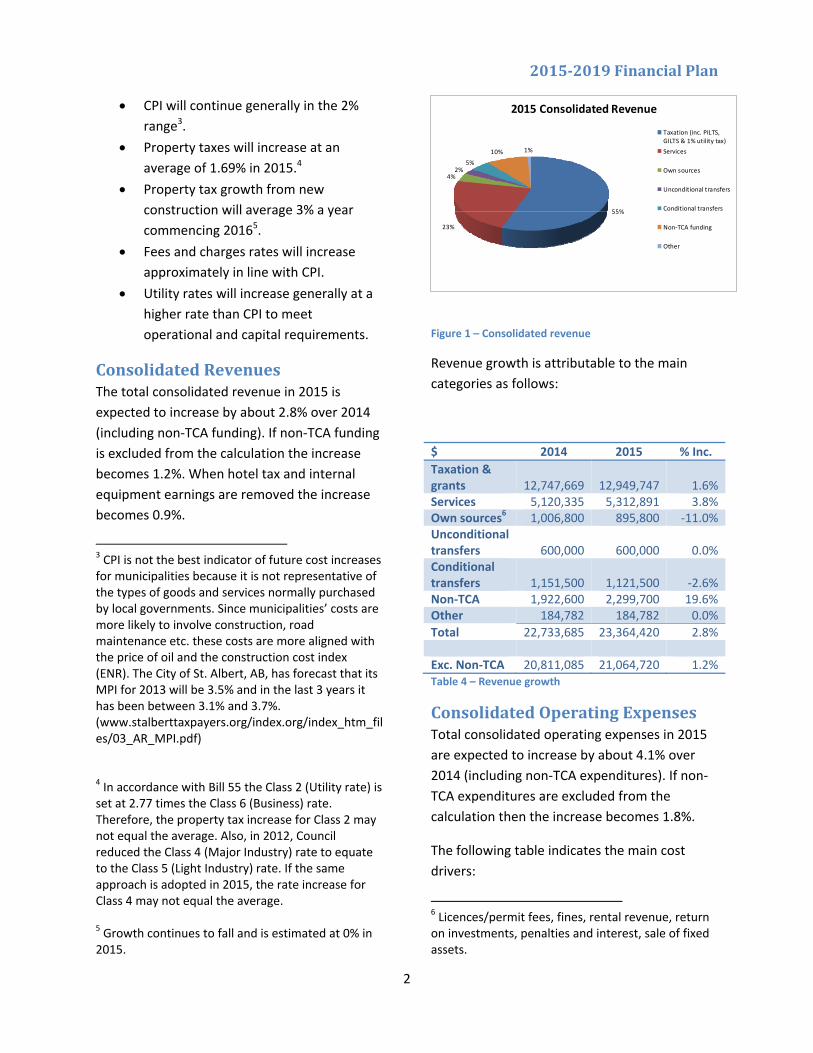
ConsolidatedRevenuesThe total consolidated revenue in 2015 is
expected to increase by about 2.8% over 2014
(including non‐TCA funding). If non‐TCA funding
is excluded from the calculation the increase
becomes 1.2%. When hotel tax and internal
equipment earnings are removed the increase
becomes 0.9%.
3 CPI is not the best indicator of future cost increases for municipalities because it is not representative of the types of goods and services normally purchased by local governments. Since municipalities’ costs are more likely to involve construction, road maintenance etc. these costs are more aligned with the price of oil and the construction cost index (ENR). The City of St. Albert, AB, has forecast that its MPI for 2013 will be 3.5% and in the last 3 years it has been between 3.1% and 3.7%. (www.stalberttaxpayers.org/index.org/index_htm_files/03_AR_MPI.pdf) 4 In accordance with Bill 55 the Class 2 (Utility rate) is set at 2.77 times the Class 6 (Business) rate. Therefore, the property tax increase for Class 2 may not equal the average. Also, in 2012, Council reduced the Class 4 (Major Industry) rate to equate to the Class 5 (Light Industry) rate. If the same approach is adopted in 2015, the rate increase for Class 4 may not equal the average. 5 Growth continues to fall and is estimated at 0% in 2015.
55%
23%
4%2%
5%
10% 1%
2015 Consolidated Revenue
Taxation (inc. PILTS,GILTS & 1% utility tax)
Services
Own sources
Unconditional transfers
Conditional transfers
Non‐TCA funding
Other
Figure 1 – Consolidated revenue
Revenue growth is attributable to the main
categories as follows:
$ 2014 2015 % Inc.
Taxation & grants 12,747,669 12,949,747 1.6% Services 5,120,335 5,312,891 3.8%Own sources6 1,006,800 895,800 ‐11.0%Unconditional transfers 600,000 600,000 0.0% Conditional transfers 1,151,500 1,121,500 ‐2.6% Non‐TCA 1,922,600 2,299,700 19.6%Other 184,782 184,782 0.0%
Total 22,733,685 23,364,420 2.8%
Exc. Non‐TCA 20,811,085 21,064,720 1.2%Table 4 – Revenue growth
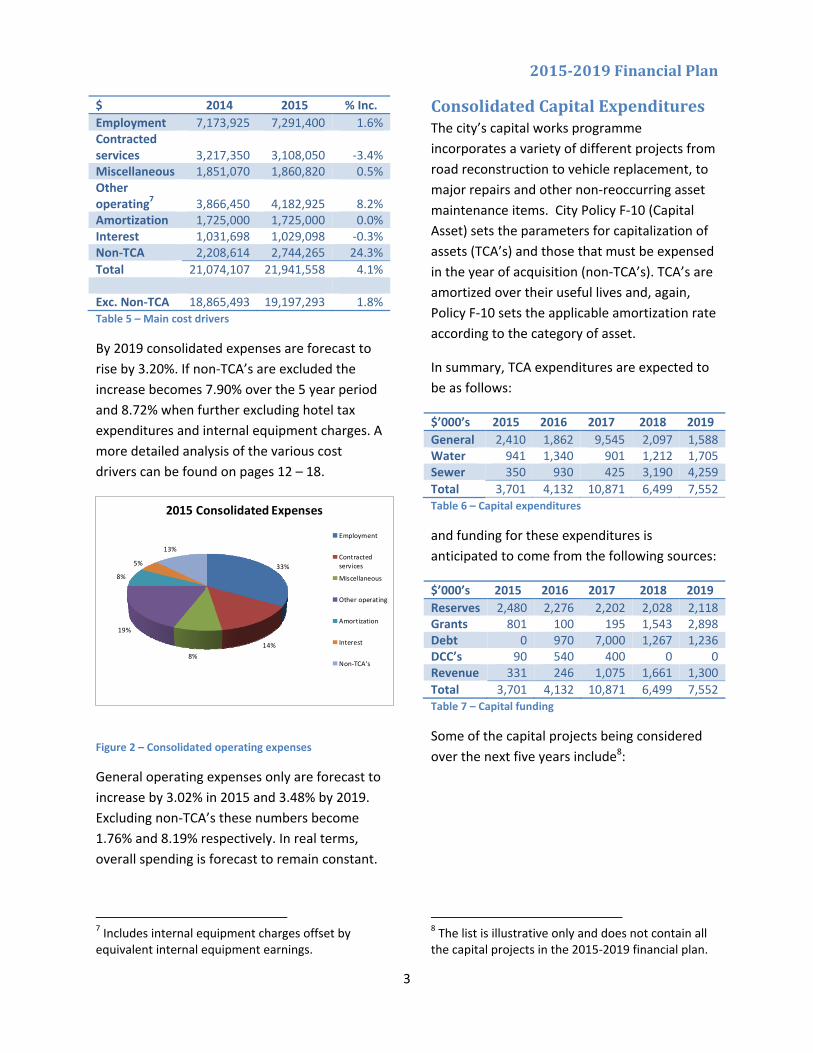
ConsolidatedOperatingExpensesTotal consolidated operating expenses in 2015
are expected to increase by about 4.1% over
2014 (including non‐TCA expenditures). If non‐
TCA expenditures are excluded from the
calculation then the increase becomes 1.8%.
The following table indicates the main cost
drivers:
6 Licences/permit fees, fines, rental revenue, return on investments, penalties and interest, sale of fixed assets.
2015‐2019FinancialPlan
3
$ 2014 2015 % Inc.
Employment 7,173,925 7,291,400 1.6%Contracted services 3,217,350 3,108,050 ‐3.4% Miscellaneous 1,851,070 1,860,820 0.5%Other operating7 3,866,450 4,182,925 8.2% Amortization 1,725,000 1,725,000 0.0%Interest 1,031,698 1,029,098 ‐0.3%Non‐TCA 2,208,614 2,744,265 24.3%
Total 21,074,107 21,941,558 4.1% Exc. Non‐TCA 18,865,493 19,197,293 1.8%Table 5 – Main cost drivers
By 2019 consolidated expenses are forecast to
rise by 3.20%. If non‐TCA’s are excluded the
increase becomes 7.90% over the 5 year period
and 8.72% when further excluding hotel tax
expenditures and internal equipment charges. A
more detailed analysis of the various cost
drivers can be found on pages 12 – 18.
33%
14%
8%
19%
8%
5%
13%
2015 Consolidated Expenses
Employment
Contractedservices
Miscellaneous
Other operating
Amortization
Interest
Non‐TCA's
Figure 2 – Consolidated operating expenses
General operating expenses only are forecast to
increase by 3.02% in 2015 and 3.48% by 2019.
Excluding non‐TCA’s these numbers become
1.76% and 8.19% respectively. In real terms,
overall spending is forecast to remain constant.
7 Includes internal equipment charges offset by equivalent internal equipment earnings.
ConsolidatedCapitalExpendituresThe city’s capital works programme
incorporates a variety of different projects from
road reconstruction to vehicle replacement, to
major repairs and other non‐reoccurring asset
maintenance items. City Policy F‐10 (Capital
Asset) sets the parameters for capitalization of
assets (TCA’s) and those that must be expensed
in the year of acquisition (non‐TCA’s). TCA’s are
amortized over their useful lives and, again,
Policy F‐10 sets the applicable amortization rate
according to the category of asset.
In summary, TCA expenditures are expected to
be as follows:
$’000’s 2015 2016 2017 2018 2019
General 2,410 1,862 9,545 2,097 1,588Water 941 1,340 901 1,212 1,705Sewer 350 930 425 3,190 4,259
Total 3,701 4,132 10,871 6,499 7,552Table 6 – Capital expenditures
and funding for these expenditures is
anticipated to come from the following sources:
$’000’s 2015 2016 2017 2018 2019
Reserves 2,480 2,276 2,202 2,028 2,118Grants 801 100 195 1,543 2,898Debt 0 970 7,000 1,267 1,236DCC’s 90 540 400 0 0Revenue 331 246 1,075 1,661 1,300
Total 3,701 4,132 10,871 6,499 7,552Table 7 – Capital funding
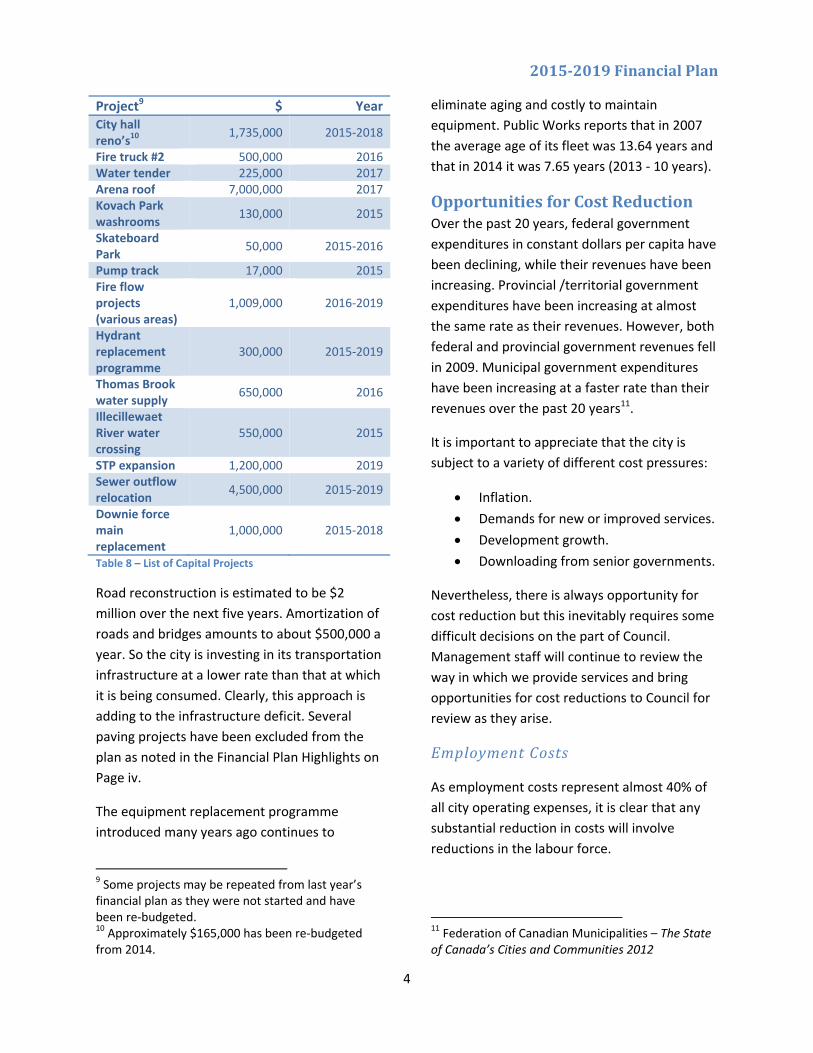
Some of the capital projects being considered
over the next five years include8:
8 The list is illustrative only and does not contain all the capital projects in the 2015‐2019 financial plan.
2015‐2019FinancialPlan
4
Project9 $ YearCity hall reno’s10
1,735,000 2015‐2018
Fire truck #2 500,000 2016Water tender 225,000 2017Arena roof 7,000,000 2017Kovach Park washrooms
130,000 2015
Skateboard Park
50,000 2015‐2016
Pump track 17,000 2015Fire flow projects (various areas)
1,009,000 2016‐2019
Hydrant replacement programme
300,000 2015‐2019
Thomas Brook water supply
650,000 2016
Illecillewaet River water crossing
550,000 2015
STP expansion 1,200,000 2019Sewer outflow relocation
4,500,000 2015‐2019
Downie force main replacement
1,000,000 2015‐2018
Table 8 – List of Capital Projects
Road reconstruction is estimated to be $2
million over the next five years. Amortization of
roads and bridges amounts to about $500,000 a
year. So the city is investing in its transportation
infrastructure at a lower rate than that at which
it is being consumed. Clearly, this approach is
adding to the infrastructure deficit. Several
paving projects have been excluded from the
plan as noted in the Financial Plan Highlights on
Page iv.
The equipment replacement programme
introduced many years ago continues to
9 Some projects may be repeated from last year’s financial plan as they were not started and have been re‐budgeted. 10 Approximately $165,000 has been re‐budgeted from 2014.
eliminate aging and costly to maintain
equipment. Public Works reports that in 2007
the average age of its fleet was 13.64 years and
that in 2014 it was 7.65 years (2013 ‐ 10 years).
OpportunitiesforCostReductionOver the past 20 years, federal government
expenditures in constant dollars per capita have
been declining, while their revenues have been
increasing. Provincial /territorial government
expenditures have been increasing at almost
the same rate as their revenues. However, both
federal and provincial government revenues fell
in 2009. Municipal government expenditures
have been increasing at a faster rate than their
revenues over the past 20 years11.
It is important to appreciate that the city is
subject to a variety of different cost pressures:
Inflation.
Demands for new or improved services.
Development growth.
Downloading from senior governments.
Nevertheless, there is always opportunity for
cost reduction but this inevitably requires some
difficult decisions on the part of Council.
Management staff will continue to review the
way in which we provide services and bring
opportunities for cost reductions to Council for
review as they arise.
EmploymentCosts
As employment costs represent almost 40% of
all city operating expenses, it is clear that any
substantial reduction in costs will involve
reductions in the labour force.
11 Federation of Canadian Municipalities – The State of Canada’s Cities and Communities 2012
2015‐2019FinancialPlan
5
A zero based budget approach is used in
determining employment costs in the financial
planning process. Each year an estimate is made
of the hours required to carry out the city’s
various functions and work projects. For 2015,
this number is 158,952 hours12 (154,163 hours –
2014)13 and includes 3,652 hours of overtime
(3,708 hours – 2014). The anticipated cost,
including benefits, amounts to $7,348,829,
which includes $112,00014 for Mayor and
Council and $64,60015 for the volunteer
firefighters. The actual budgeted cost in the
consolidated financial plan for 2015 is
$7,291,400.
SIMEA group benefits are estimated to increase
by 2.2% in 2015. WCB premiums have increased
by 20% over 2014 and MSP and pension
premiums have also increased.
SubcontractCosts
These include certain mandatory expenditures
such as the RCMP contract, Victim Services and
Transit which make up the bulk of this expense.
Other subcontract costs may not be mandatory
12 This number does not include hours committed to capital projects. 13 The increase in hours is mainly due to the filling of an engineering position vacant in 2014 and moving from a 1 man garbage truck to a 2 man truck. 14 Mayor and Council have foregone increases over several years. In 2015, their remuneration should be $118,500 assuming an annual 2% increase. 15 This includes the monthly stipend, weekend standby compensation and disability insurance.
but are essential, such as snow removal. Of
these expenses perhaps about $1 million might
be considered non‐contractual or discretionary.
(See Table 23 page 17).
The city became responsible for plowing
Mountain Road in 2014 at a cost of
approximately $37,000 a year.
MiscellaneousCosts
A substantial portion of these expenditures
(about $1.1 million) are offset by equivalent
revenues. The balance of about $500,000 or so
relates to discretionary items. (See Table 24
page 18).
Full funding for the Social Strategy Coordinator
is included in each year of the plan.
SewerCosts
Sewer operating costs are forecast to increase
by 12.05% in 2015 mostly as the result of higher
internal equipment charges (which shows as
equipment earnings revenue in the general
operating fund) and non‐TCA expenditures.
WaterCosts
Water operating costs are forecast to increase
by 11.30% in 2015 mostly as the result of non‐
TCA expenditures.
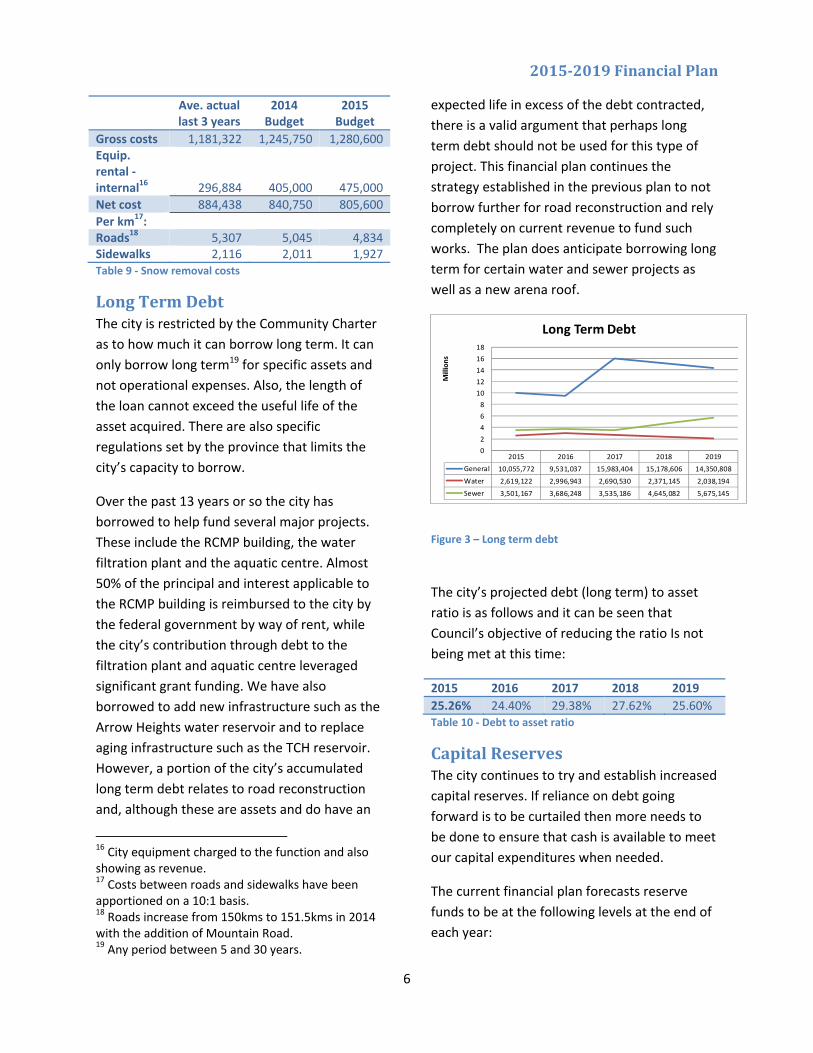
Snow removalcosts
In 2015, the snow removal budget reflects prior
actual results:
2015‐2019FinancialPlan
6
Ave. actual last 3 years
2014 Budget
2015Budget
Gross costs 1,181,322 1,245,750 1,280,600Equip. rental ‐ internal16 296,884 405,000 475,000
Net cost 884,438 840,750 805,600
Per km17: Roads18 5,307 5,045 4,834Sidewalks 2,116 2,011 1,927Table 9 ‐ Snow removal costs
LongTermDebtThe city is restricted by the Community Charter
as to how much it can borrow long term. It can
only borrow long term19 for specific assets and
not operational expenses. Also, the length of
the loan cannot exceed the useful life of the
asset acquired. There are also specific
regulations set by the province that limits the
city’s capacity to borrow.
Over the past 13 years or so the city has
borrowed to help fund several major projects.
These include the RCMP building, the water
filtration plant and the aquatic centre. Almost
50% of the principal and interest applicable to
the RCMP building is reimbursed to the city by
the federal government by way of rent, while
the city’s contribution through debt to the
filtration plant and aquatic centre leveraged
significant grant funding. We have also
borrowed to add new infrastructure such as the
Arrow Heights water reservoir and to replace
aging infrastructure such as the TCH reservoir.
However, a portion of the city’s accumulated
long term debt relates to road reconstruction
and, although these are assets and do have an
16 City equipment charged to the function and also showing as revenue. 17 Costs between roads and sidewalks have been apportioned on a 10:1 basis. 18 Roads increase from 150kms to 151.5kms in 2014 with the addition of Mountain Road. 19 Any period between 5 and 30 years.
expected life in excess of the debt contracted,
there is a valid argument that perhaps long
term debt should not be used for this type of
project. This financial plan continues the
strategy established in the previous plan to not
borrow further for road reconstruction and rely
completely on current revenue to fund such
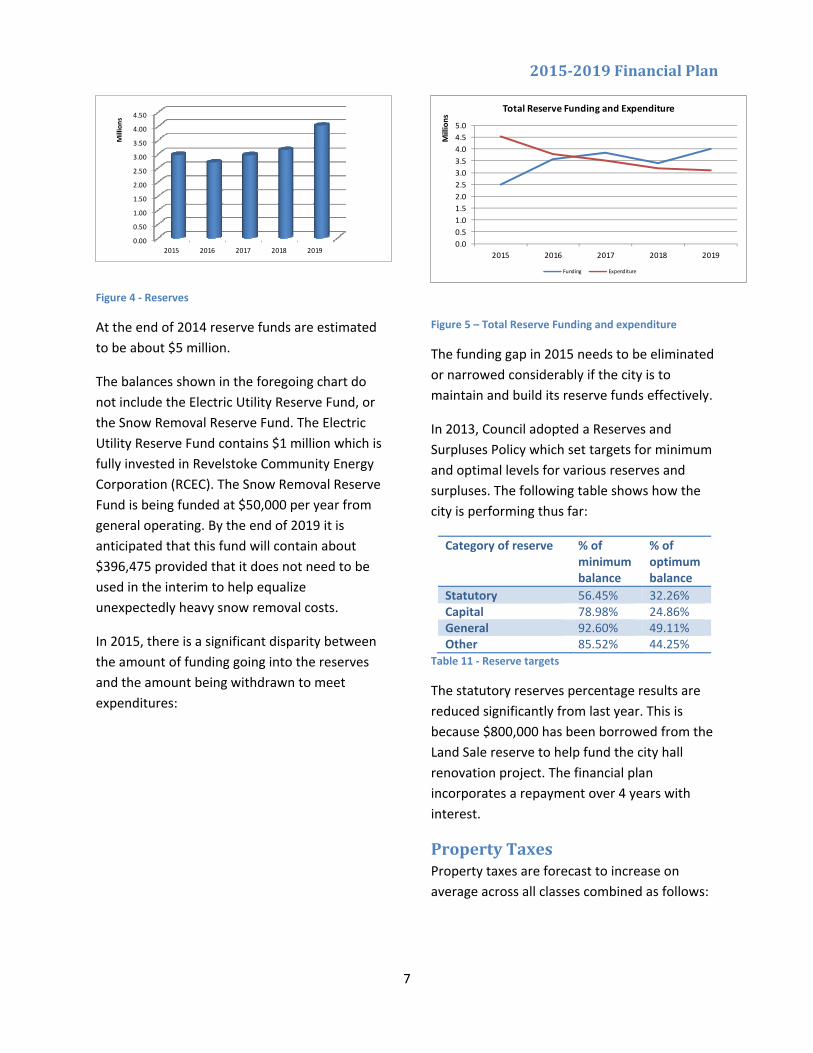
works. The plan does anticipate borrowing long
term for certain water and sewer projects as
well as a new arena roof.
2015 2016 2017 2018 2019
General 10,055,772 9,531,037 15,983,404 15,178,606 14,350,808
Water 2,619,122 2,996,943 2,690,530 2,371,145 2,038,194
Sewer 3,501,167 3,686,248 3,535,186 4,645,082 5,675,145
0
2
4
6
8
10
12
14
16
18
Millions
Long Term Debt
Figure 3 – Long term debt
The city’s projected debt (long term) to asset
ratio is as follows and it can be seen that
Council’s objective of reducing the ratio Is not
being met at this time:
2015 2016 2017 2018 2019
25.26% 24.40% 29.38% 27.62% 25.60%Table 10 ‐ Debt to asset ratio
CapitalReservesThe city continues to try and establish increased
capital reserves. If reliance on debt going
forward is to be curtailed then more needs to
be done to ensure that cash is available to meet
our capital expenditures when needed.
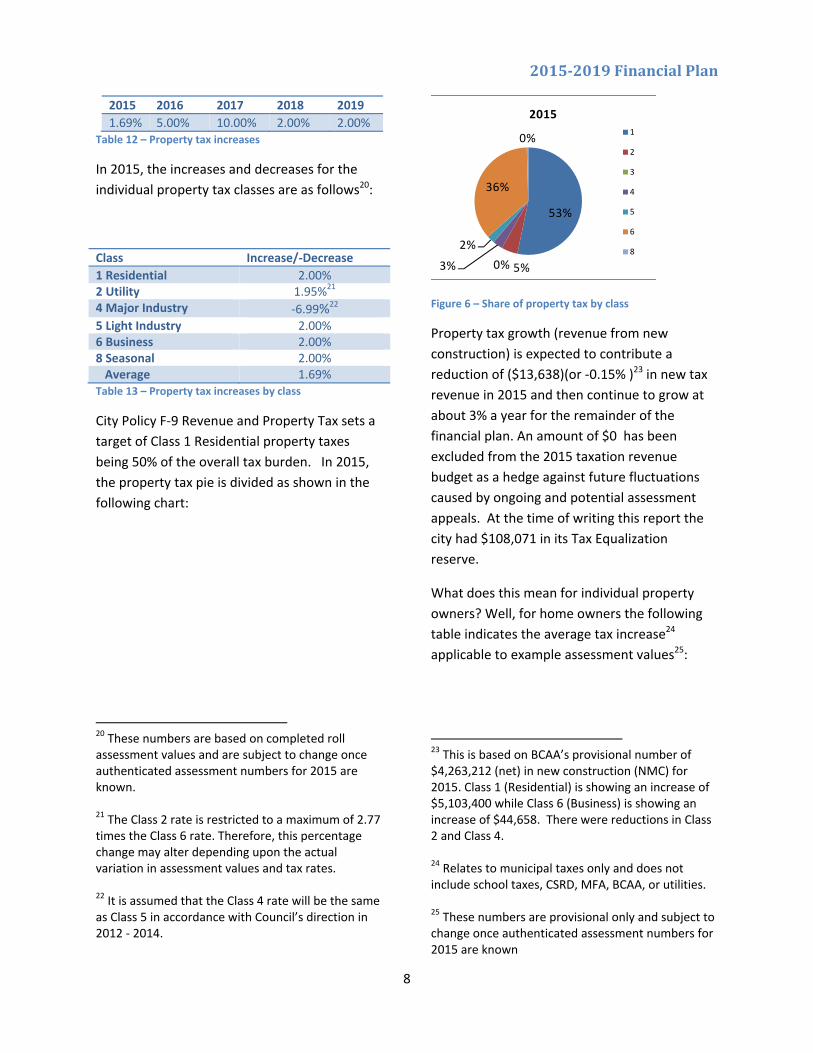
The current financial plan forecasts reserve
funds to be at the following levels at the end of
each year:
2015‐2019FinancialPlan
7
0.00
0.50
1.00
1.50
2.00
2.50
3.00
3.50
4.00
4.50
2015 2016 2017 2018 2019
Millions
Figure 4 ‐ Reserves
At the end of 2014 reserve funds are estimated
to be about $5 million.
The balances shown in the foregoing chart do
not include the Electric Utility Reserve Fund, or
the Snow Removal Reserve Fund. The Electric
Utility Reserve Fund contains $1 million which is
fully invested in Revelstoke Community Energy
Corporation (RCEC). The Snow Removal Reserve
Fund is being funded at $50,000 per year from
general operating. By the end of 2019 it is
anticipated that this fund will contain about
$396,475 provided that it does not need to be
used in the interim to help equalize
unexpectedly heavy snow removal costs.
In 2015, there is a significant disparity between
the amount of funding going into the reserves
and the amount being withdrawn to meet
expenditures:
0.0
0.5
1.0
1.5
2.0
2.5
3.0
3.5
4.0
4.5
5.0
2015 2016 2017 2018 2019
Millions
Total Reserve Funding and Expenditure
Funding Expenditure
Figure 5 – Total Reserve Funding and expenditure
The funding gap in 2015 needs to be eliminated
or narrowed considerably if the city is to
maintain and build its reserve funds effectively.
In 2013, Council adopted a Reserves and
Surpluses Policy which set targets for minimum
and optimal levels for various reserves and
surpluses. The following table shows how the
city is performing thus far:
Category of reserve % of minimum balance
% of optimum balance
Statutory 56.45% 32.26%Capital 78.98% 24.86%General 92.60% 49.11%Other 85.52% 44.25%
Table 11 ‐ Reserve targets
The statutory reserves percentage results are
reduced significantly from last year. This is
because $800,000 has been borrowed from the
Land Sale reserve to help fund the city hall
renovation project. The financial plan
incorporates a repayment over 4 years with
interest.
PropertyTaxesProperty taxes are forecast to increase on
average across all classes combined as follows:
2015‐2019FinancialPlan
8
2015 2016 2017 2018 2019
1.69% 5.00% 10.00% 2.00% 2.00%Table 12 – Property tax increases
In 2015, the increases and decreases for the
individual property tax classes are as follows20:
Class Increase/‐Decrease
1 Residential 2.00%2 Utility 1.95%21
4 Major Industry ‐6.99%22 5 Light Industry 2.00%6 Business 2.00%8 Seasonal 2.00% Average 1.69%Table 13 – Property tax increases by class
City Policy F‐9 Revenue and Property Tax sets a
target of Class 1 Residential property taxes
being 50% of the overall tax burden. In 2015,
the property tax pie is divided as shown in the
following chart:
20 These numbers are based on completed roll assessment values and are subject to change once authenticated assessment numbers for 2015 are known. 21 The Class 2 rate is restricted to a maximum of 2.77 times the Class 6 rate. Therefore, this percentage change may alter depending upon the actual variation in assessment values and tax rates. 22 It is assumed that the Class 4 rate will be the same as Class 5 in accordance with Council’s direction in 2012 ‐ 2014.
53%
5%0%3%
2%
36%
0%
2015
1
2
3
4
5
6
8
Figure 6 – Share of property tax by class
Property tax growth (revenue from new
construction) is expected to contribute a
reduction of ($13,638)(or ‐0.15% )23 in new tax
revenue in 2015 and then continue to grow at
about 3% a year for the remainder of the
financial plan. An amount of $0 has been
excluded from the 2015 taxation revenue
budget as a hedge against future fluctuations
caused by ongoing and potential assessment
appeals. At the time of writing this report the
city had $108,071 in its Tax Equalization
reserve.
What does this mean for individual property
owners? Well, for home owners the following
table indicates the average tax increase24
applicable to example assessment values25:
23 This is based on BCAA’s provisional number of $4,263,212 (net) in new construction (NMC) for 2015. Class 1 (Residential) is showing an increase of $5,103,400 while Class 6 (Business) is showing an increase of $44,658. There were reductions in Class 2 and Class 4. 24 Relates to municipal taxes only and does not include school taxes, CSRD, MFA, BCAA, or utilities. 25 These numbers are provisional only and subject to change once authenticated assessment numbers for 2015 are known
2015‐2019FinancialPlan
9
House A B C
Assessment
2014 $100,000 $250,000 $500,000
2015 $100,332 $250,831 $501,662
Taxes
2014 $479 $1,198 $2,396
2015 $489 $1,222 $2,444
Increase $10 $24 $48
Table 14 – Taxes on example houses
For business owners falling within Class 6, the
results are as follows:
Business A B C
Assessment 2014 $100,000 $250,000 $500,0002015 $104,174 $260,435 $520,871 Taxes 2014 $1,921 $4,803 $9,606 2015 $1,960 $4,899 $9,798 Increase $38 $96 $192 Table 15 – Taxes on example businesses
The property tax increases shown in the
foregoing tables are based on average increases
or decreases in assessment values.
The ratio of Class 6 (Business) tax rate to Class 1
(Residential) tax rate changes from 4.01 in 2014
to 3.86 in 2015.
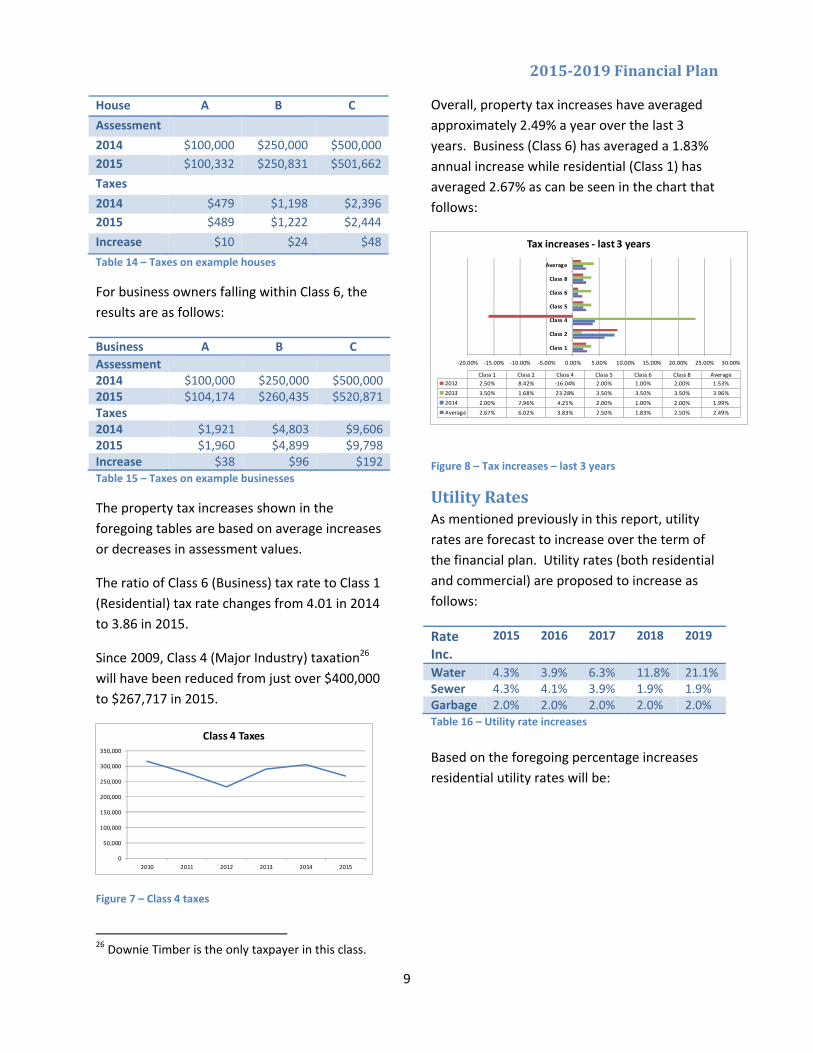
Since 2009, Class 4 (Major Industry) taxation26
will have been reduced from just over $400,000
to $267,717 in 2015.
0
50,000
100,000
150,000
200,000
250,000
300,000
350,000
2010 2011 2012 2013 2014 2015
Class 4 Taxes
Figure 7 – Class 4 taxes
26 Downie Timber is the only taxpayer in this class.
Overall, property tax increases have averaged
approximately 2.49% a year over the last 3
years. Business (Class 6) has averaged a 1.83%
annual increase while residential (Class 1) has
averaged 2.67% as can be seen in the chart that
follows:
‐20.00% ‐15.00% ‐10.00% ‐5.00% 0.00% 5.00% 10.00% 15.00% 20.00% 25.00% 30.00%
Class 1
Class 2
Class 4
Class 5
Class 6
Class 8
Average
Class 1 Class 2 Class 4 Class 5 Class 6 Class 8 Average
2012 2.50% 8.42% ‐16.04% 2.00% 1.00% 2.00% 1.53%
2013 3.50% 1.68% 23.28% 3.50% 3.50% 3.50% 3.96%
2014 2.00% 7.96% 4.25% 2.00% 1.00% 2.00% 1.99%
Average 2.67% 6.02% 3.83% 2.50% 1.83% 2.50% 2.49%
Tax increases ‐ last 3 years
Figure 8 – Tax increases – last 3 years
UtilityRatesAs mentioned previously in this report, utility
rates are forecast to increase over the term of
the financial plan. Utility rates (both residential
and commercial) are proposed to increase as
follows:
Based on the foregoing percentage increases
residential utility rates will be:
Rate Inc.
2015 2016 2017 2018 2019
Water 4.3% 3.9% 6.3% 11.8% 21.1%Sewer 4.3% 4.1% 3.9% 1.9% 1.9%Garbage 2.0% 2.0% 2.0% 2.0% 2.0%Table 16 – Utility rate increases
2015‐2019FinancialPlan
10
2015 2016 2017 2018 2019
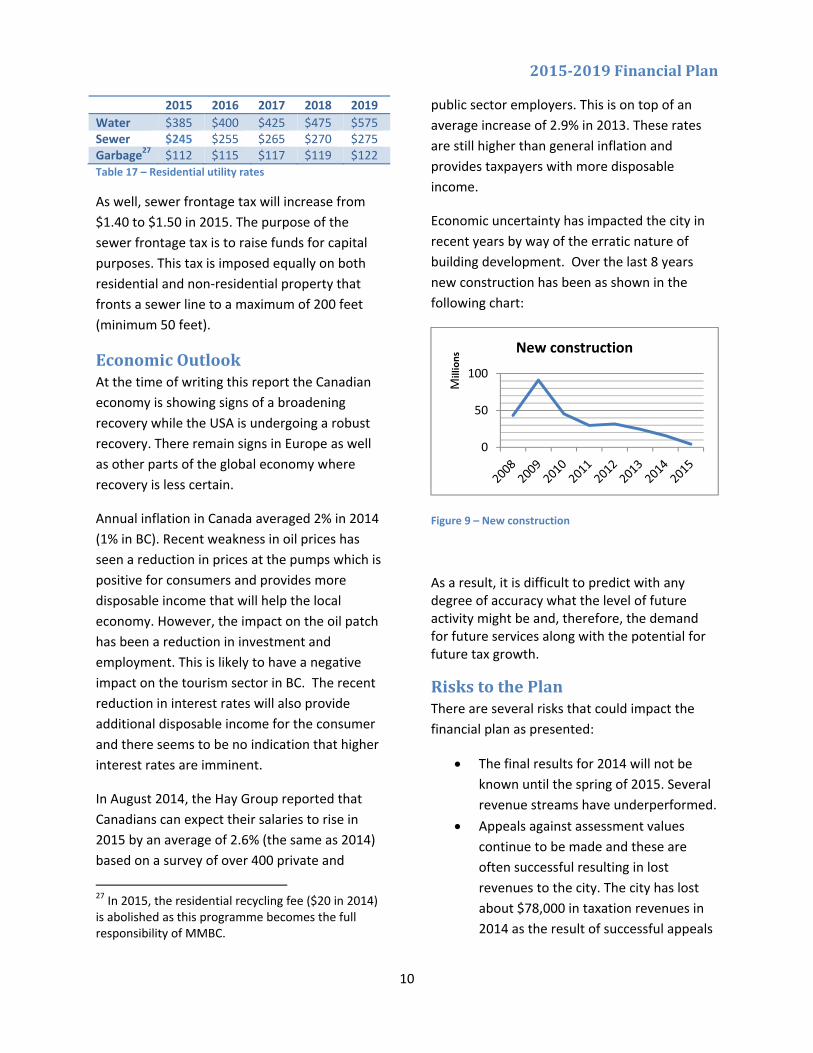
Water $385 $400 $425 $475 $575 Sewer $245 $255 $265 $270 $275 Garbage27 $112 $115 $117 $119 $122Table 17 – Residential utility rates
As well, sewer frontage tax will increase from
$1.40 to $1.50 in 2015. The purpose of the
sewer frontage tax is to raise funds for capital
purposes. This tax is imposed equally on both
residential and non‐residential property that
fronts a sewer line to a maximum of 200 feet
(minimum 50 feet).
EconomicOutlookAt the time of writing this report the Canadian
economy is showing signs of a broadening
recovery while the USA is undergoing a robust
recovery. There remain signs in Europe as well
as other parts of the global economy where
recovery is less certain.
Annual inflation in Canada averaged 2% in 2014
(1% in BC). Recent weakness in oil prices has
seen a reduction in prices at the pumps which is
positive for consumers and provides more
disposable income that will help the local
economy. However, the impact on the oil patch
has been a reduction in investment and
employment. This is likely to have a negative
impact on the tourism sector in BC. The recent
reduction in interest rates will also provide
additional disposable income for the consumer
and there seems to be no indication that higher
interest rates are imminent.
In August 2014, the Hay Group reported that
Canadians can expect their salaries to rise in
2015 by an average of 2.6% (the same as 2014)
based on a survey of over 400 private and
27 In 2015, the residential recycling fee ($20 in 2014) is abolished as this programme becomes the full responsibility of MMBC.
public sector employers. This is on top of an
average increase of 2.9% in 2013. These rates
are still higher than general inflation and
provides taxpayers with more disposable
income.
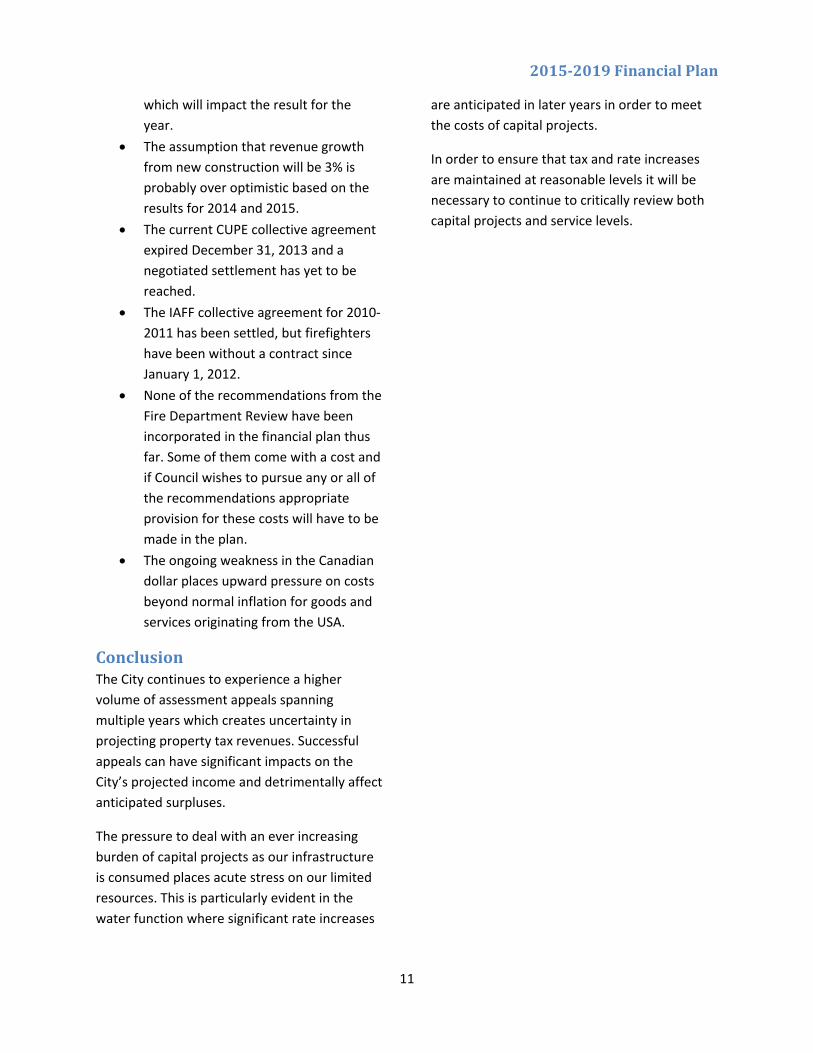
Economic uncertainty has impacted the city in
recent years by way of the erratic nature of
building development. Over the last 8 years
new construction has been as shown in the
following chart:
Figure 9 – New construction
As a result, it is difficult to predict with any degree of accuracy what the level of future activity might be and, therefore, the demand for future services along with the potential for future tax growth.
RiskstothePlanThere are several risks that could impact the
financial plan as presented:
The final results for 2014 will not be
known until the spring of 2015. Several
revenue streams have underperformed.
Appeals against assessment values
continue to be made and these are
often successful resulting in lost
revenues to the city. The city has lost
about $78,000 in taxation revenues in
2014 as the result of successful appeals
0
50
100
Millions New construction
2015‐2019FinancialPlan
11
which will impact the result for the
year.
The assumption that revenue growth
from new construction will be 3% is
probably over optimistic based on the
results for 2014 and 2015.
The current CUPE collective agreement
expired December 31, 2013 and a
negotiated settlement has yet to be
reached.
The IAFF collective agreement for 2010‐
2011 has been settled, but firefighters
have been without a contract since
January 1, 2012.
None of the recommendations from the
Fire Department Review have been
incorporated in the financial plan thus
far. Some of them come with a cost and
if Council wishes to pursue any or all of
the recommendations appropriate
provision for these costs will have to be
made in the plan.
The ongoing weakness in the Canadian
dollar places upward pressure on costs
beyond normal inflation for goods and
services originating from the USA.
ConclusionThe City continues to experience a higher
volume of assessment appeals spanning
multiple years which creates uncertainty in
projecting property tax revenues. Successful
appeals can have significant impacts on the
City’s projected income and detrimentally affect
anticipated surpluses.
The pressure to deal with an ever increasing
burden of capital projects as our infrastructure
is consumed places acute stress on our limited
resources. This is particularly evident in the
water function where significant rate increases
are anticipated in later years in order to meet
the costs of capital projects.
In order to ensure that tax and rate increases
are maintained at reasonable levels it will be
necessary to continue to critically review both
capital projects and service levels.
2015‐2019FinancialPlan
12
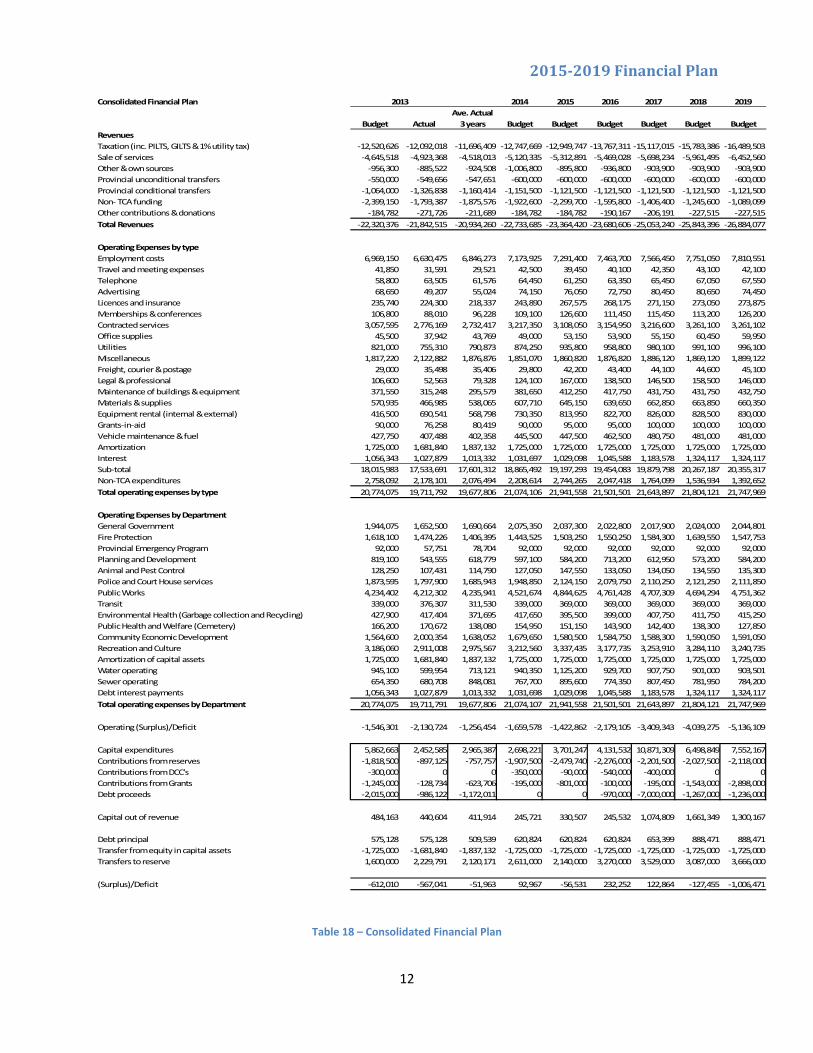
Consolidated Financial Plan 2014 2015 2016 2017 2018 2019
Budget Actual
Ave. Actual
3 years Budget Budget Budget Budget Budget Budget
Revenues
Taxation (inc. PILTS, GILTS & 1% utility tax) ‐12,520,626 ‐12,092,018 ‐11,696,409 ‐12,747,669 ‐12,949,747 ‐13,767,311 ‐15,117,015 ‐15,783,386 ‐16,489,503
Sale of services ‐4,645,518 ‐4,923,368 ‐4,518,013 ‐5,120,335 ‐5,312,891 ‐5,469,028 ‐5,698,234 ‐5,961,495 ‐6,452,560
Other & own sources ‐956,300 ‐885,522 ‐924,508 ‐1,006,800 ‐895,800 ‐936,800 ‐903,900 ‐903,900 ‐903,900
Provincial unconditional transfers ‐550,000 ‐549,656 ‐547,651 ‐600,000 ‐600,000 ‐600,000 ‐600,000 ‐600,000 ‐600,000
Provincial conditional transfers ‐1,064,000 ‐1,326,838 ‐1,160,414 ‐1,151,500 ‐1,121,500 ‐1,121,500 ‐1,121,500 ‐1,121,500 ‐1,121,500
Non‐ TCA funding ‐2,399,150 ‐1,793,387 ‐1,875,576 ‐1,922,600 ‐2,299,700 ‐1,595,800 ‐1,406,400 ‐1,245,600 ‐1,089,099
Other contributions & donations ‐184,782 ‐271,726 ‐211,689 ‐184,782 ‐184,782 ‐190,167 ‐206,191 ‐227,515 ‐227,515
Total Revenues ‐22,320,376 ‐21,842,515 ‐20,934,260 ‐22,733,685 ‐23,364,420 ‐23,680,606 ‐25,053,240 ‐25,843,396 ‐26,884,077
Operating Expenses by type
Employment costs 6,969,150 6,630,475 6,846,273 7,173,925 7,291,400 7,463,700 7,566,450 7,751,050 7,810,551
Travel and meeting expenses 41,850 31,591 29,521 42,500 39,450 40,100 42,350 43,100 42,100
Telephone 58,800 63,505 61,576 64,450 61,250 63,350 65,450 67,050 67,550
Advertising 68,650 49,207 55,024 74,150 76,050 72,750 80,450 80,650 74,450
Licences and insurance 235,740 224,300 218,337 243,890 267,575 268,175 271,150 273,050 273,875
Memberships & conferences 106,800 88,010 96,228 109,100 126,600 111,450 115,450 113,200 126,200
Contracted services 3,057,595 2,776,169 2,732,417 3,217,350 3,108,050 3,154,950 3,216,600 3,261,100 3,261,102
Office supplies 45,500 37,942 43,769 49,000 53,150 53,900 55,150 60,450 59,950
Utilities 821,000 755,310 790,873 874,250 935,800 958,800 980,100 991,100 996,100
Miscellaneous 1,817,220 2,122,882 1,876,876 1,851,070 1,860,820 1,876,820 1,886,120 1,869,120 1,899,122
Freight, courier & postage 29,000 35,498 35,406 29,800 42,200 43,400 44,100 44,600 45,100
Legal & professional 106,600 52,563 79,328 124,100 167,000 138,500 146,500 158,500 146,000
Maintenance of buildings & equipment 371,550 315,248 295,579 381,650 412,250 417,750 431,750 431,750 432,750
Materials & supplies 570,935 466,985 538,065 607,710 645,150 639,650 662,850 663,850 660,350
Equipment rental (internal & external) 416,500 690,541 568,798 730,350 813,950 822,700 826,000 828,500 830,000
Grants‐in‐aid 90,000 76,258 80,419 90,000 95,000 95,000 100,000 100,000 100,000
Vehicle maintenance & fuel 427,750 407,488 402,358 445,500 447,500 462,500 480,750 481,000 481,000
Amortization 1,725,000 1,681,840 1,837,132 1,725,000 1,725,000 1,725,000 1,725,000 1,725,000 1,725,000
Interest 1,056,343 1,027,879 1,013,332 1,031,697 1,029,098 1,045,588 1,183,578 1,324,117 1,324,117
Sub‐total 18,015,983 17,533,691 17,601,312 18,865,492 19,197,293 19,454,083 19,879,798 20,267,187 20,355,317
Non‐TCA expenditures 2,758,092 2,178,101 2,076,494 2,208,614 2,744,265 2,047,418 1,764,099 1,536,934 1,392,652
Total operating expenses by type 20,774,075 19,711,792 19,677,806 21,074,106 21,941,558 21,501,501 21,643,897 21,804,121 21,747,969
Operating Expenses by Department
General Government 1,944,075 1,652,500 1,690,664 2,075,350 2,037,300 2,022,800 2,017,900 2,024,000 2,044,801
Fire Protection 1,618,100 1,474,226 1,406,395 1,443,525 1,503,250 1,550,250 1,584,300 1,639,550 1,547,753
Provincial Emergency Program 92,000 57,751 78,704 92,000 92,000 92,000 92,000 92,000 92,000
Planning and Development 819,100 543,555 618,779 597,100 584,200 713,200 612,950 573,200 584,200
Animal and Pest Control 128,250 107,431 114,790 127,050 147,550 133,050 134,050 134,550 135,300
Police and Court House services 1,873,595 1,797,900 1,685,943 1,948,850 2,124,150 2,079,750 2,110,250 2,121,250 2,111,850
Public Works 4,234,402 4,212,302 4,235,941 4,521,674 4,844,625 4,761,428 4,707,309 4,694,294 4,751,362
Transit 339,000 376,307 311,530 339,000 369,000 369,000 369,000 369,000 369,000
Environmental Health (Garbage collection and Recycling) 427,900 417,404 371,695 417,650 395,500 399,000 407,750 411,750 415,250
Public Health and Welfare (Cemetery) 166,200 170,672 138,080 154,950 151,150 143,900 142,400 138,300 127,850
Community Economic Development 1,564,600 2,000,354 1,638,052 1,679,650 1,580,500 1,584,750 1,588,300 1,590,050 1,591,050
Recreation and Culture 3,186,060 2,911,008 2,975,567 3,212,560 3,337,435 3,177,735 3,253,910 3,284,110 3,240,735
Amortization of capital assets 1,725,000 1,681,840 1,837,132 1,725,000 1,725,000 1,725,000 1,725,000 1,725,000 1,725,000
Water operating 945,100 599,954 713,121 940,350 1,125,200 929,700 907,750 901,000 903,501
Sewer operating 654,350 680,708 848,081 767,700 895,600 774,350 807,450 781,950 784,200
Debt interest payments 1,056,343 1,027,879 1,013,332 1,031,698 1,029,098 1,045,588 1,183,578 1,324,117 1,324,117
Total operating expenses by Department 20,774,075 19,711,791 19,677,806 21,074,107 21,941,558 21,501,501 21,643,897 21,804,121 21,747,969
Operating (Surplus)/Deficit ‐1,546,301 ‐2,130,724 ‐1,256,454 ‐1,659,578 ‐1,422,862 ‐2,179,105 ‐3,409,343 ‐4,039,275 ‐5,136,109
Capital expenditures 5,862,663 2,452,585 2,965,387 2,698,221 3,701,247 4,131,532 10,871,309 6,498,849 7,552,167
Contributions from reserves ‐1,818,500 ‐897,125 ‐757,757 ‐1,907,500 ‐2,479,740 ‐2,276,000 ‐2,201,500 ‐2,027,500 ‐2,118,000
Contributions from DCC's ‐300,000 0 0 ‐350,000 ‐90,000 ‐540,000 ‐400,000 0 0
Contributions from Grants ‐1,245,000 ‐128,734 ‐623,706 ‐195,000 ‐801,000 ‐100,000 ‐195,000 ‐1,543,000 ‐2,898,000
Debt proceeds ‐2,015,000 ‐986,122 ‐1,172,011 0 0 ‐970,000 ‐7,000,000 ‐1,267,000 ‐1,236,000
Capital out of revenue 484,163 440,604 411,914 245,721 330,507 245,532 1,074,809 1,661,349 1,300,167
Debt principal 575,128 575,128 509,539 620,824 620,824 620,824 653,399 888,471 888,471
Transfer from equity in capital assets ‐1,725,000 ‐1,681,840 ‐1,837,132 ‐1,725,000 ‐1,725,000 ‐1,725,000 ‐1,725,000 ‐1,725,000 ‐1,725,000
Transfers to reserve 1,600,000 2,229,791 2,120,171 2,611,000 2,140,000 3,270,000 3,529,000 3,087,000 3,666,000
(Surplus)/Deficit ‐612,010 ‐567,041 ‐51,963 92,967 ‐56,531 232,252 122,864 ‐127,455 ‐1,006,471
2013
Table 18 – Consolidated Financial Plan
2015‐2019FinancialPlan
13
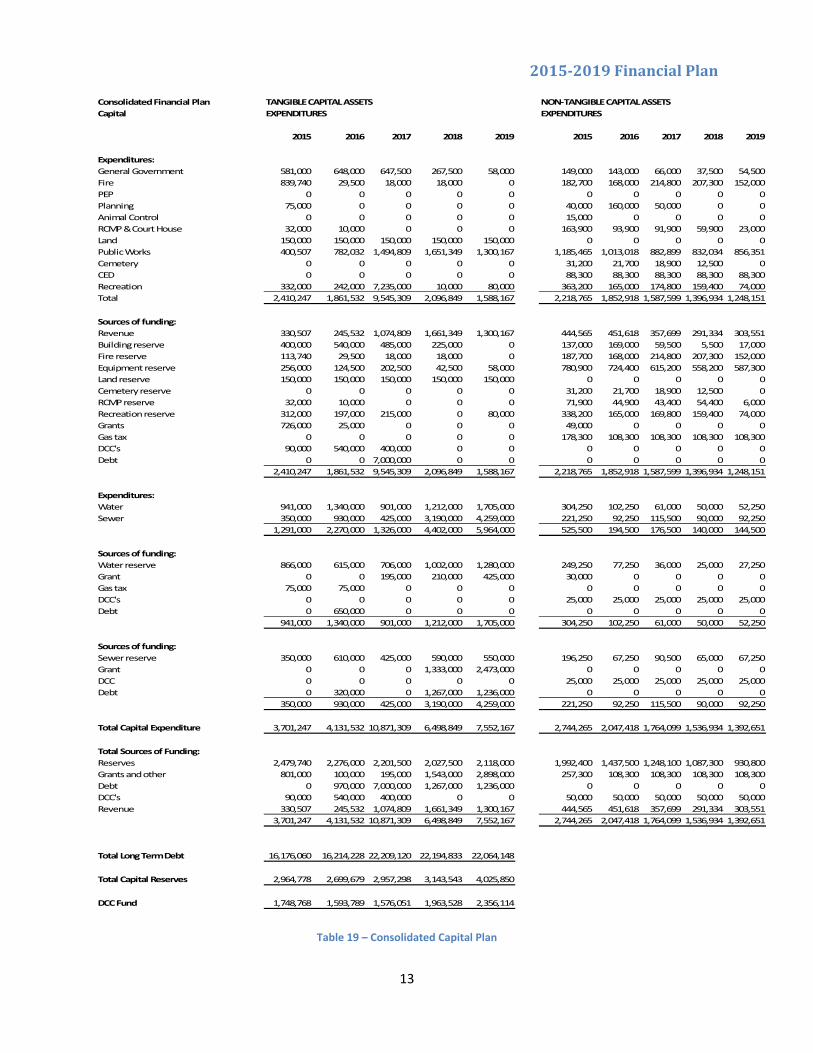
Consolidated Financial Plan TANGIBLE CAPITAL ASSETS NON‐TANGIBLE CAPITAL ASSETS
Capital EXPENDITURES EXPENDITURES
2015 2016 2017 2018 2019 2015 2016 2017 2018 2019
Expenditures:
General Government 581,000 648,000 647,500 267,500 58,000 149,000 143,000 66,000 37,500 54,500
Fire 839,740 29,500 18,000 18,000 0 182,700 168,000 214,800 207,300 152,000
PEP 0 0 0 0 0 0 0 0 0 0
Planning 75,000 0 0 0 0 40,000 160,000 50,000 0 0
Animal Control 0 0 0 0 0 15,000 0 0 0 0
RCMP & Court House 32,000 10,000 0 0 0 163,900 93,900 91,900 59,900 23,000
Land 150,000 150,000 150,000 150,000 150,000 0 0 0 0 0
Public Works 400,507 782,032 1,494,809 1,651,349 1,300,167 1,185,465 1,013,018 882,899 832,034 856,351
Cemetery 0 0 0 0 0 31,200 21,700 18,900 12,500 0
CED 0 0 0 0 0 88,300 88,300 88,300 88,300 88,300
Recreation 332,000 242,000 7,235,000 10,000 80,000 363,200 165,000 174,800 159,400 74,000
Total 2,410,247 1,861,532 9,545,309 2,096,849 1,588,167 2,218,765 1,852,918 1,587,599 1,396,934 1,248,151
Sources of funding:
Revenue 330,507 245,532 1,074,809 1,661,349 1,300,167 444,565 451,618 357,699 291,334 303,551
Building reserve 400,000 540,000 485,000 225,000 0 137,000 169,000 59,500 5,500 17,000
Fire reserve 113,740 29,500 18,000 18,000 0 187,700 168,000 214,800 207,300 152,000
Equipment reserve 256,000 124,500 202,500 42,500 58,000 780,900 724,400 615,200 558,200 587,300
Land reserve 150,000 150,000 150,000 150,000 150,000 0 0 0 0 0
Cemetery reserve 0 0 0 0 0 31,200 21,700 18,900 12,500 0
RCMP reserve 32,000 10,000 0 0 0 71,900 44,900 43,400 54,400 6,000
Recreation reserve 312,000 197,000 215,000 0 80,000 338,200 165,000 169,800 159,400 74,000
Grants 726,000 25,000 0 0 0 49,000 0 0 0 0
Gas tax 0 0 0 0 0 178,300 108,300 108,300 108,300 108,300
DCC's 90,000 540,000 400,000 0 0 0 0 0 0 0
Debt 0 0 7,000,000 0 0 0 0 0 0 0
2,410,247 1,861,532 9,545,309 2,096,849 1,588,167 2,218,765 1,852,918 1,587,599 1,396,934 1,248,151
Expenditures:
Water 941,000 1,340,000 901,000 1,212,000 1,705,000 304,250 102,250 61,000 50,000 52,250
Sewer 350,000 930,000 425,000 3,190,000 4,259,000 221,250 92,250 115,500 90,000 92,250
1,291,000 2,270,000 1,326,000 4,402,000 5,964,000 525,500 194,500 176,500 140,000 144,500
Sources of funding:
Water reserve 866,000 615,000 706,000 1,002,000 1,280,000 249,250 77,250 36,000 25,000 27,250
Grant 0 0 195,000 210,000 425,000 30,000 0 0 0 0
Gas tax 75,000 75,000 0 0 0 0 0 0 0 0
DCC's 0 0 0 0 0 25,000 25,000 25,000 25,000 25,000
Debt 0 650,000 0 0 0 0 0 0 0 0
941,000 1,340,000 901,000 1,212,000 1,705,000 304,250 102,250 61,000 50,000 52,250
Sources of funding:
Sewer reserve 350,000 610,000 425,000 590,000 550,000 196,250 67,250 90,500 65,000 67,250
Grant 0 0 0 1,333,000 2,473,000 0 0 0 0 0
DCC 0 0 0 0 0 25,000 25,000 25,000 25,000 25,000
Debt 0 320,000 0 1,267,000 1,236,000 0 0 0 0 0
350,000 930,000 425,000 3,190,000 4,259,000 221,250 92,250 115,500 90,000 92,250
Total Capital Expenditure 3,701,247 4,131,532 10,871,309 6,498,849 7,552,167 2,744,265 2,047,418 1,764,099 1,536,934 1,392,651
Total Sources of Funding:
Reserves 2,479,740 2,276,000 2,201,500 2,027,500 2,118,000 1,992,400 1,437,500 1,248,100 1,087,300 930,800
Grants and other 801,000 100,000 195,000 1,543,000 2,898,000 257,300 108,300 108,300 108,300 108,300
Debt 0 970,000 7,000,000 1,267,000 1,236,000 0 0 0 0 0
DCC's 90,000 540,000 400,000 0 0 50,000 50,000 50,000 50,000 50,000
Revenue 330,507 245,532 1,074,809 1,661,349 1,300,167 444,565 451,618 357,699 291,334 303,551
3,701,247 4,131,532 10,871,309 6,498,849 7,552,167 2,744,265 2,047,418 1,764,099 1,536,934 1,392,651
Total Long Term Debt 16,176,060 16,214,228 22,209,120 22,194,833 22,064,148
Total Capital Reserves 2,964,778 2,699,679 2,957,298 3,143,543 4,025,850
DCC Fund 1,748,768 1,593,789 1,576,051 1,963,528 2,356,114
Table 19 – Consolidated Capital Plan
2015‐2019FinancialPlan
14
General Operating Financial Plan 2014 2015 2016 2017 2018 2019
Budget Actual
Ave. Actual 3
years Budget Budget Budget Budget Budget Budget
Revenues
Taxation (inc. PILTS, GILTS & 1% utility tax) ‐12,399,626 ‐11,969,287 ‐11,576,368 ‐12,505,669 ‐12,690,461 ‐13,490,739 ‐14,823,158 ‐15,472,243 ‐16,161,074
Sale of services ‐2,120,442 ‐2,423,664 ‐2,204,271 ‐2,400,283 ‐2,480,182 ‐2,511,908 ‐2,538,725 ‐2,553,585 ‐2,567,591
Other & own sources ‐956,300 ‐885,522 ‐924,508 ‐1,006,800 ‐895,800 ‐936,800 ‐903,900 ‐903,900 ‐903,900
Provincial unconditional transfers ‐550,000 ‐549,656 ‐547,651 ‐600,000 ‐600,000 ‐600,000 ‐600,000 ‐600,000 ‐600,000
Provincial conditional transfers ‐1,064,000 ‐1,326,838 ‐1,160,414 ‐1,151,500 ‐1,121,500 ‐1,121,500 ‐1,121,500 ‐1,121,500 ‐1,121,500
Non‐ TCA funding ‐2,179,150 ‐1,640,630 ‐1,533,977 ‐1,667,600 ‐1,774,200 ‐1,401,300 ‐1,229,900 ‐1,105,600 ‐944,599
Other contributions & donations ‐60,000 ‐146,944 ‐81,123 ‐60,000 ‐60,000 ‐60,000 ‐60,000 ‐60,000 ‐60,000
Total Revenues ‐19,329,518 ‐18,942,541 ‐18,028,312 ‐19,391,851 ‐19,622,143 ‐20,122,247 ‐21,277,182 ‐21,816,828 ‐22,358,664
Operating Expenses by type
Employment costs 6,456,900 6,205,499 6,370,189 6,624,425 6,747,650 6,909,200 6,998,950 7,179,300 7,238,801
Travel and meeting expenses 27,850 28,282 26,969 28,500 32,950 33,600 35,350 36,100 35,100
Telephone 53,800 58,504 57,219 59,450 55,650 57,750 59,850 61,450 61,950
Advertising 66,350 49,057 54,974 71,850 73,750 70,450 78,150 78,350 72,150
Licences and insurance 201,990 186,095 185,218 209,390 236,325 236,925 239,650 241,550 242,125
Memberships & conferences 106,800 88,010 96,228 109,100 126,600 111,450 115,450 113,200 126,200
Contracted services 2,871,295 2,687,126 2,635,497 3,026,550 2,920,250 2,967,150 3,024,300 3,068,800 3,068,802
Office supplies 45,500 37,942 43,769 49,000 53,150 53,900 55,150 60,450 59,950
Utilities 684,950 634,809 661,766 735,200 794,700 815,700 833,950 844,950 849,950
Miscellaneous 1,582,920 1,888,743 1,640,168 1,616,270 1,625,520 1,641,520 1,650,320 1,633,320 1,663,321
Freight, courier & postage 24,400 20,398 19,442 25,200 28,300 29,500 30,200 30,700 31,200
Legal & professional 106,600 52,563 79,328 124,100 167,000 138,500 146,500 158,500 146,000
Maintenance of buildings & equipment 371,550 315,248 295,579 381,650 412,250 417,750 431,750 431,750 432,750
Materials & supplies 384,635 341,121 369,330 397,910 420,150 413,150 429,100 430,100 426,600
Equipment rental (internal & external) 351,900 631,360 518,994 661,650 727,150 735,900 739,100 741,600 743,100
Grants‐in‐aid 90,000 76,258 80,419 90,000 95,000 95,000 100,000 100,000 100,000
Vehicle maintenance & fuel 427,750 395,052 398,213 445,500 431,500 446,500 464,750 465,000 465,000
Amortization 1,200,000 1,214,914 1,342,147 1,200,000 1,200,000 1,200,000 1,200,000 1,200,000 1,200,000
Interest 591,646 563,182 557,336 567,001 564,401 564,401 685,901 804,901 804,901
Sub‐total 15,646,836 15,474,163 15,432,786 16,422,746 16,712,296 16,938,346 17,318,421 17,680,021 17,767,900
Non‐TCA expenditures 2,538,092 2,025,344 1,732,838 1,953,614 2,218,765 1,852,918 1,587,599 1,396,934 1,248,152
Total operating expenses by type 18,184,928 17,499,507 17,165,623 18,376,360 18,931,061 18,791,265 18,906,021 19,076,955 19,016,052
Operating Expenses by Department
General Government 1,944,075 1,652,500 1,690,664 2,075,350 2,037,300 2,022,800 2,017,900 2,024,000 2,044,801
Fire Protection 1,618,100 1,474,226 1,406,395 1,443,525 1,503,250 1,550,250 1,584,300 1,639,550 1,547,753
Provincial Emergency Program 92,000 57,751 78,704 92,000 92,000 92,000 92,000 92,000 92,000
Planning and Development 819,100 543,555 618,779 597,100 584,200 713,200 612,950 573,200 584,200
Animal and Pest Control 128,250 107,431 114,790 127,050 147,550 133,050 134,050 134,550 135,300
Police and Court House services 1,873,595 1,797,900 1,685,943 1,948,850 2,124,150 2,079,750 2,110,250 2,121,250 2,111,850
Public Works 4,234,402 4,212,302 4,235,941 4,521,674 4,844,625 4,761,428 4,707,309 4,694,294 4,751,362
Transit 339,000 376,307 311,530 339,000 369,000 369,000 369,000 369,000 369,000
Environmental Health (Garbage collection and Recycling) 427,900 417,404 371,695 417,650 395,500 399,000 407,750 411,750 415,250
Public Health and Welfare (Cemetery) 166,200 170,672 138,080 154,950 151,150 143,900 142,400 138,300 127,850
Community Economic Development 1,564,600 2,000,354 1,638,052 1,679,650 1,580,500 1,584,750 1,588,300 1,590,050 1,591,050
Recreation and Culture 3,186,060 2,911,008 2,975,567 3,212,560 3,337,435 3,177,735 3,253,910 3,284,110 3,240,735
Amortization of capital assets 1,200,000 1,214,914 1,342,147 1,200,000 1,200,000 1,200,000 1,200,000 1,200,000 1,200,000
Debt interest payments 591,646 563,182 557,336 567,001 564,401 564,401 685,901 804,901 804,901
Total operating expenses by Department 18,184,928 17,499,506 17,165,623 18,376,360 18,931,061 18,791,265 18,906,021 19,076,955 19,016,052
Operating (Surplus)/Deficit ‐1,144,590 ‐1,443,034 ‐862,689 ‐1,015,491 ‐691,082 ‐1,330,983 ‐2,371,162 ‐2,739,873 ‐3,342,612
Capital expenditures 4,361,663 1,788,562 2,111,717 1,211,721 2,410,247 1,861,532 9,545,309 2,096,849 1,588,167
Contributions from reserves ‐617,500 ‐233,102 ‐487,313 ‐790,000 ‐1,263,740 ‐1,051,000 ‐1,070,500 ‐435,500 ‐288,000
Contributions from DCC's 0 0 0 ‐50,000 ‐90,000 ‐540,000 ‐400,000 0 0
Contributions from Grants ‐1,245,000 ‐128,734 ‐303,655 ‐126,000 ‐726,000 ‐25,000 0 0 0
Debt proceeds ‐2,015,000 ‐986,122 ‐908,835 0 0 0 ‐7,000,000 0 0
Capital out of revenue 484,163 440,604 411,914 245,721 330,507 245,532 1,074,809 1,661,349 1,300,167
Debt principal 311,797 311,797 273,762 357,493 357,493 357,493 357,493 592,566 592,566
Transfer from equity in capital assets ‐1,200,000 ‐1,214,914 ‐1,342,147 ‐1,200,000 ‐1,200,000 ‐1,200,000 ‐1,200,000 ‐1,200,000 ‐1,200,000
Transfers to reserve 1,050,000 1,454,791 1,498,505 1,561,000 1,290,000 1,920,000 2,179,000 1,637,000 1,566,000
(Surplus)/Deficit ‐498,630 ‐450,756 ‐20,656 ‐51,277 86,919 ‐7,957 40,141 ‐48,958 ‐1,083,879
2013
Table 20 – General operating financial plan
2015‐2019FinancialPlan
15
Water Operating
Ave actual
last 3
years 2014 2015 2016 2017 2018 2019
Budget Actual Budget Budget Budget Budget Budget Budget
Revenues
Taxation and grants
Sale of services ‐1,590,012 ‐1,541,563 ‐1,478,522 ‐1,745,500 ‐1,818,671 ‐1,898,208 ‐2,045,086 ‐2,273,744 ‐2,731,061
Other & own sources 0
Provincial unconditional transfers 0
Provincial conditional transfers 0
DCC funding ‐2,060
Non‐ TCA funding ‐165,000 ‐75,678 ‐91,842 ‐100,500 ‐304,250 ‐102,250 ‐61,000 ‐50,000 ‐52,250
Other contributions & donations 0 0 0 0 0 0 0 0
Total Revenues ‐1,755,012 ‐1,617,241 ‐1,572,424 ‐1,846,000 ‐2,122,921 ‐2,000,458 ‐2,106,086 ‐2,323,744 ‐2,783,311
Operating Expenses by type
Employment costs 307,000 207,730 245,269 336,500 306,000 312,000 321,250 325,500 325,500
Travel and meeting expenses 8,500 2,754 2,171 8,500 3,500 3,500 4,000 4,000 4,000
Telephone 3,000 3,074 2,951 3,000 3,600 3,600 3,600 3,600 3,600
Advertising 2,000 150 50 2,000 2,000 2,000 2,000 2,000 2,000
Licences and insurance 23,750 27,787 23,972 24,000 19,250 19,250 19,500 19,500 19,750
Memberships & conferences 0 0 0 0 0 0 0 0 0
Contracted services 131,500 39,726 64,782 135,000 131,000 131,000 133,500 133,500 133,500
Office supplies 0 0 0 0 0 0 0 0 0
Utilities 58,550 50,294 56,103 60,050 60,600 61,100 62,650 62,650 62,650
Miscellaneous 117,500 117,370 119,440 117,500 117,500 117,500 117,500 117,500 117,501
Freight, courier & postage 2,500 3,189 4,008 2,500 2,500 2,500 2,500 2,500 2,500
Legal & professional 0 0 0 0 0 0 0 0 0
Maintenance of buildings & equipment 0 0 0 0 0 0 0 0 0
Materials & supplies 100,300 52,655 90,462 122,300 136,500 136,500 141,750 141,750 141,750
Equipment rental (internal & external) 25,500 11,860 9,509 28,500 28,500 28,500 28,500 28,500 28,500
Grants‐in‐aid 0 0 0 0 0 0 0 0 0
Vehicle maintenance & fuel 0 7,687 2,562 0 10,000 10,000 10,000 10,000 10,000
Non‐TCA expenditures 165,000 75,678 91,842 100,500 304,250 102,250 61,000 50,000 52,250
Amortization 400,000 270,484 295,536 400,000 400,000 400,000 400,000 400,000 400,000
Interest 296,048 296,048 294,172 296,048 296,048 307,098 318,148 318,148 318,148
Total operating expenses 1,641,148 1,166,486 1,302,829 1,636,398 1,821,248 1,636,798 1,625,898 1,619,148 1,621,649
Operating (surplus)/deficit ‐113,864 ‐450,755 ‐269,595 ‐209,603 ‐301,673 ‐363,660 ‐480,189 ‐704,596 ‐1,161,663
Capital expenditures 582,000 664,023 660,190 659,000 941,000 1,340,000 901,000 1,212,000 1,705,000
Contributions from reserves ‐582,000 ‐664,023 ‐266,491 ‐590,000 ‐866,000 ‐615,000 ‐706,000 ‐1,002,000 ‐1,280,000
Contributions from DCC's 0 0 0 0 0 0 0 0 0
Contributions from Grants 0 0 ‐193699 ‐69,000 ‐75,000 ‐75,000 ‐195,000 ‐210,000 ‐425,000
Debt proceeds 0 0 ‐200,000 0 0 ‐650,000 0 0 0
Capital out of revenue 0 0 0 0 0 0 0 0
Debt principal 152,085 152,085 147,283 152,085 152,085 152,085 173,914 173,914 173,914
Transfer from equity in capital assets ‐400,000 ‐270,484 ‐295,536 ‐400,000 ‐400,000 ‐400,000 ‐400,000 ‐400,000 ‐400,000
Transfers to reserve 350,000 550,000 466,667 320,000 550,000 800,000 800,000 900,000 1,350,000
(Surplus)/Deficit ‐11,779 ‐19,154 48,819 ‐137,518 412 188,425 93,725 ‐30,683 ‐37,749
2013
Table 21 – Water operating plan
2015‐2019FinancialPlan
16
Sewer Operating
Ave.
actual last
3 years 2014 2015 2016 2017 2018 2019
Budget Actual Budget Budget Budget Budget Budget Budget
Revenues
Taxation and grants ‐121,000 ‐122,731 ‐120,041 ‐242,000 ‐259,286 ‐276,571 ‐293,857 ‐311,143 ‐328,429
Sale of services ‐935,064 ‐958,141 ‐835,219 ‐974,552 ‐1,014,039 ‐1,058,912 ‐1,114,423 ‐1,134,166 ‐1,153,908
Other & own sources 0
Provincial unconditional transfers 0
Provincial conditional transfers 0
DCC funding
Non‐ TCA funding ‐55,000 ‐77,079 ‐249,757 ‐154,500 ‐221,250 ‐92,250 ‐115,500 ‐90,000 ‐92,250
Other contributions & donations ‐124,782 ‐124,782 ‐124,782 ‐124,782 ‐124,782 ‐130,167 ‐146,191 ‐167,515 ‐167,515
Total Revenues ‐1,235,846 ‐1,282,733 ‐1,329,800 ‐1,495,833 ‐1,619,356 ‐1,557,900 ‐1,669,972 ‐1,702,824 ‐1,742,102
Operating Expenses by type
Employment costs 205,250 217,246 230,815 213,000 237,750 242,500 246,250 246,250 246,250
Travel and meeting expenses 5,500 555 381 5,500 3,000 3,000 3,000 3,000 3,000
Telephone 2,000 1,927 1,406 2,000 2,000 2,000 2,000 2,000 2,000
Advertising 300 0 0 300 300 300 300 300 300
Licences and insurance 10,000 10,418 9,147 10,500 12,000 12,000 12,000 12,000 12,000
Memberships & conferences 0 0 0 0 0 0 0 0 0
Contracted services 54,800 49,317 32,138 55,800 56,800 56,800 58,800 58,800 58,800
Office supplies 0 0 0 0 0 0 0 0 0
Utilities 77,500 70,207 73,004 79,000 80,500 82,000 83,500 83,500 83,500
Miscellaneous 116,800 116,769 117,268 117,300 117,800 117,800 118,300 118,300 118,300
Freight, courier & postage 2,100 11,911 11,956 2,100 11,400 11,400 11,400 11,400 11,400
Legal & professional 0 0 0 0 0 0 0 0 0
Maintenance of buildings & equipment 0 0 0 0 0 0 0 0 0
Materials & supplies 86,000 73,209 78,274 87,500 88,500 90,000 92,000 92,000 92,000
Equipment rental (internal & external) 39,100 47,321 40,295 40,200 58,300 58,300 58,400 58,400 58,400
Grants‐in‐aid 0 0 0 0 0 0 0 0 0
Vehicle maintenance & fuel 0 4,749 1,583 0 6,000 6,000 6,000 6,000 6,000
Non‐TCA expenditures 55,000 77,079 251,815 154,500 221,250 92,250 115,500 90,000 92,250
Amortization 125,000 196,442 199,449 125,000 125,000 125,000 125,000 125,000 125,000
Interest 168,649 168,649 161,823 168,649 168,649 174,089 179,529 201,068 201,068
Total operating expenses by type 947,999 1,045,799 1,209,353 1,061,349 1,189,249 1,073,439 1,111,979 1,108,018 1,110,268
Operating (surplus)/deficit ‐287,847 ‐236,934 ‐120,446 ‐434,485 ‐430,107 ‐484,461 ‐557,993 ‐594,806 ‐631,834
Capital expenditures 919,000 0 193,480 827,500 350,000 930,000 425,000 3,190,000 4,259,000
Contributions from reserves ‐619,000 0 ‐3,952 ‐527,500 ‐350,000 ‐610,000 ‐425,000 ‐590,000 ‐550,000
Contributions from DCC's ‐300,000 0 0 ‐300,000 0 0 0 0 0
Contributions from Grants 0 0 ‐126,352 0 0 0 0 ‐1,333,000 ‐2,473,000
Debt proceeds 0 0 ‐63,176 0 0 ‐320,000 0 ‐1,267,000 ‐1,236,000
Capital out of revenue 0 0 0 0 0 0 0 0
Debt principal 111,246 111,246 88,494 111,246 111,246 111,246 121,992 121,992 121,992
Transfer from equity in capital assets ‐125,000 ‐196,442 ‐199,449 ‐125,000 ‐125,000 ‐125,000 ‐125,000 ‐125,000 ‐125,000
Transfers to reserve 200,000 225,000 155,000 730,000 300,000 550,000 550,000 550,000 750,000
(Surplus)/Deficit ‐101,601 ‐97,130 ‐76,401 281,761 ‐143,862 51,784 ‐11,001 ‐47,814 115,158
2013
Table 22 – Sewer operating plan
2015‐2019FinancialPlan
17
General Operating Ave. Actual 2014 2015 2016 2017 2018 2019
Contracted Services Budget Actual Last 3 years Budget Budget Budget Budget Budget Budget
Blue #'s are offset by equivalent revenues
Mayor and Council 19,700 15,771 17,284 20,000 26,000 26,000 26,000 26,000 26,000
City property 0 321 189 500 500 500 500 500 500
City Hall maintenance 3,250 4,098 3,777 4,750 5,250 5,250 5,750 5,750 5,750
Administration/Finance 3,000 2,752 2,802 3,000 3,000 3,000 3,500 3,500 3,500
Elections & Referendums 0 0 5,209 20,000 0 1,000 20,000 25,000 0
Labour management 11,650 3,037 10,125 11,650 2,500 2,500 2,500 2,500 2,500
Fire Department Administration 0 25 0 0 0 0 0 0 0
Fire Fighting force 25,000 27,074 21,511 25,000 30,000 30,000 30,000 32,000 32,000
Fire station 0 3,229 1,436 0 0 0 0 0 1
PEP 3,600 16,864 14,111 3,600 3,600 3,600 3,600 3,600 3,600
Emergency Programme Coordinator 56,000 11,774 25,583 56,000 56,000 56,000 56,000 56,000 56,000
ESS Coordinator 9,000 16,697 15,380 9,000 9,000 9,000 9,000 9,000 9,000
Planning 50,000 24,860 46,116 50,000 5,000 5,000 5,000 5,000 5,000
Planning ‐ funded 20,000 0 0 20,000 0 0 0 0 0
Animal & Pest control 99,250 95,642 96,000 100,000 110,000 110,000 110,000 110,000 110,000
Police station 19,000 19,474 20,424 19,000 32,000 32,000 32,000 32,000 32,000
RCMP 1,200,000 1,169,792 1,073,065 1,250,000 1,260,000 1,275,000 1,300,000 1,325,000 1,350,000
RCMP Overtime 60,000 42,473 42,160 60,000 65,000 65,000 65,000 70,000 70,000
RCMP Prisoner costs 60,000 46,593 48,104 60,000 80,000 80,000 80,000 85,000 85,000
Victim Services 44,695 54,485 53,033 55,000 55,000 56,000 56,500 57,000 57,000
Court House 27,800 35,937 33,447 42,800 42,800 43,800 43,800 44,800 44,800
Engineering ‐ consulting fees 0 1,085 1,528 0 0 0 0 0 0
Public Works administration 0 300 688 0 0 0 0 0 0
Engineering services 2,400 18,565 12,240 7,000 7,000 7,000 7,500 7,500 7,500
Equipment maintenance 9,750 12,475 12,835 9,750 12,750 12,750 12,750 12,750 12,750
Municipal yards & buildings 15,000 31,974 28,748 27,000 27,000 27,000 27,500 27,500 27,500
Street maintenance 85,000 66,631 62,546 85,000 86,000 86,000 87,000 87,000 87,000
Sidewalk maintenance 5,000 1,124 2,255 5,000 5,000 5,000 5,000 5,000 5,000
Drainage Ditch maintenance 0 31 46,384 0 0 0 0 0 0
Storm Sewer maintenance 4,000 948 1,339 4,000 4,000 4,000 4,000 4,000 4,000
Snow removal 345,900 288,021 358,048 378,400 335,000 364,400 365,000 365,000 365,000
Custom work 1,050 7,075 5,068 1,050 1,050 1,050 1,100 1,100 1,100
Street lighting 15,000 15,193 12,791 15,000 16,000 16,000 16,000 16,000 16,000
Traffic services 3,500 1,260 1,040 3,500 3,500 3,500 3,500 3,500 3,500
Railway Crossing maintenance 15,000 12,148 13,186 12,000 12,000 12,000 12,000 12,000 12,001
Bridge maintenance 1,000 1,106 935 1,000 15,000 15,000 15,000 15,000 15,000
Gravel pit 0 0 312 0 0 0 0 0 0
Transit 336,500 367,208 307,189 336,500 366,500 366,500 366,500 366,500 366,500
Garbage collection 2,500 1,432 1,695 2,500 2,750 2,750 3,000 3,000 3,000
Recycling 110,000 110,025 73,440 110,000 0 0 0 0 0
Garbage bins 25,000 6,270 9,166 15,000 15,000 15,000 15,000 15,000 15,000
Cemetery 1,000 315 474 1,000 1,000 1,000 1,000 1,000 1,000
Tourism & Public Relations 45,000 45,000 45,000 45,000 45,000 45,000 45,000 45,000 45,000
Ski Hill 0 0 1,760 0 0 0 0 0 0
Economic Development 25,000 26,655 24,638 32,000 32,000 32,000 32,000 32,000 32,000
Recreation administration 1,500 900 882 2,000 2,000 1,500 1,500 1,500 1,500
Community centre 2,000 7,721 5,579 11,000 11,000 11,000 11,000 11,000 11,000
Community Centre ‐ snow removal 6,000 1,719 3,128 6,000 15,000 15,000 15,000 15,000 15,000
Aquatic centre 2,351 2,922 1,800 1,800 1,800 1,800 1,800 1,800
Arena 37,500 31,154 24,325 39,500 57,000 57,000 57,000 57,000 57,000
Williamson's Lake 2,750 1,185 629 2,750 2,750 2,750 3,000 3,000 3,000
Boulevard maintenance 8,000 1,636 4,412 4,000 4,000 4,000 4,000 4,000 4,000
Revit maintenance 14,000 6,447 6,428 11,000 11,000 11,500 12,500 13,500 13,500
Parks ‐ general 30,000 21,456 17,984 35,500 29,000 29,000 35,000 35,000 35,000
Columbia View Park 500 0 0 2,500 1,000 500 500 500 500
Museum 4,000 6,818 6,746 4,000 6,000 6,000 6,000 6,000 6,000
Trails & Walkways 5,500 0 6,587 5,500 7,500 7,500 9,000 9,000 9,000
SILGA Convention 0 0 2,808 0 0 0 0 0 0
TOTAL 2,871,295 2,687,126 2,635,488 3,026,550 2,920,250 2,967,150 3,024,300 3,068,800 3,068,802
2013
Table 23 – General operating contracted services
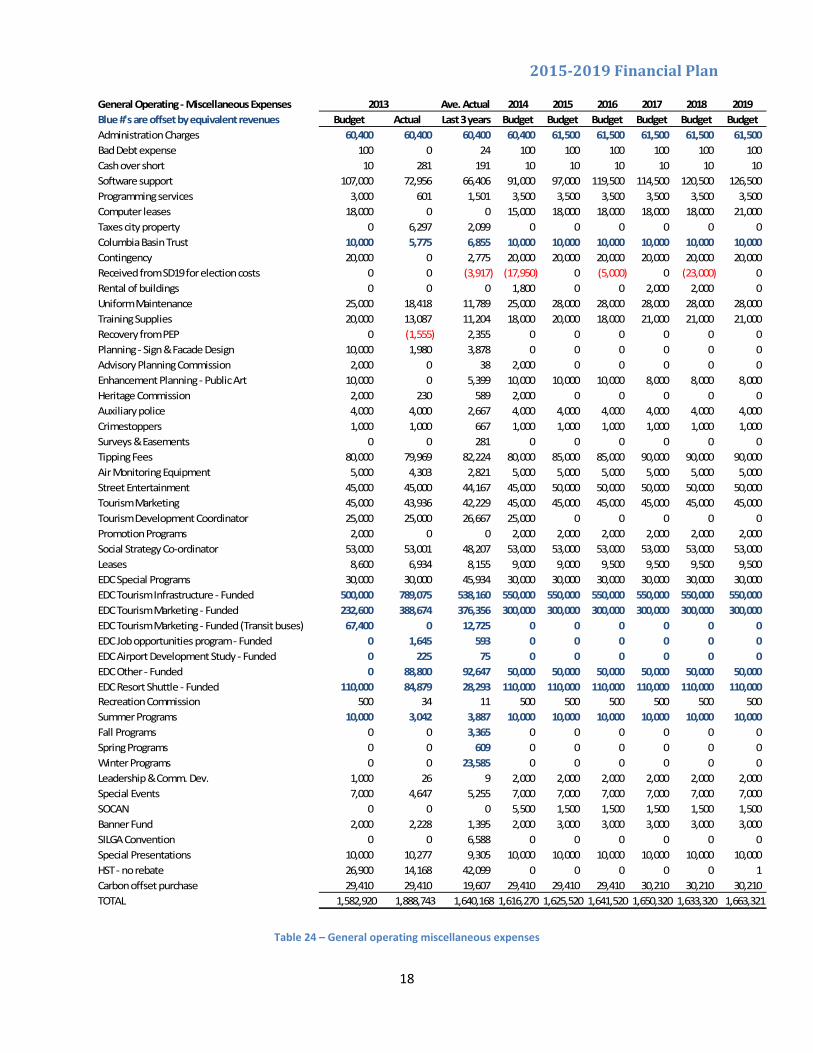
2015‐2019FinancialPlan
18
General Operating ‐ Miscellaneous Expenses Ave. Actual 2014 2015 2016 2017 2018 2019
Blue #'s are offset by equivalent revenues Budget Actual Last 3 years Budget Budget Budget Budget Budget Budget
Administration Charges 60,400 60,400 60,400 60,400 61,500 61,500 61,500 61,500 61,500
Bad Debt expense 100 0 24 100 100 100 100 100 100
Cash over short 10 281 191 10 10 10 10 10 10
Software support 107,000 72,956 66,406 91,000 97,000 119,500 114,500 120,500 126,500
Programming services 3,000 601 1,501 3,500 3,500 3,500 3,500 3,500 3,500
Computer leases 18,000 0 0 15,000 18,000 18,000 18,000 18,000 21,000
Taxes city property 0 6,297 2,099 0 0 0 0 0 0
Columbia Basin Trust 10,000 5,775 6,855 10,000 10,000 10,000 10,000 10,000 10,000
Contingency 20,000 0 2,775 20,000 20,000 20,000 20,000 20,000 20,000
Received from SD19 for election costs 0 0 (3,917) (17,950) 0 (5,000) 0 (23,000) 0
Rental of buildings 0 0 0 1,800 0 0 2,000 2,000 0
Uniform Maintenance 25,000 18,418 11,789 25,000 28,000 28,000 28,000 28,000 28,000
Training Supplies 20,000 13,087 11,204 18,000 20,000 18,000 21,000 21,000 21,000
Recovery from PEP 0 (1,555) 2,355 0 0 0 0 0 0
Planning ‐ Sign & Facade Design 10,000 1,980 3,878 0 0 0 0 0 0
Advisory Planning Commission 2,000 0 38 2,000 0 0 0 0 0
Enhancement Planning ‐ Public Art 10,000 0 5,399 10,000 10,000 10,000 8,000 8,000 8,000
Heritage Commission 2,000 230 589 2,000 0 0 0 0 0
Auxiliary police 4,000 4,000 2,667 4,000 4,000 4,000 4,000 4,000 4,000
Crimestoppers 1,000 1,000 667 1,000 1,000 1,000 1,000 1,000 1,000
Surveys & Easements 0 0 281 0 0 0 0 0 0
Tipping Fees 80,000 79,969 82,224 80,000 85,000 85,000 90,000 90,000 90,000
Air Monitoring Equipment 5,000 4,303 2,821 5,000 5,000 5,000 5,000 5,000 5,000
Street Entertainment 45,000 45,000 44,167 45,000 50,000 50,000 50,000 50,000 50,000
Tourism Marketing 45,000 43,936 42,229 45,000 45,000 45,000 45,000 45,000 45,000
Tourism Development Coordinator 25,000 25,000 26,667 25,000 0 0 0 0 0
Promotion Programs 2,000 0 0 2,000 2,000 2,000 2,000 2,000 2,000
Social Strategy Co‐ordinator 53,000 53,001 48,207 53,000 53,000 53,000 53,000 53,000 53,000
Leases 8,600 6,934 8,155 9,000 9,000 9,500 9,500 9,500 9,500
EDC Special Programs 30,000 30,000 45,934 30,000 30,000 30,000 30,000 30,000 30,000
EDC Tourism Infrastructure ‐ Funded 500,000 789,075 538,160 550,000 550,000 550,000 550,000 550,000 550,000
EDC Tourism Marketing ‐ Funded 232,600 388,674 376,356 300,000 300,000 300,000 300,000 300,000 300,000
EDC Tourism Marketing ‐ Funded (Transit buses) 67,400 0 12,725 0 0 0 0 0 0
EDC Job opportunities program ‐ Funded 0 1,645 593 0 0 0 0 0 0
EDC Airport Development Study ‐ Funded 0 225 75 0 0 0 0 0 0
EDC Other ‐ Funded 0 88,800 92,647 50,000 50,000 50,000 50,000 50,000 50,000
EDC Resort Shuttle ‐ Funded 110,000 84,879 28,293 110,000 110,000 110,000 110,000 110,000 110,000
Recreation Commission 500 34 11 500 500 500 500 500 500
Summer Programs 10,000 3,042 3,887 10,000 10,000 10,000 10,000 10,000 10,000
Fall Programs 0 0 3,365 0 0 0 0 0 0
Spring Programs 0 0 609 0 0 0 0 0 0
Winter Programs 0 0 23,585 0 0 0 0 0 0
Leadership & Comm. Dev. 1,000 26 9 2,000 2,000 2,000 2,000 2,000 2,000
Special Events 7,000 4,647 5,255 7,000 7,000 7,000 7,000 7,000 7,000
SOCAN 0 0 0 5,500 1,500 1,500 1,500 1,500 1,500
Banner Fund 2,000 2,228 1,395 2,000 3,000 3,000 3,000 3,000 3,000
SILGA Convention 0 0 6,588 0 0 0 0 0 0
Special Presentations 10,000 10,277 9,305 10,000 10,000 10,000 10,000 10,000 10,000
HST ‐ no rebate 26,900 14,168 42,099 0 0 0 0 0 1
Carbon offset purchase 29,410 29,410 19,607 29,410 29,410 29,410 30,210 30,210 30,210
TOTAL 1,582,920 1,888,743 1,640,168 1,616,270 1,625,520 1,641,520 1,650,320 1,633,320 1,663,321
2013
Table 24 – General operating miscellaneous expenses