ChromaBlur: Rendering Chromatic Eye Aberration...
12
ChromaBlur: Rendering Chromatic Eye Aberration Improves Accommodation and Realism STEVEN A. CHOLEWIAK, University of California, Berkeley GORDON D. LOVE, Durham University PRATUL P. SRINIVASAN, University of California, Berkeley REN NG, University of California, Berkeley MARTIN S. BANKS, University of California, Berkeley ChromaBlur Displayed Image Image LCA Retinal Image farther nearer Fig. 1. Leſt: The pipeline for ChromaBlur rendering. The human eye has chromatic aberration, which produces depth-dependent chromatic effects on the retina: blue is focused in front of the retina and red behind. We calculate the image to be displayed that, when processed by the viewer’s in-focus eye, will produce the correct chromatic effects on the viewer’s retina for the simulated 3d scene. Right: Displayed image produced by ChromaBlur. The viewer is focused on the ball. Objects at other distances are blurred, but differently depending on whether they are farther (blue outline) or nearer (red) than the current focus distance. Computer-graphics engineers and vision scientists want to generate images that reproduce realistic depth-dependent blur. Current rendering algorithms take into account scene geometry, aperture size, and focal distance, and they produce photorealistic imagery as with a high-quality camera. But to create immersive experiences, rendering algorithms should aim instead for perceptual realism. In so doing, they should take into account the signif- icant optical aberrations of the human eye. We developed a method that, by incorporating some of those aberrations, yields displayed images that produce retinal images much closer to the ones that occur in natural view- ing. In particular, we create displayed images taking the eye’s chromatic aberration into account. is produces different chromatic effects in the retinal image for objects farther or nearer than current focus. We call the method ChromaBlur. We conducted two experiments that illustrate the benefits of ChromaBlur. One showed that accommodation (eye focusing) is driven quite effectively when ChromaBlur is used and that accommoda- tion is not driven at all when conventional methods are used. e second showed that perceived depth and realism are greater with imagery created by ChromaBlur than in imagery created conventionally. ChromaBlur can be coupled with focus-adjustable lenses and gaze tracking to reproduce the natural relationship between accommodation and blur in HMDs and Permission to make digital or hard copies of all or part of this work for personal or classroom use is granted without fee provided that copies are not made or distributed for profit or commercial advantage and that copies bear this notice and the full citation on the first page. Copyrights for components of this work owned by others than the author(s) must be honored. Abstracting with credit is permied. To copy otherwise, or republish, to post on servers or to redistribute to lists, requires prior specific permission and/or a fee. Request permissions from [email protected]. © 2017 Copyright held by the owner/author(s). Publication rights licensed to ACM. 0730-0301/2017/11-ART210 $15.00 DOI: 10.1145/3130800.3130815 other immersive devices. It may thereby minimize the adverse effects of vergence-accommodation conflicts. CCS Concepts: •Computing methodologies → Perception; Rendering; Virtual reality; Mixed / augmented reality; Additional Key Words and Phrases: chromatic aberration, accommodation, vergence-accommodation conflict, head-mounted displays ACM Reference format: Steven A. Cholewiak, Gordon D. Love, Pratul P. Srinivasan, Ren Ng, and Mar- tin S. Banks. 2017. ChromaBlur: Rendering Chromatic Eye Aberration Im- proves Accommodation and Realism. ACM Trans. Graph. 36, 6, Article 210 (November 2017), 12 pages. DOI: 10.1145/3130800.3130815 1 INTRODUCTION Seeing in three dimensions is a construction based on several depth cues. Rendering and display techniques are designed to reproduce those cues and thereby enable enriching 3d experiences. e meth- ods for presenting perspective-based depth cues (e.g., linear perspec- tive, texture gradient, relative size) and light-transport-based cues (e.g., shading, aerial perspective, occlusion) are well understood. Advances have also been made in reproducing triangulation-based depth cues (binocular disparity, motion parallax, and focus cues). Stereoscopic displays and direct-view, autostereoscopic displays enable effective presentation of disparity; head-mounted displays (HMDs) with head tracking enable motion parallax as well. e ACM Transactions on Graphics, Vol. 36, No. 6, Article 210. Publication date: November 2017.
Transcript of ChromaBlur: Rendering Chromatic Eye Aberration...
ChromaBlur: Rendering Chromatic Eye Aberration ImprovesAccommodation and Realism
STEVEN A. CHOLEWIAK, University of California, Berkeley
GORDON D. LOVE, Durham University
PRATUL P. SRINIVASAN, University of California, Berkeley
REN NG, University of California, Berkeley
MARTIN S. BANKS, University of California, Berkeley
ChromaBlur
Displayed
ImageImage
LCA
Retinal
Image
farther
nearer
Fig. 1. Le�: The pipeline for ChromaBlur rendering. The human eye has chromatic aberration, which produces depth-dependent chromatic e�ects on the
retina: blue is focused in front of the retina and red behind. We calculate the image to be displayed that, when processed by the viewer’s in-focus eye, will
produce the correct chromatic e�ects on the viewer’s retina for the simulated 3d scene. Right: Displayed image produced by ChromaBlur. The viewer is
focused on the ball. Objects at other distances are blurred, but di�erently depending on whether they are farther (blue outline) or nearer (red) than the current
focus distance.
Computer-graphics engineers and vision scientists want to generate images
that reproduce realistic depth-dependent blur. Current rendering algorithms
take into account scene geometry, aperture size, and focal distance, and
they produce photorealistic imagery as with a high-quality camera. But to
create immersive experiences, rendering algorithms should aim instead for
perceptual realism. In so doing, they should take into account the signif-
icant optical aberrations of the human eye. We developed a method that,
by incorporating some of those aberrations, yields displayed images that
produce retinal images much closer to the ones that occur in natural view-
ing. In particular, we create displayed images taking the eye’s chromatic
aberration into account. �is produces di�erent chromatic e�ects in the
retinal image for objects farther or nearer than current focus. We call the
method ChromaBlur. We conducted two experiments that illustrate the
bene�ts of ChromaBlur. One showed that accommodation (eye focusing)
is driven quite e�ectively when ChromaBlur is used and that accommoda-
tion is not driven at all when conventional methods are used. �e second
showed that perceived depth and realism are greater with imagery created
by ChromaBlur than in imagery created conventionally. ChromaBlur can
be coupled with focus-adjustable lenses and gaze tracking to reproduce
the natural relationship between accommodation and blur in HMDs and
Permission to make digital or hard copies of all or part of this work for personal orclassroom use is granted without fee provided that copies are not made or distributedfor pro�t or commercial advantage and that copies bear this notice and the full citationon the �rst page. Copyrights for components of this work owned by others than theauthor(s) must be honored. Abstracting with credit is permi�ed. To copy otherwise, orrepublish, to post on servers or to redistribute to lists, requires prior speci�c permissionand/or a fee. Request permissions from [email protected].
© 2017 Copyright held by the owner/author(s). Publication rights licensed to ACM.0730-0301/2017/11-ART210 $15.00DOI: 10.1145/3130800.3130815
other immersive devices. It may thereby minimize the adverse e�ects of vergence-accommodation con�icts.
CCS Concepts: •Computing methodologies → Perception; Rendering; Virtual reality; Mixed / augmented reality;
Additional Key Words and Phrases: chromatic aberration, accommodation, vergence-accommodation con�ict, head-mounted displays
ACM Reference format:
Steven A. Cholewiak, Gordon D. Love, Pratul P. Srinivasan, Ren Ng, and Mar-
tin S. Banks. 2017. ChromaBlur: Rendering Chromatic Eye Aberration Im-
proves Accommodation and Realism. ACM Trans. Graph. 36, 6, Article 210 (November 2017), 12 pages.DOI: 10.1145/3130800.3130815
1 INTRODUCTION
Seeing in three dimensions is a construction based on several depth cues. Rendering and display techniques are designed to reproduce those cues and thereby enable enriching 3d experiences. �e meth-
ods for presenting perspective-based depth cues (e.g., linear perspec-tive, texture gradient, relative size) and light-transport-based cues (e.g., shading, aerial perspective, occlusion) are well understood. Advances have also been made in reproducing triangulation-based depth cues (binocular disparity, motion parallax, and focus cues). Stereoscopic displays and direct-view, autostereoscopic displays enable e�ective presentation of disparity; head-mounted displays (HMDs) with head tracking enable motion parallax as well. �e
ACM Transactions on Graphics, Vol. 36, No. 6, Article 210. Publication date: November 2017.
210:2 • Cholewiak, Love, Srinivasan, Ng, and Banks
most challenging remaining problem is the reproduction of focus
cues: blur and accommodation.
Blur by itself is o�en considered a weak depth cue because it is
said to be unsigned [Mather and Smith 2002]: i.e., the same blur
arises whether an object is farther or nearer than the eye’s current
focus distance. But natural blur actually does contain sign informa-
tion and can be used to drive accommodation in the correct direction
[Kruger et al. 1993] and to perceive depth order [Nguyen et al. 2005;
Zannoli et al. 2016]. One such optical signal that speci�es sign is
chromatic aberration, and we capitalize on it here.
In natural viewing, the rate at which blur changes with distance
from the focal plane–i.e., depth-of-�eld (DoF) blur–depends on
focal distance, object distances relative to that distance, and pupil
diameter. DoF blur has powerful e�ects on depth perception and
perceived realism. If DoF is increased, the scene appears magni�ed;
if it is decreased, the scene looks miniature. �us, se�ing DoF
to the appropriate value enables accurate perception of scale and
depth [Held et al. 2010; Vishwanath and Blaser 2010] and increases
perceived realism [Mauderer et al. 2014; Zhang et al. 2015].
Traditionally, rendering has focused on “photorealism”: simu-
lating images from a camera with a pinhole or idealized lenses
without aberrations. Even simulation of realistic optics has focused
on ray-tracing camera lenses [Kolb et al. 1995; Ng and Hanrahan
2006] with well-corrected aberrations. In contrast, rendering for
virtual reality (VR) should emphasize “perceptual realism” to enable
immersion in a virtual environment. In this quest for perceptual
realism, an important but neglected property of the visual system is
the imperfect optics of the human eye. Real images on the retina are
aberrated and are therefore not close to photorealistic images. Here
we describe how to implement rendering that incorporates natural
aberrations; this involves calculating what the retinal image should
be and then computing the displayed image that, when processed
through the viewer’s aberrated eye, creates the intended, natural
retinal image. We concentrate on two signi�cant and universal
aberrations1: defocus and chromatic aberration.
Our contribution is three-fold. 1) We develop a color-correct
rendering method–ChromaBlur–that incorporates defocus and the
eye’s natural chromatic aberration to generate retinal images that
are close to those created in viewing the real world. 2) We show
that this rendering method drives accommodation e�ectively. 3)
We show that the method yields a greater impression of depth than
conventional rendering.
2 RELATED WORK
Realistic image synthesis in graphics has focused on computing the
images produced by camera systems. Kolb et al. [1995] introduced
realistic camera models by physically-based ray tracing [Pharr and
Humphreys 2014] of optical formulas for camera lenses. Steinert et
al. [2011] extended this approach to include spectral e�ects such
as chromatic aberration. Our work takes a di�erent approach by
creating images to display that will create realistic retinal images
rather than minimally aberrated images like those inside a camera.
1By signi�cant we mean that the magnitude of the e�ect on the retinal image is largeenough to be perceived. By universal we mean that there is li�le, if any, variationacross individuals.
Some graphics researchers [Barsky 2004; Kakimoto et al. 2007;
Mostafawy et al. 1997; Nießner et al. 2012; Tang and Xiao 2015;
Wu et al. 2011] have pursued rendering of retinal images with the
goal of visualizing optical e�ects due to human eye aberrations.
Most used ray-tracing in the style of Kolb, employing accurate eye
models from the vision science literature [Polans et al. 2015]. Barsky
used Shack-Hartmann wavefront measurements of highly aberrated
eyes. �ese graphics algorithms have many uses including giving
customers an impression of how di�erent types of correction with
spectacles, contact lenses, or LASIK surgery will aid their vision.
But the goal in that previous work was quite di�erent from ours.
Deering’s eye model [2005] accounts for chromatic aberration
because he wanted to calculate an accurate photon count at each
photoreceptor. One of his goals was principled evaluation of display
system designs, but his model stopped at photometric calculations
before considering human perception or response. In contrast, a
central contribution of our work is measuring perceptual and oculo-
motor responses due to the eye’s defocus and chromatic aberration.
Important perceptual and ergonomic issues arise from the way
blur is reproduced and whether accommodation is enabled or not.
Many of the issues are due to the vergence-accommodation con�ict.
Vergence and accommodation are neurally coupled [Schor 1992],
which is bene�cial in the real world where the distances to which
the eyes should converge and focus are always the same. But the
coupling is broken by conventional stereoscopic displays because
such displays require the viewer to converge to one distance (that
of the virtual object) while accommodating to another (the display
screen). �e resulting vergence-accommodation con�ict causes
visual discomfort [Ho�man et al. 2008; Koulieris et al. 2017; Lambooij
et al. 2009; Shibata et al. 2011], reductions in performance [Akeley
et al. 2004; Johnson et al. 2016; Konrad et al. 2016; Maiello et al. 2014],
and distortions of perceived depth [Wa� et al. 2005]. Our work
provides an opportunity to control accommodation more e�ectively
and thereby minimize the vergence-accommodation con�ict.
3 OPTICAL ABERRATIONS OF THE EYE
Although the human eye has a variety of �eld-dependent optical
imperfections, we restrict our analysis to on-axis e�ects because
optical imperfections are much more noticeable near the fovea and
because optical quality is reasonably constant over the central 10◦ of
the visual �eld [Navarro et al. 1993]. In this section, we describe why
we choose to incorporate only defocus and chromatic aberration
in our rendering method and why we ignored other imperfections
that could have been incorporated.
3.1 Defocus
Defocus is caused by the eye being focused at a di�erent distance
than the object. In most eyes defocus constitutes the great majority
of the total deviation from an ideal optical system [Cheng et al. 2004;
Porter et al. 2001]. �e function of accommodation is to minimize
defocus. �e point-spread function (PSF) due to defocus alone is a
disk whose diameter depends on the magnitude of defocus and diam-
eter of the pupil. �e disk diameter is given to close approximation
by:
β ≈ A
�
�
�
�
1
z0−
1
z1
�
�
�
�
= A |∆D | (1)
ACM Transactions on Graphics, Vol. 36, No. 6, Article 210. Publication date: November 2017.
ChromaBlur • 210:3
where β is in angular units, A is pupil diameter, z0 is distance to
which the eye is focused, z1 is distance to the object creating the
blurred image, and ∆D is the di�erence in those distances in diopters
[Held et al. 2010]. Importantly, the PSF due to defocus alone is
identical whether the object is farther or nearer than the eye’s
current focus. �us, rendering of defocus is the same for far and
near parts of the scene.
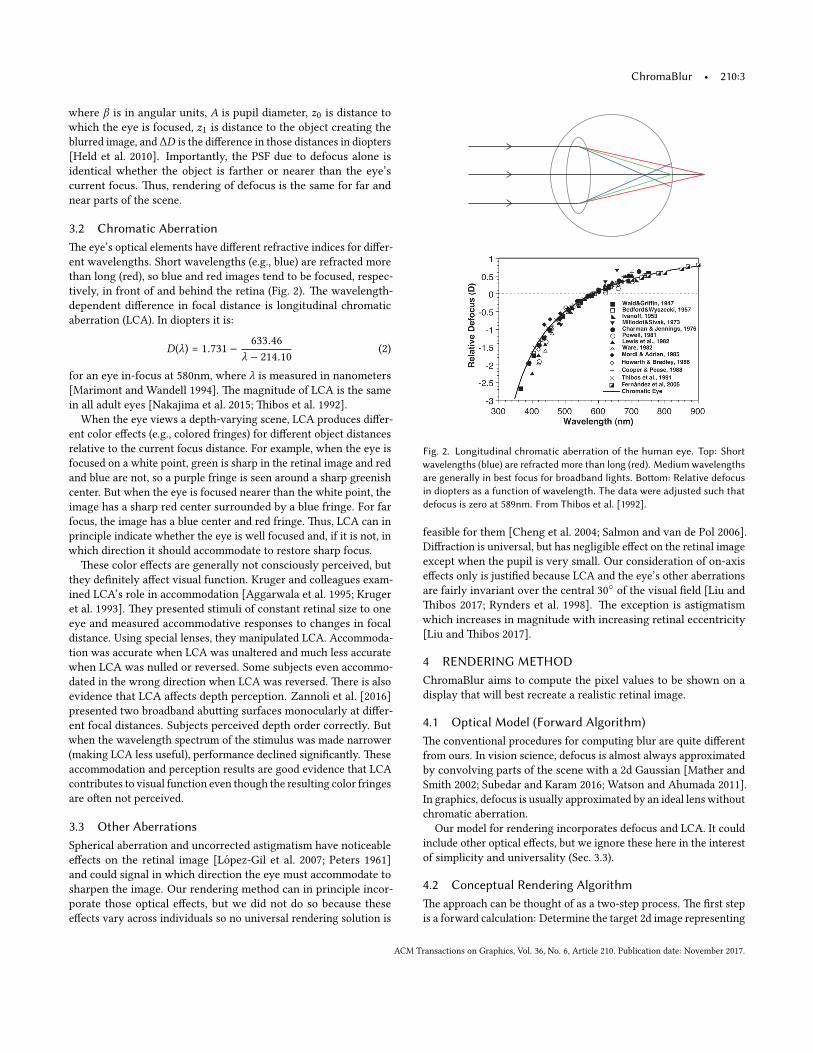
3.2 Chromatic Aberration
�e eye’s optical elements have di�erent refractive indices for di�er-
ent wavelengths. Short wavelengths (e.g., blue) are refracted more
than long (red), so blue and red images tend to be focused, respec-
tively, in front of and behind the retina (Fig. 2). �e wavelength-
dependent di�erence in focal distance is longitudinal chromatic
aberration (LCA). In diopters it is:
D(λ) = 1.731 −633.46
λ − 214.10(2)
for an eye in-focus at 580nm, where λ is measured in nanometers
[Marimont and Wandell 1994]. �e magnitude of LCA is the same
in all adult eyes [Nakajima et al. 2015; �ibos et al. 1992].
When the eye views a depth-varying scene, LCA produces di�er-
ent color e�ects (e.g., colored fringes) for di�erent object distances
relative to the current focus distance. For example, when the eye is
focused on a white point, green is sharp in the retinal image and red
and blue are not, so a purple fringe is seen around a sharp greenish
center. But when the eye is focused nearer than the white point, the
image has a sharp red center surrounded by a blue fringe. For far
focus, the image has a blue center and red fringe. �us, LCA can in
principle indicate whether the eye is well focused and, if it is not, in
which direction it should accommodate to restore sharp focus.
�ese color e�ects are generally not consciously perceived, but
they de�nitely a�ect visual function. Kruger and colleagues exam-
ined LCA’s role in accommodation [Aggarwala et al. 1995; Kruger
et al. 1993]. �ey presented stimuli of constant retinal size to one
eye and measured accommodative responses to changes in focal
distance. Using special lenses, they manipulated LCA. Accommoda-
tion was accurate when LCA was unaltered and much less accurate
when LCA was nulled or reversed. Some subjects even accommo-
dated in the wrong direction when LCA was reversed. �ere is also
evidence that LCA a�ects depth perception. Zannoli et al. [2016]
presented two broadband abu�ing surfaces monocularly at di�er-
ent focal distances. Subjects perceived depth order correctly. But
when the wavelength spectrum of the stimulus was made narrower
(making LCA less useful), performance declined signi�cantly. �ese
accommodation and perception results are good evidence that LCA
contributes to visual function even though the resulting color fringes
are o�en not perceived.
3.3 Other Aberrations
Spherical aberration and uncorrected astigmatism have noticeable
e�ects on the retinal image [Lopez-Gil et al. 2007; Peters 1961]
and could signal in which direction the eye must accommodate to
sharpen the image. Our rendering method can in principle incor-
porate those optical e�ects, but we did not do so because these
e�ects vary across individuals so no universal rendering solution is
Fig. 2. Longitudinal chromatic aberration of the human eye. Top: Short
wavelengths (blue) are refracted more than long (red). Medium wavelengths
are generally in best focus for broadband lights. Bo�om: Relative defocus
in diopters as a function of wavelength. The data were adjusted such that
defocus is zero at 589nm. From Thibos et al. [1992].
feasible for them [Cheng et al. 2004; Salmon and van de Pol 2006].
Di�raction is universal, but has negligible e�ect on the retinal image
except when the pupil is very small. Our consideration of on-axis
e�ects only is justi�ed because LCA and the eye’s other aberrations
are fairly invariant over the central 30◦ of the visual �eld [Liu and
�ibos 2017; Rynders et al. 1998]. �e exception is astigmatism
which increases in magnitude with increasing retinal eccentricity
[Liu and �ibos 2017].
4 RENDERING METHOD
ChromaBlur aims to compute the pixel values to be shown on a
display that will best recreate a realistic retinal image.
4.1 Optical Model (Forward Algorithm)
�e conventional procedures for computing blur are quite di�erent
from ours. In vision science, defocus is almost always approximated
by convolving parts of the scene with a 2d Gaussian [Mather and
Smith 2002; Subedar and Karam 2016; Watson and Ahumada 2011].
In graphics, defocus is usually approximated by an ideal lens without
chromatic aberration.
Our model for rendering incorporates defocus and LCA. It could
include other optical e�ects, but we ignore these here in the interest
of simplicity and universality (Sec. 3.3).
4.2 Conceptual Rendering Algorithm
�e approach can be thought of as a two-step process. �e �rst step
is a forward calculation: Determine the target 2d image representing
ACM Transactions on Graphics, Vol. 36, No. 6, Article 210. Publication date: November 2017.
210:4 • Cholewiak, Love, Srinivasan, Ng, and Banks
the signal that would have appeared on the retina in response to a
given scene. �e second step is an inverse problem: Determine the
pixel values for an image to display that, when viewed by the eye,
will produce a retinal image that best approximates the target image.
In this step we assume that the viewing eye is accommodated on the
display screen, so that the green primary is focused on the retina
while red and blue are not. We created two algorithms (2d and 3d),
which are quite di�erent in operation, but are both based on the
two-step process.
4.3 2d ChromaBlur Algorithm
�e accommodation experiments presented here use a 2d scene
composed of a textured plane at di�erent distances. We render
these scenes with the 2d ChromaBlur algorithm, which is a physical
(wave) optics simulation incorporating defocus, LCA, and di�raction.
Given a target retinal image I {R,G,B }(x ,y), we compute the image
D {R,G,B }(x ,y) to display on the screen. For each color primary, we
have a wavelength-dependent blur kernel,K {R,G,B }(x ,y), which is a
PSF calculated from the square of the Fourier transform of the eye’s
complex aperture function (which takes into account the amplitude
and phase of light). �e target retinal image is therefore the 2d
convolution (∗∗) of the display image with the eye’s PSF for each of
the three color channels ({R,G,B}):
I {R,G,B }(x ,y) = D {R,G,B }(x ,y) ∗∗K {R,G,B }(x ,y). (3)
We generated values ofD {R,G,B } by varying induced defocus and
compared these with the forward-model solution until we found
the optimum image to display.
�is model works well for 2d scenes and includes di�raction. But
it is not based on conventional graphics techniques and is not suit-
able for complex 3d scenes. So we produced a second method based
on alternating direction method of multipliers (ADMM) deconvolu-
tion.
4.4 3d ChromaBlur Algorithm
�e 3d algorithm enables application to general graphics systems
for rendering complex scenes. It was used for rendering the kitchen
scene [Jay-Artist 2012] in Fig. 1 and the chessboard scenes [Hoyt
2016] in Figs. 6 and 12 and for one of the experiments (Sec. 7).
4.4.1 Forward Step: Monte Carlo Ray Tracing. We compute the
target retinal image using Monte Carlo ray-tracing. �is is a simple
ma�er of using a �nite-aperture lens in the camera model, where the
focal length of the lens varies according to wavelength as de�ned
by Eqn. 2. We approximate each primary with one representative
wavelength. We used the physically based renderer Mitsuba [Jakob
2010] to implement this step for the results shown in the paper.
4.4.2 Inverse Step: ADMM Optimization. We again use Eqn. 3 as
the basic model. For each color primary, we compute the display
imageD(x ,y) by solving the following optimization equation, where
we omit R,G,B for brevity:
minD(x,y)
| |D(x ,y) ∗∗K (x ,y) − I (x ,y)| |22+ψ | |∇D(x ,y)| |1
such that 0 ≤ D(x ,y) ≤ 1 (4)
Retinal In
tensity
0
1
0.8
0.6
0.4
0.2
1.2
Position (arcmin)
+1.4D, Real
-30 -20 -10 0 302010
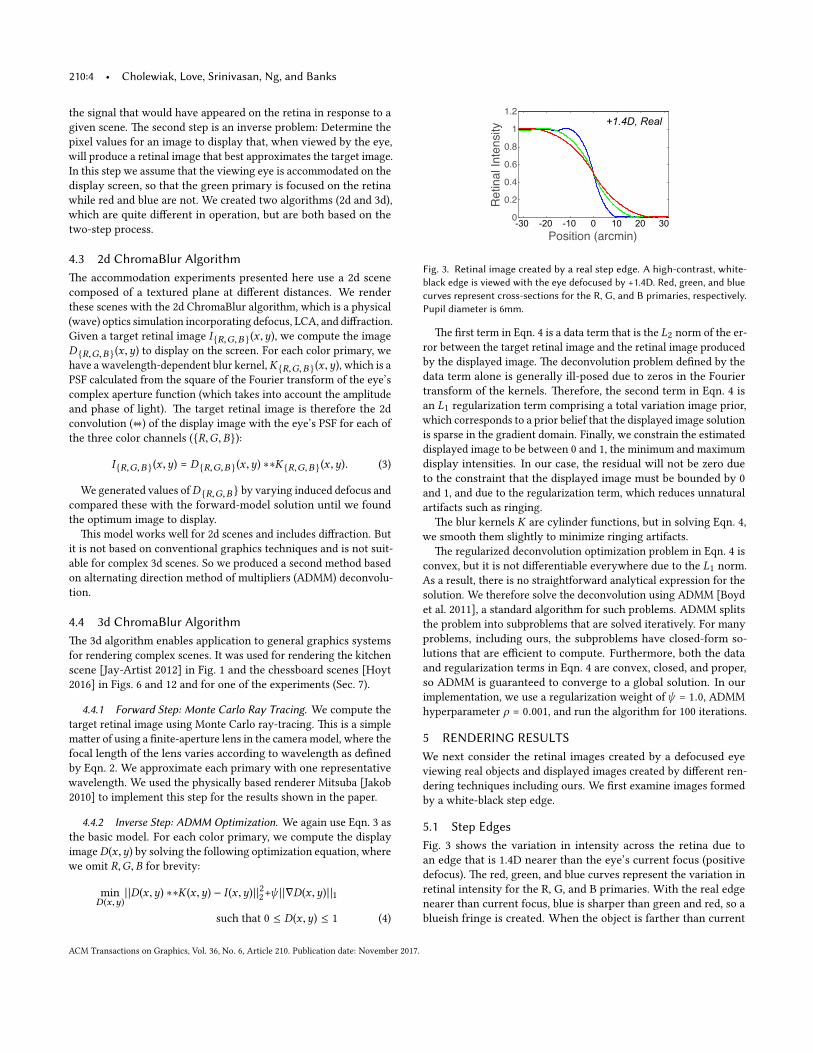
Fig. 3. Retinal image created by a real step edge. A high-contrast, white-
black edge is viewed with the eye defocused by +1.4D. Red, green, and blue
curves represent cross-sections for the R, G, and B primaries, respectively.
Pupil diameter is 6mm.
�e �rst term in Eqn. 4 is a data term that is the L2 norm of the er-
ror between the target retinal image and the retinal image produced
by the displayed image. �e deconvolution problem de�ned by the
data term alone is generally ill-posed due to zeros in the Fourier
transform of the kernels. �erefore, the second term in Eqn. 4 is
an L1 regularization term comprising a total variation image prior,
which corresponds to a prior belief that the displayed image solution
is sparse in the gradient domain. Finally, we constrain the estimated
displayed image to be between 0 and 1, the minimum and maximum
display intensities. In our case, the residual will not be zero due
to the constraint that the displayed image must be bounded by 0
and 1, and due to the regularization term, which reduces unnatural
artifacts such as ringing.
�e blur kernels K are cylinder functions, but in solving Eqn. 4,
we smooth them slightly to minimize ringing artifacts.
�e regularized deconvolution optimization problem in Eqn. 4 is
convex, but it is not di�erentiable everywhere due to the L1 norm.
As a result, there is no straightforward analytical expression for the
solution. We therefore solve the deconvolution using ADMM [Boyd
et al. 2011], a standard algorithm for such problems. ADMM splits
the problem into subproblems that are solved iteratively. For many
problems, including ours, the subproblems have closed-form so-
lutions that are e�cient to compute. Furthermore, both the data
and regularization terms in Eqn. 4 are convex, closed, and proper,
so ADMM is guaranteed to converge to a global solution. In our
implementation, we use a regularization weight ofψ = 1.0, ADMM
hyperparameter ρ = 0.001, and run the algorithm for 100 iterations.
5 RENDERING RESULTS
We next consider the retinal images created by a defocused eye
viewing real objects and displayed images created by di�erent ren-
dering techniques including ours. We �rst examine images formed
by a white-black step edge.
5.1 Step Edges
Fig. 3 shows the variation in intensity across the retina due to
an edge that is 1.4D nearer than the eye’s current focus (positive
defocus). �e red, green, and blue curves represent the variation in
retinal intensity for the R, G, and B primaries. With the real edge
nearer than current focus, blue is sharper than green and red, so a
blueish fringe is created. When the object is farther than current
ACM Transactions on Graphics, Vol. 36, No. 6, Article 210. Publication date: November 2017.
ChromaBlur • 210:5
Re
tin
al In
ten
sity
0
1
0.8
0.6
0.4
0.2
1.2
0
1
0.8
0.6
0.4
0.2
1.2
Dis
pla
ye
d I
nte
nsity
Defocus Only Defocus + LCA
-0.4
-0.2
0
0.2
0.4
-30 -20 -10 0 302010 -30 -20 -10 0 302010
Re
tin
al D
iffe
ren
ce
Position (arcmin)
-30 -20 -10 0 302010 -30 -20 -10 0 302010
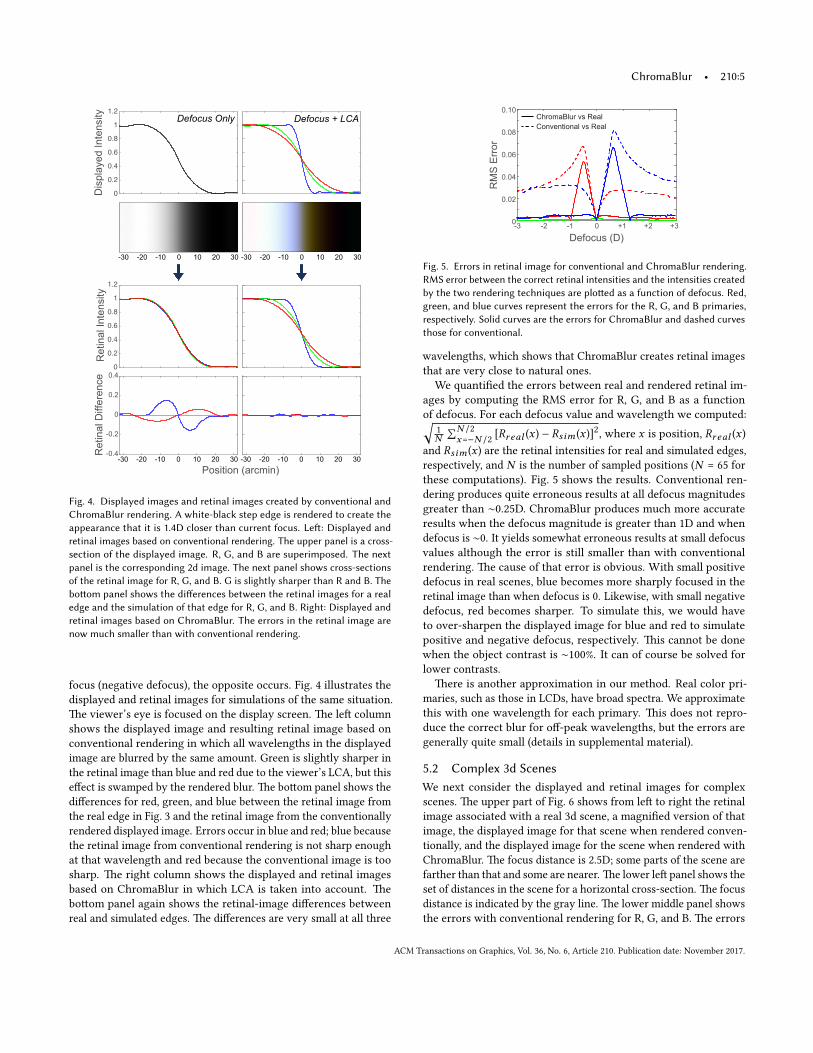
Fig. 4. Displayed images and retinal images created by conventional and
ChromaBlur rendering. A white-black step edge is rendered to create the
appearance that it is 1.4D closer than current focus. Le�: Displayed and
retinal images based on conventional rendering. The upper panel is a cross-
section of the displayed image. R, G, and B are superimposed. The next
panel is the corresponding 2d image. The next panel shows cross-sections
of the retinal image for R, G, and B. G is slightly sharper than R and B. The
bo�om panel shows the di�erences between the retinal images for a real
edge and the simulation of that edge for R, G, and B. Right: Displayed and
retinal images based on ChromaBlur. The errors in the retinal image are
now much smaller than with conventional rendering.
focus (negative defocus), the opposite occurs. Fig. 4 illustrates the
displayed and retinal images for simulations of the same situation.
�e viewer’s eye is focused on the display screen. �e le� column
shows the displayed image and resulting retinal image based on
conventional rendering in which all wavelengths in the displayed
image are blurred by the same amount. Green is slightly sharper in
the retinal image than blue and red due to the viewer’s LCA, but this
e�ect is swamped by the rendered blur. �e bo�om panel shows the
di�erences for red, green, and blue between the retinal image from
the real edge in Fig. 3 and the retinal image from the conventionally
rendered displayed image. Errors occur in blue and red; blue because
the retinal image from conventional rendering is not sharp enough
at that wavelength and red because the conventional image is too
sharp. �e right column shows the displayed and retinal images
based on ChromaBlur in which LCA is taken into account. �e
bo�om panel again shows the retinal-image di�erences between
real and simulated edges. �e di�erences are very small at all three
-3 -2 -1 +1 +2 +30
Defocus (D)
0
0.02
0.04
0.06
0.08
0.10
RM
S E
rro
r
ChromaBlur vs Real
Conventional vs Real
Fig. 5. Errors in retinal image for conventional and ChromaBlur rendering.
RMS error between the correct retinal intensities and the intensities created
by the two rendering techniques are plo�ed as a function of defocus. Red,
green, and blue curves represent the errors for the R, G, and B primaries,
respectively. Solid curves are the errors for ChromaBlur and dashed curves
those for conventional.
wavelengths, which shows that ChromaBlur creates retinal images
that are very close to natural ones.
We quanti�ed the errors between real and rendered retinal im-
ages by computing the RMS error for R, G, and B as a function
of defocus. For each defocus value and wavelength we computed:√
1N
∑N /2x=−N /2
[Rr eal (x ) − Rsim (x )]2, where x is position, Rr eal (x)
and Rsim (x ) are the retinal intensities for real and simulated edges,
respectively, and N is the number of sampled positions (N = 65 for
these computations). Fig. 5 shows the results. Conventional ren-
dering produces quite erroneous results at all defocus magnitudes
greater than ∼0.25D. ChromaBlur produces much more accurate
results when the defocus magnitude is greater than 1D and when
defocus is ∼0. It yields somewhat erroneous results at small defocus
values although the error is still smaller than with conventional
rendering. �e cause of that error is obvious. With small positive
defocus in real scenes, blue becomes more sharply focused in the
retinal image than when defocus is 0. Likewise, with small negative
defocus, red becomes sharper. To simulate this, we would have
to over-sharpen the displayed image for blue and red to simulate
positive and negative defocus, respectively. �is cannot be done
when the object contrast is ∼100%. It can of course be solved for
lower contrasts.
�ere is another approximation in our method. Real color pri-
maries, such as those in LCDs, have broad spectra. We approximate
this with one wavelength for each primary. �is does not repro-
duce the correct blur for o�-peak wavelengths, but the errors are
generally quite small (details in supplemental material).
5.2 Complex 3d Scenes
We next consider the displayed and retinal images for complex
scenes. �e upper part of Fig. 6 shows from le� to right the retinal
image associated with a real 3d scene, a magni�ed version of that
image, the displayed image for that scene when rendered conven-
tionally, and the displayed image for the scene when rendered with
ChromaBlur. �e focus distance is 2.5D; some parts of the scene are
farther than that and some are nearer. �e lower le� panel shows the
set of distances in the scene for a horizontal cross-section. �e focus
distance is indicated by the gray line. �e lower middle panel shows
the errors with conventional rendering for R, G, and B. �e errors
ACM Transactions on Graphics, Vol. 36, No. 6, Article 210. Publication date: November 2017.
210:6 • Cholewiak, Love, Srinivasan, Ng, and Banks
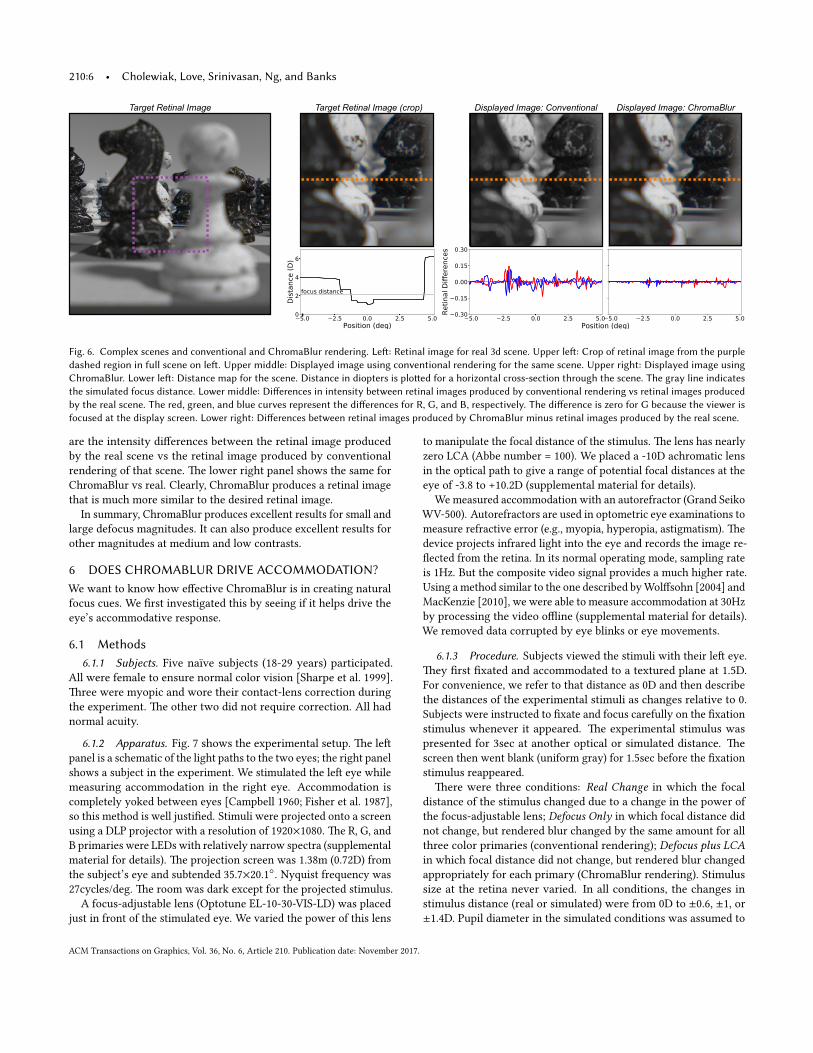
Target Retinal Image Target Retinal Image (crop) Displayed Image: Conventional Displayed Image: ChromaBlur
Fig. 6. Complex scenes and conventional and ChromaBlur rendering. Le�: Retinal image for real 3d scene. Upper le�: Crop of retinal image from the purple
dashed region in full scene on le�. Upper middle: Displayed image using conventional rendering for the same scene. Upper right: Displayed image using
ChromaBlur. Lower le�: Distance map for the scene. Distance in diopters is plo�ed for a horizontal cross-section through the scene. The gray line indicates
the simulated focus distance. Lower middle: Di�erences in intensity between retinal images produced by conventional rendering vs retinal images produced
by the real scene. The red, green, and blue curves represent the di�erences for R, G, and B, respectively. The di�erence is zero for G because the viewer is
focused at the display screen. Lower right: Di�erences between retinal images produced by ChromaBlur minus retinal images produced by the real scene.
are the intensity di�erences between the retinal image produced
by the real scene vs the retinal image produced by conventional
rendering of that scene. �e lower right panel shows the same for
ChromaBlur vs real. Clearly, ChromaBlur produces a retinal image
that is much more similar to the desired retinal image.
In summary, ChromaBlur produces excellent results for small and
large defocus magnitudes. It can also produce excellent results for
other magnitudes at medium and low contrasts.
6 DOES CHROMABLUR DRIVE ACCOMMODATION?
We want to know how e�ective ChromaBlur is in creating natural
focus cues. We �rst investigated this by seeing if it helps drive the
eye’s accommodative response.
6.1 Methods
6.1.1 Subjects. Five naıve subjects (18-29 years) participated.
All were female to ensure normal color vision [Sharpe et al. 1999].
�ree were myopic and wore their contact-lens correction during
the experiment. �e other two did not require correction. All had
normal acuity.
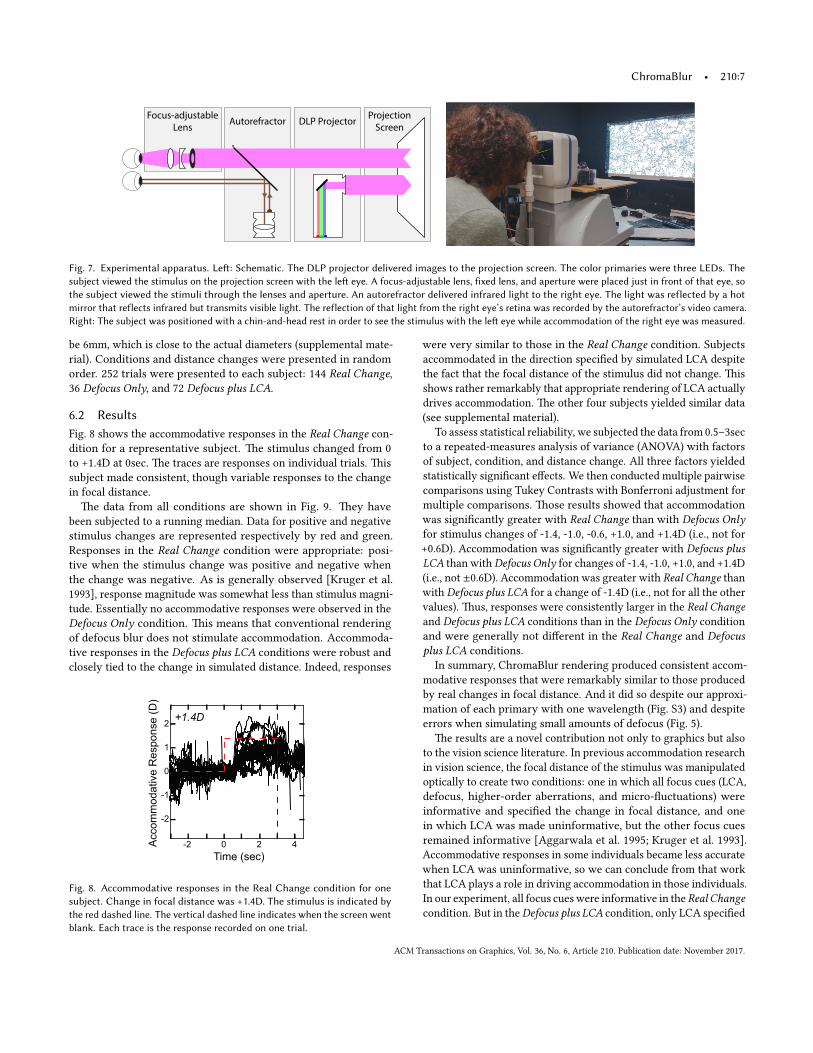
6.1.2 Apparatus. Fig. 7 shows the experimental setup. �e le�
panel is a schematic of the light paths to the two eyes; the right panel
shows a subject in the experiment. We stimulated the le� eye while
measuring accommodation in the right eye. Accommodation is
completely yoked between eyes [Campbell 1960; Fisher et al. 1987],
so this method is well justi�ed. Stimuli were projected onto a screen
using a DLP projector with a resolution of 1920×1080. �e R, G, and
B primaries were LEDs with relatively narrow spectra (supplemental
material for details). �e projection screen was 1.38m (0.72D) from
the subject’s eye and subtended 35.7×20.1◦. Nyquist frequency was
27cycles/deg. �e room was dark except for the projected stimulus.
A focus-adjustable lens (Optotune EL-10-30-VIS-LD) was placed
just in front of the stimulated eye. We varied the power of this lens
to manipulate the focal distance of the stimulus. �e lens has nearly
zero LCA (Abbe number = 100). We placed a -10D achromatic lens
in the optical path to give a range of potential focal distances at the
eye of -3.8 to +10.2D (supplemental material for details).
We measured accommodation with an autorefractor (Grand Seiko
WV-500). Autorefractors are used in optometric eye examinations to
measure refractive error (e.g., myopia, hyperopia, astigmatism). �e
device projects infrared light into the eye and records the image re-
�ected from the retina. In its normal operating mode, sampling rate
is 1Hz. But the composite video signal provides a much higher rate.
Using amethod similar to the one described byWol�sohn [2004] and
MacKenzie [2010], we were able to measure accommodation at 30Hz
by processing the video o�ine (supplemental material for details).
We removed data corrupted by eye blinks or eye movements.
6.1.3 Procedure. Subjects viewed the stimuli with their le� eye.
�ey �rst �xated and accommodated to a textured plane at 1.5D.
For convenience, we refer to that distance as 0D and then describe
the distances of the experimental stimuli as changes relative to 0.
Subjects were instructed to �xate and focus carefully on the �xation
stimulus whenever it appeared. �e experimental stimulus was
presented for 3sec at another optical or simulated distance. �e
screen then went blank (uniform gray) for 1.5sec before the �xation
stimulus reappeared.
�ere were three conditions: Real Change in which the focal
distance of the stimulus changed due to a change in the power of
the focus-adjustable lens; Defocus Only in which focal distance did
not change, but rendered blur changed by the same amount for all
three color primaries (conventional rendering); Defocus plus LCA
in which focal distance did not change, but rendered blur changed
appropriately for each primary (ChromaBlur rendering). Stimulus
size at the retina never varied. In all conditions, the changes in
stimulus distance (real or simulated) were from 0D to ±0.6, ±1, or
±1.4D. Pupil diameter in the simulated conditions was assumed to
ACM Transactions on Graphics, Vol. 36, No. 6, Article 210. Publication date: November 2017.
ChromaBlur • 210:7
Focus-adjustable
LensAutorefractor DLP Projector
Projection
Screen
Fig. 7. Experimental apparatus. Le�: Schematic. The DLP projector delivered images to the projection screen. The color primaries were three LEDs. The
subject viewed the stimulus on the projection screen with the le� eye. A focus-adjustable lens, fixed lens, and aperture were placed just in front of that eye, so
the subject viewed the stimuli through the lenses and aperture. An autorefractor delivered infrared light to the right eye. The light was reflected by a hot
mirror that reflects infrared but transmits visible light. The reflection of that light from the right eye’s retina was recorded by the autorefractor’s video camera.
Right: The subject was positioned with a chin-and-head rest in order to see the stimulus with the le� eye while accommodation of the right eye was measured.
be 6mm, which is close to the actual diameters (supplemental mate-
rial). Conditions and distance changes were presented in random
order. 252 trials were presented to each subject: 144 Real Change,
36 Defocus Only, and 72 Defocus plus LCA.
6.2 Results
Fig. 8 shows the accommodative responses in the Real Change con-
dition for a representative subject. �e stimulus changed from 0
to +1.4D at 0sec. �e traces are responses on individual trials. �is
subject made consistent, though variable responses to the change
in focal distance.
�e data from all conditions are shown in Fig. 9. �ey have
been subjected to a running median. Data for positive and negative
stimulus changes are represented respectively by red and green.
Responses in the Real Change condition were appropriate: posi-
tive when the stimulus change was positive and negative when
the change was negative. As is generally observed [Kruger et al.
1993], response magnitude was somewhat less than stimulus magni-
tude. Essentially no accommodative responses were observed in the
Defocus Only condition. �is means that conventional rendering
of defocus blur does not stimulate accommodation. Accommoda-
tive responses in the Defocus plus LCA conditions were robust and
closely tied to the change in simulated distance. Indeed, responses
-2 0 2 4
2
1
0
-1
-2
+1.4D
Time (sec)
Acco
mm
od
ative
Re
sp
on
se
(D
)
Fig. 8. Accommodative responses in the Real Change condition for one
subject. Change in focal distance was +1.4D. The stimulus is indicated by
the red dashed line. The vertical dashed line indicates when the screen went
blank. Each trace is the response recorded on one trial.
were very similar to those in the Real Change condition. Subjects
accommodated in the direction speci�ed by simulated LCA despite
the fact that the focal distance of the stimulus did not change. �is
shows rather remarkably that appropriate rendering of LCA actually
drives accommodation. �e other four subjects yielded similar data
(see supplemental material).
To assess statistical reliability, we subjected the data from 0.5–3sec
to a repeated-measures analysis of variance (ANOVA) with factors
of subject, condition, and distance change. All three factors yielded
statistically signi�cant e�ects. We then conducted multiple pairwise
comparisons using Tukey Contrasts with Bonferroni adjustment for
multiple comparisons. �ose results showed that accommodation
was signi�cantly greater with Real Change than with Defocus Only
for stimulus changes of -1.4, -1.0, -0.6, +1.0, and +1.4D (i.e., not for
+0.6D). Accommodation was signi�cantly greater with Defocus plus
LCA than withDefocus Only for changes of -1.4, -1.0, +1.0, and +1.4D
(i.e., not ±0.6D). Accommodation was greater with Real Change than
with Defocus plus LCA for a change of -1.4D (i.e., not for all the other
values). �us, responses were consistently larger in the Real Change
and Defocus plus LCA conditions than in the Defocus Only condition
and were generally not di�erent in the Real Change and Defocus
plus LCA conditions.
In summary, ChromaBlur rendering produced consistent accom-
modative responses that were remarkably similar to those produced
by real changes in focal distance. And it did so despite our approxi-
mation of each primary with one wavelength (Fig. S3) and despite
errors when simulating small amounts of defocus (Fig. 5).
�e results are a novel contribution not only to graphics but also
to the vision science literature. In previous accommodation research
in vision science, the focal distance of the stimulus was manipulated
optically to create two conditions: one in which all focus cues (LCA,
defocus, higher-order aberrations, and micro-�uctuations) were
informative and speci�ed the change in focal distance, and one
in which LCA was made uninformative, but the other focus cues
remained informative [Aggarwala et al. 1995; Kruger et al. 1993].
Accommodative responses in some individuals became less accurate
when LCA was uninformative, so we can conclude from that work
that LCA plays a role in driving accommodation in those individuals.
In our experiment, all focus cueswere informative in the Real Change
condition. But in theDefocus plus LCA condition, only LCA speci�ed
ACM Transactions on Graphics, Vol. 36, No. 6, Article 210. Publication date: November 2017.
210:8 • Cholewiak, Love, Srinivasan, Ng, and Banks
Time (sec)-2 0 2 4
2
1
0
-1
-2
Accom
modative R
esponse (
D)
Real Change Defocus Only Defocus + LCA
2
1
0
-1
-2
2
1
0
-1
-2
-2 0 2 4 -2 0 2 4
0.6D+_
1.4D+_
1.0D+_
0.6D+_
1.4D+_
1.0D+_
0.6D+_
1.4D+_
1.0D+_
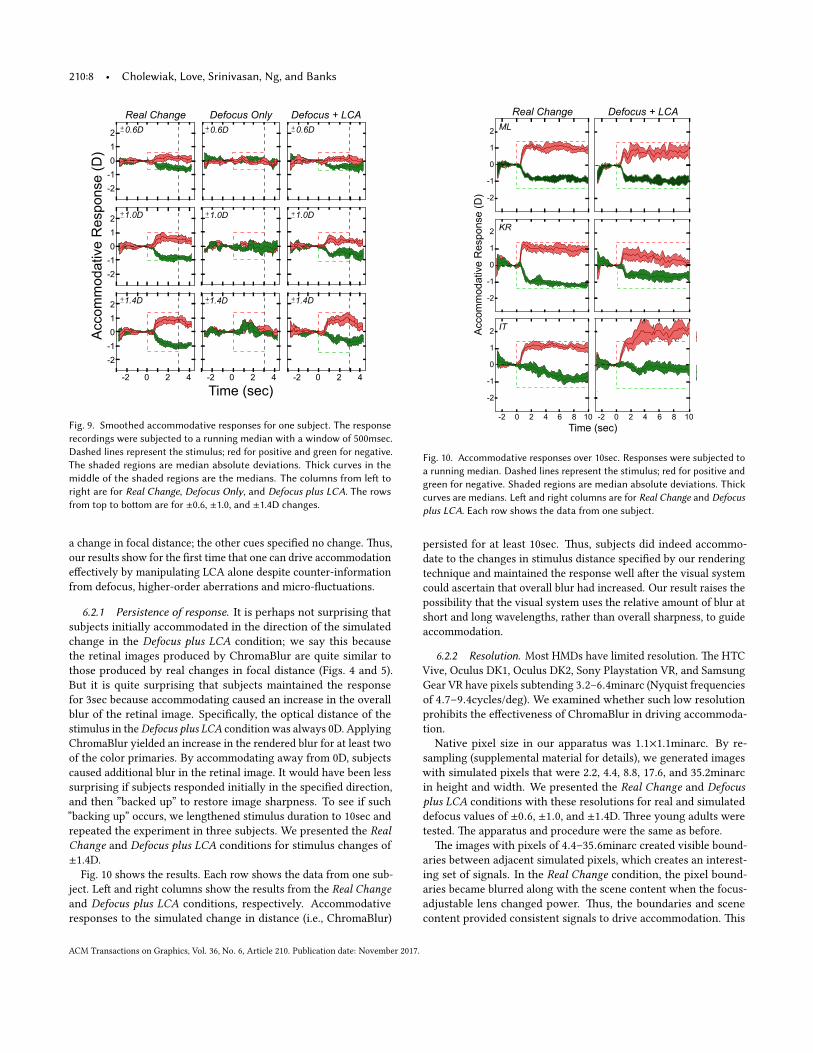
Fig. 9. Smoothed accommodative responses for one subject. The response
recordings were subjected to a running median with a window of 500msec.
Dashed lines represent the stimulus; red for positive and green for negative.
The shaded regions are median absolute deviations. Thick curves in the
middle of the shaded regions are the medians. The columns from le� to
right are for Real Change, Defocus Only, and Defocus plus LCA. The rows
from top to bo�om are for ±0.6, ±1.0, and ±1.4D changes.
a change in focal distance; the other cues speci�ed no change. �us,
our results show for the �rst time that one can drive accommodation
e�ectively by manipulating LCA alone despite counter-information
from defocus, higher-order aberrations and micro-�uctuations.
6.2.1 Persistence of response. It is perhaps not surprising that
subjects initially accommodated in the direction of the simulated
change in the Defocus plus LCA condition; we say this because
the retinal images produced by ChromaBlur are quite similar to
those produced by real changes in focal distance (Figs. 4 and 5).
But it is quite surprising that subjects maintained the response
for 3sec because accommodating caused an increase in the overall
blur of the retinal image. Speci�cally, the optical distance of the
stimulus in theDefocus plus LCA condition was always 0D. Applying
ChromaBlur yielded an increase in the rendered blur for at least two
of the color primaries. By accommodating away from 0D, subjects
caused additional blur in the retinal image. It would have been less
surprising if subjects responded initially in the speci�ed direction,
and then ”backed up” to restore image sharpness. To see if such
”backing up” occurs, we lengthened stimulus duration to 10sec and
repeated the experiment in three subjects. We presented the Real
Change and Defocus plus LCA conditions for stimulus changes of
±1.4D.
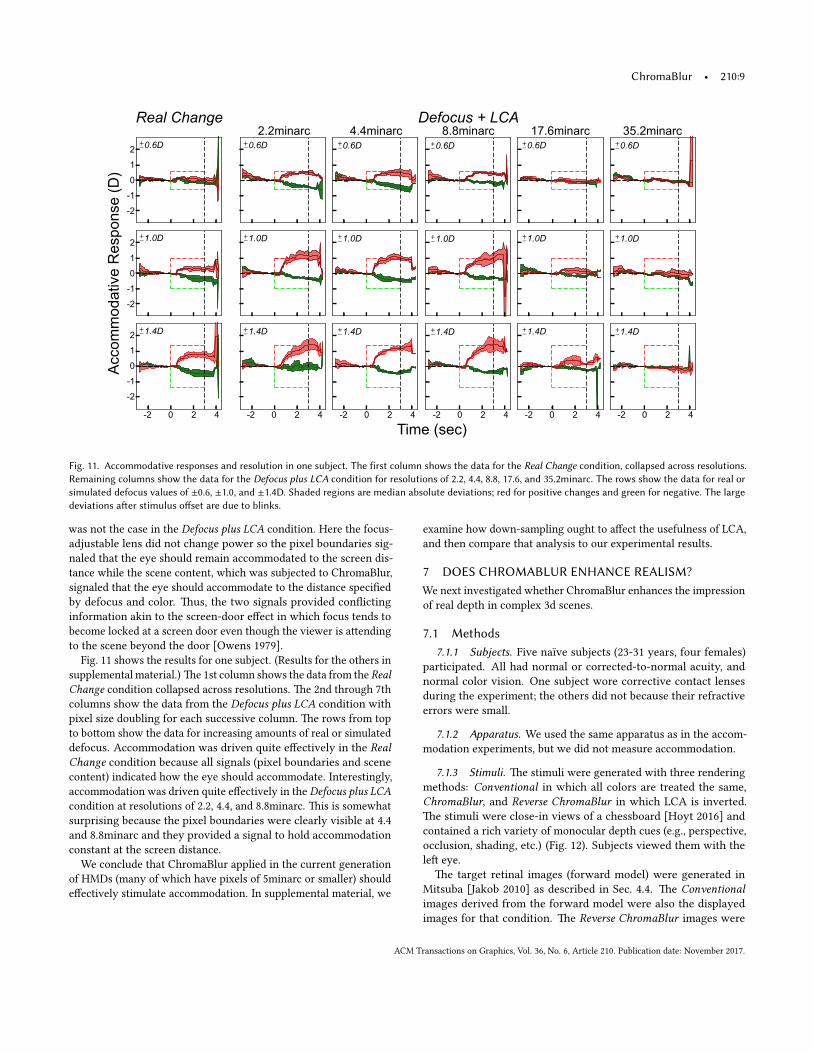
Fig. 10 shows the results. Each row shows the data from one sub-
ject. Le� and right columns show the results from the Real Change
and Defocus plus LCA conditions, respectively. Accommodative
responses to the simulated change in distance (i.e., ChromaBlur)
2
1
0
-1
-2
Real Change Defocus + LCA
2
1
0
-1
-2
Time (sec)
Acco
mm
od
ative
Re
sp
on
se
(D
)
2
1
0
-1
-2
-2 0 2 4 6 8 10 -2 0 2 4 6 8 10
KR
IT
ML
Fig. 10. Accommodative responses over 10sec. Responses were subjected to
a running median. Dashed lines represent the stimulus; red for positive and
green for negative. Shaded regions are median absolute deviations. Thick
curves are medians. Le� and right columns are for Real Change and Defocus
plus LCA. Each row shows the data from one subject.
persisted for at least 10sec. �us, subjects did indeed accommo-
date to the changes in stimulus distance speci�ed by our rendering
technique and maintained the response well a�er the visual system
could ascertain that overall blur had increased. Our result raises the
possibility that the visual system uses the relative amount of blur at
short and long wavelengths, rather than overall sharpness, to guide
accommodation.
6.2.2 Resolution. Most HMDs have limited resolution. �e HTC
Vive, Oculus DK1, Oculus DK2, Sony Playstation VR, and Samsung
Gear VR have pixels subtending 3.2–6.4minarc (Nyquist frequencies
of 4.7–9.4cycles/deg). We examined whether such low resolution
prohibits the e�ectiveness of ChromaBlur in driving accommoda-
tion.
Native pixel size in our apparatus was 1.1×1.1minarc. By re-
sampling (supplemental material for details), we generated images
with simulated pixels that were 2.2, 4.4, 8.8, 17.6, and 35.2minarc
in height and width. We presented the Real Change and Defocus
plus LCA conditions with these resolutions for real and simulated
defocus values of ±0.6, ±1.0, and ±1.4D. �ree young adults were
tested. �e apparatus and procedure were the same as before.
�e images with pixels of 4.4–35.6minarc created visible bound-
aries between adjacent simulated pixels, which creates an interest-
ing set of signals. In the Real Change condition, the pixel bound-
aries became blurred along with the scene content when the focus-
adjustable lens changed power. �us, the boundaries and scene
content provided consistent signals to drive accommodation. �is
ACM Transactions on Graphics, Vol. 36, No. 6, Article 210. Publication date: November 2017.
ChromaBlur • 210:9
0.6D+_
1.0D+_
1.4D+_
0.6D+_
1.0D+_
1.4D+_
0.6D+_
1.0D+_
1.4D+_
0.6D+_
1.0D+_
1.4D+_
0.6D+_
1.0D+_
1.4D+_
0.6D+_
1.0D+_
1.4D+_
Acco
mm
od
ative
Re
sp
on
se
(D
)Real Change Defocus + LCA
2
1
0
-1
-2
2
1
0
-1
-2
2
1
0
-1
-2
-2 0 2 4 -2 0 2 4 -2 0 2 4 -2 0 2 4 -2 0 2 4 -2 0 2 4
Time (sec)
2.2minarc 4.4minarc 8.8minarc 17.6minarc 35.2minarc
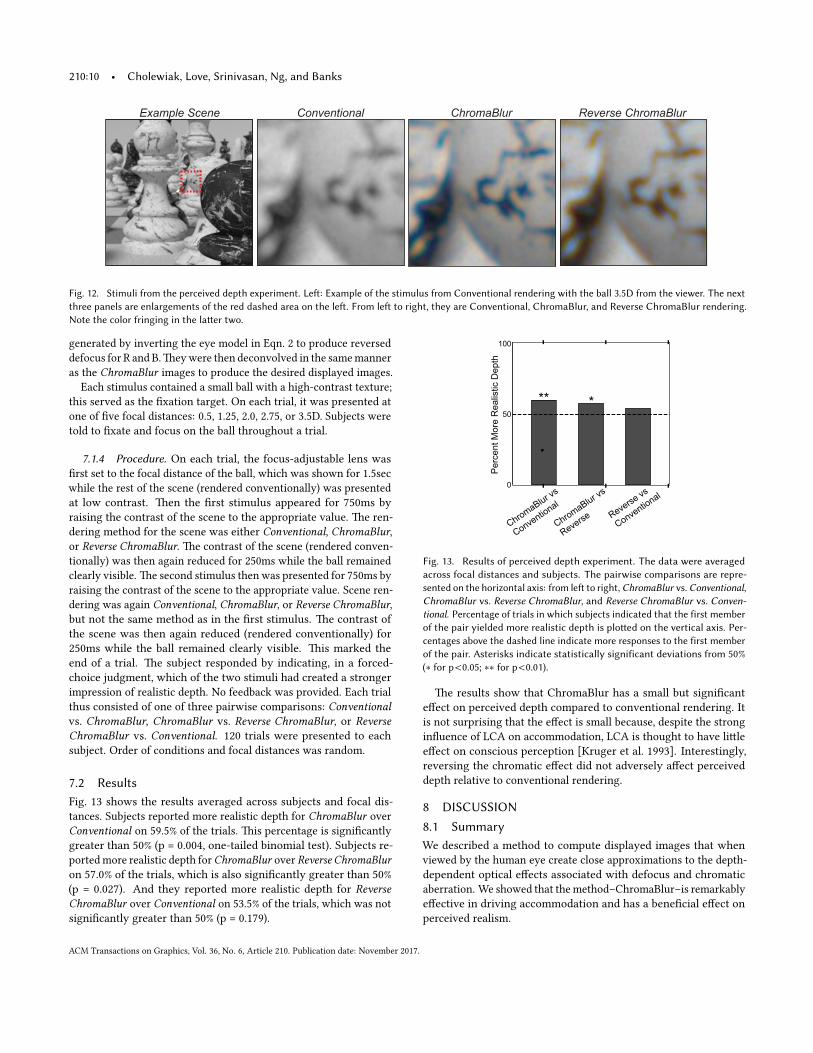
Fig. 11. Accommodative responses and resolution in one subject. The first column shows the data for the Real Change condition, collapsed across resolutions.
Remaining columns show the data for the Defocus plus LCA condition for resolutions of 2.2, 4.4, 8.8, 17.6, and 35.2minarc. The rows show the data for real or
simulated defocus values of ±0.6, ±1.0, and ±1.4D. Shaded regions are median absolute deviations; red for positive changes and green for negative. The large
deviations a�er stimulus o�set are due to blinks.
was not the case in the Defocus plus LCA condition. Here the focus-
adjustable lens did not change power so the pixel boundaries sig-
naled that the eye should remain accommodated to the screen dis-
tance while the scene content, which was subjected to ChromaBlur,
signaled that the eye should accommodate to the distance speci�ed
by defocus and color. �us, the two signals provided con�icting
information akin to the screen-door e�ect in which focus tends to
become locked at a screen door even though the viewer is a�ending
to the scene beyond the door [Owens 1979].
Fig. 11 shows the results for one subject. (Results for the others in
supplemental material.) �e 1st column shows the data from the Real
Change condition collapsed across resolutions. �e 2nd through 7th
columns show the data from the Defocus plus LCA condition with
pixel size doubling for each successive column. �e rows from top
to bo�om show the data for increasing amounts of real or simulated
defocus. Accommodation was driven quite e�ectively in the Real
Change condition because all signals (pixel boundaries and scene
content) indicated how the eye should accommodate. Interestingly,
accommodation was driven quite e�ectively in the Defocus plus LCA
condition at resolutions of 2.2, 4.4, and 8.8minarc. �is is somewhat
surprising because the pixel boundaries were clearly visible at 4.4
and 8.8minarc and they provided a signal to hold accommodation
constant at the screen distance.
We conclude that ChromaBlur applied in the current generation
of HMDs (many of which have pixels of 5minarc or smaller) should
e�ectively stimulate accommodation. In supplemental material, we
examine how down-sampling ought to a�ect the usefulness of LCA,
and then compare that analysis to our experimental results.
7 DOES CHROMABLUR ENHANCE REALISM?
We next investigated whether ChromaBlur enhances the impression
of real depth in complex 3d scenes.
7.1 Methods
7.1.1 Subjects. Five naıve subjects (23-31 years, four females)
participated. All had normal or corrected-to-normal acuity, and
normal color vision. One subject wore corrective contact lenses
during the experiment; the others did not because their refractive
errors were small.
7.1.2 Apparatus. We used the same apparatus as in the accom-
modation experiments, but we did not measure accommodation.
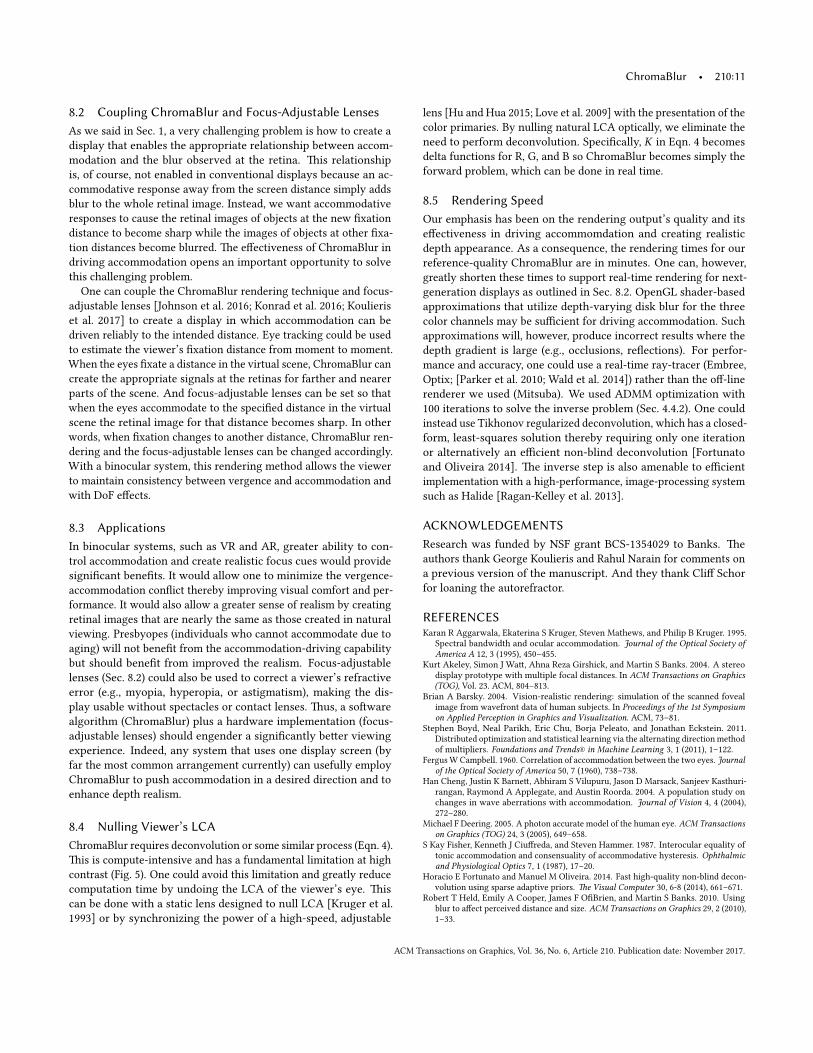
7.1.3 Stimuli. �e stimuli were generated with three rendering
methods: Conventional in which all colors are treated the same,
ChromaBlur, and Reverse ChromaBlur in which LCA is inverted.
�e stimuli were close-in views of a chessboard [Hoyt 2016] and
contained a rich variety of monocular depth cues (e.g., perspective,
occlusion, shading, etc.) (Fig. 12). Subjects viewed them with the
le� eye.
�e target retinal images (forward model) were generated in
Mitsuba [Jakob 2010] as described in Sec. 4.4. �e Conventional
images derived from the forward model were also the displayed
images for that condition. �e Reverse ChromaBlur images were
ACM Transactions on Graphics, Vol. 36, No. 6, Article 210. Publication date: November 2017.
210:10 • Cholewiak, Love, Srinivasan, Ng, and Banks
Conventional ChromaBlur Reverse ChromaBlurExample Scene
Fig. 12. Stimuli from the perceived depth experiment. Le�: Example of the stimulus from Conventional rendering with the ball 3.5D from the viewer. The next
three panels are enlargements of the red dashed area on the le�. From le� to right, they are Conventional, ChromaBlur, and Reverse ChromaBlur rendering.
Note the color fringing in the la�er two.
generated by inverting the eye model in Eqn. 2 to produce reversed
defocus for R and B.�eywere then deconvolved in the samemanner
as the ChromaBlur images to produce the desired displayed images.
Each stimulus contained a small ball with a high-contrast texture;
this served as the �xation target. On each trial, it was presented at
one of �ve focal distances: 0.5, 1.25, 2.0, 2.75, or 3.5D. Subjects were
told to �xate and focus on the ball throughout a trial.
7.1.4 Procedure. On each trial, the focus-adjustable lens was
�rst set to the focal distance of the ball, which was shown for 1.5sec
while the rest of the scene (rendered conventionally) was presented
at low contrast. �en the �rst stimulus appeared for 750ms by
raising the contrast of the scene to the appropriate value. �e ren-
dering method for the scene was either Conventional, ChromaBlur,
or Reverse ChromaBlur. �e contrast of the scene (rendered conven-
tionally) was then again reduced for 250ms while the ball remained
clearly visible. �e second stimulus then was presented for 750ms by
raising the contrast of the scene to the appropriate value. Scene ren-
dering was again Conventional, ChromaBlur, or Reverse ChromaBlur,
but not the same method as in the �rst stimulus. �e contrast of
the scene was then again reduced (rendered conventionally) for
250ms while the ball remained clearly visible. �is marked the
end of a trial. �e subject responded by indicating, in a forced-
choice judgment, which of the two stimuli had created a stronger
impression of realistic depth. No feedback was provided. Each trial
thus consisted of one of three pairwise comparisons: Conventional
vs. ChromaBlur, ChromaBlur vs. Reverse ChromaBlur, or Reverse
ChromaBlur vs. Conventional. 120 trials were presented to each
subject. Order of conditions and focal distances was random.
7.2 Results
Fig. 13 shows the results averaged across subjects and focal dis-
tances. Subjects reported more realistic depth for ChromaBlur over
Conventional on 59.5% of the trials. �is percentage is signi�cantly
greater than 50% (p = 0.004, one-tailed binomial test). Subjects re-
portedmore realistic depth forChromaBlur over Reverse ChromaBlur
on 57.0% of the trials, which is also signi�cantly greater than 50%
(p = 0.027). And they reported more realistic depth for Reverse
ChromaBlur over Conventional on 53.5% of the trials, which was not
signi�cantly greater than 50% (p = 0.179).
***
100
50
0
Chrom
aBlur vs
Conventio
nal
Chrom
aBlur vs
Revers
e Revers
e vs
Conventio
nalP
erc
ent M
ore
Realis
tic D
epth
Fig. 13. Results of perceived depth experiment. The data were averaged
across focal distances and subjects. The pairwise comparisons are repre-
sented on the horizontal axis: from le� to right,ChromaBlur vs.Conventional,
ChromaBlur vs. Reverse ChromaBlur, and Reverse ChromaBlur vs. Conven-
tional. Percentage of trials in which subjects indicated that the first member
of the pair yielded more realistic depth is plo�ed on the vertical axis. Per-
centages above the dashed line indicate more responses to the first member
of the pair. Asterisks indicate statistically significant deviations from 50%
(∗ for p<0.05; ∗∗ for p<0.01).
�e results show that ChromaBlur has a small but signi�cant
e�ect on perceived depth compared to conventional rendering. It
is not surprising that the e�ect is small because, despite the strong
in�uence of LCA on accommodation, LCA is thought to have li�le
e�ect on conscious perception [Kruger et al. 1993]. Interestingly,
reversing the chromatic e�ect did not adversely a�ect perceived
depth relative to conventional rendering.
8 DISCUSSION
8.1 Summary
We described a method to compute displayed images that when
viewed by the human eye create close approximations to the depth-
dependent optical e�ects associated with defocus and chromatic
aberration. We showed that themethod–ChromaBlur–is remarkably
e�ective in driving accommodation and has a bene�cial e�ect on
perceived realism.
ACM Transactions on Graphics, Vol. 36, No. 6, Article 210. Publication date: November 2017.
ChromaBlur • 210:11
8.2 Coupling ChromaBlur and Focus-Adjustable Lenses
As we said in Sec. 1, a very challenging problem is how to create a
display that enables the appropriate relationship between accom-
modation and the blur observed at the retina. �is relationship
is, of course, not enabled in conventional displays because an ac-
commodative response away from the screen distance simply adds
blur to the whole retinal image. Instead, we want accommodative
responses to cause the retinal images of objects at the new �xation
distance to become sharp while the images of objects at other �xa-
tion distances become blurred. �e e�ectiveness of ChromaBlur in
driving accommodation opens an important opportunity to solve
this challenging problem.
One can couple the ChromaBlur rendering technique and focus-
adjustable lenses [Johnson et al. 2016; Konrad et al. 2016; Koulieris
et al. 2017] to create a display in which accommodation can be
driven reliably to the intended distance. Eye tracking could be used
to estimate the viewer’s �xation distance from moment to moment.
When the eyes �xate a distance in the virtual scene, ChromaBlur can
create the appropriate signals at the retinas for farther and nearer
parts of the scene. And focus-adjustable lenses can be set so that
when the eyes accommodate to the speci�ed distance in the virtual
scene the retinal image for that distance becomes sharp. In other
words, when �xation changes to another distance, ChromaBlur ren-
dering and the focus-adjustable lenses can be changed accordingly.
With a binocular system, this rendering method allows the viewer
to maintain consistency between vergence and accommodation and
with DoF e�ects.
8.3 Applications
In binocular systems, such as VR and AR, greater ability to con-
trol accommodation and create realistic focus cues would provide
signi�cant bene�ts. It would allow one to minimize the vergence-
accommodation con�ict thereby improving visual comfort and per-
formance. It would also allow a greater sense of realism by creating
retinal images that are nearly the same as those created in natural
viewing. Presbyopes (individuals who cannot accommodate due to
aging) will not bene�t from the accommodation-driving capability
but should bene�t from improved the realism. Focus-adjustable
lenses (Sec. 8.2) could also be used to correct a viewer’s refractive
error (e.g., myopia, hyperopia, or astigmatism), making the dis-
play usable without spectacles or contact lenses. �us, a so�ware
algorithm (ChromaBlur) plus a hardware implementation (focus-
adjustable lenses) should engender a signi�cantly be�er viewing
experience. Indeed, any system that uses one display screen (by
far the most common arrangement currently) can usefully employ
ChromaBlur to push accommodation in a desired direction and to
enhance depth realism.
8.4 Nulling Viewer’s LCA
ChromaBlur requires deconvolution or some similar process (Eqn. 4).
�is is compute-intensive and has a fundamental limitation at high
contrast (Fig. 5). One could avoid this limitation and greatly reduce
computation time by undoing the LCA of the viewer’s eye. �is
can be done with a static lens designed to null LCA [Kruger et al.
1993] or by synchronizing the power of a high-speed, adjustable
lens [Hu and Hua 2015; Love et al. 2009] with the presentation of the
color primaries. By nulling natural LCA optically, we eliminate the
need to perform deconvolution. Speci�cally, K in Eqn. 4 becomes
delta functions for R, G, and B so ChromaBlur becomes simply the
forward problem, which can be done in real time.
8.5 Rendering Speed
Our emphasis has been on the rendering output’s quality and its
e�ectiveness in driving accommomdation and creating realistic
depth appearance. As a consequence, the rendering times for our
reference-quality ChromaBlur are in minutes. One can, however,
greatly shorten these times to support real-time rendering for next-
generation displays as outlined in Sec. 8.2. OpenGL shader-based
approximations that utilize depth-varying disk blur for the three
color channels may be su�cient for driving accommodation. Such
approximations will, however, produce incorrect results where the
depth gradient is large (e.g., occlusions, re�ections). For perfor-
mance and accuracy, one could use a real-time ray-tracer (Embree,
Optix; [Parker et al. 2010; Wald et al. 2014]) rather than the o�-line
renderer we used (Mitsuba). We used ADMM optimization with
100 iterations to solve the inverse problem (Sec. 4.4.2). One could
instead use Tikhonov regularized deconvolution, which has a closed-
form, least-squares solution thereby requiring only one iteration
or alternatively an e�cient non-blind deconvolution [Fortunato
and Oliveira 2014]. �e inverse step is also amenable to e�cient
implementation with a high-performance, image-processing system
such as Halide [Ragan-Kelley et al. 2013].
ACKNOWLEDGEMENTS
Research was funded by NSF grant BCS-1354029 to Banks. �e
authors thank George Koulieris and Rahul Narain for comments on
a previous version of the manuscript. And they thank Cli� Schor
for loaning the autorefractor.
REFERENCESKaran R Aggarwala, Ekaterina S Kruger, Steven Mathews, and Philip B Kruger. 1995.
Spectral bandwidth and ocular accommodation. Journal of the Optical Society ofAmerica A 12, 3 (1995), 450–455.
Kurt Akeley, Simon J Wa�, Ahna Reza Girshick, and Martin S Banks. 2004. A stereodisplay prototype with multiple focal distances. In ACM Transactions on Graphics(TOG), Vol. 23. ACM, 804–813.
Brian A Barsky. 2004. Vision-realistic rendering: simulation of the scanned fovealimage from wavefront data of human subjects. In Proceedings of the 1st Symposiumon Applied Perception in Graphics and Visualization. ACM, 73–81.
Stephen Boyd, Neal Parikh, Eric Chu, Borja Peleato, and Jonathan Eckstein. 2011.Distributed optimization and statistical learning via the alternating direction methodof multipliers. Foundations and Trends® in Machine Learning 3, 1 (2011), 1–122.
FergusWCampbell. 1960. Correlation of accommodation between the two eyes. Journalof the Optical Society of America 50, 7 (1960), 738–738.
Han Cheng, Justin K Barne�, Abhiram S Vilupuru, Jason D Marsack, Sanjeev Kasthuri-rangan, Raymond A Applegate, and Austin Roorda. 2004. A population study onchanges in wave aberrations with accommodation. Journal of Vision 4, 4 (2004),272–280.
Michael F Deering. 2005. A photon accurate model of the human eye. ACM Transactionson Graphics (TOG) 24, 3 (2005), 649–658.
S Kay Fisher, Kenneth J Ciu�reda, and Steven Hammer. 1987. Interocular equality oftonic accommodation and consensuality of accommodative hysteresis. Ophthalmicand Physiological Optics 7, 1 (1987), 17–20.
Horacio E Fortunato and Manuel M Oliveira. 2014. Fast high-quality non-blind decon-volution using sparse adaptive priors. �e Visual Computer 30, 6-8 (2014), 661–671.
Robert T Held, Emily A Cooper, James F O�Brien, and Martin S Banks. 2010. Usingblur to a�ect perceived distance and size. ACM Transactions on Graphics 29, 2 (2010),1–33.
ACM Transactions on Graphics, Vol. 36, No. 6, Article 210. Publication date: November 2017.
210:12 • Cholewiak, Love, Srinivasan, Ng, and Banks
David M Ho�man, Ahna R Girshick, Kurt Akeley, and Martin S Banks. 2008. Vergence–accommodation con�icts hinder visual performance and cause visual fatigue. Journalof Vision 8, 3 (2008), 1–30.
Miriam Hoyt. 2016. Standard (Stauton) Chess Set. (2016). Retrieved March 3, 2017 fromh�p://www.blendswap.com/blends/view/86207
Xinda Hu and Hong Hua. 2015. Design and tolerance of a free-form optical systemfor an optical see-through multi-focal-plane display. Applied Optics 54, 33 (2015),9990–9999.
Wenzel Jakob. 2010. Mitsuba renderer. (2010). Retrieved January 6, 2017 from h�p://www.mitsuba-renderer.org
Jay-Artist. 2012. Country-Kitchen Cycles. (2012). Retrieved January 6, 2017 fromh�p://www.blendswap.com/blends/view/42851
Paul V Johnson, Jared AQ Parnell, Joohwan Kim, Christopher D Saunter, Gordon DLove, and Martin S Banks. 2016. Dynamic lens and monovision 3D displays toimprove viewer comfort. Optics Express 24, 11 (2016), 11808–11827.
Masanori Kakimoto, Tomoaki Tatsukawa, Yukiteru Mukai, and Tomoyuki Nishita. 2007.Interactive simulation of the human eye depth of �eld and its correction by spectaclelenses. In Computer Graphics Forum, Vol. 26. Wiley Online Library, 627–636.
Craig Kolb, Don Mitchell, and Pat Hanrahan. 1995. A realistic camera model forcomputer graphics. In Proceedings of the 22nd Annual Conference on ComputerGraphics and Interactive Techniques. ACM, 317–324.
Robert Konrad, Emily A Cooper, and Gordon Wetzstein. 2016. Novel optical con-�gurations for virtual reality: evaluating user preference and performance withfocus-tunable and monovision near-eye displays. In Proceedings of the 2016 CHIConference on Human Factors in Computing Systems. ACM, 1211–1220.
George-Alex Koulieris, Bee Bui, Martin S. Banks, and George Dre�akis. 2017. Accom-modation and Comfort in Head-Mounted Displays. ACM Transactions on Graphics(SIGGRAPH Conference Proceedings) 36, 4 (July 2017), 11. h�p://www-sop.inria.fr/reves/Basilic/2017/KBBD17
Philip B Kruger, Steven Mathews, Karan R Aggarwala, and Nivian Sanchez. 1993.Chromatic aberration and ocular focus: Fincham revisited. Vision Research 33, 10(1993), 1397–1411.
Marc Lambooij, Marten Fortuin, Ingrid Heynderickx, and Wijnand IJsselsteijn. 2009.Visual discomfort and visual fatigue of stereoscopic displays: A review. Journal ofImaging Science and Technology 53, 3 (2009), 30201–1–30201–14.
Tao Liu and Larry N �ibos. 2017. Variation of axial and oblique astigmatism withaccommodation across the visual �eld. Journal of Vision 17, 3 (2017), 1–23.
Norberto Lopez-Gil, Frances J Rucker, Lawrence R Stark, Mustanser Badar, �eodoreBorgovan, Sean Burke, and Philip B Kruger. 2007. E�ect of third-order aberrationson dynamic accommodation. Vision Research 47, 6 (2007), 755–765.
Gordon D Love, David M Ho�man, Philip JW Hands, James Gao, Andrew K Kirby, andMartin S Banks. 2009. High-speed switchable lens enables the development of avolumetric stereoscopic display. Optics Express 17, 18 (2009), 15716–15725.
Kevin J MacKenzie, David M Ho�man, and Simon J Wa�. 2010. Accommodation tomultiple-focal-plane displays: Implications for improving stereoscopic displays andfor accommodation control. Journal of Vision 10, 8 (2010), 1–20.
Guido Maiello, Manuela Chessa, Fabio Solari, and Peter J Bex. 2014. Simulated disparityand peripheral blur interact during binocular fusion. Journal of Vision 14, 8 (2014),1–14.
David H Marimont and Brian A Wandell. 1994. Matching color images: the e�ects ofaxial chromatic aberration. Journal of the Optical Society of America A 11, 12 (1994),3113–3122.
George Mather and David RR Smith. 2002. Blur discrimination and its relation toblur-mediated depth perception. Perception 31, 10 (2002), 1211–1219.
Michael Mauderer, Simone Conte, Miguel A Nacenta, and Dhanraj Vishwanath. 2014.Depth perception with gaze-contingent depth of �eld. In Proceedings of the SIGCHIConference on Human Factors in Computing Systems. ACM, 217–226.
Sina Mostafawy, Omid Kermani, and Holger Lubatschowski. 1997. Virtual eye: retinalimage visualization of the human eye. IEEE Computer Graphics and Applications 17,1 (1997), 8–12.
Masashi Nakajima, Takahiro Hiraoka, Yoko Hirohara, Tetsuro Oshika, and ToshifumiMihashi. 2015. Veri�cation of the lack of correlation between age and longitudinalchromatic aberrations of the human eye from the visible to the infrared. BiomedicalOptics Express 6, 7 (2015), 2676–2694.
Rafael Navarro, David R Williams, and Pablo Artal. 1993. Modulation transfer of thehuman eye as a function of retinal eccentricity. Journal of the Optical Society ofAmerica A 10, 2 (1993), 201–212.
Ren Ng and Pat Hanrahan. 2006. Digital correction of lens aberrations in light �eldphotography. In Proceedings of the International Optical Design Conference. OpticalSociety of America.
Vincent A Nguyen, Ian P Howard, and Robert S Allison. 2005. Detection of the depthorder of defocused images. Vision Research 45, 8 (2005), 1003–1011.
Ma�hias Nießner, Roman Sturm, and Gunther Greiner. 2012. Real-time simulation andvisualization of human vision through eyeglasses on the GPU. In Proceedings of the11th ACM SIGGRAPH International Conference on Virtual-Reality Continuum and itsApplications in Industry. ACM, 195–202.
D Alfred Owens. 1979. �e Mandelbaum e�ect: Evidence for an accommodative biastoward intermediate viewing distances. Journal of the Optical Society of America 69,5 (1979), 646–652.
Steven G Parker, James Bigler, Andreas Dietrich, Heiko Friedrich, Jared Hoberock,David Luebke, David McAllister, Morgan McGuire, Keith Morley, Austin Robison,and others. 2010. Optix: a general purpose ray tracing engine. In ACM Transactionson Graphics (TOG), Vol. 29. ACM, 66.
Henry B Peters. 1961. �e relationship between refractive error and visual acuity atthree age levels. Optometry & Vision Science 38, 4 (1961), 194–198.
Ma� Pharr and Greg Humphreys. 2014. Physically based rendering: From theory toimplementation (3rd ed.). Morgan Kaufmann.
James Polans, Bart Jaeken, Ryan P McNabb, Pablo Artal, and Joseph A Iza�. 2015. Wide-�eld optical model of the human eye with asymmetrically tilted and decentered lensthat reproduces measured ocular aberrations. Optica 2, 2 (2015), 124–134.
Jason Porter, Antonio Guirao, Ian G Cox, and David R Williams. 2001. Monochromaticaberrations of the human eye in a large population. Journal of the Optical Society ofAmerica A 18, 8 (2001), 1793–1803.
Jonathan Ragan-Kelley, Connelly Barnes, Andrew Adams, Sylvain Paris, Fredo Durand,and Saman Amarasinghe. 2013. Halide: a language and compiler for optimizing par-allelism, locality, and recomputation in image processing pipelines. ACM SIGPLANNotices 48, 6 (2013), 519–530.
Maurice C Rynders, Rafael Navarro, and M Angeles Losada. 1998. Objective measure-ment of the o�-axis longitudinal chromatic aberration in the human eye. VisionResearch 38, 4 (1998), 513–522.
�omas O Salmon and Corina van de Pol. 2006. Normal-eye Zernike coe�cients androot-mean-square wavefront errors. Journal of Cataract & Refractive Surgery 32, 12(2006), 2064–2074.
Cli�on M Schor. 1992. A dynamic model of cross-coupling between accommodationand convergence: simulations of step and frequency responses. Optometry & VisionScience 69, 4 (1992), 258–269.
Lindsay T Sharpe, Andrew Stockman, Herbert Jagle, and Jeremy Nathans. 1999. Opsingenes, cone photopigments, color vision, and color blindness. Color vision: Fromgenes to perception (1999), 3–51.
Takashi Shibata, Joohwan Kim, David M Ho�man, and Martin S Banks. 2011. �e zoneof comfort: Predicting visual discomfort with stereo displays. Journal of Vision 11, 8(2011), 1–29.
KH Spring and Walter S. Stiles. 1948. Variation of pupil size with change in the angleat which the light stimulus strikes the retina. �e British Journal of Ophthalmology32, 6 (1948), 340–346.
Benjamin Steinert, Holger Dammertz, Johannes Hanika, and Hendrik PA Lensch. 2011.General spectral camera lens simulation. In Computer Graphics Forum, Vol. 30. WileyOnline Library, 1643–1654.
Mahesh M Subedar and Lina J Karam. 2016. 3D Blur Discrimination. ACM Transactionson Applied Perception (TAP) 13, 3 (2016), 1–13.
Ning Tang and ShuangJiu Xiao. 2015. Real-time human vision rendering using blurdistribution function. In Proceedings of the 14th ACM SIGGRAPH International Con-ference on Virtual Reality Continuum and its Applications in Industry. ACM, 39–42.
Larry N �ibos, Ming Ye, Xiaoxiao Zhang, and Arthur Bradley. 1992. �e chromaticeye: a new reduced-eye model of ocular chromatic aberration in humans. AppliedOptics 31, 19 (1992), 3594–3600.
Dhanraj Vishwanath and Erik Blaser. 2010. Retinal blur and the perception of egocentricdistance. Journal of Vision 10, 10 (2010), 1–16.
Ingo Wald, Sven Woop, Carsten Benthin, Gregory S Johnson, and Manfred Ernst. 2014.Embree: a kernel framework for e�cient CPU ray tracing. ACM Transactions onGraphics (TOG) 33, 4 (2014), 143.
Andrew B Watson and Albert J Ahumada. 2011. Blur clari�ed: A review and synthesisof blur discrimination. Journal of Vision 11, 5 (2011), 1–23.
Simon J Wa�, Kurt Akeley, Marc O Ernst, and Martin S Banks. 2005. Focus cues a�ectperceived depth. Journal of Vision 5, 10 (2005), 834–862.
James S Wol�sohn, Bernard Gilmartin, Edward AH Mallen, and Sei-ichi Tsujimura.2001. Continuous recording of accommodation and pupil size using the Shin-NipponSRW-5000 autorefractor. Ophthalmic and Physiological Optics 21, 2 (2001), 108–113.
James S Wol�sohn, Clare O’Donnell, W Neil Charman, and Bernard Gilmartin. 2004.Simultaneous continuous recording of accommodation and pupil size using themodi�ed Shin-Nippon SRW-5000 autorefractor. Ophthalmic and Physiological Optics24, 2 (2004), 142–147.
Jiaze Wu, Changwen Zheng, Xiaohui Hu, and Fanjiang Xu. 2011. Realistic simulationof peripheral vision using an aspherical eye model. Eurographics (2011).
Marina Zannoli, Gordon D Love, Rahul Narain, and Martin S Banks. 2016. Blur and theperception of depth at occlusions. Journal of Vision 16, 6 (2016), 1–25.
Tingting Zhang, Louise O�Hare, Paul BHibbard, Harold TNefs, and Ingrid Heynderickx.2015. Depth of �eld a�ects perceived depth in stereographs. ACM Transactions onApplied Perception (TAP) 11, 4 (2015), 18.
ACM Transactions on Graphics, Vol. 36, No. 6, Article 210. Publication date: November 2017.