Charge Distribution in the Surface BEDT-TTF Layer of ...Typeset with jpsj2.cls Full Paper Charge...
7
Typeset with jpsj2.cls <ver.1.2> Full Paper Charge Distribution in the Surface BEDT-TTF Layer of α-(BEDT-TTF) 2 I 3 at Room Temperature with STM Eiichi Mori, Hidemasa Usui, Hirokazu Sakamoto, Kenji Mizoguchi, * and Toshio Naito 1 Department of Physics, Tokyo Metropolitan University, Hachioji, Tokyo 192-0397, Japan 1 Division of Chemistry and Biology, Graduate School of Science and Engineering, Ehime University, Matsuyama, Ehime 790-8577, Japan The charge distribution in the surface BEDT-TTF layer of the α-(BEDT-TTF) 2 I 3 crys- tal with the charge disproportionation state at room temperature was studied in detail by a scanning tunneling microscope (STM), where BEDT-TTF (abbreviated as ET) is bis(ethylenedithio)tetrathiafulvalene. The obtained molecular charge distribution in the sur- face ET layer suggests that the electronic states of the surface ET layer at room temperature is the charge-ordered state, stable below 135 K in bulk crystals, rather than the charge dispropor- tionation state above 135 K. The most probable mechanism underlying this remarkable finding is the particular freedom to the surface ET layer. The missing of the I 3 layer partially removes the structural constraint of the steric interaction between the thermally vibrating ethylene groups and the neighboring two I 3 layers. This mechanism would have something in common with the layered ET complexes. KEYWORDS: charge transfer salt, charge ordering, charge disproportionation, surface electronic states, STM 1. Introduction Recently, charge ordering (CO) and charge dispro- portionation (CD) in strongly correlated organic sys- tems, where the intersite Coulomb interaction V is large enough, have attracted much interest. The number of π charges on the molecules in a unit cell could be nonequiv- alent in the CO and CD states. The CO state represents the long-range ordering of the intermolecular charge dis- tribution caused by the intersite Coulomb repulsion V with the insulating electronic states, which is similar to the charge density wave in phenomenon, but not in mechanism. However, the CD state is similar to the CO state, but is caused by anisotropic transfer integrals in the unit cell, which might be metallic in the electronic states. It has been reported that α-(BEDT-TTF) 2 I 3 shows both the CD and CO states in different temper- ature ranges, 1–3 where BEDT-TTF (abbreviated as ET, hereafter) is bis(ethylenedithio)tetrathiafulvalene. This system has currently attracted huge interest as the typi- cal bulk example of the massless Dirac fermion system 2, 3 along with the layer graphene system. 4 The a-b plane projection of the crystal structure of α-(ET) 2 I 3 determined by X-ray analysis 5, 6 is shown in Fig. 1, which contains four nonequivalent ET molecules, i.e., A, A’, B, and C. On the distribution of the molecu- lar charges in the unit cell, there are three independent sites in the CD state at room temperature (RT), but roughly two in the CO state below T C = 135 K. It is con- firmed that the intermolecular charge distribution below T C shows a horizontal stripe pattern with rich charges of 0.7 - 0.8 at the A and B sites and poor charges of 0.2 - 0.3 at the A’ and C sites, 5 which is consistent with the results of NMR analysis, 7 Raman study, 8 and theoretical prediction. 9 The horizontal stripe means that the ordered * E-mail address: [email protected] Fig. 1. (Color online) Structure of α-(BEDT-TTF) 2 I 3 deter- mined by X-ray analysis at 300 K. 5, 6 The a-b plane is parallel to the observed surface. Hydrogen atoms are not indicated. The labels A, A’, B, and C are the same as those reported in ref. 5. a = 0.9187 nm, b = 1.0793 nm, c = 1.7400 nm, α = 96.957 ◦ , β = 97.911 ◦ , and γ = 90.795 ◦ . direction of charge-rich or charge-poor molecules is per- pendicular to the molecular stacking a-axis. Above the transition temperature, this system behaves as a semi- metal with weak charge disproportionation. Surface molecular charges have been studied in sev- Fig. 2. (Color online) Molecular structure of BEDT-TTF with HOMO molecular orbitals calculated by MOPAC. The size of the orbitals represents the relative fraction of HOMO electrons. 1
Transcript of Charge Distribution in the Surface BEDT-TTF Layer of ...Typeset with jpsj2.cls Full Paper Charge...
Typeset with jpsj2.cls <ver.1.2> Full Paper
Charge Distribution in the Surface BEDT-TTF Layer of !-(BEDT-TTF)2I3 at Room
Temperature with STM
Eiichi Mori, Hidemasa Usui, Hirokazu Sakamoto, Kenji Mizoguchi,! and Toshio Naito1
Department of Physics, Tokyo Metropolitan University, Hachioji, Tokyo 192-0397, Japan1Division of Chemistry and Biology, Graduate School of Science and Engineering, Ehime University, Matsuyama, Ehime
790-8577, Japan
The charge distribution in the surface BEDT-TTF layer of the !-(BEDT-TTF)2I3 crys-tal with the charge disproportionation state at room temperature was studied in detailby a scanning tunneling microscope (STM), where BEDT-TTF (abbreviated as ET) isbis(ethylenedithio)tetrathiafulvalene. The obtained molecular charge distribution in the sur-face ET layer suggests that the electronic states of the surface ET layer at room temperature isthe charge-ordered state, stable below 135 K in bulk crystals, rather than the charge dispropor-tionation state above 135 K. The most probable mechanism underlying this remarkable findingis the particular freedom to the surface ET layer. The missing of the I3 layer partially removesthe structural constraint of the steric interaction between the thermally vibrating ethylenegroups and the neighboring two I3 layers. This mechanism would have something in commonwith the layered ET complexes.
KEYWORDS: charge transfer salt, charge ordering, charge disproportionation, surface electronic states,STM
1. IntroductionRecently, charge ordering (CO) and charge dispro-
portionation (CD) in strongly correlated organic sys-tems, where the intersite Coulomb interaction V is largeenough, have attracted much interest. The number of !charges on the molecules in a unit cell could be nonequiv-alent in the CO and CD states. The CO state representsthe long-range ordering of the intermolecular charge dis-tribution caused by the intersite Coulomb repulsion Vwith the insulating electronic states, which is similarto the charge density wave in phenomenon, but not inmechanism. However, the CD state is similar to the COstate, but is caused by anisotropic transfer integrals inthe unit cell, which might be metallic in the electronicstates. It has been reported that "-(BEDT-TTF)2I3shows both the CD and CO states in di!erent temper-ature ranges,1–3 where BEDT-TTF (abbreviated as ET,hereafter) is bis(ethylenedithio)tetrathiafulvalene. Thissystem has currently attracted huge interest as the typi-cal bulk example of the massless Dirac fermion system2,3
along with the layer graphene system.4The a-b plane projection of the crystal structure of
"-(ET)2I3 determined by X-ray analysis5,6 is shown inFig. 1, which contains four nonequivalent ET molecules,i.e., A, A’, B, and C. On the distribution of the molecu-lar charges in the unit cell, there are three independentsites in the CD state at room temperature (RT), butroughly two in the CO state below TC = 135 K. It is con-firmed that the intermolecular charge distribution belowTC shows a horizontal stripe pattern with rich charges of0.7 - 0.8 at the A and B sites and poor charges of 0.2 -0.3 at the A’ and C sites,5 which is consistent with theresults of NMR analysis,7 Raman study,8 and theoreticalprediction.9 The horizontal stripe means that the ordered
!E-mail address: [email protected]
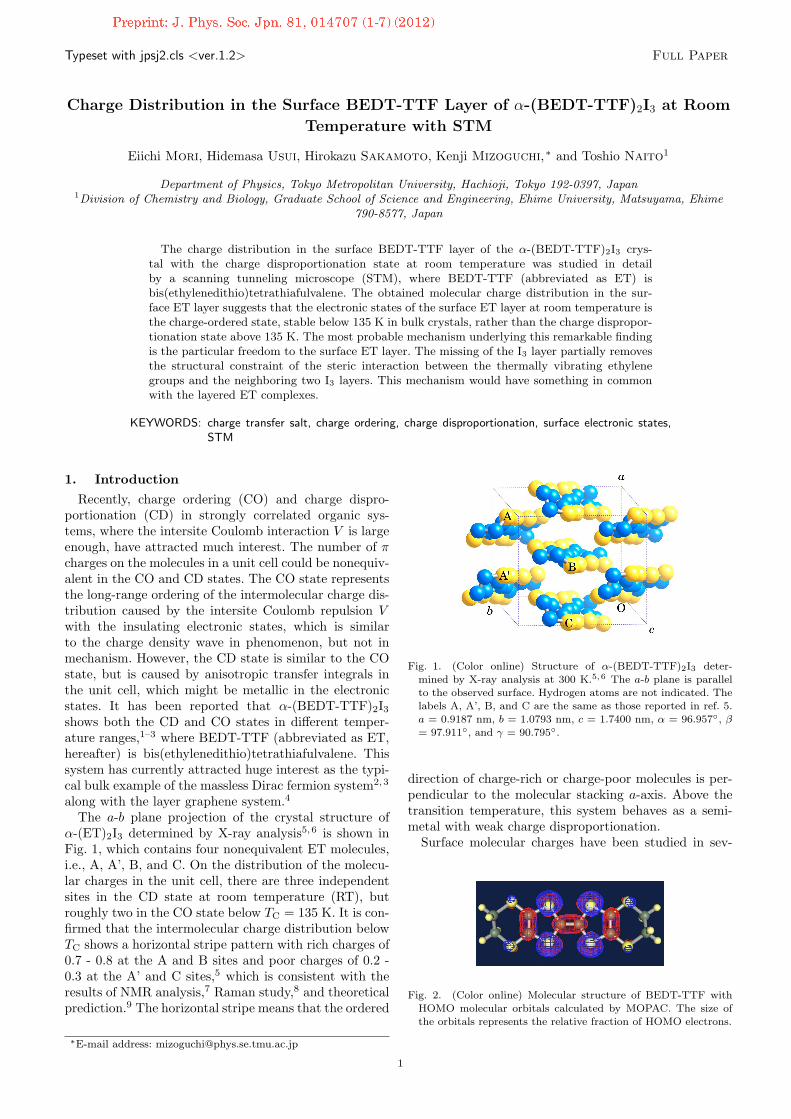
Fig. 1. (Color online) Structure of !-(BEDT-TTF)2I3 deter-mined by X-ray analysis at 300 K.5,6 The a-b plane is parallelto the observed surface. Hydrogen atoms are not indicated. Thelabels A, A’, B, and C are the same as those reported in ref. 5.a = 0.9187 nm, b = 1.0793 nm, c = 1.7400 nm, ! = 96.957", "= 97.911", and # = 90.795".
direction of charge-rich or charge-poor molecules is per-pendicular to the molecular stacking a-axis. Above thetransition temperature, this system behaves as a semi-metal with weak charge disproportionation.
Surface molecular charges have been studied in sev-
Fig. 2. (Color online) Molecular structure of BEDT-TTF withHOMO molecular orbitals calculated by MOPAC. The size ofthe orbitals represents the relative fraction of HOMO electrons.
1
kemserver
Preprint: J. Phys. Soc. Jpn. 81, 014707 (1-7) (2012)
2 J. Phys. Soc. Jpn. Full Paper Author Name
eral molecular crystal systems. In an earlier study ofthe present system "-(ET)2I3, scanning tunneling mi-croscope (STM) images were assigned to the proton 1sorbitals at the end ethylene.10 ! electrons were, however,present on sulfur atoms, but absent not only on theseprotons but also on ethylene carbons, as demonstratedby the molecular orbital calculation for the HOMO ofET molecule in Fig. 2. Thus, further investigation of themolecular charge distribution in "-(ET)2I3 is needed.Yoshimura et al. have reported the surface superstruc-ture of ET molecules in the observed b-c plane paral-lel to the I3 layers in #-(ET)2I3.11 They observed a pe-riodic structural modulation consisting of two alterna-tive di!erent spacings of 0.84 and 0.68 nm along the c-axis with c = 0.66 nm in the bulk crystal. Thus, it isvery interesting to investigate the surface structure ofthe present system "-(ET)2I3 with the same composi-tion as but a di!erent structure from #-(ET)2I3. Ishidaand coworkers have reported the surface reconstructionat various temperatures in the quasi-one dimensional sys-tem #-(ET)2PF6 with the CO ground state.12–14 Theyreported the remarkable surface reconstruction along theb-direction perpendicular to the observed a-c plane atRT, which reaches up to 0.15 nm following their analy-sis based on the assumption for the surface reconstruc-tion solely to be structural, but not the redistributionof charges. However, note that Nogami and Mori havereported a CO ground state with a large charge distribu-tion from 0 to +0.8 electrons on the four ET moleculesin the unit cell at 90 K in this system.14 Thus, it is alsointeresting to study the origin of the surface reconstruc-tion of the present system "-(ET)2I3 in detail, as one ofthe organic molecular systems. In $-(ET)2RbZn(SCN)4,Yoneyama and coworkers reported the electronic statesat RT with STM.15 It has been considered that themetallic state at RT transforms into the CO insulatorbelow 190 K.16 However, Yoneyama et al. discoveredthe brightness pattern corresponding to the charge dis-tribution among the molecules in the unit cell and pro-posed a vertical-stripe-type CO state at RT. This findingraises a possibility that the electronic states of the sur-face layer are independent of those of bulk crystals inorganic molecular systems. Thus, it is important to clar-ify whether it is a special example or a universal featureof organic layered crystals.
In this research, we study the CD state of "-(ET)2I3at RT by STM. On the basis of the hydrogen-like 3porbitals at the end sulfur atoms in each molecule, theobserved topographies are analyzed in detail, which showa small but distinct deviation from the reported crystalstructure and molecular charges. Two possible origins ofthe deviation are discussed in detail, on the basis of theresults of the electric field analysis of an I"3 layer. Finally,we conclude that the CD state is not found, but that theCO state is observed in the surface ET layer even at RT.We also propose a model for interpreting this interestingfinding, similar to that in the $-(ET)2RbZn(SCN)4 case.
2. Experimental
STM was carried out at RT with easyScan 2, man-ufactured by NanoSurf R!, with a mechanically sharp-
ened Pt0.8Ir0.2 wire. Throughout this study, the tunnel-ing current and tip potential were set to 1 nA and 10mV, respectively. Single crystals of "-(ET)2I3 were pre-pared following a previously reported procedure17 withchlorobenzene instead of tetrahydrofuran as the solvent.The typical crystal dimensions were 5 " 2 " 0.05 mm3.The instrumental drift of STM was eliminated on the ba-sis of the reported lattice parameters5 with the SPIPTM
image processing software.
3. Discussion
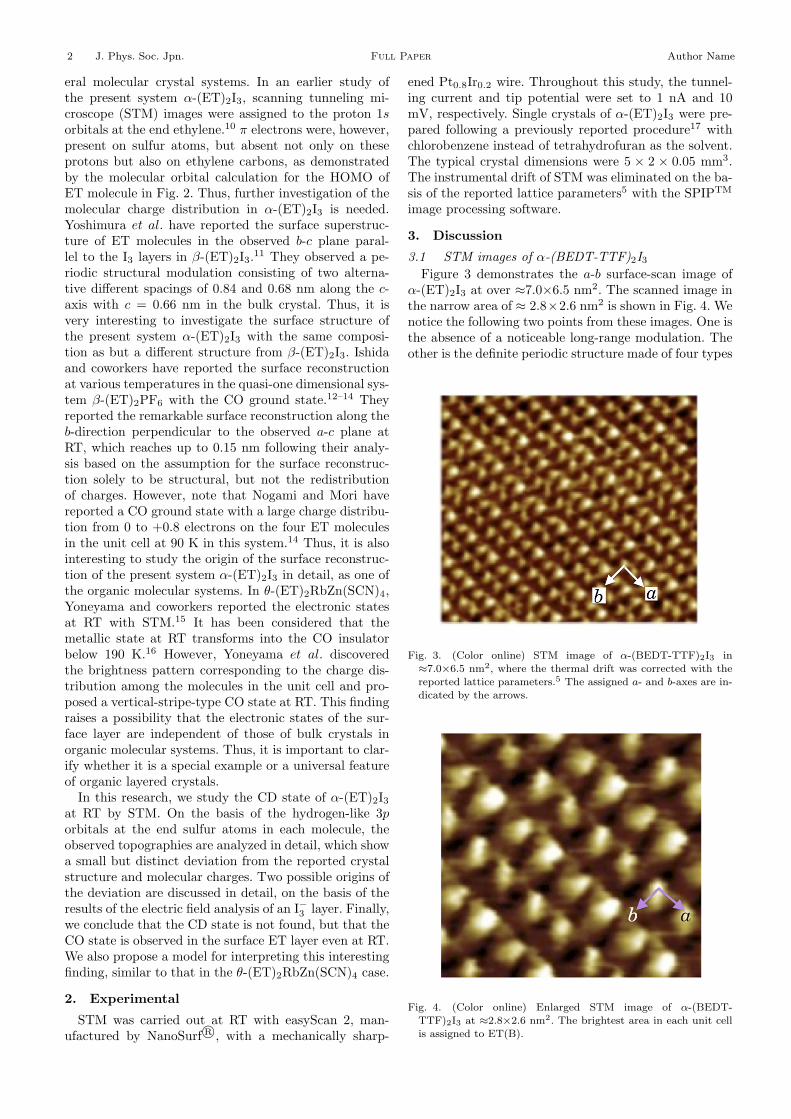
3.1 STM images of "-(BEDT-TTF)2I3Figure 3 demonstrates the a-b surface-scan image of
"-(ET)2I3 at over #7.0"6.5 nm2. The scanned image inthe narrow area of # 2.8"2.6 nm2 is shown in Fig. 4. Wenotice the following two points from these images. One isthe absence of a noticeable long-range modulation. Theother is the definite periodic structure made of four types
Fig. 3. (Color online) STM image of !-(BEDT-TTF)2I3 in!7.0"6.5 nm2, where the thermal drift was corrected with thereported lattice parameters.5 The assigned a- and b-axes are in-dicated by the arrows.
Fig. 4. (Color online) Enlarged STM image of !-(BEDT-TTF)2I3 at !2.8"2.6 nm2. The brightest area in each unit cellis assigned to ET(B).

J. Phys. Soc. Jpn. Full Paper Author Name 3
of bright areas with characteristic features in brightnessand shapes, which is helpful as the tool for assignment.The molecular stacking a-axis along the A-A’ and B-C molecular arrays is easily assigned to run from thetop left to the bottom right. The brightest areas can bereasonably assigned to the B site [hereafter, representedas ET(B)] in Fig. 1, because the molecular charge inthe B site is largest at RT.5 Thus, less bright areas inthe B-C arrays, which contain the brightest ET(B), areassigned to the C site [ET(C)]. Arrays with small andless bright areas in between the B-C arrays correspondto the A and A’ [ET(A) and ET(A’)] arrays, which areequivalent to each other at RT within the experimentaluncertainty, following the reported molecular structureand charges, as shown by "S,i and %i in Table I and bythe X-ray results at RT in Table II.5 Figure 2 shows themolecular HOMO orbitals of an ET molecule, which willbe observed with an STM probe tip. Since the atoms ofend ethylenes have no HOMO orbitals, one should probeone of the four end sulfur 3p orbitals in the a-b planewith STM. Thus, the interpretation of the STM imagein terms of the proton atoms of the end ethylene in ref. 11needs to be reexamined. The symmetry axes of the sulfur3p orbitals in both ends tilted slightly from the normal tothe molecular plane because of the twisted ethylene sp3
bondings. However, it is safely assumed that one observesthe time-averaged direction of the symmetry axis for the3p orbital in STM, that is, the normal to the molecularplane because of the rapid thermal motion between thebistable twisted positions.
The structure determined by X-ray analysis5 is super-posed on the STM image in Fig. 5. The bright areasshow a reasonable agreement with the 3p orbitals of sul-fur atoms in the position and direction without sizablereconstructions within the limited accuracy of the wave-function image. Here, it is assumed that the bright areas
Fig. 5. (Color online) Crystal structure assigned to the STM im-age of !-(BEDT-TTF)2I3, with which the topographies in Fig. 9are simulated. The balls with A’ [ET(A’)], A [ET(A)], B [ET(B)],and C [ET(C)] represent the relevant sulfur atoms. This modelassignment corresponds to the a-b plane observed from the re-verse side of Fig. 1. The three large arrows represent the directionof the topography shown in Fig. 9.
Fig. 6. (Color online) 3p wavefunction of a sulfur atom with thee!ective nuclear charge of Ze! = 5.48 for every 10" of $ from 0to 80, which is defined in Fig. 7. r is the distance from the sulfurnucleus. STM observes the region farther than r ! 0.1 nm in !-(BEDT-TTF)2I3.
are assigned to the halves of the sulfur 3p orbitals on thesingle side of the molecular plane, because the symmetryaxis of the sulfur 3p orbital tilts by about 12# out of thea-b plane. The present assignment of the molecular sitesis also consistent with the characteristic feature of theX-ray structure; one can see a weak dimerization alongthe A-A’ array corresponding to the alternating transferintegrals of a2 and a3 in the same notification as that inref. 5.
3.2 Analysis of STM topographyThe wavefunction #i
S3p for the 3p orbital of the rele-vant sulfur atom in the ET(i) molecule (i = B, C, A, orA’) is expressed as
#iS3p =
!&ifS#S3p, (1)
where &i is the molecular charge number in the HOMOband of each ET(i), fS is the fraction of 3p charge at thesulfur atom in each ET(i), and #S3p, as shown in Fig.6, is the wavefunction of the sulfur 3p orbital with theatomic number Z=16, expressed as
#S3p =
"2!
#Ze!
a0
$5 r
81
#6 $ Ze!r
a0
$exp
#$Ze!r
3a0
$cos $, (2)
where a0 = 5.29"10"11 m is the Bohr radius and Ze! =5.48 is the e!ective nuclear charge for the sulfur atom,in which the screening e!ect of the inner core electronsis taken into account.18 The representative contour ofthe constant #S3p is shown in Fig. 7. The tunnel currentI in the limits of small voltage and low temperature isexpressed as19
Itunnel =#
2!
!
$e2Va$i |Mµ,i|2 %(Ei $ EF)%(Eµ $ EF), (3)
where Va is the applied voltage, Mµ,i is the tunnelingmatrix element between the states #µ of the probe tipand #i
S3p of the relevant sulfur atom, and Ei, Eµ, andEF are the energies of the states #i
S3p and #µ in theabsence of tunneling, and the Fermi energy of the tip,respectively. The expected change in the probe height in
4 J. Phys. Soc. Jpn. Full Paper Author Name
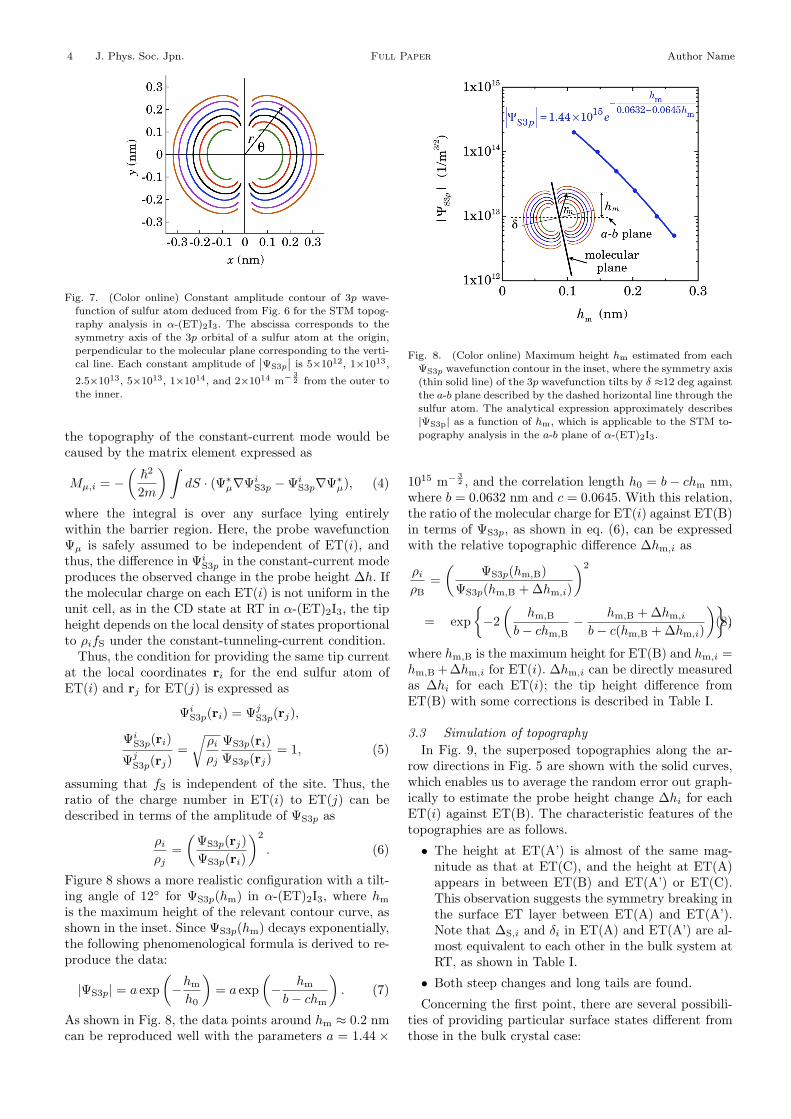
Fig. 7. (Color online) Constant amplitude contour of 3p wave-function of sulfur atom deduced from Fig. 6 for the STM topog-raphy analysis in !-(ET)2I3. The abscissa corresponds to thesymmetry axis of the 3p orbital of a sulfur atom at the origin,perpendicular to the molecular plane corresponding to the verti-cal line. Each constant amplitude of
˛̨"S3p
˛̨is 5"1012, 1"1013,
2.5"1013, 5"1013, 1"1014, and 2"1014 m# 32 from the outer to
the inner.
the topography of the constant-current mode would becaused by the matrix element expressed as
Mµ,i = $#
!2
2m
$%dS · (#!
µ%#iS3p $ #i
S3p%#!µ), (4)
where the integral is over any surface lying entirelywithin the barrier region. Here, the probe wavefunction#µ is safely assumed to be independent of ET(i), andthus, the di!erence in #i
S3p in the constant-current modeproduces the observed change in the probe height "h. Ifthe molecular charge on each ET(i) is not uniform in theunit cell, as in the CD state at RT in "-(ET)2I3, the tipheight depends on the local density of states proportionalto &ifS under the constant-tunneling-current condition.
Thus, the condition for providing the same tip currentat the local coordinates ri for the end sulfur atom ofET(i) and rj for ET(j) is expressed as
#iS3p(ri) = #j
S3p(rj),
#iS3p(ri)
#jS3p(rj)
=&
&i
&j
#S3p(ri)#S3p(rj)
= 1, (5)
assuming that fS is independent of the site. Thus, theratio of the charge number in ET(i) to ET(j) can bedescribed in terms of the amplitude of #S3p as
&i
&j=
##S3p(rj)#S3p(ri)
$2
. (6)
Figure 8 shows a more realistic configuration with a tilt-ing angle of 12# for #S3p(hm) in "-(ET)2I3, where hm
is the maximum height of the relevant contour curve, asshown in the inset. Since #S3p(hm) decays exponentially,the following phenomenological formula is derived to re-produce the data:
|#S3p| = a exp#$hm
h0
$= a exp
#$ hm
b $ chm
$. (7)
As shown in Fig. 8, the data points around hm # 0.2 nmcan be reproduced well with the parameters a = 1.44 "
Fig. 8. (Color online) Maximum height hm estimated from each"S3p wavefunction contour in the inset, where the symmetry axis(thin solid line) of the 3p wavefunction tilts by % !12 deg againstthe a-b plane described by the dashed horizontal line through thesulfur atom. The analytical expression approximately describes|"S3p| as a function of hm, which is applicable to the STM to-pography analysis in the a-b plane of !-(ET)2I3.
1015 m" 32 , and the correlation length h0 = b $ chm nm,
where b = 0.0632 nm and c = 0.0645. With this relation,the ratio of the molecular charge for ET(i) against ET(B)in terms of #S3p, as shown in eq. (6), can be expressedwith the relative topographic di!erence "hm,i as
&i
&B=
##S3p(hm,B)
#S3p(hm,B + "hm,i)
$2
= exp'$2
#hm,B
b $ chm,B$ hm,B + "hm,i
b $ c(hm,B + "hm,i)
$(,(8)
where hm,B is the maximum height for ET(B) and hm,i =hm,B +"hm,i for ET(i). "hm,i can be directly measuredas "hi for each ET(i); the tip height di!erence fromET(B) with some corrections is described in Table I.
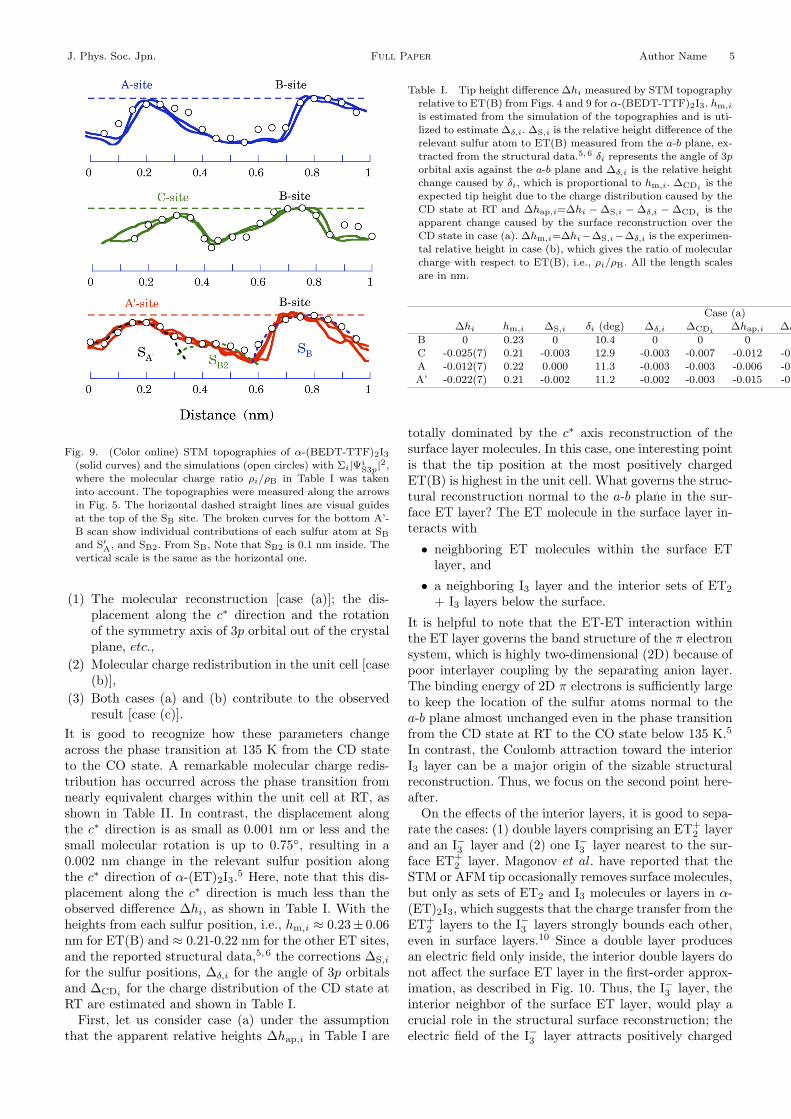
3.3 Simulation of topographyIn Fig. 9, the superposed topographies along the ar-
row directions in Fig. 5 are shown with the solid curves,which enables us to average the random error out graph-ically to estimate the probe height change "hi for eachET(i) against ET(B). The characteristic features of thetopographies are as follows.• The height at ET(A’) is almost of the same mag-
nitude as that at ET(C), and the height at ET(A)appears in between ET(B) and ET(A’) or ET(C).This observation suggests the symmetry breaking inthe surface ET layer between ET(A) and ET(A’).Note that "S,i and %i in ET(A) and ET(A’) are al-most equivalent to each other in the bulk system atRT, as shown in Table I.
• Both steep changes and long tails are found.Concerning the first point, there are several possibili-
ties of providing particular surface states di!erent fromthose in the bulk crystal case:
J. Phys. Soc. Jpn. Full Paper Author Name 5
Fig. 9. (Color online) STM topographies of !-(BEDT-TTF)2I3(solid curves) and the simulations (open circles) with #i|"i
S3p|2,
where the molecular charge ratio &i/&B in Table I was takeninto account. The topographies were measured along the arrowsin Fig. 5. The horizontal dashed straight lines are visual guidesat the top of the SB site. The broken curves for the bottom A’-B scan show individual contributions of each sulfur atom at SB
and S$A, and SB2. From SB, Note that SB2 is 0.1 nm inside. The
vertical scale is the same as the horizontal one.
(1) The molecular reconstruction [case (a)]; the dis-placement along the c! direction and the rotationof the symmetry axis of 3p orbital out of the crystalplane, etc.,
(2) Molecular charge redistribution in the unit cell [case(b)],
(3) Both cases (a) and (b) contribute to the observedresult [case (c)].
It is good to recognize how these parameters changeacross the phase transition at 135 K from the CD stateto the CO state. A remarkable molecular charge redis-tribution has occurred across the phase transition fromnearly equivalent charges within the unit cell at RT, asshown in Table II. In contrast, the displacement alongthe c! direction is as small as 0.001 nm or less and thesmall molecular rotation is up to 0.75#, resulting in a0.002 nm change in the relevant sulfur position alongthe c! direction of "-(ET)2I3.5 Here, note that this dis-placement along the c! direction is much less than theobserved di!erence "hi, as shown in Table I. With theheights from each sulfur position, i.e., hm,i # 0.23± 0.06nm for ET(B) and # 0.21-0.22 nm for the other ET sites,and the reported structural data,5,6 the corrections "S,i
for the sulfur positions, "!,i for the angle of 3p orbitalsand "CDi for the charge distribution of the CD state atRT are estimated and shown in Table I.
First, let us consider case (a) under the assumptionthat the apparent relative heights "hap,i in Table I are
Table I. Tip height di!erence $hi measured by STM topographyrelative to ET(B) from Figs. 4 and 9 for !-(BEDT-TTF)2I3. hm,i
is estimated from the simulation of the topographies and is uti-lized to estimate $!,i. $S,i is the relative height di!erence of therelevant sulfur atom to ET(B) measured from the a-b plane, ex-tracted from the structural data.5,6 %i represents the angle of 3porbital axis against the a-b plane and $!,i is the relative heightchange caused by %i, which is proportional to hm,i. $CDi is theexpected tip height due to the charge distribution caused by theCD state at RT and $hap,i=$hi # $S,i # $!,i # $CDi is theapparent change caused by the surface reconstruction over theCD state in case (a). $hm,i=$hi#$S,i#$!,i is the experimen-tal relative height in case (b), which gives the ratio of molecularcharge with respect to ET(B), i.e., &i/&B. All the length scalesare in nm.
Case (a) Case (b)$hi hm,i $S,i %i (deg) $!,i $CDi $hap,i $hm,i &i/&B
B 0 0.23 0 10.4 0 0 0 0 1C -0.025(7) 0.21 -0.003 12.9 -0.003 -0.007 -0.012 -0.019 0.36A -0.012(7) 0.22 0.000 11.3 -0.003 -0.003 -0.006 -0.009 0.61A’ -0.022(7) 0.21 -0.002 11.2 -0.002 -0.003 -0.015 -0.018 0.38
totally dominated by the c! axis reconstruction of thesurface layer molecules. In this case, one interesting pointis that the tip position at the most positively chargedET(B) is highest in the unit cell. What governs the struc-tural reconstruction normal to the a-b plane in the sur-face ET layer? The ET molecule in the surface layer in-teracts with• neighboring ET molecules within the surface ET
layer, and• a neighboring I3 layer and the interior sets of ET2
+ I3 layers below the surface.It is helpful to note that the ET-ET interaction withinthe ET layer governs the band structure of the ! electronsystem, which is highly two-dimensional (2D) because ofpoor interlayer coupling by the separating anion layer.The binding energy of 2D ! electrons is su%ciently largeto keep the location of the sulfur atoms normal to thea-b plane almost unchanged even in the phase transitionfrom the CD state at RT to the CO state below 135 K.5In contrast, the Coulomb attraction toward the interiorI3 layer can be a major origin of the sizable structuralreconstruction. Thus, we focus on the second point here-after.
On the e!ects of the interior layers, it is good to sepa-rate the cases: (1) double layers comprising an ET+
2 layerand an I"3 layer and (2) one I"3 layer nearest to the sur-face ET+
2 layer. Magonov et al. have reported that theSTM or AFM tip occasionally removes surface molecules,but only as sets of ET2 and I3 molecules or layers in "-(ET)2I3, which suggests that the charge transfer from theET+
2 layers to the I"3 layers strongly bounds each other,even in surface layers.10 Since a double layer producesan electric field only inside, the interior double layers donot a!ect the surface ET layer in the first-order approx-imation, as described in Fig. 10. Thus, the I"3 layer, theinterior neighbor of the surface ET layer, would play acrucial role in the structural surface reconstruction; theelectric field of the I"3 layer attracts positively charged
6 J. Phys. Soc. Jpn. Full Paper Author Name
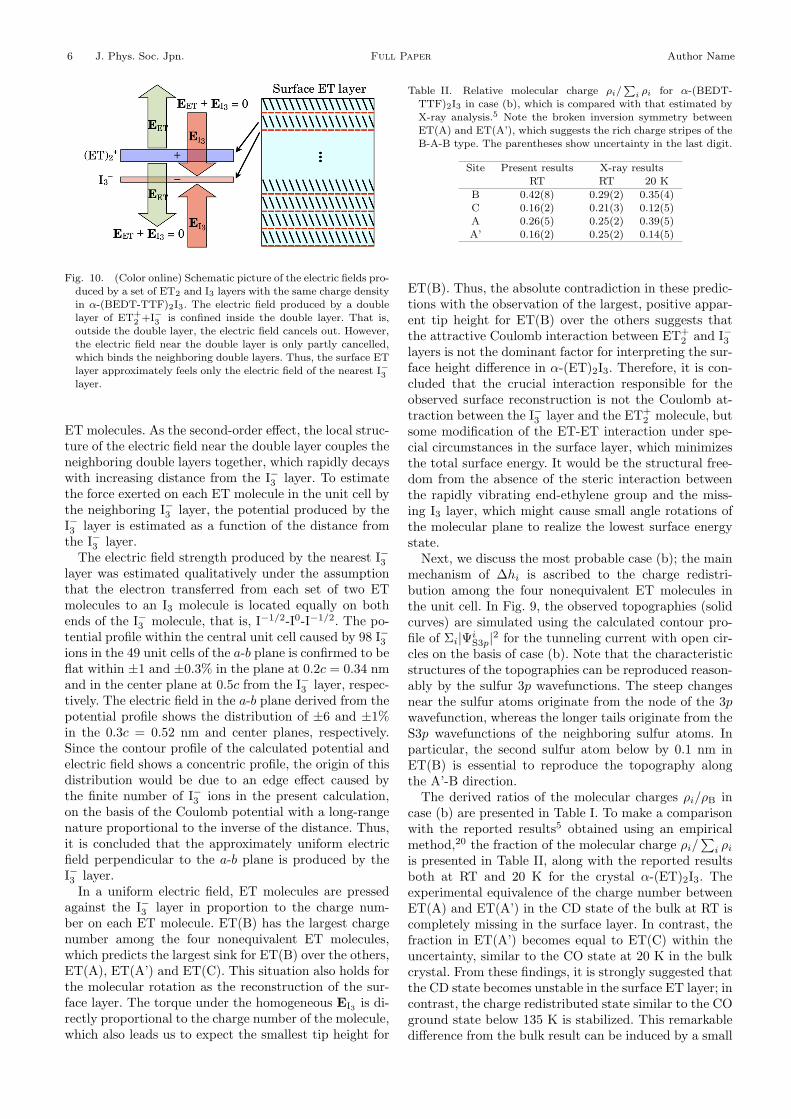
Fig. 10. (Color online) Schematic picture of the electric fields pro-duced by a set of ET2 and I3 layers with the same charge densityin !-(BEDT-TTF)2I3. The electric field produced by a doublelayer of ET+
2 +I#3 is confined inside the double layer. That is,outside the double layer, the electric field cancels out. However,the electric field near the double layer is only partly cancelled,which binds the neighboring double layers. Thus, the surface ETlayer approximately feels only the electric field of the nearest I#3layer.
ET molecules. As the second-order e!ect, the local struc-ture of the electric field near the double layer couples theneighboring double layers together, which rapidly decayswith increasing distance from the I"3 layer. To estimatethe force exerted on each ET molecule in the unit cell bythe neighboring I"3 layer, the potential produced by theI"3 layer is estimated as a function of the distance fromthe I"3 layer.
The electric field strength produced by the nearest I"3layer was estimated qualitatively under the assumptionthat the electron transferred from each set of two ETmolecules to an I3 molecule is located equally on bothends of the I"3 molecule, that is, I"1/2-I0-I"1/2. The po-tential profile within the central unit cell caused by 98 I"3ions in the 49 unit cells of the a-b plane is confirmed to beflat within ±1 and ±0.3% in the plane at 0.2c = 0.34 nmand in the center plane at 0.5c from the I"3 layer, respec-tively. The electric field in the a-b plane derived from thepotential profile shows the distribution of ±6 and ±1%in the 0.3c = 0.52 nm and center planes, respectively.Since the contour profile of the calculated potential andelectric field shows a concentric profile, the origin of thisdistribution would be due to an edge e!ect caused bythe finite number of I"3 ions in the present calculation,on the basis of the Coulomb potential with a long-rangenature proportional to the inverse of the distance. Thus,it is concluded that the approximately uniform electricfield perpendicular to the a-b plane is produced by theI"3 layer.
In a uniform electric field, ET molecules are pressedagainst the I"3 layer in proportion to the charge num-ber on each ET molecule. ET(B) has the largest chargenumber among the four nonequivalent ET molecules,which predicts the largest sink for ET(B) over the others,ET(A), ET(A’) and ET(C). This situation also holds forthe molecular rotation as the reconstruction of the sur-face layer. The torque under the homogeneous EI3 is di-rectly proportional to the charge number of the molecule,which also leads us to expect the smallest tip height for
Table II. Relative molecular charge &i/P
i &i for !-(BEDT-TTF)2I3 in case (b), which is compared with that estimated byX-ray analysis.5 Note the broken inversion symmetry betweenET(A) and ET(A’), which suggests the rich charge stripes of theB-A-B type. The parentheses show uncertainty in the last digit.
Site Present results X-ray resultsRT RT 20 K
B 0.42(8) 0.29(2) 0.35(4)C 0.16(2) 0.21(3) 0.12(5)A 0.26(5) 0.25(2) 0.39(5)A’ 0.16(2) 0.25(2) 0.14(5)
ET(B). Thus, the absolute contradiction in these predic-tions with the observation of the largest, positive appar-ent tip height for ET(B) over the others suggests thatthe attractive Coulomb interaction between ET+
2 and I"3layers is not the dominant factor for interpreting the sur-face height di!erence in "-(ET)2I3. Therefore, it is con-cluded that the crucial interaction responsible for theobserved surface reconstruction is not the Coulomb at-traction between the I"3 layer and the ET+
2 molecule, butsome modification of the ET-ET interaction under spe-cial circumstances in the surface layer, which minimizesthe total surface energy. It would be the structural free-dom from the absence of the steric interaction betweenthe rapidly vibrating end-ethylene group and the miss-ing I3 layer, which might cause small angle rotations ofthe molecular plane to realize the lowest surface energystate.
Next, we discuss the most probable case (b); the mainmechanism of "hi is ascribed to the charge redistri-bution among the four nonequivalent ET molecules inthe unit cell. In Fig. 9, the observed topographies (solidcurves) are simulated using the calculated contour pro-file of $i|#i
S3p|2 for the tunneling current with open cir-cles on the basis of case (b). Note that the characteristicstructures of the topographies can be reproduced reason-ably by the sulfur 3p wavefunctions. The steep changesnear the sulfur atoms originate from the node of the 3pwavefunction, whereas the longer tails originate from theS3p wavefunctions of the neighboring sulfur atoms. Inparticular, the second sulfur atom below by 0.1 nm inET(B) is essential to reproduce the topography alongthe A’-B direction.
The derived ratios of the molecular charges &i/&B incase (b) are presented in Table I. To make a comparisonwith the reported results5 obtained using an empiricalmethod,20 the fraction of the molecular charge &i/
)i &i
is presented in Table II, along with the reported resultsboth at RT and 20 K for the crystal "-(ET)2I3. Theexperimental equivalence of the charge number betweenET(A) and ET(A’) in the CD state of the bulk at RT iscompletely missing in the surface layer. In contrast, thefraction in ET(A’) becomes equal to ET(C) within theuncertainty, similar to the CO state at 20 K in the bulkcrystal. From these findings, it is strongly suggested thatthe CD state becomes unstable in the surface ET layer; incontrast, the charge redistributed state similar to the COground state below 135 K is stabilized. This remarkabledi!erence from the bulk result can be induced by a small
J. Phys. Soc. Jpn. Full Paper Author Name 7
angle of molecular rotation, which can strongly modifythe electronic states of the surface ET layer. Here, noteagain that the largest molecular rotation is only 0.75# inthe CD-to-CO phase transition at 135 K.5
Thus, we propose that the possible reason for thischarge redistribution in the surface ET layer is the ab-sence of the constraint interaction between the thermallyvibrating ethylene group of ET molecules and the miss-ing second I"3 neighboring layer. The ET-ET interactionwithout the constraint of the I3 molecules would real-ize the most stable ground state of the CO state in "-(ET)2I3 even at RT. The present finding suggests thatthe large-amplitude, bistable thermal vibration of ethy-lene groups interferes with the ground state molecularconformation of the ET layer at RT in the "-(ET)2I3crystals. The weakening of the thermal vibration at 135K results in the phase transition from the metallic CDstate at RT to the insulating CO state in "-(ET)2I3 crys-tals. This mechanism has something in common with theother organic layered systems with segregated structures,such as #-(ET)2PF6 and $-(ET)2RbZn(SCN)4, whichwere mentioned in §1.
4. ConclusionsWe have studied "-(ET)2I3 to directly observe the CD
state at RT with STM, and found that the electronicstates of the surface ET layer were not the CD state,but the CO state, in contrast to the bulk crystal result.5That is, the electronic states of the surface ET layer isindependent of those of the bulk crystal because of thereduced constraint by the missing surface anion layer,which should have something in common with the otherlayered organic charge transfer salts.
On the basis of the hydrogen-like 3p orbitals at the endsulfurs in each ET molecule, the observed topographiescan be reasonably reproduced with a small, but distinctdeviation from those of the bulk crystals. The two mech-anisms, i.e., (a) the structural reconstruction and (b) themolecular charge redistribution in the surface layer, wereexamined by electric field analysis, which suggests thatthe molecular charge redistribution is the unique originof the observed deviation. The estimated charge distri-bution in the surface ET layer is similar to the CO stateof bulk "-(ET)2I3 crystal below TC, but not to the CDstate of the crystals at RT, shown by the broken sym-metry between ET(A) and ET(A’) and the horizontalcharge stripe of the B-A-B type, which are induced bythe lack of constraint interaction layer. This understand-
ing suggests that the phase transition at 135 K fromthe metallic CD state to the insulating CO state in the"-(ET)2I3 crystals is partly driven by the termination ofthe thermal bistable vibration in the end ethylene groupsof ET molecules. This conclusion would provide impor-tant information to further advance the research on theelectronic states of strongly correlated organic crystals.
Acknowledgments
One of the authors (KM) would like to express hissincere thanks to Professor Sawa for valuable data anddiscussions, and Dr. Shimoi and Dr. Iwano for helpfuldiscussions. This work was partly supported by MEXTKAKENHI in Priority Area (17067015) and by JSPSKAKENHI (C) (22540371).
1) N. Tajima, M. Tamura, Y. Nishio, K. Kajita, and Y. Iye: J.Phys. Soc. Jpn 69 (2000) 543.
2) N. Tajima and K. Kajita: Sci. Technol. Adv. Mater. 10 (2009)024308.
3) A. Kobayashi, S. Katayama, and Y. Suzumura: Sci. Technol.Adv. Mater. 10 (2009) 024309.
4) G.Li, A.Luican, and E.Y.Andrei: Phys.Rev.Lett.102 (2009)176804.
5) T. Kakiuchi, Y. Wakabayashi, H. Sawa, T. Takahashi, and T.Nakamura: J. Phys. Soc. Jpn 76 (2007) 113702.
6) H. Sawa: private communication.7) T. Kawai and A. Kawamoto: J. Phys. Soc. Jpn 78 (2009)
074711.8) R. Wojciechowski, K. Yamamoto, K. Yakushi, and A.
Kawamoto: Synth. Met. 135-136 (2003) 587.9) H. Seo: J. Phys. Soc. Jpn 69 (2000) 805.
10) S. N. Magonov, G. Bar, and H.-J. Cantow: Synth. Met. 62(1994) 83.
11) M. Yoshimura, H. Shigekawa, H. Yamochi, G. Saito, Y. Saito,and A. Kawazu: Phys. Rev. B 44 (1991) 1970.
12) M. Ishida, T. Mori, and H. Shigekawa: Phys. Rev. Lett. 83(1999) 596.
13) M. Ishida, O. Takeuchi, T. Mori, and H. Shigekawa: Jpn. J.Appl. Phys. 39 (2000) 3823.
14) Y. Nogami and T. Mori: J. Phys. IV France 12 (2002) 233.15) N. Yoneyama, T. Sasaki, T. Nishizaki, A. M. Troyanovskiy,
and N. Kobayashi: J. Low Temp. Phys. 142 (2006) 159.16) H. Mori, S. Tanaka, and T. Mori: Phys. Rev. B 57 (1998)
12023.17) K. Bender, I. Hennig, D. Schweitzer, K. Dietz, H. Endres, and
H. J. Keller: Mol. Cryst. Liq. Cryst. 108 (1984) 359.18) E. Clementi and D. L. Raimondi: J. Chem. Phys. 38 (1963)
2686.19) J. Terso! and D. R. Hamann: Phys. Rev. Lett 50 (1983) 1998.20) P. Guionneau, C. J. Kepert, G. Bravic, D. Chasseau, M. R.
Truter, M. Kurmoo, and P. Day: Synth. Met. 86 (1997) 1973.
![Condensed Matter Theory Laboratory, arXiv:1408.3162v3 ... · arXiv:1408.3162v3 [cond-mat.str-el] 7 Jul 2015 First-principles study of hydrogen-bonded molecular conductor κ-H3(Cat-EDT-TTF/ST)2](https://static.fdocument.org/doc/165x107/5f9042bb89a5b510dd02deb3/condensed-matter-theory-laboratory-arxiv14083162v3-arxiv14083162v3-cond-matstr-el.jpg)