CHARACTERIZATION OF α-CYCLODEXTRIN INCLUSION …
62
CHARACTERIZATION OF α-CYCLODEXTRIN INCLUSION COMPLEXES WITH TRANS-CINNAMIC ACID IN AN ACID-BASED BEVERAGE SYSTEM Dina L. Romano Thesis submitted to the faculty of the Virginia Polytechnic Institute and State University in partial fulfillment of the requirements for the degree of Master of Science In Food Science & Technology Dr. Joseph E. Marcy, Chairman Dr. Joe Eifert Dr. Robert C. Williams April 11, 2008 Blacksburg, VA Keywords: cinnamic acid, α-cyclodextrin, preservative, inclusion complex, solubility, antimicrobial Copyright 2008, Dina L. Romano
Transcript of CHARACTERIZATION OF α-CYCLODEXTRIN INCLUSION …
CHARACTERIZATION OF α-CYCLODEXTRIN INCLUSION COMPLEXES WITH TRANS-CINNAMIC ACID IN AN ACID-BASED BEVERAGE SYSTEM
Dina L. Romano
Thesis submitted to the faculty of the Virginia Polytechnic Institute and State University in partial fulfillment of the requirements for the degree of
Master of Science In
Food Science & Technology
Dr. Joseph E. Marcy, Chairman
Dr. Joe Eifert
Dr. Robert C. Williams
April 11, 2008 Blacksburg, VA
Keywords: cinnamic acid, α-cyclodextrin, preservative, inclusion complex, solubility, antimicrobial
Copyright 2008, Dina L. Romano
CHARACTERIZATION OF α-CYCLODEXTRIN INCLUSION COMPLEXES WITH TRANS-CINNAMIC ACID IN AN ACID-BASED BEVERAGE SYSTEM
Dina L. Romano
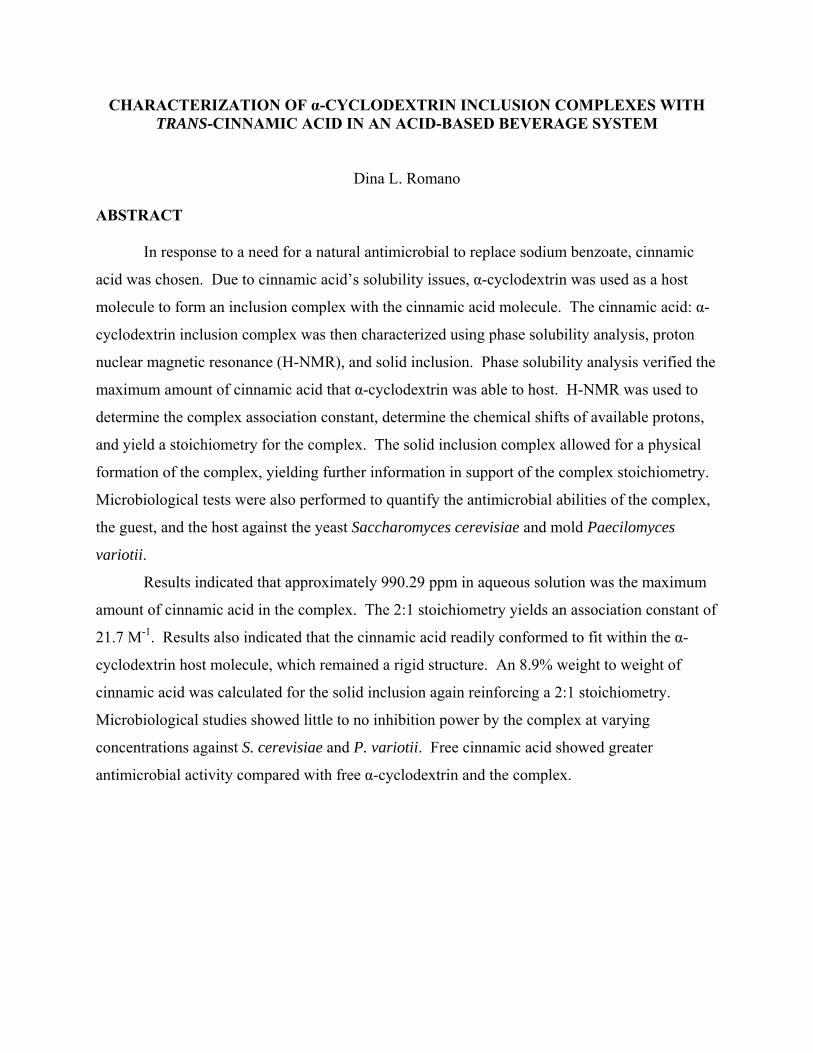
ABSTRACT In response to a need for a natural antimicrobial to replace sodium benzoate, cinnamic
acid was chosen. Due to cinnamic acid’s solubility issues, α-cyclodextrin was used as a host
molecule to form an inclusion complex with the cinnamic acid molecule. The cinnamic acid: α-
cyclodextrin inclusion complex was then characterized using phase solubility analysis, proton
nuclear magnetic resonance (H-NMR), and solid inclusion. Phase solubility analysis verified the
maximum amount of cinnamic acid that α-cyclodextrin was able to host. H-NMR was used to
determine the complex association constant, determine the chemical shifts of available protons,
and yield a stoichiometry for the complex. The solid inclusion complex allowed for a physical
formation of the complex, yielding further information in support of the complex stoichiometry.
Microbiological tests were also performed to quantify the antimicrobial abilities of the complex,
the guest, and the host against the yeast Saccharomyces cerevisiae and mold Paecilomyces
variotii.
Results indicated that approximately 990.29 ppm in aqueous solution was the maximum
amount of cinnamic acid in the complex. The 2:1 stoichiometry yields an association constant of
21.7 M-1. Results also indicated that the cinnamic acid readily conformed to fit within the α-
cyclodextrin host molecule, which remained a rigid structure. An 8.9% weight to weight of
cinnamic acid was calculated for the solid inclusion again reinforcing a 2:1 stoichiometry.
Microbiological studies showed little to no inhibition power by the complex at varying
concentrations against S. cerevisiae and P. variotii. Free cinnamic acid showed greater
antimicrobial activity compared with free α-cyclodextrin and the complex.

ACKNOWLEDGEMENTS
I would first and foremost like to thank Dr. Joseph E. Marcy for his help and guidance
throughout this entire project. From first handing me the project details to guiding me through
procedures and ways of deeper thinking, I cannot thank him enough. I would also like to thank
Dr. Joe Eifert for his ability to keep me down to earth and on schedule as well as his gift of grant
funding and work on my committee. Thanks to Dr. Williams for his work on my committee and
his lightheartedness and optimism throughout the entire process. It has been a pleasure working
closely with all three of these professors.
Thanks to all of the staff who provided their support, guidance, problem solving skills,
and precious time including especially Joell Eifert, Harriet Williams, Trina Pauley, Geoff Knobl,
and Joe Boling. Thanks to my office mates Kevin Holland and Rebecca Baker for their help in
times of questioning as well as their unending humor and friendship that it made it easy to come
in every morning, if only for their company. Thanks to Vy Truong for her help, guidance, and
information sharing, to Shelley Hogan for her help and patience with the freeze drier, and to
Giuseppe Toia for his help calculating my association constant. A very special thank you to
John Koontz, who without his help, this project would not have been possible. His guidance
through every step of the way, his patience with my questions, and his friendship will always be
held dear.
A very sweet thank you to my entire family: my mother who always pushed me to
challenge myself and to do my best and always wished for me to be a scientist; my father for his
constant support, praise, and love and all the time spent watching Virginia Tech football with
me; my sister Devon and brother Jared for their support and friendship; Matthew Price for his
love and urging to continue to make it work, as he is the person to motivate me to become a
better person.
I would finally like to thank Richard Smith and Pepsi Co. for funding and guidance
throughout the entire process of my work.
iii
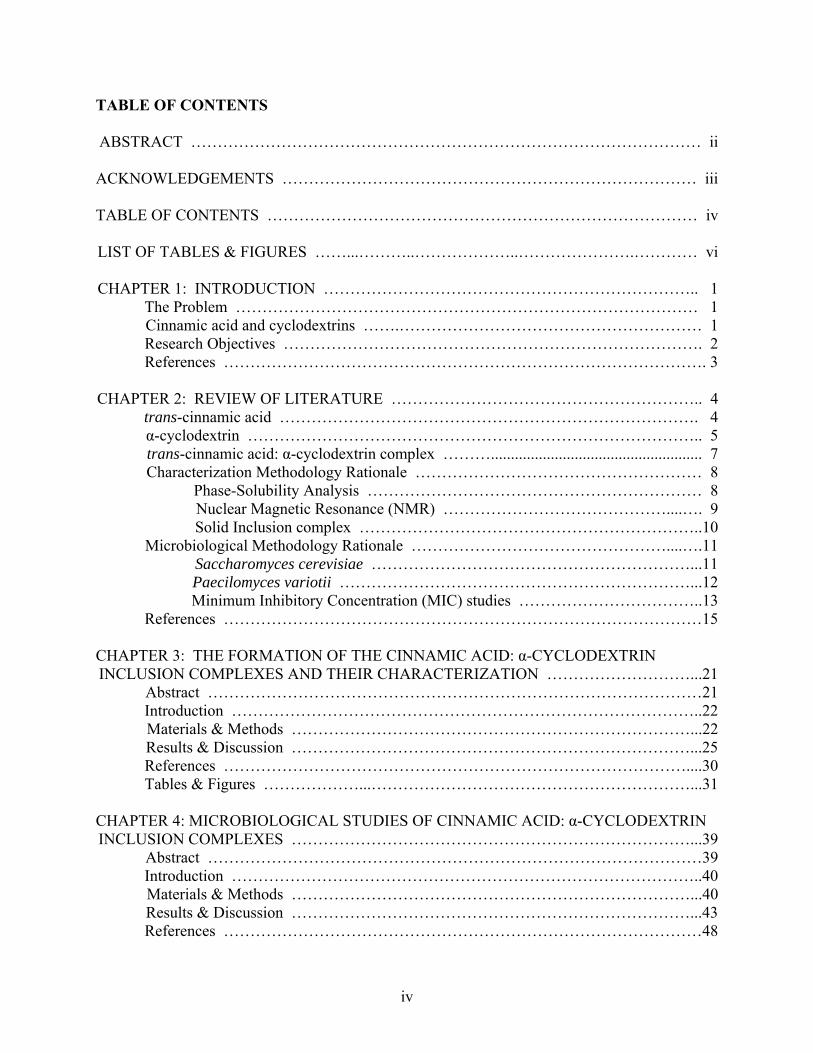
TABLE OF CONTENTS ABSTRACT …………………………………………………………………………………… ii
ACKNOWLEDGEMENTS …………………………………………………………………… iii
TABLE OF CONTENTS ……………………………………………………………………… iv
LIST OF TABLES & FIGURES ……...………..………………..………………….………… vi CHAPTER 1: INTRODUCTION …………………………………………………………….. 1 The Problem …………………………………………………………………………… 1 Cinnamic acid and cyclodextrins …….………………………………………………… 1 Research Objectives ……………………………………………………………………. 2 References ………………………………………………………………………………. 3
CHAPTER 2: REVIEW OF LITERATURE ………………………………………………….. 4 trans-cinnamic acid ……………………………………………………………………. 4 α-cyclodextrin ………………………………………………………………………….. 5 trans-cinnamic acid: α-cyclodextrin complex ………..................................................... 7 Characterization Methodology Rationale ……………………………………………… 8 Phase-Solubility Analysis ……………………………………………………… 8 Nuclear Magnetic Resonance (NMR) ……………………………………....…. 9 Solid Inclusion complex ………………………………………………………..10 Microbiological Methodology Rationale …………………………………………....….11 Saccharomyces cerevisiae ……………………………………………………...11 Paecilomyces variotii …………………………………………………………...12 Minimum Inhibitory Concentration (MIC) studies ……………………………..13 References ………………………………………………………………………………15 CHAPTER 3: THE FORMATION OF THE CINNAMIC ACID: α-CYCLODEXTRIN INCLUSION COMPLEXES AND THEIR CHARACTERIZATION ………………………...21 Abstract …………………………………………………………………………………21 Introduction ……………………………………………………………………………..22 Materials & Methods …………………………………………………………………...22 Results & Discussion …………………………………………………………………...25 References ……………………………………………………………………………....30 Tables & Figures ………………...……………………………………………………...31
CHAPTER 4: MICROBIOLOGICAL STUDIES OF CINNAMIC ACID: α-CYCLODEXTRIN INCLUSION COMPLEXES …………………………………………………………………...39 Abstract …………………………………………………………………………………39 Introduction ……………………………………………………………………………..40 Materials & Methods …………………………………………………………………...40 Results & Discussion …………………………………………………………………...43 References ………………………………………………………………………………48
iv

Tables & Figures …………...…………………………………………………………...49
v
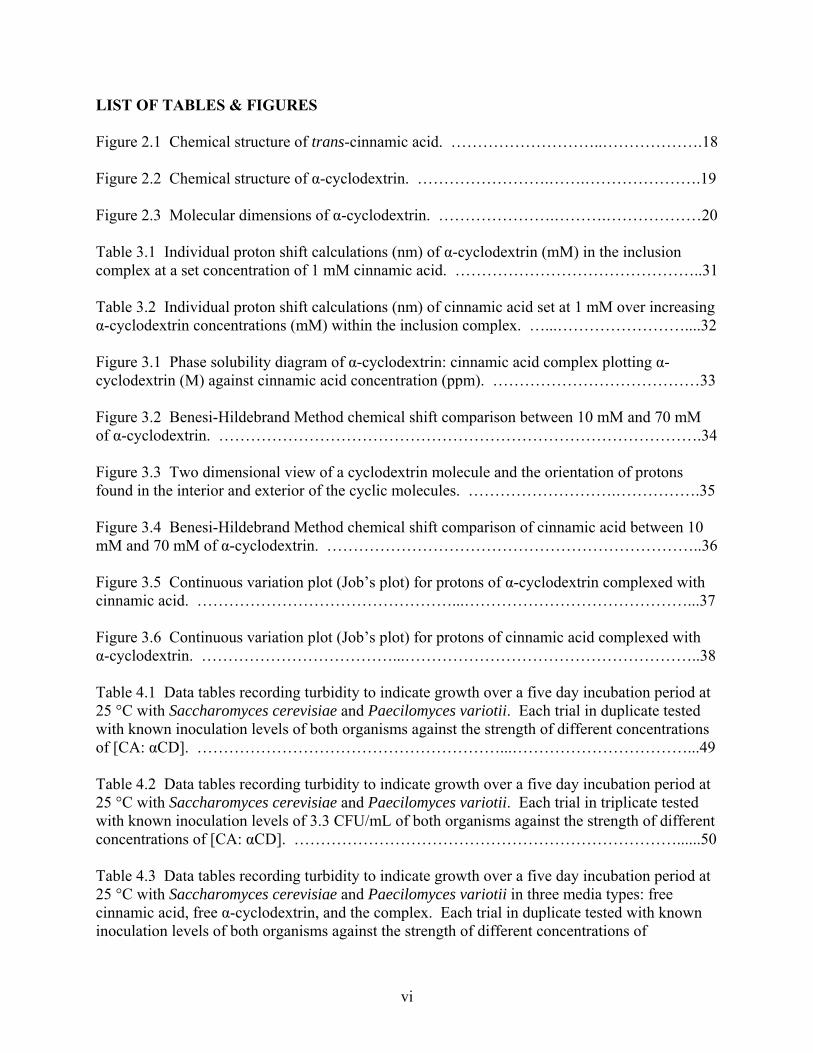
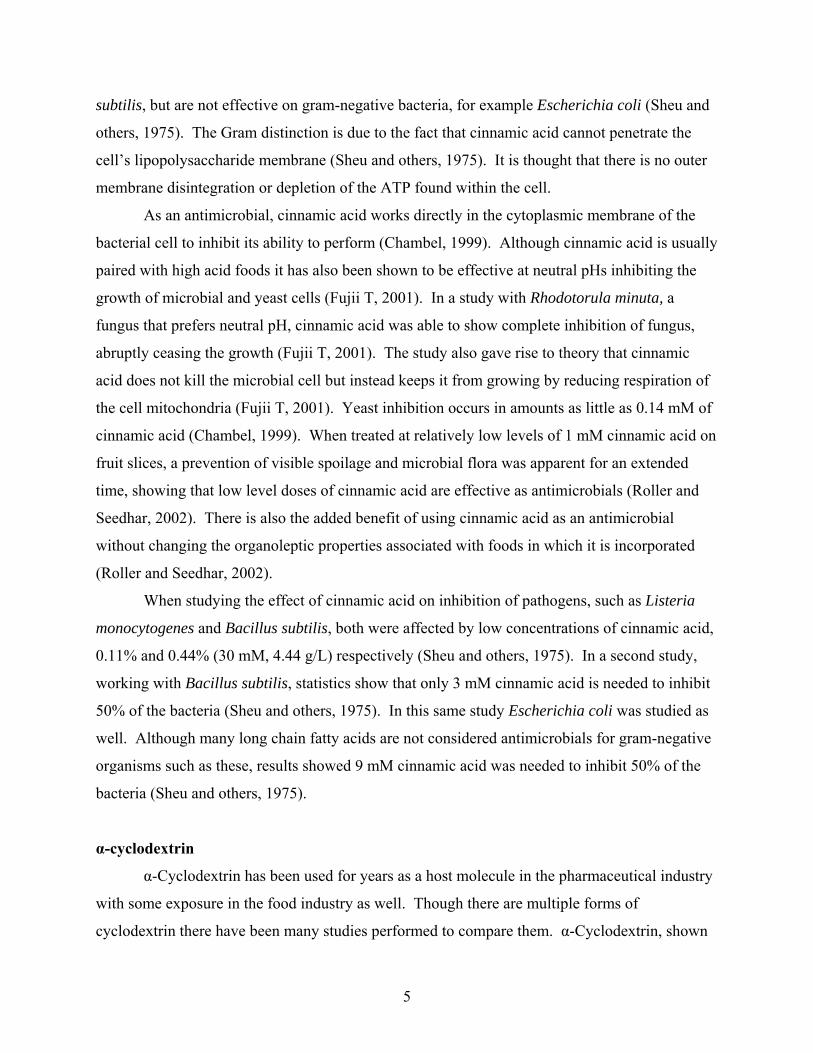
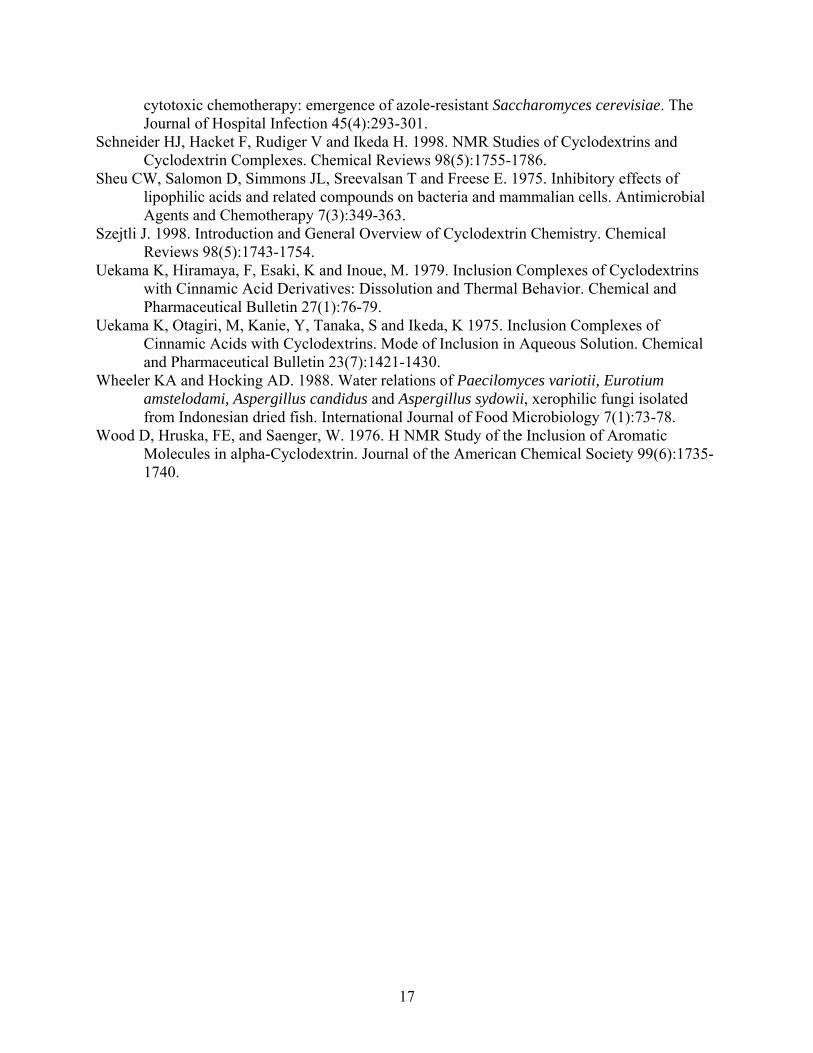
LIST OF TABLES & FIGURES Figure 2.1 Chemical structure of trans-cinnamic acid. ………………………..……………….18
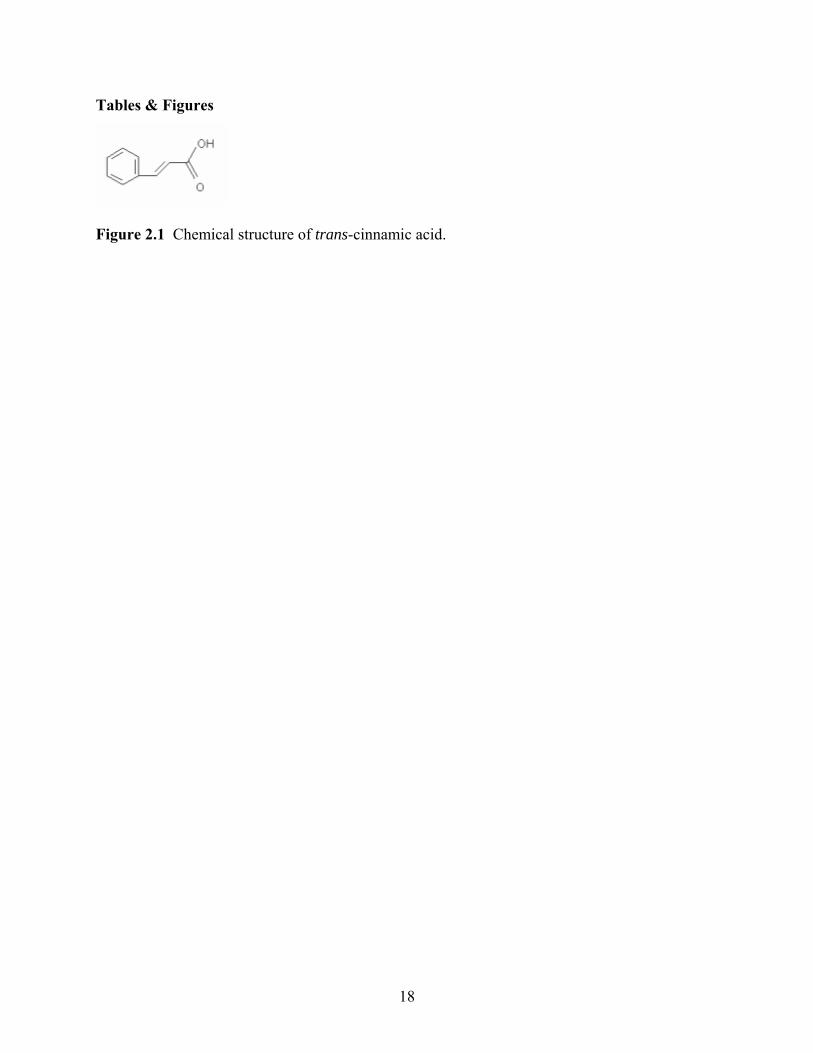
Figure 2.2 Chemical structure of α-cyclodextrin. …………………….…….………………….19
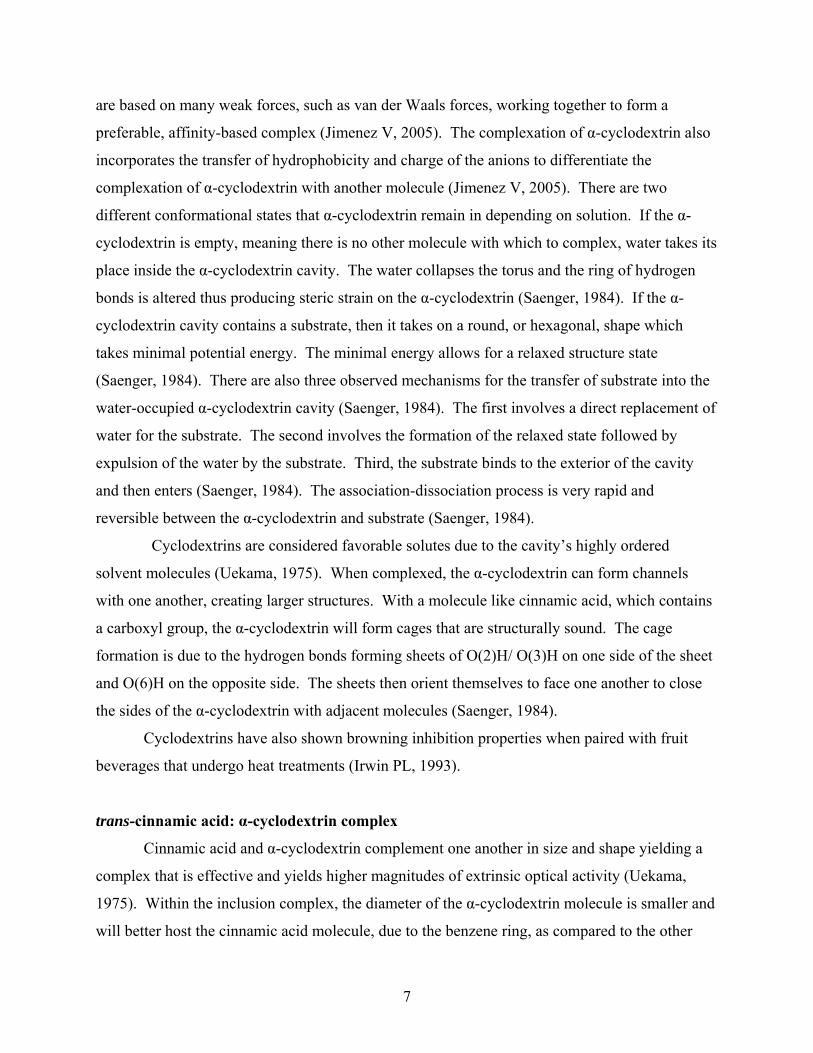
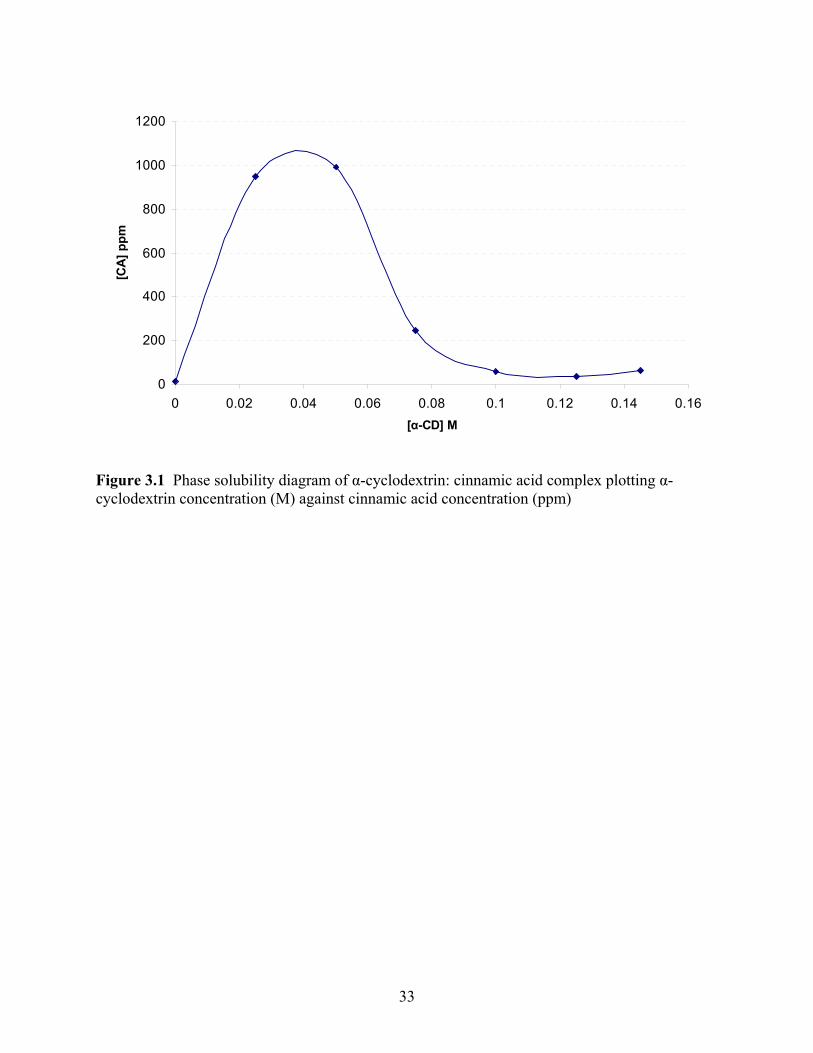
Figure 2.3 Molecular dimensions of α-cyclodextrin. ………………….……….………………20 Table 3.1 Individual proton shift calculations (nm) of α-cyclodextrin (mM) in the inclusion complex at a set concentration of 1 mM cinnamic acid. ………………………………………..31 Table 3.2 Individual proton shift calculations (nm) of cinnamic acid set at 1 mM over increasing α-cyclodextrin concentrations (mM) within the inclusion complex. …...……………………....32 Figure 3.1 Phase solubility diagram of α-cyclodextrin: cinnamic acid complex plotting α-cyclodextrin (M) against cinnamic acid concentration (ppm). …………………………………33 Figure 3.2 Benesi-Hildebrand Method chemical shift comparison between 10 mM and 70 mM of α-cyclodextrin. ……………………………………………………………………………….34 Figure 3.3 Two dimensional view of a cyclodextrin molecule and the orientation of protons found in the interior and exterior of the cyclic molecules. ……………………….…………….35 Figure 3.4 Benesi-Hildebrand Method chemical shift comparison of cinnamic acid between 10 mM and 70 mM of α-cyclodextrin. ……………………………………………………………..36 Figure 3.5 Continuous variation plot (Job’s plot) for protons of α-cyclodextrin complexed with cinnamic acid. …………………………………………...……………………………………...37 Figure 3.6 Continuous variation plot (Job’s plot) for protons of cinnamic acid complexed with α-cyclodextrin. ………………………………...………………………………………………..38 Table 4.1 Data tables recording turbidity to indicate growth over a five day incubation period at 25 °C with Saccharomyces cerevisiae and Paecilomyces variotii. Each trial in duplicate tested with known inoculation levels of both organisms against the strength of different concentrations of [CA: αCD]. …………………………………………………...……………………………...49
Table 4.2 Data tables recording turbidity to indicate growth over a five day incubation period at 25 °C with Saccharomyces cerevisiae and Paecilomyces variotii. Each trial in triplicate tested with known inoculation levels of 3.3 CFU/mL of both organisms against the strength of different concentrations of [CA: αCD]. ………………………………………………………………......50 Table 4.3 Data tables recording turbidity to indicate growth over a five day incubation period at 25 °C with Saccharomyces cerevisiae and Paecilomyces variotii in three media types: free cinnamic acid, free α-cyclodextrin, and the complex. Each trial in duplicate tested with known inoculation levels of both organisms against the strength of different concentrations of
vi
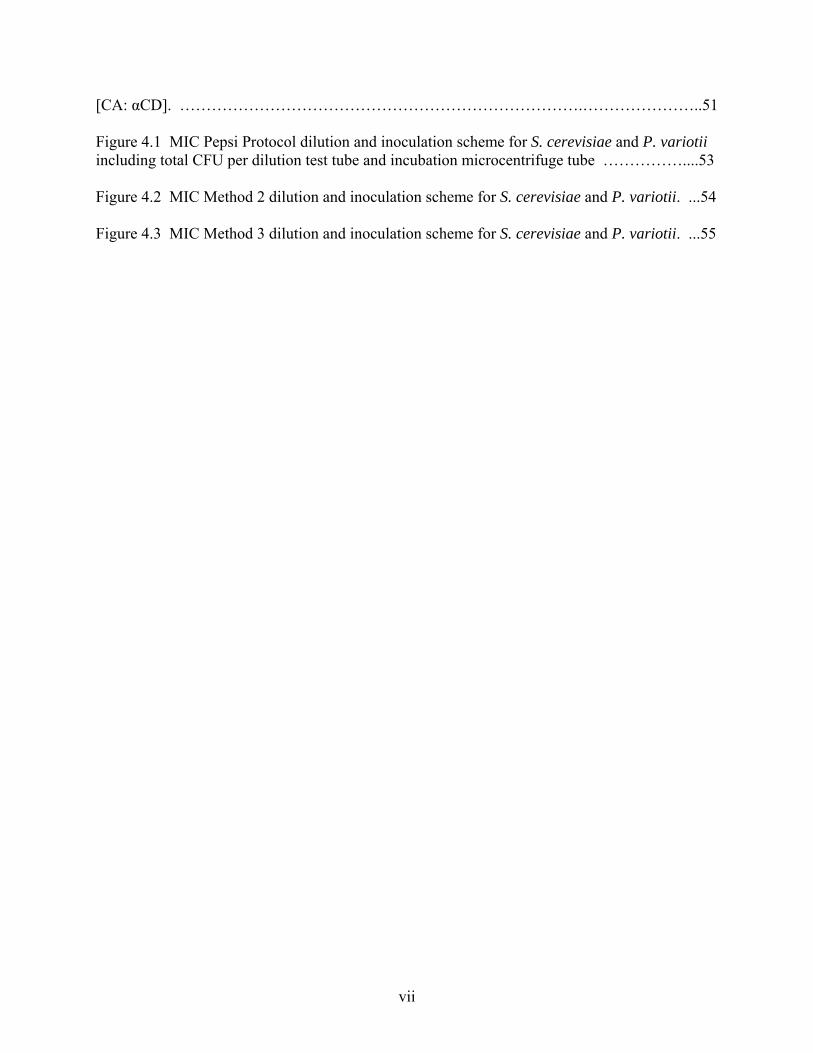
[CA: αCD]. ………………………………………………………………….…………………..51 Figure 4.1 MIC Pepsi Protocol dilution and inoculation scheme for S. cerevisiae and P. variotii including total CFU per dilution test tube and incubation microcentrifuge tube ……………....53 Figure 4.2 MIC Method 2 dilution and inoculation scheme for S. cerevisiae and P. variotii. ...54
Figure 4.3 MIC Method 3 dilution and inoculation scheme for S. cerevisiae and P. variotii. ...55
vii
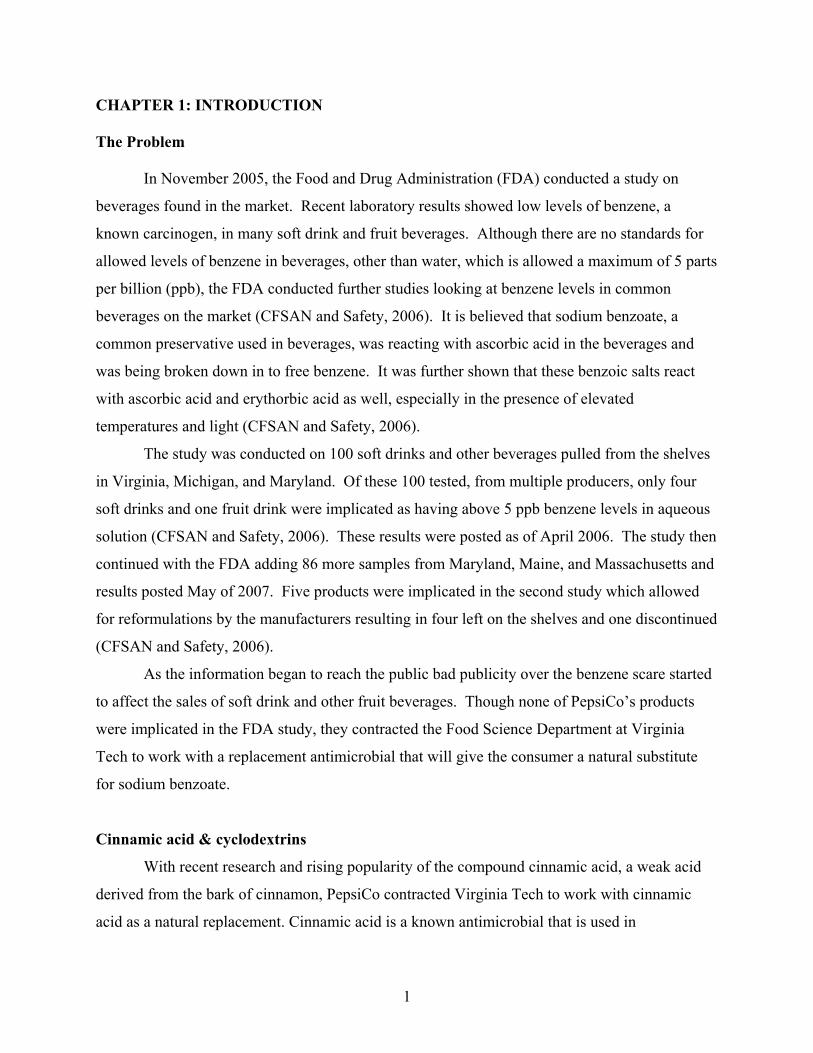
CHAPTER 1: INTRODUCTION The Problem In November 2005, the Food and Drug Administration (FDA) conducted a study on
beverages found in the market. Recent laboratory results showed low levels of benzene, a
known carcinogen, in many soft drink and fruit beverages. Although there are no standards for
allowed levels of benzene in beverages, other than water, which is allowed a maximum of 5 parts
per billion (ppb), the FDA conducted further studies looking at benzene levels in common
beverages on the market (CFSAN and Safety, 2006). It is believed that sodium benzoate, a
common preservative used in beverages, was reacting with ascorbic acid in the beverages and
was being broken down in to free benzene. It was further shown that these benzoic salts react
with ascorbic acid and erythorbic acid as well, especially in the presence of elevated
temperatures and light (CFSAN and Safety, 2006).
The study was conducted on 100 soft drinks and other beverages pulled from the shelves
in Virginia, Michigan, and Maryland. Of these 100 tested, from multiple producers, only four
soft drinks and one fruit drink were implicated as having above 5 ppb benzene levels in aqueous
solution (CFSAN and Safety, 2006). These results were posted as of April 2006. The study then
continued with the FDA adding 86 more samples from Maryland, Maine, and Massachusetts and
results posted May of 2007. Five products were implicated in the second study which allowed
for reformulations by the manufacturers resulting in four left on the shelves and one discontinued
(CFSAN and Safety, 2006).
As the information began to reach the public bad publicity over the benzene scare started
to affect the sales of soft drink and other fruit beverages. Though none of PepsiCo’s products
were implicated in the FDA study, they contracted the Food Science Department at Virginia
Tech to work with a replacement antimicrobial that will give the consumer a natural substitute
for sodium benzoate.
Cinnamic acid & cyclodextrins
With recent research and rising popularity of the compound cinnamic acid, a weak acid
derived from the bark of cinnamon, PepsiCo contracted Virginia Tech to work with cinnamic
acid as a natural replacement. Cinnamic acid is a known antimicrobial that is used in
1
pharmaceuticals and cosmetics in the market already (Hoskins, 1984). Although cinnamic acid
has shown great stride as an antimicrobial its poor solubility and wettability have caused
problems in its incorporation in to aqueous solutions. When placed in an aqueous solution the
cinnamic acid tends to clump and stay clumped. With a solubility of only 0.5 grams per liter,
cinnamic acid takes a good amount of time or good amount of solvent to solubilize the
compound (Hoskins, 1984). To overcome the solubility problem, an inclusion complex is
theorized using cyclodextrins as the host molecule.
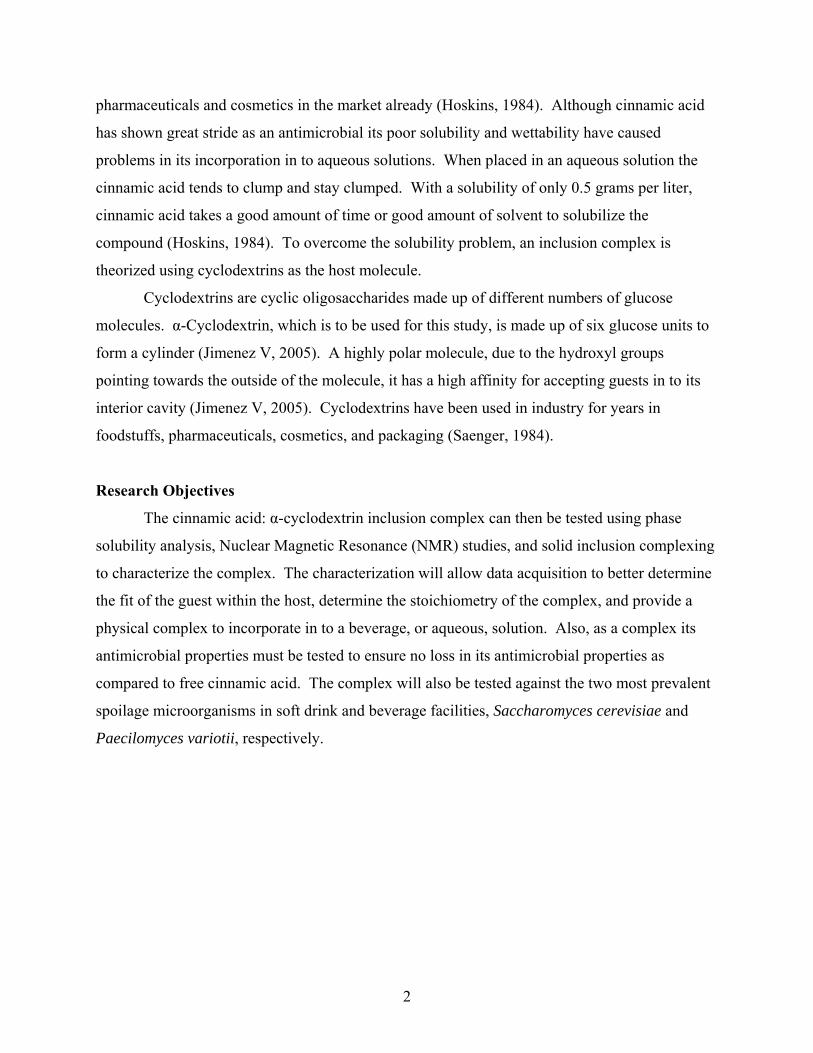
Cyclodextrins are cyclic oligosaccharides made up of different numbers of glucose
molecules. α-Cyclodextrin, which is to be used for this study, is made up of six glucose units to
form a cylinder (Jimenez V, 2005). A highly polar molecule, due to the hydroxyl groups
pointing towards the outside of the molecule, it has a high affinity for accepting guests in to its
interior cavity (Jimenez V, 2005). Cyclodextrins have been used in industry for years in
foodstuffs, pharmaceuticals, cosmetics, and packaging (Saenger, 1984).
Research Objectives
The cinnamic acid: α-cyclodextrin inclusion complex can then be tested using phase
solubility analysis, Nuclear Magnetic Resonance (NMR) studies, and solid inclusion complexing
to characterize the complex. The characterization will allow data acquisition to better determine
the fit of the guest within the host, determine the stoichiometry of the complex, and provide a
physical complex to incorporate in to a beverage, or aqueous, solution. Also, as a complex its
antimicrobial properties must be tested to ensure no loss in its antimicrobial properties as
compared to free cinnamic acid. The complex will also be tested against the two most prevalent
spoilage microorganisms in soft drink and beverage facilities, Saccharomyces cerevisiae and
Paecilomyces variotii, respectively.
2
References
FDA. 2006. Data on Benzene in Soft Drinks and Other Beverages. Office of Food Additive Safety, CFSAN, Food and Drug Administration. Received October 2007 from http://www.cfsan.fda.gov/~dms/benzdata.html.
Hoskins JA. 1984. The occurrence, metabolism and toxicity of cinnamic acid and related compounds. J Appl Toxicol 4(6):283-292.
Jimenez V AJ. 2005. The role of charge transfer interactions in the inclusion complexation of anionic guests with alpha-cyclodextrin. Tetrahedron 61:5449-5456.
Saenger W. 1984. Structural Aspects of Cyclodextrins and their Inclusion Complexes. Inclusion Compounds 2. London: Academic Press. p. 231-259.
3
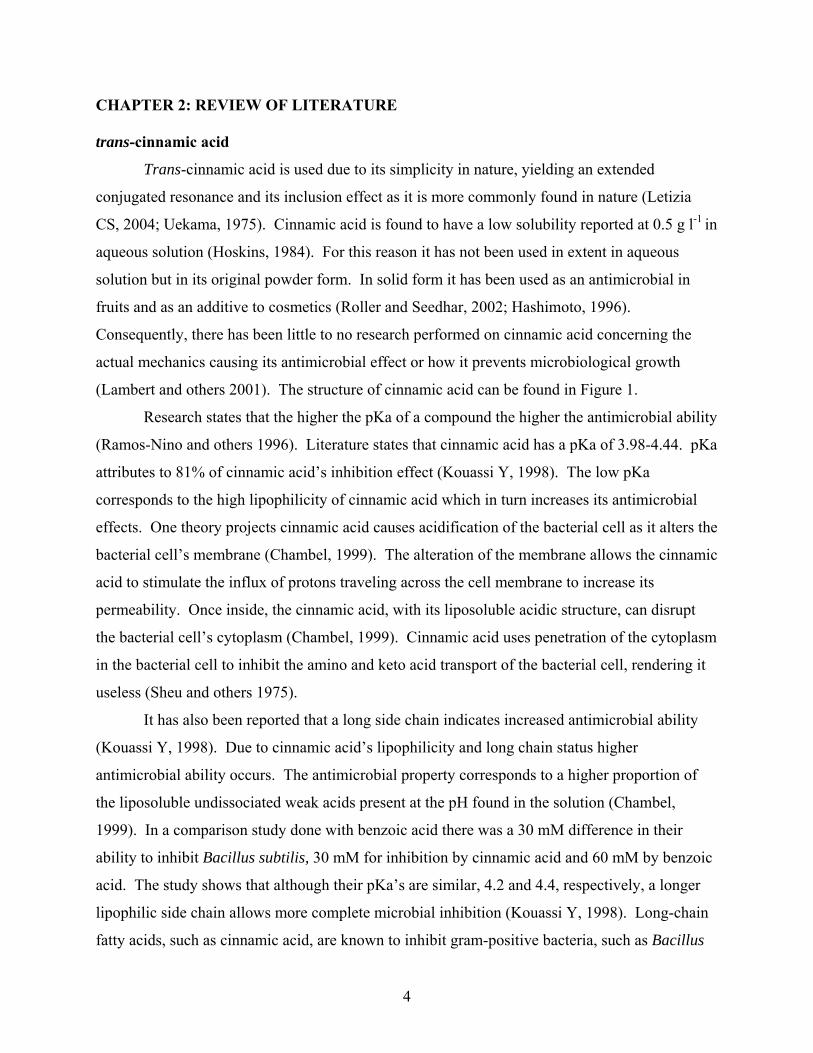
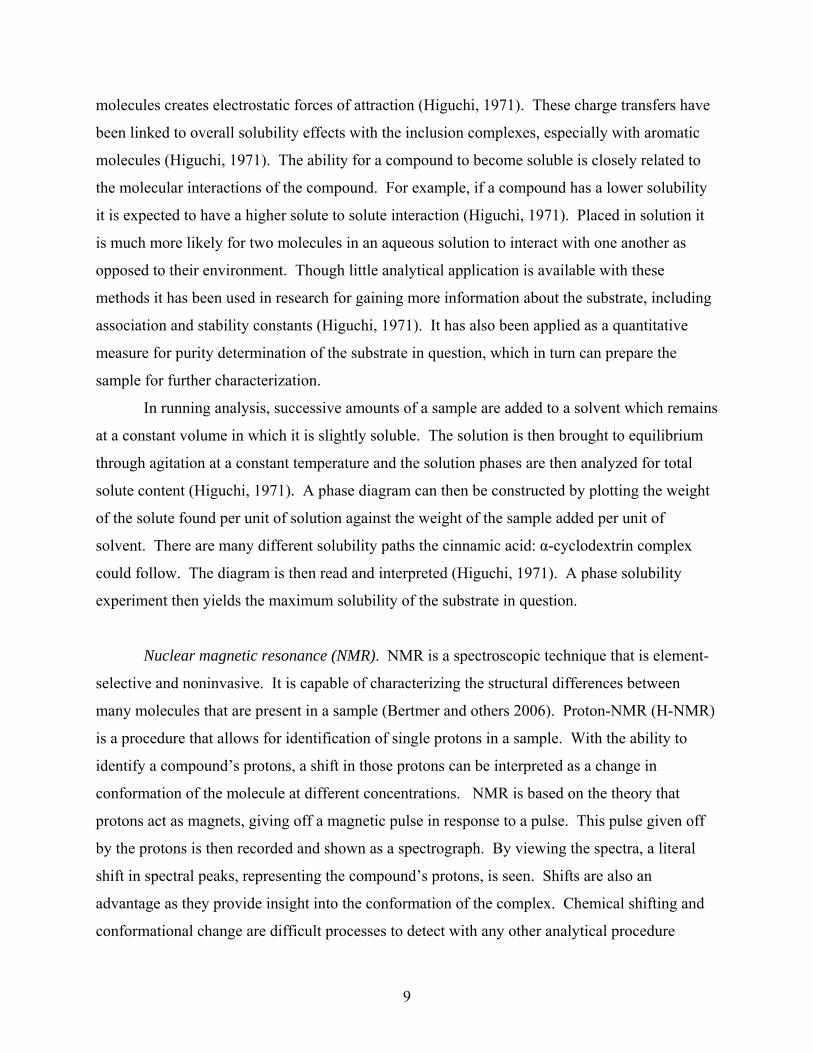
CHAPTER 2: REVIEW OF LITERATURE trans-cinnamic acid
Trans-cinnamic acid is used due to its simplicity in nature, yielding an extended
conjugated resonance and its inclusion effect as it is more commonly found in nature (Letizia
CS, 2004; Uekama, 1975). Cinnamic acid is found to have a low solubility reported at 0.5 g l-1 in
aqueous solution (Hoskins, 1984). For this reason it has not been used in extent in aqueous
solution but in its original powder form. In solid form it has been used as an antimicrobial in
fruits and as an additive to cosmetics (Roller and Seedhar, 2002; Hashimoto, 1996).
Consequently, there has been little to no research performed on cinnamic acid concerning the
actual mechanics causing its antimicrobial effect or how it prevents microbiological growth
(Lambert and others 2001). The structure of cinnamic acid can be found in Figure 1.
Research states that the higher the pKa of a compound the higher the antimicrobial ability
(Ramos-Nino and others 1996). Literature states that cinnamic acid has a pKa of 3.98-4.44. pKa
attributes to 81% of cinnamic acid’s inhibition effect (Kouassi Y, 1998). The low pKa
corresponds to the high lipophilicity of cinnamic acid which in turn increases its antimicrobial
effects. One theory projects cinnamic acid causes acidification of the bacterial cell as it alters the
bacterial cell’s membrane (Chambel, 1999). The alteration of the membrane allows the cinnamic
acid to stimulate the influx of protons traveling across the cell membrane to increase its
permeability. Once inside, the cinnamic acid, with its liposoluble acidic structure, can disrupt
the bacterial cell’s cytoplasm (Chambel, 1999). Cinnamic acid uses penetration of the cytoplasm
in the bacterial cell to inhibit the amino and keto acid transport of the bacterial cell, rendering it
useless (Sheu and others 1975).
It has also been reported that a long side chain indicates increased antimicrobial ability
(Kouassi Y, 1998). Due to cinnamic acid’s lipophilicity and long chain status higher
antimicrobial ability occurs. The antimicrobial property corresponds to a higher proportion of
the liposoluble undissociated weak acids present at the pH found in the solution (Chambel,
1999). In a comparison study done with benzoic acid there was a 30 mM difference in their
ability to inhibit Bacillus subtilis, 30 mM for inhibition by cinnamic acid and 60 mM by benzoic
acid. The study shows that although their pKa’s are similar, 4.2 and 4.4, respectively, a longer
lipophilic side chain allows more complete microbial inhibition (Kouassi Y, 1998). Long-chain
fatty acids, such as cinnamic acid, are known to inhibit gram-positive bacteria, such as Bacillus
4
subtilis, but are not effective on gram-negative bacteria, for example Escherichia coli (Sheu and
others, 1975). The Gram distinction is due to the fact that cinnamic acid cannot penetrate the
cell’s lipopolysaccharide membrane (Sheu and others, 1975). It is thought that there is no outer
membrane disintegration or depletion of the ATP found within the cell.
As an antimicrobial, cinnamic acid works directly in the cytoplasmic membrane of the
bacterial cell to inhibit its ability to perform (Chambel, 1999). Although cinnamic acid is usually
paired with high acid foods it has also been shown to be effective at neutral pHs inhibiting the
growth of microbial and yeast cells (Fujii T, 2001). In a study with Rhodotorula minuta, a
fungus that prefers neutral pH, cinnamic acid was able to show complete inhibition of fungus,
abruptly ceasing the growth (Fujii T, 2001). The study also gave rise to theory that cinnamic
acid does not kill the microbial cell but instead keeps it from growing by reducing respiration of
the cell mitochondria (Fujii T, 2001). Yeast inhibition occurs in amounts as little as 0.14 mM of
cinnamic acid (Chambel, 1999). When treated at relatively low levels of 1 mM cinnamic acid on
fruit slices, a prevention of visible spoilage and microbial flora was apparent for an extended
time, showing that low level doses of cinnamic acid are effective as antimicrobials (Roller and
Seedhar, 2002). There is also the added benefit of using cinnamic acid as an antimicrobial
without changing the organoleptic properties associated with foods in which it is incorporated
(Roller and Seedhar, 2002).
When studying the effect of cinnamic acid on inhibition of pathogens, such as Listeria
monocytogenes and Bacillus subtilis, both were affected by low concentrations of cinnamic acid,
0.11% and 0.44% (30 mM, 4.44 g/L) respectively (Sheu and others, 1975). In a second study,
working with Bacillus subtilis, statistics show that only 3 mM cinnamic acid is needed to inhibit
50% of the bacteria (Sheu and others, 1975). In this same study Escherichia coli was studied as
well. Although many long chain fatty acids are not considered antimicrobials for gram-negative
organisms such as these, results showed 9 mM cinnamic acid was needed to inhibit 50% of the
bacteria (Sheu and others, 1975).
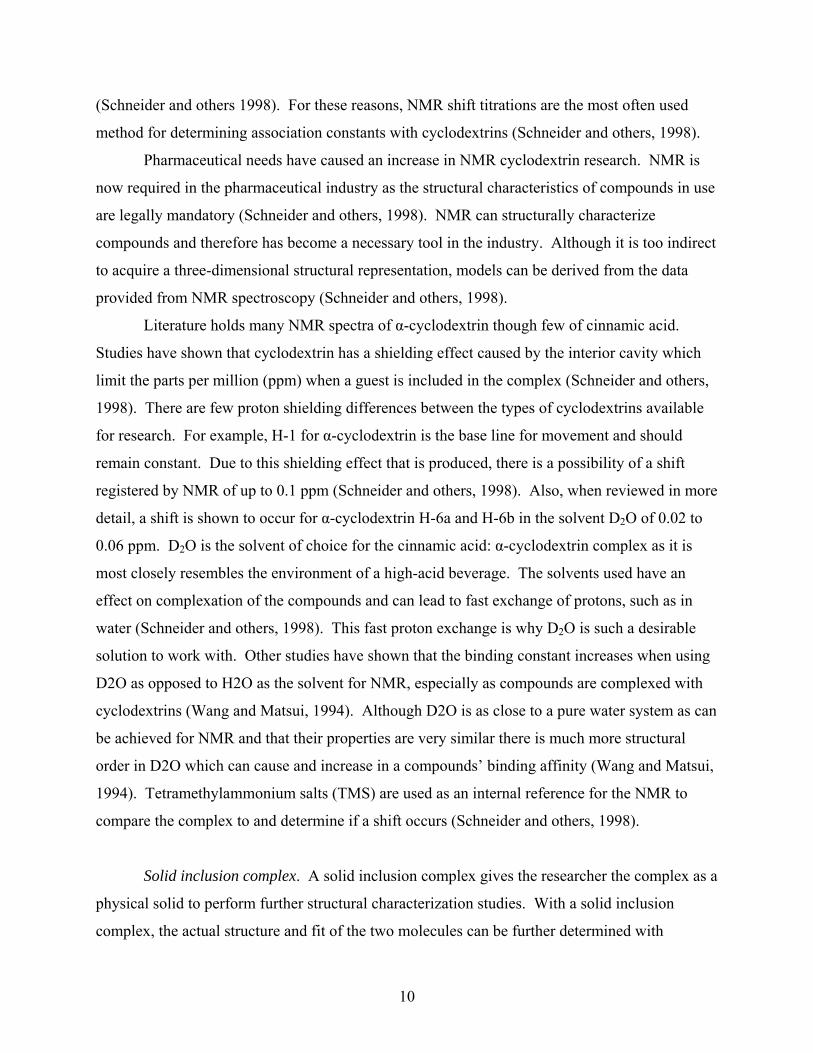
α-cyclodextrin
α-Cyclodextrin has been used for years as a host molecule in the pharmaceutical industry
with some exposure in the food industry as well. Though there are multiple forms of
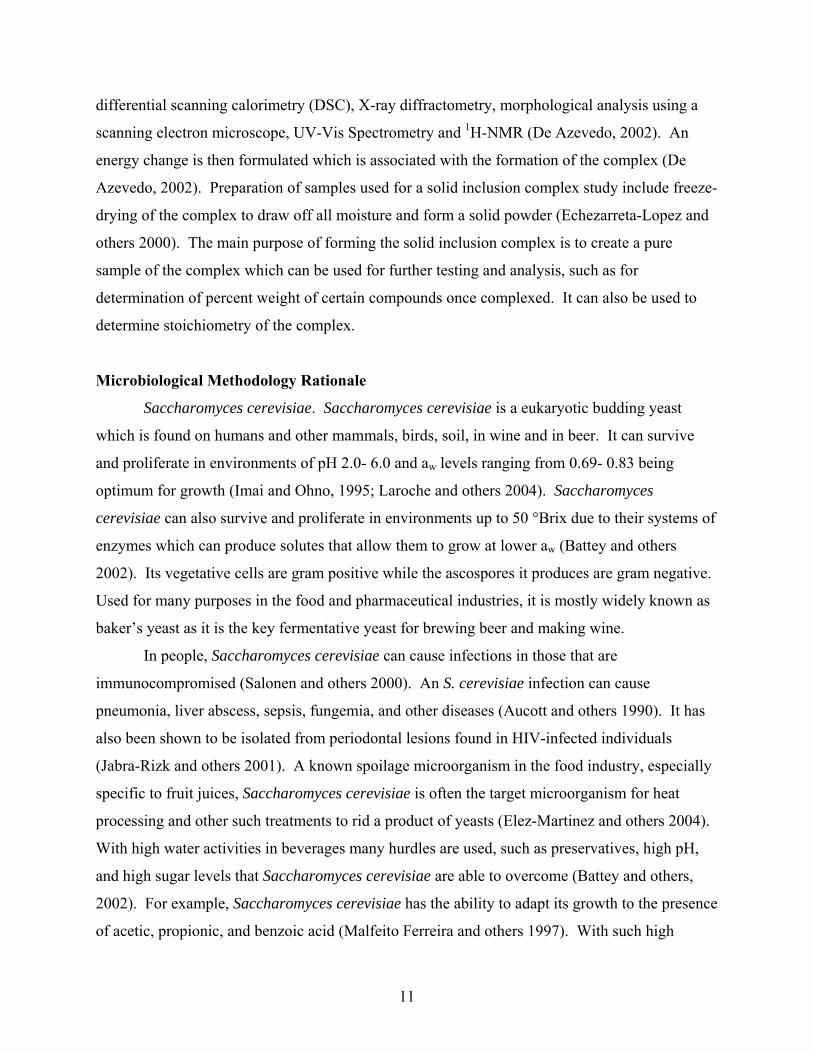
cyclodextrin there have been many studies performed to compare them. α-Cyclodextrin, shown
5
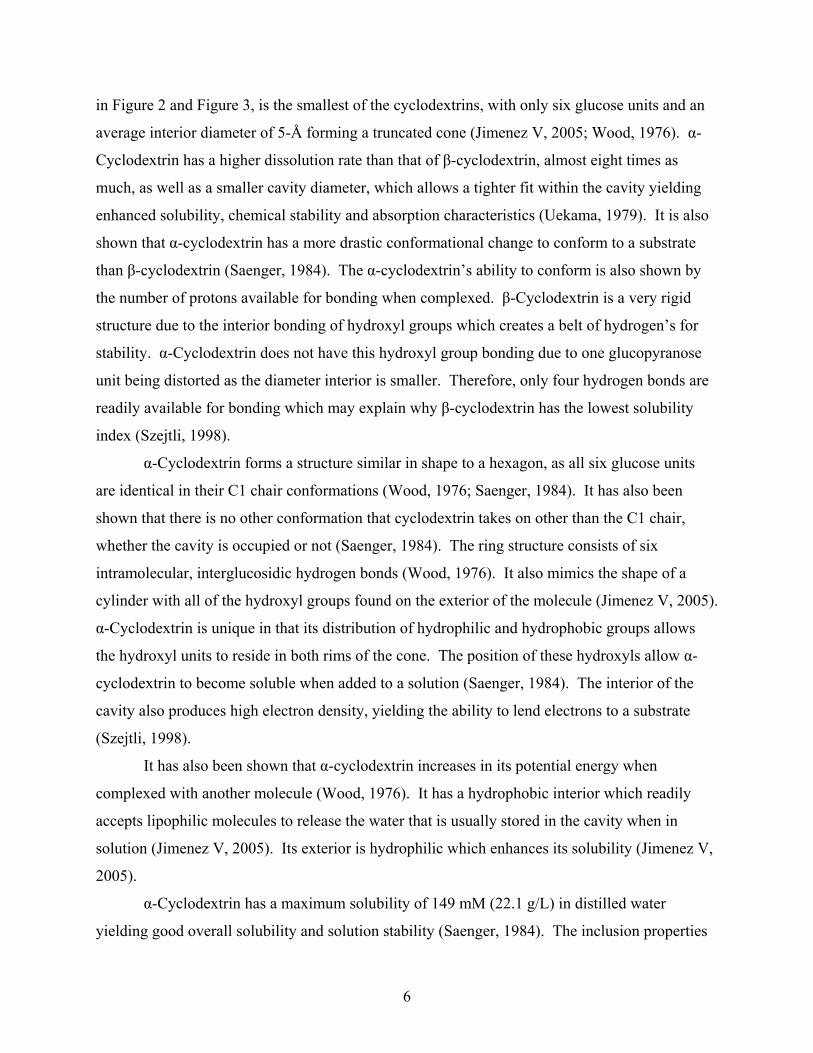
in Figure 2 and Figure 3, is the smallest of the cyclodextrins, with only six glucose units and an
average interior diameter of 5-Å forming a truncated cone (Jimenez V, 2005; Wood, 1976). α-
Cyclodextrin has a higher dissolution rate than that of β-cyclodextrin, almost eight times as
much, as well as a smaller cavity diameter, which allows a tighter fit within the cavity yielding
enhanced solubility, chemical stability and absorption characteristics (Uekama, 1979). It is also
shown that α-cyclodextrin has a more drastic conformational change to conform to a substrate
than β-cyclodextrin (Saenger, 1984). The α-cyclodextrin’s ability to conform is also shown by
the number of protons available for bonding when complexed. β-Cyclodextrin is a very rigid
structure due to the interior bonding of hydroxyl groups which creates a belt of hydrogen’s for
stability. α-Cyclodextrin does not have this hydroxyl group bonding due to one glucopyranose
unit being distorted as the diameter interior is smaller. Therefore, only four hydrogen bonds are
readily available for bonding which may explain why β-cyclodextrin has the lowest solubility
index (Szejtli, 1998).
α-Cyclodextrin forms a structure similar in shape to a hexagon, as all six glucose units
are identical in their C1 chair conformations (Wood, 1976; Saenger, 1984). It has also been
shown that there is no other conformation that cyclodextrin takes on other than the C1 chair,
whether the cavity is occupied or not (Saenger, 1984). The ring structure consists of six
intramolecular, interglucosidic hydrogen bonds (Wood, 1976). It also mimics the shape of a
cylinder with all of the hydroxyl groups found on the exterior of the molecule (Jimenez V, 2005).
α-Cyclodextrin is unique in that its distribution of hydrophilic and hydrophobic groups allows
the hydroxyl units to reside in both rims of the cone. The position of these hydroxyls allow α-
cyclodextrin to become soluble when added to a solution (Saenger, 1984). The interior of the
cavity also produces high electron density, yielding the ability to lend electrons to a substrate
(Szejtli, 1998).
It has also been shown that α-cyclodextrin increases in its potential energy when
complexed with another molecule (Wood, 1976). It has a hydrophobic interior which readily
accepts lipophilic molecules to release the water that is usually stored in the cavity when in
solution (Jimenez V, 2005). Its exterior is hydrophilic which enhances its solubility (Jimenez V,
2005).
α-Cyclodextrin has a maximum solubility of 149 mM (22.1 g/L) in distilled water
yielding good overall solubility and solution stability (Saenger, 1984). The inclusion properties
6
are based on many weak forces, such as van der Waals forces, working together to form a
preferable, affinity-based complex (Jimenez V, 2005). The complexation of α-cyclodextrin also
incorporates the transfer of hydrophobicity and charge of the anions to differentiate the
complexation of α-cyclodextrin with another molecule (Jimenez V, 2005). There are two
different conformational states that α-cyclodextrin remain in depending on solution. If the α-
cyclodextrin is empty, meaning there is no other molecule with which to complex, water takes its
place inside the α-cyclodextrin cavity. The water collapses the torus and the ring of hydrogen
bonds is altered thus producing steric strain on the α-cyclodextrin (Saenger, 1984). If the α-
cyclodextrin cavity contains a substrate, then it takes on a round, or hexagonal, shape which
takes minimal potential energy. The minimal energy allows for a relaxed structure state
(Saenger, 1984). There are also three observed mechanisms for the transfer of substrate into the
water-occupied α-cyclodextrin cavity (Saenger, 1984). The first involves a direct replacement of
water for the substrate. The second involves the formation of the relaxed state followed by
expulsion of the water by the substrate. Third, the substrate binds to the exterior of the cavity
and then enters (Saenger, 1984). The association-dissociation process is very rapid and
reversible between the α-cyclodextrin and substrate (Saenger, 1984).
Cyclodextrins are considered favorable solutes due to the cavity’s highly ordered
solvent molecules (Uekama, 1975). When complexed, the α-cyclodextrin can form channels
with one another, creating larger structures. With a molecule like cinnamic acid, which contains
a carboxyl group, the α-cyclodextrin will form cages that are structurally sound. The cage
formation is due to the hydrogen bonds forming sheets of O(2)H/ O(3)H on one side of the sheet
and O(6)H on the opposite side. The sheets then orient themselves to face one another to close
the sides of the α-cyclodextrin with adjacent molecules (Saenger, 1984).
Cyclodextrins have also shown browning inhibition properties when paired with fruit
beverages that undergo heat treatments (Irwin PL, 1993).
trans-cinnamic acid: α-cyclodextrin complex
Cinnamic acid and α-cyclodextrin complement one another in size and shape yielding a
complex that is effective and yields higher magnitudes of extrinsic optical activity (Uekama,
1975). Within the inclusion complex, the diameter of the α-cyclodextrin molecule is smaller and
will better host the cinnamic acid molecule, due to the benzene ring, as compared to the other
7
cyclodextrin varieties (Uekama, 1975). Benzene rings will fit in both α and β versions of
cyclodextrin as their interiors range from 6 to 8 Å. A benzene structure measures approximately
7 x 7 x 3.4 Å and therefore is able to fit in to the interior of the cyclodextrin cavity (Lach and
Cohen, 1963). It is shown that molecules made up of benzene rings have the propensity to bond
with the α-cyclodextrin cavity and will lead to an elliptical distortion of the benzene ring with the
O(4) hexagon elongated by approximately 0.8 Ǻ (Saenger, 1984). Although it is theorized that
the benzene ring is the portion of the molecule to bind within the cyclodextrin cavity, it is also
theorized that the side chains may fit in to the cavity and complexation occur which allow for the
cinnamic acid molecule to be included in solution (Lach and Cohen, 1963). Studies theorize that
hydrogen bonding, due to the many hydroxyl and carboxyl groups of the cyclodextrin is the
primary mechanism in the inclusion complex formation. If the guest is too small, forces holding
it in place within the cyclodextrin cavity are too weak to form a stable inclusion complex (Lach
and Cohen, 1963). With the benzene ring diameter being roughly the same size as the
cyclodextrin cavity a strong stability is expected, though strain is necessary due to the tight fit
(Lach and Cohen, 1963).
If the complex is formed as a solid state complex, rehydrating the complex for the ability
to increase solubility or increase bioavailability of the substrate is shown to be non-problematic
as opposed to using the complex for protection or stabilization of the substrate (Saenger, 1984).
Solubility studies propose that α-cyclodextrin is capable of interacting with the substituent
groups as well as benzene rings, yielding a 2:1 molar ratio (Uekama, 1979). The interation with
other groups may be due to the ability of α-cyclodextrin to interact with many molecules,
including those that are derivatives of cinnamic acid (Uekama, 1979). Studies have shown that
due to a 2:1 molar ratio, when complexed, there is a change in pKa from 4.35 when
uncomplexed to 6.27 (Uekama, 1975).
Characterization Methodology Rationale
Phase-solubility analysis. Phase-solubility analysis is a measurement of the equilibrium
solubility of a chemical substance in a given solvent, at a given temperature and pressure which
is used to identify the purity of the substance (Higuchi, 1971). The interactions between the two
molecules used in the inclusion complex are held together with weak induction forces, such as
van der Waals forces and charge transfer (Higuchi, 1971). The electron transfer between the two
8
molecules creates electrostatic forces of attraction (Higuchi, 1971). These charge transfers have
been linked to overall solubility effects with the inclusion complexes, especially with aromatic
molecules (Higuchi, 1971). The ability for a compound to become soluble is closely related to
the molecular interactions of the compound. For example, if a compound has a lower solubility
it is expected to have a higher solute to solute interaction (Higuchi, 1971). Placed in solution it
is much more likely for two molecules in an aqueous solution to interact with one another as
opposed to their environment. Though little analytical application is available with these
methods it has been used in research for gaining more information about the substrate, including
association and stability constants (Higuchi, 1971). It has also been applied as a quantitative
measure for purity determination of the substrate in question, which in turn can prepare the
sample for further characterization.
In running analysis, successive amounts of a sample are added to a solvent which remains
at a constant volume in which it is slightly soluble. The solution is then brought to equilibrium
through agitation at a constant temperature and the solution phases are then analyzed for total
solute content (Higuchi, 1971). A phase diagram can then be constructed by plotting the weight
of the solute found per unit of solution against the weight of the sample added per unit of
solvent. There are many different solubility paths the cinnamic acid: α-cyclodextrin complex
could follow. The diagram is then read and interpreted (Higuchi, 1971). A phase solubility
experiment then yields the maximum solubility of the substrate in question.
Nuclear magnetic resonance (NMR). NMR is a spectroscopic technique that is element-
selective and noninvasive. It is capable of characterizing the structural differences between
many molecules that are present in a sample (Bertmer and others 2006). Proton-NMR (H-NMR)
is a procedure that allows for identification of single protons in a sample. With the ability to
identify a compound’s protons, a shift in those protons can be interpreted as a change in
conformation of the molecule at different concentrations. NMR is based on the theory that
protons act as magnets, giving off a magnetic pulse in response to a pulse. This pulse given off
by the protons is then recorded and shown as a spectrograph. By viewing the spectra, a literal
shift in spectral peaks, representing the compound’s protons, is seen. Shifts are also an
advantage as they provide insight into the conformation of the complex. Chemical shifting and
conformational change are difficult processes to detect with any other analytical procedure
9
(Schneider and others 1998). For these reasons, NMR shift titrations are the most often used
method for determining association constants with cyclodextrins (Schneider and others, 1998).
Pharmaceutical needs have caused an increase in NMR cyclodextrin research. NMR is
now required in the pharmaceutical industry as the structural characteristics of compounds in use
are legally mandatory (Schneider and others, 1998). NMR can structurally characterize
compounds and therefore has become a necessary tool in the industry. Although it is too indirect
to acquire a three-dimensional structural representation, models can be derived from the data
provided from NMR spectroscopy (Schneider and others, 1998).
Literature holds many NMR spectra of α-cyclodextrin though few of cinnamic acid.
Studies have shown that cyclodextrin has a shielding effect caused by the interior cavity which
limit the parts per million (ppm) when a guest is included in the complex (Schneider and others,
1998). There are few proton shielding differences between the types of cyclodextrins available
for research. For example, H-1 for α-cyclodextrin is the base line for movement and should
remain constant. Due to this shielding effect that is produced, there is a possibility of a shift
registered by NMR of up to 0.1 ppm (Schneider and others, 1998). Also, when reviewed in more
detail, a shift is shown to occur for α-cyclodextrin H-6a and H-6b in the solvent D2O of 0.02 to
0.06 ppm. D2O is the solvent of choice for the cinnamic acid: α-cyclodextrin complex as it is
most closely resembles the environment of a high-acid beverage. The solvents used have an
effect on complexation of the compounds and can lead to fast exchange of protons, such as in
water (Schneider and others, 1998). This fast proton exchange is why D2O is such a desirable
solution to work with. Other studies have shown that the binding constant increases when using
D2O as opposed to H2O as the solvent for NMR, especially as compounds are complexed with
cyclodextrins (Wang and Matsui, 1994). Although D2O is as close to a pure water system as can
be achieved for NMR and that their properties are very similar there is much more structural
order in D2O which can cause and increase in a compounds’ binding affinity (Wang and Matsui,
1994). Tetramethylammonium salts (TMS) are used as an internal reference for the NMR to
compare the complex to and determine if a shift occurs (Schneider and others, 1998).
Solid inclusion complex. A solid inclusion complex gives the researcher the complex as a
physical solid to perform further structural characterization studies. With a solid inclusion
complex, the actual structure and fit of the two molecules can be further determined with
10
differential scanning calorimetry (DSC), X-ray diffractometry, morphological analysis using a
scanning electron microscope, UV-Vis Spectrometry and 1H-NMR (De Azevedo, 2002). An
energy change is then formulated which is associated with the formation of the complex (De
Azevedo, 2002). Preparation of samples used for a solid inclusion complex study include freeze-
drying of the complex to draw off all moisture and form a solid powder (Echezarreta-Lopez and
others 2000). The main purpose of forming the solid inclusion complex is to create a pure
sample of the complex which can be used for further testing and analysis, such as for
determination of percent weight of certain compounds once complexed. It can also be used to
determine stoichiometry of the complex.
Microbiological Methodology Rationale
Saccharomyces cerevisiae. Saccharomyces cerevisiae is a eukaryotic budding yeast
which is found on humans and other mammals, birds, soil, in wine and in beer. It can survive
and proliferate in environments of pH 2.0- 6.0 and aw levels ranging from 0.69- 0.83 being
optimum for growth (Imai and Ohno, 1995; Laroche and others 2004). Saccharomyces
cerevisiae can also survive and proliferate in environments up to 50 °Brix due to their systems of
enzymes which can produce solutes that allow them to grow at lower aw (Battey and others
2002). Its vegetative cells are gram positive while the ascospores it produces are gram negative.
Used for many purposes in the food and pharmaceutical industries, it is mostly widely known as
baker’s yeast as it is the key fermentative yeast for brewing beer and making wine.
In people, Saccharomyces cerevisiae can cause infections in those that are
immunocompromised (Salonen and others 2000). An S. cerevisiae infection can cause
pneumonia, liver abscess, sepsis, fungemia, and other diseases (Aucott and others 1990). It has
also been shown to be isolated from periodontal lesions found in HIV-infected individuals
(Jabra-Rizk and others 2001). A known spoilage microorganism in the food industry, especially
specific to fruit juices, Saccharomyces cerevisiae is often the target microorganism for heat
processing and other such treatments to rid a product of yeasts (Elez-Martinez and others 2004).
With high water activities in beverages many hurdles are used, such as preservatives, high pH,
and high sugar levels that Saccharomyces cerevisiae are able to overcome (Battey and others,
2002). For example, Saccharomyces cerevisiae has the ability to adapt its growth to the presence
of acetic, propionic, and benzoic acid (Malfeito Ferreira and others 1997). With such high
11
fermentation rates it is possible that it is able to overcome obstacles these quickly, having been
shown to repair itself during growth, showing adaption to its surroundings (Malfeito Ferreira and
others, 1997). The adaption abilities may be one reason why there is such a spoilage factor with
S. cerevisiae in the food industry (Malfeito Ferreira and others, 1997).
There is a significant presence of Saccharomyces cerevisiae in the food production
facilities as it is the main yeast spoilage concern in soft drink and juice plants (Battey and others,
2002). In one 2005 study within a processing facility, 99% of the samples showed
contamination with Saccharomyces cerevisiae range of 106- 108 CFU per gram (Glover and
others 2005). These values demonstrate its propensity to develop and populate in processing
facilities. It has been shown to be ubiquitous in foods and raw materials. In juice studies it was
shown that Saccharomyces cerevisiae showed more of a propensity for survival in heat
processed juices than in liquid cultures of malt broth (Pieckova and Samson, 2000). Due to the
fact that it is not a pathogenic organism there are no regulations in place for dealing with the
yeast despite proper cleaning and sanitizing procedures.
Paecilomyces variotii. Paecilomyces variotii is a filamentous fungus with thick walled
hyphae and ascopsore production. It is found in soil, decaying plant life, insects, and food
products. Paecilomyces variotii has a pH range of 3.9 to 6.9 with an optimum growth at pH 5.9.
Its water activity (aw) maximum for growth is 0.793 as Paecilomyces variotii is a xerotolerant
fungi (Wheeler and Hocking, 1988; Pieckova and Samson, 2000; Estevez and others 2005). It is
also a heat tolerant fungi, therefore often found in heat treated products though it rarely forms
ascospores as a result of treatment (Houbraken and others 2008). It is able to grow in
temperatures up to 50 ºC, deeming it one of the most heat resistant fungi known due to its ability
to produce ascospores. It has been shown to survive heat processes at 93 ºC for 5 minutes
(Pieckova and Samson, 2000). The ability to survive is due to the thick-walled hyphae and
chlamydospores which are produced in the budding phase of growth (Pieckova and Samson,
2000). The fungus is also able to grow at low oxygen levels and in the presence of preservatives,
specifically sorbate, which proves a challenge in food manufacturing facilities (Houbraken and
others, 2008; Pieckova and Samson, 2000).
Paecilomyces variotii is commonly associated with keratitis and soft tissue infections in
immunocompromised patients, though no mycotoxins are known to be produced (Pieckova and
12
Samson, 2000). It is theorized to enter the body through the respiratory tract and can also be
found in exposed wounds from catheters (Groll and Walsh, 2001). Once in the body,
Paecilomyces variotii become distinctly similar to microconidia and can then travel freely within
the patients bloodstream to cause infection (Groll and Walsh, 2001). It is most commonly
associated with endocarditis which can lead to death (Houbraken and others, 2008). In food its
route of contamination is unknown though it is found most frequently in pasteurized fruit
beverages and is the most frequently encountered spoilage microorganism in multiple foods,
especially oil based products. Examples include margarine, cheese, dried fruit, seeds, cereal, and
peanuts (Pieckova and Samson, 2000). (Pieckova and Samson, 2000). Due to the fact that it is
not a pathogenic organism there are no regulations in place for dealing with the fungus despite
proper cleaning and sanitizing procedures in a processing facility.
Minimum inhibitory concentration (MIC) studies. Food spoilage is often contributed to
the fermentation process microorganisms undergo producing CO2 and ethanol which cause off
tastes and textures in the food product (Malfeito Ferreira and others, 1997). MIC studies
determine the minimum amount of antimicrobial concentration needed to inhibit visible growth
of microorganisms over a set period of time. Therefore, the lower the number value derived by
MIC studies the more effective the compound. There are tests for pathogens, yeasts, molds, etc.
A study testing the antimicrobial ability of cinnamic acid against Escherichia coli O157:H7 and
Salmonella Typhimurium showed a relatively high MIC value, which is not desired, of 5.0 and
7.5 mmol-1, respectively (Olasupo and others 2003). This study holds some of the first data for
cinnamic acid against these compounds (Olasupo and others, 2003). As previously stated,
cinnamic acid also shows inhibitory effects on kiwi and honeydew melon (Burt, 2004). A
cinnamic acid derivative, cinnamaldehyde also holds a slight effectiveness in cooked shrimp,
yogurt, and alfalfa seeds (Burt, 2004).
Another study working with the parent compound of cinnamic acid, as well as many of
its derivatives, reported MIC study results of 2.34 log 1/MIC against S. aureus, 2.34 against
B.subtilis, 2.39 against E.coli, 2.69 against C. albicans, and 2.69 against A. niger (Narasimhan
and others 2004). The study also showed MIC values of 2.55-3.10 against certain fungi
(Narasimhan and others, 2004). A similar study correlating pH with titratable acidity and
antimicrobial presence found that Saccharomyces cerevisiae was still able to grow at levels as
13
low as pH 3.8 with a preservative concentration of 325 ppm (Battey and others, 2002). This
study was able to show a correlation between pH and preservative concentration. When pH was
not a factor and high levels of preservatives used they still showed growth and vice versa (Battey
and others, 2002).
The MIC studies allow a researcher to define the range of effectiveness of a test
compound or inclusion complex’s concentration against specific microorganisms. The results
then define which concentrations are the most effective, the lower the better, against the
microorganisms in question and allow for a numerical value determination of effectiveness.
These models can then be mimicked in the product to be produced in a processing facility.
Although there are many different varieties of MIC studies, whether the researcher is using agar
wells or aqueous solution, the results are able to predict contamination models in real time.
Further studies can then be conducted using standard plate counts to determine the concentration
of the microorganism and its growth rate at the different preservative levels tested.
14
References
Aucott JN, Fayen J, Grossnicklas H, Morrissey A, Lederman MM and Salata RA. 1990. Invasive infection with Saccharomyces cerevisiae: report of three cases and review. Reviews of Infectious Diseases 12(3):406-411.
Battey AS, Duffy S and Schaffner DW. 2002. Modeling yeast spoilage in cold-filled ready-to-drink beverages with Saccharomyces cerevisiae, Zygosaccharomyces bailii, and Candida lipolytica. Applied and Environmental Microbiology 68(4):1901-1906.
Bertmer M, Nieuwendaal RC, Barnes AB and Hayes SE. 2006. Solid-state photodimerization kinetics of alpha-trans-cinnamic acid to alpha-truxillic acid studied via solid-state NMR. The Journal of Physical Chemistry 110(12):6270-6273.
Burt S. 2004. Essential oils: their antibacterial properties and potential applications in foods--a review. International Journal of Food Microbiology 94(3):223-253.
Chambel AV, CA; Sa-Correia, I. 1999. Effect of cinnamic acid on the growth and on plasma membrane H+-ATPase activity of Saccharomyces cerevisiae. International Journal of Food Microbiology 50:173-179.
De Azevedo MBMZ, M.A.T.; Alderete, J.B.; De Azevedo, M.M.M.; Salva, T.J.G.and Duran, N. 2002. Characterisation and properties of the inclusion complex of 24-epibrassinolide with beta-cyclodextrin. Plant Growth Regulation 37:233-240.
Echezarreta-Lopez M, Torres-Labandeira JJ, Castineiras-Seijo L, Santana-Penin L and Vila-Jato JL. 2000. Complexation of the interferon inducer, bropirimine, with hydroxypropyl-beta-cyclodextrin. European Journal of Pharmaceutical Science 9(4):381-386.
Elez-Martinez P, Escola-Hernandez J, Soliva-Fortuny RC and Martin-Belloso O. 2004. Inactivation of Saccharomyces cerevisiae suspended in orange juice using high-intensity pulsed electric fields. Journal of Food Protection 67(11):2596-2602.
Estevez E, Veiga MC and Kennes C. 2005. Biodegradation of toluene by the new fungal isolates Paecilomyces variotii and Exophiala oligosperma. Journal of Industrial Microbiology and Biotechnology 32(1):33-37.
FDA. 2006. Data on Benzene in Soft Drinks and Other Beverages. Office of Food Additive Safety, CFSAN, Food and Drug Administration. Received October 2007 from http://www.cfsan.fda.gov/~dms/benzdata.html.
Fujii T SC, Yano A, Terado K, Sugino H, and Fukuda H. 2001. Suppression of the growth of the baidiomycete yeast, Rhodotorula minuta, by cinnamic acid. Biotechnology Letters 24:151-154.
Glover RL, Abaidoo RC, Jakobsen M and Jespersen L. 2005. Biodiversity of Saccharomyces cerevisiae isolated from a survey of pito production sites in various parts of Ghana. Systematic and Applied Microbiology 28(8):755-761.
Groll AH and Walsh TJ. 2001. Uncommon opportunistic fungi: new nosocomial threats. Clinical Microbiological Infections 7(2):8-24.
Hashimoto H. 1996. Cyclodextrins in Foods, Cosmetics, and Toiletries. In: Atwood, J. D., JED; MacNicol, DD; Vogtle, F, editor. Comprehensive Supramolecular Chemistry. Yokohama: Pergamon. p. 483-502.
Higuchi TC, K.A. 1971. Phase-Solubility Diagrams. Advances in Analytical Chemistry and Instrumentation. John Wiley and Sons Inc. p. 117-212.
Hoskins JA. 1984. The occurrence, metabolism and toxicity of cinnamic acid and related compounds. Journal of Applied Toxicology 4(6):283-292.
15
Houbraken J, Varga J, Rico-Munoz E, Johnson S and Samson RA. 2008. Sexual reproduction as the cause of heat resistance in the food spoilage fungus Byssochlamys spectabilis (anamorph: Paecilomyces variotii ). Applied and Environmental Microbiology.
Imai T and Ohno T. 1995. The relationship between viability and intracellular pH in the yeast Saccharomyces cerevisiae. Applied and Environmental Microbiology 61(10):3604-3608.
Irwin PL PP, Doner LW, Sapers GM, Brewster JD, Nagahashi G, and Hicks KB. 1993. Binding geometry, stoichiometry, and thermodynamics of cyclomalto-oligosaccharide (cyclodextrin) inclusion complex formation with chlorogenic acid, the major substrate of apple polyphenol oxidase. Carbohydrate Research 256:13-27.
Jabra-Rizk MA, Ferreira SM, Sabet M, Falkler WA, Merz WG and Meiller TF. 2001. Recovery of Candida dubliniensis and other yeasts from human immunodeficiency virus-associated periodontal lesions. Journal of Clinical Microbiology 39(12):4520-4522.
Jimenez V AJ. 2005. The role of charge transfer interactions in the inclusion complexation of anionic guests with alpha-cyclodextrin. Tetrahedron 61:5449-5456.
Kouassi Y SL. 1998. Inhibition of Listeria monocytogenes by cinnamic acid: possible interaction of the acid with cysteinyl residues. Journal of Food Safety 18:231-242.
Lach JL and Cohen J. 1963. Interaction of pharmaceuticals with Schardinger dextrins. II. Interaction with selected compounds. Journal of Pharmaceutical Sciences 52:137-142.
Lambert RJ, Skandamis PN, Coote PJ and Nychas GJ. 2001. A study of the minimum inhibitory concentration and mode of action of oregano essential oil, thymol and carvacrol. Journal of Applied Microbiology 91(3):453-462.
Laroche C, Fine F and Gervais P. 2004. Water activity affects heat resistance of microorganisms in food powders. International Journal of Food Microbiology 97(3):307-315.
Letizia CS CJ, Lapczynski A, Lalko J, and Api AM. 2004. Fragrance material review on cinnamic acid. Food and Chemical Toxicology 43:925-943.
Malfeito Ferreira M, Loureiro-Dias MC and Loureiro V. 1997. Weak acid inhibition of fermentation by Zygosaccharomyces bailii and Saccharomyces cerevisiae. International Journal of Food Microbiology 36:145-153.
Narasimhan B, Belsare D, Pharande D, Mourya V and Dhake A. 2004. Esters, amides and substituted derivatives of cinnamic acid: synthesis, antimicrobial activity and QSAR investigations. European Journal of Medicinal Chemistry 39(10):827-834.
Olasupo NA, Fitzgerald DJ, Gasson MJ and Narbad A. 2003. Activity of natural antimicrobial compounds against Escherichia coli and Salmonella enterica serovar Typhimurium. Letters in Applied Microbiology 37(6):448-451.
Pieckova E and Samson RA. 2000. Heat resistance of Paecilomyces variotii in sauce and juice. Journal of Industrial Microbiology and Biotechnology 24(4):227-230.
Ramos-Nino ME, Clifford MN and Adams MR. 1996. Quantitative structure activity relationship for the effect of benzoic acids, cinnamic acids and benzaldehydes on Listeria monocytogenes. The Journal of Applied Bacteriology 80(3):303-310.
Roller S and Seedhar P. 2002. Carvacrol and cinnamic acid inhibit microbial growth in fresh-cut melon and kiwifruit at 4 degrees and 8 degrees C. Letters in Applied Microbiology 35(5):390-394.
Saenger W. 1984. Structural Aspects of Cyclodextrins and their Inclusion Complexes. Inclusion Compounds 2. London: Academic Press. p. 231-259.
Salonen JH, Richardson MD, Gallacher K, Issakainen J, Helenius H, Lehtonen OP and Nikoskelainen J. 2000. Fungal colonization of haematological patients receiving
16
cytotoxic chemotherapy: emergence of azole-resistant Saccharomyces cerevisiae. The Journal of Hospital Infection 45(4):293-301.
Schneider HJ, Hacket F, Rudiger V and Ikeda H. 1998. NMR Studies of Cyclodextrins and Cyclodextrin Complexes. Chemical Reviews 98(5):1755-1786.
Sheu CW, Salomon D, Simmons JL, Sreevalsan T and Freese E. 1975. Inhibitory effects of lipophilic acids and related compounds on bacteria and mammalian cells. Antimicrobial Agents and Chemotherapy 7(3):349-363.
Szejtli J. 1998. Introduction and General Overview of Cyclodextrin Chemistry. Chemical Reviews 98(5):1743-1754.
Uekama K, Hiramaya, F, Esaki, K and Inoue, M. 1979. Inclusion Complexes of Cyclodextrins with Cinnamic Acid Derivatives: Dissolution and Thermal Behavior. Chemical and Pharmaceutical Bulletin 27(1):76-79.
Uekama K, Otagiri, M, Kanie, Y, Tanaka, S and Ikeda, K 1975. Inclusion Complexes of Cinnamic Acids with Cyclodextrins. Mode of Inclusion in Aqueous Solution. Chemical and Pharmaceutical Bulletin 23(7):1421-1430.
Wheeler KA and Hocking AD. 1988. Water relations of Paecilomyces variotii, Eurotium amstelodami, Aspergillus candidus and Aspergillus sydowii, xerophilic fungi isolated from Indonesian dried fish. International Journal of Food Microbiology 7(1):73-78.
Wood D, Hruska, FE, and Saenger, W. 1976. H NMR Study of the Inclusion of Aromatic Molecules in alpha-Cyclodextrin. Journal of the American Chemical Society 99(6):1735-1740.
17
Tables & Figures
Figure 2.1 Chemical structure of trans-cinnamic acid.
18
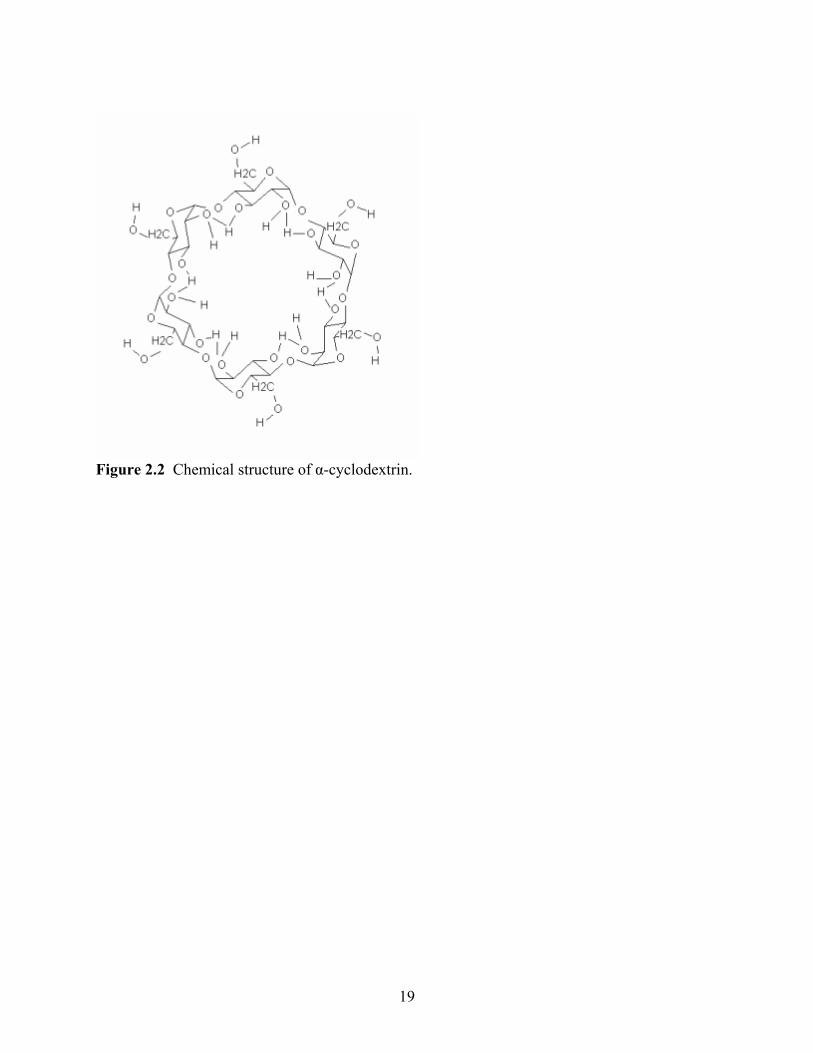
Figure 2.2 Chemical structure of α-cyclodextrin.
19
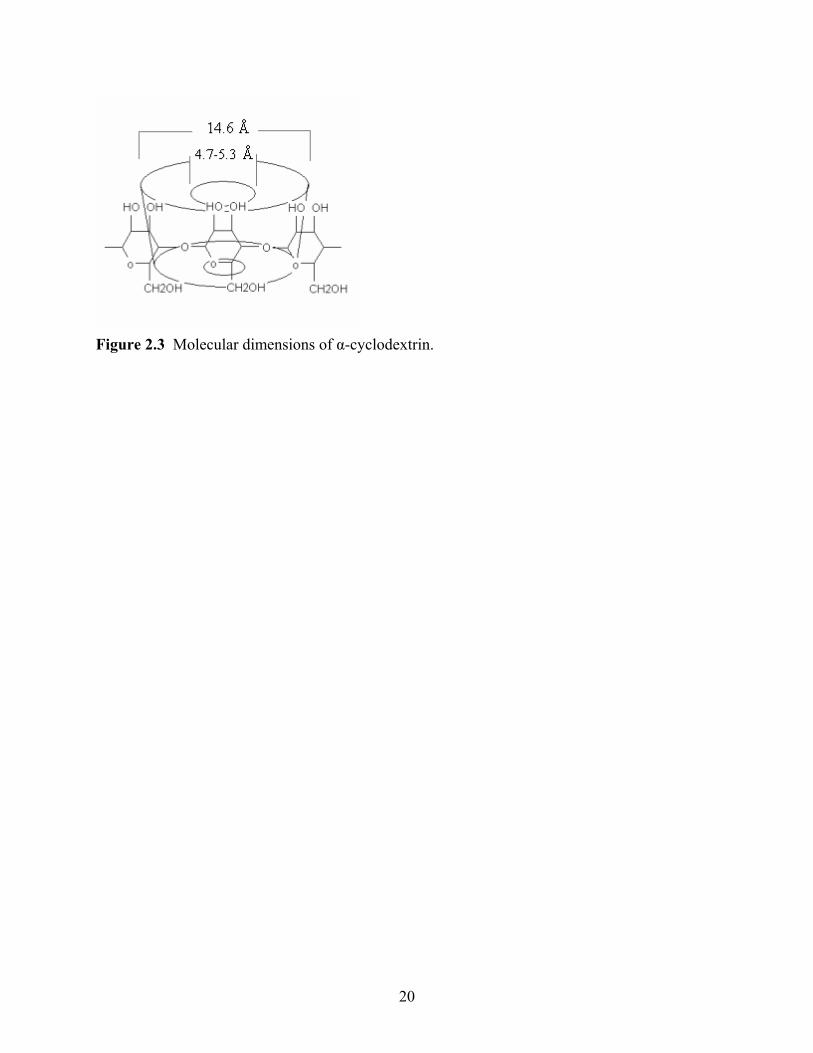
Figure 2.3 Molecular dimensions of α-cyclodextrin.
20
CHAPTER 3: THE FORMATION OF CINNAMIC ACID: Α-CYCLODEXTRIN INCLUSION COMPLEXES AND THEIR CHARACTERIZATION Abstract Characterization of the cinnamic acid: α-cyclodextrin complex was important to
investigate. Phase solubility tests were conducted to show the maximum amount of cinnamic
acid that α-cyclodextrin was able to host and the maximum concentration of α-cyclodextrin that
could host the cinnamic acid. Results indicated that 0.990 g/L of cinnamic acid in aqueous
solution was able to be complexed. This concentration had two times the solubility of the initial
0.5 g/L of free cinnamic acid in aqueous solution. Proton nuclear magnetic resonance (H-NMR)
was used to determine the conformation of the molecules, both guest and host, the affinity to
bond, and the association constant of the reaction. Results indicated that the cinnamic acid guest
molecule was shifting at the site of the benzene ring to conform to the rigid structure of the α-
cyclodextrin host molecule. It was also shown that the α-cyclodextrin had an association
constant of K1:1= 817.3 M-1 and K1:2= 21.7 M-1. Further H-NMR studies were done to reflect the
stoichiometry of the complex, which was a 1:2 ratio. Further studies to collect a solid inclusion
complex allowed for information pertaining to the percent weight of cinnamic acid found within
the complex. Results yielded an 8.9% weight to weight ratio of cinnamic acid in the complex.
These results indicate that the cinnamic acid undergoes much more strain to bind with the
interior cavity of the α-cyclodextrin. It also shows that the cinnamic acid undergoes fast action
binding that leaves it free to incorporate in to multiple molecules of α-cyclodextrin.
21
Introduction The Food and Drug Administration (FDA) released a study in November 2005 regarding
benzene levels in soft drinks and fruit beverages on the market (CFSAN and Safety, 2006).
Benzene, a known carcinogen, was being produced by a breakdown of the preservative sodium
benzoate, which was reacting with ascorbic acid (FDA, 2006). The dissociation mechanism was
accelerated by elevated temperatures and exposure to light (CFSAN and Safety, 2006). In want
of a new, natural preservative cinnamic acid was chosen by industry. A poor solubility of 0.5
g/L aqueous solution and a poor wettability necessitated an inclusion complex with α-
cyclodextrin. α-Cyclodextrin was chosen as the host molecule for cinnamic acid, as opposed to
cyclodextrins many other forms, due to its smaller interior diameter, of approximately 5 Å and
its solubility of 149 mg/L in a water-based solution (Hashimoto, 1996).
To characterize this inclusion complex of cinnamic acid and α-cyclodextrin in a water
based solution, multiple methods of investigation were chosen. To determine the maximum
amount of cinnamic acid that could be complexed with α-cyclodextrin, a phase solubility study
was conducted. To quantify a conformational change on the molecular level between the guest
and host molecules, proton nuclear magnetic resonance (H-NMR) was used. Two experimental
methods were chosen for the H-NMR study to yield data of the complex stoichiometry as well as
an association constant. Finally, a solid inclusion complex was formed to physically obtain the
complex as well as to determine the ratio of cinnamic acid to α-cyclodextrin in the complex for
future microbial studies.
Materials & Methods
Materials. trans-Cinnamic acid of 98 +% purity supplied by Arcos Organics (Geel,
Belgium). α-Cyclodextrin, CAVAMAX® W6 pharma cyclohexaamylose supplied by Wacker
Fine Chemicals (Munich, Germany). Ethyl alcohol, absolute, 99.5%, A.C.S. reagent supplied by
Arcos Organics (Geel, Belgium). Puradisc 25PP disposable filter device, 0.45 µm polypropylene
supplied by Whatman, Schleicher & Schuell (Florham Park, New Jersey, USA). Latex free 10
mL syringe supplied by Becton Dickinson & Co. (Franklin Lakes, New Jersey, USA). UV-Vis
spectrophotometer, UV-2101PC supplied by Shimadzu (Kyoto, Japan). Deuterium oxide, 99.9
atom% D supplied by Aldrich (Steinheim, Germany). NMR Sample Tubes 507-HP supplied by
22
Chemglass (Landisville, New Jersey, USA). NMR Inova400 ROBOT supplied by Varian (Palo
Alto, California, USA). Filtration Product, 75 mm Filter Unit- 500 mL supplied by Nalgene
(Rochester, New York, USA). Sentry Freezemobile 12SL freeze dryer supplied by Virtis
(Gardiner, New York, USA). NutsPro- NMR Utility Transform Software- Professional for
Windows supplied by Acorn NMR, Inc. (Livermore, California, USA).
Phase Solubility Analysis. Seven glass bottles with screwtop lids were each filled with
10 mL distilled H2O and labeled as 0 mM α-CD, 25 mM α-CD, 50 mM α-CD, 75 mM α-CD, 100
mM α-CD, 125 mM α-CD, and 145 mM α-CD. The appropriate amount of α-cyclodextrin (α-
CD) was then added to the distilled H2O as the label describes. With the lids tight, the solutions
were placed in the darkened mechanical shaker for 24 hours at 25 ºC at 250 rpm. After 24 hours
the bottles were extracted from the shaker and an excess of cinnamic acid were added to each
bottle with 0.05g/10 mL of the aqueous solution. Once the lids were replaced, the bottles were
set back in the darkened shaker for 48 hours at 25 ºC at 250 rpm. The samples were then pulled
and stored in a stationary, dark place to allow the excess cinnamic acid to settle out of solution
for 24 hours. The solution was then extracted with a 10 mL syringe and filtered into a test tube
using a 0.45 µm filter tip. For samples ranging from 0 mM- 75 mM, 1 mL of 50% ethanol was
added to the aqueous solution. For samples ranging from 100 mM- 145 mM, 0.1 mL 50%
ethanol was added. These solutions were placed into the shaker at 25 ºC at 250 rpm for 30
minutes. The samples were removed and 1 mL 100% ethanol was added to all samples. These
samples were then transferred to UV-Vis disposable cuvettes and run on the UV-Vis
spectrophotometer. Settings for the UV-Vis spectrophotometer included a wavelength range of
230-330 nm with a specific target wavelength of 269.5 nm. This procedure was done in
triplicate.
Phase solubility allowed the observation of the maximum amount of cinnamic acid able
to be complexed with α-cyclodextrin. Once the multiple concentrations of α-cyclodextrin with
excess cinnamic acid were run through the UV-Vis spectrophotometer, data was extracted from
the concentration data given at a wavelength of 269.5 nm. Each of these individual numbers was
then added as the y-value in the equation 0565.03984.0 −= xy , which has been derived from a
standard equation of the line for cinnamic acid in ethanol. The newly calculated values
determine the amount of cinnamic acid in mg/L found in the aqueous solution. These values
23
plotted on the y-axis against the concentration of α-cyclodextrin on the x-axis yield a phase
solubility diagram.
Nuclear Magnetic Resonance (NMR).
The Benesi-Hildebrand Method. Two stock solutions were prepared by labeling two
glass screwtop bottles 2 mM cinnamic acid stock and 140 mM α-cyclodextrin stock,
respectively. For the 2 mM cinnamic acid stock solution 14.82 mg of cinnamic acid was placed
in 50 mL of deuterated oxide (D2O). The stock solution was placed in the mechanical shaker for
24 hours at 25 ºC at 250 rpm. For the 140 mM α-cyclodextrin stock solution 1362.2 mg was
placed in 10 mL of deuterated oxide (D2O). The stock solution was also placed in the shaker for
24 hours at 25 ºC at 250 rpm. After these compounds had solubilized they were removed from
the shaker and NMR sample tubes were labeled Run 1- Run 8. These Runs were distinguished
by the amount of cinnamic acid stock and α-cyclodextrin stock included in each of the sample
NMR tubes. Each included 0.35 mL of the cinnamic acid stock. Stock α-cyclodextrin was
added in the following quantities: 0 mL, 0.05 mL, 0.1 mL, 0.15 mL, 0.2 mL, 0.25 mL, 0.3 mL,
0.35 mL. These samples were processed by the Inova400 ROBOT. The spectrographs retrieved
were processed using the NUTS computer program.
Method of continuous variation (Job’s plot). Nine glass bottles with screwtop lids were
acquired and labeled Run 9- Run 17. These aqueous samples were arranged with cinnamic acid
concentrations and the α-cyclodextrin concentrations and 0.2 mM of cinnamic acid and 1.8 mM
of α-cyclodextrin; 0.4 mM cinnamic acid and 1.6 mM of α-cyclodextrin; 0.6 mM cinnamic acid
and 1.4 mM of α-cyclodextrin; 0.8 mM cinnamic acid and 1.2 mM α-cyclodextrin; 1 mM
cinnamic acid and 1 mM α-cyclodextrin; 1.2 mM cinnamic acid and 0.8 mM α-cyclodextrin; 1.4
mM cinnamic acid and 0.6 mM α-cyclodextrin; 1.6 mM cinnamic acid and 0.4 mM α-
cyclodextrin; 1.8 mM cinnamic acid and 0.2 mM α-cyclodextrin. Once both of these compounds
were added to the appropriate vial, 10 mL D2O was added to put them together in solution. They
were then placed in the Innova mechanical shaker for 48 hours at 25 ºC at 250 rpm. Once they
were finished, 0.7 mL was drawn from each of the bottles and placed in an appropriately labeled
NMR sample tube. These samples were then taken to be processed by the Inova400 ROBOT.
24
The spectrographs retrieved were processed using the NUTS computer program. These
procedures were done in triplicate.
Solid Inclusion Complex. Twenty-six grams of α-cyclodextrin were mixed in 1 L of
distilled H2O. The α-cyclodextrin solution was then shaken for 24 hours at 25 ºC at 250 rpm.
After 24 hours, 15 grams of cinnamic acid were added and the aqueous solution placed back in
the shaker for 48 hours at 25 ºC at 250 rpm. The aqueous solution was poured in to the filter
sterilizer using vacuum pressure. The filtered solution was then separated into 500 mL portions
and placed in two wide, shallow dishes, covered with plastic wrap, frozen, and the samples were
lyophilized over four days. The samples were then removed and stored in a concealed bottle in a
desiccator, which was kept in a darkened environment. This procedure was done in triplicate.
Results & Discussion Phase Solubility Analysis
The curve shown in Figure 1 shows the maximum amount of cinnamic acid which can be
complexed by α-cyclodextrin. The phase diagram curve shows the peak at approximately 990.29
ppm aqueous solution, which denotes the maximum amount of cinnamic acid able to be held by
α-cyclodextrin. Cinnamic acid’s optimum uptake was seen at 0.04 M of α-cyclodextrin in
aqueous solution. Literature has shown results with estimations at 170 M aqueous soltuion,
equal to 2,518 ppm, for a cinnamate ion: α-cyclodextrin inclusion complex though
tris(hydroxymethyl)aminomethane base and hydrochloride were used as solvents to aid in
complete solubility of the complex (Connors and Rosanske, 1980). This value is double the
solubility that was found in the present study. One reason for this may be that the distilled water
used to solubilize the complex was not acidified to mimic a soft drink or fruit beverage and no
solvents were used making it much more difficult to incorporate the complex. The non-
acidification of the solutions test was initially done to achieve a baseline test for solubility.
H-NMR Benesi-Hildebrand Method
The Benesi-Hildebrand method conducted using H-NMR allowed further data processing
to determine the chemical shift of specific protons within both guest and host molecules as well
25
as the calculation of the complex’s association constant. Figure 2 shows the chemical shift noted
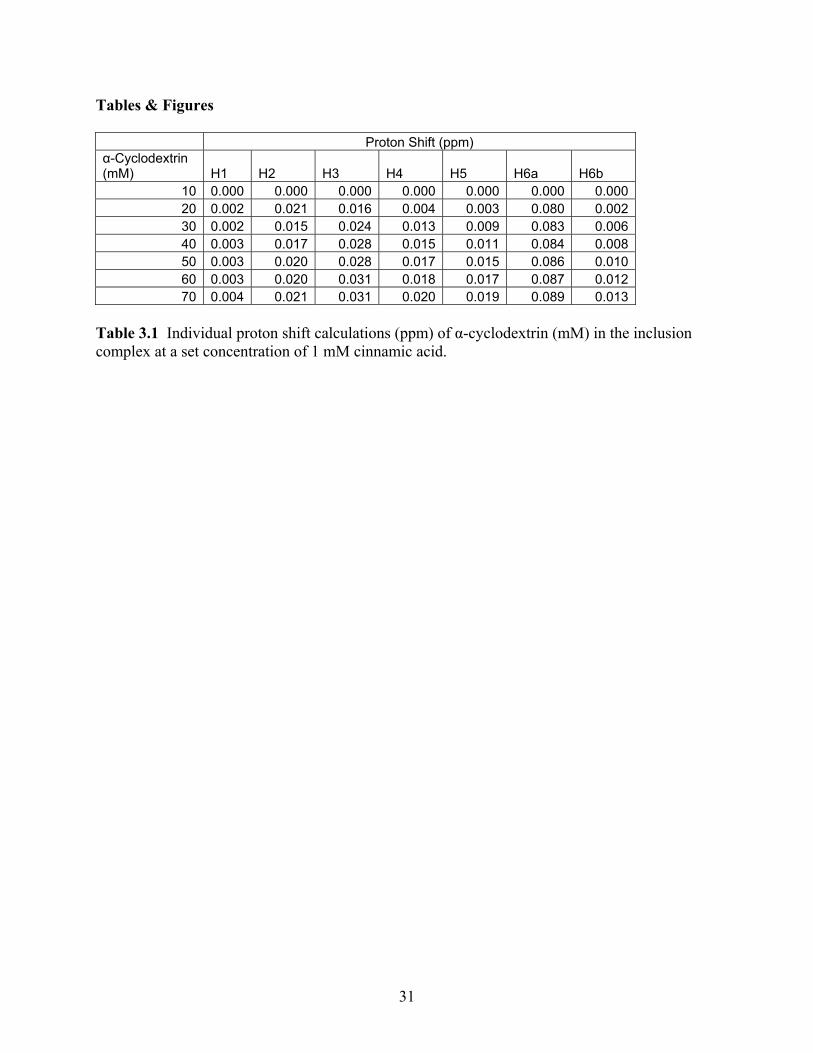
between the smallest amount of α-cyclodextrin present and the highest amount. Table 1 shows
the amount of conformation, or shift, performed by the cyclodextrin molecule. As can be seen,
there is very little conformational shift present. The largest shift at 0.089 ppm, occurred with
hydrogen 6a which is found on the exterior of the molecule. Hydrogen 6a is part of the chain
which hangs off of the cyclic molecule and is oriented as a tail off of the molecule, as seen in
Figure 3. The hydrogen is theorized to shift to accommodate a host (Irwin PL, 1993). Irwin
(1993) has stated that little conformation is expected from the α-cyclodextrin as a very rigid
structure will keep the molecule mostly stationary. Support for this argument can also be seen
with the disruption of the aromatic protons which where more disturbed by the binding than the
protons which had the largest shifts. When viewing the chemical shift, based on the Benesi-
Hildebrand method, it is seen that the majority of the conformation is coming from the cinnamic
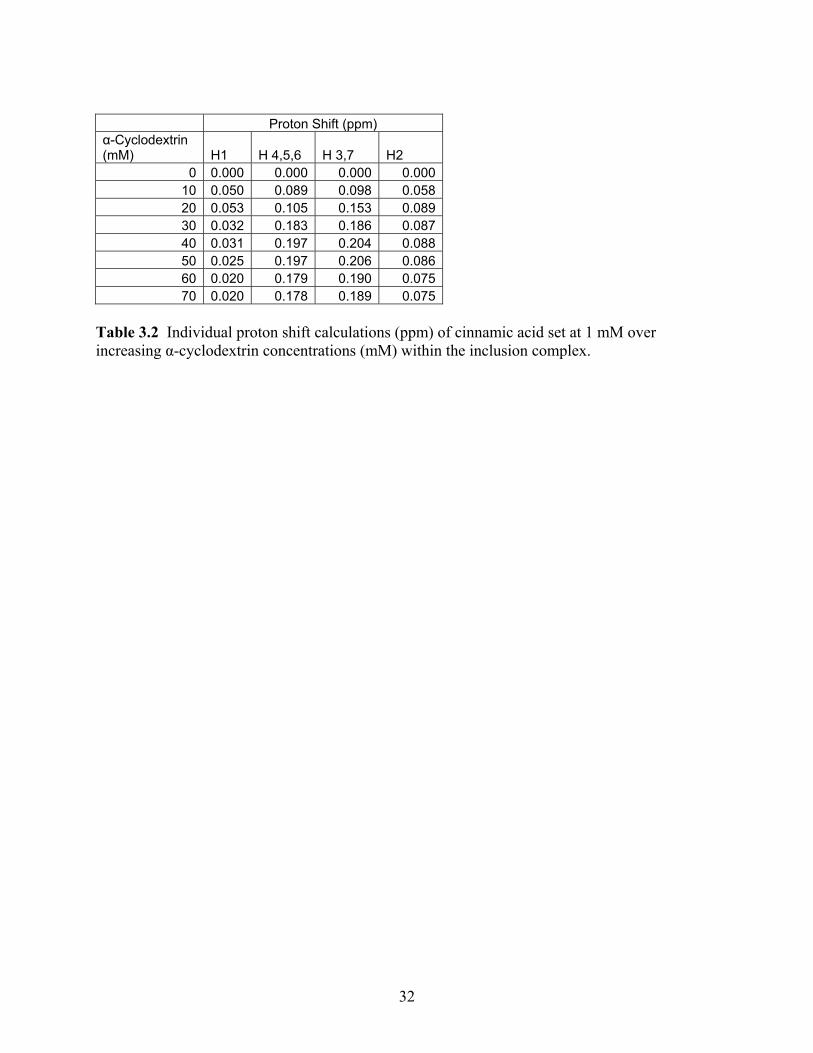
acid molecule itself. The cinnamic acid shifts can be seen in Figure 4 and Table 2. One study
found similar results, seeing the majority of movement in the shift of the host molecule than with
a cyclodextrin molecule (Denadai and others 2007). For cinnamic acid, the major shifts of 0.178
ppm and 0.189 ppm occurred with hydrogen groups 4, 5, and 6 as well as hydrogen groups 3 and
7, respectively. As these hydrogens are found on the benzene ring, this then points to its
conformation and ability to fit within the host of the α-cyclodextrin. Irwin (1993) has stated
similar conformations, where the largest shifts were associated with the hydrogens on the
benzene ring allowing the researcher to believe that this moiety inserts and attaches within the
cyclodextrin cavity.
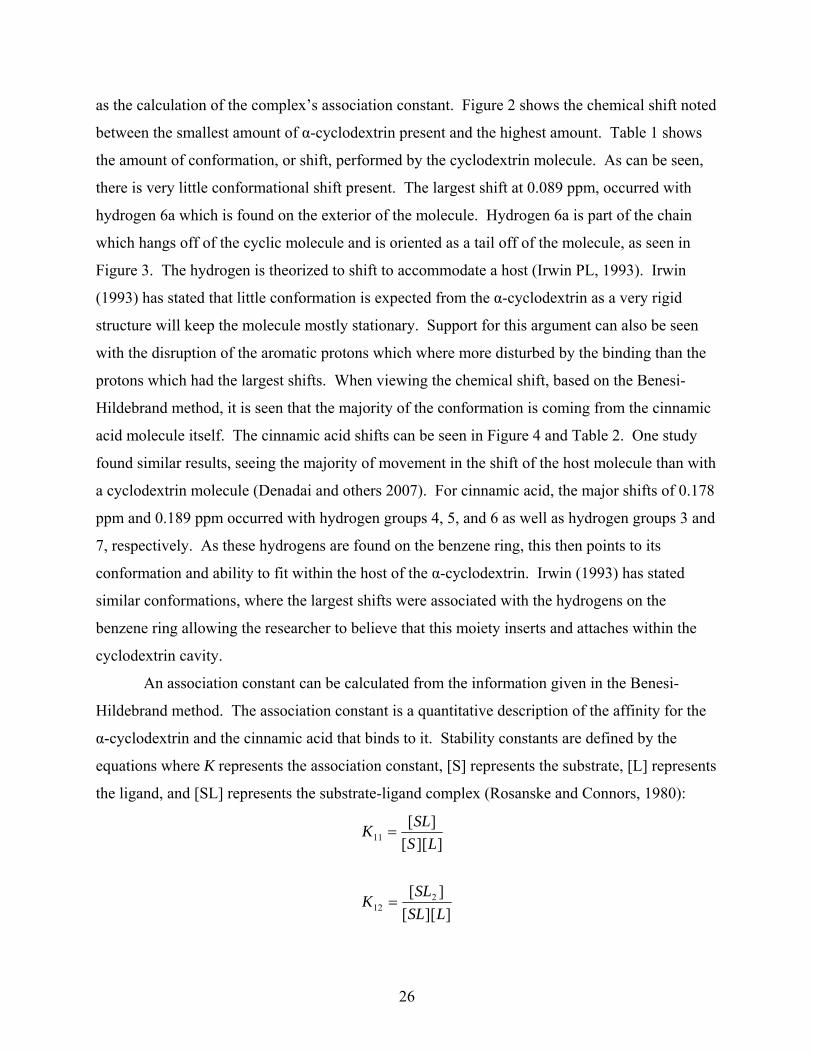
An association constant can be calculated from the information given in the Benesi-
Hildebrand method. The association constant is a quantitative description of the affinity for the
α-cyclodextrin and the cinnamic acid that binds to it. Stability constants are defined by the
equations where K represents the association constant, [S] represents the substrate, [L] represents
the ligand, and [SL] represents the substrate-ligand complex (Rosanske and Connors, 1980):
]][[][
]][[][
212
11
LSLSLK
LSSLK
=
=
26
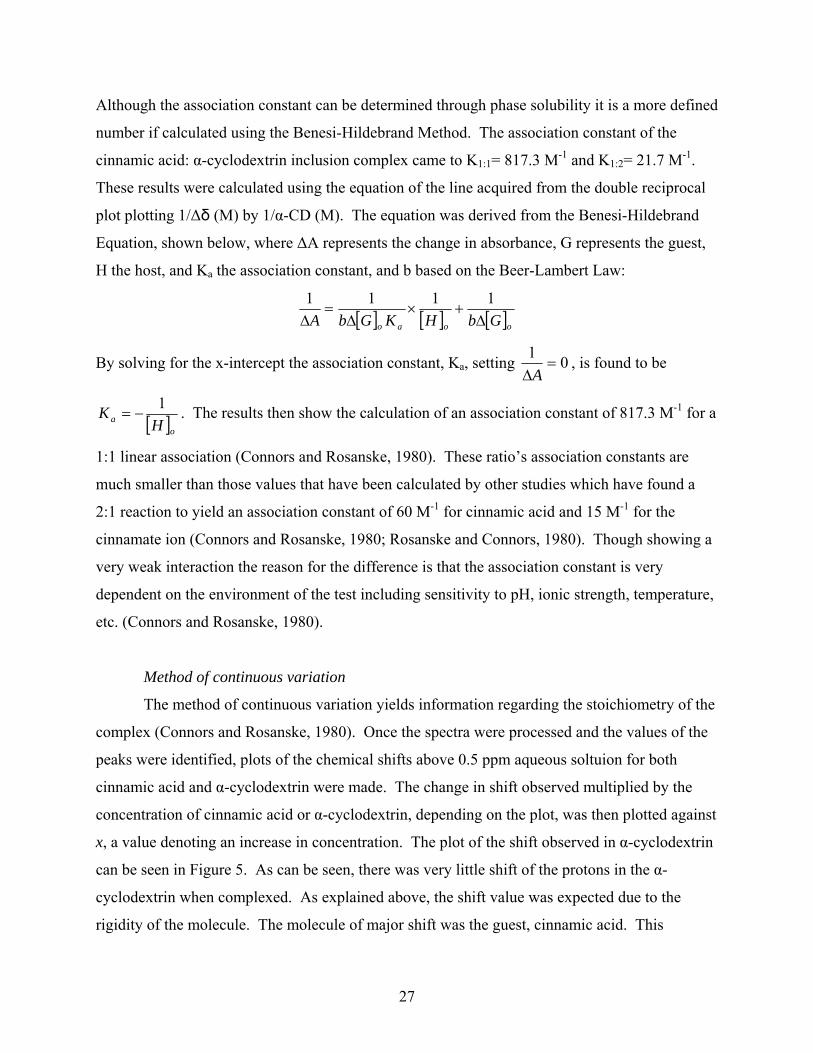
Although the association constant can be determined through phase solubility it is a more defined
number if calculated using the Benesi-Hildebrand Method. The association constant of the
cinnamic acid: α-cyclodextrin inclusion complex came to K1:1= 817.3 M-1 and K1:2= 21.7 M-1.
These results were calculated using the equation of the line acquired from the double reciprocal
plot plotting 1/Δδ (M) by 1/α-CD (M). The equation was derived from the Benesi-Hildebrand
Equation, shown below, where ΔA represents the change in absorbance, G represents the guest,
H the host, and Ka the association constant, and b based on the Beer-Lambert Law:
[ ] [ ] [ ]ooao GbHKGbA Δ+×
Δ=
Δ1111
By solving for the x-intercept the association constant, Ka, setting 01=
ΔA, is found to be
[ ]oa HK 1
−= . The results then show the calculation of an association constant of 817.3 M-1 for a
1:1 linear association (Connors and Rosanske, 1980). These ratio’s association constants are
much smaller than those values that have been calculated by other studies which have found a
2:1 reaction to yield an association constant of 60 M-1 for cinnamic acid and 15 M-1 for the
cinnamate ion (Connors and Rosanske, 1980; Rosanske and Connors, 1980). Though showing a
very weak interaction the reason for the difference is that the association constant is very
dependent on the environment of the test including sensitivity to pH, ionic strength, temperature,
etc. (Connors and Rosanske, 1980).
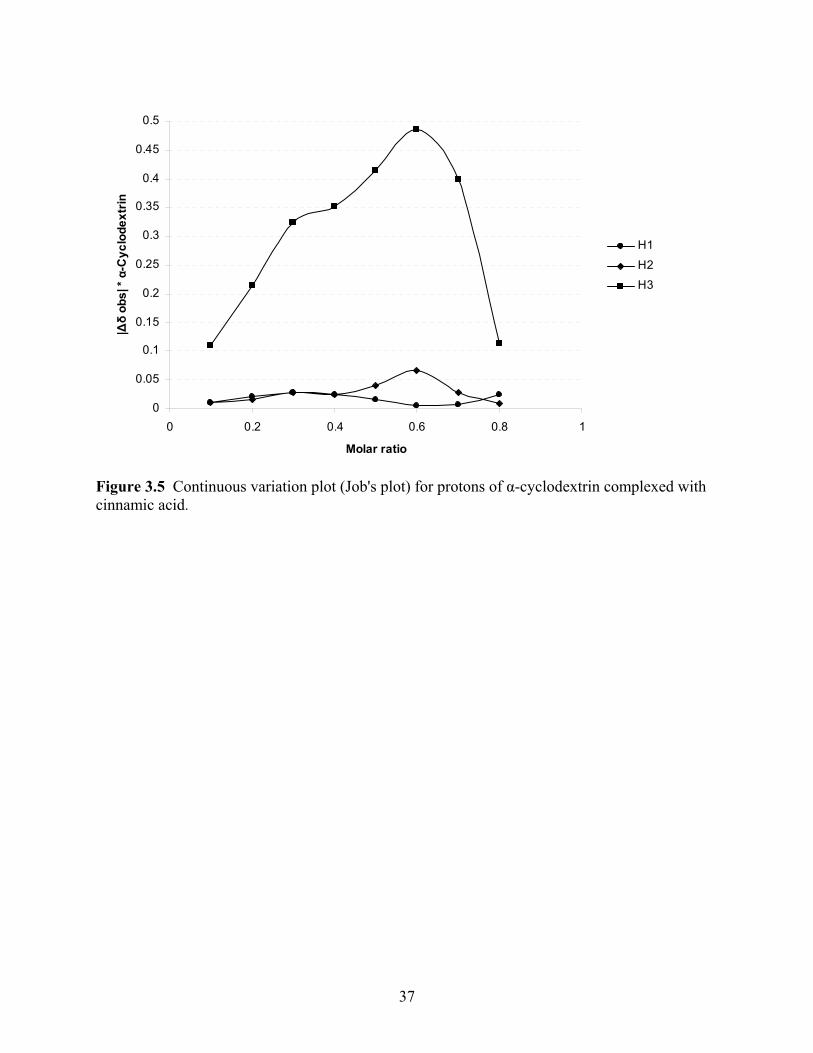
Method of continuous variation
The method of continuous variation yields information regarding the stoichiometry of the
complex (Connors and Rosanske, 1980). Once the spectra were processed and the values of the
peaks were identified, plots of the chemical shifts above 0.5 ppm aqueous soltuion for both
cinnamic acid and α-cyclodextrin were made. The change in shift observed multiplied by the
concentration of cinnamic acid or α-cyclodextrin, depending on the plot, was then plotted against
x, a value denoting an increase in concentration. The plot of the shift observed in α-cyclodextrin
can be seen in Figure 5. As can be seen, there was very little shift of the protons in the α-
cyclodextrin when complexed. As explained above, the shift value was expected due to the
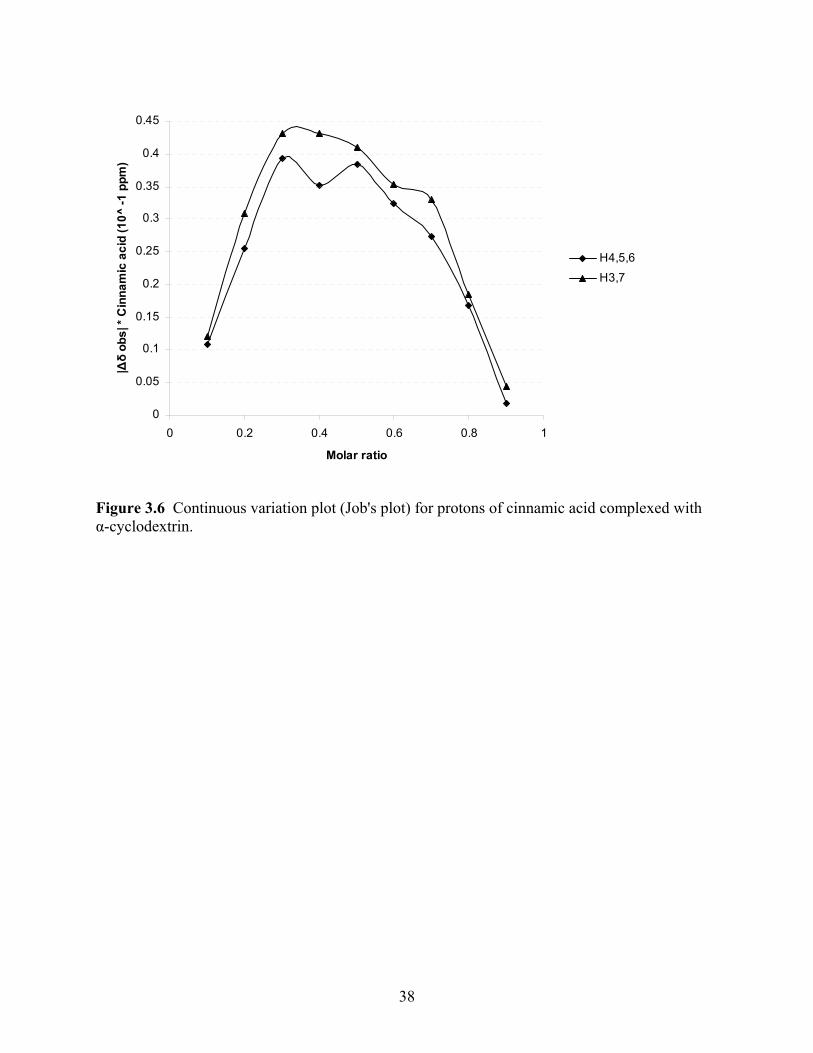
rigidity of the molecule. The molecule of major shift was the guest, cinnamic acid. This
27
cinnamic acid shift can be seen in Figure 6. Cinnamic acid has its major shift with the protons
associated with the benzene molecule. The Job’s plot design was developed to plot the data as a
parabola. Based on the structure of the method as ratio based concentrations of cinnamic acid
and α-cyclodextrin a parabola was expected. The plotted data in Figure 6 show a loosely based
parabola with defined peaks. Each peak, for both proton shifts represented, represent an
individual parabola. Therefore, each proton shift contains the peaks of two overlapping
parabolas. The peaks of shift H4,5,6 are oriented over 0.3 and 0.5. The peaks of shift H3,7 are
positioned over 0.3 and 0.7 on the x-axis. These values are highly significant as the two peaks
suggest a 2:1 stoichiometry. A 1:1 stoichiometry ratio would not be off center from 0.5 as is
shown in Figure 6 (Dodziuk, 2006). A 2:1 stoichiometry is expected of a cinnamic acid: α-
cyclodextrin complex (Dodziuk and others 1999; Rosanske and Connors, 1980). The 2:1
stoichiometry also shows that the host is able to enter at either end of the α-cyclodextrin, and
which end is preferred is unknown (Rosanske and Connors, 1980).
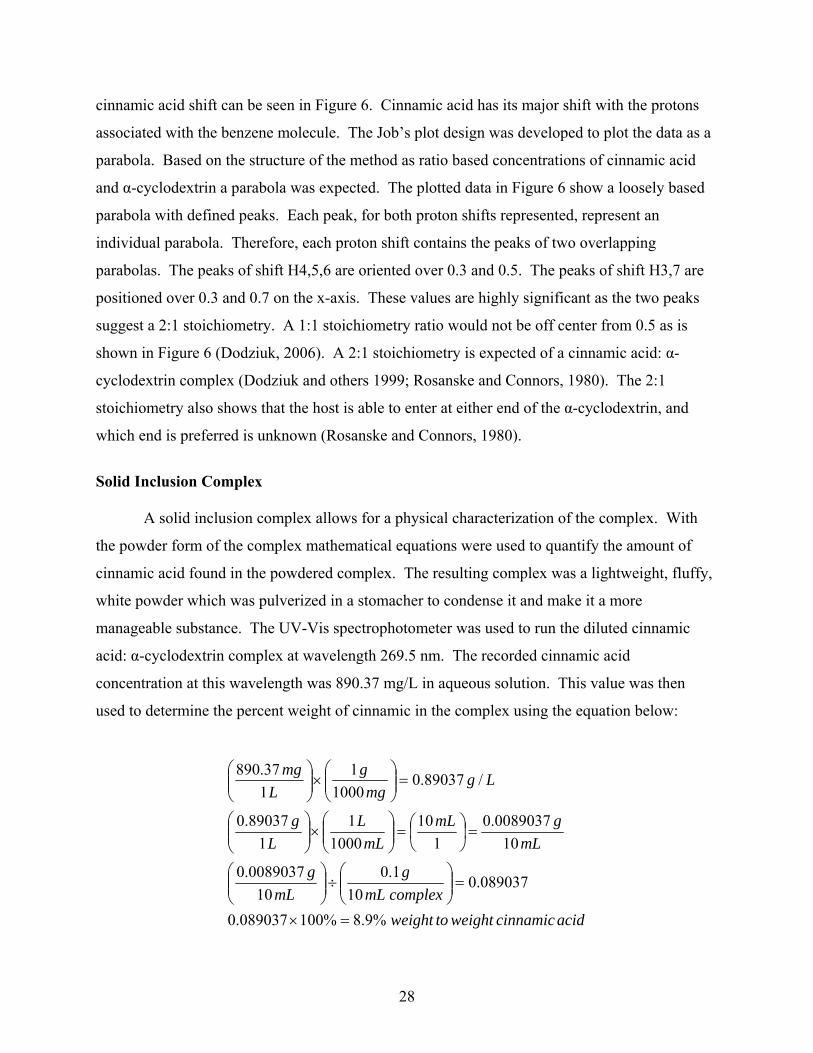
Solid Inclusion Complex A solid inclusion complex allows for a physical characterization of the complex. With
the powder form of the complex mathematical equations were used to quantify the amount of
cinnamic acid found in the powdered complex. The resulting complex was a lightweight, fluffy,
white powder which was pulverized in a stomacher to condense it and make it a more
manageable substance. The UV-Vis spectrophotometer was used to run the diluted cinnamic
acid: α-cyclodextrin complex at wavelength 269.5 nm. The recorded cinnamic acid
concentration at this wavelength was 890.37 mg/L in aqueous solution. This value was then
used to determine the percent weight of cinnamic in the complex using the equation below:
acidcinnamicweighttoweightcomplexmL
gmL
g
mLgmL
mLL
Lg
Lgmg
gL
mg
%9.8%100089037.0
089037.010
1.010
0089037.0
100089037.0
110
10001
189037.0
/89037.01000
1137.890
=×
=⎟⎟⎠
⎞⎜⎜⎝
⎛÷⎟⎟
⎠
⎞⎜⎜⎝
⎛
=⎟⎠⎞
⎜⎝⎛=⎟⎟
⎠
⎞⎜⎜⎝
⎛×⎟⎟⎠
⎞⎜⎜⎝
⎛
=⎟⎟⎠
⎞⎜⎜⎝
⎛×⎟⎟⎠
⎞⎜⎜⎝
⎛
28
Therefore, it was calculated that out of the complex in hand, due to lyophilization, 8.9% weight
to weight in the complex can be attributed to the cinnamic acid. This is expected as the ratio of a
smaller percentage of guest and a larger percent of host is needed to drive the reaction. This
information also contributes to a 2:1 stoichiometry as much more of the α-cyclodextrin must be
present compared to the cinnamic acid to fully coerce the inclusion complex formation. With
this value it is shown that a 2:1 stoichiometry is present and at what weight value the cinnamic
acid is present in comparison to α-cyclodextrin.
29
References Connors KA and Rosanske TW. 1980. trans-Cinnamic acid--alpha-cyclodextrin system as
studied by solubility, spectral, and potentiometric techniques. Journal of Pharmaceutical Sciences 69(2):173-179.
Denadai AM, Teixeira KI, Santoro MM, Pimenta AM, Cortes ME and Sinisterra RD. 2007. Supramolecular self-assembly of beta-cyclodextrin: an effective carrier of the antimicrobial agent chlorhexidine. Carbohydrate Research 342(15):2286-2296.
Dodziuk H, Ejchart A, Lukin O and Vysotsky MO. 1999. 1H and (13)C NMR and Molecular Dynamics Study of Chiral Recognition of Camphor Enantiomers by alpha-Cyclodextrin. The Journal of Organic Chemistry 64(5):1503-1507.
Dodziuk H. 2006. Cyclodextrins and Their Complexes: Chemistry, Analytical Methods, Applications,1 ed.: Wiley-VCH.
FDA. 2006. Data on Benzene in Soft Drinks and Other Beverages. Office of Food Additive Safety, CFSAN, Food and Drug Administration. Received October 2007 from http://www.cfsan.fda.gov/~dms/benzdata.html.
Hashimoto H. 1996. Cyclodextrins in Foods, Cosmetics, and Toiletries. In: Atwood, J. D., JED; MacNicol, DD; Vogtle, F, editor. Comprehensive Supramolecular Chemistry. Yokohama: Pergamon. p. 483-502.
Irwin PL PP, Doner LW, Sapers GM, Brewster JD, Nagahashi G, Hicks KB. 1993. Binding geometry, stoichiometry, and thermodynamics of cyclomalto-oligosaccharide (cyclodextrin) inclusion complex formation with chlorogenic acid, the major substrate of apple polyphenol oxidase. Carbohydrate Research 256:13-27.
Rosanske TW and Connors KA. 1980. Stoichiometric model of alpha-cyclodextrin complex formation. Journal of Pharmaceutical Sciences 69(5):564-567.
30
Tables & Figures Proton Shift (ppm) α-Cyclodextrin (mM) H1 H2 H3 H4 H5 H6a H6b
10 0.000 0.000 0.000 0.000 0.000 0.000 0.000 20 0.002 0.021 0.016 0.004 0.003 0.080 0.002 30 0.002 0.015 0.024 0.013 0.009 0.083 0.006 40 0.003 0.017 0.028 0.015 0.011 0.084 0.008 50 0.003 0.020 0.028 0.017 0.015 0.086 0.010 60 0.003 0.020 0.031 0.018 0.017 0.087 0.012 70 0.004 0.021 0.031 0.020 0.019 0.089 0.013
Table 3.1 Individual proton shift calculations (ppm) of α-cyclodextrin (mM) in the inclusion complex at a set concentration of 1 mM cinnamic acid.
31
Proton Shift (ppm) α-Cyclodextrin (mM) H1 H 4,5,6 H 3,7 H2
0 0.000 0.000 0.000 0.00010 0.050 0.089 0.098 0.05820 0.053 0.105 0.153 0.08930 0.032 0.183 0.186 0.08740 0.031 0.197 0.204 0.08850 0.025 0.197 0.206 0.08660 0.020 0.179 0.190 0.07570 0.020 0.178 0.189 0.075
Table 3.2 Individual proton shift calculations (ppm) of cinnamic acid set at 1 mM over increasing α-cyclodextrin concentrations (mM) within the inclusion complex.
32
0
200
400
600
800
1000
1200
0 0.02 0.04 0.06 0.08 0.1 0.12 0.14 0.16[α-CD] M
[CA
] ppm
Figure 3.1 Phase solubility diagram of α-cyclodextrin: cinnamic acid complex plotting α-cyclodextrin concentration (M) against cinnamic acid concentration (ppm)
33
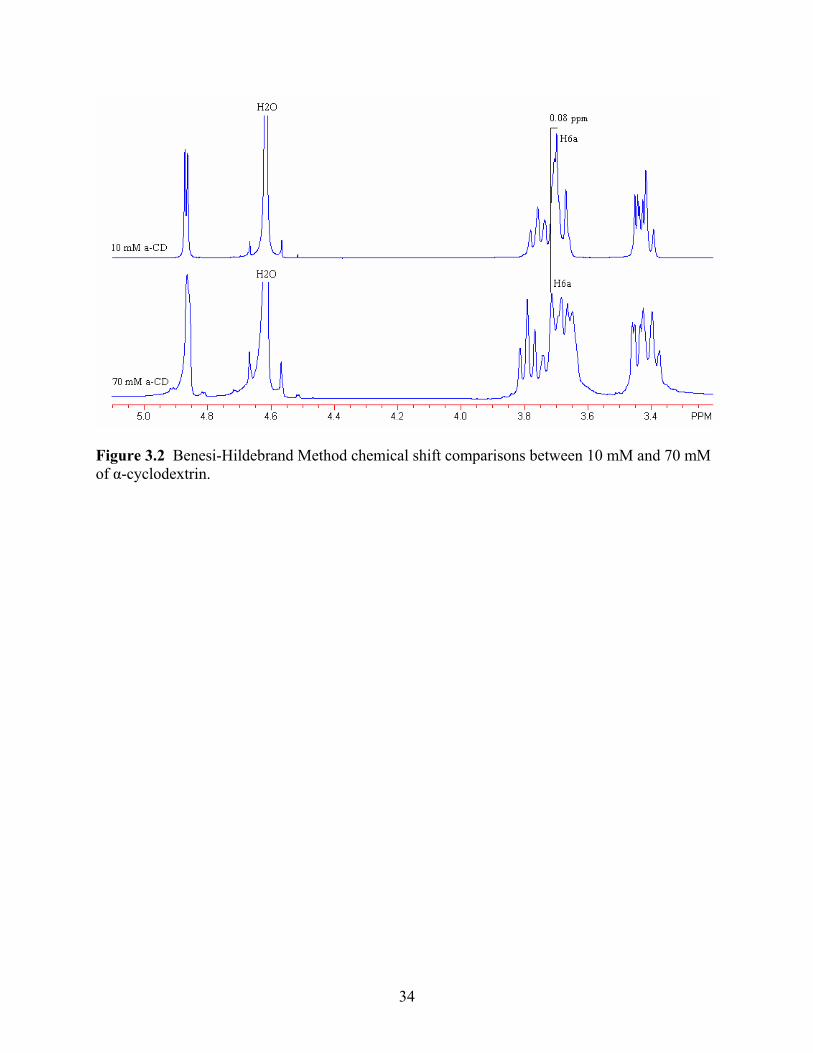
Figure 3.2 Benesi-Hildebrand Method chemical shift comparisons between 10 mM and 70 mM of α-cyclodextrin.
34
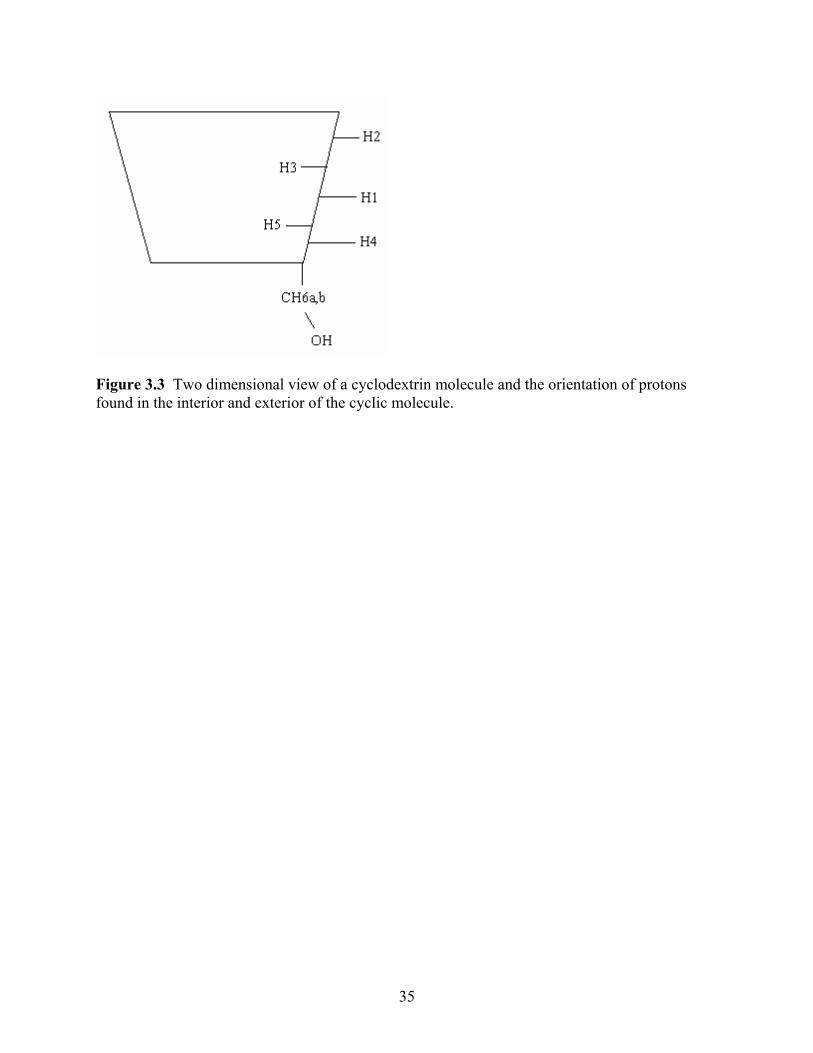
Figure 3.3 Two dimensional view of a cyclodextrin molecule and the orientation of protons found in the interior and exterior of the cyclic molecule.
35
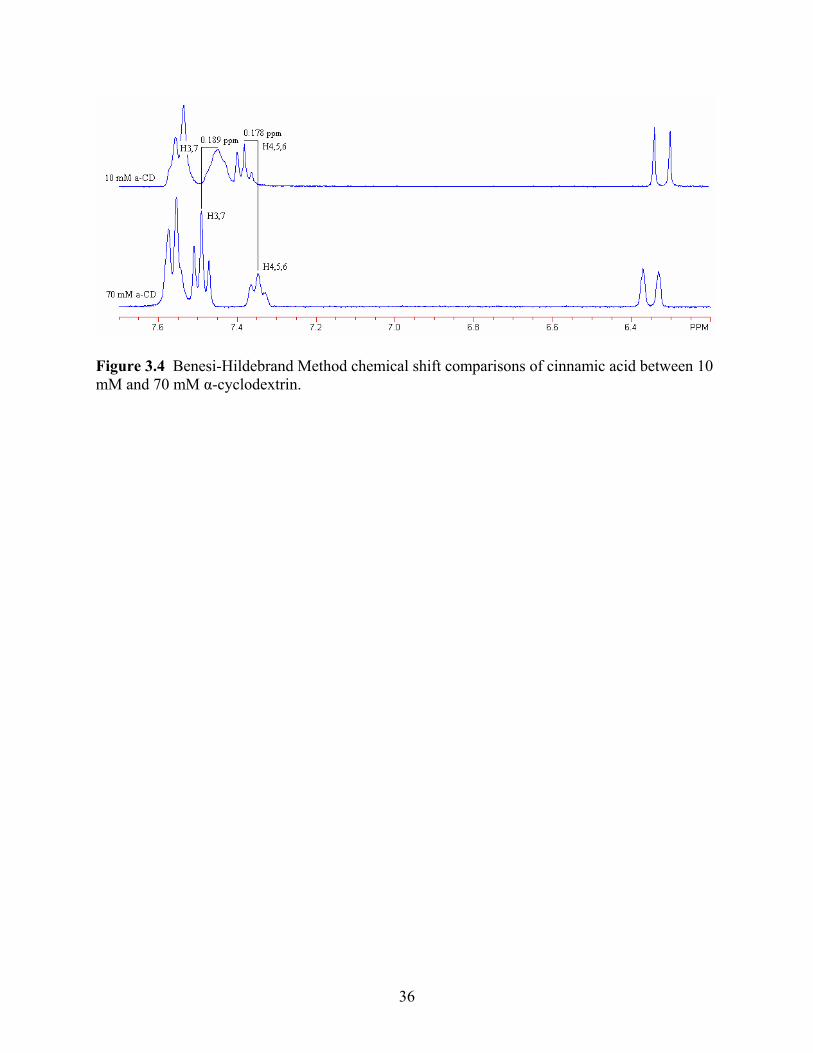
Figure 3.4 Benesi-Hildebrand Method chemical shift comparisons of cinnamic acid between 10 mM and 70 mM α-cyclodextrin.
36
0
0.05
0.1
0.15
0.2
0.25
0.3
0.35
0.4
0.45
0.5
0 0.2 0.4 0.6 0.8 1
Molar ratio
|Δδ
obs|
* α-
Cyc
lode
xtrin
H1
H2
H3
Figure 3.5 Continuous variation plot (Job's plot) for protons of α-cyclodextrin complexed with cinnamic acid.
37
0
0.05
0.1
0.15
0.2
0.25
0.3
0.35
0.4
0.45
0 0.2 0.4 0.6 0.8 1
Molar ratio
|Δδ
obs|
* C
inna
mic
aci
d (1
0^ -1
ppm
)
H4,5,6
H3,7
Figure 3.6 Continuous variation plot (Job's plot) for protons of cinnamic acid complexed with α-cyclodextrin.
38
CHAPTER 4: MICROBIOLICAL STUDIES OF CINNAMIC ACID: α-CYCLODEXTRIN INCLUSION COMPLEXES Abstract Minimum inhibitory concentration studies were performed using cinnamic acid: α-
cyclodextrin inclusion complex and microrganisms Saccharomyces cerevisiae and Paecilomyces
variotii. Three methods were designed to determine the effectiveness of the complex at different
concentrations. The first method tested different inoculation levels against increasing
concentrations of the inclusion complex. Results were highly variable therefore poor indicators
of this method as small aqueous amounts of 4 μL were pulled to be incubated and surveyed for
visible turbidity denoting growth. A second method was designed to mimic this study through
the use of larger sample sizes up to 3 mL for determination of growth. It also restricted the total
colony count amount to 3.3 CFU/mL aqueous solution. This study showed that at the 3.3
CFU/mL inoculation level little to no inhibition ability was seen by the complex at varying
concentrations for both organisms. To test the complex against its guest and host compounds a
third method was designed. This method tested free cinnamic acid against free α-cyclodextrin
against the inclusion complex. Results showed high inhibition of the microorganisms by free
cinnamic acid, no inhibition by free α-cyclodextrin and little to no inhibition by the complex, as
initially seen in Method 2. The limited complex inhibition effects may have been due to the
inability of the complex to deliver the guest effectively to exhibit its antimicrobial effects.
Another theory is due to the presence of α-cyclodextrin in the complex; it may act more as a food
source for the microorganisms, as opposed to an inhibitor.
39
Introduction
With the release of a Food and Drug Administration (FDA) November 2005 study
regarding benzene levels in soft drinks and fruit beverages, a want for a natural antimicrobial
became top priority (CFSAN and Safety, 2006). Benzene, a known carcinogen, was being
produced in the beverages by a breakdown of the preservative sodium benzoate. The dissociation
mechanism of sodium benzoate reacting with ascorbic acid was accelerated by elevated
temperatures and exposure to light resulting in free benzene (CFSAN and Safety, 2006).
Cinnamic acid was the choice of the natural preservative to use but, with a poor solubility of 0.5
g/L in aqueous solution and a poor wettability it necessitated an inclusion complex with α-
cyclodextrin. α-Cyclodextrin was chosen as the host molecule as opposed to cyclodextrins many
other forms, due to its smaller interior diameter, of approximately 5 Å and its solubility of 149
mg/L in a water-based solution (Hashimoto, 1996).
Once complexed with α-cyclodextrin, it is theorized that the cinnamic acid will still be
able to hold its antimicrobial properties. A strong antimicrobial in its powder form, it is now
being used in aqueous form against the two most difficult microorganisms for soft drink and fruit
beverage processing facilities: Saccharomyces cerevisiae, a yeast, and Paecilomyces variotii, a
mold (Deak, 1996; Chambel, 1999; Battey and others, 2002). Three separate methods have been
developed for the experimentation of the effectiveness of the complex. The first method will
determine the ability of the α-cyclodextrin: cinnamic acid complex, at increasing concentrations,
to stunt the growth of both S. cerevisiae and P.variotii. The second method will further study
this same retardation of the microorganisms at a specific level of inoculation as determined by
the processing facility. The third method will compare the effectiveness of the complex against
free cinnamic acid as well as free α-cyclodextrin.
Materials & Methods
Materials. trans-Cinnamic acid of 98 +% purity supplied by Arcos Organics
(Geel, Belgium). α-Cyclodextrin, CAVAMAX® W6 pharma cyclohexaamylose supplied by
Wacker Fine Chemicals (Munich, Germany). Solid inclusion complex supplied by Dina L.
Romano’s research (Blacksburg, Virginia, USA). Saccharomyces cerevisiae yeast culture
supplied by Pepsi Co. (Valhalla, New York, USA). Paecilomyces variotii fungus culture
supplied by Pepsi Co. (Valhalla, New York, USA). Microcentrifuge tubes 0.5 mL with secure
40
closure, supplied by Fisher Scientific (Pittsburg, Pennsylvania, USA). Innova 4230 Refrigerated
incubator shaker (Edison, New Jersey, USA). Premium 100% Pure Apple Juice, 100% Vitamin
C calcium enriched, Pressed from fresh apples, not from concentrate, 64 Fl.oz (1/2 gallon) 1.89
L, Pasteurized supplied by White House (Winchester, Pennsylvania, USA). Alpha-D(+)-
glucose, anhydrous 99+% supplied by Acros Organics (Geel, Belgium). D-Fructose, reagent
grade (crystal) supplied by Fisher Scientific (Fair Lawn, New Jersey, USA). Sucrose (α-D-
Glucopyranosyl; β-D-fructofuranoside; Saccharose; Can Sugar) supplied by Sigma Chemical
Company (St. Louis, Missouri, USA). Malic acid, FG, powder supplied by Presque Isle Wine
Cellars (North East, Pennsylvania, USA). Nylon, 0.45 µm filter tips supplied by Fisher
Scientific (Pittsburg, Pennsylvania, USA). Amsco Eagle 3011-C Gravity Steam Sterilizer
supplied by Steris (Mentor, Ohio, USA). Maxi Mix II Type 37600 Mixer Vortex, 120 Volts, 40
Watts supplied by Barnstead/Thermolyne (Dubuque, Iowa, USA). Research pipettes, 10-100
µL, 100-1000 µL, supplied by Eppendorf (Hamburg, Germany). Redi-Tip pipette tips, 200 µL,
50- 1000 µL supplied by Fisher Scientific (Pittsburg, Pennsylvania, USA).
Minimum Inhibitory Concentration Studies.
Method 1. This method, dilution, and inoculation scheme was supplied by PepsiCo.
Preparation of the media included 900 mL of distilled H2O, 100 mL of preservative-free apple
juice, 46.8 grams D-glucose, 59.4 grams fructose, 1.8 grams D-sucrose. This media was similar
to the beverages a complex would be added to in respects to the pH, °Brix, and titratable acidity.
The media was then stirred with no heat to incorporate all of the ingredients. Because the media
contains such a high level of sugar it could not be autoclaved and was filter sterilized instead.
The pH was taken once all was dissolved and adjusted to a pH of 3.4 using 1 M Malic acid in
aqueous solution. Once the media was prepared it was separated into 200 mL amounts in four
separate bottles with screwtop lids. Each bottle was labeled 1 mM [CA:αCD], 2 mM [CA:αCD],
3 mM [CA:αCD], and 4 mM [CA:αCD]. The appropriate amount of solid inclusion complex
was added to each of these bottles and incubated at 25 ºC at 250 rpm for 24 hours. Once this was
done the test tubes were organized with six test tubes per concentration per microorganism.
Controls were formulated as well with a positive and negative control for both microorganisms.
A standard plate count showed the amount of CFU per 2.7 mL in the aqueous stock solutions of
Saccharomyces cerevisiae and Paecilomyces variotii. This was then used to diagram the dilution
41
scheme found in Figure 1. After the dilutions were made and inoculated, 4 µL of each aqueous
dilution was pipetted into a microcentrifuge tube which was incubated at 25 ºC for five days.
The microcentrifuge tubes were vortexed and visually checked for turbidity daily. A positive
symbol (+) denoted visible turbidity therefore colony growth. A negative symbol (-) denoted no
visible turbidity therefore no colony growth. This procedure was done in duplicate.
Method 2. This method was a modified version of Method 1 as supplied by PepsiCo.
Preparation of the media included 900 mL of distilled H2O, 100 mL of preservative-free apple
juice, 46.8 grams D-glucose, 59.4 grams fructose, 1.8 grams D-sucrose. This media was similar
to the beverages a complex would be added to in respects to the pH, °Brix, and titratable acidity.
The media was then stirred with no heat to incorporate all of the ingredients. The pH was
adjusted to a pH of 3.4 using 1 M malic acid. Once the media was prepared it was separated in
to seven bottles of 200 mL with screwtop lids. Each of these bottles were labeled 1 mM
[CA:αCD], 2 mM [CA:αCD], 3 mM [CA:αCD], and 4 mM [CA:αCD], control with cinnamic
acid and no α-cyclodextrin, control with α-cyclodextrin and no cinnamic acid, and control with
no cinnamic acid and no α-cyclodextrin. The solutions were mixed as defined by the labels.
These aqueous solutions were then placed in the shaker for 24 hours at 25 ºC and 250 rpm. Once
the media was prepared, it was filter sterilized into the test tubes with eight test tubes for each
concentration and two for control media. The dilution schemes can be found in Figure 2. The
final three test tubes, of the same dilution, each contained 3.3 CFU/mL of aqueous
Saccharomyces cerevisiae and Paecilomyces variotii, respectively. These last tubes per
concentration per microorganism inoculated were incubated at 25 ºC for five days. The test
tubes were vortexed and visually checked for turbidity daily. A positive symbol (+) denoted
visible turbidity growth. A negative symbol (-) denoted no visible turbidity therefore no growth.
This procedure was done in triplicate.
Method 3. Preparation of the media included 900 mL of distilled H2O, 100 mL of
preservative-free apple juice, 46.8 grams D-glucose, 59.4 grams fructose, 1.8 grams D-sucrose.
This media was similar to the beverages a complex would be added to in respects to the pH,
°Brix, and titratable acidity. The media was then stirred with no heat to incorporate all of the
ingredients. The pH was taken once all was dissolved and adjusted to a pH of 3.4 using 1 M
42
Malic acid. Once the media was prepared it was divided among 15 glass bottles. One set of five
was labeled free cinnamic acid with each of those bottles divided by concentration of cinnamic
acid alone; 100 ppm, 200 ppm, 300 ppm, 400 ppm, 500 ppm. The second set of five bottles was
labeled free α-cyclodextrin with concentrations of 100 ppm, 200 ppm, 300 ppm, 400 ppm, 500
ppm. The last set of five was labeled [CA:αCD] with concentrations of 100 ppm, 200 ppm, 300
ppm, 400 ppm, 500 ppm. Each bottle was then filled with the appropriate amount of free
cinnamic acid, free α-cyclodextrin, and [CA:αCD] complex, all aqueous solutions. Controls
were formulated as well with a positive and negative control for both microorganisms per
method. These bottles were placed in the mechanical shaker for 24 hours at 25 ºC at 250 rpm.
Once these were all prepared the dilutions were made for each compound, free cinnamic acid
versus free α-cyclodextrin versus the complex, for all concentrations. Each of these were
inoculated with 20 µL aqueous solutions of both Saccharomyces cerevisiae and Paecilomyces
variotii as shown by Figure 3. These last tubes per concentration per microorganism inoculated
were incubated at 25 ºC for five days. The test tubes were vortexed and visually checked for
turbidity daily. A positive symbol (+) denoted visible turbidity therefore colony growth. A
negative symbol (-) denoted no visible turbidity therefore no colony growth. This procedure was
done in triplicate.
Results & Discussion Method 1 After the full incubation period of five days was finished, the overall picture of results
was not as expected. Found in Table 1, results, with a (+) or (-) indication for visible turbidity
therefore growth, seemed to vary drastically and not follow a typical growth pattern as is
expected with microorganisms. The stock solutions were given a plate count for S. cerevisiae of
1.13x10⁷ CFU per five mL stock and for P. variotii of 1.4x10⁶ CFU per five mL stock as
enumerated by PepsiCo. As these values were not verified once received the dilution scheme
became more of an estimate than an exact cell count. It is most commonly expected to see
growth where a majority of cells are found first, followed by a breakthrough of the antimicrobial
compound by the smaller total cell count. For this method, the microcentrifuge tubes inoculated
with the highest number of yeast or fungi cells seemed to show turbidity after those tubes with
fewer known cells, which indicated a possibility of sampling error.
43
Due to such a small amount, 4 μL of aqueous solution, drawn from a sample of up to 3.0
mL aqueous solution, which contained the initial inoculum, there is reason to doubt the proper
sampling of the yeast and mold colonies. The fraction of a sample drawn from the dilution tubes
may not have included the same amount of cells that would better represent the overall
environment that was initially intended. While one sample, which was intended to have to more
cells, may have only picked up the diluent and few yeast or mold cells, another sample may have
done just the opposite. Where there are more cells there is more of a chance for those cells to
proliferate despite inhibition ability by the complex. This pattern, however, was not shown as is
apparent by the results of the experiment. Therefore, the second MIC method was produced to
better represent the contamination of a water-based, acid-adjusted sample.
Method 2 This second method was developed to duplicate the industry acceptable level for yeasts
and molds in beverage processing. Tolerance levels are acceptable for yeasts and molds in
products that have undergone heat treatments as no food product is completely sterile. These
tolerance levels, as stated by PepsiCo., were incorporated in to the dilution/inoculation scheme
matching the upper range of contamination accepted, at 3.3 CFU/mL aqueous solution. A total
plate count was made of the stock solutions prior to use. The plate count for S. cerevisiae was
3.7x10⁶ CFU per mL stock and for P. variotii of 1.13x10⁷ CFU per mL stock. Once incubated
for the full five days the overall results showed little microbial inhibition, shown in Table 2.
Although the higher concentrations of the complex yielded better inhibition power against both
S. cerevisiae and P.variotii it could not maintain its inhibition longer than three to four days. In
the food industry, this is a short shelf-life, especially for beverage life. One study shows that
complexing with cyclodextrin led to a decrease in antimicrobial ability with every
microorganism used in the investigation (Kral'ova and Bujdakova, 1996). It has also stated that
an excess of cyclodextrin in the solution leads to complete elimination of antimicrobial ability
(Kral'ova and Bujdakova, 1996). One study states the reasoning behind this low to no inhibition
ability is due to the inclusion complexes being unable to penetrate through the cell membranes
leaving the effector incapable of reaching the necessary site of inhibition (Kral'ova and
Bujdakova, 1996). This may also have been the case in the low inhibition power of the cinnamic
44
acid: α-cyclodextrin inclusion complex tested as the conformation of the cinnamic acid within
the α-cyclodextrin molecule cannot be completely defined.
The complex itself, at varying concentrations, showed a positive trend toward a higher
level of inhibition ability with a higher concentration of complex. This positive trend was as
expected but the fact that it did not inhibit the yeast or mold more than five days was
disappointing. It has been shown in past studies that levels of free cinnamic acid, when added to
an aqueous solution, exhibit antimicrobial properties though only to inhibit the maximum growth
of Saccharomyces cerevisiae (Chambel, 1999). Using small concentration levels of lower than 1
mM it only showed enough inhibition of S. cerevisiae to slow its growth, not to completely
inhibit it (Chambel, 1999). Other studies have shown weak inhibition of up to 50% of the
bacteria in question, namely E. coli and B. subtilis (Sheu and others, 1975). Studies have shown
that inhibition ability has come from cinnamic acid in its powder form, not in aqueous form, in
the presence of spoilage microorganisms on fruit slices (Roller and Seedhar, 2002). Free
cinnamic acid showed potential in the study, though concentrations could be much higher as it
was not dissolved in water or a solvent to aid in solubility (Roller and Seedhar, 2002). Although
these studies show potential for cinnamic acid alone they do not show cinnamic acid working in
tandem with α-cyclodextrin. With cinnamic acid complexed to increase solubility this led to the
development of the third method for the MIC studies.
Method 3 Method 3 was designed to compare the antimicrobial abilities of the complex against free
cinnamic acid as well as free α-cyclodextrin. The importance of this study was to take all of the
literature, which stated the benefits of free cinnamic acid as an antimicrobial and compare this
data against Method 2 of this study, which showed little inhibition power by the complex. The
method also allowed for a maximum of 500 ppm of free cinnamic acid in solution. The results,
summarized in Table 3, showed the difference between their abilities. A total plate count was
made of the stock solutions prior to use. The plate count for S. cerevisiae was 3.7x10⁶ CFU per
mL stock and for P. variotii of 1.13x10⁷ CFU per mL stock.
As can be seen in Table 3, free cinnamic acid showed antimicrobial abilities against both
S. cerevisiae and P. variotii. Although smaller parts per million (ppm) measurements of the
compounds were used due to solubility restraints of the free cinnamic acid, a comparison can be
45
made. Over the five day period no growth was seen from the test tubes inoculated with either
yeast or mold in the free cinnamic acid tubes. The ability of the free cinnamic acid to inhibit
both S. cerevisiae and P. variotii was just as purposed by literature (Burt, 2004; Castelli and
others 1999; Guerzoni and others 1990). All of these studies showed that free cinnamic acid
could be used as an effective antimicrobial. Much of that data was derived from the powder
form of the compound as opposed to aqueous solution, which is an interesting point and could be
studied further.
Table 3 also shows the results of the test conducted with free α-cyclodextrin. These
results were not a surprise as α-cyclodextrin has no antimicrobial properties whatsoever. These
samples showed turbidity denoting growth as early as day two of the experiment giving the yeast
and mold more of a food source than a preservative effect. Although α-cyclodextrin has many
important properties dealing with solubility, protection from oxidation, stability, etc., the results
were expected as no antimicrobial properties have been attributed to α-cyclodextrin (Connors,
1997; Hashimoto, 1996).
For the cinnamic acid: α-cyclodextrin complex results, they exhibited similar behavior to
that of the previous method as far as the time the tubes lasted before visible turbidity was
demonstrated. Although the two method’s results are similar, it does show that the free cinnamic
acid is much more effective as an antimicrobial than the complex itself. Though further studies
could be designed to look at this more closely, it is possible that the α-cyclodextrin itself is
affecting the antimicrobial properties of the complex. Although it aids drastically in the
solubility of the cinnamic acid it could be acting as a starchy food source for the yeast and molds
it is trying to inhibit. One study showed that β-cyclodextrin, when complexed with
hydroxypropyl, also showed a reduction in the antimicrobial properties of the complex (Lehner
and others 1994). Low concentrations of the complex showed no inhibition of the
microorganisms and at higher concentrations minimal inhibition of the microorganisms was
shown with no damage to the bacteria itself observed (Lehner and others, 1994). This study also
used relatively low inoculation levels, similar to the present methodology, and still low inhibition
ability was seen when the antimicrobial compound was complexed with cyclodextrin (Lehner
and others, 1994). The study theorized that the reason for poor inhibition power when
complexed was due to the poor bond strength of the molecules. On the other hand, this study
also showed that a Gram-positive bacteria, S. aureus, showed complex inhibition ability due to
46

its gram orientation (Lehner and others, 1994). S. cerevisiae is a Gram-positive yeast with
Gram-negative spores. If the Gram-positive trend held true it would seem there would be an
increase in the complex inhibition power, due to the complex interaction with the cell wall. The
inhibition, however, was not seen.
47
References Battey AS, Duffy S and Schaffner DW. 2002. Modeling yeast spoilage in cold-filled ready-to-
drink beverages with Saccharomyces cerevisiae, Zygosaccharomyces bailii, and Candida lipolytica. Applied and Environmental Microbiology 68(4):1901-1906.
Burt S. 2004. Essential oils: their antibacterial properties and potential applications in foods--a review. International Journal of Food Microbiology 94(3):223-253.
Castelli F, Uccella N, Trombetta D and Saija A. 1999. Differences between coumaric and cinnamic acids in membrane permeation as evidenced by time-dependent calorimetry. Journal of Agricultural and Food Chemistry 47(3):991-995.
Chambel AV, CA; Sa-Correia, I. 1999. Effect of cinnamic acid on the growth and on plasma membrane H+-ATPase activity of Saccharomyces cerevisiae. International Journal of Food Microbiology 50:173-179.
Connors KA. 1997. The Stability of Cyclodextrin Complexes in Solution. Chemical Reviews 97(5):1325-1358.
Deak T, Beuchat, L.R. 1996. Handbook of Food Spoilage Yeasts. CRC Press. FDA. 2006. Data on Benzene in Soft Drinks and Other Beverages. Office of Food Additive
Safety, CFSAN, Food and Drug Administration. Received October 2007 from http://www.cfsan.fda.gov/~dms/benzdata.html.
Guerzoni ME, Gardini F and Duan J. 1990. Interactions between inhibition factors on microbial stability of fruit-based systems. International Journal of Food Microbiology 10(1):1-18.
Hashimoto H. 1996. Cyclodextrins in Foods, Cosmetics, and Toiletries. In: Atwood, MacNicol, DD; Vogtle, F, editor. Comprehensive Supramolecular Chemistry. Yokohama: Pergamon. p. 483-502. Kral'ova K and Bujdakova H. 1996. Effect of beta-cyclodextrin on antimicrobial and
photosynthesis inhibiting activity of the cationic surfactant N,N'-bis[4-(4-tert.butylphenoxy)butyl-dimethyl]-1,6-hexanediammonium dibromide. Die Pharmazie 51(8):606-608.
Lehner SJ, Muller BW and Seydel JK. 1994. Effect of hydroxypropyl-beta-cyclodextrin on the antimicrobial action of preservatives. The Journal of Pharmacy and Pharmacology 46(3):186-191.
Roller S and Seedhar P. 2002. Carvacrol and cinnamic acid inhibit microbial growth in fresh-cut melon and kiwifruit at 4 degrees and 8 degrees C. Letters in Applied Microbiology 35(5):390-394.
Sheu CW, Salomon D, Simmons JL, Sreevalsan T and Freese E. 1975. Inhibitory effects of lipophilic acids and related compounds on bacteria and mammalian cells. Antimicrobial Agents and Chemotherapy 7(3):349-363.
48
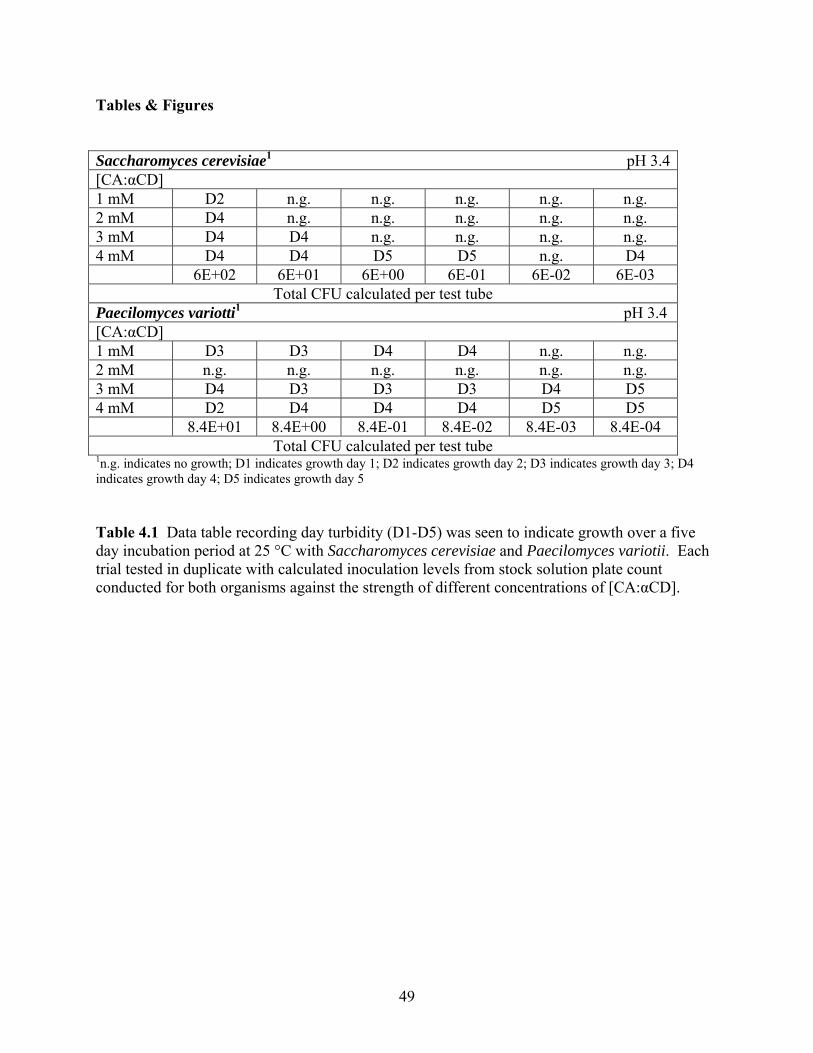
Tables & Figures Saccharomyces cerevisiae1 pH 3.4[CA:αCD] 1 mM D2 n.g. n.g. n.g. n.g. n.g. 2 mM D4 n.g. n.g. n.g. n.g. n.g. 3 mM D4 D4 n.g. n.g. n.g. n.g. 4 mM D4 D4 D5 D5 n.g. D4 6E+02 6E+01 6E+00 6E-01 6E-02 6E-03
Total CFU calculated per test tube Paecilomyces variotti1 pH 3.4 [CA:αCD] 1 mM D3 D3 D4 D4 n.g. n.g. 2 mM n.g. n.g. n.g. n.g. n.g. n.g. 3 mM D4 D3 D3 D3 D4 D5 4 mM D2 D4 D4 D4 D5 D5 8.4E+01 8.4E+00 8.4E-01 8.4E-02 8.4E-03 8.4E-04
Total CFU calculated per test tube 1n.g. indicates no growth; D1 indicates growth day 1; D2 indicates growth day 2; D3 indicates growth day 3; D4 indicates growth day 4; D5 indicates growth day 5 Table 4.1 Data table recording day turbidity (D1-D5) was seen to indicate growth over a five day incubation period at 25 °C with Saccharomyces cerevisiae and Paecilomyces variotii. Each trial tested in duplicate with calculated inoculation levels from stock solution plate count conducted for both organisms against the strength of different concentrations of [CA:αCD].
49
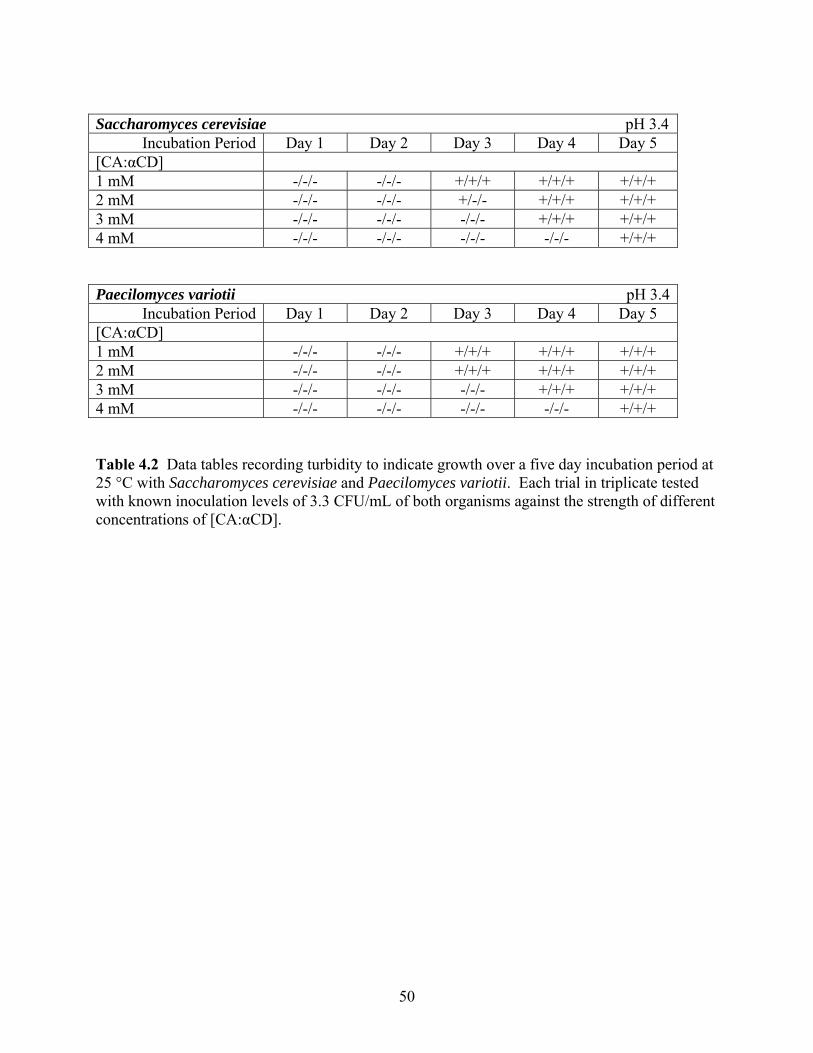
Saccharomyces cerevisiae pH 3.4
Incubation Period Day 1 Day 2 Day 3 Day 4 Day 5 [CA:αCD] 1 mM -/-/- -/-/- +/+/+ +/+/+ +/+/+ 2 mM -/-/- -/-/- +/-/- +/+/+ +/+/+ 3 mM -/-/- -/-/- -/-/- +/+/+ +/+/+ 4 mM -/-/- -/-/- -/-/- -/-/- +/+/+ Paecilomyces variotii pH 3.4
Incubation Period Day 1 Day 2 Day 3 Day 4 Day 5 [CA:αCD] 1 mM -/-/- -/-/- +/+/+ +/+/+ +/+/+ 2 mM -/-/- -/-/- +/+/+ +/+/+ +/+/+ 3 mM -/-/- -/-/- -/-/- +/+/+ +/+/+ 4 mM -/-/- -/-/- -/-/- -/-/- +/+/+ Table 4.2 Data tables recording turbidity to indicate growth over a five day incubation period at 25 °C with Saccharomyces cerevisiae and Paecilomyces variotii. Each trial in triplicate tested with known inoculation levels of 3.3 CFU/mL of both organisms against the strength of different concentrations of [CA:αCD].
50
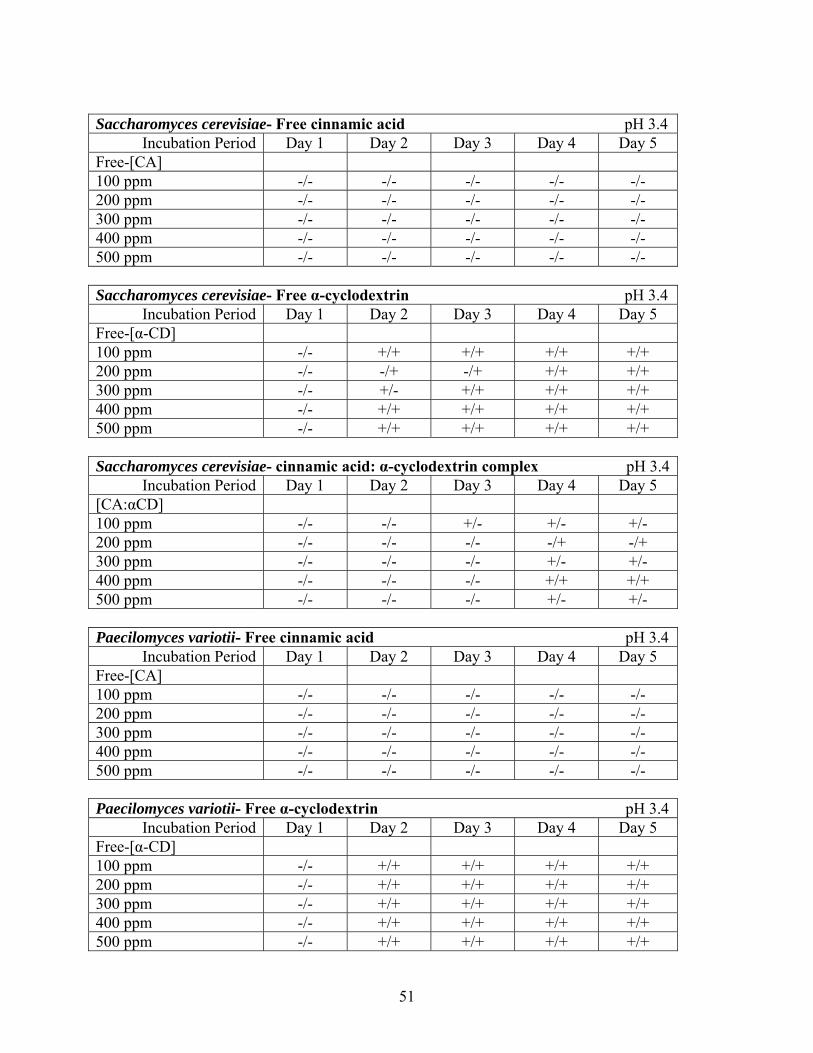
Saccharomyces cerevisiae- Free cinnamic acid pH 3.4
Incubation Period Day 1 Day 2 Day 3 Day 4 Day 5 Free-[CA] 100 ppm -/- -/- -/- -/- -/- 200 ppm -/- -/- -/- -/- -/- 300 ppm -/- -/- -/- -/- -/- 400 ppm -/- -/- -/- -/- -/- 500 ppm -/- -/- -/- -/- -/- Saccharomyces cerevisiae- Free α-cyclodextrin pH 3.4
Incubation Period Day 1 Day 2 Day 3 Day 4 Day 5 Free-[α-CD] 100 ppm -/- +/+ +/+ +/+ +/+ 200 ppm -/- -/+ -/+ +/+ +/+ 300 ppm -/- +/- +/+ +/+ +/+ 400 ppm -/- +/+ +/+ +/+ +/+ 500 ppm -/- +/+ +/+ +/+ +/+ Saccharomyces cerevisiae- cinnamic acid: α-cyclodextrin complex pH 3.4
Incubation Period Day 1 Day 2 Day 3 Day 4 Day 5 [CA:αCD] 100 ppm -/- -/- +/- +/- +/- 200 ppm -/- -/- -/- -/+ -/+ 300 ppm -/- -/- -/- +/- +/- 400 ppm -/- -/- -/- +/+ +/+ 500 ppm -/- -/- -/- +/- +/- Paecilomyces variotii- Free cinnamic acid pH 3.4
Incubation Period Day 1 Day 2 Day 3 Day 4 Day 5 Free-[CA] 100 ppm -/- -/- -/- -/- -/- 200 ppm -/- -/- -/- -/- -/- 300 ppm -/- -/- -/- -/- -/- 400 ppm -/- -/- -/- -/- -/- 500 ppm -/- -/- -/- -/- -/- Paecilomyces variotii- Free α-cyclodextrin pH 3.4
Incubation Period Day 1 Day 2 Day 3 Day 4 Day 5 Free-[α-CD] 100 ppm -/- +/+ +/+ +/+ +/+ 200 ppm -/- +/+ +/+ +/+ +/+ 300 ppm -/- +/+ +/+ +/+ +/+ 400 ppm -/- +/+ +/+ +/+ +/+ 500 ppm -/- +/+ +/+ +/+ +/+
51
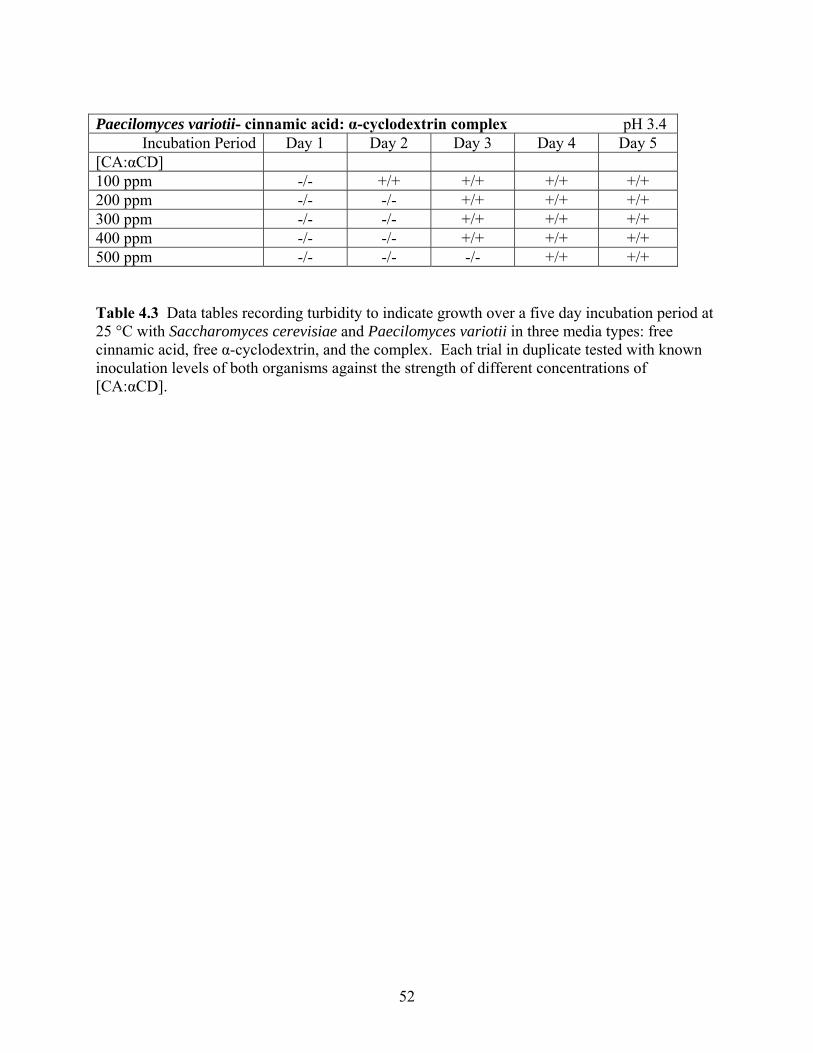
Paecilomyces variotii- cinnamic acid: α-cyclodextrin complex pH 3.4
Incubation Period Day 1 Day 2 Day 3 Day 4 Day 5 [CA:αCD] 100 ppm -/- +/+ +/+ +/+ +/+ 200 ppm -/- -/- +/+ +/+ +/+ 300 ppm -/- -/- +/+ +/+ +/+ 400 ppm -/- -/- +/+ +/+ +/+ 500 ppm -/- -/- -/- +/+ +/+ Table 4.3 Data tables recording turbidity to indicate growth over a five day incubation period at 25 °C with Saccharomyces cerevisiae and Paecilomyces variotii in three media types: free cinnamic acid, free α-cyclodextrin, and the complex. Each trial in duplicate tested with known inoculation levels of both organisms against the strength of different concentrations of [CA:αCD].
52
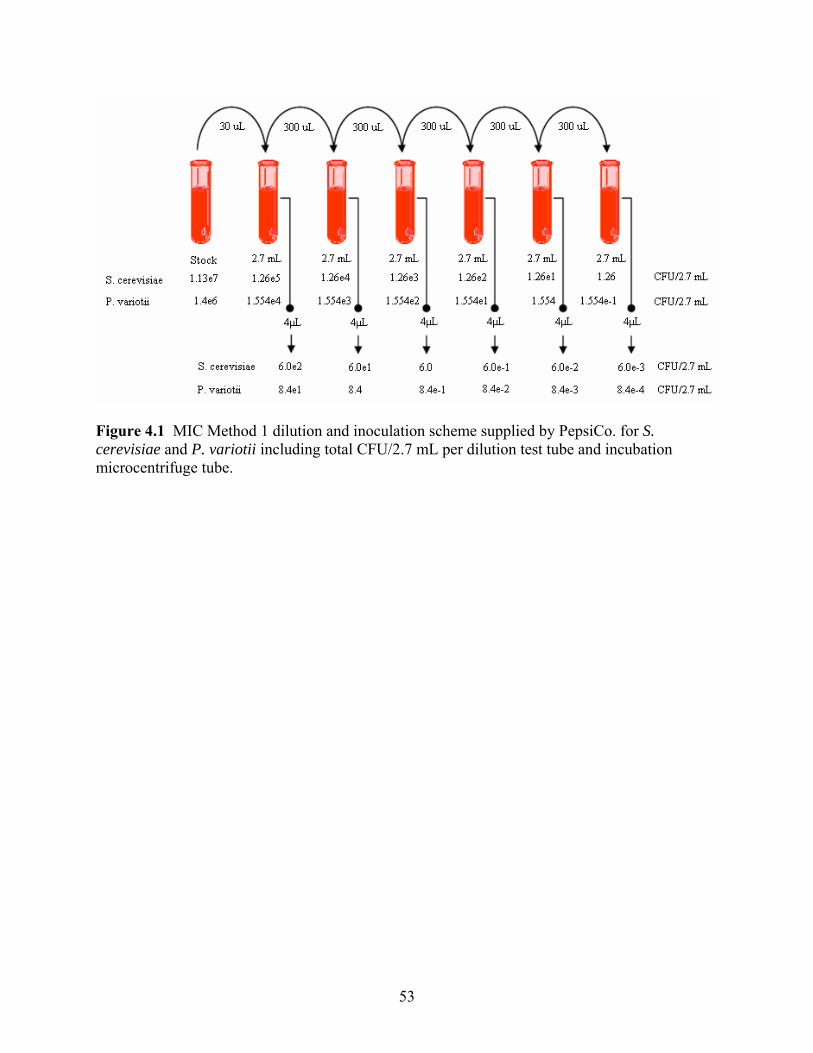
Figure 4.1 MIC Method 1 dilution and inoculation scheme supplied by PepsiCo. for S. cerevisiae and P. variotii including total CFU/2.7 mL per dilution test tube and incubation microcentrifuge tube.
53
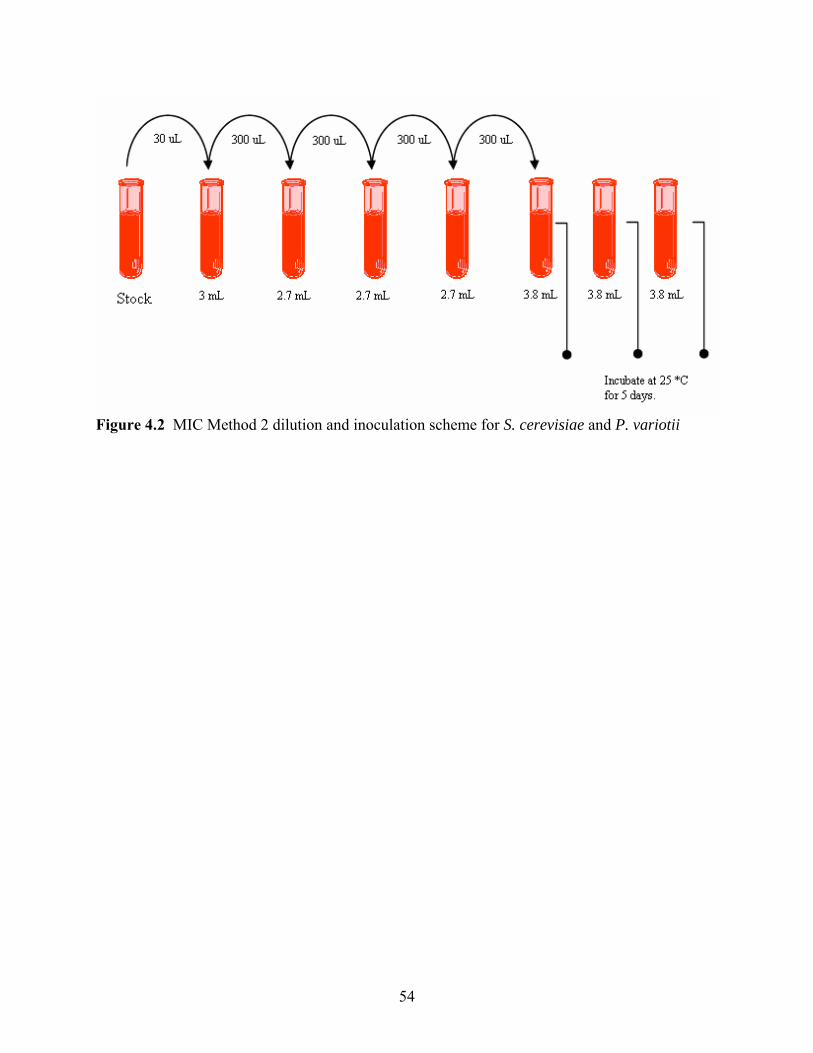
Figure 4.2 MIC Method 2 dilution and inoculation scheme for S. cerevisiae and P. variotii
54
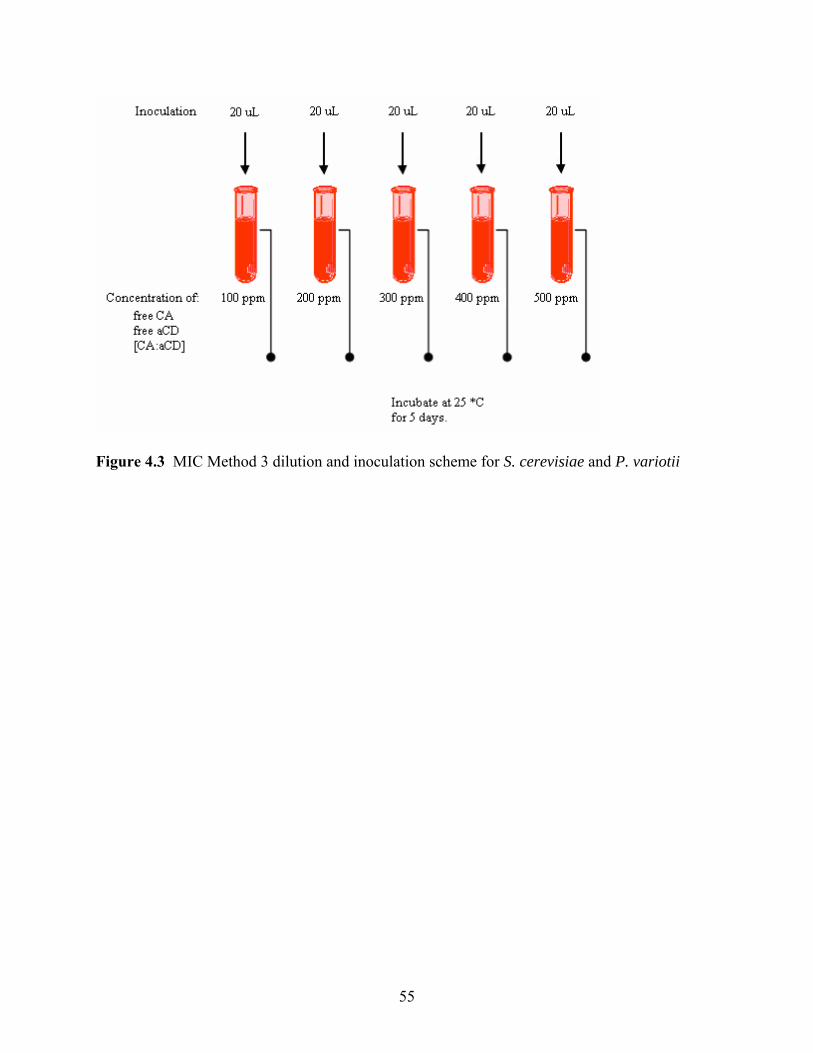
Figure 4.3 MIC Method 3 dilution and inoculation scheme for S. cerevisiae and P. variotii
55

![Structure Elucidation of Benzhexol-β-Cyclodextrin Complex ... · of inclusion complex, but also provides information useful for detailed structure elucidation of the complex [13].](https://static.fdocument.org/doc/165x107/5e7e1d38e07ed352d60daf63/structure-elucidation-of-benzhexol-cyclodextrin-complex-of-inclusion-complex.jpg)