Characterization of β-cell Specific Knockout of UCP2 · Schematic diagram of the RIP-Cre transgene...
84
Characterization of β-cell Specific Knockout of UCP2 By Sobia Sultan A thesis submitted in conformity with the requirements for the degree of Masters of Science Graduate Department of Physiology University of Toronto © Copyright by Sobia Sultan (2010)
Transcript of Characterization of β-cell Specific Knockout of UCP2 · Schematic diagram of the RIP-Cre transgene...
Characterization of β-cell Specific Knockout of UCP2
By
Sobia Sultan
A thesis submitted in conformity with the requirements
for the degree of Masters of Science
Graduate Department of Physiology
University of Toronto
© Copyright by Sobia Sultan (2010)
ii
Abstract Characterization of β-cell Specific Knockout of UCP2
Sobia Sultan
MSc. Thesis 2010
Department of Physiology
University of Toronto
The whole body UCP2 knockout (UCP2−/−) have enhanced insulin secretion and higher ATP
content. However, these changes could be due to indirect effects of extra-pancreatic deletion and
therefore, generating beta-cell specific knockout mice (UCP2BKO) is essential. A 90%
knockdown of UCP2 protein was observed in beta-cells of UCP2BKO mice. No significant
differences were observed in body weight accumulation, fasting blood glucose, plasma insulin or
glucagon. UCP2BKO had impaired oral glucose tolerance with no differences in insulin
secretion or sensitivity. Enhanced ROS accumulation was observed in the beta-cells of
UCP2BKO and upregulation of antioxidant enzyme genes. Morphometric analysis showed an
increased glucagon positive area in the pancreata of UCP2BKO mice. Results obtained from
UCP2BKO were contrary to the phenotype observed in UCP2−/− mice. Overall, the
characterization of UCP2BKO demonstrates that UCP2 in the beta-cell is involved in modulating
ROS production.

iii
Acknowledgements:
I would like to extend my deepest gratitude to my supervisor, Dr. Michael B. Wheeler for giving
me the opportunity to work on this project and for his ongoing support throughout my graduate
studies. I would also like to thank Dr. Emma M. Allister for being my mentor and guiding me
through every large and small endeavor.
Furthermore, I would like to thank all the past and present members of the Wheeler lab for their
invaluable recommendations.
I am grateful for my supervisory committee members; Drs. Adria Giacca, Dominic Ng and Dr.
Herbert Y. Gaisano for their important discussions.
I would also like to thank the Banting and Best Diabetes Centre for funding my research over the
years of 2008-2009.
Lastly, I would like to thank my grandmother, parents, and the rest of my family members who
have continued to support me throughout the years. Your love and guidance has made me a
better person.
iv
Table of Contents: Pg. No.
Abstract ii
Acknowledgements iii
Table of Contents iv
List of abbreviations viii
List of figures x
Chapter 1: Introduction
1.1 Diabetes Mellitus 1
1.1.1 The Epidemic 1
1.1.2 Type 2 Diabetes Mellitus: description of the pathophysiology 2
1.2 Glucose Homeostasis 4
1.3 Glucose-Stimulated Insulin Secretion 6
1.3.1 Glucose metabolism 6
1.3.2 Insulin secretion via ATP production 7
1.3.3 Insulin secretion: Amplification Pathway 9
1.4 Uncoupling Proteins 10
1.4.1 UCP1 10
1.4.2 UCP3 11
1.4.3 UCP2 11
1.4.4 Role of UCP2 in insulin secretion and glucose homeostasis 12
1.4.5 UCP2: Modulation of ROS & Cytoprotection 14
1.4.6 Alternate functions of UCP2 17
1.5 Cre-Lox Recombination system 19
1.5.1 Background 19
1.5.2 RIP-Cre model 20
1.6 General Hypothesis 22
v
Table of Contents Con’t: Pg. No.
Chapter 2: Creation and In Vivo characterization of UCP2BKO 2.1 Hypothesis 23
2.2 Method and Materials 23
2.2.1 Reagents 23
2.2.2 Animal Breeding 23
2.2.3 Pancreatic islet isolation and culture 25
2.2.4 Islet cell dispersion 25
2.2.5 RNA extraction & Reverse Transcription of animal tissues 26
2.2.6 DNA extraction & Multiplex PCR 26
2.2.7 Real-time PCR 26
2.2.8 Immunostaining and immunofluorescence confocal microscopy 26
2.2.9 Weight & Blood glucose measurements 27
2.2.10 Measurement of fasting plasma glucagon 27
2.2.11 Measurement of glucose tolerance 28
2.2.12 Measurement of insulin sensitivity 28
2.2.13 Statistical Analysis 28
2.3 Results 29
2.3.1 Genotyping 29
2.3.2 Cre mRNA expression 21
2.3.3 Effective deletion of UCP2 mRNA & protein 30
2.3.4 Body Mass & Fasting Blood Glucose 32
2.3.5 Plasma Insulin and Plasma Glucagon 33
2.3.6 Assessing Glucose Tolerance: ipGTT & OGTT 35
2.3.7 ITT 38
Chapter 3: Characterization of UCP2βKO: In Vitro Analysis 3.1 Hypothesis 40
3.2 Method and Materials 40
vi
Table of Contents Con’t: Pg. No.
3.2.1 Reagents 40
3.2.2 Animals 40
3.2.3 Analysis of Membrane Potential 41
3.2.4 Analysis of ATP levels in β cells 41
3.2.5 Measurement of glucose stimulated insulin secretion 41
3.2.6 Pancreatic islet morphology 42
3.2.7 Measurement of ROS 42
3.2.8 Evaluating the mRNA expression of Anti-oxidant enzymes in β-cells 42
3.2.9 Statistical Analysis 43
3.3 Results 43
3.3.1 Membrane Potential 43
3.3.2 ATP Levels 45
3.3.3 Glucose Stimulated Insulin Secretion 45
3.3.4 Islet Area 46
3.3.5 Beta Cell area 47
3.3.6 Alpha Cell area 48
3.3.7 ROS accumulation 49
3.3.8 Anti-oxidant enzyme expression in β cells 50
Chapter 4: Discussion & Conclusion 4.1 Summary of findings 52
4.1.1 In Vivo Findings 52
4.1.2 In Vitro Findings 52
4.2 General Discussion 53
4.2.1 UCP2BKO in comparison to previous global knockout models 53
4.2.2 UCP2BKO and Oxidative Stress 57
4.2.3 UCP2BKO and α-cell area 58
4.2.4 UCP2BKO and impaired glucose tolerance 60
vii
Table of Contents Con’t: Pg. No.
4.3 Future Directions 62
4.3.1 UCP2 in the Hypothalamus 62
4.3.3 UCP2BKO on a High-Fat Diet 63
4.4 Conclusions 64
Reference List 66
viii
List of Abbreviations
ADP – adenosine diphosphate
ANOVA – analysis of variance
ATP – adenosine triphosphate
BP - basepair
cDNA – complementary deoxyribonucleic acid
CNS – central nervous system
DM – Diabetes Mellitus
DCF – dicholorofluorescein
DNA – deoxyribose nucleic acid
EDTA – ethylenediaminetetraacetic acid
EGTA – ethylene glycol tetraacetic acid
ELISA – enzyme-linked immunosorbent assays
ETC – electron transport chain
FAD – flavin adenine dinucleotide
FFA – free fatty acids
FBS – fetal bovine serum
FITC – Fluorescein isothiocyanate
G-6-P – glucose-6-phosphate
GDP – guanosine diphosphate
GLUT – glucose transporter
GSIS – glucose-stimulated insulin secretion
mRNA – messenger ribosomal nucleic acid
NAD – nicotinamide adenine dinucleotide
NLS – nuclear localization signal
NO – nitric oxide
PI – propidium iodide
PBS – phosphate buffered soluton
PDX-1 – pancreatic-duodenal homeobox factor-1
PPAR-γ – peroxisome proliferator-activated receptor
RFU – relative fluorescence unit
ix
RIA – radioimmunoassay
RIP – Rat Insulin Promoter
RNA - ribosomal nucleic acid
ROS – reactive oxygen species
RPMI – Roswell Park Memorial Institute
SREBP-1c – Sterol Regulatory Element Binding Protein-1c
STZ – streptozotocin
TCA cycle – tricarboxylic acid cycle
UCP – uncoupling protein
UCP2 – uncoupling protein-2
UCP2BKO – beta-cell specific knockout of UCP2
VDCC – voltage dependent calcium channel
WHO – World Health Organization
x
List of Figures & Tables
Figures:
1. Control of Glucose Homeostasis in the Body
2. Insulin Secretion in the Beta-Cell
3. Structure of a generic uncoupling protein
4. UCP2 in the Mitochondria
5. UCP2 as a negative regulator of insulin secretion
6. Proposed role of UCP2 in cytoprotection
7. Cre-mediated DNA recombination
8. Schematic diagram of the RIP-Cre transgene
9. Recombination via Cre recombinase
10. Genotyping for LoxUCP2 and Cre
11. Cre expression in cDNA of multiple tissues
12. Gene expression for UCP2
13. UCP2 protein expression in islets
14. Weekly body weight measurements
15. Fasting blood glucose measurements
16. Fasting Plasma Insulin levels
17. Fasting Plasma Glucagon
18. Glucose Tolerance Test; ipGTT
19. Glucose Tolerance Test; OGTT
20. Glucose-stimulated insulin secretion
21. Intraperitoneal insulin tolerance tests
22. Mitochondrial membrane potential
23. Islet ATP content
24. In vitro GSIS
xi
25. Islet Area
26. Pancreatic Beta-cell area
27. Pancreatic Alpha-cell area
28. ROS accumulation
29. Gene expression of anti-oxidant enzymes
30. Proposed explanation of the phenotype
Tables:
1. The functional role of antioxidant enzymes in the pancreatic beta cell
2. UCP2 and Islet Function
3. Primer sequences for genotyping and RT PCR
4. Primer sequences for RT-PCR of Anti-oxidant enzymes
5. Comparison of UCP2BKO to the UCP2 whole body knockout models
1
Chapter 1: Introduction
1.1 Diabetes Mellitus
1.1.1 The Epidemic
With an estimated 180 Million people afflicted and the number most likely to double by
the year 2030, Diabetes Mellitus (DM) is an epidemic that will cause great socio-economic
burden on our world (http://who.int, accessed August 2009). A disorder that is classically
characterized by hyperglycemia (high blood-sugar), DM results when there are inadequate levels
of insulin secreted or when there is resistance to insulin’s blood glucose lowering effects
(http://who.int, accessed August 2009). Insulin is a hormone produced by the beta-cells in the
pancreas which is released into the blood to stimulate glucose uptake by peripheral tissues tissues
such as the skeletal muscle. The World Health Organization (WHO) recognizes three main
forms of DM; Type 1, Type 2, and Gestational (http://who.int, accessed August 2009). Type 1
diabetes, which represents about 10% of all diabetics, occurs through a T-cell-mediated
autoimmune attack on the insulin-producing beta-cells, which leads to a lack of insulin
production. Type 2 DM, which represents about 90% of all diabetic cases, is primarily
characterized by insulin resistance and low levels of insulin production due to beta-cell
dysfunction. Gestational diabetes is first recognized during pregnancies and the cause and
symptoms are similar to Type 2 DM (http://who.int, accessed August 2009).
In 2005, the WHO estimated 1.1 million deaths due to diabetes with projections
increasing by more than 50% in the next 10 years. The myriad of symptoms associated with the
affliction of diabetes include retinopathy, neuropathy, kidney failure, and heart disease. Due to
these vast health implications, it is imperative to understand the progression of the disease and
develop effective therapeutic strategies accordingly. Studies thus far have shown that diabetes is
a complex, multifactorial disease with both genetic and epigenetic factors contributing to its risk
of development. Type-1 DM has been shown to be caused by polymorphisms in certain genes
such as the insulin and HLA class II genes that decrease the β-cell mass by 70-80%, which leads
to little or no production of insulin (Cnop 2005). In contrast, Type-2 DM, usually develops
when chronic over-nutrition combined with a genetic predisposition causing peripheral tissues to
2
be resistant to insulin production (Muoio 2008). This eventually leads to a partial loss of β-cell
mass (between 40-60%) as well as a decline in β-cell function (Butler 2003).
The treatment strategies used for patients with Type-2 DM include medication that
improves the body’s response to insulin sensitivity in peripheral tissues. Metformin, the primary
pharamocological drug for Type-2 DM, activates 5’AMP-activated protein kinase (AMPK) to
increase glycolysis and fatty acid oxidation (Muoio 2008). Thiazolidinediones such as
rosiglitazone activate peroxisome proliferator-activated receptor-γ2, which stimulates the AMPK
pathway, induces adipogenesis and reallocates lipids from liver and muscle into adipose tissue
(Muoio 2008). This results in an increase in adipose tissue and insulin sensitivity of the
peripheral tissues (Muoio 2008). Sulfonylureas increase insulin secretion, however, have been
found to lose effectiveness over time (Cohen 2007).
1.1.2 Type-2 DM: description of the pathophysiology
As previously mentioned, Type-2 DM is characterized by insulin resistance in the
peripheral tissues combined with beta-cell dysfunction. Initially, insulin resistance, caused by
factors such as genetic predisposition and lifestyle influences result in a compensation by the
beta-cells to increase insulin secretion as well as an increase in cell proliferation and hypertrophy
(Asghar et al 2006). Eventually, the beta cells are unable to keep up with the high demand of
insulin, which leads to their dysfunction and apoptosis (Rhodes 2005). In recent times, the
number of people with Type-2 DM has dramatically increased due to secondary factors such as
obesity, hypertension and lack of physical activity (http://who.int, accessed August 2009).
Through genome-wide associated studies, 11 genomic regions have been recognized to alter the
risk of Type-2 DM in the general population (Frayling 2007). One of these associated variations
includes a common variant in the fat mass and obesity associated gene (FTO). A continual rise
in obesity has been noted as a serious risk factor for the development of Type 2-DM (Formiguera
2004).
It is commonly thought that obesity, which is characterized by hyperlipidemia and
hyperglycemia (known as glucolipotoxicity together), causes defective insulin secretion and
contributes to the development of Type-2 DM (Poitout 2002). Elevated levels of glucose result
3
in decreased insulin synthesis and eventually lead to beta-cell dysfunction and death by damage
to cellular components (Poitout 2002). Increased accumulation of glucose and lipid metabolic
products results in impaired insulin secretion and a decrease in insulin gene expression. Studies
have suggested that activation of the epsilon isomer of pyruvate kinase C (PKCε) by lipids
results in the impairment of insulin secretion through the decrease in the amplification pathway
of secretion (Cantley et al. 2009). Islets from PKCε knockout mice were protected from the
harmful effects of fatty acids and did not show impaired insulin secretion when exposed to fatty
acids (Cantley et al. 2009). Glucolipotoxicity has also been shown to directly affect insulin
exocytotic machinery and suspending the release of insulin at the fusion pore (Olofsson et al.
2007). Lipids have also been shown to downregulate insulin gene expression by decreasing the
binding of transcriptions factors such as pancreas-duodenum homeobox-1 (PDX-1) and MafA to
the insulin promoter (Kelpe et al. 2003; Hagman et al. 2005). Moreover, chronic exposure of
fatty acids such as palmitate or oleate to islets leads to deficiencies in insulin secretion (Kelpe et
al. 2003). De novo synthesis of ceramide, a metabolic product of palmitate, has been
demonstrated to play a role in beta-cell apoptosis and result in a downregulation of insulin gene
expression through similar mechanisms as mentioned above (Shimabukuro 1999; Hagman et al.
2005).
β-cell dysfunction in Type-2 DM has also been shown to occur through oxidative stress
(Rhodes 2005). Oxidative stress is characterized by the continual rise of reactive oxygen species
(ROS) combined with the decline of antioxidant defenses in the cell. ROS consists of highly
reactive oxygen-containing molecules such as hydroxyl radical, hydrogen peroxide and
superoxide. ROS production occurs primarily at the mitochondrial membrane, specifically at the
electron transport chain (Chen et al. 2003). When glucose and fatty acids are metabolized, there
is an increase in the mitochondrial membrane potential due to protons being pumped into the
inter-membrane space by complexes in the electron transport chain (ETC). During this process,
electrons escaping from the ETC react with free oxygen to form superoxides and other species
(Chen et al. 2003). Thus, the chronic increase in glucose and lipid metabolism, such as the case
in obesity, leads to an increase in the production of ROS (Korshunov et al. 1997). The continual
increase of ROS results in oxidative damage such as DNA fragmentation and protein damage,
which leads to necrosis and apoptosis (Rhodes 2005). Li et al. (2009) have shown that oxidative
4
stress results in decreased activity of subunits of the ETC and downregulation of genes
responsible for mitochondrial biogenesis leading to impaired glucose-stimulated insulin secretion
(GSIS) and ATP production. Accumulation of ROS due to chronic increases in glucose and lipid
metabolism has also been shown to activate the JNK/p38 pathway, an ER stress pathway leading
to the apoptosis of the cell (Rhodes 2005). The activation of proapoptotic factors such as the
release of cytochorme c, and the activation of the caspase family induces choromatin
condensation and membrane decomposition resulting in apoptosis (Maestre et al. 2003). In
addition, islets are not equipped with a stringent antioxidant defense system, which exacerbates
the problem by making the beta-cells highly susceptible to damage via oxidative stress. Overall,
these studies highlight the strong association between type-2 diabetes and glucolipotoxicity,
which results in beta-cell dysfunction and apoptosis through mechanisms such as defective
insulin secretion and oxidative stress.
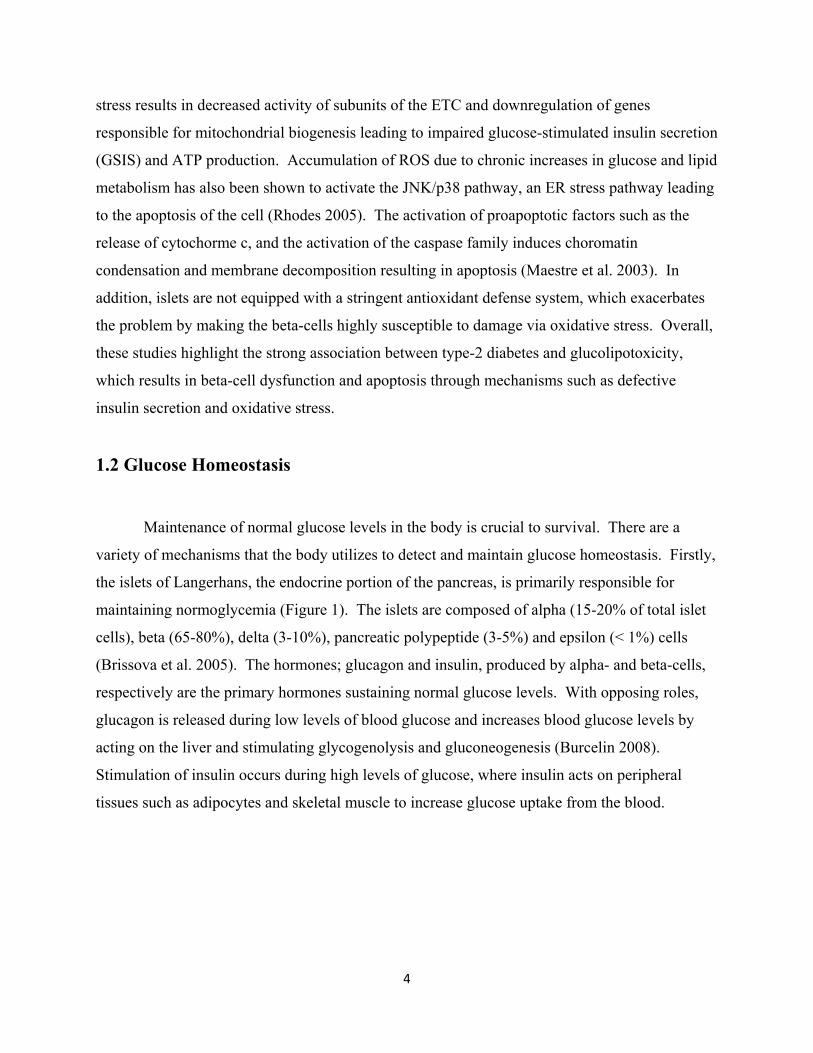
1.2 Glucose Homeostasis
Maintenance of normal glucose levels in the body is crucial to survival. There are a
variety of mechanisms that the body utilizes to detect and maintain glucose homeostasis. Firstly,
the islets of Langerhans, the endocrine portion of the pancreas, is primarily responsible for
maintaining normoglycemia (Figure 1). The islets are composed of alpha (15-20% of total islet
cells), beta (65-80%), delta (3-10%), pancreatic polypeptide (3-5%) and epsilon (< 1%) cells
(Brissova et al. 2005). The hormones; glucagon and insulin, produced by alpha- and beta-cells,
respectively are the primary hormones sustaining normal glucose levels. With opposing roles,
glucagon is released during low levels of blood glucose and increases blood glucose levels by
acting on the liver and stimulating glycogenolysis and gluconeogenesis (Burcelin 2008).
Stimulation of insulin occurs during high levels of glucose, where insulin acts on peripheral
tissues such as adipocytes and skeletal muscle to increase glucose uptake from the blood.
Figure 1modulateincrease productiocells by phypothalglucose p
A
maintain
glucose h
Gelling e
acids and
hypothal
Konner e
neurons r
glucose p
: Control ofed by the alpblood glucoon. Increasepromoting glamus controproduction.
Aside from th
ing glucose
homeostasis
et al. 2006; I
d glucose (Le
amus suppre
et al. 2007).
resulted in th
production, d
f Glucose hpha- and betase levels by
es in blood glucose uptak
ols glucose h
he pancreas,
and energy h
by 1) sensin
noue et al. 2
evin et al. 20
esses hepatic
Moreover, t
he inability o
demonstratin
omeostasis a-cells in thesecreting gl
glucose levelke in periphehomeostasis t
the central n
homeostasis
ng hormones
2006; Obici e
004; Parton
c glucose pro
the antagoni
of neurons to
ng the fact th
5
in the bodye pancreas anucagon, whi
ls stimulatederal tissues sthrough the
nervous syst
s (Figure 1).
s such as insu
et al. 2002) a
et al. 2007).
oduction via
ism of down
o react to inc
hat neurons i
y. Blood glund the hypotich stimulate
d the secretiouch as the skstimulation
tem (CNS) p
The CNS h
ulin and lept
and 2) detec
Infusion of
a NPY/AgRP
stream insul
creasing insu
in the hypoth
cose levels athalamus. Thes hepatic glon of insulin keletal muscor suppressi
plays a critic
has the ability
tin (Coppari
ting nutrient
f insulin dire
P neurons (O
lin signaling
ulin levels an
halamus hav
are primarilyhe alpha-celucose from the be
cle. The ion of hepati
al role in
y to regulate
et al. 2005;
ts such as fat
ectly into the
Obici et al. 20
g molecules i
nd restrain
ve an intact
y lls
ta-
ic
e
tty
e
002;
in
6
insulin signaling pathway (Obici et al. 2002). Leptin, produced by the adipocytes is classically
involved in improving glucose homeostasis by signaling satiety to the hypothalamus and
reducing adiposity and feeding (Campfield et al. 1995; Halaas et al. 1995; Pelleymounter et al.
1995). However, leptin signaling in the arcuate nucleus of the hypothalamus has recently been
shown to decrease hepatic glucose production through the JAK/STAT3 pathway and improve
glucose homeostasis (Buettner et al. 2006). Studies have shown that an increase in glucose
concentration specifically in the CNS leads to the suppression of both hepatic gluconeogenesis
and glycogenolysis resulting in a decrease in blood glucose and insulin levels (Lam et al. 2005).
Parton et al. (2007) have shown that mice expressing a mutant KATP channel (a channel
important in glucose metabolism and insulin signaling) in Pro-opiomelanocortin (POMC)
neurons had systemic impaired glucose homeostasis. Moreover, fatty acid sensing by the
hypothalamus has been shown to regulate glucose homeostasis. Infusion of oleic acid into the
third cerebral ventricle of the hypothalamus resulted in decreased plasma insulin and glucose
levels demonstrating that long-chain fatty acids had the ability to trigger neural pathways to
regulate energy homeostasis (Obici et al. 2002).
1.3 Glucose-Stimulated Insulin Secretion
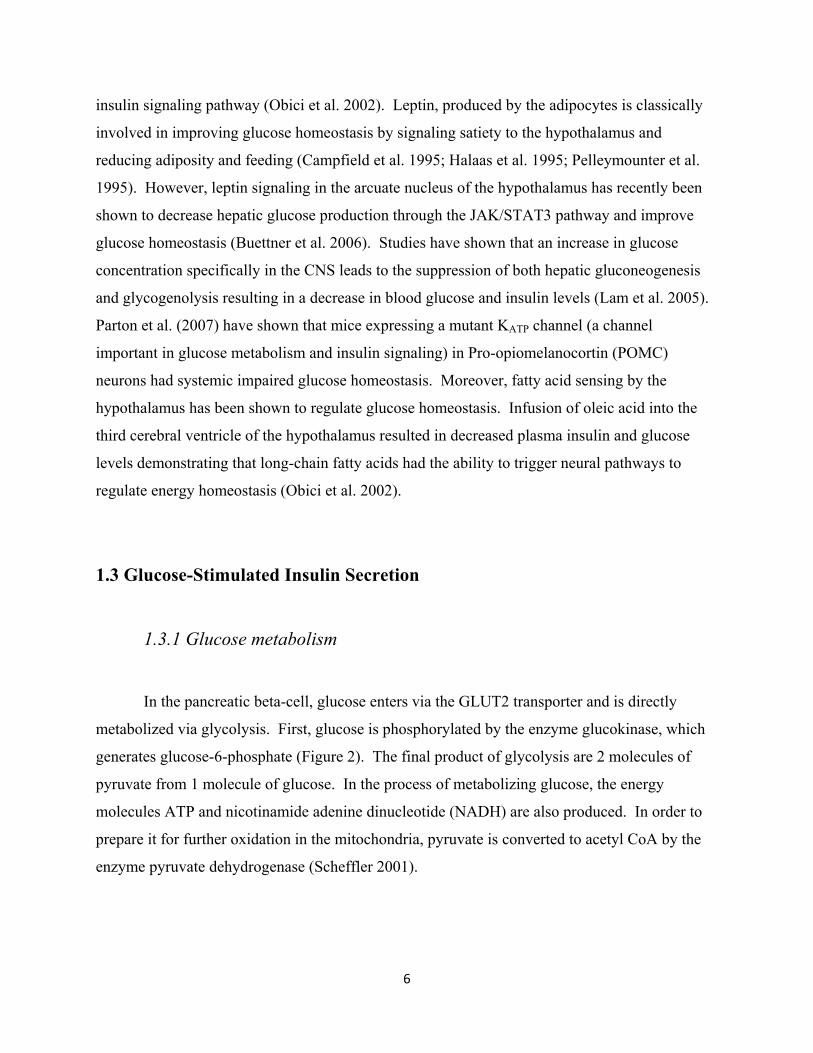
1.3.1 Glucose metabolism
In the pancreatic beta-cell, glucose enters via the GLUT2 transporter and is directly
metabolized via glycolysis. First, glucose is phosphorylated by the enzyme glucokinase, which
generates glucose-6-phosphate (Figure 2). The final product of glycolysis are 2 molecules of
pyruvate from 1 molecule of glucose. In the process of metabolizing glucose, the energy
molecules ATP and nicotinamide adenine dinucleotide (NADH) are also produced. In order to
prepare it for further oxidation in the mitochondria, pyruvate is converted to acetyl CoA by the
enzyme pyruvate dehydrogenase (Scheffler 2001).
7
1.3.2 Insulin secretion via ATP production
The oxidation of acetyl CoA occurs within the tricarboxylic acid (TCA) cycle, which
takes place in the inner mitochondrial membrane (Figure 2). The TCA cycle begins with Acetyl
CoA combining with oxaloacetate to make citrate, and through a series of oxidation steps leads
to the transfer of energy to substrates such as NADH and flavin adenine dinucleotide (FADH2)
(Scheffler 2001). These substrates are used in the electron transport chain which occurs on the
inner mitochondrial membrane (Figure 2). NADH and FADH2 act as electron donors and pass
electrons through a series of redox complexes, where the energy is harvested to move protons
across the membrane into the intermembrane space (Scheffler 2001). The final acceptor of the
electrons is a molecule of oxygen, which combines with hydrogen to make water (H2O). As a
result, a proton gradient is created across the mitochondrial membrane. The protons then re-
enter the matrix, down their electrochemical gradient, through ATP-synthase, where the energy
is used to convert ADP to ATP (Figure 2).
Increased accumulation of ATP causes the closure of potassium ATP (KATP) channels,
located on the plasma membrane, decreasing the outward K+ ion flow from the beta-cell and
depolarizing the cell. Due to the changes in membrane potential, voltage-dependent calcium
channels open to allow extracellular Ca2+ into the cell (Figure 2). Ca2+ accumulation in the
cytoplasm has been shown to be required for the docking, priming and exocytosis of insulin
vesicles (Bratanova-Tochkova et al. 2002). Thus, the inward flow of Ca2+ leads ultimately to the
secretion of insulin from the β-cells (Scheffler 2001). Insulin secretion can be differentiated in
two phases: first and second. The first phase is characterized by the rapid exocytosis of insulin
and occurs in the first few minutes after glucose stimulation. The first phase is defined by the
release of insulin vesicles that are docked at the plasma membrane. The second phase is
characterized by the release of stored granules as well as the synthesis of new insulin.
8
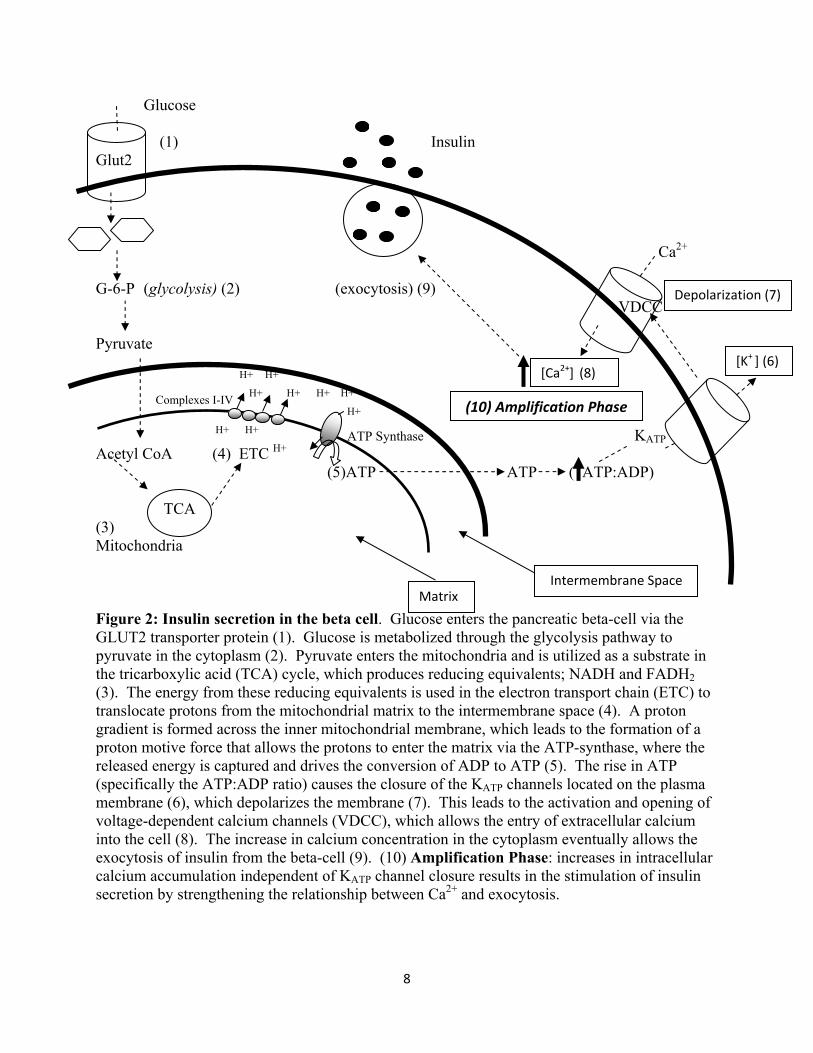
Glucose (1) Insulin Glut2 Ca2+ G-6-P (glycolysis) (2) (exocytosis) (9) VDCC Pyruvate H+ H+ Complexes I-IV H+ H+ H+ H+ H+ H+ H+ ATP Synthase KATP Acetyl CoA (4) ETC H+ (5)ATP ATP ( ATP:ADP) TCA (3) Mitochondria Figure 2: Insulin secretion in the beta cell. Glucose enters the pancreatic beta-cell via the GLUT2 transporter protein (1). Glucose is metabolized through the glycolysis pathway to pyruvate in the cytoplasm (2). Pyruvate enters the mitochondria and is utilized as a substrate in the tricarboxylic acid (TCA) cycle, which produces reducing equivalents; NADH and FADH2 (3). The energy from these reducing equivalents is used in the electron transport chain (ETC) to translocate protons from the mitochondrial matrix to the intermembrane space (4). A proton gradient is formed across the inner mitochondrial membrane, which leads to the formation of a proton motive force that allows the protons to enter the matrix via the ATP-synthase, where the released energy is captured and drives the conversion of ADP to ATP (5). The rise in ATP (specifically the ATP:ADP ratio) causes the closure of the KATP channels located on the plasma membrane (6), which depolarizes the membrane (7). This leads to the activation and opening of voltage-dependent calcium channels (VDCC), which allows the entry of extracellular calcium into the cell (8). The increase in calcium concentration in the cytoplasm eventually allows the exocytosis of insulin from the beta-cell (9). (10) Amplification Phase: increases in intracellular calcium accumulation independent of KATP channel closure results in the stimulation of insulin secretion by strengthening the relationship between Ca2+ and exocytosis.
Intermembrane Space Matrix
[Ca2+] (8) [K+ ] (6)
Depolarization (7)
(10) Amplification Phase
9
1.3.3 Insulin secretion: Amplification Pathway Insulin secretion can be sustained through the amplification phase, which acts
independent of KATP channel-stimulated closure. The amplification of insulin secretion is
complementary to the triggering (KATP channel dependent) pathway in order to augment the
amount of insulin secretion (Henquin et al. 2003). Glucose can directly stimulate secretion by
strengthening the interaction between intracellular Ca2+ and exocytotic machinery (Henquin et al.
2003). Studies have shown that if KATP channels cannot be closed, an artificial increase in
intracellular calcium can still result in the stimulation of beta-cell insulin secretion (Gembal et al.
1992; Gembal et al. 1993). Paracrine influence by hormones and neurotransmitters such as
glucagon-like peptide 1 (GLP-1) and acetylcholine have also been shown to amplify insulin
secretion (Henquin et al. 2003). Acetylcholine (ACh), which is released by the parasympathetic
nervous system that synapses at the beta-cells results in the increase in intracellular calcium.
Studies have shown that acetylcholine induces the release of endoplasmic storage of calcium into
the cytosol (Gilon et al. 2001). Diacylglycerol, a metabolic product of Ach, has also been shown
to activate protein kinase C, which results in exocytotic machinery being more sensitive to
stimulation by Ca2+ (Jones et al. 1998). Similarly, GLP-1 has also been shown to induce
intracellular stores of calcium as well as stimulate the closure of KATP channels. GLP-1 can
activate protein kinase A, which results in the production of cAMP resulting in the strengthening
of Ca2+ and exocytosis interaction (Fujimoto et al. 2002).
1.4 Uncoupling Proteins
Uncoupling proteins (UCPs) belong to a family of membrane carrier proteins that provide
a proton leak mechanism across the mitochondrial membrane. Uncouplers dissipate the potential
energy stored in the proton gradient through heat and bypass ATP synthase, decreasing the
efficiency of ATP production (Saleh et al. 2002). Structurally, UCPs are transmembrane
proteins composed of six alpha-helix transmembrane regions, which are joined by 3 loops
located on the mitochondrial matrix side (Walker 1993). The alpha-helices form a channel
through the membrane, which is controlled by the loops that act as gates (Figure 3; Walker
1993). The functional channel has been shown to be a homodimer (Echtay 2007).
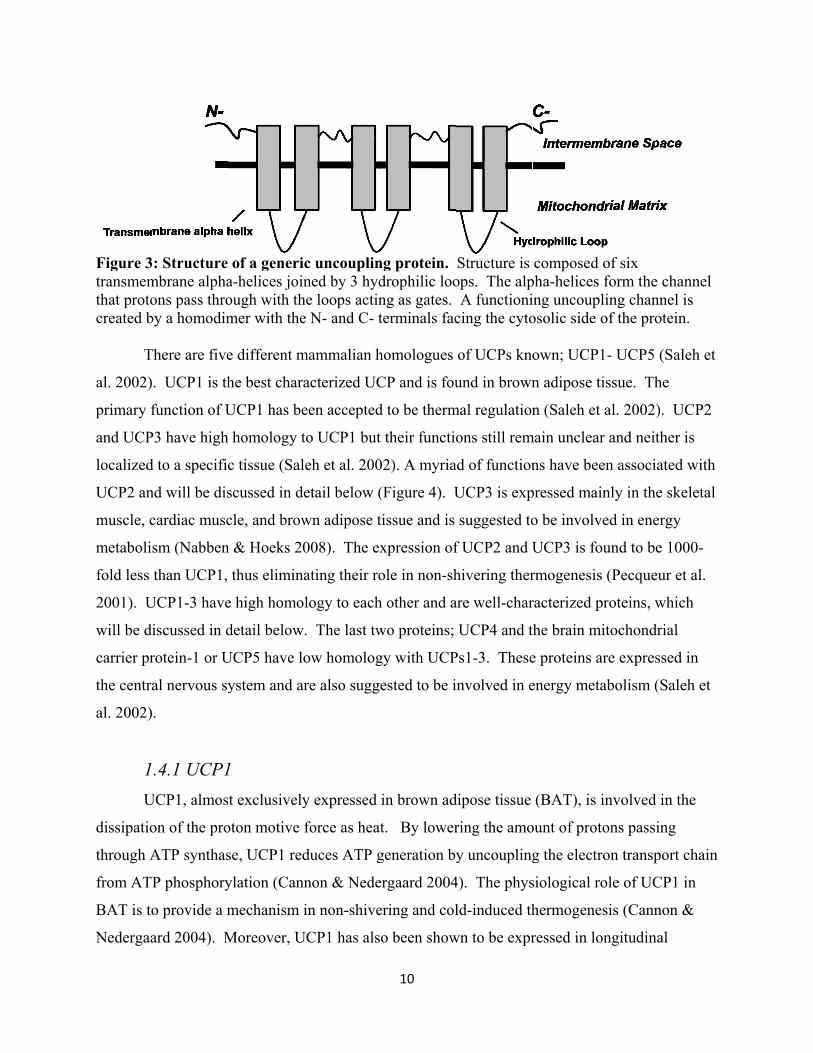
Figure 3transmemthat protocreated b
T
al. 2002)
primary f
and UCP
localized
UCP2 an
muscle, c
metaboli
fold less
2001). U
will be d
carrier pr
the centra
al. 2002)
1U
dissipatio
through A
from AT
BAT is to
Nedergaa
3: Structure mbrane alphaons pass throby a homodim
There are five
. UCP1 is th
function of U
P3 have high
d to a specific
nd will be dis
cardiac musc
sm (Nabben
than UCP1,
UCP1-3 have
iscussed in d
rotein-1 or U
al nervous sy
.
.4.1 UCP1UCP1, almos
on of the pro
ATP synthas
P phosphory
o provide a m
ard 2004). M
of a generia-helices joinough with thmer with the
e different m
he best chara
UCP1 has be
h homology t
c tissue (Sal
scussed in de
cle, and brow
n & Hoeks 20
thus elimina
e high homo
detail below
UCP5 have lo
ystem and ar
1 st exclusively
oton motive
se, UCP1 red
ylation (Cann
mechanism i
Moreover, U
c uncouplinned by 3 hyd
he loops actine N- and C- t
mammalian h
acterized UC
een accepted
to UCP1 but
leh et al. 200
etail below (
wn adipose t
008). The ex
ating their ro
logy to each
. The last tw
ow homolog
re also sugg
y expressed
force as heat
duces ATP g
non & Nede
in non-shive
UCP1 has als
10
ng protein. drophilic loong as gates. terminals fac
homologues
CP and is fou
d to be therm
t their functio
02). A myria
(Figure 4). U
tissue and is
xpression of
ole in non-sh
h other and a
wo proteins;
gy with UCP
ested to be i
in brown ad
t. By lower
generation by
ergaard 2004
ering and col
o been show
Structure is ops. The alp
A functionicing the cyto
of UCPs kn
und in brown
mal regulation
ons still rem
ad of function
UCP3 is exp
suggested to
f UCP2 and U
hivering ther
are well-char
UCP4 and t
Ps1-3. These
nvolved in e
dipose tissue
ring the amo
y uncoupling
4). The phys
ld-induced th
wn to be expr
composed opha-helices fing uncoupliosolic side o
own; UCP1-
n adipose tis
n (Saleh et a
main unclear
ns have been
pressed main
o be involve
UCP3 is fou
rmogenesis (
racterized pr
the brain mit
e proteins ar
energy metab
(BAT), is in
ount of proto
g the electro
siological rol
hermogenes
ressed in lon
of six form the chaning channel if the protein
- UCP5 (Sal
ssue. The
al. 2002). U
and neither
n associated
nly in the ske
ed in energy
und to be 100
(Pecqueur et
roteins, whic
tochondrial
e expressed
bolism (Sale
nvolved in th
ons passing
on transport c
le of UCP1 i
is (Cannon &
ngitudinal
nnel is
n.
leh et
CP2
is
with
eletal
00-
t al.
ch
in
eh et
he
chain
in
&
11
smooth muscle of the digestive and reproductive tracts where it participates in thermogenesis as
well as relaxation of the muscle (Nibbelink et al. 2001). The proton conductance of UCP1 is
under stringent control where it has been shown to be activated by fatty acids and inhibited by
purine nucleotides such as ATP, and GTP (Echtay 2007).
1.4.2 UCP3 Uncoupling protein-3 is exclusively expressed in the skeletal muscle and heart (Echtay
2005). It is commonly thought that UCP3 plays a role in fatty acid metabolism. UCP3 has been
suggested to provide a mechanism of transport for fatty acids across the mitochondrial
membrane into the cytosol thereby preventing fatty acid toxicity and mitochondrial damage
(Echtay et al. 2005). Transportation of fatty acid anions into the cytosol results in the
reactivation by acyl-CoA synthetase thereby facilitating continual fatty acid oxidation (Bezaire et
al. 2007). Moreover, it has also been suggested that UCP3 protects the skeletal muscles from
ROS damage, where increased oxidative stress was observed in the muscle of UCP3 knockout
mice (Bezaire et al. 2001). Supporting these roles, clinical studies with patients having a
mutation in the UCP3 gene have been suggested to result in decreased rates of fatty acid
oxidation and are associated with type 2 diabetes (Argyropoulous et al. 1998). In addition, the
overexpression of UCP3 in muscle cells has been shown to be associated with decreased
production of ROS as well as facilitating fatty acid oxidation (MacLellan et al. 2005)
1.4.3 UCP2 UCP2 has been recently spotlighted because of its controversial role in metabolism and
insulin secretion. In fact, the UCP2 gene has been shown to be located on chromosome 11 in
humans, close to the gene associated with obesity (Saleh et al. 2002). Although there is high
homology between the UCP1 and UCP2, they are not proposed to share a similar functional role.
High expression of UCP2 mRNA has been found in several tissues including spleen, thymus,
heart, lungs, white and brown adipose tissue (Echtay 2005). However, the mRNA expression
does not necessarily correlate with increased UCP2 protein translation. Although higher mRNA
expression is observed, extremely low levels of UCP2 protein are found in the heart, skeletal
muscle and brown adipose tissue (Echtay 2005). On the other hand, high protein expression is
observed in the pancreas, spleen and macrophages (Pecqueur et al. 2001). In general, UCP2
12
activity and expression has been shown to be up-regulated in a high glucose or fatty acid
environment. Upregulation of UCP2 mRNA has been shown by substrates such as sterol-
regulatory-element-binding protein-1c (SREBP-1c), and peroxisome-proliferator-activated-γ,
which are, in turn, stimulated by fatty acids and glucose (Echtay et al. 2001; Ito et al. 2004;
Takahashi et al. 2005). On the other hand, down-regulation of UCP2 transcription has been
shown to occur using nucleotides such as ADP as well as sirtuan-1 (Echtay et al. 2001; Bordone
et al. 2006). Suppression of UCP2 activity has been demonstrated using GDP as well as a
compound named genipin from the extract of Gardenia jasminoides Ellis fruits (Echtay et al.
2002; Zhang et al. 2006). The addition of genipin to pancreatic beta-cells has been shown to
increase mitochondrial membrane potential and increase ATP generation in a UCP2-dependent
manner (Zhang et al. 2006).
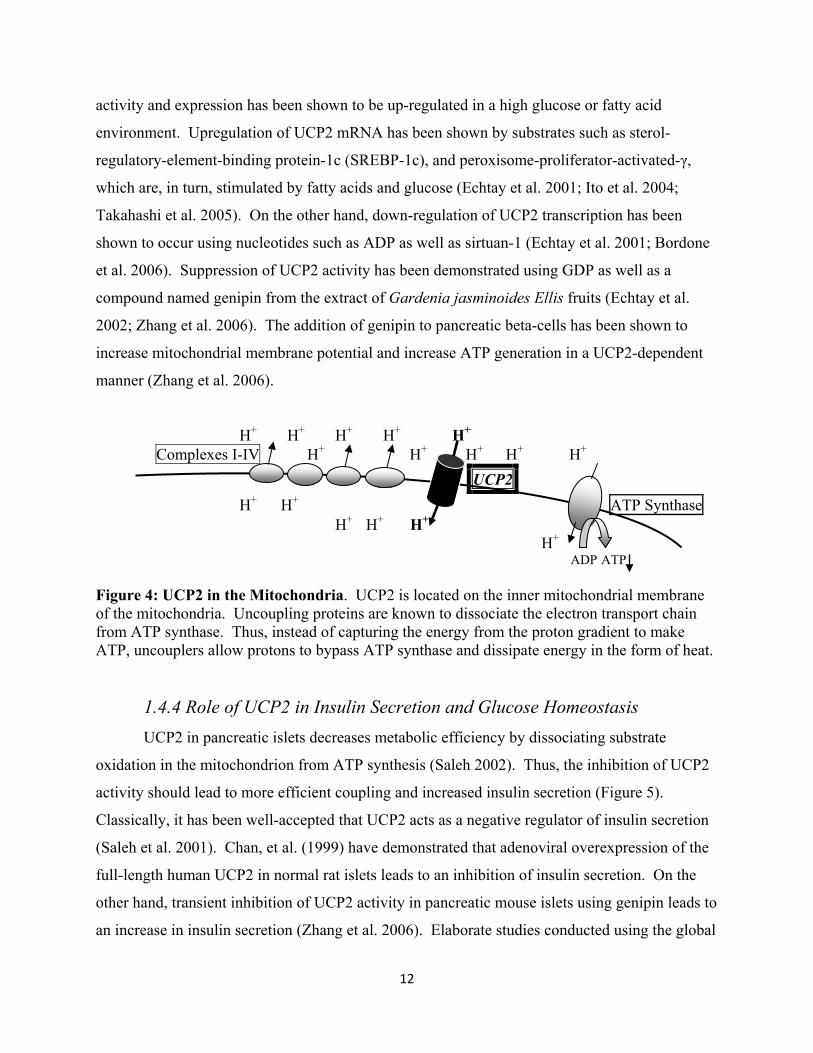
H+ H+ H+ H+ H+ Complexes I-IV H+ H+ H+ H+ H+ UCP2 H+ H+ ATP Synthase H+ H+ H+ H+ ADP ATP Figure 4: UCP2 in the Mitochondria. UCP2 is located on the inner mitochondrial membrane of the mitochondria. Uncoupling proteins are known to dissociate the electron transport chain from ATP synthase. Thus, instead of capturing the energy from the proton gradient to make ATP, uncouplers allow protons to bypass ATP synthase and dissipate energy in the form of heat.
1.4.4 Role of UCP2 in Insulin Secretion and Glucose Homeostasis UCP2 in pancreatic islets decreases metabolic efficiency by dissociating substrate
oxidation in the mitochondrion from ATP synthesis (Saleh 2002). Thus, the inhibition of UCP2
activity should lead to more efficient coupling and increased insulin secretion (Figure 5).
Classically, it has been well-accepted that UCP2 acts as a negative regulator of insulin secretion
(Saleh et al. 2001). Chan, et al. (1999) have demonstrated that adenoviral overexpression of the
full-length human UCP2 in normal rat islets leads to an inhibition of insulin secretion. On the
other hand, transient inhibition of UCP2 activity in pancreatic mouse islets using genipin leads to
an increase in insulin secretion (Zhang et al. 2006). Elaborate studies conducted using the global
13
UCP2 knockout mice (UCP2 -/-) have shown that this model has higher islet ATP levels,
improved glucose tolerance and increased glucose stimulated insulin secretion compared to
wildtype controls (Zhang et al. 2001; Joseph et al. 2002). Thus, suggesting that deletion of
UCP2 may be metabolically protective. Also, UCP2-/- mice were placed on a high-fat diet
(HFD) to assess its role during the development of diet-induced type 2 diabetes. Interestingly,
UCP2-/- on the HFD had enhanced glucose sensitivity, increased beta-cell mass and insulin
content compared to WT mice after HFD (Joseph et al. 2002). Moreover, a myriad of clinical
studies looking at the -866G/A polymorphism in humans located in the UCP2 promoter increases
UCP2 expression and is associated with deficient insulin secretion and type-2 diabetes (Sesti et
al. 2003; D’Adamo et al. 2004; Gable et al. 2006).
However, recent studies have questioned the role of UCP2 as a negative regulator of
insulin secretion. Beta cell-specific overexpression of the human UCP2 gene in clonal cell lines
lead to the conclusion that UCP2 overexpression results in no changes to glucose-stimulated
insulin secretion, cytosolic ATP or mitochondrial membrane potential (Produit-Zengaffinen et al.
2007). Furthermore, Pi et al. (2009) have recently backcrossed the whole body UCP2 knockout
mice onto three different congenic strains, and concluded that the chronic absence of UCP2 lead
to persistent ROS accumulation and oxidative stress, which was accompanied by decreased
glucose-stimulated insulin secretion (Pi et al. 2009). On the contrary, Lee et al. (2009) found
that UCP2-/- mice also had increased ROS accumulation, however, this chronic elevation of
ROS was suggested to contribute to enhanced beta-cell function and attenuation of glucagon
secretion, resulting in a decreased STZ-stimulated hyperglycemia.
Moreover, pre-opiomelanocortin (POMC) neurons have been recently demonstrated to
play a prominent role in glucose sensing (Parton et al. 2007). Disruption of the KATP channel in
POMC neurons has been shown to impair the whole-body response to a systemic glucose load
(Parton et al. 2007). This mechanism was shown to involve UCP2, which was demonstrated to
negatively regulate glucose sensing and homeostasis in POMC neurons (Parton et al. 2007).
Considering the fact that UCP2 is expressed in the arcuate nucleus of the hypothalamus, it is
possible that the phenotype demonstrated in UCP2-/- could be explained by the deletion of UCP2
in the CNS (Saleh et al. 2001).
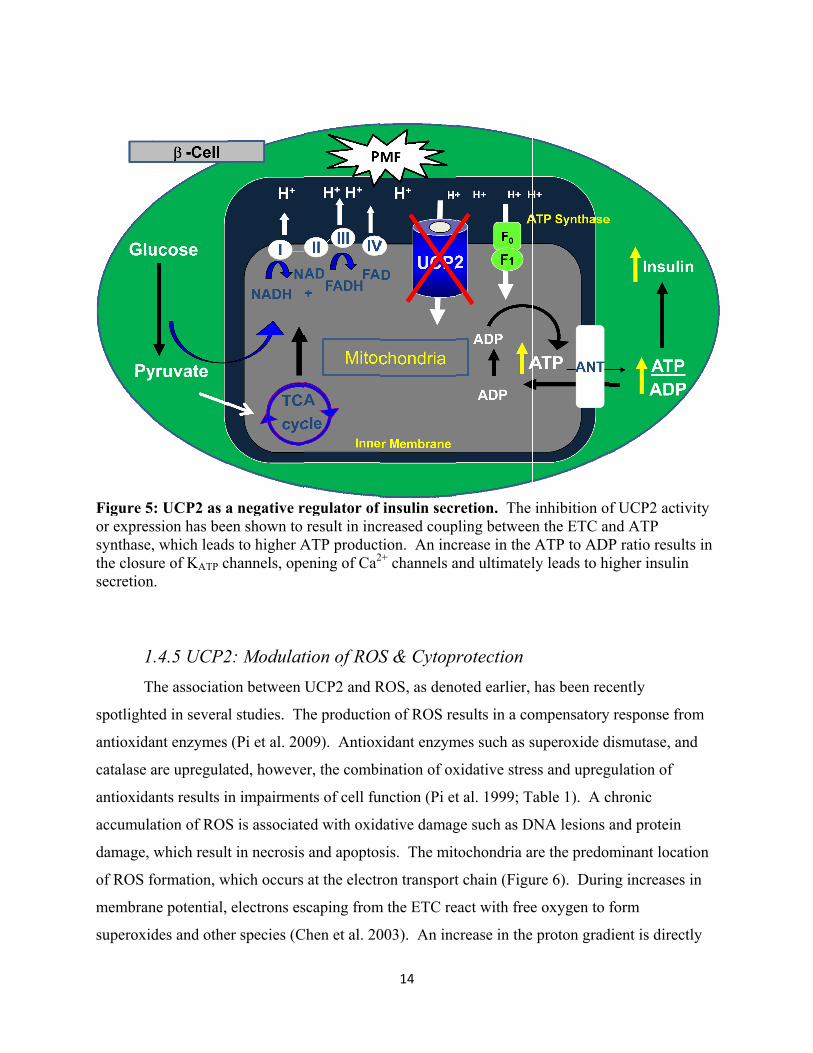
Figure 5or expressynthase,the closusecretion
1T
spotlight
antioxida
catalase a
antioxida
accumula
damage,
of ROS f
membran
superoxid
5: UCP2 as assion has bee, which lead
ure of KATP cn.
.4.5 UCP2The associatio
ed in severa
ant enzymes
are upregula
ants results i
ation of ROS
which result
formation, w
ne potential,
des and othe
a negative ren shown to
ds to higher Achannels, ope
2: Modulaton between
l studies. Th
(Pi et al. 20
ated, howeve
n impairmen
S is associate
t in necrosis
which occurs
electrons es
er species (C
regulator of result in inc
ATP productening of Ca2
tion of ROSUCP2 and R
he productio
009). Antiox
er, the combi
nts of cell fu
ed with oxid
and apoptos
at the electr
scaping from
Chen et al. 20
14
insulin secrcreased couption. An inc2+ channels a
S & CytopROS, as deno
on of ROS re
xidant enzym
ination of ox
unction (Pi et
dative damag
sis. The mit
ron transport
m the ETC re
003). An inc
retion. The pling betweencrease in the and ultimatel
rotectionoted earlier,
esults in a co
mes such as s
xidative stres
t al. 1999; T
ge such as D
tochondria a
t chain (Figu
eact with free
crease in the
inhibition on the ETC aATP to ADPly leads to h
has been rec
ompensatory
superoxide d
ss and upreg
Table 1). A c
DNA lesions
are the predo
ure 6). Durin
e oxygen to
proton grad
of UCP2 actiand ATP P ratio resuligher insulin
cently
y response fro
dismutase, an
gulation of
chronic
and protein
ominant locat
ng increases
form
dient is direc
vity
lts in n
om
nd
tion
s in
ctly
15
proportional to an increased production of ROS (Korshunov et al. 1997). Thus, a possible
physiological role of UCPs is that through uncoupling activity, these proteins lower the
mitochondrial membrane potential thereby decreasing ROS formation.
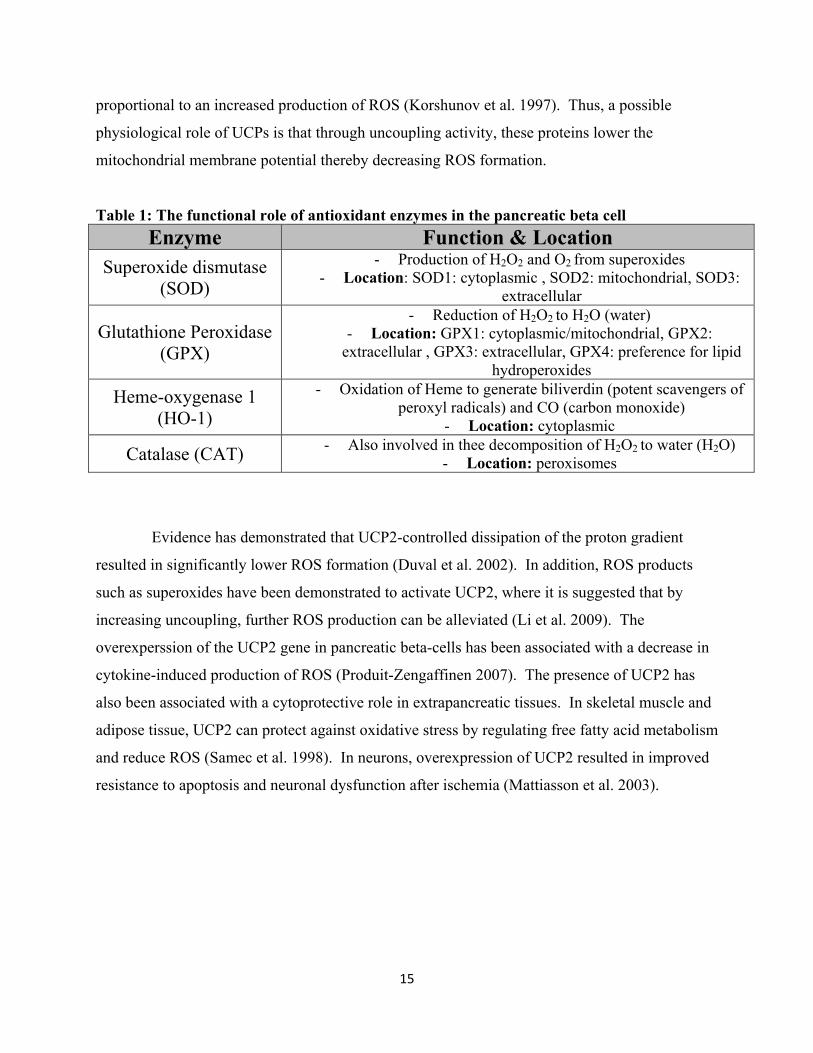
Table 1: The functional role of antioxidant enzymes in the pancreatic beta cell Enzyme Function & Location
Superoxide dismutase (SOD)
- Production of H2O2 and O2 from superoxides - Location: SOD1: cytoplasmic , SOD2: mitochondrial, SOD3:
extracellular
Glutathione Peroxidase (GPX)
- Reduction of H2O2 to H2O (water) - Location: GPX1: cytoplasmic/mitochondrial, GPX2:
extracellular , GPX3: extracellular, GPX4: preference for lipid hydroperoxides
Heme-oxygenase 1 (HO-1)
- Oxidation of Heme to generate biliverdin (potent scavengers of peroxyl radicals) and CO (carbon monoxide)
- Location: cytoplasmic
Catalase (CAT) - Also involved in thee decomposition of H2O2 to water (H2O) - Location: peroxisomes
Evidence has demonstrated that UCP2-controlled dissipation of the proton gradient
resulted in significantly lower ROS formation (Duval et al. 2002). In addition, ROS products
such as superoxides have been demonstrated to activate UCP2, where it is suggested that by
increasing uncoupling, further ROS production can be alleviated (Li et al. 2009). The
overexperssion of the UCP2 gene in pancreatic beta-cells has been associated with a decrease in
cytokine-induced production of ROS (Produit-Zengaffinen 2007). The presence of UCP2 has
also been associated with a cytoprotective role in extrapancreatic tissues. In skeletal muscle and
adipose tissue, UCP2 can protect against oxidative stress by regulating free fatty acid metabolism
and reduce ROS (Samec et al. 1998). In neurons, overexpression of UCP2 resulted in improved
resistance to apoptosis and neuronal dysfunction after ischemia (Mattiasson et al. 2003).
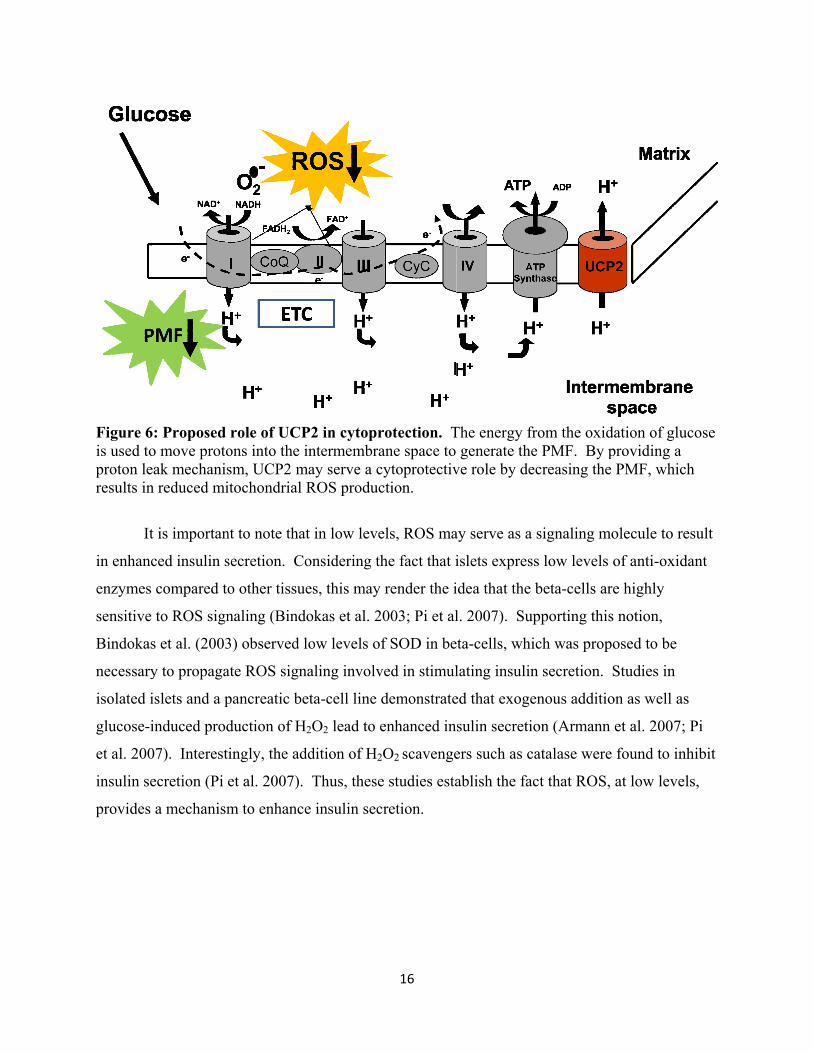
Figure 6is used toproton leresults in
It
in enhanc
enzymes
sensitive
Bindokas
necessary
isolated i
glucose-i
et al. 200
insulin se
provides
6: Proposed o move protoeak mechanisn reduced mi
t is importan
ced insulin s
compared to
to ROS sign
s et al. (2003
y to propaga
islets and a p
induced prod
07). Interest
ecretion (Pi e
a mechanism
role of UCPons into the ism, UCP2 mitochondrial
nt to note tha
secretion. C
o other tissu
naling (Bind
3) observed l
ate ROS sign
pancreatic be
duction of H
ingly, the ad
et al. 2007).
m to enhanc
P2 in cytoprintermembra
may serve a cROS produc
at in low leve
onsidering th
ues, this may
dokas et al. 2
low levels o
naling involv
eta-cell line
H2O2 lead to e
ddition of H2
Thus, these
e insulin sec
16
rotection. Tane space to cytoprotectivction.
els, ROS ma
he fact that i
y render the i
2003; Pi et al
f SOD in be
ved in stimul
demonstrate
enhanced in
2O2 scavenge
e studies esta
cretion.
The energy frgenerate the
ve role by de
ay serve as a
islets expres
idea that the
l. 2007). Su
eta-cells, whi
lating insulin
ed that exoge
sulin secreti
ers such as c
ablish the fa
from the oxide PMF. By pecreasing the
signaling m
ss low levels
beta-cells ar
upporting thi
ich was prop
n secretion.
enous additio
ion (Armann
catalase were
ct that ROS,
dation of gluproviding a e PMF, whic
molecule to re
of anti-oxid
re highly
s notion,
posed to be
Studies in
on as well as
n et al. 2007;
e found to in
, at low leve
ucose
ch
esult
dant
s
; Pi
nhibit
ls,
17
1.4.6 Alternate functions of UCP2 As these studies suggest, the precise physiological role(s) of UCP2 is still highly debated.
In fact, UCP2 has also been shown to be highly expressed in alpha-cells (higher expression than
beta-cells) and involved in maintaining alpha-cell function (Diao et al. 2008). Inhibiting UCP2
activity in alpha-cells was associated with higher mitochondrial membrane potential, increased
ATP synthesis, decreased glucagon secretion and alpha-cells were found to be more susceptible
to apoptosis (Diao et al. 2008). UCP2 has also been suggested to be involved in immune
function, where it controls macrophage activation by modulating the production of ROS (a
signaling molecule in the macrophage) and increasing nitric oxide production in macrophages
(Emre et al. 2007). Macrophages from UCP2 -/- mice were found to produce more ROS and the
mice were more resistant to infection than wildtype mice (Arsenijevic 2000). A study that
generated a combined knockout of the LDL receptor and UCP2 resulted in mice having
increased oxidative stress and higher susceptibility to atherosclerosis (Blanc et al. 2003). Thus,
considering the wide range of tissues that UCP2 is expressed in, it may have multiple roles
depending on the tissue being studied.
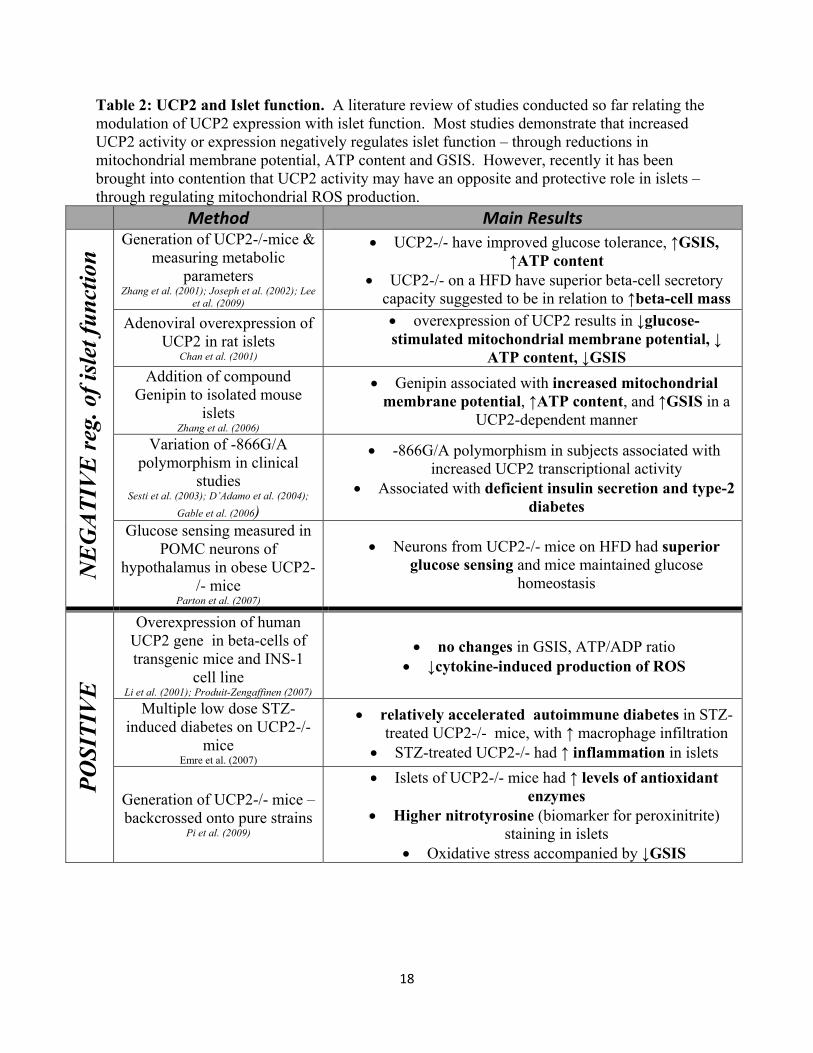
The role of UCP2 is extremely controversial and due to its wide range of tissue
expression, it is difficult to deduce it specific physiological role in the pancreatic beta-cell.
Table 2 summarizes the myriad of studies conducted thus far that relate UCP2 to both a role of a
positive as well as a negative regulator of islet function. The aim of this project is to elucidate
the role of UCP2 by creating a beta-cell specific knockout of UCP2. Thus, to specifically
understand the role of UCP2 in islet function, we generated a beta-cell specific knockout model
of UCP2 (UCP2BKO) using the cre-lox recombination system, which will be further discussed
below.
18
Table 2: UCP2 and Islet function. A literature review of studies conducted so far relating the modulation of UCP2 expression with islet function. Most studies demonstrate that increased UCP2 activity or expression negatively regulates islet function – through reductions in mitochondrial membrane potential, ATP content and GSIS. However, recently it has been brought into contention that UCP2 activity may have an opposite and protective role in islets – through regulating mitochondrial ROS production.
Method Main Results
NE
GA
TIV
E re
g. o
f isl
et fu
nctio
n Generation of UCP2-/-mice &
measuring metabolic parameters
Zhang et al. (2001); Joseph et al. (2002); Lee et al. (2009)
• UCP2-/- have improved glucose tolerance, ↑GSIS, ↑ATP content
• UCP2-/- on a HFD have superior beta-cell secretory capacity suggested to be in relation to ↑beta-cell mass
Adenoviral overexpression of UCP2 in rat islets
Chan et al. (2001)
• overexpression of UCP2 results in ↓glucose-stimulated mitochondrial membrane potential, ↓
ATP content, ↓GSIS Addition of compound
Genipin to isolated mouse islets
Zhang et al. (2006)
• Genipin associated with increased mitochondrial membrane potential, ↑ATP content, and ↑GSIS in a
UCP2-dependent manner Variation of -866G/A
polymorphism in clinical studies
Sesti et al. (2003); D’Adamo et al. (2004); Gable et al. (2006)
• -866G/A polymorphism in subjects associated with increased UCP2 transcriptional activity
• Associated with deficient insulin secretion and type-2 diabetes
Glucose sensing measured in POMC neurons of
hypothalamus in obese UCP2-/- mice
Parton et al. (2007)
• Neurons from UCP2-/- mice on HFD had superior glucose sensing and mice maintained glucose
homeostasis
POSI
TIV
E
Overexpression of human UCP2 gene in beta-cells of transgenic mice and INS-1
cell line Li et al. (2001); Produit-Zengaffinen (2007)
• no changes in GSIS, ATP/ADP ratio • ↓cytokine-induced production of ROS
Multiple low dose STZ-induced diabetes on UCP2-/-
mice Emre et al. (2007)
• relatively accelerated autoimmune diabetes in STZ-treated UCP2-/- mice, with ↑ macrophage infiltration
• STZ-treated UCP2-/- had ↑ inflammation in islets
Generation of UCP2-/- mice – backcrossed onto pure strains
Pi et al. (2009)
• Islets of UCP2-/- mice had ↑ levels of antioxidant enzymes
• Higher nitrotyrosine (biomarker for peroxinitrite) staining in islets
• Oxidative stress accompanied by ↓GSIS
19
1.5 Cre-Lox Recombination system
1.5.1 Background
The cre-lox recombination system allows the recombination of two DNA sites
(loxP sites) by the enzyme cre recombinase and has revolutionized mouse genomic studies
(Nagy 2000). The advancements in mouse transgenics have allowed the addition of any selected
DNA fragment into ES (embryonic stem) cells, which can then be injected into blastocysts and
allowed to grow normally into mice. With the Cre-Lox recombination system, any genome
flanked by the two loxP sites can be excised, inverted or recombined between two DNA strands
in a tissue-specific manner (Nagy 2000). Thus, the study of knocking down a protein in any
specific tissue without the possibility of embryonic lethality is possible. Combining all of these
systems gives the tools to generate mice with any modification in their DNA.
The Cre recombinase is a 38 kD protein that comes from the virus P1 bacteriophage. Cre
recombinase recognizes two sets of 34 bp sequences called loxP sites and catalyzes
recombination between the sites. The 34 bp sequence consists of a core or spacer sequence that
is 8 bp long as well as two 13 bp palindromic sequences at either end (Hamilton & Abremiski
1984). The orientation of the loxP sites determines the outcome of the recombination. Cis loxP
sites (Figure 7, sites that are a direct repeat or in tandem) result in an excision or inversion of the
sequence. Trans sites (sites that are on different chromosomes) lead to an insertion of one DNA
segment into another or the exchange of DNA between two chromosomes (Nagy 2000). The
specific molecular mechanism of the recombination consists of the enzyme cre recombinase
binding to each of the palindromic halves of the loxP sites, bringing the sites together
(Voziyanov et al. 1999). After the formation of a tetramer, recombination occurs in between the
spacer area (Voziyanov et al. 1999).
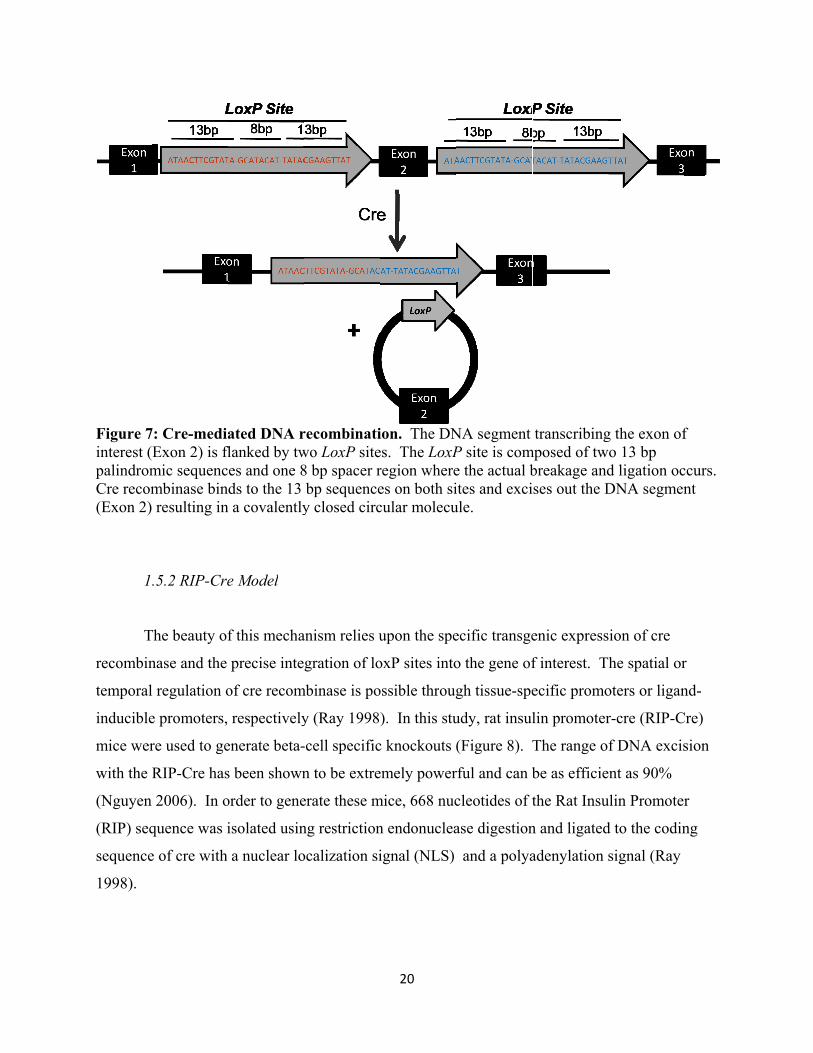
Figure 7interest (palindromCre recom(Exon 2)
1
T
recombin
temporal
inducible
mice wer
with the R
(Nguyen
(RIP) seq
sequence
1998).
7: Cre-mediaExon 2) is flmic sequencmbinase bin resulting in
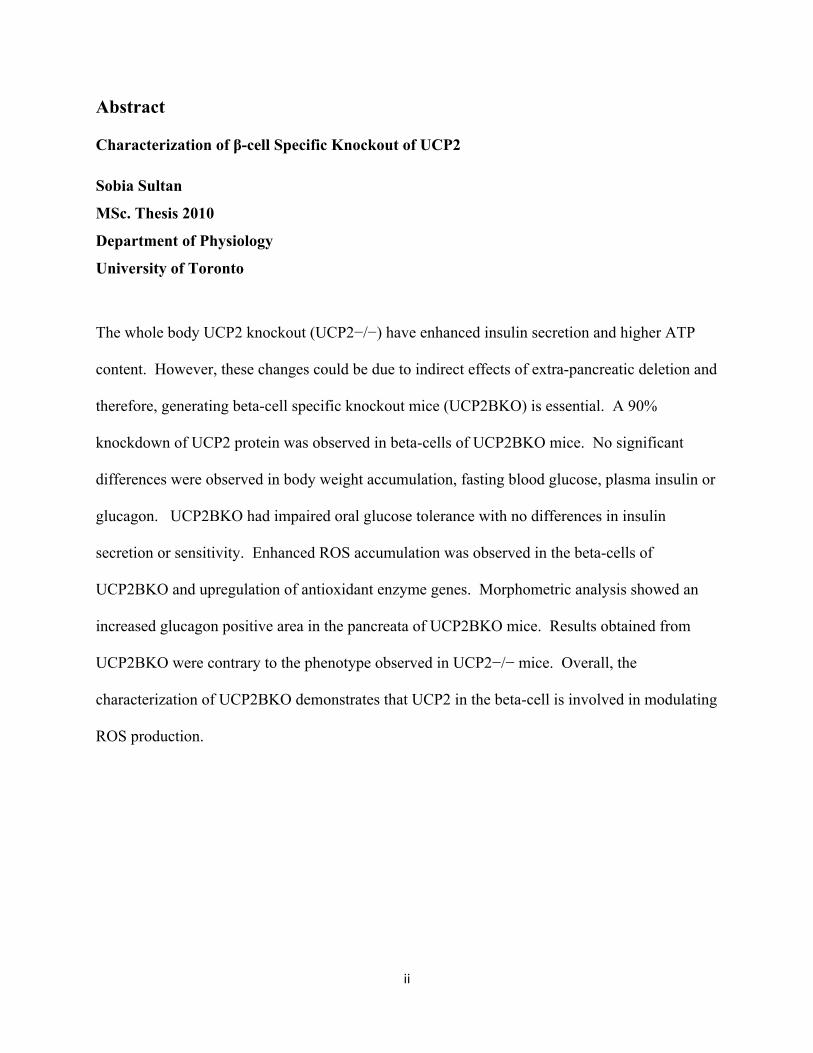
.5.2 RIP-Cre
The beauty of
nase and the
l regulation o
e promoters,
re used to ge
RIP-Cre has
2006). In o
quence was i
e of cre with
ated DNA rflanked by twes and one 8ds to the 13
n a covalently
e Model
f this mecha
precise inte
of cre recom
respectively
enerate beta-
s been shown
order to gene
isolated usin
a nuclear lo
recombinatiwo LoxP site8 bp spacer rbp sequencey closed circ
anism relies u
gration of lo
mbinase is po
y (Ray 1998
-cell specific
n to be extre
erate these m
ng restriction
ocalization si
20
ion. The DNes. The LoxPregion wherees on both sicular molecu
upon the spe
oxP sites into
ossible throug
). In this stu
c knockouts (
emely power
mice, 668 nuc
n endonuclea
ignal (NLS)
NA segment P site is come the actual bites and exciule.
ecific transge
o the gene of
gh tissue-spe
udy, rat insul
(Figure 8).
rful and can b
cleotides of t
ase digestion
and a polya
transcribingmposed of twbreakage andises out the D
enic express
f interest. T
ecific promo
lin promoter
The range o
be as efficie
the Rat Insu
n and ligated
adenylation s
g the exon ofwo 13 bp
d ligation ocDNA segmen
sion of cre
he spatial or
oters or ligan
r-cre (RIP-C
f DNA excis
ent as 90%
ulin Promoter
d to the codin
signal (Ray
f
ccurs. nt
r
nd-
Cre)
sion
r
ng
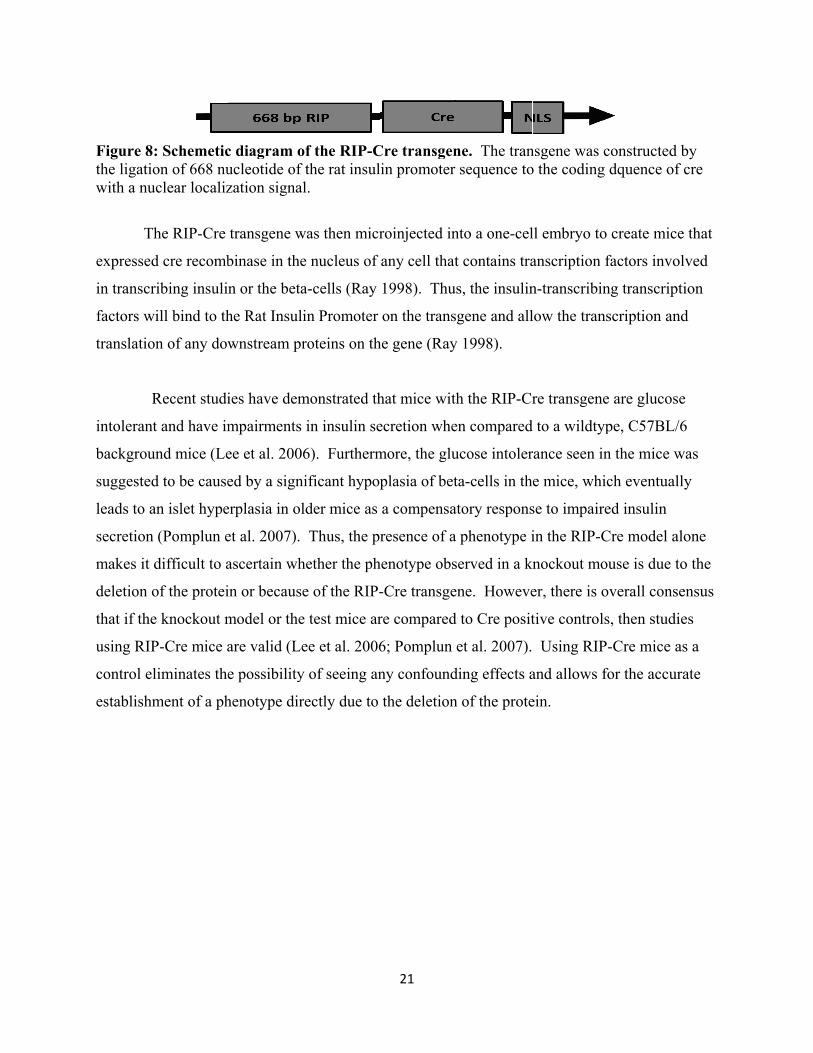
Figure 8the ligatiwith a nu
T
expressed
in transcr
factors w
translatio
R
intoleran
backgrou
suggested
leads to a
secretion
makes it
deletion o
that if the
using RIP
control e
establishm
8: Schemeticon of 668 nu
uclear localiz
The RIP-Cre
d cre recomb
ribing insuli
will bind to th
on of any dow
Recent studi
nt and have im
und mice (Le
d to be cause
an islet hype
n (Pomplun e
difficult to a
of the protei
e knockout m
P-Cre mice a
liminates the
ment of a ph
c diagram oucleotide of zation signal
transgene w
binase in the
n or the beta
he Rat Insuli
wnstream pr
ies have dem
mpairments
ee et al. 2006
ed by a signi
erplasia in ol
et al. 2007).
ascertain wh
in or because
model or the
are valid (Le
e possibility
henotype dir
of the RIP-Cthe rat insull.
was then micr
e nucleus of
a-cells (Ray
in Promoter
roteins on th
monstrated th
in insulin se
6). Furtherm
ificant hypop
lder mice as
Thus, the pr
hether the ph
e of the RIP-
e test mice ar
ee et al. 2006
y of seeing an
ectly due to
21
Cre transgenin promoter
roinjected in
any cell that
1998). Thu
on the trans
he gene (Ray
hat mice with
ecretion whe
more, the glu
plasia of bet
a compensa
resence of a
henotype obs
-Cre transge
re compared
6; Pomplun
ny confound
the deletion
ne. The transequence to
nto a one-cel
t contains tra
s, the insulin
gene and all
y 1998).
h the RIP-Cr
en compared
ucose intoler
ta-cells in th
atory respons
phenotype i
served in a k
ene. Howeve
d to Cre posit
et al. 2007).
ding effects a
n of the prote
nsgene was co the coding
ll embryo to
anscription f
n-transcribin
low the trans
re transgene
d to a wildtyp
rance seen in
e mice, whic
se to impaire
in the RIP-C
knockout mou
er, there is o
tive controls
Using RIP-
and allows fo
ein.
constructed bdquence of c
create mice
factors invol
ng transcripti
scription and
e are glucose
pe, C57BL/6
n the mice w
ch eventually
ed insulin
Cre model alo
use is due to
verall conse
s, then studie
-Cre mice as
for the accura
by cre
that
ved
ion
d
e
6
was
y
one
o the
ensus
es
s a
ate
22
1.6 General Hypothesis
The objective of this project was to elucidate the specific physiological role of UCP2 in
the pancreatic beta-cell. Considering UCP2’s broad tissue expression, its function may also vary
depending on the tissue being studied and the UCP2-/- model may have been too simple to
establish a confirmed role of UCP2 in a specific tissue. So far, studies in whole body knockout
models resulted in further debate of UCP2’s function and there has been no consensus on
function. The role of UCP2 in the beta-cell in terms of insulin secretion has been well described,
however, recent studies have also suggested UCP2 having a cytoprotective function against
oxidative stress. Thus, UCP2’s function in the beta-cell is still questionable and it is imperative
to study its role without any compensatory effects. Therefore, it is essential to create a beta-cell
specific UCP2 knock out (UCP2BKO) model to determine the independent effect of deleting
UCP2 in the beta-cell. We hypothesize that UCP2 negatively regulates beta-cell function and
the deletion of UCP2 specifically in the beta-cells will result in higher efficiency of oxidative
phosphorylation leading to increased ATP production and enhanced insulin secretion.
The specific Aims of this project were to:
1) Generate a beta-cell specific knockout model of UCP2 (UCP2BKO)
2) Confirm efficient deletion of UCP2 in the Beta-cells
3) Characterize the in vivo metabolic parameters of UCP2BKO
4) Characterize in vitro beta-cell function of the UCP2BKO
23
Chapter 2: Creation and In Vivo characterization of β-Cell Specific Knockout of UCP2 (UCP2BKO)
2.1 Hypothesis
In this study, beta-cell specific knockout of UCP2 (UCP2BKO) will be generated using the
Cre-Lox recombination system and various in vivo metabolic parameters will be measured. We
hypothesize that cre-lox recombination using the RIP-Cre model will result in effective deletion
of UCP2; specifically from the beta-cells.
Overwhelming evidence in the past has demonstrated that UCP2 provides a proton leak
mechanism to dissipate the proton motive force, which leads to less efficient production of ATP
resulting in a decrease in insulin secretion (Chan et al. 1999; Zhang et al. 2001; Joseph et al.
2002; Zhang et al. 2006). Thus, it is proposed that deleting UCP2 will result in more efficient
coupling between substrate oxidation and ATP synthase leading to increased ATP generation and
enhanced insulin secretion. Thus, we hypothesize that UCP2 is a negative regulator of insulin
secretion and the in vivo phenotype of the UCP2BKO model will reflect this accordingly; with
no differences in body weight, improved glucose tolerance and increased glucose-stimulated
insulin secretion.
2.2 Method and Materials 2.2.1 Reagents
RedTaq polymerase (Sigma D4309) was used for Multiplex PCR. All primers were
ordered from invitrogen (Canada) and sequences are listed in Table 3 & 4. Islets were isolated
using Collagense type-V (Sigma, Canada). The monoclonal Cre antibody was obtained from
Covance (USA) and the polyclonal UCP2 antibody was purchased from Everest Biotech (UK).
Guinea pig anti-swine insulin (Dako), fluorescein (FITC)- and cyanine (Cy5)-labeled secondary
antibodies (Jackson ImmunoResearch, USA) were also used.
2.2.2 Animal Breeding
The loxP sites were integrated between the start codon sequence of the UCP2 gene; one
upstream of exon 3 and one downstream of exon 4. Exon 1 and 2 of the UCP2 gene are
untranslated exons (Pecqueur et al 1999). Although 3 ATG sites have been found in exon 2,
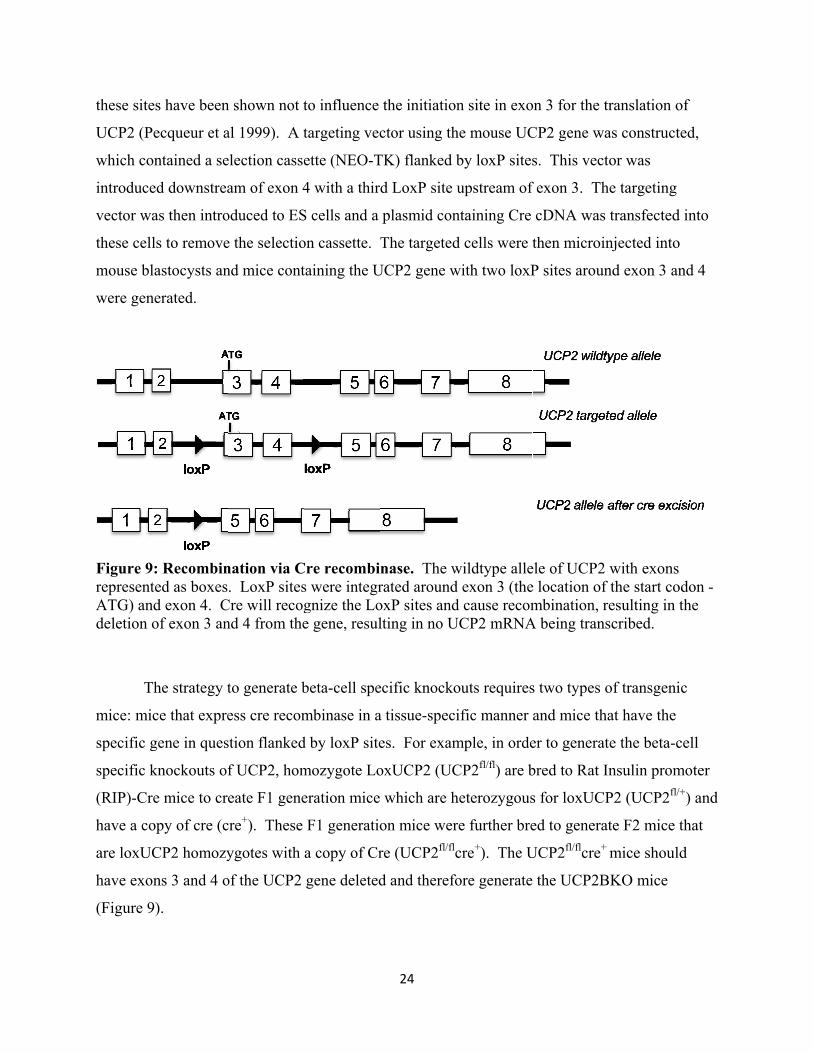
these site
UCP2 (P
which co
introduce
vector wa
these cell
mouse bl
were gen
Figure 9representATG) andeletion o
T
mice: mi
specific g
specific k
(RIP)-Cr
have a co
are loxUC
have exo
(Figure 9
es have been
Pecqueur et a
ontained a se
ed downstrea
as then intro
ls to remove
lastocysts an
nerated.
9: Recombinted as boxes
nd exon 4. Cof exon 3 an
The strategy t
ce that expre
gene in ques
knockouts of
re mice to cre
opy of cre (c
CP2 homozy
ons 3 and 4 o
9).
n shown not t
al 1999). A t
election casse
am of exon 4
oduced to ES
e the selectio
nd mice cont
nation via C. LoxP sites
Cre will recognd 4 from the
to generate b
ess cre recom
stion flanked
f UCP2, hom
eate F1 gene
cre+). These
ygotes with
of the UCP2
to influence
targeting vec
ette (NEO-T
4 with a thir
S cells and a
on cassette.
taining the U
Cre recombis were integrgnize the Loe gene, resul
beta-cell spe
mbinase in a
d by loxP site
mozygote Lo
eration mice
F1 generatio
a copy of Cr
gene deleted
24
the initiation
ctor using th
TK) flanked b
d LoxP site
plasmid con
The targeted
UCP2 gene w
nase. The wrated aroundoxP sites andlting in no U
ecific knocko
a tissue-speci
es. For exam
oxUCP2 (UC
which are h
on mice wer
re (UCP2fl/flc
d and therefo
n site in exo
he mouse UC
by loxP sites
upstream of
ntaining Cre
d cells were
with two loxP
wildtype alled exon 3 (thed cause recom
UCP2 mRNA
outs requires
ific manner
mple, in orde
CP2fl/fl) are b
heterozygous
re further bre
cre+). The U
ore generate
on 3 for the tr
CP2 gene wa
s. This vect
f exon 3. Th
cDNA was
then microin
P sites aroun
ele of UCP2 e location of mbination, r
A being trans
s two types o
and mice tha
er to generat
bred to Rat I
s for loxUCP
ed to generat
UCP2fl/flcre+
the UCP2B
ranslation of
as constructe
tor was
he targeting
transfected i
njected into
nd exon 3 an
with exons the start codesulting in thscribed.
of transgenic
at have the
te the beta-ce
nsulin prom
P2 (UCP2fl/+
te F2 mice th
mice should
BKO mice
f
ed,
into
nd 4
don - he
c
ell
moter +) and
hat
d
25
The UCP2lox homozygote mice that also express Cre in beta-cells should have exons 3
and 4 of the UCP2 gene deleted, which excises the start codon, and therefore generates
UCP2BKO mice. In vivo and ex vivo analysis will be conducted on these mice and compared to
the controls; RIP-Cre. Using RIP-Cre mice as controls should account for any effects of this
transgene alone. The oral glucose tolerance test was also conducted in floxed controls (mice that
were homozygote for loxUCP2 with no cre) to confirm that differences observed in glucose
tolerance between the UCP2BKO and RIP-Cre mice were due to the deletion of UCP2 in beta-
cells. Studies have shown that RIP-Cre mice are glucose intolerant, and thus it was imperative to
compare the OGTT values against another control to ascertain that results obtained were not
solely due to the presence of the RIP-Cre transgene. All animal experiments were approved by
the Animal Care Committee at the University of Toronto and animals were handled according to
the guidelines of the Canadian Council of Animal Care.
2.2.3 Pancreatic islet isolation and culture Mice were anesthetized by intraperitoneal injection of approximately 250 mg/kg of
tribromoethanol. The pancreas was perfused with collagenase type-V (0.8 mg/ml) in RPMI-
1640 (supplemented with 11.1 mM glucose) with 2% bovine serum albumin and 1% penicillin
and streptomycin. The collagenase solution was perfused into the pancreas via the common bile
duct. The perfused pancreas was then extracted from surrounding tissues and digested for 15
min at 37 °C. RPMI-1640 media stored at 4 °C was added to arrest the digestion process and
islets were then manually picked using a dissection microscope. In order to allow complete
recovery, islets were cultured overnight in a 37 °C, 5% CO2 incubator.
2.2.4 Islet cell dispersion Isolated islets were washed in phosphate buffered saline (PBS) with 2mM EGTA.
Dispersion of islets was carried out with 0.125% dispase II (Roche Diagnostics) for 5 min at
37°C with gentle mixing with a pipette. The addition of RPMI-1640 media with 10% fetal
bovine serum arrested the further dispersion of islets. Islet cells were then resuspended with
fresh media and plated on a glass coverslip, which was coated with poly-L-lysine solution
(Sigma). The coverslips were placed in a 37 °C, 5% CO2 incubator and the cells allowed to
attach before further experiments.
26
2.2.5 RNA extraction & Reverse Transcription of animal tissues Mice were anesthetized using the protocol previously mentioned and tissues (spleen,
hypothalamus, small intestine, brain, kidney, etc) were isolated, washed in PBS and flash-frozen
using dry ice and stored in – 80 °C until further use. Prior to extraction, tissues were
homogenized either manually (vigorously mixing with a pipette) or using an electronic polytron.
RNA was extracted using the TRIzol (Invitrogen) reagent and following the manufacturers’
protocol. Reverse transcription to make cDNA was completed using Invitrogen’s Superscript II
kit and also following the manufacturers’ protocol.
2.2.6 DNA Extraction & Multiplex PCR Genotyping of the mice was completed using tail DNA and standard multiplex PCR. Tail
clips were digested overnight using a DNA lysis buffer on a waterbath (100 mM of Tris, 5 mM
of EDTA, 0.2% SDS, 200 mM NaCl ) at 37 °C. Subsequently, tail samples were vigorously
mixed with a 50% chloroform and 50% phenol solution for 1 hour and then spun at 13 000 rpm
for 10 min. The supernatant, which contained the DNA, was removed into a new tube to which
isopropanol was added. After another spin at 13 000 rpm for 10 min, the DNA was found as a
pellet on the tube and a final wash with 70% ethanol was conducted. Tubes were then air dryed
for approximately 2 hrs and 50 ul of water was added to redissolve the DNA. PCR was
conducted to determine the presence of the cre transgene as well as the zygosity for loxUCP2
using RedTaq DNA polymerase (Sigma-Aldrich, Canada) and an annealing temperature of 59 °C
and 62 °C, respectively. Sequences for cre and loxUCP2 genotyping are listed below in Table 3.
PCR products were run on 1.2% agarose gel (with 0.1% ethidium bromide) to identify the
amplification of a 380 bp for loxUCP2, 270 bp band for a wt UCP2 gene, and the presence of a
250 bp band representing cre recombinase.
2.2.7 Real-time PCR Quantification of mRNA expression was performed using a SYBR green detection
system (SYBR Green PCR Master Mix, Applied Biosystems). The real-time PCR conditions
were 2 min at 50°C, 10 min at 95°C, and then 40 cycles for 15 s at 95°C and 1 min at 53°C. Melt
27
curve analysis showed that the primer set amplified one product. Expression was normalized to
β-actin (a housekeeping gene) levels. Sequences for RT-PCR are listed below in Table 3.
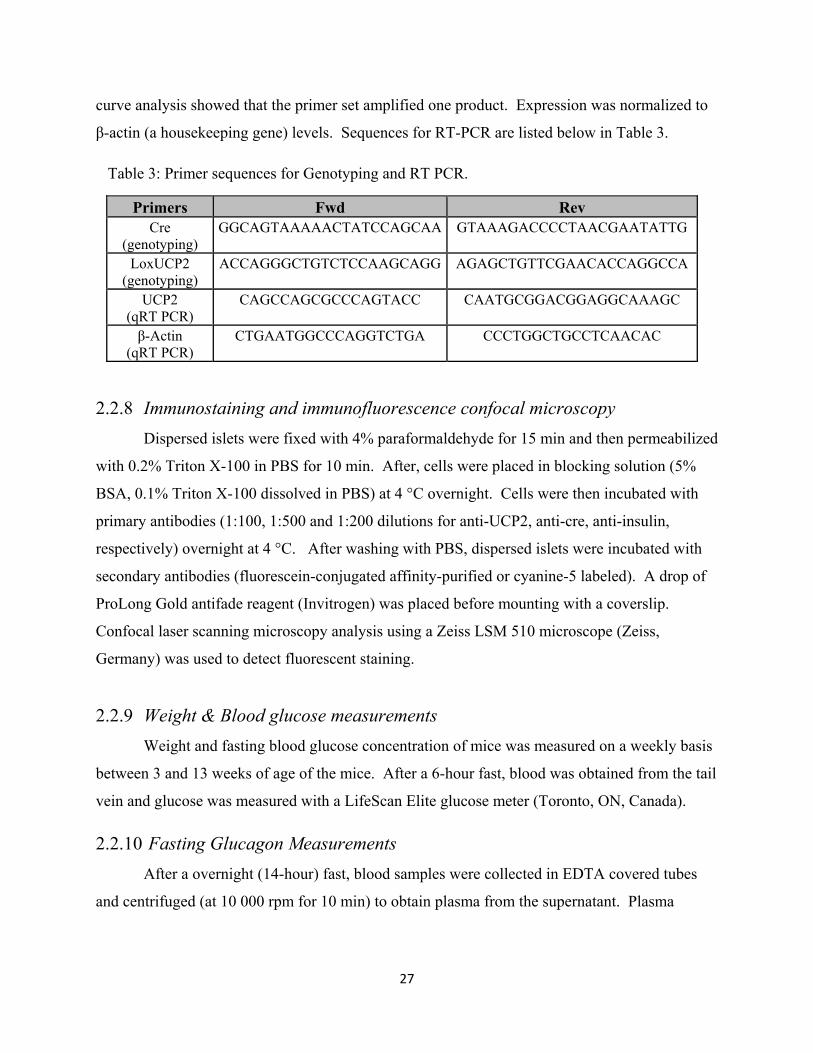
Table 3: Primer sequences for Genotyping and RT PCR.
Primers Fwd Rev Cre
(genotyping) GGCAGTAAAAACTATCCAGCAA GTAAAGACCCCTAACGAATATTG
LoxUCP2 (genotyping)
ACCAGGGCTGTCTCCAAGCAGG AGAGCTGTTCGAACACCAGGCCA
UCP2 (qRT PCR)
CAGCCAGCGCCCAGTACC CAATGCGGACGGAGGCAAAGC
β-Actin (qRT PCR)
CTGAATGGCCCAGGTCTGA CCCTGGCTGCCTCAACAC
2.2.8 Immunostaining and immunofluorescence confocal microscopy Dispersed islets were fixed with 4% paraformaldehyde for 15 min and then permeabilized
with 0.2% Triton X-100 in PBS for 10 min. After, cells were placed in blocking solution (5%
BSA, 0.1% Triton X-100 dissolved in PBS) at 4 °C overnight. Cells were then incubated with
primary antibodies (1:100, 1:500 and 1:200 dilutions for anti-UCP2, anti-cre, anti-insulin,
respectively) overnight at 4 °C. After washing with PBS, dispersed islets were incubated with
secondary antibodies (fluorescein-conjugated affinity-purified or cyanine-5 labeled). A drop of
ProLong Gold antifade reagent (Invitrogen) was placed before mounting with a coverslip.
Confocal laser scanning microscopy analysis using a Zeiss LSM 510 microscope (Zeiss,
Germany) was used to detect fluorescent staining.
2.2.9 Weight & Blood glucose measurements Weight and fasting blood glucose concentration of mice was measured on a weekly basis
between 3 and 13 weeks of age of the mice. After a 6-hour fast, blood was obtained from the tail
vein and glucose was measured with a LifeScan Elite glucose meter (Toronto, ON, Canada).
2.2.10 Fasting Glucagon Measurements After a overnight (14-hour) fast, blood samples were collected in EDTA covered tubes
and centrifuged (at 10 000 rpm for 10 min) to obtain plasma from the supernatant. Plasma
28
glucagon was measured using a Linco Research Radioimmunoassay (RIA) kit and following the
manufacturers’ protocol.
2.2.11 Measurement of glucose tolerance Glucose tolerance was measured using two different methods of glucose infusion: either
an intraperitoneal injection or an oral gavage of glucose. Intraperitoneal glucose tolerance tests
(ipGTT) were carried out at 12 weeks of age in both males and females. Following a 6-hour fast,
an exogenous load of glucose (2 g/Kg of body weight) was injected intra-peritoneally and blood
glucose levels were measured at 0, 2, 5, 15, 30, 60, 120 minutes after injection.
Oral glucose tolerance tests (OGTT) were also carried out at 12 weeks of age in both
males and females. Following a 12 to 16-hour overnight fast, an exogenous load of glucose
(2g/Kg) was given with an oral gavage and blood glucose levels were measured at 0, 10, 20, 30,
60, 120 minutes. Blood samples were collected at 0, 10, 20 and 60 minutes to measure plasma
insulin concentration in 5uL samples using an ALPCO Ultrasensitive ELISA kit (ALPCO
diagnostics, NH, USA) and following the manufacturers protocol.
2.2.12 Measurement of insulin sensitivity Insulin sensitivity was measured by an intraperitoneal insulin tolerance test (ipITT) on 13
weeks-old male and female mice. Following a 4-hour fast, an exogenous load of insulin (0.75
IU/Kg of body weight) was injected intra-peritoneally and blood glucose levels were measured at
0, 15, 30, 60, 120 minutes after injection.
2.2.13 Statistical Analysis Statistical significance was assessed by using either the Student’s t test (GraphPad Prism 4)
or a one- or two-way ANOVA for repeated measures followed by a Bonferroni post-test
comparisons using GraphPad Prism 4. A p-value of less than 0.05 was considered significant.
All data is expressed as the mean ± SE.
2.3 Res 2.3.1 G
In
extraction
that the a
wildtype
was used
the cre tr
mice.
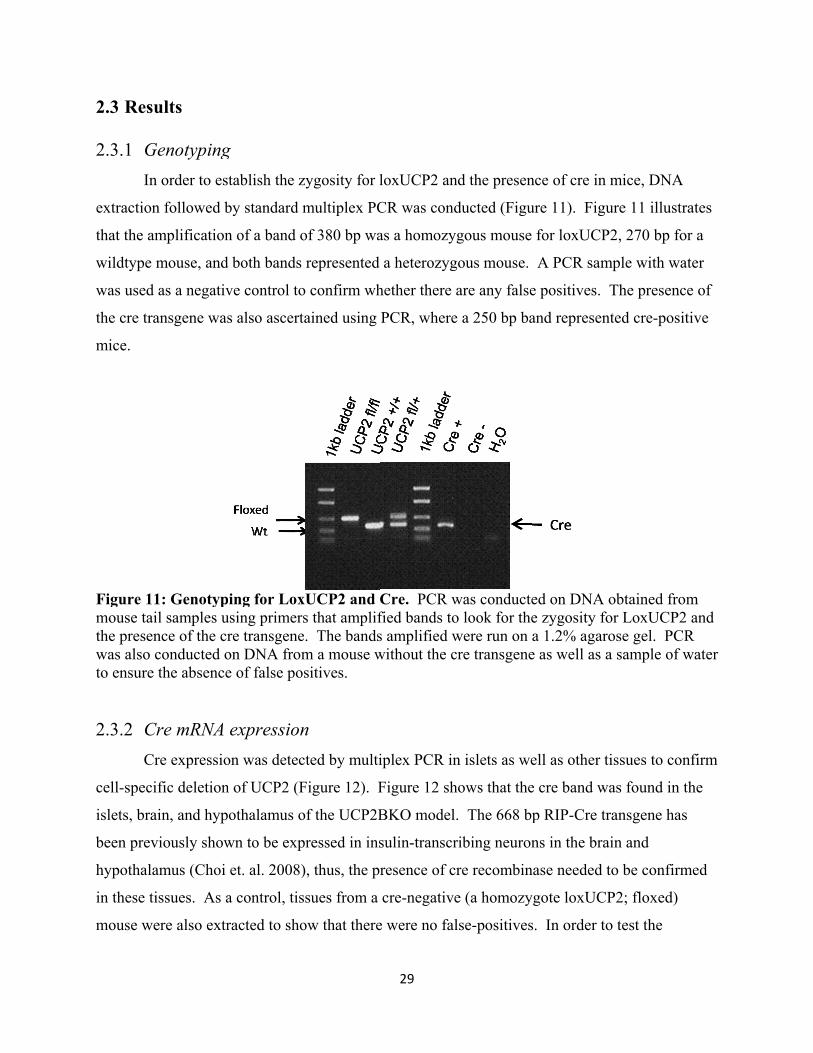
Figure 1mouse tathe presewas also to ensure 2.3.2 C
C
cell-spec
islets, bra
been prev
hypothal
in these t
mouse w
sults
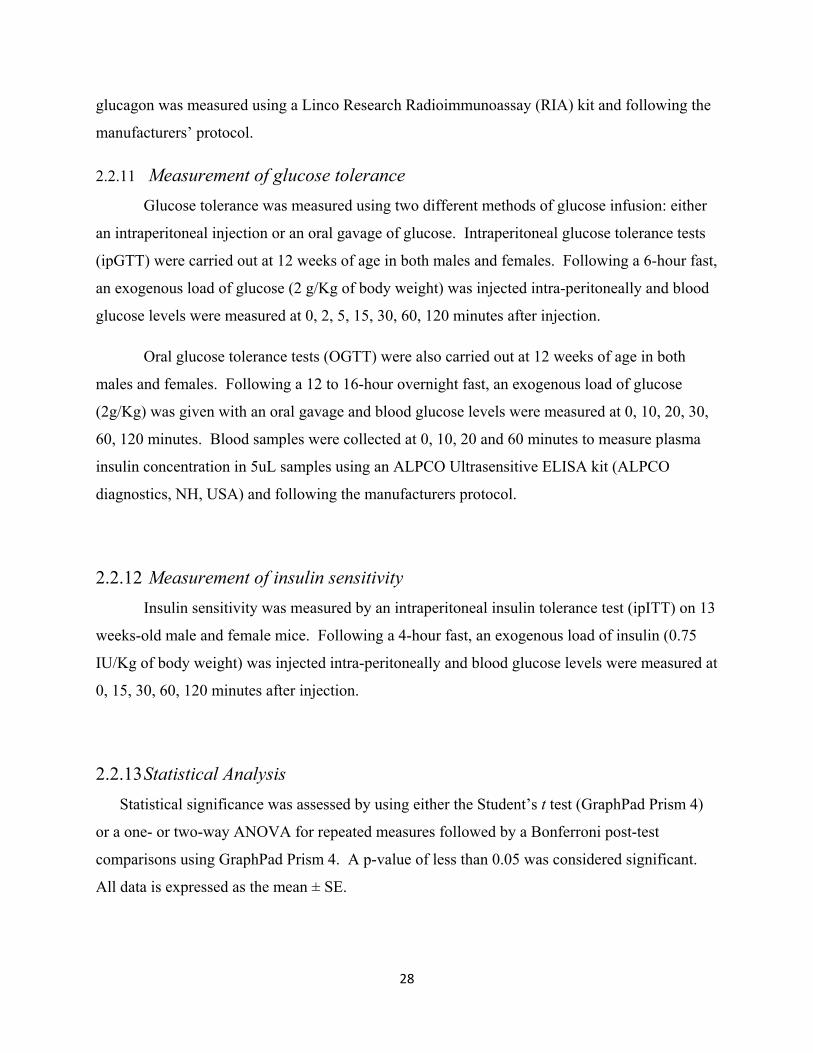
Genotypingn order to es
n followed b
amplification
mouse, and
d as a negativ
ransgene was
1: Genotyp
ail samples uence of the cr
conducted oe the absence
Cre mRNA Cre expressio
cific deletion
ain, and hyp
viously show
amus (Choi
tissues. As a
were also extr
g tablish the z
by standard m
n of a band o
d both bands
ve control to
s also ascert
ing for Loxusing primersre transgeneon DNA frome of false pos
expressionon was detec
n of UCP2 (F
othalamus o
wn to be exp
et. al. 2008)
a control, tis
racted to sho
zygosity for l
multiplex PC
of 380 bp wa
represented
o confirm wh
ained using
xUCP2 and Cs that amplif. The bandsm a mouse wsitives.
n cted by multi
Figure 12). F
of the UCP2B
pressed in ins
), thus, the pr
sues from a
ow that there
29
loxUCP2 an
CR was cond
as a homozy
a heterozyg
hether there a
PCR, where
Cre. PCR wfied bands tos amplified wwithout the c
iplex PCR in
Figure 12 sh
BKO model
sulin-transcr
resence of cr
cre-negative
e were no fal
nd the presen
ducted (Figu
gous mouse
gous mouse.
are any false
e a 250 bp ba
was conducteo look for thewere run on cre transgene
n islets as we
hows that the
. The 668 bp
ribing neuron
re recombin
e (a homozy
lse-positives
nce of cre in
ure 11). Figu
for loxUCP
A PCR sam
e positives.
and represen
ed on DNA e zygosity foa 1.2% agaroe as well as a
ell as other t
e cre band w
p RIP-Cre tr
ns in the bra
nase needed t
ygote loxUCP
s. In order to
mice, DNA
ure 11 illustr
P2, 270 bp fo
mple with wa
The presenc
nted cre-posi
obtained froor LoxUCP2ose gel. PCRa sample of w
tissues to con
as found in t
ransgene has
ain and
to be confirm
P2; floxed)
o test the
rates
or a
ater
ce of
tive
om 2 and R water
nfirm
the
s
med
30
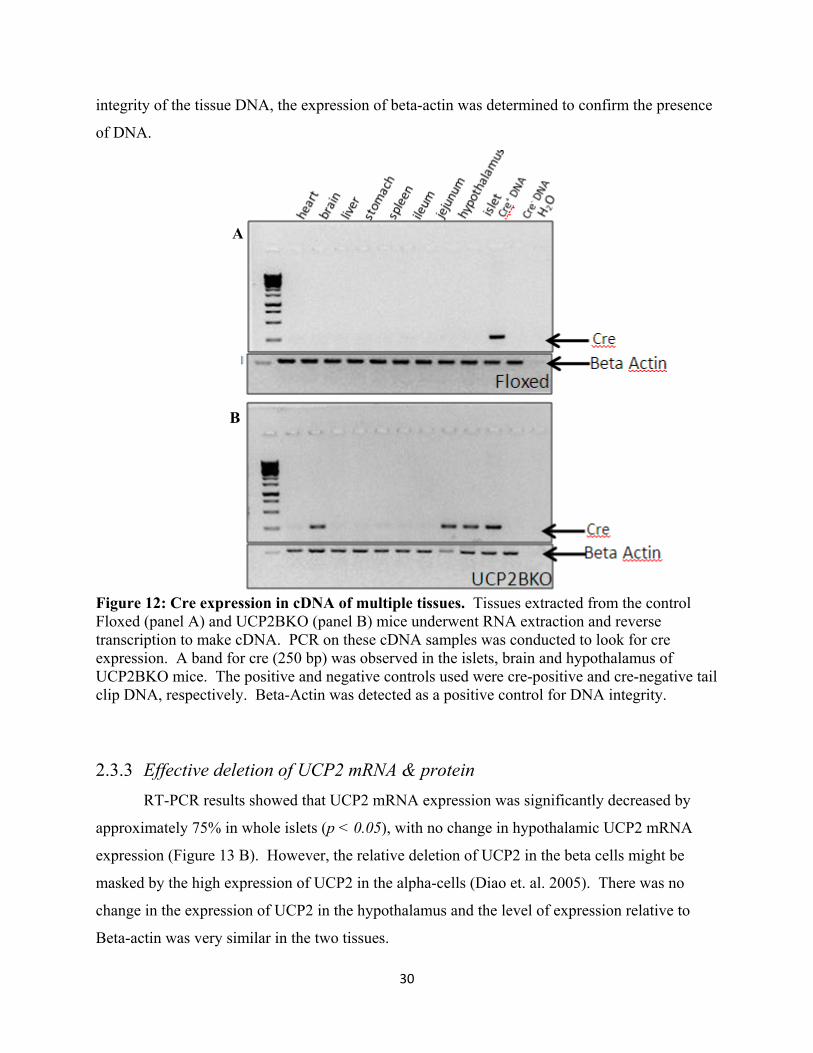
integrity of the tissue DNA, the expression of beta-actin was determined to confirm the presence
of DNA.
Figure 12: Cre expression in cDNA of multiple tissues. Tissues extracted from the control Floxed (panel A) and UCP2BKO (panel B) mice underwent RNA extraction and reverse transcription to make cDNA. PCR on these cDNA samples was conducted to look for cre expression. A band for cre (250 bp) was observed in the islets, brain and hypothalamus of UCP2BKO mice. The positive and negative controls used were cre-positive and cre-negative tail clip DNA, respectively. Beta-Actin was detected as a positive control for DNA integrity.
2.3.3 Effective deletion of UCP2 mRNA & protein RT-PCR results showed that UCP2 mRNA expression was significantly decreased by
approximately 75% in whole islets (p < 0.05), with no change in hypothalamic UCP2 mRNA
expression (Figure 13 B). However, the relative deletion of UCP2 in the beta cells might be
masked by the high expression of UCP2 in the alpha-cells (Diao et. al. 2005). There was no
change in the expression of UCP2 in the hypothalamus and the level of expression relative to
Beta-actin was very similar in the two tissues.
A
B
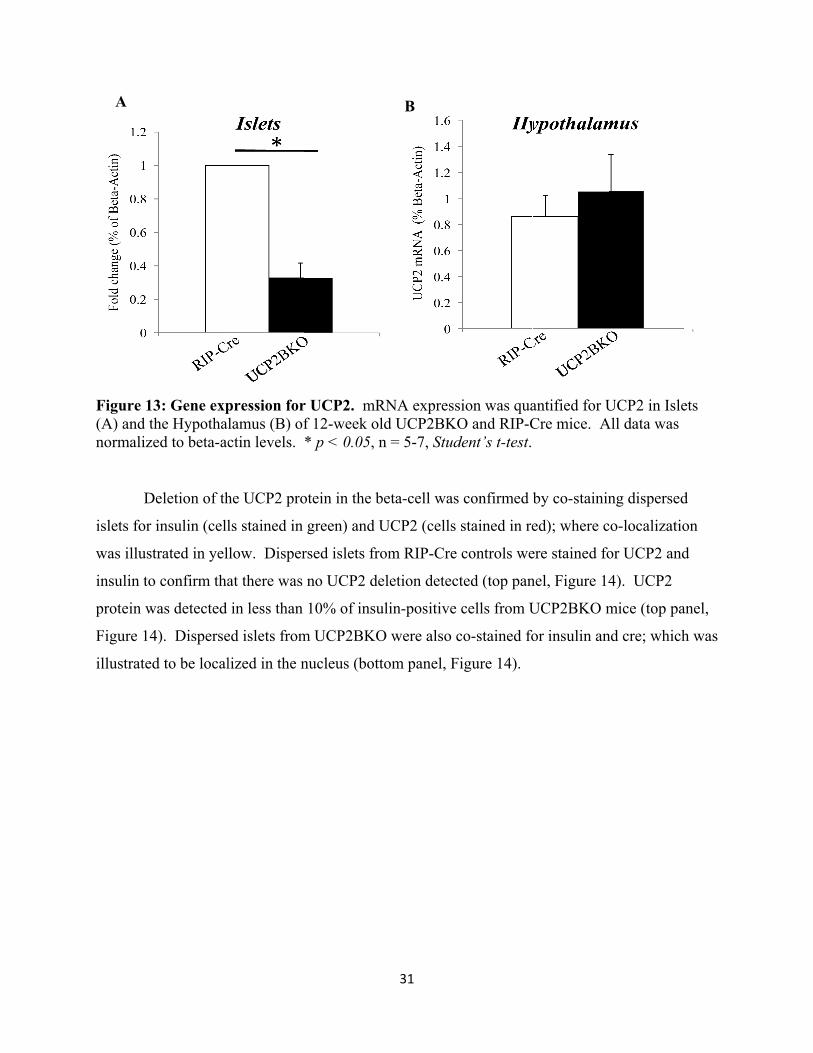
Figure 1(A) and tnormaliz
D
islets for
was illus
insulin to
protein w
Figure 14
illustrate
A
3: Gene expthe Hypothalzed to beta-ac
Deletion of th
insulin (cell
trated in yel
o confirm tha
was detected
4). Disperse
d to be local
pression forlamus (B) ofctin levels.
he UCP2 pro
ls stained in
low. Disper
at there was
in less than
ed islets from
lized in the n
r UCP2. mRf 12-week ol* p < 0.05, n
otein in the b
green) and U
rsed islets fro
no UCP2 de
10% of insu
m UCP2BKO
nucleus (bott
31
RNA expressld UCP2BKn = 5-7, Stud
beta-cell was
UCP2 (cells
om RIP-Cre
eletion detec
ulin-positive
O were also c
tom panel, F
B
sion was quaKO and RIP-C
dent’s t-test.
s confirmed
stained in re
e controls we
cted (top pan
cells from U
co-stained fo
Figure 14).
antified for UCre mice. A
by co-stainin
ed); where c
ere stained fo
nel, Figure 1
UCP2BKO m
or insulin an
UCP2 in IsleAll data was
ng dispersed
co-localizatio
or UCP2 and
4). UCP2
mice (top pa
nd cre; which
ets
d
on
d
anel,
h was
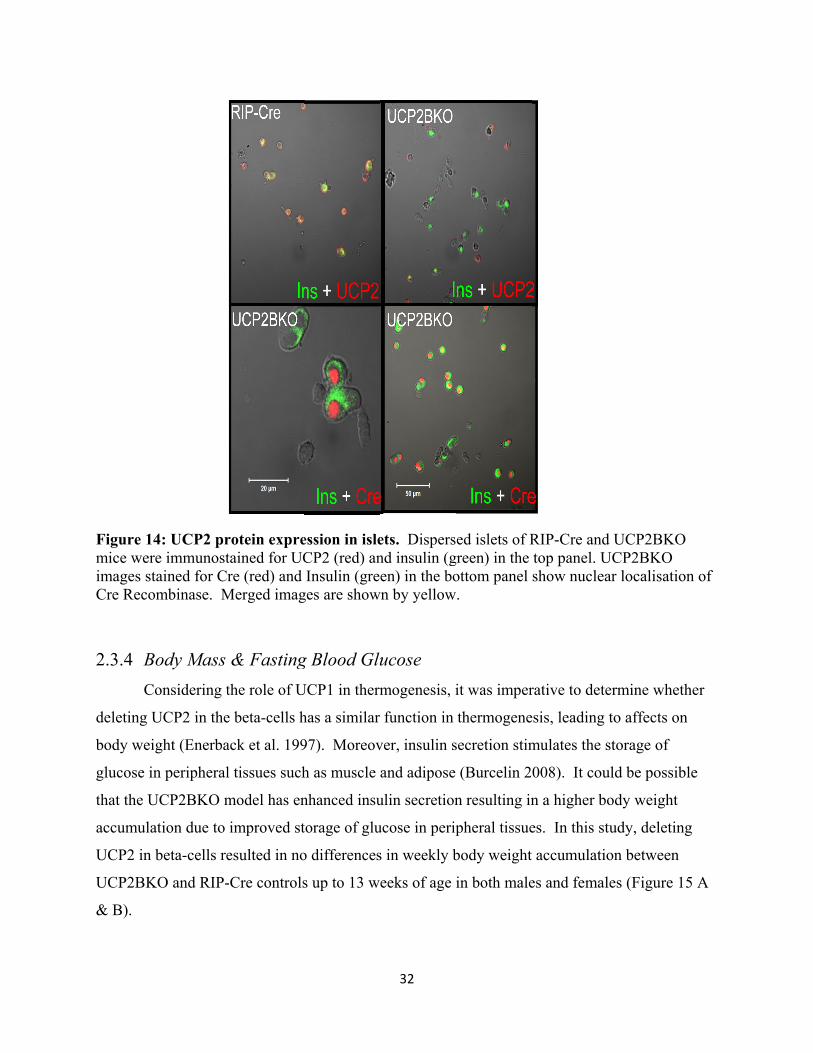
Figure 1mice werimages stCre Reco
2.3.4 BC
deleting U
body wei
glucose i
that the U
accumula
UCP2 in
UCP2BK
& B).
4: UCP2 prre immunosttained for Crombinase. M
Body Mass Considering t
UCP2 in the
ight (Enerba
in peripheral
UCP2BKO m
ation due to
beta-cells re
KO and RIP-
rotein expretained for UCre (red) and
Merged imag
& Fastingthe role of U
e beta-cells h
ack et al. 199
l tissues such
model has en
improved st
esulted in no
-Cre controls
ession in isleCP2 (red) anInsulin (gre
ges are show
g Blood GluUCP1 in therm
has a similar
97). Moreov
h as muscle
nhanced insu
torage of glu
o differences
s up to 13 w
32
ets. Dispersnd insulin (gen) in the bo
wn by yellow
ucose mogenesis, i
function in
ver, insulin s
and adipose
ulin secretion
ucose in perip
s in weekly b
eeks of age i
ed islets of Rgreen) in the ottom panel .
it was imper
thermogene
secretion stim
(Burcelin 2
n resulting in
pheral tissue
body weight
in both male
RIP-Cre andtop panel. Ushow nuclea
rative to dete
sis, leading
mulates the s
008). It cou
n a higher bo
es. In this st
accumulatio
es and femal
d UCP2BKOUCP2BKO ar localisatio
ermine wheth
to affects on
storage of
uld be possib
ody weight
tudy, deletin
on between
les (Figure 1
O
on of
her
n
ble
g
5 A
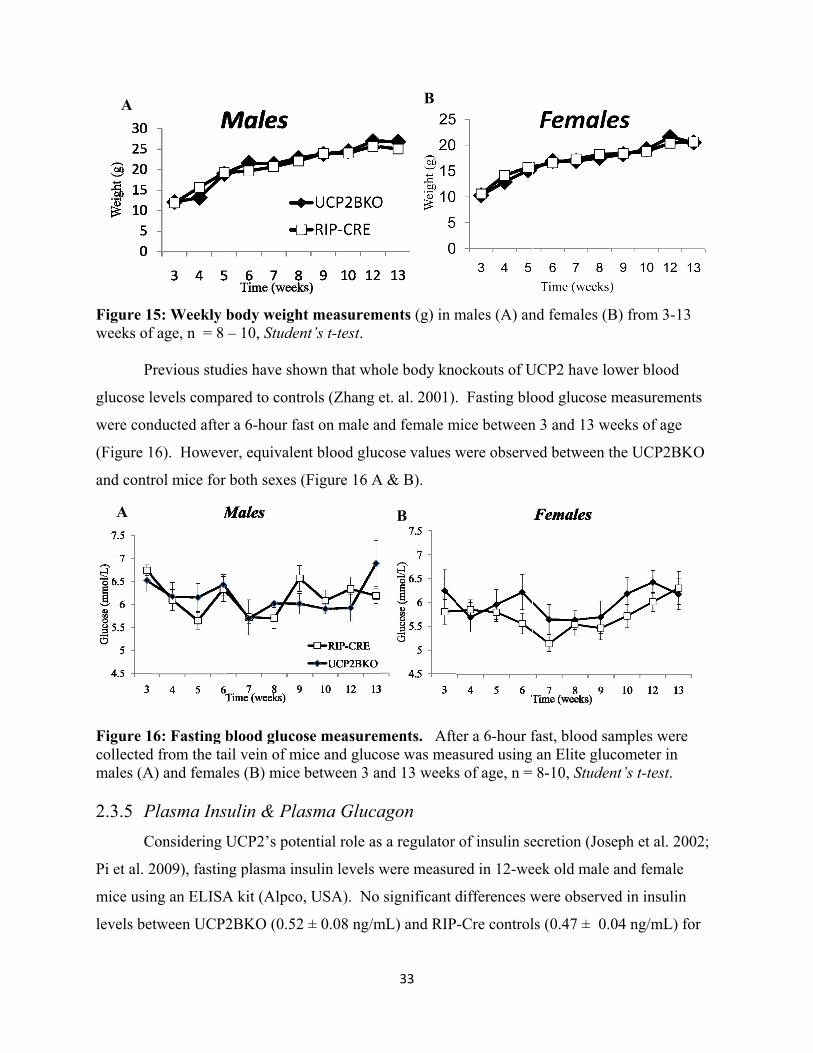
Figure 1weeks of
P
glucose l
were con
(Figure 1
and contr
Figure 1collectedmales (A 2.3.5 P
C
Pi et al. 2
mice usin
levels be
A
A
5: Weekly bf age, n = 8 –
revious stud
levels compa
nducted after
16). Howeve
rol mice for
6: Fasting bd from the taiA) and female
Plasma InsuConsidering U
2009), fastin
ng an ELISA
tween UCP2
body weight– 10, Studen
dies have sho
ared to contr
r a 6-hour fa
er, equivalen
both sexes (
blood glucosil vein of mies (B) mice b
ulin & PlaUCP2’s pote
ng plasma ins
A kit (Alpco,
2BKO (0.52
t measuremnt’s t-test.
own that who
rols (Zhang e
st on male a
nt blood gluc
(Figure 16 A
se measuremice and glucobetween 3 a
asma Glucaential role as
sulin levels w
, USA). No
± 0.08 ng/m
33
ments (g) in m
ole body kno
et. al. 2001).
nd female m
cose values w
A & B).
ments. Aftose was meand 13 weeks
agon s a regulator
were measur
significant d
mL) and RIP
B
B
males (A) an
ockouts of U
. Fasting blo
mice between
were observ
er a 6-hour fasured usings of age, n =
of insulin se
red in 12-we
differences w
-Cre control
nd females (B
UCP2 have lo
ood glucose
n 3 and 13 w
ed between
fast, blood sa an Elite glu 8-10, Stude
ecretion (Jos
eek old male
were observe
ls (0.47 ± 0.
B) from 3-13
ower blood
measuremen
weeks of age
the UCP2BK
amples wereucometer in ent’s t-test.
seph et al. 20
e and female
ed in insulin
.04 ng/mL) f
3
nts
KO
e
002;
n
for
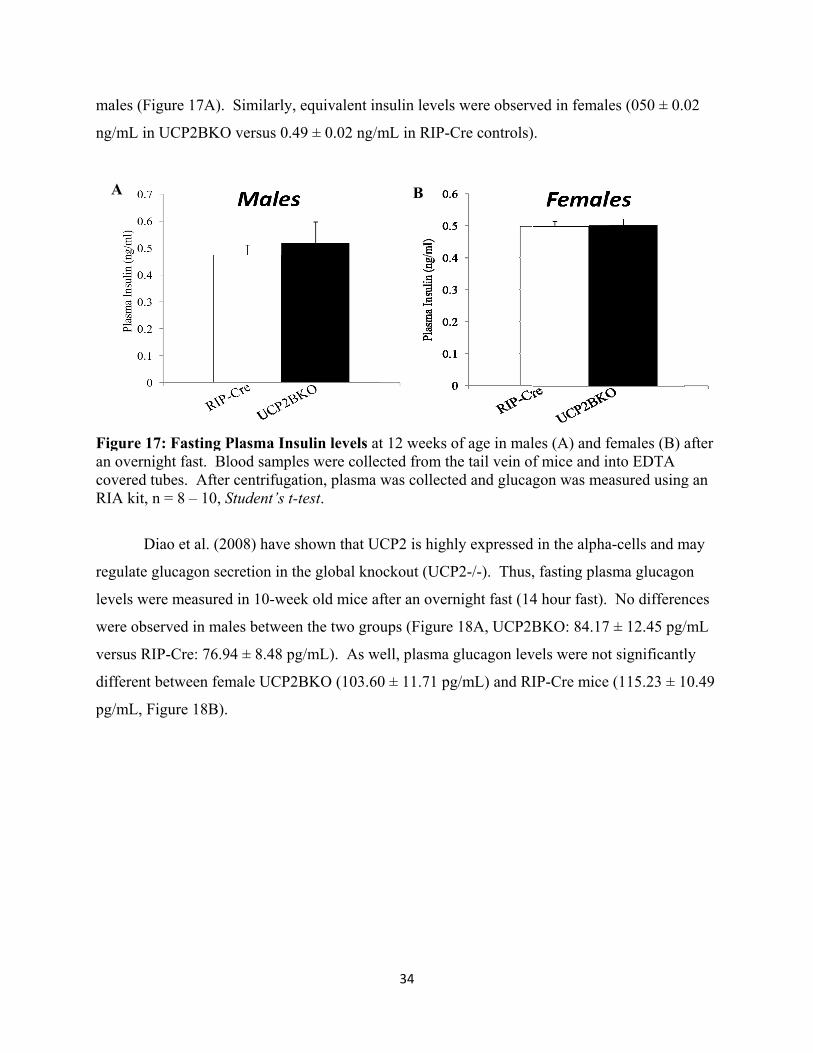
males (Fi
ng/mL in
Figure 1an overnicovered tRIA kit,
D
regulate g
levels we
were obs
versus RI
different
pg/mL, F
A
igure 17A).
n UCP2BKO
7: Fasting Pight fast. Bltubes. Aftern = 8 – 10, S
Diao et al. (20
glucagon sec
ere measured
served in ma
IP-Cre: 76.9
between fem
Figure 18B).
Similarly, e
O versus 0.49
Plasma Insulood samplesr centrifugatiStudent’s t-te
008) have sh
cretion in th
d in 10-week
ales between
94 ± 8.48 pg/
male UCP2B
equivalent in
9 ± 0.02 ng/m
ulin levels ats were collecion, plasma est.
hown that UC
e global kno
k old mice af
the two grou
/mL). As w
BKO (103.60
34
nsulin levels
mL in RIP-C
t 12 weeks octed from thwas collecte
CP2 is highl
ockout (UCP
fter an overn
ups (Figure
ell, plasma g
0 ± 11.71 pg
B
were observ
Cre controls)
of age in malhe tail vein oed and gluca
ly expressed
P2-/-). Thus,
night fast (14
18A, UCP2B
glucagon lev
g/mL) and RI
ved in femal
).
les (A) and ff mice and ingon was me
d in the alpha
, fasting plas
4 hour fast).
BKO: 84.17
vels were not
IP-Cre mice
es (050 ± 0.0
females (B) nto EDTA asured using
a-cells and m
sma glucago
No differen
7 ± 12.45 pg/
t significantl
(115.23 ± 1
02
after
g an
may
on
nces
/mL
ly
10.49
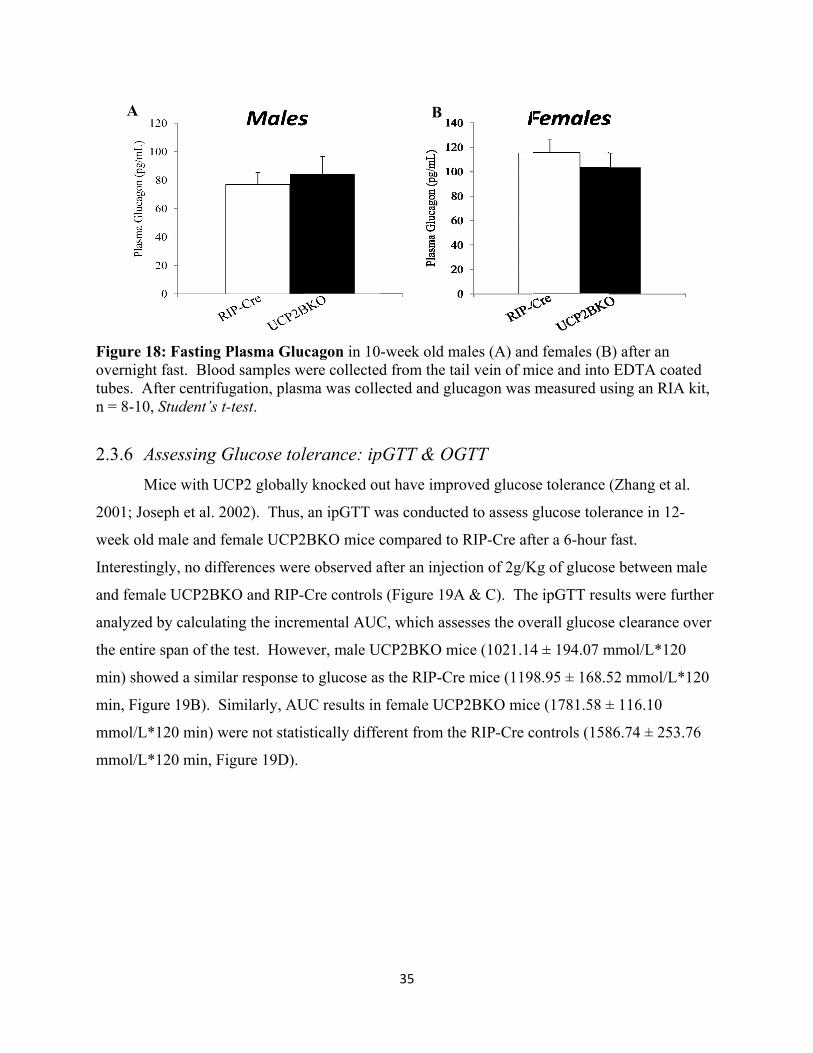
Figure 1overnightubes. An = 8-10,
2.3.6 AM
2001; Jos
week old
Interestin
and fema
analyzed
the entire
min) sho
min, Figu
mmol/L*
mmol/L*
A
8: Fasting Pht fast. BloodAfter centrifu
, Student’s t-
Assessing GMice with UC
seph et al. 20
d male and fe
ngly, no diffe
ale UCP2BK
d by calculati
e span of the
wed a simila
ure 19B). Si
*120 min) w
*120 min, Fi
Plasma Glud samples w
ugation, plasm-test.
Glucose tolCP2 globally
002). Thus,
emale UCP2
ferences were
KO and RIP-
ing the incre
e test. Howe
ar response t
imilarly, AU
were not statis
igure 19D).
cagon in 10were collected
ma was colle
lerance: ipy knocked ou
an ipGTT w
2BKO mice c
e observed a
Cre controls
emental AUC
ever, male U
to glucose as
UC results in
stically diffe
35
-week old md from the taected and glu
pGTT & OGut have impr
was conducte
compared to
after an injec
s (Figure 19A
C, which ass
UCP2BKO m
s the RIP-Cr
n female UCP
erent from th
B
males (A) andail vein of mucagon was
GTT roved glucos
ed to assess
o RIP-Cre aft
ction of 2g/K
A & C). The
sesses the ov
mice (1021.14
re mice (119
P2BKO mic
he RIP-Cre c
d females (Bmice and into
measured u
se tolerance
glucose tole
fter a 6-hour
Kg of glucos
e ipGTT resu
verall glucos
4 ± 194.07 m
98.95 ± 168.5
ce (1781.58 ±
controls (158
B) after an o EDTA coatsing an RIA
(Zhang et al
rance in 12-
fast.
e between m
ults were fur
e clearance o
mmol/L*120
52 mmol/L*
± 116.10
86.74 ± 253.
ted A kit,
l.
male
rther
over
0
120
76
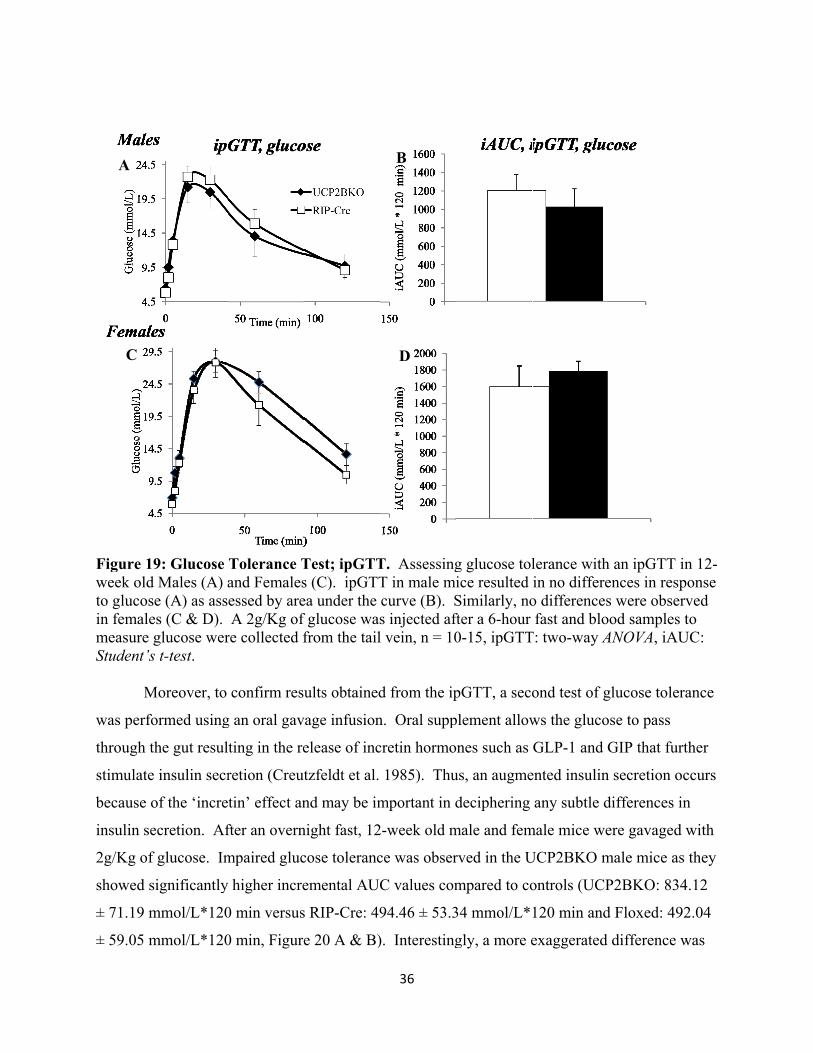
Figure 1week oldto glucosin femalemeasure Student’s
M
was perfo
through t
stimulate
because o
insulin se
2g/Kg of
showed s
± 71.19 m
± 59.05 m
A
C
9: Glucose d Males (A) ase (A) as asses (C & D). glucose wers t-test.
Moreover, to
ormed using
the gut resul
e insulin secr
of the ‘incre
ecretion. Af
f glucose. Im
significantly
mmol/L*120
mmol/L*120
Tolerance Tand Femalesessed by areA 2g/Kg of
re collected f
confirm resu
g an oral gav
ting in the re
retion (Creut
tin’ effect an
fter an overn
mpaired gluc
y higher incre
0 min versus
0 min, Figure
Test; ipGTTs (C). ipGTTea under the f glucose wasfrom the tail
ults obtained
vage infusion
elease of inc
tzfeldt et al.
nd may be im
night fast, 12
cose toleranc
emental AUC
s RIP-Cre: 49
e 20 A & B)
36
T. AssessingT in male micurve (B). Ss injected aftl vein, n = 10
d from the ip
n. Oral supp
cretin hormo
1985). Thu
mportant in d
2-week old m
ce was obser
C values com
94.46 ± 53.3
). Interesting
B
D
g glucose tolice resulted Similarly, nofter a 6-hour 0-15, ipGTT
pGTT, a seco
plement allow
nes such as
us, an augme
deciphering
male and fem
rved in the U
mpared to co
34 mmol/L*
gly, a more e
lerance within no differeo differencesfast and blo
T: two-way A
ond test of g
ws the gluco
GLP-1 and G
ented insulin
any subtle d
male mice we
UCP2BKO m
ontrols (UCP
120 min and
exaggerated
h an ipGTT iences in resps were obser
ood samples ANOVA, iAU
glucose toler
ose to pass
GIP that furt
n secretion oc
differences in
ere gavaged
male mice as
P2BKO: 834
d Floxed: 492
difference w
n 12-
ponse rved to
UC:
rance
ther
ccurs
n
with
they
4.12
2.04
was
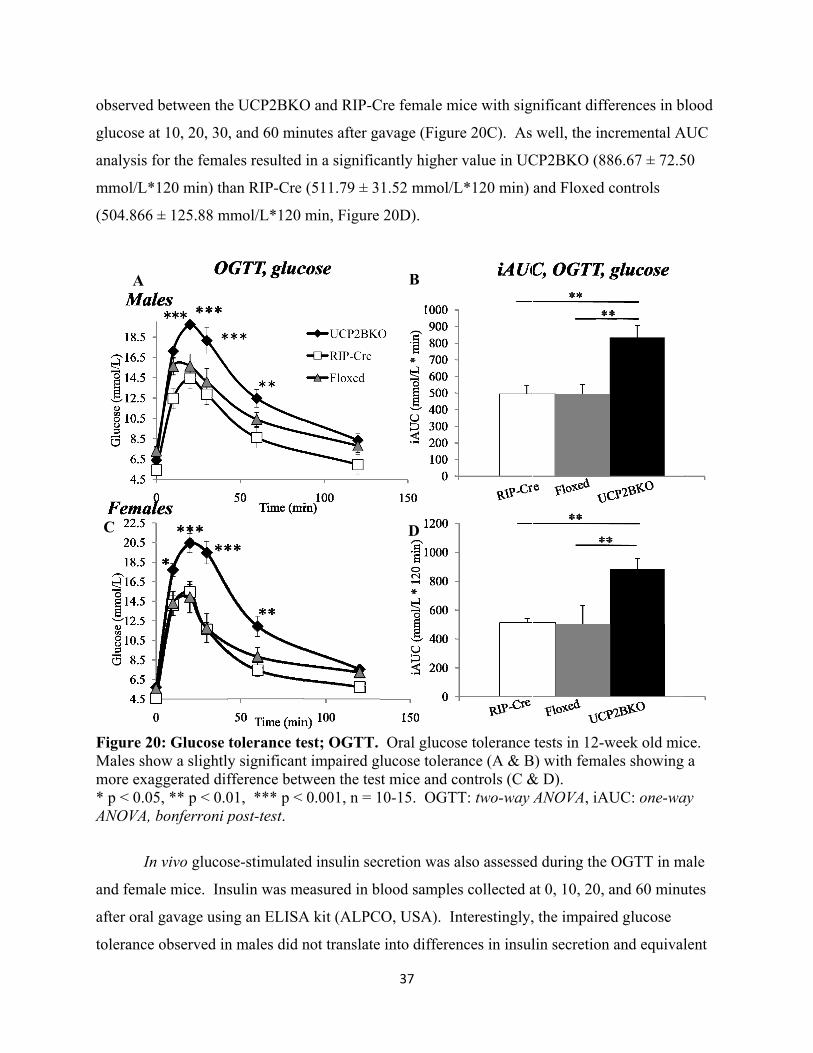
observed
glucose a
analysis f
mmol/L*
(504.866
Figure 2Males shmore exa* p < 0.0ANOVA,
In
and fema
after oral
tolerance
A
C
d between the
at 10, 20, 30
for the fema
*120 min) th
6 ± 125.88 m
20: Glucose how a slightlyaggerated dif05, ** p < 0.0
bonferroni p
n vivo glucos
ale mice. Ins
l gavage usin
e observed in
e UCP2BKO
, and 60 min
ales resulted
han RIP-Cre
mmol/L*120
tolerance tey significantfference betw01, *** p < post-test.
se-stimulate
sulin was me
ng an ELISA
n males did n
O and RIP-C
nutes after ga
in a signific
(511.79 ± 3
min, Figure
est; OGTT.t impaired glween the tes0.001, n = 1
d insulin sec
easured in b
A kit (ALPC
not translate
37
Cre female m
avage (Figur
cantly higher
1.52 mmol/L
20D).
Oral glucoslucose tolerat mice and c
10-15. OGT
cretion was a
lood sample
O, USA). In
into differen
B
D
mice with sig
re 20C). As
r value in UC
L*120 min)
se tolerance ance (A & Bcontrols (C &TT: two-way
also assessed
es collected a
nterestingly,
nces in insul
nificant diff
well, the inc
CP2BKO (88
and Floxed
tests in 12-wB) with fema& D). ANOVA, iA
d during the
at 0, 10, 20,
, the impaire
lin secretion
ferences in b
cremental A
86.67 ± 72.5
controls
week old micles showing
AUC: one-wa
OGTT in m
and 60 minu
ed glucose
n and equival
lood
AUC
50
ce. a
ay
male
utes
lent
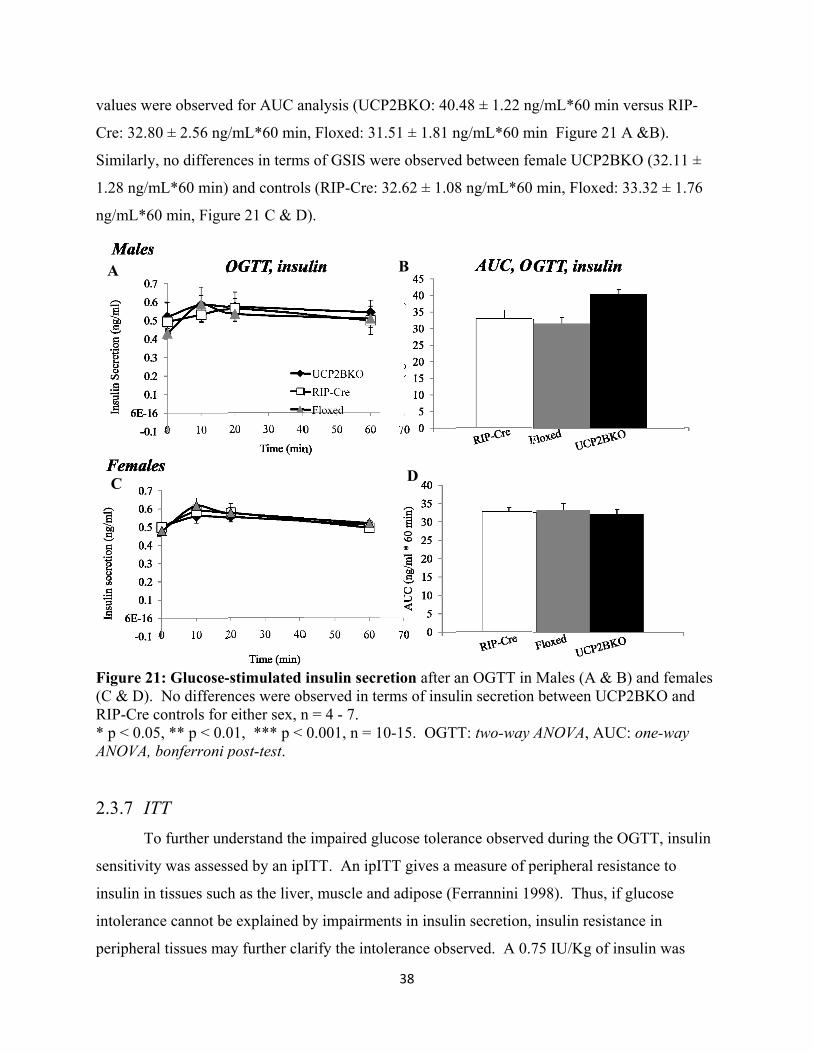
values w
Cre: 32.8
Similarly
1.28 ng/m
ng/mL*6
Figure 2(C & D).RIP-Cre * p < 0.0ANOVA, 2.3.7 IT
T
sensitivit
insulin in
intoleran
periphera
A
C
ere observed
80 ± 2.56 ng/
y, no differen
mL*60 min)
60 min, Figu
21: Glucose- No differencontrols for
05, ** p < 0.0bonferroni p
TT To further un
ty was assess
n tissues such
nce cannot be
al tissues ma
d for AUC a
/mL*60 min
nces in term
and control
ure 21 C & D
-stimulated nces were obeither sex, n
01, *** p < post-test.
nderstand the
sed by an ipI
h as the live
e explained b
ay further cla
analysis (UC
n, Floxed: 31
s of GSIS w
s (RIP-Cre:
D).
insulin secrbserved in ten = 4 - 7. 0.001, n = 1
e impaired gl
ITT. An ipI
r, muscle an
by impairme
arify the into
38
P2BKO: 40.
1.51 ± 1.81 n
were observed
32.62 ± 1.08
retion after aerms of insul
10-15. OGT
lucose tolera
ITT gives a m
nd adipose (F
ents in insuli
olerance obs
B
D
.48 ± 1.22 ng
ng/mL*60 m
d between fe
8 ng/mL*60
an OGTT in lin secretion
TT: two-way
ance observe
measure of p
Ferrannini 19
in secretion,
erved. A 0.7
g/mL*60 mi
min Figure 2
emale UCP2
min, Floxed
Males (A &n between UC
ANOVA, AU
ed during the
peripheral re
998). Thus,
insulin resis
75 IU/Kg of
in versus RIP
21 A &B).
2BKO (32.11
d: 33.32 ± 1.
& B) and femCP2BKO an
UC: one-way
e OGTT, ins
esistance to
if glucose
stance in
f insulin was
P-
1 ±
.76
males nd
y
sulin
s
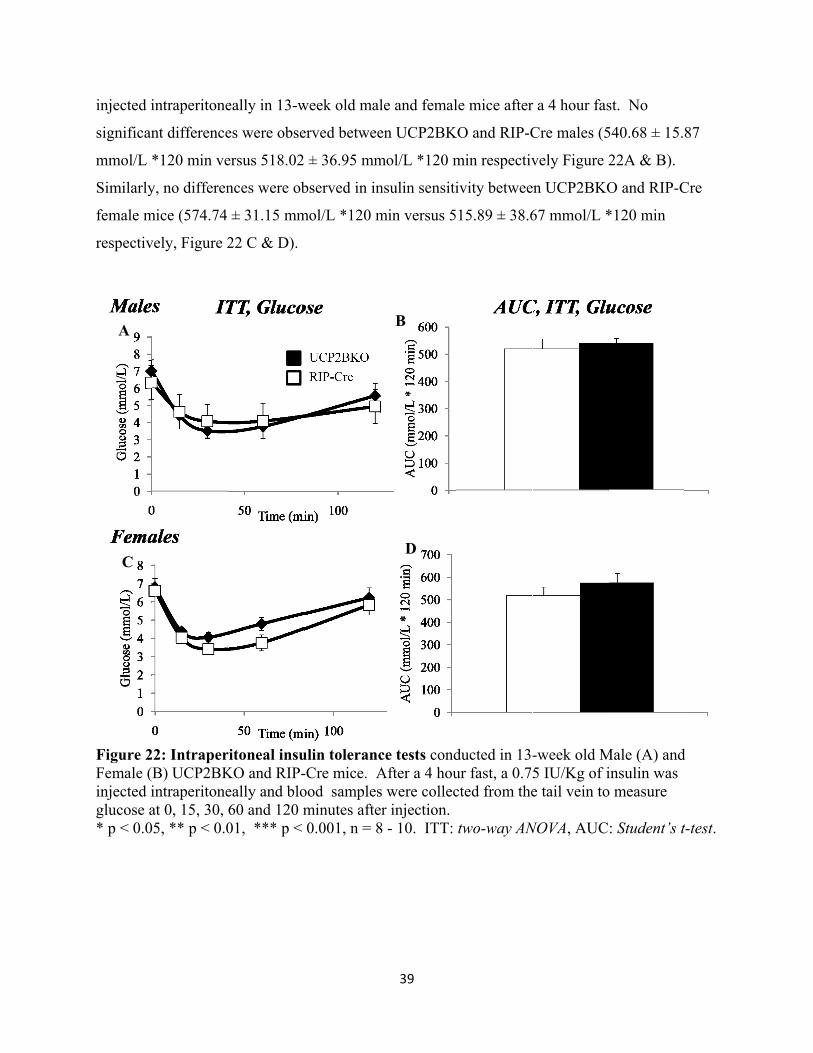
injected i
significan
mmol/L
Similarly
female m
respectiv
Figure 2Female (injected iglucose a* p < 0.0
A
C
intraperitone
nt difference
*120 min ve
y, no differen
mice (574.74
vely, Figure 2
22: IntraperB) UCP2BKintraperitoneat 0, 15, 30, 05, ** p < 0.0
eally in 13-w
es were obse
ersus 518.02
nces were ob
± 31.15 mm
22 C & D).
ritoneal insuKO and RIP-eally and blo60 and 120 m01, *** p <
week old mal
erved betwee
± 36.95 mm
bserved in in
mol/L *120 m
ulin toleranc-Cre mice. Aood samplesminutes afte0.001, n = 8
39
le and femal
en UCP2BK
mol/L *120 m
nsulin sensiti
min versus 5
ce tests condAfter a 4 hous were collecer injection.8 - 10. ITT:
B
D
le mice after
KO and RIP-C
min respectiv
ivity betwee
15.89 ± 38.6
ducted in 13ur fast, a 0.7cted from the
two-way AN
r a 4 hour fas
Cre males (5
vely Figure
en UCP2BKO
67 mmol/L *
-week old M5 IU/Kg of ie tail vein to
NOVA, AUC
st. No
540.68 ± 15.
22A & B).
O and RIP-C
*120 min
Male (A) andinsulin was o measure
: Student’s t
87
Cre
d
t-test.
40
Chapter 3: Characterization of UCP2BKO: In Vitro Analysis 3.1 Hypothesis
In order to fully understand the physiological role of UCP2 in the beta-cell, further analysis
of isolated UCP2BKO islets was required. As previously mentioned, reduced expression of
UCP2 in the beta-cell has been associated with both a negative regulation of insulin secretion as
well as an increased accumulation of ROS and oxidative stress (Chan et al. 1999; Zhang et al.
2001; Mattiasson et al. 2003; Pi et al. 2009). To address both sides, further functional studies to
assess islet function were conducted.
In Vitro islet studies to examine glucose-stimulated insulin secretion, islet ATP content,
mitochondrial membrane potential, and oxidative stress were performed. We hypothesized that
UCP2 will be a negative regulator of islet function and deletion of UCP2 will result in increased
efficiency of oxidative phosphorylation leading to superior islet function. We predict that
UCP2BKO will have enhanced glucose-induced mitochondrial membrane potential, increased
beta-cell secretory capacity, higher islet ATP content, and no differences in ROS accumulation.
3.2 Method and Materials
3.2.1 Reagents Rh123 for membrane potential studies, Carboxy-dichlorofluorescein (DCF) for ROS
measurements and a Luciferase ATP kit were all obtained from Sigma-Aldrich (USA). Insulin
RIA kits were ordered from Linco Research (USA). Quantitave RT-PCR primers for anti-
oxidant enzymes were ordered from Invitrogen (Canada).
3.2.2 Animals All experiments were conducted on 12- to 13-week old, adult UCP2BKO and RIP-Cre
control mice. All animals were handled according to the guidelines provided by the Canadian
Council on Animal Care.
41
3.2.3 Analysis of Membrane Potential Glucose-induced changes in membrane potential were quantified in dispersed islet cells
using a mitochondrial-specific Rhodamine dye. Dispersed islets adhered to cover slips were
loaded with rhodamine 123 (25 ug/ml, 10 min) in Krebs-Ringer buffer (KRB) containing 0.1%
BSA, 120mM NaCl, 2 mM CaCl2, 1 mM MgCl2, 24 mM NaHCO3, and 10 mM Hepes (pH 7.3).
Glucose was then added (at a concentration of 20 mM). At the end of the experiment, 1 mM
NaN3 was added to inhibit the respiratory reaction and fully dissipate the potential. Membrane
potential was measured using an Olympus IX70 inverted epifluorescence microscope combined
to an Ultrapix camera and a computer with Merlin imaging software (LSR).
3.2.4 Analysis of ATP levels in β cells Isolated islets from 12-week old UCP2BKO and RIP-Cre control mice were hand-picked
into 1.5 ml microfuge tubes with approximately 30 islets per tube. ATP content in these samples
was measured using a luciferase ATP kit according to the manufacturer’s instructions (Sigma-
Aldrich, USA) and normalized to DNA content. In order to isolate ATP, islets were lysed using
a strong base (30 ul 0.1M NaOH + 1 mM EDTA). Lysates were then heated at 60 °C for 20 min
and samples were aliquoted in wells of a luminometer 96-well plate with 160 ul of assay buffer,
20 ul of lysate, and 40 ul of the luciferin/luciferase mixture. Luminescence was measured by a
spectrophotometer immediately after the last addition and signal intensity was calibrated with an
ATP standard from the kit. Each set of experiments was performed in triplicates.
3.2.5 Measurement of glucose stimulated insulin secretion Isolated islets were cultured overnight and pre-incubated with 2.8 mM KRB buffer for
one hour prior to secretion assessment. 10 islets were then picked into microfuge tubes and
incubated with either low (2.8 mM) or high (16.7 mM) glucose for one hour and aliquots of the
sample stored in – 20 °C for insulin measurements. The islets were lysed (using acid-ethanol)
and the DNA content was measured using a spectrophotometer. Total insulin content and Insulin
in the samples was measured using the Linco Research RIA kit and normalized to total DNA
content.
42
3.2.6 Pancreatic islet morphology Pancreata were removed from anesthetized mice and fixed using 10% buffered formalin
for 48 hours before being processed for islet morphology. After fixation, pancreata were
embedded into paraffin wax and sections were cut using a microtome and mounted onto slides
for staining. Sections were treated with pepsin and incubated for 1 hr in either a rabbit
polyclonal anti-insulin or anti-glucagon primary antibody (1:200 or a 1:150 dilution,
respectively) obtained from Biomeda (Foster City, MA). Slides were scanned using a brightfield
scanner at 20X magnification. The program ImageScope was used to analyze insulin- and
glucagon-positive area as well as islet density using a pixel-positive algorithm. All data was
normalized to whole pancreatic slice area.
3.2.7 Measurement of ROS Basal levels of ROS were measured at 11mM glucose. Dispersed islets were loaded with
5μM carboxy-dichlorofluorescein diacetate (DCF) for 45 min in incubation buffer in a 37°C
incubator. After incubation, coverslips were washed and placed in the imaging chamber.
Fluorescent excitation was at 480 nm for 300 ms, and emission detected with a 525 nm band pass
filter using a 505 nm beam splitter. Fluorescence intensity levels were kept within the upper and
lower detection thresholds of the recording equipment. Fluorescence was quantified by software
and the mean emission intensity from each cell was recorded. Approximately 20-30 cells were
analyzed per coverslip. Excitations of each coverslip were kept at 3 exposures or less to reduce
any potential photobleaching effects.
3.2.8 Evaluating mRNA expression of Anti-oxidant enzymes in β-cells RNA extracted from islets was reverse transcribed to make cDNA as previously
mentioned (Chapter 2, section 2.2.5 & 2.2.7). Gene expression of various Anti-oxidant enzymes
(primer sequences listed in Table 4) was measured using RT-PCR and normalized to levels of
beta-actin. In order to ensure specificity, the sequences of all primers were blasted against the
mouse genome (Nucleotide Blast).
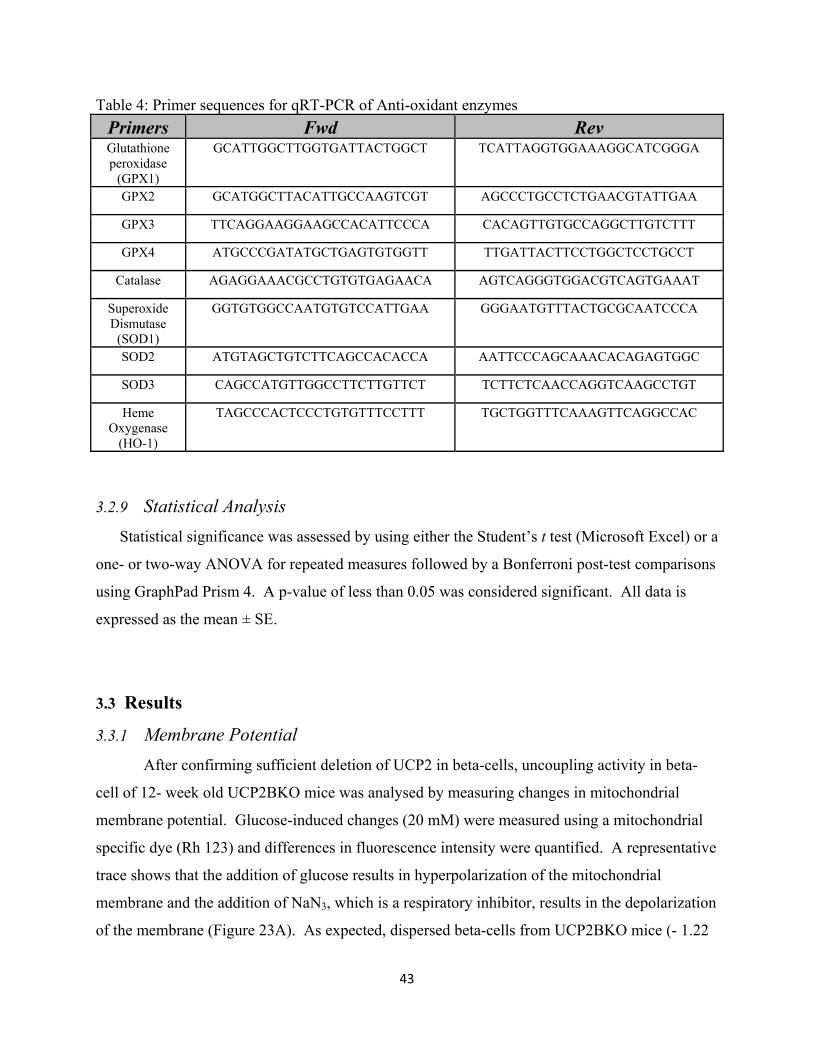
43
Table 4: Primer sequences for qRT-PCR of Anti-oxidant enzymes Primers Fwd Rev Glutathione peroxidase
(GPX1)
GCATTGGCTTGGTGATTACTGGCT TCATTAGGTGGAAAGGCATCGGGA
GPX2 GCATGGCTTACATTGCCAAGTCGT AGCCCTGCCTCTGAACGTATTGAA
GPX3 TTCAGGAAGGAAGCCACATTCCCA CACAGTTGTGCCAGGCTTGTCTTT
GPX4 ATGCCCGATATGCTGAGTGTGGTT TTGATTACTTCCTGGCTCCTGCCT
Catalase AGAGGAAACGCCTGTGTGAGAACA AGTCAGGGTGGACGTCAGTGAAAT
Superoxide Dismutase
(SOD1)
GGTGTGGCCAATGTGTCCATTGAA GGGAATGTTTACTGCGCAATCCCA
SOD2 ATGTAGCTGTCTTCAGCCACACCA AATTCCCAGCAAACACAGAGTGGC
SOD3 CAGCCATGTTGGCCTTCTTGTTCT TCTTCTCAACCAGGTCAAGCCTGT
Heme Oxygenase
(HO-1)
TAGCCCACTCCCTGTGTTTCCTTT TGCTGGTTTCAAAGTTCAGGCCAC
3.2.9 Statistical Analysis
Statistical significance was assessed by using either the Student’s t test (Microsoft Excel) or a
one- or two-way ANOVA for repeated measures followed by a Bonferroni post-test comparisons
using GraphPad Prism 4. A p-value of less than 0.05 was considered significant. All data is
expressed as the mean ± SE.
3.3 Results
3.3.1 Membrane Potential After confirming sufficient deletion of UCP2 in beta-cells, uncoupling activity in beta-
cell of 12- week old UCP2BKO mice was analysed by measuring changes in mitochondrial
membrane potential. Glucose-induced changes (20 mM) were measured using a mitochondrial
specific dye (Rh 123) and differences in fluorescence intensity were quantified. A representative
trace shows that the addition of glucose results in hyperpolarization of the mitochondrial
membrane and the addition of NaN3, which is a respiratory inhibitor, results in the depolarization
of the membrane (Figure 23A). As expected, dispersed beta-cells from UCP2BKO mice (- 1.22
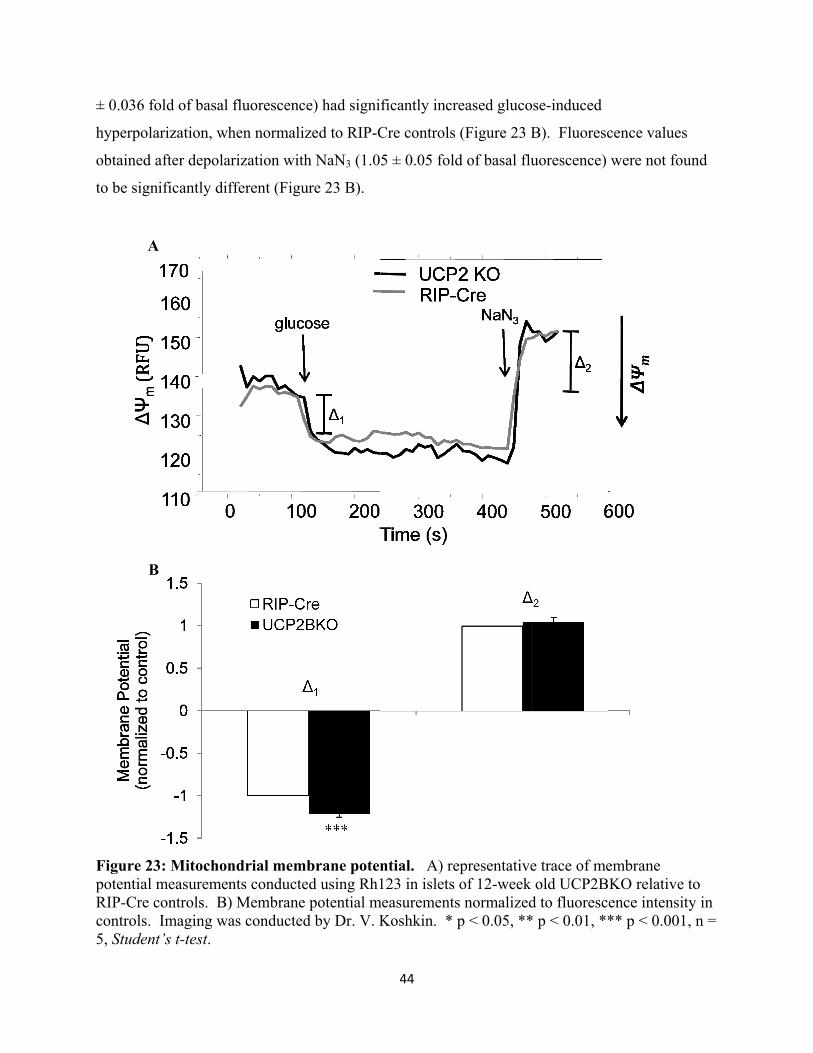
± 0.036 f
hyperpol
obtained
to be sign
Figure 2potential RIP-Cre controls. 5, Studen
A
B
fold of basal
larization, wh
after depola
nificantly dif
23: Mitochonmeasuremecontrols. B) Imaging w
nt’s t-test.
A
B
fluorescenc
hen normali
arization with
fferent (Figu
ndrial memnts conducte) Membraneas conducted
ce) had signi
zed to RIP-C
h NaN3 (1.0
ure 23 B).
mbrane potened using Rh1e potential md by Dr. V. K
44
ficantly incr
Cre controls
5 ± 0.05 fold
ntial. A) re123 in islets
measurementsKoshkin. *
reased gluco
(Figure 23 B
d of basal flu
epresentativeof 12-week
s normalizedp < 0.05, **
se-induced
B). Fluoresc
uorescence)
e trace of meold UCP2B
d to fluoresc* p < 0.01, **
cence values
were not fou
embrane KO relative ence intensit** p < 0.001
s
und
to ty in
1, n =
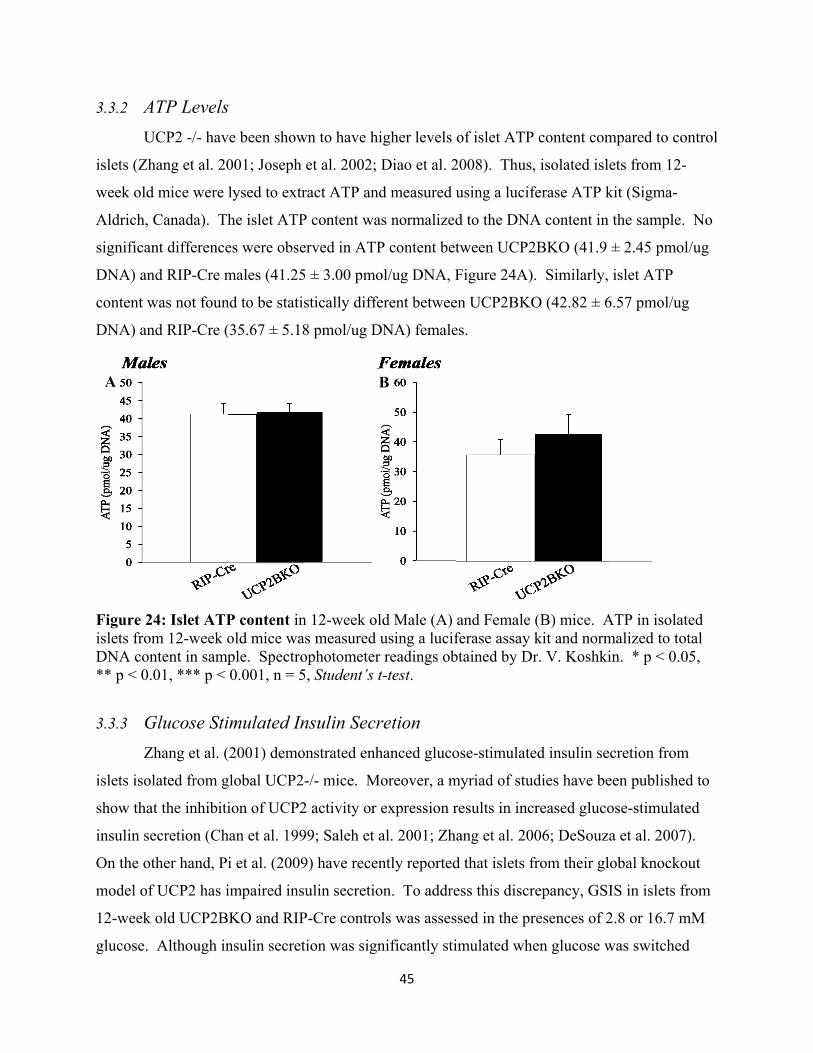
3.3.2 AU
islets (Zh
week old
Aldrich,
significan
DNA) an
content w
DNA) an
Figure 2islets fromDNA con** p < 0.
3.3.3 GZ
islets isol
show tha
insulin se
On the ot
model of
12-week
glucose.
A
ATP LevelsUCP2 -/- hav
hang et al. 20
d mice were
Canada). Th
nt difference
nd RIP-Cre m
was not foun
nd RIP-Cre (
24: Islet ATPm 12-week ontent in samp01, *** p <
Glucose StiZhang et al. (
lated from g
at the inhibiti
ecretion (Ch
ther hand, Pi
f UCP2 has i
old UCP2B
Although in
s ve been show
001; Joseph
lysed to extr
he islet ATP
es were obse
males (41.25
nd to be statis
(35.67 ± 5.18
P content inold mice waple. Spectro0.001, n = 5
imulated In(2001) demo
global UCP2
ion of UCP2
han et al. 199
i et al. (2009
impaired ins
KO and RIP
nsulin secret
wn to have hi
et al. 2002;
ract ATP and
P content wa
erved in ATP
5 ± 3.00 pmo
stically diffe
8 pmol/ug D
n 12-week olas measured uophotometer5, Student’s t
nsulin Secronstrated enh
-/- mice. M
2 activity or
99; Saleh et a
9) have recen
ulin secretio
P-Cre contro
tion was sign
B
45
igher levels
Diao et al. 2
d measured u
as normalized
P content bet
ol/ug DNA, F
erent betwee
DNA) female
ld Male (A) using a lucif
r readings obt-test.
retion hanced gluco
oreover, a m
expression r
al. 2001; Zh
ntly reported
on. To addre
ls was asses
nificantly sti
B
of islet ATP
2008). Thus
using a lucif
d to the DNA
tween UCP2
Figure 24A)
en UCP2BKO
es.
and Female ferase assay btained by D
ose-stimulate
myriad of stu
results in inc
ang et al. 20
d that islets f
ess this discr
ssed in the pr
imulated wh
P content com
, isolated isl
ferase ATP k
A content in
2BKO (41.9
). Similarly,
O (42.82 ± 6
(B) mice. Akit and normr. V. Koshki
ed insulin se
udies have be
creased gluco
006; DeSouz
from their gl
repancy, GS
resences of 2
en glucose w
mpared to co
lets from 12-
kit (Sigma-
n the sample.
± 2.45 pmo
islet ATP
6.57 pmol/ug
ATP in isolatmalized to toin. * p < 0.0
ecretion from
een publishe
ose-stimulat
a et al. 2007
lobal knocko
IS in islets f
2.8 or 16.7 m
was switched
ontrol
-
No
l/ug
g
ted
otal 05,
m
ed to
ed
7).
out
from
mM
d
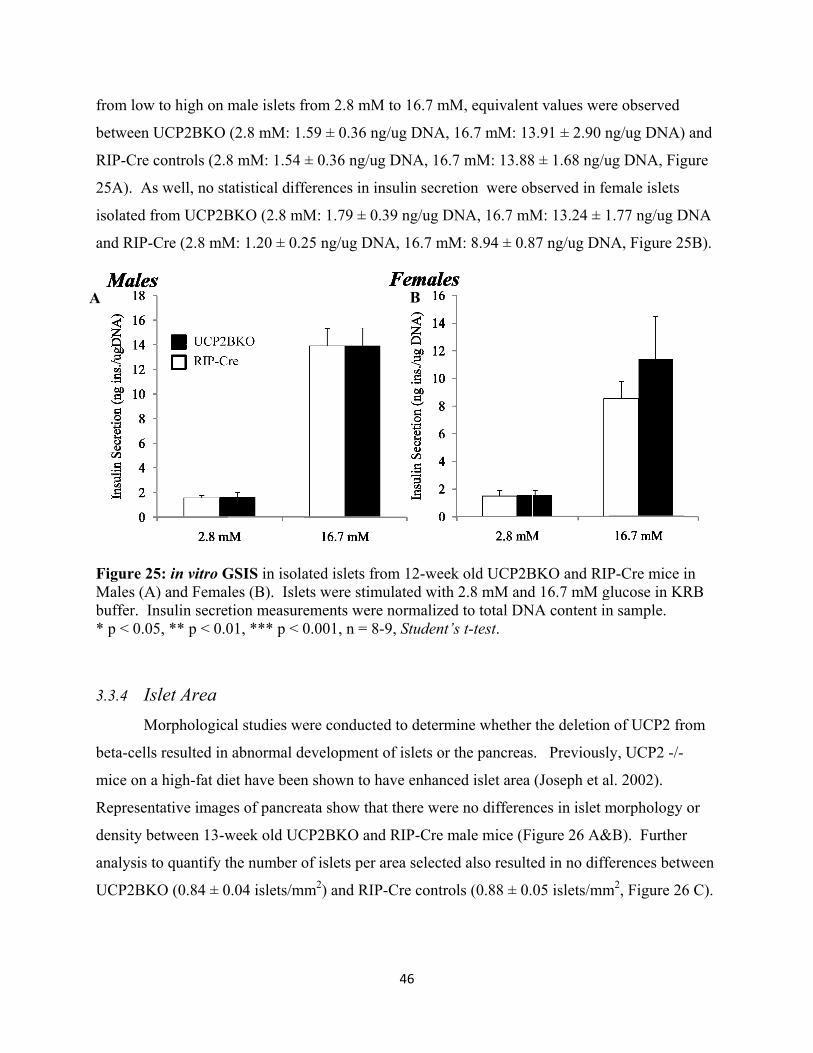
from low
between
RIP-Cre
25A). A
isolated f
and RIP-
Figure 2Males (Abuffer. I* p < 0.0
3.3.4 IsM
beta-cells
mice on a
Represen
density b
analysis t
UCP2BK
A
w to high on m
UCP2BKO
controls (2.8
s well, no st
from UCP2B
-Cre (2.8 mM
25: in vitro GA) and Femalnsulin secret
05, ** p < 0.0
slet Area
Morphologica
s resulted in
a high-fat di
ntative image
between 13-w
to quantify t
KO (0.84 ± 0
male islets f
(2.8 mM: 1.
8 mM: 1.54
tatistical diff
BKO (2.8 mM
M: 1.20 ± 0.2
GSIS in isolales (B). Isletion measure01, *** p < 0
al studies we
abnormal d
iet have been
es of pancre
week old UC
the number o
0.04 islets/mm
from 2.8 mM
.59 ± 0.36 ng
± 0.36 ng/ug
ferences in in
M: 1.79 ± 0.
25 ng/ug DN
ated islets froets were stimements were0.001, n = 8-
ere conducte
evelopment
n shown to h
ata show tha
CP2BKO and
of islets per a
m2) and RIP
46
M to 16.7 mM
g/ug DNA, 1
g DNA, 16.7
nsulin secret
.39 ng/ug DN
NA, 16.7 mM
om 12-weekmulated with e normalized-9, Student’s
ed to determ
of islets or t
have enhance
at there were
d RIP-Cre m
area selected
P-Cre contro
B
M, equivalen
16.7 mM: 13
7 mM: 13.88
tion were ob
NA, 16.7 mM
M: 8.94 ± 0.8
k old UCP2B2.8 mM and
d to total DNs t-test.
ine whether
the pancreas
ed islet area
e no differen
male mice (Fi
d also resulte
ls (0.88 ± 0.
nt values wer
3.91 ± 2.90 n
8 ± 1.68 ng/u
bserved in fe
M: 13.24 ± 1
87 ng/ug DN
BKO and RIPd 16.7 mM g
NA content in
the deletion
s. Previousl
(Joseph et a
nces in islet m
igure 26 A&
ed in no diff
05 islets/mm
re observed
ng/ug DNA)
ug DNA, Fig
emale islets
1.77 ng/ug D
NA, Figure 2
P-Cre mice iglucose in KRn sample.
n of UCP2 fr
ly, UCP2 -/-
al. 2002).
morphology
&B). Further
ferences betw
m2, Figure 26
and
gure
DNA
5B).
in RB
rom
or
r
ween
6 C).
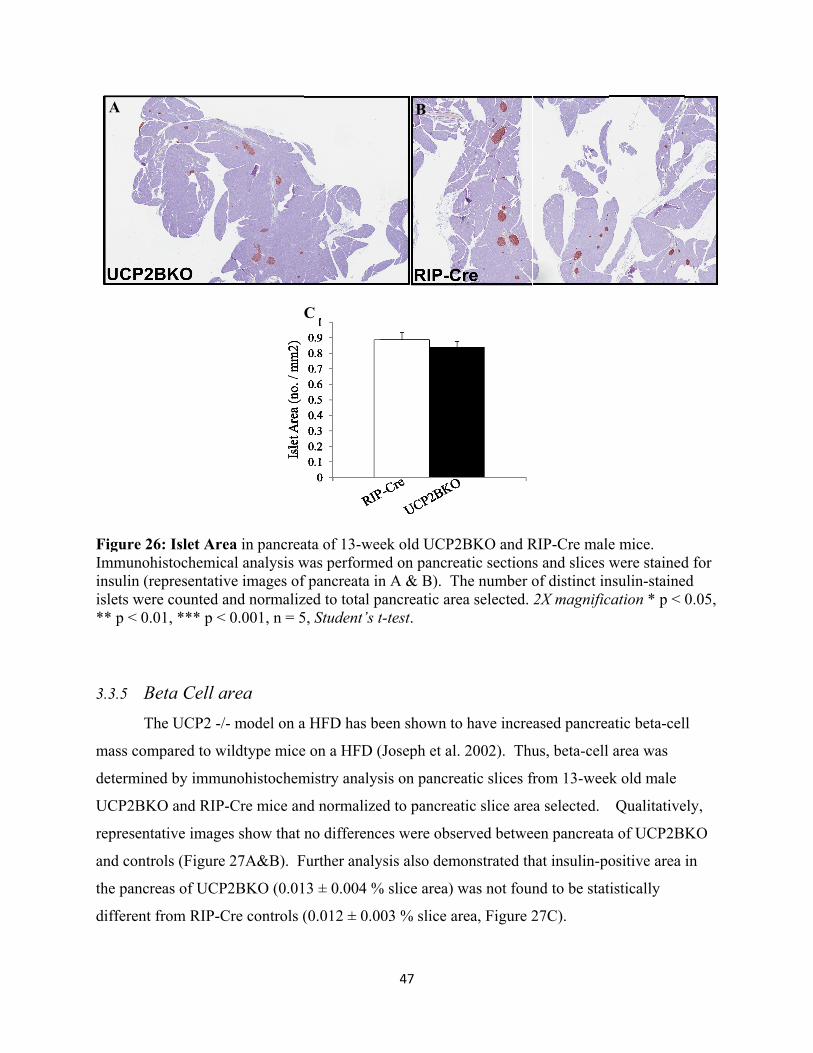
Figure 2Immunohinsulin (rislets wer** p < 0.
3.3.5 BT
mass com
determin
UCP2BK
represent
and contr
the pancr
different
A
26: Islet Arehistochemicarepresentativre counted a01, *** p <
Beta Cell arThe UCP2 -/-
mpared to wi
ned by immu
KO and RIP-
tative image
rols (Figure
reas of UCP2
from RIP-C
ea in pancreaal analysis wve images ofand normaliz0.001, n = 5
rea - model on a
ildtype mice
unohistochem
-Cre mice an
s show that
27A&B). F
2BKO (0.01
Cre controls (
ata of 13-wewas performef pancreata inzed to total p5, Student’s t
a HFD has be
e on a HFD (
mistry analys
nd normalize
no differenc
Further analy
13 ± 0.004 %
(0.012 ± 0.0
C
47
ek old UCP2ed on pancren A & B). T
pancreatic aret-test.
een shown to
(Joseph et al
sis on pancre
ed to pancrea
ces were obs
ysis also dem
% slice area)
03 % slice a
B
2BKO and Reatic sectionThe number oea selected.
o have incre
. 2002). Thu
eatic slices f
atic slice are
erved betwe
monstrated th
was not foun
area, Figure 2
RIP-Cre mals and slices of distinct in2X magnific
ased pancrea
us, beta-cell
from 13-wee
ea selected.
een pancreata
hat insulin-po
nd to be stat
27C).
e mice. were stained
nsulin-stainecation * p <
atic beta-cel
area was
ek old male
Qualitative
a of UCP2B
ositive area
tistically
d for ed 0.05,
ll
ely,
KO
in
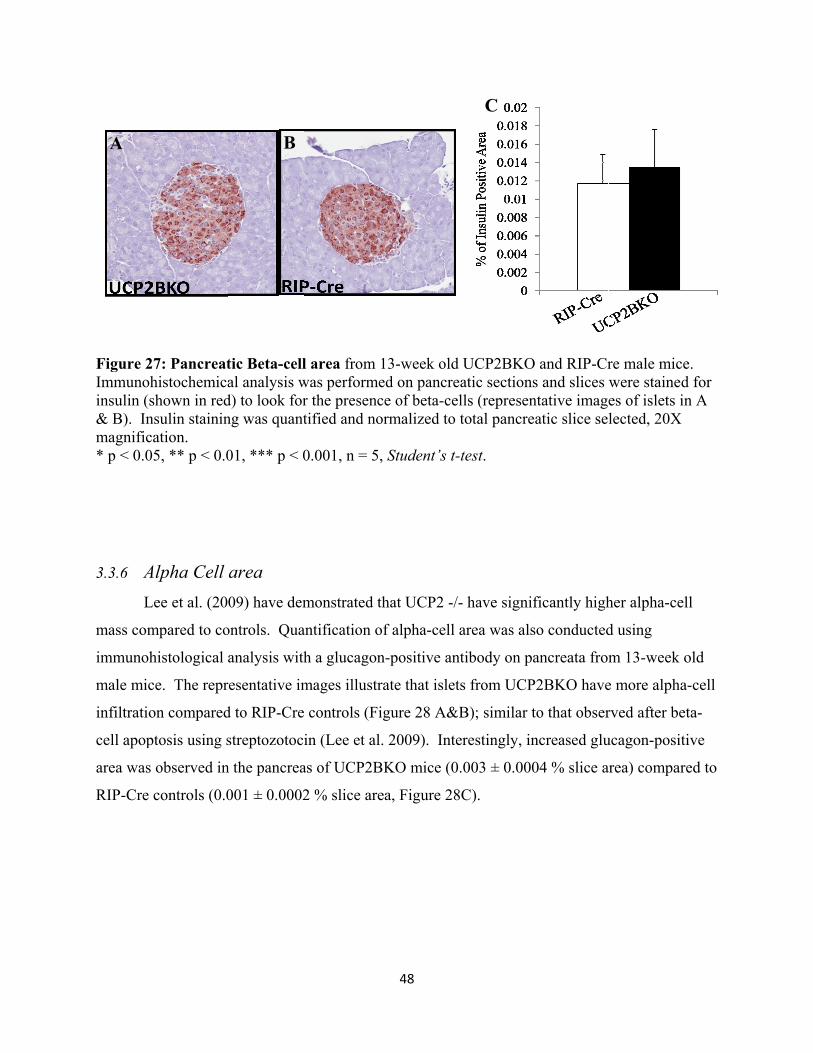
Figure 2Immunohinsulin (s& B). Inmagnific* p < 0.0
3.3.6 AL
mass com
immunoh
male mic
infiltratio
cell apop
area was
RIP-Cre
A
27: Pancreathistochemicashown in rednsulin stainination.
05, ** p < 0.0
Alpha Cell Lee et al. (20
mpared to co
histological
ce. The repr
on compared
ptosis using s
observed in
controls (0.0
tic Beta-cellal analysis wd) to look forng was quant
01, *** p < 0
area 09) have dem
ontrols. Qua
analysis with
resentative im
d to RIP-Cre
streptozotoci
n the pancrea
001 ± 0.0002
B
l area from was performer the presenctified and no
0.001, n = 5,
monstrated t
antification o
h a glucagon
mages illustr
controls (Fi
in (Lee et al
as of UCP2B
2 % slice are
48
13-week olded on pancrece of beta-ceormalized to
, Student’s t-
that UCP2 -/
of alpha-cell
n-positive an
rate that islet
igure 28 A&
. 2009). Inte
BKO mice (0
ea, Figure 28
d UCP2BKOeatic sectionells (represen
total pancre
-test.
/- have signi
area was als
ntibody on p
ts from UCP
&B); similar t
erestingly, in
0.003 ± 0.000
8C).
C
O and RIP-Crs and slices ntative imageatic slice se
ficantly high
so conducted
ancreata from
P2BKO have
to that obser
ncreased glu
04 % slice a
re male micewere stainedes of islets inlected, 20X
her alpha-cel
d using
m 13-week o
e more alpha
rved after be
ucagon-posit
area) compar
e. d for n A
ll
old
a-cell
eta-
tive
red to
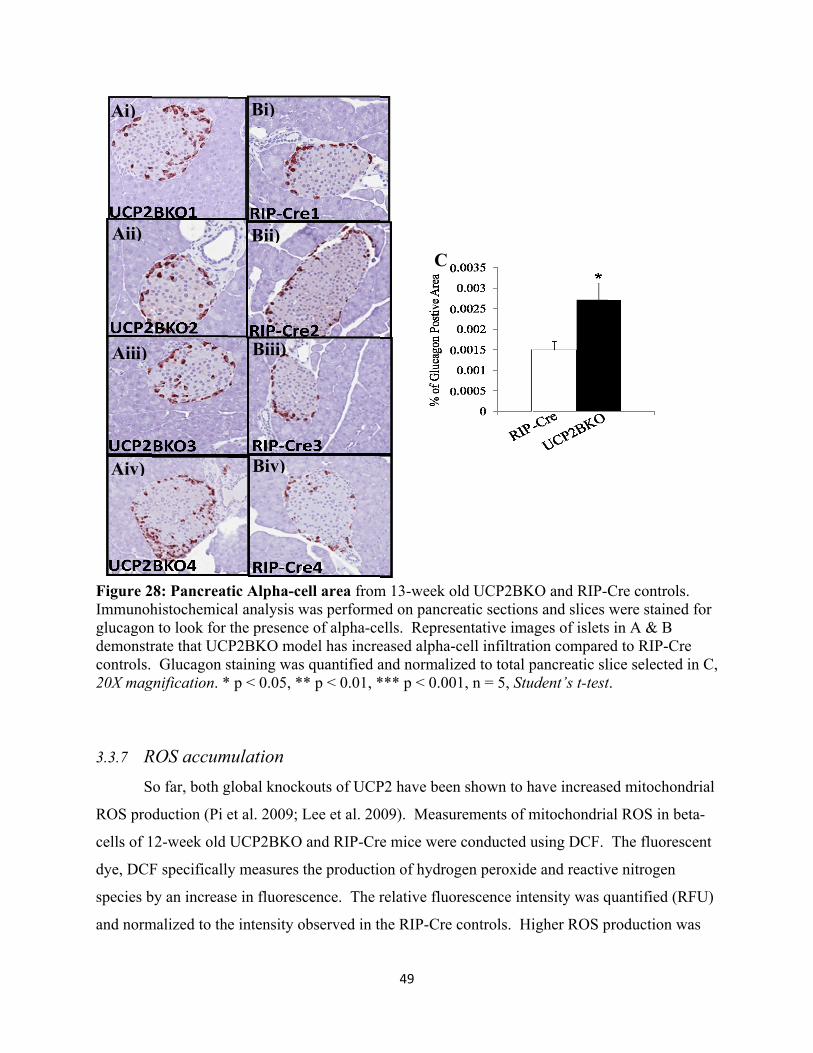
Figure 2Immunohglucagondemonstrcontrols. 20X mag
3.3.7 RS
ROS pro
cells of 1
dye, DCF
species b
and norm
Ai)
Aii)
Aiii)
Aiv)
28: Pancreathistochemican to look for rate that UC Glucagon s
gnification. *
ROS accumo far, both g
duction (Pi e
12-week old
F specifically
by an increas
malized to the
tic Alpha-ceal analysis wthe presenceP2BKO modstaining was* p < 0.05, **
mulation global knock
et al. 2009; L
UCP2BKO
y measures t
se in fluoresc
e intensity o
Bi)
Bii)
Biii)
Biv)
ell area fromwas performee of alpha-cedel has incre quantified a* p < 0.01, *
kouts of UCP
Lee et al. 20
and RIP-Cre
the productio
cence. The r
observed in th
49
m 13-week oed on pancreells. Represeeased alpha-cand normaliz*** p < 0.00
P2 have been
09). Measu
e mice were
on of hydrog
relative fluo
he RIP-Cre
C
old UCP2BKeatic sectionentative imacell infiltratized to total p1, n = 5, Stu
n shown to h
urements of m
conducted u
gen peroxide
rescence int
controls. Hi
KO and RIP-Cs and slices
ages of isletsion comparepancreatic sludent’s t-test
have increase
mitochondria
using DCF.
e and reactiv
tensity was q
igher ROS p
Cre controlswere stained
s in A & B ed to RIP-Crlice selected t.
ed mitochon
al ROS in be
The fluores
ve nitrogen
quantified (R
production w
s. d for
re in C,
ndrial
eta-
cent
RFU)
was
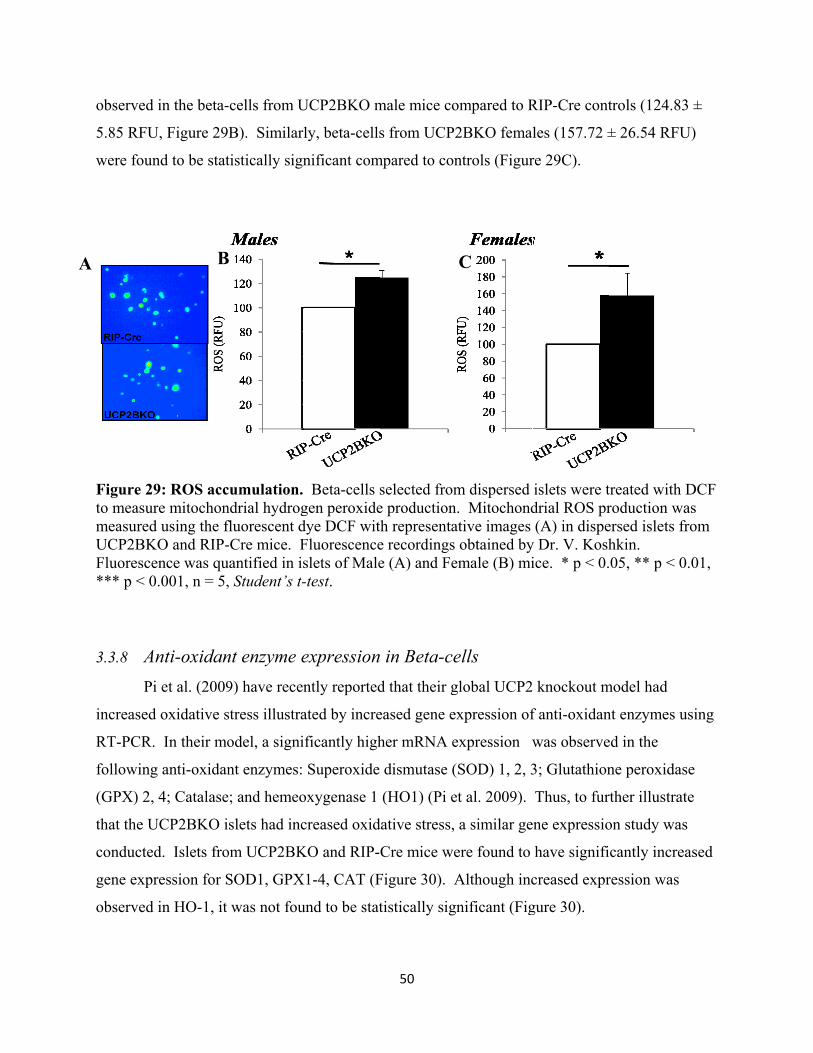
observed
5.85 RFU
were fou
Figure 2to measumeasuredUCP2BKFluoresce*** p < 0
3.3.8 AP
increased
RT-PCR
following
(GPX) 2,
that the U
conducte
gene exp
observed
A
d in the beta-
U, Figure 29
nd to be stat
29: ROS accure mitochond using the fKO and RIP-ence was qu0.001, n = 5,
Anti-oxidani et al. (2009
d oxidative s
. In their mo
g anti-oxidan
, 4; Catalase
UCP2BKO i
ed. Islets fro
pression for S
d in HO-1, it
B
-cells from U
B). Similarl
tistically sign
cumulation. ndrial hydrogfluorescent d-Cre mice. Fuantified in is, Student’s t-
nt enzyme e9) have recen
stress illustra
odel, a signi
nt enzymes:
e; and hemeo
slets had inc
om UCP2BK
SOD1, GPX
was not fou
B
UCP2BKO m
ly, beta-cells
nificant com
Beta-cells sgen peroxidedye DCF witFluorescenceslets of Male-test.
expressionntly reported
ated by incre
ficantly high
Superoxide
oxygenase 1
creased oxid
KO and RIP-
X1-4, CAT (F
und to be stat
50
male mice co
s from UCP2
mpared to con
selected frome productionh representae recordings e (A) and Fe
in Beta-ced that their g
eased gene e
her mRNA e
dismutase (
(HO1) (Pi e
dative stress,
Cre mice we
Figure 30). A
tistically sig
ompared to R
2BKO fema
ntrols (Figur
m dispersed . Mitochond
ative images obtained by
emale (B) mi
ells global UCP2
xpression of
expression w
(SOD) 1, 2, 3
et al. 2009).
a similar ge
ere found to
Although inc
nificant (Fig
C
RIP-Cre cont
les (157.72 ±
re 29C).
islets were tdrial ROS pr(A) in dispe
y Dr. V. Koshice. * p < 0.
2 knockout m
f anti-oxidan
was observe
3; Glutathion
Thus, to fur
ene expressio
have signifi
creased expr
gure 30).
trols (124.83
± 26.54 RFU
treated with roduction waersed islets frhkin. .05, ** p < 0
model had
nt enzymes u
ed in the
ne peroxidas
rther illustrat
on study was
icantly incre
ression was
3 ±
U)
DCF as
from
0.01,
using
se
te
s
ased
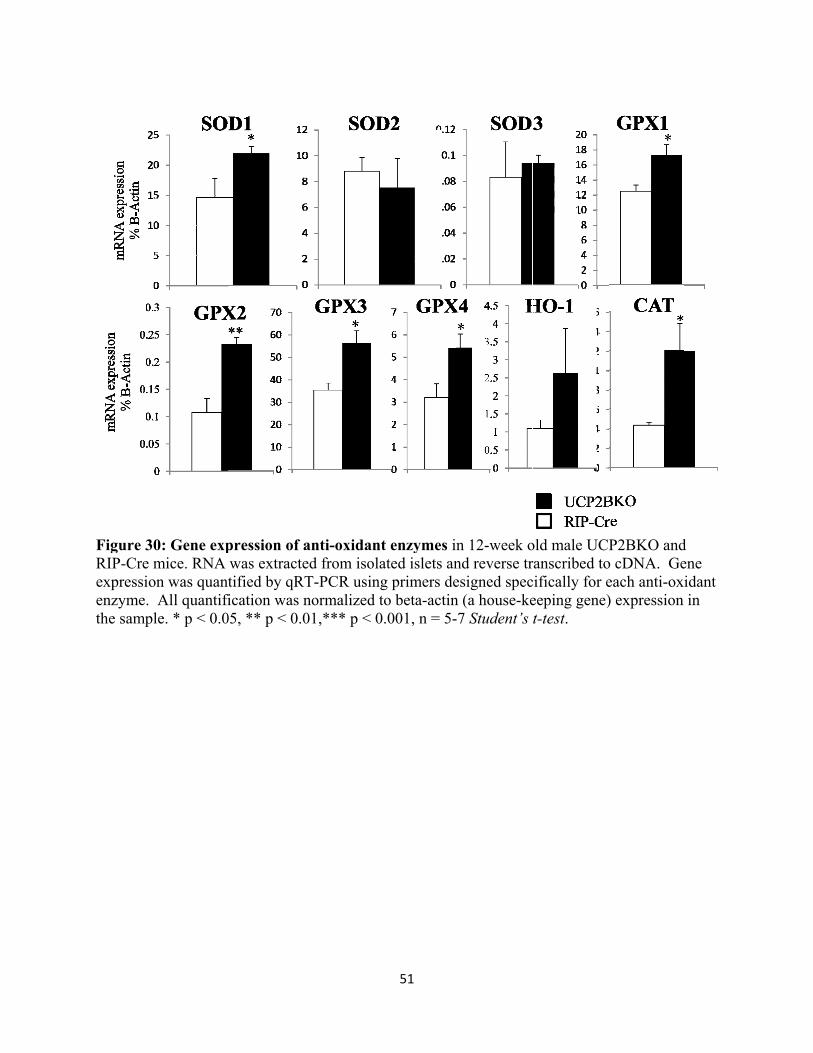
Figure 3RIP-Cre expressioenzyme. the samp
30: Gene expmice. RNA
on was quant All quantifi
ple. * p < 0.0
pression of awas extractetified by qR
fication was n05, ** p < 0.0
anti-oxidaned from isolaT-PCR usinnormalized t01,*** p < 0
51
nt enzymes inated islets ang primers deto beta-actin0.001, n = 5-
n 12-week ond reverse tresigned specn (a house-ke-7 Student’s
old male UCranscribed tocifically for eeeping gene)t-test.
P2BKO ando cDNA. Geeach anti-oxi) expression
d ene idant in
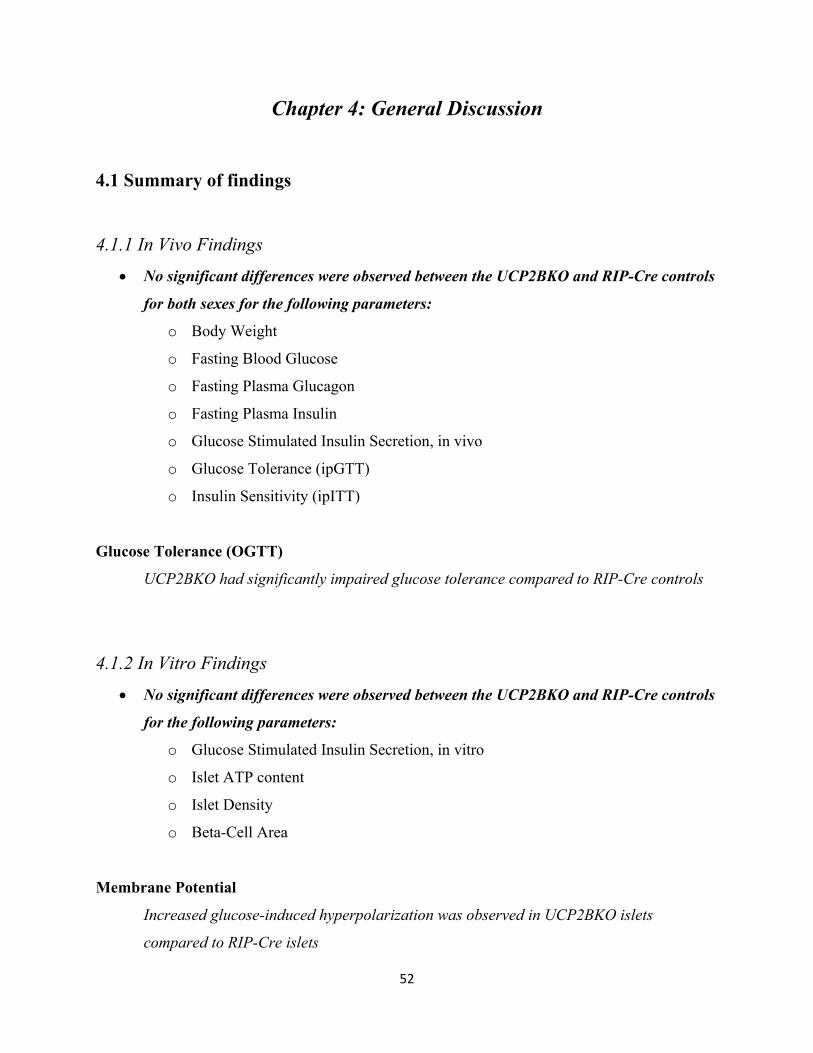
52
Chapter 4: General Discussion
4.1 Summary of findings
4.1.1 In Vivo Findings
• No significant differences were observed between the UCP2BKO and RIP-Cre controls
for both sexes for the following parameters:
o Body Weight
o Fasting Blood Glucose
o Fasting Plasma Glucagon
o Fasting Plasma Insulin
o Glucose Stimulated Insulin Secretion, in vivo
o Glucose Tolerance (ipGTT)
o Insulin Sensitivity (ipITT)
Glucose Tolerance (OGTT)
UCP2BKO had significantly impaired glucose tolerance compared to RIP-Cre controls
4.1.2 In Vitro Findings
• No significant differences were observed between the UCP2BKO and RIP-Cre controls
for the following parameters:
o Glucose Stimulated Insulin Secretion, in vitro
o Islet ATP content
o Islet Density
o Beta-Cell Area
Membrane Potential
Increased glucose-induced hyperpolarization was observed in UCP2BKO islets
compared to RIP-Cre islets
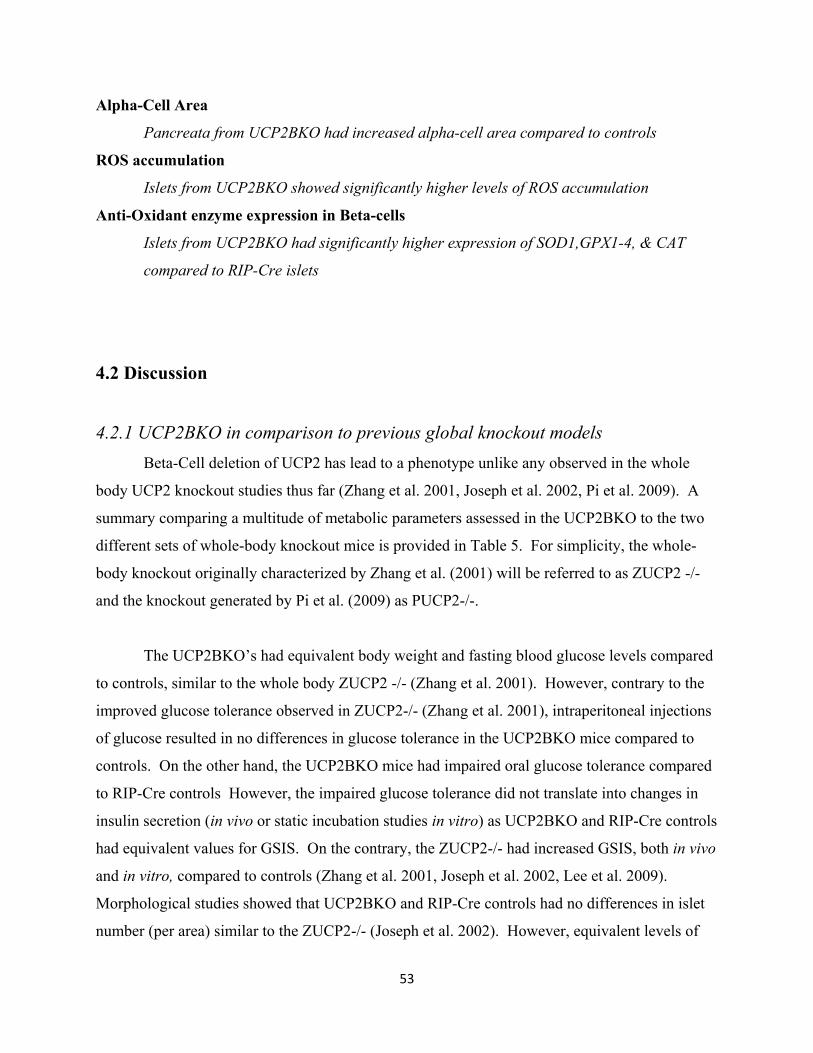
53
Alpha-Cell Area
Pancreata from UCP2BKO had increased alpha-cell area compared to controls
ROS accumulation
Islets from UCP2BKO showed significantly higher levels of ROS accumulation
Anti-Oxidant enzyme expression in Beta-cells
Islets from UCP2BKO had significantly higher expression of SOD1,GPX1-4, & CAT
compared to RIP-Cre islets
4.2 Discussion
4.2.1 UCP2BKO in comparison to previous global knockout models Beta-Cell deletion of UCP2 has lead to a phenotype unlike any observed in the whole
body UCP2 knockout studies thus far (Zhang et al. 2001, Joseph et al. 2002, Pi et al. 2009). A
summary comparing a multitude of metabolic parameters assessed in the UCP2BKO to the two
different sets of whole-body knockout mice is provided in Table 5. For simplicity, the whole-
body knockout originally characterized by Zhang et al. (2001) will be referred to as ZUCP2 -/-
and the knockout generated by Pi et al. (2009) as PUCP2-/-.
The UCP2BKO’s had equivalent body weight and fasting blood glucose levels compared
to controls, similar to the whole body ZUCP2 -/- (Zhang et al. 2001). However, contrary to the
improved glucose tolerance observed in ZUCP2-/- (Zhang et al. 2001), intraperitoneal injections
of glucose resulted in no differences in glucose tolerance in the UCP2BKO mice compared to
controls. On the other hand, the UCP2BKO mice had impaired oral glucose tolerance compared
to RIP-Cre controls However, the impaired glucose tolerance did not translate into changes in
insulin secretion (in vivo or static incubation studies in vitro) as UCP2BKO and RIP-Cre controls
had equivalent values for GSIS. On the contrary, the ZUCP2-/- had increased GSIS, both in vivo
and in vitro, compared to controls (Zhang et al. 2001, Joseph et al. 2002, Lee et al. 2009).
Morphological studies showed that UCP2BKO and RIP-Cre controls had no differences in islet
number (per area) similar to the ZUCP2-/- (Joseph et al. 2002). However, equivalent levels of
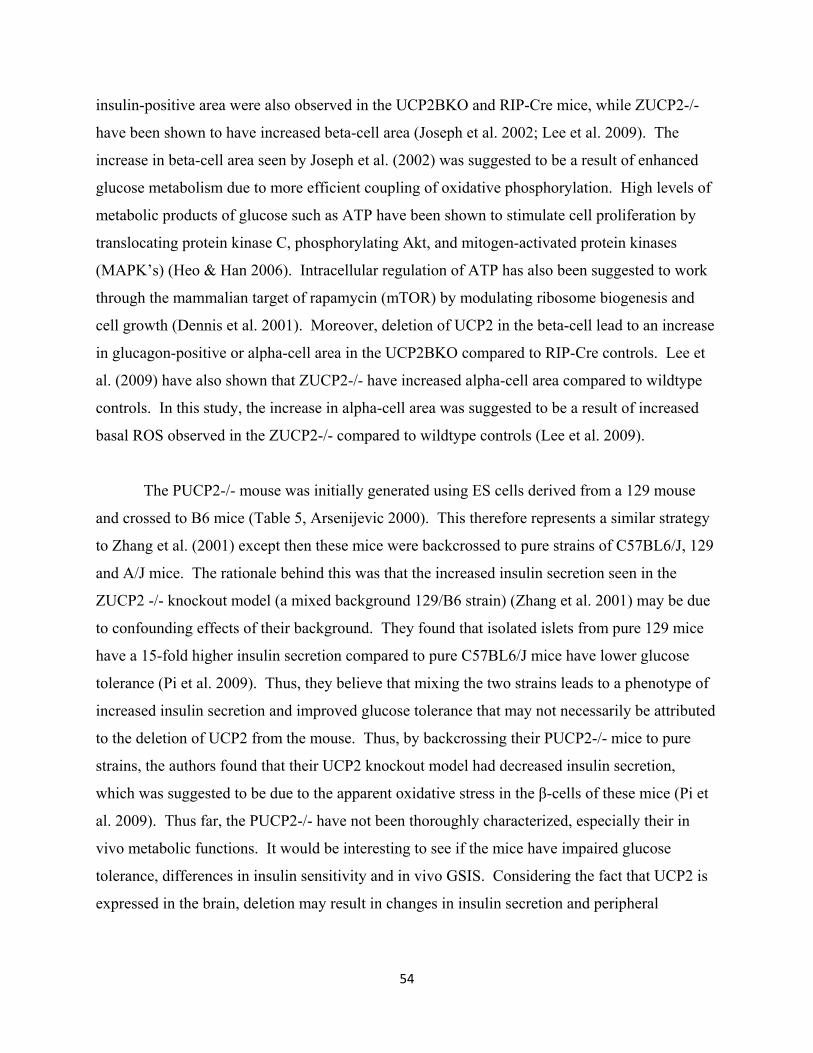
54
insulin-positive area were also observed in the UCP2BKO and RIP-Cre mice, while ZUCP2-/-
have been shown to have increased beta-cell area (Joseph et al. 2002; Lee et al. 2009). The
increase in beta-cell area seen by Joseph et al. (2002) was suggested to be a result of enhanced
glucose metabolism due to more efficient coupling of oxidative phosphorylation. High levels of
metabolic products of glucose such as ATP have been shown to stimulate cell proliferation by
translocating protein kinase C, phosphorylating Akt, and mitogen-activated protein kinases
(MAPK’s) (Heo & Han 2006). Intracellular regulation of ATP has also been suggested to work
through the mammalian target of rapamycin (mTOR) by modulating ribosome biogenesis and
cell growth (Dennis et al. 2001). Moreover, deletion of UCP2 in the beta-cell lead to an increase
in glucagon-positive or alpha-cell area in the UCP2BKO compared to RIP-Cre controls. Lee et
al. (2009) have also shown that ZUCP2-/- have increased alpha-cell area compared to wildtype
controls. In this study, the increase in alpha-cell area was suggested to be a result of increased
basal ROS observed in the ZUCP2-/- compared to wildtype controls (Lee et al. 2009).
The PUCP2-/- mouse was initially generated using ES cells derived from a 129 mouse
and crossed to B6 mice (Table 5, Arsenijevic 2000). This therefore represents a similar strategy
to Zhang et al. (2001) except then these mice were backcrossed to pure strains of C57BL6/J, 129
and A/J mice. The rationale behind this was that the increased insulin secretion seen in the
ZUCP2 -/- knockout model (a mixed background 129/B6 strain) (Zhang et al. 2001) may be due
to confounding effects of their background. They found that isolated islets from pure 129 mice
have a 15-fold higher insulin secretion compared to pure C57BL6/J mice have lower glucose
tolerance (Pi et al. 2009). Thus, they believe that mixing the two strains leads to a phenotype of
increased insulin secretion and improved glucose tolerance that may not necessarily be attributed
to the deletion of UCP2 from the mouse. Thus, by backcrossing their PUCP2-/- mice to pure
strains, the authors found that their UCP2 knockout model had decreased insulin secretion,
which was suggested to be due to the apparent oxidative stress in the β-cells of these mice (Pi et
al. 2009). Thus far, the PUCP2-/- have not been thoroughly characterized, especially their in
vivo metabolic functions. It would be interesting to see if the mice have impaired glucose
tolerance, differences in insulin sensitivity and in vivo GSIS. Considering the fact that UCP2 is
expressed in the brain, deletion may result in changes in insulin secretion and peripheral
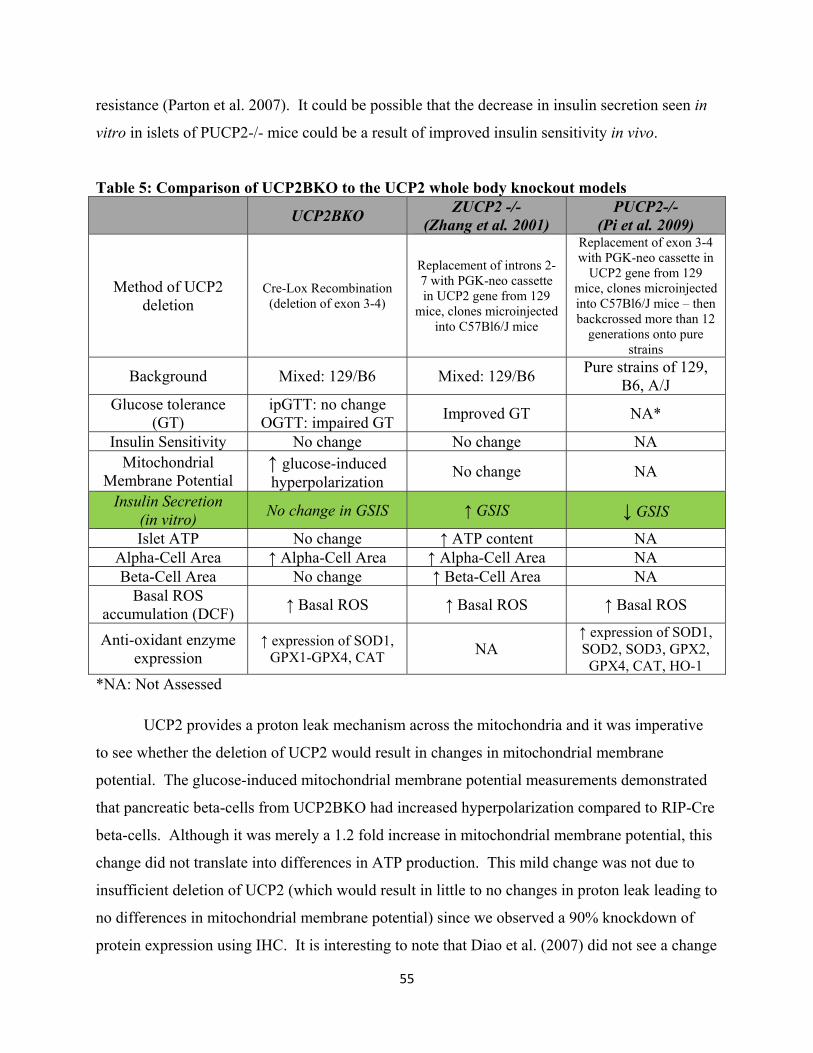
55
resistance (Parton et al. 2007). It could be possible that the decrease in insulin secretion seen in
vitro in islets of PUCP2-/- mice could be a result of improved insulin sensitivity in vivo.
Table 5: Comparison of UCP2BKO to the UCP2 whole body knockout models UCP2BKO ZUCP2 -/-
(Zhang et al. 2001) PUCP2-/-
(Pi et al. 2009)
Method of UCP2 deletion
Cre-Lox Recombination (deletion of exon 3-4)
Replacement of introns 2-7 with PGK-neo cassette in UCP2 gene from 129
mice, clones microinjected into C57Bl6/J mice
Replacement of exon 3-4 with PGK-neo cassette in
UCP2 gene from 129 mice, clones microinjected into C57Bl6/J mice – then backcrossed more than 12
generations onto pure strains
Background Mixed: 129/B6 Mixed: 129/B6 Pure strains of 129, B6, A/J
Glucose tolerance (GT)
ipGTT: no change OGTT: impaired GT Improved GT NA*
Insulin Sensitivity No change No change NA Mitochondrial
Membrane Potential ↑ glucose-induced hyperpolarization
No change NA
Insulin Secretion (in vitro) No change in GSIS ↑ GSIS ↓ GSIS
Islet ATP No change ↑ ATP content NA Alpha-Cell Area ↑ Alpha-Cell Area ↑ Alpha-Cell Area NA Beta-Cell Area No change ↑ Beta-Cell Area NA
Basal ROS accumulation (DCF) ↑ Basal ROS ↑ Basal ROS ↑ Basal ROS
Anti-oxidant enzyme expression
↑ expression of SOD1, GPX1-GPX4, CAT NA
↑ expression of SOD1, SOD2, SOD3, GPX2, GPX4, CAT, HO-1
*NA: Not Assessed
UCP2 provides a proton leak mechanism across the mitochondria and it was imperative
to see whether the deletion of UCP2 would result in changes in mitochondrial membrane
potential. The glucose-induced mitochondrial membrane potential measurements demonstrated
that pancreatic beta-cells from UCP2BKO had increased hyperpolarization compared to RIP-Cre
beta-cells. Although it was merely a 1.2 fold increase in mitochondrial membrane potential, this
change did not translate into differences in ATP production. This mild change was not due to
insufficient deletion of UCP2 (which would result in little to no changes in proton leak leading to
no differences in mitochondrial membrane potential) since we observed a 90% knockdown of
protein expression using IHC. It is interesting to note that Diao et al. (2007) did not see a change
56
in glucose-induced membrane hyperpolarization in beta-cells of ZUCP -/- mice, but still
observed a significant increase in ATP production compared to controls. UCP2 has been shown
to be a physiologically irrelevant uncoupler, thus deleting UCP2 may not necessarily result in
significant differences in overall mitochondrial membrane potential but still modulate ATP
production and insulin secretion (Bouillaud 2009; Diao et al. 2007). It is also quite possible that
the increase in ATP production seen in islets of ZUCP2-/- mice was due to deletion of UCP2 in
extrapancreatic tissues. Beta-cell insulin secretion is influenced by a myriad of paracrine effects
such as incretin-derived, neuronal, and alpha-cell, thus results obtained from ZUCP2-/-
knockout studies could be a result of extrapancreatic deletion of UCP2 (Henquin et al. 2003).
Diao et al.(2007) have demonstrated that UCP2 is highly expressed in alpha-cells and influences
alpha-cell survival, and deletion could lead to paracrine influences on beta-cells and
consequently on insulin secretion. Moreover, Parton et al. (2008) have recently shown that
hypothalamic POMC neurons of ZUCP2-/- mice on a HFD had improved glucose sensing and
maintained superior glucose homeostasis. Thus, it is quite possible that the whole body
phenotype of ZUCP2-/- could be explained by deletion of UCP2 in the CNS with hypothalamic
neurons that synapse on beta-cells influencing ATP production and insulin secretion.
On the other hand, it is well established that even slight increases in mitochondrial
membrane potential are strongly associated with increased ROS production (Korshunov et al.
1997). The mitochondria is the primary location of ROS production and increased membrane
potential results in a higher number of electrons escaping from the ETC to form superoxides and
other ROS (Chen et al. 2003). High production of ROS can lead to the perforation of the
mitochondrial membrane (making it more ‘leaky’ to protons) (Roberts & Sindhu 2009),
decreased activity of subunits involved in the ETC , and downregulation of mitochondrial
biogenesis (Li et al. 2009) which, in turn, attenuate ATP production and insulin secretion (Pi et
al. 2009). Thus, a consequence of higher mitochondrial membrane potential could be the
increased ROS accumulation observed in the islets of UCP2BKO. The increased ROS
accumulation in UCP2BKO islets could be involved in mitochondrial dysfunction (Victor et al.
2009; Li et al. 2009). However, considering that there was a mild increase in mitochondrial
membrane potential, it may not have been significant enough to result in changes in ATP
production and insulin secretion. Moreover, it is possible that deleting UCP2 leads to efficient
coupling for ATP production, however, this may be counteracted by the competing and opposing
57
effects of ROS damage and mitochondrial dysfunciton, which result in the attenuation of insulin
secretion.
The most significant distinction amongst the three models would have to be the 3 distinct
results obtained from GSIS studies (Table 5, highlighted in green). While islets from ZUCP2-/-
were shown to have increased GSIS, which was proposed to be due to more efficient coupling
and higher ATP production, Pi et al. observed a decrease in GSIS in islets of their PUCP2-/-
(Zhang et al. 2001; Pi et al. 2009). Similar to Pi et al. (2009), the UCP2BKO model had
relatively increased ROS accumulation (shown through increases in DCF fluorescence as well as
higher gene expression of anti-oxidant enzymes), however, no evidence of impairments in
insulin secretion were observed (in vivo or in vitro). The equivalent levels of insulin secretion
could be a result of increased levels of ROS accumulation observed in the beta-cells of
UCP2BKO mice compared to RIP-cre beta-cells. As explained in detail below, mitochondrial
ROS production can damage key subunits in the ETC and ATP production, thus attenuating the
increase of insulin secretion that could have been observed as a result of deleting UCP2 in the
pancreatic beta-cell (Li et al. 2009). As well, the higher alpha-cell or glucagon-positive area
could also explain the equivalent levels of insulin secretion observed. The hormone glucagon
secreted by alpha-cells negatively regulates insulin secretion and vice versa (Bansal & Wang
2008). As discussed below, the increase in glucagon content of UCP2BKO mice could be
playing a significant impact on GSIS from whole islets and thus, counteracting any increase in
insulin secretion usually seen when UCP2 is deleted from the beta-cell.
4.2.2 UCP2BKO and Oxidative Stress Considering UCP2’s proposed role in cytoprotection against oxidative stress, it was
important to confirm whether the UCP2BKO mice showed signs of increased ROS accumulation
and other consequences of oxidative stress. It is proposed that the production of mitochondrial
ROS such as superoxides upregulate UCP2 activity and expression, which in turn, leads to a
decrease in ROS accumulation (Echtay et al. 2002). Undoubtedly, pancreatic oxidative stress is
one of the characteristics of diabetes, where Type-2 diabetic patients have increased
accumulation of hydrogen peroxides (Nourooz-Zadeh et al. 1995). Moreover, it has been
58
previously demonstrated that exposure of beta-cells to high levels of oxidative stress results in
decreased mitochondrial oxygen consumption and ATP production as well as a decreased
expression of respiratory chain subunits and genes responsible for mitochondrial biogenesis (Li
et. al. 2009). As Pi et al. (2009) suggest, chronic oxidative stress in their PUCP2-/- model was
proposed to result in impaired GSIS. However, considering the mild increases in ROS and
antioxidant gene expression (Figure 29&30), the UCP2BKO mice did not show any significant
consequences of chronic oxidative stress (such as severely impaired insulin-positive area, GSIS
or ATP production). Thus, although increases in similar markers of oxidative stress were
observed in the islets of UCP2BKO mice as the PUCP2-/-, this did not translate into impairments
in insulin secretion.
On the other hand, low levels of ROS accumulation have been observed to be a metabolic
signal that modulates GSIS (Pi et al. 2007) as well as shown to be an important component of
cell signaling. H2O2 production can activate various signal transduction pathways such as
MAPKs (kinases involved in mitosis & cell proliferation), NF-κB/rel (plays a key role in
regulating immune response to infection) and AP-1 (transcription factor that regulated gene
expression in response to growth factors) (Powis et al. 1997). Joseph et al. (2002) observed that
when ZUCP2-/- mice were placed on a HFD, they were able to tolerate the development of diet-
induced obesity by compensating with increased beta-cell area. This could be as a result of
increased levels of ROS. As well, Pi et al. (2007) have shown that both exogenous dosage and
endogenous production of ROS stimulates GSIS. Thus, although mitochondrial ROS
accumulation have always been understood to be a damaging by-product, low levels of ROS
could be involved in cell signaling, proliferation, and secretion pathways.
4.2.3 UCP2BKO and α-cell area Interestingly, pancreatic morphological studies indicated that the UCP2BKO had
increased staining for alpha-cell (or glucagon-positive) area. We have previously shown that the
whole body knockout model of UCP2 has both increased beta- as well as alpha-cell area on both
a chow-fed diet (Lee et al. 2009) as well as a high-fat diet (Joseph et al. 2002). Although further
analysis showed no significant differences in fasting plasma glucagon, a slightly increased
59
glucagon-positive area may explain the mild glucose intolerance (as described in detail below)
that we observed in the UCP2BKO mice.
It is interesting to note that the immunohistochemistry staining observed for glucagon-
positive cells (Figure 28), is similar to that seen in mice treated with streptozotocin (STZ). STZ,
a chemical that specifically targets pancreatic beta-cells by triggering DNA fragmentation and
cellular dysfunction leading to apoptosis is widely used to study type-1 diabetes (Bedoya et al.
1996). Infiltration of peripheral alpha-cells due to the destruction of beta-cells in the core, is a
common observation in mice injected with low doses leading to beta-cell apoptosis (Adewole &
Ojewole 2007; Lee et al. 2009). Considering the alpha-cell morphology of UCP2BKO mice, it is
possible that the increased alpha-cell area could be an indicator of decreased proliferation of
beta-cells and/or increased apoptosis of beta-cells. Thus, increased apoptosis of the beta-cell
could also be another explanation for the impaired glucose tolerance seen in the OGTT results.
However, considering the fact that we found no evidence of beta-cell dysfunction, impairment or
decreased insulin-positive area in pancreata of UCP2BKO mice, a further explanation is
necessary for the increased glucagon-positive area in the beta-cell knockout. During metabolic
stress, the beta-cell inflammatory response results in the production of cytokines such as
interleukins (Ehses et al. 2009). One such cytokine, interleukin-6 (IL-6), has been shown to
result in increased proliferation of alpha-cells (Ehses et al. 2009). Thus, it is possible that the
increased inflammatory response in the UCP2BKO could lead to the production of IL-6 resulting
in increased glucagon secretion. Furthermore, it is well accepted that beta- and alpha-cells are
tightly regulated, where impairments of beta-cell function can lead to dysregulation of alpha-cell
proliferation and an increase in glucagon content and secretion (Henquin et al. 2003). As
mentioned above, studies suggest that low levels of ROS accumulation are involved in cell
proliferation and signal transduction pathways (Powis et al. 1997; Finkel 2000; Emre et al.
2007). ROS production may activate downstream signal transduction pathways such as the
MAPK pathway (as mentioned above) leading to cell growth and proliferation (Powis et al.
1997). The islets of UCP2BKO mice had increased production of H2O2 (as seen by DCF
fluorescence) and significantly higher levels of anti-oxidant enzyme expression (a marker of
ROS accumulation). Thus, it is also possible that greater ROS accumulation in the islets of
UCP2BKO directly results in increased cell growth and proliferation of the alpha-cells.
60
4.2.4 UCP2BKO and impaired glucose tolerance The discrepancy posed by the results from the tolerance tests (oral versus intraperitoneal)
may be explained by the differences one observes in the amount of insulin secreted between the
two assays. When an oral gavage is given, glucose passes through the gut resulting in the
stimulation of incretin hormones such as GLP-1 and GIP (Creutzfeldt 1985). With an oral
glucose supplement, the synergistic combination of indirect and direct stimulation leads to an
augmented insulin secretion as compared to an intraperitoneal injection (in which glucose is
absorbed into the bloodstream and directly acts on the pancreas). Thus, if there are subtle
differences in terms of insulin secretion, it may be masked by an ipGTT and more clearly
deciphered through an OGTT. Moreover, it is possible that the differences were not apparent
from an ipGTT due to the ‘RIP-Cre effect’. Studies have shown that the presence of the RIP-Cre
transgene alone leads to glucose intolerance due to the significant hypoplasia (eventually
resulting in an islet hyperplasia as they age) seen in the mice (Lee et al. 2006; Pomplun et al.
2007). Considering the fact that the UCP2BKO as well as the controls expressed the RIP-Cre
transgene, it is possible that the glucose intolerance observed in these mice could be masking the
subtle differences expected due to the deletion of UCP2 in the pancreatic beta-cell.
Interestingly, the glucose intolerance in the UCP2BKO can neither be explained by
impairments in insulin secretion nor differences in insulin sensitivity. However, there are two
possible explanations for the impaired glucose tolerance; the increased glucagon positive area as
well as the higher ROS accumulation in the UCP2BKO compared to RIP-Cre controls.
Although a significant difference in fasting plasma glucagon was not observed in the UCP2BKO
mice, further analysis of glucagon secretion could decipher differences in alpha cell function. In
addition to hypoinsulinemia, hyperglucagonemia has been associated with diabetic patients
(Burcelin et al. 2008). Studies have shown that suppression of glucagon after a glucose stimulus
is apparent in non-diabetic controls, but does not occur in patients with type 2 diabetes (Muller et
al. 1970; Raskin et al. 1978). However, hyperglucagonemia can result from α-cell dysfunction
as well as from some other impaired regulatory system upstream such as in the beta-cell
(Burcelin et al. 2008). The beta- and alpha- cell are tightly regulated, where it is possible that
due to an impairment or inhibition of insulin secretion, an increase in glucagon content and
secretion could occur (Weir et al. 1976; Unger 1983; Diao et al. 2005). Although, no
61
impairments in insulin secretion were observed in the UCP2BKO mice, it is quite possible that
the alpha-cells have defective insulin sensing (Diao et al. 2005). Thus, the impairment of insulin
sensing could result in decreased sensitivity of the alpha-cell to the suppressive effects of insulin.
As the increased glucagon-positive area suggests, glucagon secretion capacity may be impaired
in the alpha-cells of the UCP2BKO mice, which could explain the increased mass as a measure
to compensate. Moreover, as mentioned above, the increased oxidative stress and ROS
accumulation observed in the UCP2BKO mice may also elucidate the mechanism of glucose
intolerance in our mice (Roberts & Sindhu 2009; Wei et al. 2008).
It has been previously demonstrated that exposure of oxidative stress to beta cells results
in decreased mitochondrial oxygen consumption and ATP production as well as downregulation
of subunits of the respiratory chain and genes responsible for mitochondrial biogenesis (Li et al.
2009). Thus, the phenotype in question could be further explained by the increased
accumulation of beta-cell ROS in UCP2BKO, which leads to mitochondrial dysfunction,
resulting in an impairment of glucose tolerance. It is also possible that beta-cell dysfunction of
the UCP2BKO could lead to defective GLP-1 sensing and insulin secretion. A downregulation
of the GIP and GLP-1 receptor in pancreatic islets has been observed in models of type-2
diabetes (Shu et al. 2009). Increased beta-cell oxidative stress, as observed in type-2 diabetes,
results in decreased transcription of key proteins such as the GIP and GLP-1 receptor (Shu et al.
2009). This downregulation could result in a decreased amplification of GLP-1 mediated
exocytosis of insulin (Li et al. 2009). Thus, beta-cell dysfunction in the UCP2BKO could result
in reduced expression of the GIP and GLP-1 receptor leading to decreased insulin secretion. It
would be interesting to assess insulin secretion by directly stimulating beta-cells with GLP-1 and
observe possible differences between UCP2BKO and controls. Therefore, the glucose
intolerance in the UCP2BKO mice could be a combinatorial effect of impairments through
significantly increased glucagon-positive area, as well as a higher ROS accumulation and beta-
cell dysfunction.
62
4.3 Future Directions
4.3.1 UCP2 in the Hypothalamus The reality of mouse transgenics is that there is no perfect model for studying the
knockdown of a protein. Studies have shown that expression of cre recombinase can have toxic
effects in cells including DNA damage and changes in cell growth (Loonstra 2001; Silver 2001).
Moreover, although very easily executed, the microinjection of a cre transgene into the embryo
does not control for the location of integration, which can modify the pattern and duration of cre
expression (Lee et al. 2006). As previously mentioned, both the RIP-Cre transgene and UCP2
are expressed in the hypothalamus resulting in the possibility of the deletion of UCP2 in this
tissue. Although, no significant differences were observed in UCP2 mRNA expression between
the hypothalami of UCP2BKO and RIP-Cre mice, the deletion could have occurred in a specific
set of neurons that may play a significant role in systemic glucose homeostasis. Thus, the
potential deletion of UCP2 in insulin-transcribing neurons of the CNS may have contributed to
the phenotype of our model (Chaudhary et al. 2005; Nguyen et al. 2006).
Initial studies using the RIP-Cre model to generate a beta-cell specific Insulin-receptor
substrate-2 (Irs2) knockout found that these mice had impaired glucose tolerance, reduced islet
mass as well as hypothalamic dysfunctions such as melanocortin dysfunction, and leptin
resistance (Lin et al. 2004; Kubota 2004). The studies concluded that a poorly defined set of
neurons in the hypothalamus expressed cre and contained the machinery to transcribe insulin
(Lin et al. 2004; Kubota 2004). The RIP-Cre model was initially the only beta-cell specific cre
model available and has demonstrated its importance in detecting and characterizing the role of
novel, insulin-transcribing neurons in the hypothalamus that would have gone undetected in any
other study. Difficulty of using this model only arises when the protein is expressed and has a
role in the brain, and deleting it may result in a hypothalamic-specific phenotype.
The hypothalamus is a key regulator of food intake and energy metabolism and
disruption of insulin signaling have been shown to result in insulin resistance and impaired
response to hypoglycemia. Moreover, Parton et al. (2008) have demonstrated that UCP2 is
expressed in the hypothalamus and may be involved in glucose homeostasis. POMC neurons
play a significant role in systemic glucose homeostasis and obese mice on a HFD had disrupted
63
glucose sensing in these neurons (Parton et al. 2008). Moreover, ZUCP2-/- mice on a HFD were
found to prevent obesity-induced loss of glucose sensing in POMC neurons and maintained
superior glucose homeostasis when compared to wildtype mice on a HFD (Parton et al. 2008).
Thus, considering the evidence of UCP2 expression in the hypothalamus and its potential
involvement in neuronal glucose sensing, it would be interesting to study neuron-specific
knockout models of UCP2. LoxUCP2 mice could be crossed to neuron expression models of the
cre transgene such as the POMC-Cre, or NPY-Cre to delete UCP2 from specific sets of neurons.
These models could enable us to specifically understand the role of UCP2 in hypothalamic
insulin signaling.
4.3.2 UCP2BKO on a High-Fat Diet A chronic high-fat diet study may further elaborate on the specific mechanisms of the
phenotype observed thus far in the UCP2BKO mice. Previous studies from our lab have shown
that on a HFD, ZUCP2-/- mice maintain superior pancreatic glucose responsiveness compared to
HFD-fed wildtype mice (Joseph et. al. 2002). ZUCP2-/- on a HFD have lower fasting blood
glucose, elevated insulin levels, and are more insulin sensitive (Joseph et. al. 2002). This
enhanced beta-cell response in ZUCP2-/- on a HFD was suggested to be due to a combination of
expanded beta-cell secretory capacity (seen through significantly higher pancreatic beta-cell
mass and insulin content) as well as superior fatty acid oxidation capacity (seen through
increased gene expression of carnitine palmitoyl transferase-1, Joseph et. al. 2002). Since
obesity (a result of a HFD) induces ROS accumulation (Furkawa et al. 2004), it is interesting to
note that although both ZUCP2-/- and wildtype controls were exposed to increased levels of
oxidative stress, ZUCP2-/- maintained superior beta-cell function. Thus, it is hypothesized that
on a normal diet, UCP2 being lowly expressed in the beta cell (Diao et. al. 2008), its activity may
be advantageous in attenuating ROS accumulation and maintaining normal insulin secretion.
This would explain the mild impairment in glucose tolerance we observed in the UCP2BKO
mice on a chow-fed diet. However, in a high-fat environment, which increases oxidative stress,
deletion of the protein may be beneficial to the islets. It is proposed that UCP2BKO on a HFD
may have improved islet function compared to controls through superior insulin secretory
capacity and improved fatty acid oxidation, which may overshadow the increased mitochondrial
ROS production seen in the mice.
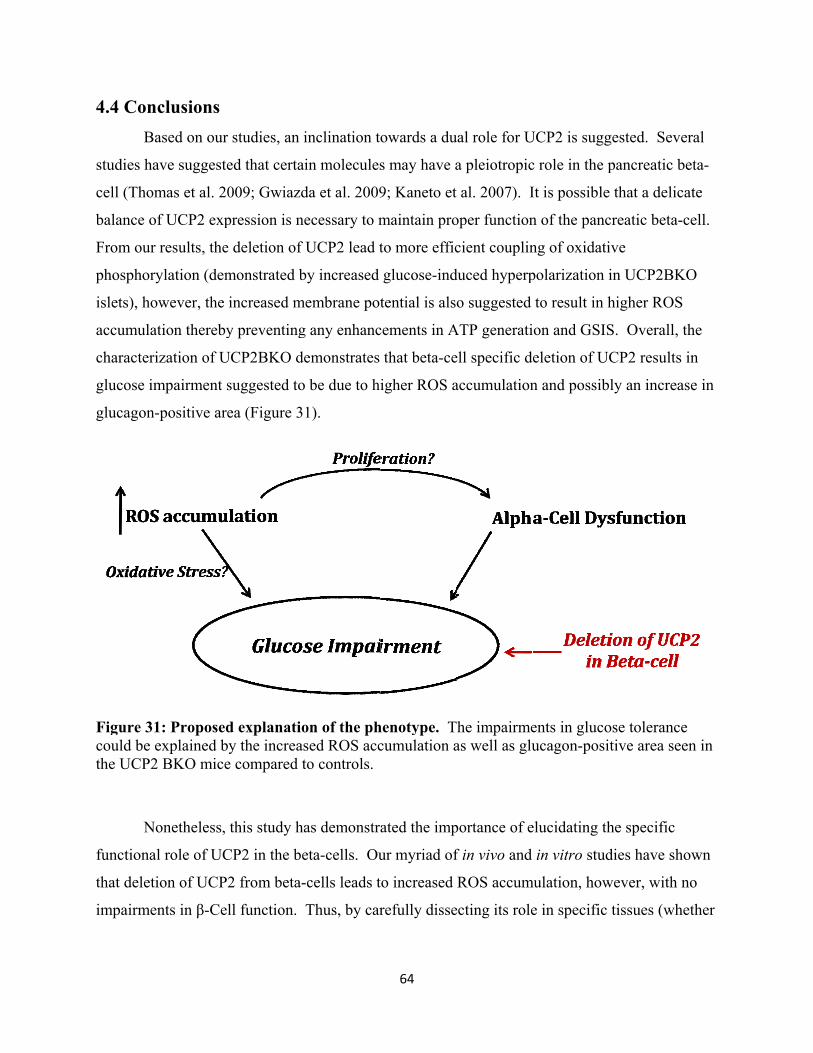
4.4 ConB
studies h
cell (Tho
balance o
From our
phosphor
islets), ho
accumula
character
glucose i
glucagon
Figure 3could be the UCP2
N
functiona
that delet
impairme
nclusions Based on our
have suggeste
omas et al. 20
of UCP2 exp
r results, the
rylation (dem
owever, the
ation thereby
rization of U
impairment s
n-positive are
31: Proposedexplained b
2 BKO mice
Nonetheless,
al role of UC
tion of UCP2
ents in β-Cel
studies, an i
ed that certa
009; Gwiazd
pression is n
e deletion of
monstrated b
increased m
y preventing
UCP2BKO de
suggested to
ea (Figure 3
d explanatioy the increas
e compared t
this study ha
CP2 in the be
2 from beta-
ll function.
inclination t
in molecules
da et al. 2009
ecessary to m
UCP2 lead t
by increased
membrane pot
g any enhanc
emonstrates
o be due to h
1).
on of the phsed ROS accto controls.
as demonstr
eta-cells. Ou
-cells leads t
Thus, by car
64
owards a du
s may have a
9; Kaneto et
maintain pro
to more effic
glucose-ind
tential is als
cements in A
that beta-ce
igher ROS a
henotype. Tcumulation a
ated the imp
ur myriad of
to increased
refully disse
ual role for U
a pleiotropic
t al. 2007). I
oper function
cient couplin
duced hyperp
o suggested
ATP generati
ell specific d
accumulation
The impairmeas well as glu
portance of e
f in vivo and
ROS accum
ecting its role
UCP2 is sugg
c role in the p
It is possible
n of the panc
ng of oxidati
polarization
to result in h
ion and GSIS
deletion of U
n and possib
ents in glucoucagon-posi
elucidating th
in vitro stud
mulation, how
e in specific
gested. Seve
pancreatic b
e that a delic
creatic beta-c
ive
in UCP2BK
higher ROS
S. Overall, t
CP2 results
bly an increa
ose toleranceitive area see
he specific
dies have sho
wever, with n
tissues (whe
eral
beta-
ate
cell.
KO
the
in
se in
e en in
own
no
ether

65
it is the neurons in the hypothalamus, macrophages, or the alpha or beta-cells), we will be able to
determine the pharmacological potential of targeting this protein for diabetes.
66
Reference List
1. Adewole SO, Ojewole JA. Insulin-induced immunohistochemical and morphological changes in pancreatic beta-cells of streptozotocin-treated diabetic rats. Methods Find Exp Clin Pharmacol. 29(7): 447-55, 2007.
2. Argyropoulous G, Brown AM, Willi SM, Zhu J, He Y, Reitman M, Gevao SM, Spruill I, Garvey WT. Effects of mutations in the human uncoupling protein 3 gene on the respiratory quotient and fat oxidation in severe obesity and type 2 diabetes. J Clin. Invest. 102: 1345-1351, 1998.
3. Armann B, Hanson MS, Hatch E, Steffen A, Fernandez LA. Quantification of basal and stimulated ROS levels as predictors of islet potency and function. Am J Transplant. 7: 38-47, 2007.
4. Arsenijevic D, Onuma H, Pecqueur C, Raimbault S, Manning BS, Miroux B, Couplan E, Alves-Guerra MC, Goubern M, Surwit R, Bouillaud F, Richard D, Collins S, Ricquier D: Disruption of the uncoupling protein-2 gene in mice reveals a role in immunity and reactive oxygen species production. Nature Genetics 26: 435-439, 2000.
5. Asghar Z, et al. Insulin resistance causes increased β-cell mass but defective glucose-stimulated insulin secretion in a murine model of type 2 diabetes. Diabetologia 49:90–99, 2006.
6. Bansal P, Wang Q. Insulin as a physiological modulator of glucagon secretion. Am J Physiol Endocrinol Metab. 295(4): E751-61, 2008.
7. Bedoya FJ, Solano F, Lucas M. N-monomethyl arginine and nicotinamide prevent streptozotocin-induced double strand DNA break formation in pancreatic rat islets. Experientia. 52: 344-347, 1996.
8. Bezaire V, Hofmann W, Kramer JK, Kozak LP, Harper ME. Effects of fasting on muscle mitochondrial energetic and fatty acid metabolism in UCP3(-/-) and wild-type mice. Am J Physiol Endocrinol Metab. 281: E975-E982, 2001.
9. Bezaire V, Seifert EL, Harper ME. Uncoupling protein-3: clues in an ongoing mitochondrial mystery. FASEB J. 2: 312-324, 2007.
10. Bindokas VP, Kuznetsov A, Sreenan S, Polonsky KS, Roe MW, Philipson LH. Visualizing superoxide production in normal and diabetic rat islets of Langerhans. J Biol Chem. 278: 9796-801, 2003.
11. Blanc J, Alves-Guerra MC, Esposito B, Rousset S, Gourdy P, Ricquier D, Tedgui A, Miroux B, Mallat Z. Protective role of uncoupling protein 2 in atherosclerosis. Circulation. 107: 388-390, 2003.
12. Bordone L, Motta MC, Picard F, Robinson A, Jhala US, Apfeld J, McDonagh T, Lemiuex M, McBurney M, Szilvasi A, Easlon EJ, Lin SJ, Guarente L. Sirt1 regulates insulin secretion by repressing UCP2 in pancreatic beta cells. PLos Biol. 4(2):e31, 2006.
13. Buettner C, Pocai A, Muse ED, Etgen AM, Myers MG Jr, Rossetti L. Critical role of STAT3 in leptin’s metabolic actions. Cell Metab 4: 49–60, 2006.
14. Boss, O., S. Samec, et al.: Uncoupling protein-3: a new member of the mitochondrial carrier family with tissue-specific expression. FEBS Lett 408(1): 39-42, 1997.
15. Bratanova-Tochkova TK, Cheng H, Daniel S, Gunawardana S, Liu YJ, Mulvaney-Musa J, Schermerhorn T, Straub SG, Yajima H, Sharp GW: Triggering and augmentation mechanisms, granule pools, and biphasic insulin secretion. Diabetes 51 Suppl 1:S83-90, 2002.
67
16. Brissova M, Fowler MJ, Nicholson WE, Chu A, Hirshberg B, Harlan DM, Powers AC: Assessment of human pancreatic islet architecture and composition by laser scanning confocal microscopy. J Histochem Cytochem 53:1087-1097, 2005.
17. Brubaker,P.L., So,D.C., and Drucker,D.J: Tissue-specific differences in the levels of proglucagon-derived peptides in streptozotocin-induced diabetes. Endocrinology 124: 3003-3009, 1989.
18. Bouillaud F. UCP2, not a physiologically relevant uncoupler but a glucose sparing switch impacting ROS production and glucose sensing. Biochim Biophys Acta. 1787(5): 377-83, 2009.
19. Burcelin R, Knauf C, Cani PD. Pancreatic alpha-cell dysfunction in diabetes. Diabetes Metab. Feb: 34 Suppl 2: S49-55, 2008.
20. Butler AE, Janson J, Bonner-Weir S, Ritzel R, Rizza RA, Butler PC: β-cell deficit and increased B-cell apoptosis in humans with type 2 diabetes. Diabetes 52: 102-110, 2003.
21. Campfield LA, Smith FJ, Guisez Y, Devos R, Burn P. Recombinant mouse OB protein: evidence for a peripheral signal linking adiposity and central neural netoworks. Science 269: 546–549, 1995.
22. Cantley J, Burchfield JG, Pearson GL, Schmitz-Pfeiffer C, Leitges M, Biden TJ. Deletion of PKCepsilon selectively enhances the amplifying pathways of glucose stimulated insulin secretion via incrased lipolysis in mouse beta-cells. Diabetes. 58: 1826-1834, 2009.
23. Cannon B, Nedergaard J. Brown adipose tissue: function and physiological significance. Physiol. Rev. 84: 277-359, 2004.
24. Chan CB., MacDonald PE, et al. Overexpression of uncoupling protein 2 inhibits glucose-stimulated insulin secretion from rat islets. Diabetes 48(7): 1482-6, 1999.
25. Chen Q, Vazquez EJ, Moghaddas S, Hoppel CL, Lesnefsky EJ. Production of reactive oxygen species by mitochondria: central role of complex III. J Biol Chem 278:36027-36031, 2003.
26. Choi D, Nguyen KT, Wang L, Schroer SA, Suzuki A, Mak TW, Woo M. Partial deletion of Pten in the hypothalamus leads to growth defects that cannot be rescued by exogenous growth hormone. Endocrinology. 149(9):4382-6, 2008.
27. Choudhury, A. I., H. Heffron, M. A. Smith, H. Al-Qassab, A. W. Xu, C. Selman, M. Simmgen, M. Clements, M. Claret, G. Maccoll, D. C. Bedford, K. Hisadome, I. Diakonov, V. Moosajee, J. D. Bell, J. R. Speakman, R. L. Batterham, G. S. Barsh, M. L. Ashford, and D. J. Withers. The role of insulin receptor substrate 2 in hypothalamic and beta cell function. J. Clin. Investig. 115:940–950, 2005.
28. Cnop M, Welsh N, Jonas JC, Jorns A, Lenzen S, Eizirik DL: Mechanisms of pancreatic beta-cell death in type 1 and type 2 diabetes: many differences, few similarities. Diabetes 54: S97-107, 2005.
29. Coppari R, Ichinose M, Lee CE, Pullen AE, Kenny CD, McGovern RA, Tang V, Liu SM, Ludwing T, Chua SC, Lowell BB, Elmquist JK. The hypothalamic arcuate nucleus: a key site for mediating leptin’s effects on glucose homeostasis and locomotor activity. Cell Metab. 1: 63-72, 2005.
30. Creutzfeldt W, Ebert R: New developments in the incretin concept today. Diabetologia 28:565–573, 1985.
31. D'Adamo M, Perego L, Cardellini M, Marini MA, Frontoni S, Andreozzi F, Sciacqua A, Lauro D, Sbraccia P, Federici M, Paganelli M, Pontiroli AE, Lauro R, Perticone F, Folli
68
F, Sesti G. The -866A/A genotype in the promoter of the human uncoupling protein 2 gene is associated with insulin resistance and increased risk of type 2 diabetes. Diabetes 53:1905-1910, 2004.
32. Dennis PB, Jaeschke A, Saitoh M, Fowler B, Kozma SC, Thomas G. Mammalian TOR: a homeostatic ATP sensor. Science. 294(5544): 1102-5.
33. Diao J, Asghar Z, Chan CB, Wheeler MB. Glucose-regulated glucagon secretion requires insulin receptor expression in pancreatic alpha-cells. J Biol Chem 280:33487–33496, 2005.
34. Diao J, et al.: UCP2 is highly expressed in pancreatic α-cells and influences secretion and survival. PNAS 105(33):12057-62, 2008.
35. Duval C, Negre-Salvayre A, Dogilo A, Salvayre R, Penicaud L, Casteilla L. Increased reactive oxygen species production with antisense oligonucleotides directed against uncoupling protein 2 in murine endothelial cells. Biochem Cell Biol. 80:757-764, 2002.
36. Echtay KS. Mitochondrial uncoupling proteins – What is their physiological role? Free Radical Biology & Medicine. 43: 1351-1371, 2007.
37. Echtay KS, Roussel D, St-Pierre J, Jekabsons MB, Cadenas S, Stuart JA, Harper JA, Roebuck SJ, Morrison A, Pickering S, Clapham JC, Brand MD. Superoxide activates mitochondrial uncoupling proteins. Nature (London). 415: 96-99, 2002.
38. Echtay KS, Winkler E, Frischmuth K, Klingenberg M. Uncoupling proteins 2 and 3 are highly active H(+) transporters and highly nucleotide sensitive when activated by conenzyme Q (ubiquinone). Proc Natl Acad Sci USA. 98:1416-1421.
39. Ehses JA, Ellingsgaard H, Boni-Schnetzler M, Donath MY. Pancreatic islet inflammation in type 2 diabetes: From alpha to beta cell compensation to dysfunction. Archives of Physiology and Biochemistry. 115(4): 240-247.
40. Emre Y, Hurtaud C, Nubel T, Criscuolo F, Ricquier D & Cassard-Doulcier AM. Mitochondria contribute to LPS-induced MAPK activation via uncoupling protein UCP2 in macrophages. Biochemical Journal 402, 271–278, 2007.
41. Enerback, S., Jacobsson, A., Simpson, E.M., Guerra, C., Yamashita,H, Harper, M.E., and Kozak, L.P. Mice lacking mitochondrial uncoupling protein are cold-sensitive but not obese. Nature 387:90–94, 1997.
42. Ferrannini E, Maria A. How to measure insulin sensitivity. Journal of Hypertension. 16(7): 895-906, 1998.
43. Finkel T. Redox-dependent signal transduction. FEBS Letters. 476, 52–54, 2000. 44. Formiguera, X. and A. Canton: Obesity: epidemiology and clinical aspects. Best Pract
Res Clin Gastroenterol 18(6): 1125-46, 2004. 45. Frayling TM Genome-wide association studies provide new insights into type 2 diabetes
aetiology. Nat Rev Genet 8(9):657-662, 2007. 46. Fujimoto K, Shilbasaki T, Yokoi N, Kashima Y, Matsumoto M et al. Piccolo, a Ca2+
sensor in pancreatic beta-cells. Involvement of cAMP-GEFII.Rim2. Piccolo complex in cAMP-dependent exocytosis. J Biol Chem. 277: 50497-50502, 2002.
47. Furukawa S, Fujita T, Shimabukuro M, Iwaki M, Yamada Y, Nakajima Y, Nakayama O, Makishima M, Maatsuda M, Shimomura I. Increased oxidative stress in obesity and its impact on metabolic syndrome. J Clin Invest. 114(12): 1752-61, 2004.
48. Gable DR, Stephens JW, Cooper JA, Miller GJ, Humphries SE. Variation in the UCP2-UCP3 gene cluster predicts the development of type 2 diabetes in healthy middle-aged men. Diabetes 55:1504-1511, 2006.
69
49. Gelling RW, Morrison CD, Niswender KD, Myers MG Jr., Rhodes CJ, Schwartz MW. Insulin action in the brain contributes to glucose lowering during insulin treatment of diabetes. Cell Metab. 3: 67-73, 2006.
50. Gembal M, Gilon P, Henqin JC. Evidence that glucose can control insulin release independently from its action on ATP-sensitive K+ channels in mouse beta-cells. J Clin Invest. 89: 1288-1295, 1992.
51. Gembal M, Detimary P, Gilon P, Gao ZY, Henquin JC. Mechanisms by which glucose can control insulin release independently from its action on ATP-sensitive K+ channels in mouse beta-cells. J Clin Invest. 91: 871-880, 1993.
52. Gilon P, Henquin JC. Mechanisms and physiological significance of the cholinergic control of the pancreatic Beta-cell function. Endocrin Rev. 22: 565-604, 2001.
53. Gwiazda KS, Yang TL, Lin Y, Johnson JD. Effects of palmitate on ER and cytosolic Ca2+ homeostasis in beta-cells. Am J Physiol Endocrinol Metab. 296(4):E690-701, 2009.
54. Hagman DK, Hay LB, Parazzoli SD, Poitout V. Palmitate inhibits insulin gene expression by altering PDX-1 nuclear localization and reducing MafA expression in isolated rat islets of Langerhans. J. Biol Chem. 280: 32413-32418, 2005.
55. Halaas JL, Gajiwala KS, Maffei M, Cohen SL, Chait BT, Rabinowitz D, Lallone RL, Burley SK, Friedman JM. Weight-reducing effects of the plasma protein encoded by the obese gene. Science 269: 543–546, 1995.
56. Hamilton DL, Abremski K. Site-specific recombination by the bacteriophage P1 lox-cre system. Cre-mediated synapsis of two lox sites. J Mol Biol. 178: 481-486, 1984.
57. Henquin JC, Ravier MA Nenqin M, Jonas JC, Gilon P. Hierarchy of the beta-cell signals controlling insulin secretion. European Journal of Clinical investigation. 33: 742-750, 2003.
58. Heo JS & Han HJ. ATP stimulates mouse embryonic stem cell proliferation via protein kinase C, phosphatidylinositol 3-kinase/Akt, and mitogen-activated protein kinase signaling pathways. Stem Cells. 24(12): 2637-48, 2006.
59. Inoue H, Ogawa W, Asakawa A, Okamoto Y, Nishizawa A, Matsumoto M, Teshigawara K, Matsuki Y, Watanabe E, Hiramatsu R, Notohara K, Katayose K, Okamura H, Kahn CR, Noda T, Takeda K, Akira S, Inui A, Kasuga M. Role of hepatic STAT3 in brain-insulin action on hepatic glucose production. Cell Metab. 3: 267-275, 2006.
60. Ito E, Ozawa S, Takahashi K, Tanaka T, Katsuta H, Yamaguchi S, Maruyama M, Takizawa M, Katahira H, Yoshimoto K, Nagamatsu S, Ishida H. PPAR-gamma overexpression selectively suppresses insulin secretory capacity in isolated pancreatic islets through induction of UCP-2 protein. Biochem Biophys Res Commun 324:810-814, 2004.
61. Jones PM, Persaud SJ. Protein kinases, protein phosphorylation, and the regulation of insulin secretion from pancreatic beta-cells. Endocrine Rev. 19: 429-461, 1998.
62. Joseph, J. W., V. Koshkin, et al.: Uncoupling protein 2 knockout mice have enhanced insulin secretory capacity after a high-fat diet. Diabetes 51(11): 3211-9, 2002.
63. Joseph JW, et al.: Free fatty acid-induced β-cell defects are dependent on uncoupling protein 2 expression. J Biol Chem 279:51049–51056, 2004.
64. Kaneto H, Miyatsuka T, Kawamori D, Matsuoka TA. Pleiotropic Roles of PDX-1 in the Pancreas. Rev Diabet Stud. 4(4): 209-25, 2007.
65. Könner AC, Janoschek R, Plum L, Jordan SD, Rother E, Ma X, Xu C, Enriori P, Hampel B, Barsh GS, Kahn CR, Cowley MA, Ashcroft FM, Brüning JC. Insulin action in AgRP-
70
expressing neurons is required for suppression of hepatic glucose production. Cell Metab 5: 438–449, 2007.
66. Korshunov SS, Skulachev VP, Starkov AA. High protonic potential actuates a mechanism of production of reactive oxygen species in mitochondria. FEBS Letters 416:15-18, 1997.
67. Kubota, N., et al. Insulin receptor substrate 2 plays a crucial role in β cells and the hypothalamus. J. Clin. Invest. 114:917–927, 2004.
68. Lam CKL Chari M, Lam TKT: CNS regulaton of glucose homeostasis. Physiology 24, 159-170, 2009.
69. Lam TK, Gutierrez-Juarez R, Pocai A, Rossetti L. Regulation of blood glucose by hypothalamic pyruvate metabolism. Science 309: 943–947,2005.
70. Lee JY, Ristow M, Lin X, White MF, Magnuson MA, Hennighausen L. RIP-Cre Revisited, Evidence for Impairments of Pancreatic Beta-Cell function. The Journal of Biological Chemistry. 281(5):2649-2653, 2006.
71. Lee SC, Robson-Doucette CA, Wheeler MB. Uncoupling protein 2 regulates reactive oxygen species formation in islets and influences susceptibility to diabetogenic action of streptozotocin. Journal of Endocrinology. 203, 1-12, 2009.
72. Levin BE, Routh VH, Kang L, Sanders NM, Dunn-Meynell AA. Neuronal glucosensing: what do we know after 50 years? Diabetes. 53: 2521-2528, 2004.
73. Li N, Brun T, Cnop M, Cunha DA, Eizirik DL, Maechler P. Transient oxidative stress damages mitochondrial machinery inducing persistent beta-cell dysfunction. J Biol Chem. Jun 22. [Epub ahead of print], 2009.
74. Lin, X., et al. Dysregulation of insulin receptor substrate 2 in β cells and brain causes obesity and diabetes. J. Clin. Invest. 114:908–916, 2004.
75. Loonstra, A., Vooijs, M., Beverloo, H. B., Allak, B. A., van Drunen, E., Kanaar, R., Berns, A., and Jonkers, J. Growth inhibition and DNA damage induced by Cre recombinase in mammalian cells. Proc. Natl. Acad. Sci. U. S. A. 98, 9209–9214, 2001.
76. MacLelllan JD, Gerrits MF, Gowing A, Smith PJ, Wheeler MB, Harper ME. Diabetes. 54(8): 2343-2350, 2005.
77. Maestre I Jordan J Soledad C Reig JA Cena V Soria B Prentki M Roche E. Mitochondrial dysfunction is involved in apoptosis induced by serum withdrawal and fatty acids in the beta-cell line INS-1. Endocrinology. 144: 335-345, 2003.
78. Mattiasson G, Shamloo M, Gido G, Mathi K, Tomasevic G, Yi S, Warden CH, Castilho RF, Melcher T, Gonzalez-Zulueta M, Nikolich K, Wieloch T. Uncoupling protein-2 prevents neuronal death and diminishes brain dysfunction after stroke and brain trauma. Nat Med 9:1062-1068, 2003.
79. Muller WA, Faloona GR, Aguilar-Parada E, Unger RH. Abnormal alpha-cell dysfunction in diabetes. Response to carbohydrate and protein ingestion. N Engl J Med. 283: 109-15, 1970.
80. Muoio DM, Newgard CB: Molecular and metabolic mechanisms of insulin resistance and β-cell failure in type 2 diabetes. Nature Reviews 9(3): 193-205, 2008.
81. Nabben M, Hoeks J: Mitochondrial uncoupling protein 3 and its role in cardiac- and skeletal muscle metabolism. Physiology & Behaviour. 94(2): 259-69, 2008.
82. Nagy A. Cre recombinase: the universal reagent for genome tailoring. Genesis 26:99-109, 2000.
71
83. Nguyen KT, Tajmir P, Lin CH, Liadis N, Zhu XD, Eweida M, Tolasa-Karaman G, Cai F, Wang R, Kitamura T, Belsham DD, Wheeler MB, Suzuki A, Mak TW, Woo M. Essential role of Pten in body size determination and pancreatic beta-cell homeostasis in vivo. Mol Cell Biol. 26(12): 4511-8, 2006.
84. Nibbelink M, Moulin K, Arnaud E, Duval C, Penicaud L, Casteilla L. Brown fat UCP1 is specifically expressed in uterine longitudinal smooth muscle cells. J Biol. Chem. 276: 47291-47295, 2001.
85. Obici S, Feng Z, Morgan K, Stein D, Karkanias G, Rosetti L. Central administration of oleic acid inhibits glucose production and food intake. Diabetes. 51: 271-275, 2002.
86. Obici S, Zhang BB, Karkanias G, Rossetti L. Hypothalamic insulin signaling is required for inhibition of glucose production. Nat Med 8: 1376–1382, 2002.
87. Olofsson CS, Collins S, Bengtsson M, Eliasson L, Salehi A, Shimmomura K, Tarasov A, Holm C, Ashcroft F, Rorsman P. Long-term exposure to glucose and lipids inhibits glucose-induced insulin secretion downstream of granule fusion with plasma membrane. Diabetes. 56: 1888-1897, 2007.
88. Parton, L.E., Ye, C.P., Coppari, R., Enriori, P.J., Choi, B., Zhang, C.Y., Xu, C., Vianna, C.R., Balthasar, N., Lee, C.E., Elmquist, J.K., Cowley, M.A., Lowell, B.B: Glucose sensing by POMC neurons regulates glucose homeostasis and is impaired in obesity. Nature 449, 228-232, 2007.
89. Patane G, Anello M, Piro S, Vigneri R, Purrello F, Rabuazzo AM. Role of ATP production and uncoupling protein-2 in the insulin secretory defect induced by chronic exposure to high glucose or free fatty acids and effects of peroxisome proliferator-activated receptor-gamma inhibition. Diabetes 51:2749-2756, 2002.
90. Pecqueur C, M. C. Alves-Guerra, et al.: Uncoupling protein 2, in vivo distribution, induction upon oxidative stress, and evidence for translational regulation. J Biol Chem 276(12): 8705-12, 2001.
91. Pecqueur C, Cassard-Doulcier AM, Raimbault S, C. Fleury B, Gelly C, Bouillaud F, Ricquier D. Biochemical and Biophysical Research Communications. 255(1): 40-46, 1999.
92. Pelleymounter MA, Cullen MJ, Baker MB, Hecht R, Winters D, Boone T, Collins F. Effects of the obese gene product on body weight regulation in ob/ob mice. Science 269: 540–543, 1995.
93. Pi J, Bai Y, Zhang Q, Wong V, Floering LM, Daniel K, Reece JM, Deeney JT, Andersen ME, Corkey BE, Collins S. Reactive oxygen species as a signal in glucose-stimulated insulin secretion. Diabetes 56:1783-91, 2007.
94. Pi J, Bai Y, Daniel KW, Liu D, Lyght O, Edelstein D, Brownlee M, Corkey BE, Collins S. Persistent oxidative stress due to absence of uncoupling protein 2 associated with impaired pancreatic beta-cell function. Endocrinology. Feb 26. [Epub ahead of print], 2009.
95. Poitout,V, Robertson,RP: Minireview: Secondary beta-cell failure in type 2 diabetes-a convergence of glucotoxicity and lipotoxicity. Endocrinology 143:339-342, 2002.
96. Pomplun D, Florian, S, Schulz, T, Pfeiffer, AFH, Ristow M: Alterations of Pancreatic Beta-cell Mass and Islet Number due to Ins2-controlled Expression of Cre Recombinase: RIP-Cre Revisited; Part 2. Horm. Metab. Res. 39: 1-5, 2007.
97. Produit-Zengaffinen,N., Davis-Lameloise,N., Perreten,H., Becard,D., Gjinovci,A., Keller,P.A., Wollheim,C.B., Herrera,P., Muzzin,P., and Assimacopoulos-Jeannet,F:
72
Increasing uncoupling protein-2 in pancreatic beta cells does not alter glucose-induced insulin secretion but decreases production of reactive oxygen species. Diabetologia 50, 84-93, 2007.
98. Raskin P, Aydin I, Yamamoto T, Unger RH. Abnormal alpha cell function in human diabetes: the response to oral protein Am J Med. 64: 988-97, 1978.
99. Ray MK, Fagan SP, Moldovan S, DeMayo FJ and Brunicardi FC: A Mouse Model for Beta Cell-Specific Ablation of Target Gene(s) Using the Cre-loxP System. Biochemical and Biophysical Research Communications. 253, 65-69, 1998.
100. Rhodes CJ: Type 2 diabetes – a matter of beta-cell life and death? Science 307(5708): 380-384, 2005.
101. Roberts CK, Sindhu KK. Oxidative stress and metabolic syndrome. Life Sci. May 22;84(21-22):705-12, 2009
102. Saleh, M.C., Wheeler, M.B., Chan, C.B.: Uncoupling protein-2 evidence for its function as a metabolic regulator. Diabetologia 45: 174-187, 2002.
103. Samec, S., Seydoux, J, Dulloo, A.G: Role of UCP homologues in skeletal muscles and brown adipose tissue: mediators of thermogenesis of regulators of lipids as fuel substrates? Faseb J 12(9): 715-24, 1998.
104. Scheffler, I.E.: Mitochondria make a comeback. Advanced Drug Delivery Reviews. 49(1-2): 3-26, 2001.
105. Sesti G, Cardellini M, Marini MA, Frontoni S, D'Adamo M, Del Guerra S, Lauro D, De Nicolais P, Sbraccia P, Del Prato S, Gambardella S, Federici M, Marchetti P, Lauro R. A common polymorphism in the promoter of UCP2 contributes to the variation in insulin secretion in glucose-tolerant subjects. Diabetes 52:1280-1283, 2003.
106. Shimabukuro M, Higa M, Zhou YT, Wang MY, Newgard CB, Unger RH. Lipoapoptosis in beta-cells of obese prediabetic fa/fa rats. Role of serine palmitoyltransferase overexpression. J Biol Chem. 273: 32487-32490, 1999.
107. Shu L, Matveyenko AV, Kerr-Conte J, Cho JH, McIntosh CHS, Maedler K. Decreased TCF7L2 protein levels in type 2 diabetes mellitus correlate with downregulation of GIP- and GLP-1 receptors and impaired beta-cell function. Human Molecular Genetics. 18(13): 2388-2399, 2009.
108. Silver, D. P., and Livingston, D. M. Self-excising retroviral vectors encoding the Cre recombinase overcome Cre-mediated cellular toxicity. Mol. Cell 8, 233–243, 2001.
109. De Souza CT, Araujo EP, Stoppiglia LF, Pauli JR, Ropelle E, Rocco SA, Marin RM, Franchini KG, Carvalheira JB, Saad MJ et al. Inhibition of UCP2 expression reverses diet-induced diabetes mellitus by effects on both insulin secretion and action. FASEB Journal. 21 1153–1163, 2007.
110. Thomas HE, Graham KL, Angstetra E, McKenzie MD, Dudek NL, Kay TW. Interferon signallin in pancreatic beta cells. Front Biosci. 14: 644-56, 2009.
111. Takahashi A, Motomura K, Kato T, Yoshikawa T, Nakagawa Y, Yahagi N, Sone H, Suzuki H, Toyoshima H, Yamada N, Shimano H. Transgenic mice overexpressing nuclear SREBP-1c in pancreatic beta-cells. Diabetes 54:492-499, 2005.
112. Unger R. Insulin glucagon relationship in the defense against hypoglycaemia. Diabetes. 32: 575-83, 1983.
113. Victor VM, Rocha M, Banuls C, Sanchez-Serrano M, Sola E, Gomez M, Hernandez-Mijares A. Mitochondrial Complex I Impairment in Leukocytes from
73
Polycystic Ovay Syndrome Patients with Insulin Resistance. J Clin Endocrinol Metab. Jun 30. [Epub ahead of print], 2009.
114. Voyziyanov Y, Pathania S, Jayaram M. A general model for site-specific recombination by the integrase family recombinases. Nucleic Acids Res. 27:930-941, 1999.
115. Walker JE, Runswick MJ: The mitochondrial transport protein superfamily. J Bioenerg Biomembr. 25(5), 435-446, 1993.
116. Wei Y, Chen K, Whaley-Connell AT, Stump CS, Ibdah JA, Sowers JR. Skeletal muscle insulin resistance: role of inflammatory cytokines and reactive oxygen species. American Journal of Physiology. 294 (3), R673–680, 2008.
117. Weir GC, Knowlton SD, Atkins RF, McKennan KX, Martin DB. Glucagon secretion from the perfused pancreas of streptozotocin-treated rats. Diabetes. 25: 275-82, 1976.
118. Zhang CY, Parton LE, Ye CP, Krauss S, Shen R, Lin CT, Porco JA, Jr., Lowell BB. Genipin inhibits UCP2-mediated proton leak and acutely reverses obesity- and high glucose-induced beta cell dysfunction in isolated pancreatic islets. Cell Metab. 3:417-427, 2006.
119. Zhang CY, G. Baffy, et al.: Uncoupling protein-2 negatively regulates insulin secretion and is a major link between obesity, beta cell dysfunction, and type 2 diabetes. Cell. 105(6): 745-55, 2001.


![[Presented at AGU-2004 AE23A-0833] R. Sonnenfeld, J ...kestrel.nmt.edu/~rsonnenf/atmospheric/Pubs/AGUPamphlet2.pdf · shaped damper 2.0, made of rip-stop nylon kept the sonde well](https://static.fdocument.org/doc/165x107/5e1161d85b33c5109571d354/presented-at-agu-2004-ae23a-0833-r-sonnenfeld-j-rsonnenfatmosphericpubsagupamphlet2pdf.jpg)