CHAPTER 4 Studies of the methane steam reforming reaction at … · 2020-01-18 · bed reactor...
22
61 CHAPTER 4 Studies of the methane steam reforming reaction at high pressure in a ceramic membrane reactor 4.1. Introduction In this chapter, a membrane reactor study of the steam reforming of methane is presented. Methane steam reforming is an equilibrium-limited process involving three reversible reactions: ܪܥସ ܪଶ ֎ ܥ3 ܪଶ Δ ܪଶଽ ൌ 206 /ܬ ሺ4.1ሻ ܥ ܪଶ ֎ ܥ ଶ ܪଶ Δ ܪଶଽ ൌ െ41 /ܬ ሺ4.2ሻ ܪܥସ 2 ܪଶ ֎ ܥ ଶ 4 ܪଶ Δ ܪଶଽ ൌ 165 /ܬ ሺ4.3ሻ The studies used a novel silica-alumina membrane prepared by using the chemical vapor deposition (CVD) technique as mentioned in detail in Chapter 1. The conversion of methane, consumption rates of the reactants and the products yields obtained in a packed- bed reactor (PBR) were compared to those of a membrane reactor (MR) at various temperatures (773-923 K) and pressures (1-20 atm) using a commercial Ni/MgAl 2 O 4 catalyst. The conversion of methane was improved significantly in the MR by the countercurrent removal of hydrogen at all temperatures and allowed product yields higher
Transcript of CHAPTER 4 Studies of the methane steam reforming reaction at … · 2020-01-18 · bed reactor...
61
CHAPTER 4
Studies of the methane steam reforming reaction at high pressure
in a ceramic membrane reactor
4.1. Introduction
In this chapter, a membrane reactor study of the steam reforming of methane is
presented. Methane steam reforming is an equilibrium-limited process involving three
reversible reactions:
3 Δ 206 / 4.1
Δ 41 / 4.2
2 4 Δ 165 / 4.3
The studies used a novel silica-alumina membrane prepared by using the chemical
vapor deposition (CVD) technique as mentioned in detail in Chapter 1. The conversion of
methane, consumption rates of the reactants and the products yields obtained in a packed-
bed reactor (PBR) were compared to those of a membrane reactor (MR) at various
temperatures (773-923 K) and pressures (1-20 atm) using a commercial Ni/MgAl2O4
catalyst. The conversion of methane was improved significantly in the MR by the
countercurrent removal of hydrogen at all temperatures and allowed product yields higher
62
than equilibrium to be obtained. Pressure had a positive effect on the hydrogen yield
because of the increase in driving force for the permeance of hydrogen.
4.2. Experimental
4.2.1. Catalyst preparation and characterization
A commercial Ni/MgAl2O4 catalyst (NG-610-6H) provided by Unicat Catalysts was
used throughout the study. The original catalyst was crushed and sieved to sizes of 0.1-0.3
mm. A quantity of 2 g of this catalyst was mixed with 1 g of inert quartz chips of the same
size to make up a catalyst bed of 5 cm length to match the length of the membrane zone.
The catalyst was reduced in hydrogen at 923 K for 2 h before use.
The BET surface area was obtained from the nitrogen adsorption isotherm carried
out in a volumetric adsorption unit (Micromeritics, ASAP 2010). The catalyst sample was
degassed at 393 K in vacuum prior to the measurements. The CO uptake of the catalyst
was determined after reduction in 75 µmol s-1 (110 cm3 (NTP) min-1) of hydrogen at 823 K
for 2 h in a flow system. Pulses of CO were injected into a He carrier stream at room
temperature and the intensity of the CO signal (m/e = 28) was monitored with a mass
spectrometer (Dycor/Ametek Model MA100). The injection of CO was continued until
saturation of the sample surface was observed.
63
4.2.2. Preparation of hydrogen selective silica-alumina membranes
Hydrogen selective silica-alumina membranes similar to those reported in Chapter 1
were used in these studies. They were prepared by chemical vapor deposition (CVD) of a
thin permselective layer on a porous alumina support at 923 K. The support was a
commercial multilayered porous alumina support (Pall Corporation Part No. S700-0011) of
tubular geometry (OD=10 mm, ID=7 mm) with a 5 nm outer pore size. A length of 5 cm
of this support was connected to dense alumina tubing at both ends by thermal treatment of
a glass glaze (Duncan, IN, Part No. 1001) at 1153 K. The inside of the membrane was then
dip-coated in a 0.05 M dispersion of boehmite sol for 10 s and dried at room temperature
for 24 h. After drying, the membrane was calcined at 973 K for 2 h and at 923 K for 6 h.
4.2.3. Steam reforming of methane with a membrane reactor
The steam reforming of methane was conducted at various temperatures (773, 798,
823, 848, 873, 898, 923 K) and pressures (1, 5, 10, 15, 20 atm) in a packed-bed reactor
(PBR) and in a membrane reactor (MR). A mixture of steam and methane (S/C = 3/1) was
fed continuously to the reactor at a methane flow rate of 3.35 μmol/s (5.0 cm3 (NTP) min-1)
at atmospheric conditions. While the ratio of steam to methane was kept at 3 to 1, the
overall inlet flow rate of the reactants was increased proportionally to the pressure to keep
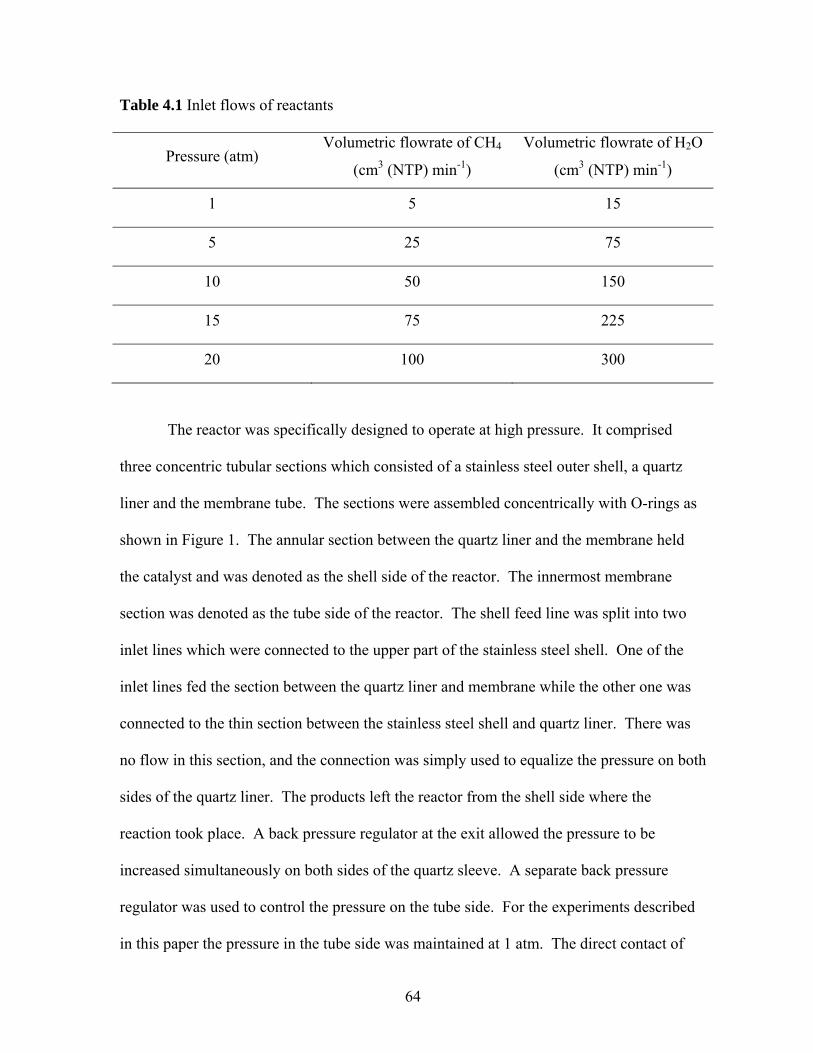
the residence time constant. The flow rates are tabulated in Table 4.1.
64
Table 4.1 Inlet flows of reactants
Pressure (atm) Volumetric flowrate of CH4
(cm3 (NTP) min-1)
Volumetric flowrate of H2O
(cm3 (NTP) min-1)
1 5 15
5 25 75
10 50 150
15 75 225
20 100 300
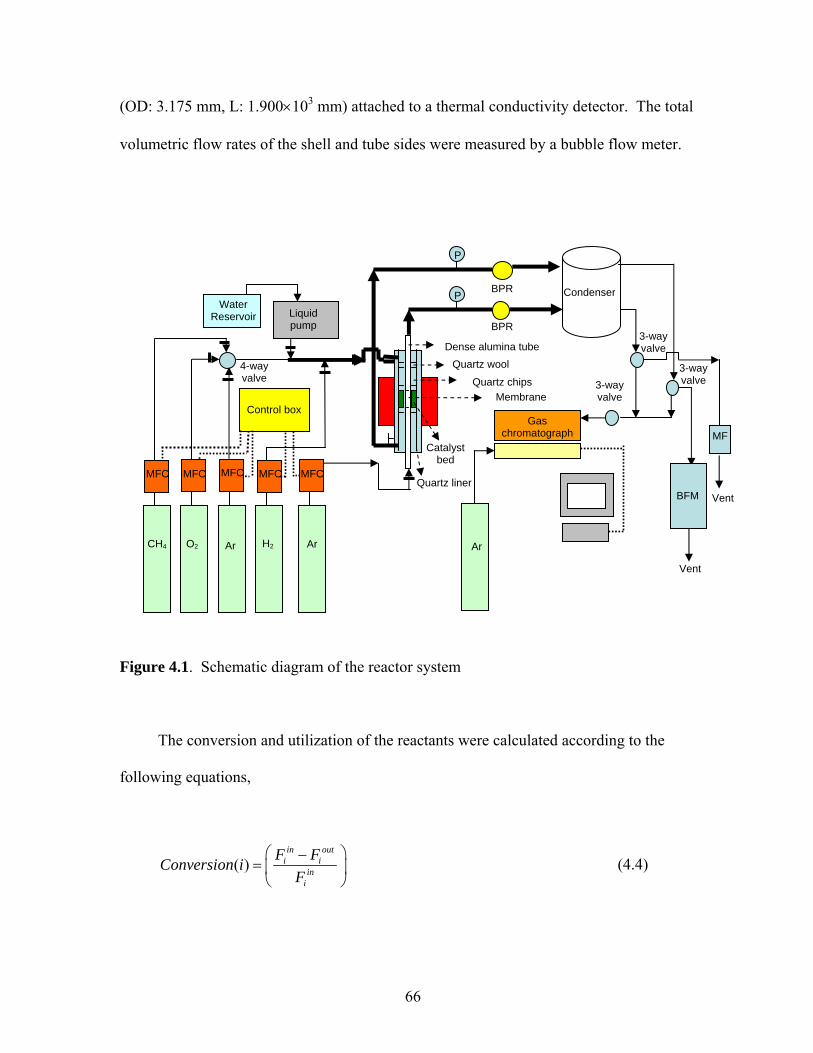
The reactor was specifically designed to operate at high pressure. It comprised
three concentric tubular sections which consisted of a stainless steel outer shell, a quartz
liner and the membrane tube. The sections were assembled concentrically with O-rings as
shown in Figure 1. The annular section between the quartz liner and the membrane held
the catalyst and was denoted as the shell side of the reactor. The innermost membrane
section was denoted as the tube side of the reactor. The shell feed line was split into two
inlet lines which were connected to the upper part of the stainless steel shell. One of the
inlet lines fed the section between the quartz liner and membrane while the other one was
connected to the thin section between the stainless steel shell and quartz liner. There was
no flow in this section, and the connection was simply used to equalize the pressure on both
sides of the quartz liner. The products left the reactor from the shell side where the
reaction took place. A back pressure regulator at the exit allowed the pressure to be
increased simultaneously on both sides of the quartz sleeve. A separate back pressure
regulator was used to control the pressure on the tube side. For the experiments described
in this paper the pressure in the tube side was maintained at 1 atm. The direct contact of
65
the catalyst with the stainless steel outer shell was avoided by this configuration which was
important as previous studies had found the stainless steel to promote carbon formation [1].
The tube side inlet line was connected to the membrane on the bottom side of the reactor
and permitted the permeated gases to be swept away from the top side of the reactor to
provide the benefits of countercurrent flow. An impermeable quartz tube was used instead
of the membrane for the studies in the packed-bed reactor configuration to keep the
geometry the same.
The catalyst pellets diluted with quartz chips of the same size was loaded in the
section between the quartz liner and membrane along the silica-alumina membrane zone.
The bed was supported with quartz wool and was preceded by a bed of the inert quartz
chips to provide better heating and mixing of the reactants. The reactor was installed in an
electric furnace and the temperature was increased at a ramping rate of 0.016 K s-1 (1 K
min-1) to the reaction temperature with respective argon flows of 33.5 μmol s-1 (50 cm3
(NTP) min-1) and 67 μmol s-1 (100 cm3 (NTP) min-1) through the shell and tube side of the
reactor before the introduction of hydrogen at a flow rate of 33.5 μmol s-1 (50 cm3 (NTP)
min-1) for 2 h on the shell side to reduce the catalyst. After the reduction, the reactants
(CH4 and H2O) were fed to the shell side of the reactor while the argon flow was continued
to be used as sweep gas through the tube side of the reactor. The back pressure regulators
were used to adjust the pressures on the shell and tube sides of the reactor. Both of the
streams passed through a condenser unit to remove moisture before injection into an on-
line gas chromatograph (SRI 8610). The compositions of the streams (H2, CH4, CO, CO2)
were determined by an on-line gas chromatograph using a carbosphere packed column
66
(OD: 3.175 mm, L: 1.900×103 mm) attached to a thermal conductivity detector. The total
volumetric flow rates of the shell and tube sides were measured by a bubble flow meter.
Figure 4.1. Schematic diagram of the reactor system
The conversion and utilization of the reactants were calculated according to the
following equations,
( )in out
i iin
i
F FConversion iF
⎛ ⎞−= ⎜ ⎟⎝ ⎠
(4.4)
Control box
Liquid pump
Gas chromatograph
Condenser
Ar Ar Ar H2 O2 CH4
P
P
BPR
BPR Water
Reservoir
MF
BFM
Vent
Vent
3-way valve
3-way valve
Membrane
Catalyst bed
4-way valve
Quartz wool
Quartz chips
Dense alumina tube
Quartz liner MFC
3-way valve
MFC MFC MFC MFC
67
( )in out
i iF FUtilization im
⎛ ⎞−= ⎜ ⎟⎝ ⎠
(4.5)
( )outjF
Yield jm
⎛ ⎞= ⎜ ⎟⎜ ⎟⎝ ⎠
(4.6)
where iniF is the inlet flow rate (mol s-1) of reactant species i, out
iF is the outlet flow rate
(mol s-1) of unreacted species i measured at the end of the reactor, outjF is the outlet flow
rate (mol s-1) of produced species j measured at the end of the reactor and m is weight of
the catalyst. The sum of the flow rates of reactant species in the shell and tube side were
used to calculate the conversion, the utilization of the reactants and the yield of the
products in the membrane reactor.
4.3. Results and Discussion
4.3.1. Catalyst properties and membrane performances
The BET surface area and the CO uptake of the commercial Ni/MgAl2O4 catalyst
were measured to be 150 m2 g-1 and 275 μmol g-1 respectively.
In this study, the alumina-silica membranes were utilized at a point where they were
stable after showing about 60 % loss of their initial hydrogen permeability. The permeance
of hydrogen at different pressures was also measured and are presented in Figure 4.2. A
68
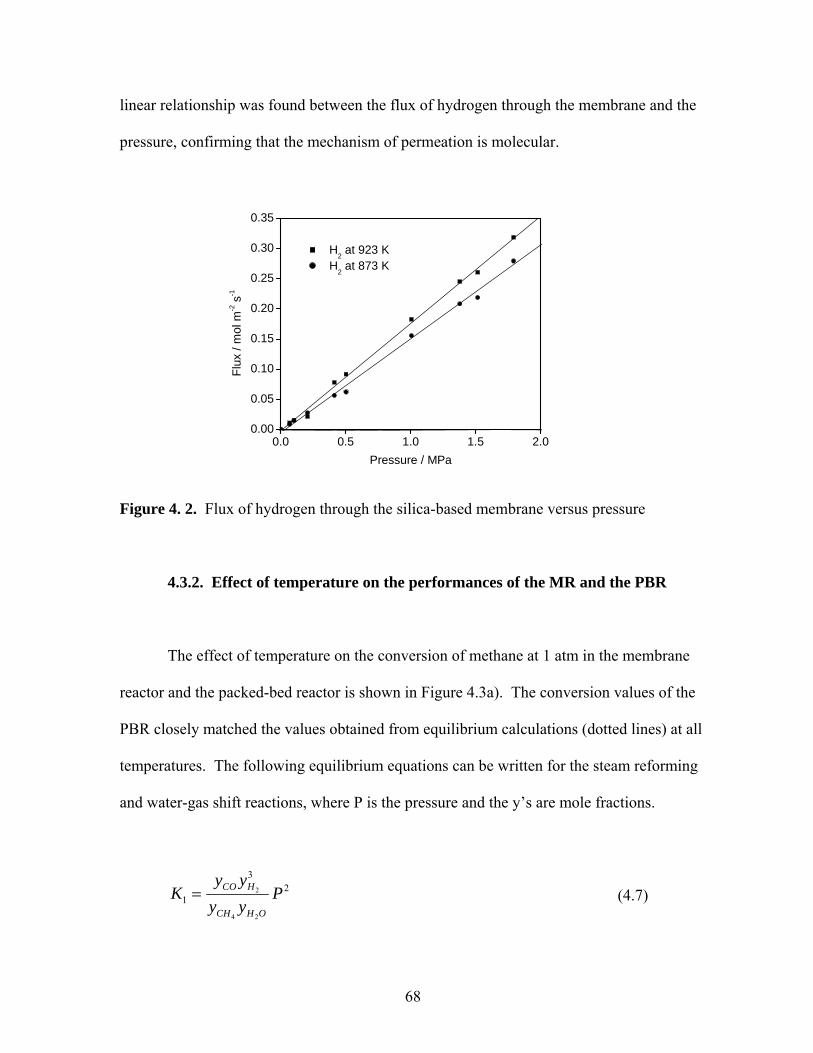
linear relationship was found between the flux of hydrogen through the membrane and the
pressure, confirming that the mechanism of permeation is molecular.
Figure 4. 2. Flux of hydrogen through the silica-based membrane versus pressure
4.3.2. Effect of temperature on the performances of the MR and the PBR
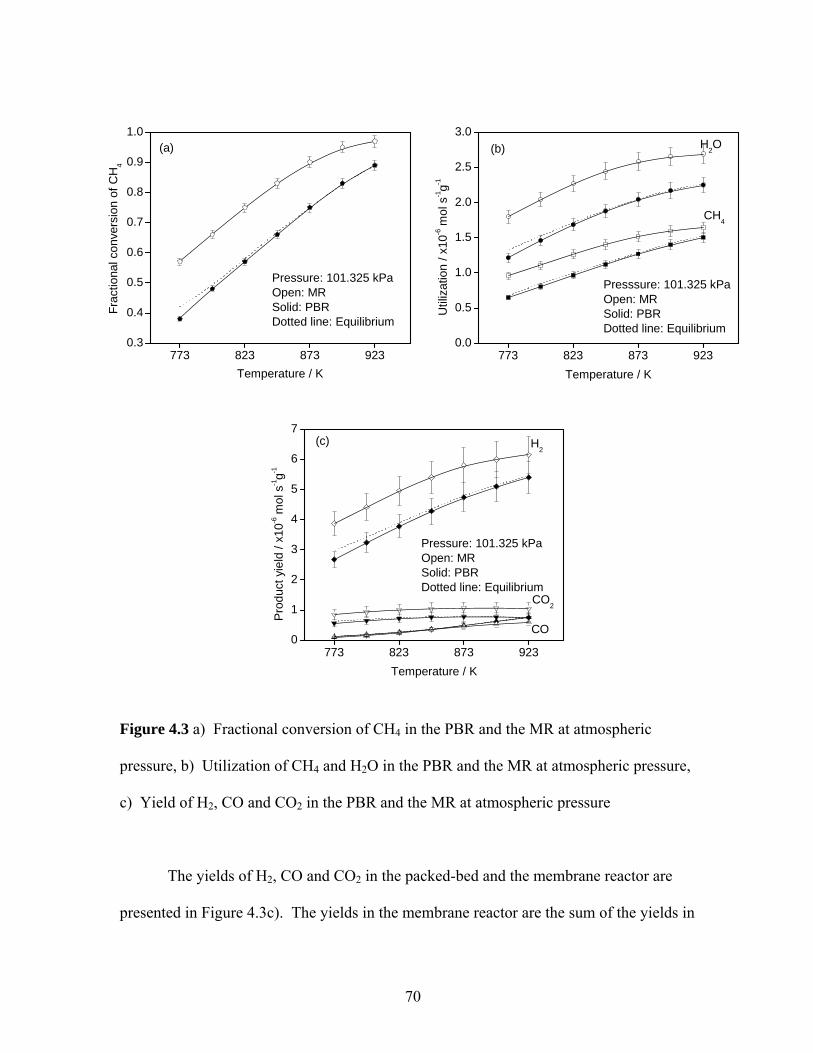
The effect of temperature on the conversion of methane at 1 atm in the membrane
reactor and the packed-bed reactor is shown in Figure 4.3a). The conversion values of the
PBR closely matched the values obtained from equilibrium calculations (dotted lines) at all
temperatures. The following equilibrium equations can be written for the steam reforming
and water-gas shift reactions, where P is the pressure and the y’s are mole fractions.
2
4 2
32
1CO H
CH H O
y yK P
y y= (4.7)
0.0 0.5 1.0 1.5 2.00.00
0.05
0.10
0.15
0.20
0.25
0.30
0.35
Flux
/ m
ol m
-2 s
-1
Pressure / MPa
H2 at 923 K H2 at 873 K
69
2 2
2
2CO H
CO H O
y yK
y y= (4.8)
The equilibrium methane conversions were calculated by solving these equations
simultaneously with values for K1 and K2 obtained at different temperatures from Chemeq
which is a basic language program for the calculation of the standard state heat and free
energy of reactions and the chemical equilibrium constants [2]. For the membrane reactor
the effect of hydrogen removal is clearly observable as the methane conversions increase to
higher values at all temperatures. In the PBR the fractional methane conversions were 0.44
and 0.90 at 773 and 923 K respectively while they reached values of 0.56 and 0.97 at the
same temperatures in the MR.
The utilizations of CH4 and H2O in the PBR and the MR in the same temperature
range are shown in Figure 4.3b). The equilibrium utilizations were also calculated from the
equilibrium conversions and the inlet flow rates of the reactants and were normalized by
the catalyst weight. A nonlinear trend was observed for the utilizations of CH4 and H2O
both in the PBR and MR, and a slightly higher level-off point was observed in the MR at
higher temperatures.
70
Figure 4.3 a) Fractional conversion of CH4 in the PBR and the MR at atmospheric
pressure, b) Utilization of CH4 and H2O in the PBR and the MR at atmospheric pressure,
c) Yield of H2, CO and CO2 in the PBR and the MR at atmospheric pressure
The yields of H2, CO and CO2 in the packed-bed and the membrane reactor are
presented in Figure 4.3c). The yields in the membrane reactor are the sum of the yields in
773 823 873 9230.3
0.4
0.5
0.6
0.7
0.8
0.9
1.0(a)
Fr
actio
nal c
onve
rsio
n of
CH
4
Temperature / K
Pressure: 101.325 kPaOpen: MRSolid: PBRDotted line: Equilibrium
773 823 873 9230.0
0.5
1.0
1.5
2.0
2.5
3.0(b)
Presssure: 101.325 kPaOpen: MRSolid: PBRDotted line: Equilibrium
H2O
CH4
Util
izat
ion
/ x10
-6 m
ol s
-1g-1
Temperature / K
773 823 873 9230
1
2
3
4
5
6
7(c)
CO
Pressure: 101.325 kPaOpen: MRSolid: PBRDotted line: Equilibrium
H2
CO2
Pro
duct
yie
ld /
x10-6
mol
s-1g-1
Temperature / K
71
the permeate and the retentate sides. In the packed bed reactor, the H2 and CO yields
increased while the CO2 yields reached a plateau with increasing temperature. A similar
trend was observed in the MR with higher product yields except for that of CO at all
temperatures. The CO yields were comparable both in the PBR and the MR at lower
temperatures but the production of CO was favored by the PBR at and above 873 K.
4.3.2. Effect of pressure on the performances of the MR and the PBR
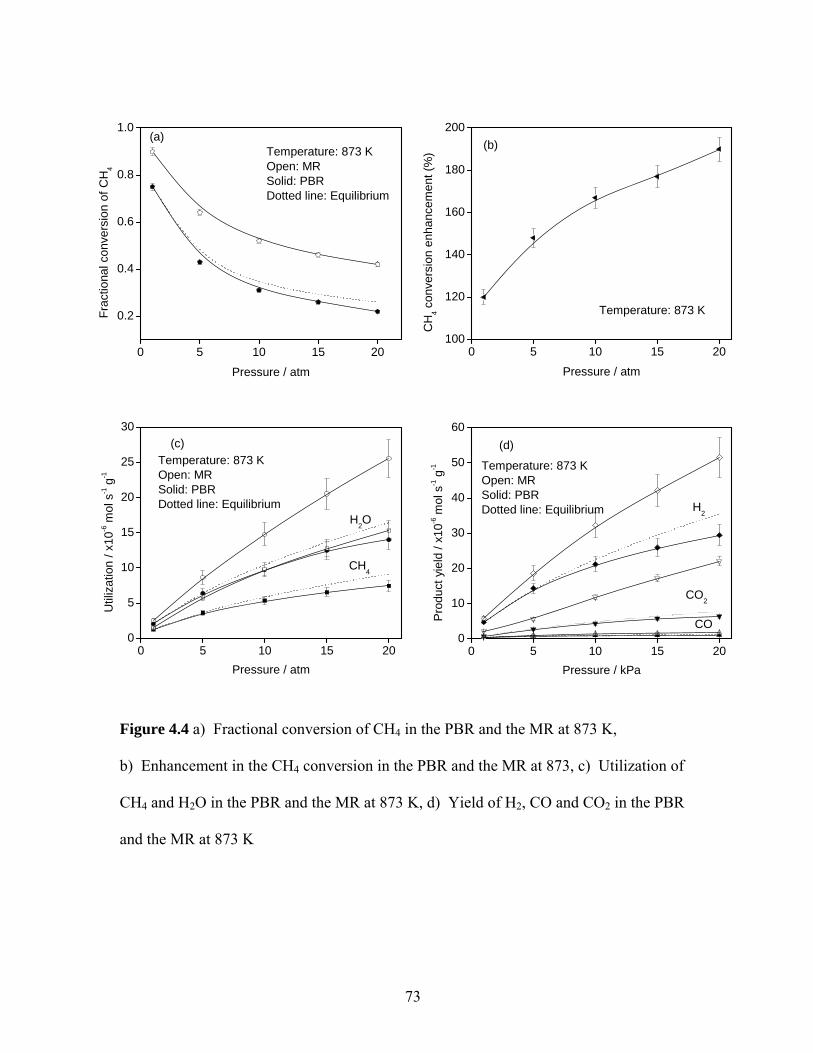
The effect of pressure on the steam reforming of methane at 873 K is presented in
Figure 4. The equilibrium methane conversions and the experimental conversions in the
PBR and the MR had a similar decreasing trend with increasing pressure as seen in Figure
4.4 a). As mentioned in the previous section, the steam reforming reaction is not favored
thermodynamically at high pressure due to the net increase of moles on the product side.
The methane conversions in the PBR were slightly lower than the equilibrium values
notably at higher pressures. In the MR the enhancing effect of separation through the
membrane on the methane conversion was clearly observed with much higher conversion
values attained at all pressures. However, the permeance of hydrogen was not high enough
to overcome the effect of thermodynamics due to the increase in moles in the reaction, and
the methane conversion decreased with increasing pressure. The enhancement in the
methane conversion is defined as 4 4( ) / ( ) 100CH CHX MR X PBR × and is presented in Figure
4.4 b). The CH4 conversion enhancement increased with increasing pressure and at 20 atm
reached a value of 190 % the value obtained in the PBR.
72
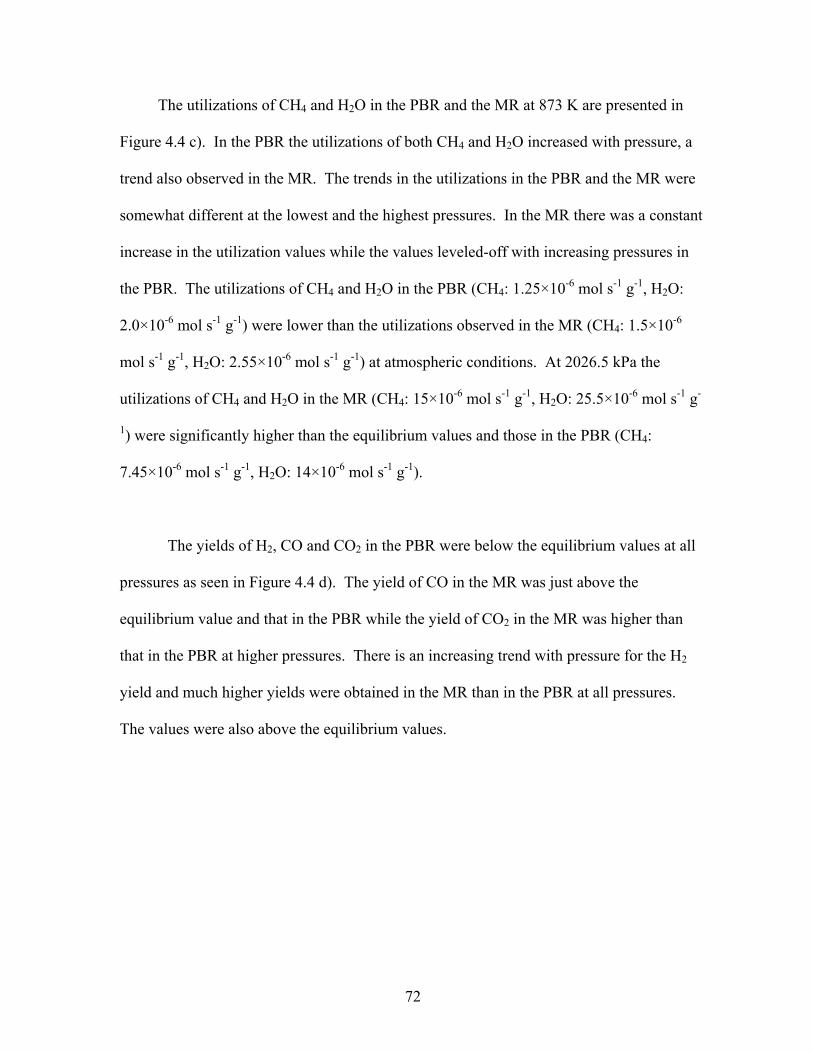
The utilizations of CH4 and H2O in the PBR and the MR at 873 K are presented in
Figure 4.4 c). In the PBR the utilizations of both CH4 and H2O increased with pressure, a
trend also observed in the MR. The trends in the utilizations in the PBR and the MR were
somewhat different at the lowest and the highest pressures. In the MR there was a constant
increase in the utilization values while the values leveled-off with increasing pressures in
the PBR. The utilizations of CH4 and H2O in the PBR (CH4: 1.25×10⁻⁶ mol s-1 g-1, H2O:
2.0×10⁻⁶ mol s-1 g-1) were lower than the utilizations observed in the MR (CH4: 1.5×10⁻⁶
mol s-1 g-1, H2O: 2.55×10⁻⁶ mol s-1 g-1) at atmospheric conditions. At 2026.5 kPa the
utilizations of CH4 and H2O in the MR (CH4: 15×10-6 mol s-1 g-1, H2O: 25.5×10⁻⁶ mol s-1 g-
1) were significantly higher than the equilibrium values and those in the PBR (CH4:
7.45×10⁻⁶ mol s-1 g-1, H2O: 14×10-6 mol s-1 g-1).
The yields of H2, CO and CO2 in the PBR were below the equilibrium values at all
pressures as seen in Figure 4.4 d). The yield of CO in the MR was just above the
equilibrium value and that in the PBR while the yield of CO2 in the MR was higher than
that in the PBR at higher pressures. There is an increasing trend with pressure for the H2
yield and much higher yields were obtained in the MR than in the PBR at all pressures.
The values were also above the equilibrium values.
73
Figure 4.4 a) Fractional conversion of CH4 in the PBR and the MR at 873 K,
b) Enhancement in the CH4 conversion in the PBR and the MR at 873, c) Utilization of
CH4 and H2O in the PBR and the MR at 873 K, d) Yield of H2, CO and CO2 in the PBR
and the MR at 873 K
0 5 10 15 20
0.2
0.4
0.6
0.8
1.0(a)
Frac
tiona
l con
vers
ion
of C
H4
Pressure / atm
Temperature: 873 KOpen: MRSolid: PBRDotted line: Equilibrium
0 5 10 15 20100
120
140
160
180
200(b)
CH
4 con
vers
ion
enha
ncem
ent (
%)
Pressure / atm
Temperature: 873 K
0 5 10 15 200
5
10
15
20
25
30(c)
Temperature: 873 KOpen: MRSolid: PBRDotted line: Equilibrium
H2O
CH4
Util
izat
ion
/ x10
-6 m
ol s
-1 g
-1
Pressure / atm0 5 10 15 20
0
10
20
30
40
50
60(d)
CO
Temperature: 873 KOpen: MRSolid: PBRDotted line: Equilibrium
H2
CO2
Pro
duct
yie
ld /
x10-6
mol
s-1 g
-1
Pressure / kPa
74
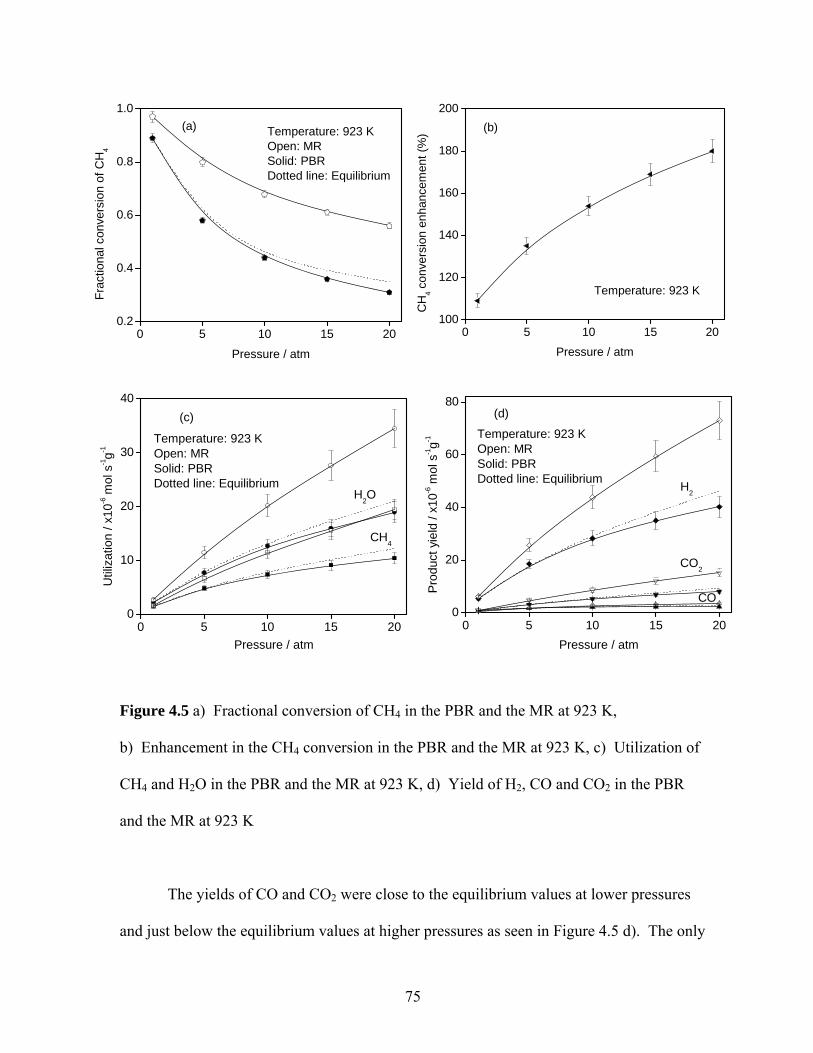
The conversion of methane both in the PBR and the MR increased considerably
with increase in the temperature from 873 K to 923 K (Figure 4.5 a). Equilibrium
conditions for the steam reforming reaction were still maintained at 923 K in the PBR. At
higher pressures (15 and 20 atm), there is a little deviation from equilibrium at 873 K and
923 K. Similarly, the conversion of methane in the MR was higher than the conversion in
the PBR at atmospheric conditions. At 2026.5 kPa much higher enhancement in the
methane conversion was observed than at atmospheric conditions and this enhancement
was significant at 923 K as clearly seen in Figure 4.5 b). The CH4 conversion enhancement
again showed an increasing trend with increasing pressure and reached a value of 180 % at
923 K
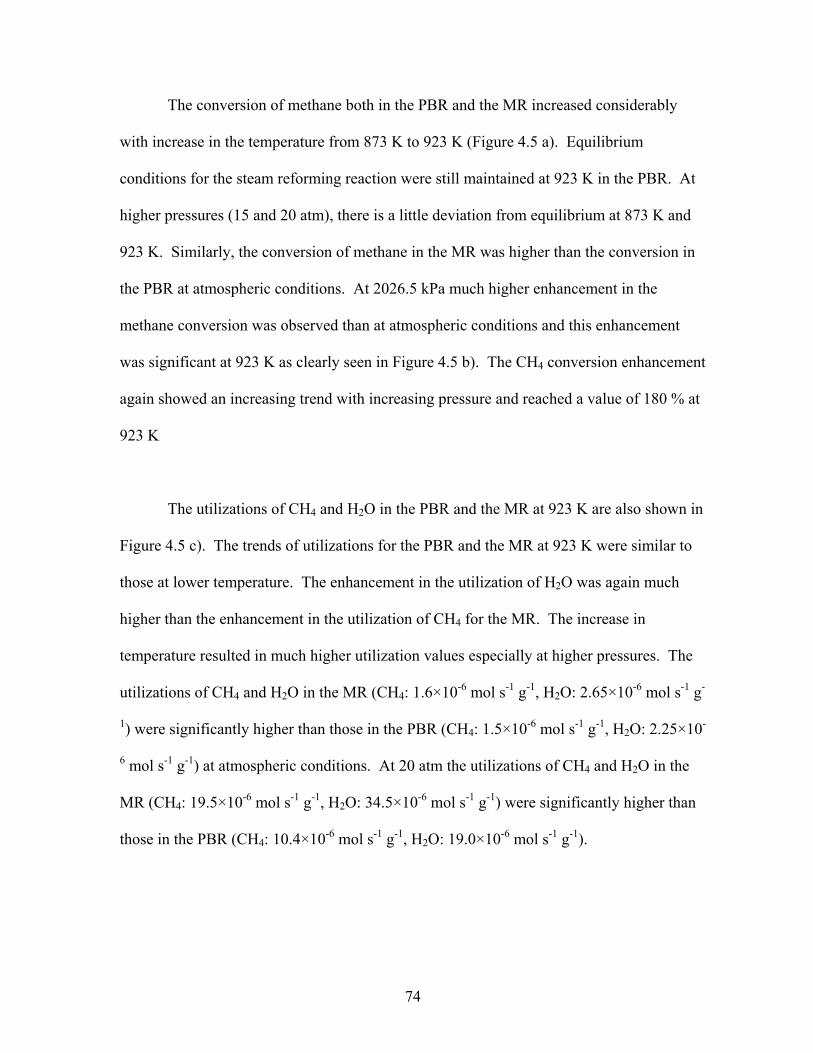
The utilizations of CH4 and H2O in the PBR and the MR at 923 K are also shown in
Figure 4.5 c). The trends of utilizations for the PBR and the MR at 923 K were similar to
those at lower temperature. The enhancement in the utilization of H2O was again much
higher than the enhancement in the utilization of CH4 for the MR. The increase in
temperature resulted in much higher utilization values especially at higher pressures. The
utilizations of CH4 and H2O in the MR (CH4: 1.6×10⁻⁶ mol s-1 g-1, H2O: 2.65×10⁻⁶ mol s-1 g-
1) were significantly higher than those in the PBR (CH4: 1.5×10⁻⁶ mol s-1 g-1, H2O: 2.25×10-
6 mol s-1 g-1) at atmospheric conditions. At 20 atm the utilizations of CH4 and H2O in the
MR (CH4: 19.5×10⁻⁶ mol s-1 g-1, H2O: 34.5×10⁻⁶ mol s-1 g-1) were significantly higher than
those in the PBR (CH4: 10.4×10⁻⁶ mol s-1 g-1, H2O: 19.0×10⁻⁶ mol s-1 g-1).
75
Figure 4.5 a) Fractional conversion of CH4 in the PBR and the MR at 923 K,
b) Enhancement in the CH4 conversion in the PBR and the MR at 923 K, c) Utilization of
CH4 and H2O in the PBR and the MR at 923 K, d) Yield of H2, CO and CO2 in the PBR
and the MR at 923 K
The yields of CO and CO2 were close to the equilibrium values at lower pressures
and just below the equilibrium values at higher pressures as seen in Figure 4.5 d). The only
0 5 10 15 200.2
0.4
0.6
0.8
1.0(a)
Fr
actio
nal c
onve
rsio
n of
CH
4
Pressure / atm
Temperature: 923 KOpen: MRSolid: PBRDotted line: Equilibrium
0 5 10 15 20100
120
140
160
180
200(b)
CH
4 con
vers
ion
enha
ncem
ent (
%)
Pressure / atm
Temperature: 923 K
0 5 10 15 200
10
20
30
40(c)
Temperature: 923 KOpen: MRSolid: PBRDotted line: Equilibrium
H2O
CH4
Util
izat
ion
/ x10
-6 m
ol s
-1g-1
Pressure / atm0 5 10 15 20
0
20
40
60
80(d)
CO
Temperature: 923 KOpen: MRSolid: PBRDotted line: Equilibrium
H2
CO2
Pro
duct
yie
ld /
x10-6
mol
s-1g-1
Pressure / atm
76
exception was the H2 yield which was much lower than the equilibrium values in the PBR
above atmospheric pressure. There was an increasing trend with pressure for the H2 yield
and much higher yields were obtained in the MR than in the PBR at all pressures. At
2026.5 kPa the yields of H2, CO and CO2 in the MR (H2: 73.0×10⁻⁶ mol s-1 g-1, CO:
3.65×10⁻⁶ mol s-1 g-1, CO2: 15.2×10⁻⁶ mol s-1 g-1) were also higher than those in the PBR
(H2: 40.2×10⁻⁶ mol s-1 g-1, CO: 2.3×10⁻⁶ mol s-1 g-1, CO2: 8.1×10⁻⁶ mol s-1 g-1) at a higher
temperature.
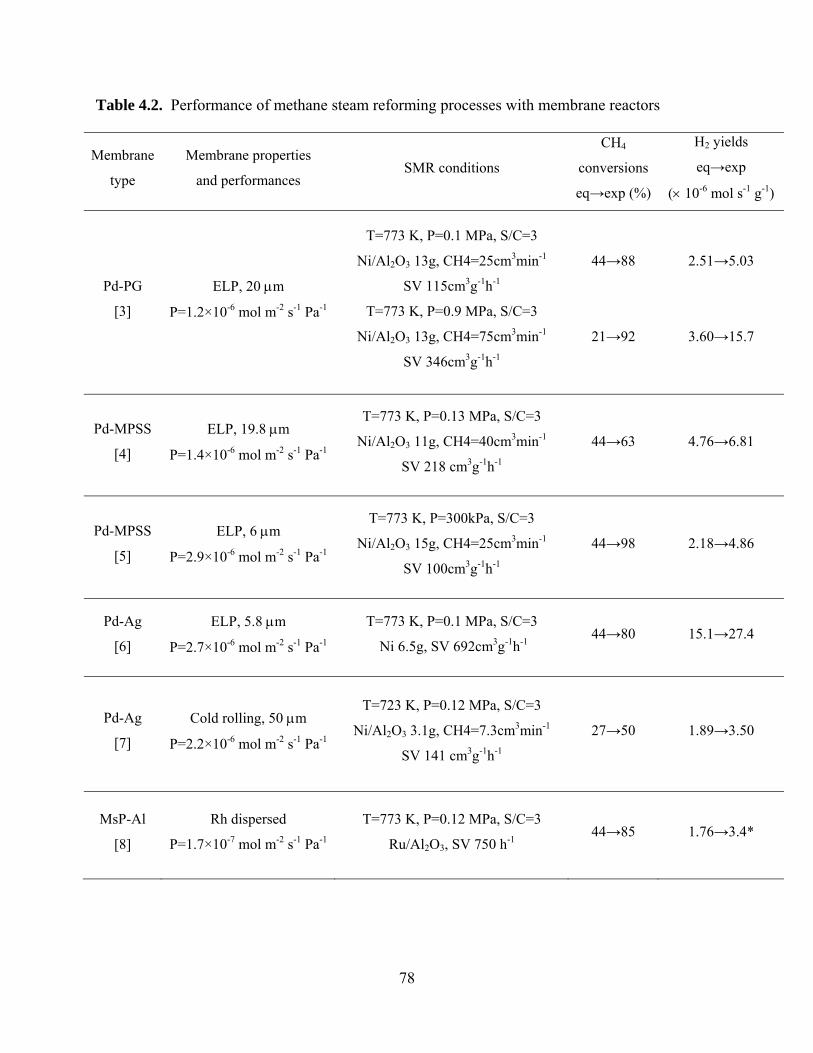
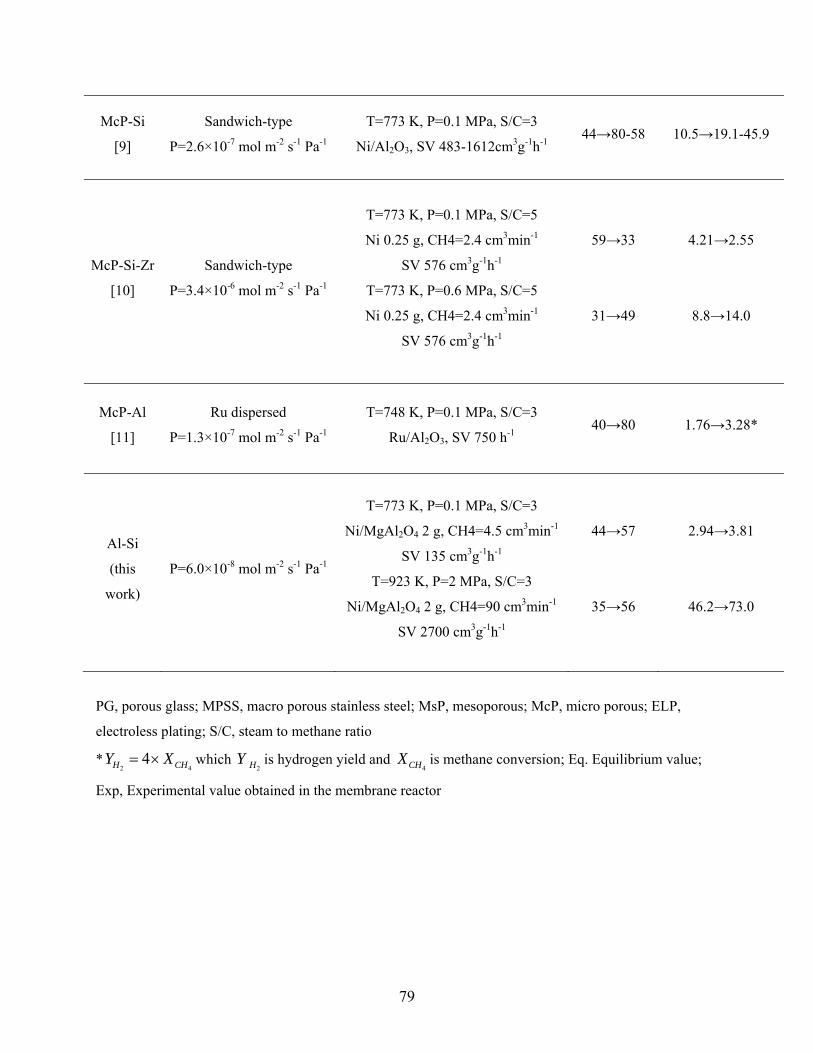
A comparison with some experimental results published in the literature was made
and the performances of various membranes and the operating conditions of the
corresponding membrane reactor applications are summarized in Table 4.2. In Table 4.2,
the first five rows describe results obtained with palladium membranes and the last five
rows describe results obtained with various types of silica and alumina membranes. When
the performances of the membranes are compared, the palladium membranes are seen to
have significantly higher permeances than the silica and alumina membranes. The units of
the permeance of palladium membranes (cm3 cm-2 min-1 atm-0.5) are converted into SI units
of the permeance (mol m-2 s-1 Pa-1) using the inlet and outlet pressures for easy comparison.
The catalysts were dispersed in the alumina membranes whereas they were sandwiched
between the alumina support and the layers of silica for the microporous membranes. The
conversion of methane fell in the range of 60 to 90% at various space velocities for all
membrane reactors and the equilibrium conversion of methane was equal to 44 % at 773 K
and 1 atm. Comparison of CH4 conversions and H2 yields obtained in the membrane
reactor are compared to equilibrium values in the last two columns. The use of membrane
77
reactors produced significant enhancements in these quantities in all cases. The membrane
prepared in this study had a permeance of 1.0×10⁻⁷ mol m-2 s-1 Pa-1 in its fresh state, and
this became 4.0×10⁻⁸ mol m-2 s-1 Pa-1 after exposure to steam and during use, a 60 % drop.
The conversion of methane reached a value of 57 % at a space velocity of 700 h-1 versus 44
% at equilibrium at 101.325 kPa and 56 % versus 85 % at 20 atm. From this comparison, it
is concluded that higher permeance membranes should be used to obtain better conversions
of methane and higher yields of hydrogen. The significance of the results with the silica-
based membrane of this study is demonstration of its applicability at higher temperatures
(873 K and 923 K) and at higher pressures (15 and 20 atm) which is important for practical
applications.
78
Table 4.2. Performance of methane steam reforming processes with membrane reactors
Membrane
type
Membrane properties
and performances SMR conditions
CH4
conversions
eq→exp (%)
H2 yields
eq→exp
(× 10-6 mol s-1 g-1)
Pd-PG
[3]
ELP, 20 μm
P=1.2×10⁻⁶ mol m-2 s-1 Pa-1
T=773 K, P=0.1 MPa, S/C=3
Ni/Al2O3 13g, CH4=25cm3min-1
SV 115cm3g-1h-1
T=773 K, P=0.9 MPa, S/C=3
Ni/Al2O3 13g, CH4=75cm3min-1
SV 346cm3g-1h-1
44→88
21→92
2.51→5.03
3.60→15.7
Pd-MPSS
[4]
ELP, 19.8 μm
P=1.4×10⁻⁶ mol m-2 s-1 Pa-1
T=773 K, P=0.13 MPa, S/C=3
Ni/Al2O3 11g, CH4=40cm3min-1
SV 218 cm3g-1h-1
44→63 4.76→6.81
Pd-MPSS
[5]
ELP, 6 μm
P=2.9×10⁻⁶ mol m-2 s-1 Pa-1
T=773 K, P=300kPa, S/C=3
Ni/Al2O3 15g, CH4=25cm3min-1
SV 100cm3g-1h-1
44→98 2.18→4.86
Pd-Ag
[6]
ELP, 5.8 μm
P=2.7×10⁻⁶ mol m-2 s-1 Pa-1
T=773 K, P=0.1 MPa, S/C=3
Ni 6.5g, SV 692cm3g-1h-1 44→80 15.1→27.4
Pd-Ag
[7]
Cold rolling, 50 μm
P=2.2×10⁻⁶ mol m-2 s-1 Pa-1
T=723 K, P=0.12 MPa, S/C=3
Ni/Al2O3 3.1g, CH4=7.3cm3min-1
SV 141 cm3g-1h-1
27→50 1.89→3.50
MsP-Al
[8]
Rh dispersed
P=1.7×10⁻⁷ mol m-2 s-1 Pa-1
T=773 K, P=0.12 MPa, S/C=3
Ru/Al2O3, SV 750 h-1 44→85 1.76→3.4*
79
McP-Si
[9]
Sandwich-type
P=2.6×10⁻⁷ mol m-2 s-1 Pa-1
T=773 K, P=0.1 MPa, S/C=3
Ni/Al2O3, SV 483-1612cm3g-1h-1 44→80-58 10.5→19.1-45.9
McP-Si-Zr
[10]
Sandwich-type
P=3.4×10⁻⁶ mol m-2 s-1 Pa-1
T=773 K, P=0.1 MPa, S/C=5
Ni 0.25 g, CH4=2.4 cm3min-1
SV 576 cm3g-1h-1
T=773 K, P=0.6 MPa, S/C=5
Ni 0.25 g, CH4=2.4 cm3min-1
SV 576 cm3g-1h-1
59→33
31→49
4.21→2.55
8.8→14.0
McP-Al
[11]
Ru dispersed
P=1.3×10⁻⁷ mol m-2 s-1 Pa-1
T=748 K, P=0.1 MPa, S/C=3
Ru/Al2O3, SV 750 h-1 40→80 1.76→3.28*
Al-Si
(this
work)
P=6.0×10⁻⁸ mol m-2 s-1 Pa-1
T=773 K, P=0.1 MPa, S/C=3
Ni/MgAl2O4 2 g, CH4=4.5 cm3min-1
SV 135 cm3g-1h-1
T=923 K, P=2 MPa, S/C=3
Ni/MgAl2O4 2 g, CH4=90 cm3min-1
SV 2700 cm3g-1h-1
44→57
35→56
2.94→3.81
46.2→73.0
PG, porous glass; MPSS, macro porous stainless steel; MsP, mesoporous; McP, micro porous; ELP,
electroless plating; S/C, steam to methane ratio
*2 4
4H CHY X= × which 2HY is hydrogen yield and
4CHX is methane conversion; Eq. Equilibrium value;
Exp, Experimental value obtained in the membrane reactor
80
4.4. Conclusions
The steam reforming of methane was studied experimentally in a packed-bed reactor
(PBR) and a membrane reactor (MR) at various temperatures (773-923 K) and pressures (1-20
atm). The silica-based membrane used in the MR was moderately hydrogen permeable and
hydrothermally stable. A similar geometry was used in both the PBR and MR except that the
PBR employed a non-permeable quartz tube instead of the membrane tube. A commercial
Ni/MgAl2O4 catalyst was used in both of the reaction systems. The conversions of methane
obtained from the PBR at various temperatures showed that the steam reforming of methane
operated at equilibrium. In the MR higher conversions were obtained due to the removal of
hydrogen from the system, which shifted the equilibrium in the forward direction.
The effect of pressure on the steam reforming of methane was also investigated in the
PBR and the MR. The steam reforming of methane is not favored at higher pressures because of
the increase in moles in the reaction. However, permeance increased at higher pressures because
of the increase in driving force. Significant enhancements were obtained with the MR over the
PBR at higher pressures.
This study also compares the results of the membrane reactor studies found in the
literature at 773 K. This temperature was chosen for comparison because data for palladium
membrane is restricted to this maximum temperature. The conversion of methane and the
hydrogen yield obtained in this study are in the range obtained in the literature. Much higher H2

81
yields at higher pressures indicate that the amount of hydrogen removal has a significant effect
on the performance of the steam reforming reaction.
82
References [1] D.Lee, Studies on hydrogen selective silica membranes and the catalytic reforming of CH4
with CO2 in a membrane reactor, VPI&SU University Libraries, 2003
[2] S. I. Sandler, Chemical and Engineering Thermodynamics. 3rd ed. John Wiley and Sons,
1999, A9.1
[3] S. Uemiya, N. Sato, H. Ando, T. Matsuda, E. Kikuchi, Appl Catal, 67 (1991) 223
[4] J. Shu, B. P. A. Grandjean, S. Kaliaguine, Appl. Catal. A, 119 (1994) 305
[5] Tong, Y. Matsumura, H. Suda, K. Haraya, Ind. Eng. Chem. Res. 44 (2005) 1454
[6] E. Kikuchi, S. Uemiya, T. Matsuda, Stud. Surf. Sci. Catal. 61 (1991) 509
[7] F. Gallucci, L. Paturzo, A. Fama, A. Basile, Ind. Eng. Chem. Res. 43 (2004) 928
[8] M. Chai, M. Machida, K. Eguchi, H. Arai, Appl. Catal. A. 110 (1994) 239
[9] T. Tsuru, K. Yamaguchi, T. Yoshioka, M. Asaeda. AIChE J. 50 (2004) 2794
[10] T. Tsuru, T. Tsuge, S. Kubota, K. Yoshida, T. Yoshioka, M. Asaeda, Sep. Sci. Technol., 36
(2001) 3721
[11] K. Eguchi, M. R. Chai, M. Machida, H. M. Arai. Sci. Tech. in Catal., 37 (1994) 251