Chandra X-ray Observatory Newsletter 2008
52
Chandra News Winter 2008 Published by the Chandra X-ray Center (CXC) Issue number 15 HETG Observations of Hot Stars: From Predicted to Bizarre Norbert S. Schulz, Paola Testa, David P. Huenemoerder, Claude R. Canizares FIGURE 1: Cumulative images of 8 HETG exposures of the central region of the Orion Trapezium Cluster with aligned zero orders centered on θ 1 Ori C for a total exposure of approximately 300 ks and with a logarithmic intensity scale. The radial features are the dispersed HETG spectra, color coded according to first order CCD energy. Most streaks are from the X-ray brightest stars θ 1 Ori A, C, and E (article p.3).
-
Upload
john-g-wolbach-library -
Category
Documents
-
view
41 -
download
0
description
Chandra X-ray Observatory Newsletter, issue 15, 2008
Transcript of Chandra X-ray Observatory Newsletter 2008
5/10/2018 Chandra X-ray Observatory Newsletter 2008 - slidepdf.com
http://slidepdf.com/reader/full/chandra-x-ray-observatory-newsletter-2008 1/52
Chandra NewsWinter 2008
Published by the Chandra X-ray Center (CXC) Issue number 15
HETG Observations of Hot Stars: From Predicted to Bizarre
Norbert S. Schulz, Paola Testa, David P. Huenemoerder, Claude R. Canizares
FIGURE 1: Cumulative images of 8 HETG exposures of the central region of the Orion Trapezium Cluster with aligned
zero orders centered on θ1 Ori C for a total exposure of approximately 300 ks and with a logarithmic intensity scale. The
radial features are the dispersed HETG spectra, color coded according to first order CCD energy. Most streaks are from the
X-ray brightest stars θ1 Ori A, C, and E (article p.3).
5/10/2018 Chandra X-ray Observatory Newsletter 2008 - slidepdf.com
http://slidepdf.com/reader/full/chandra-x-ray-observatory-newsletter-2008 2/52
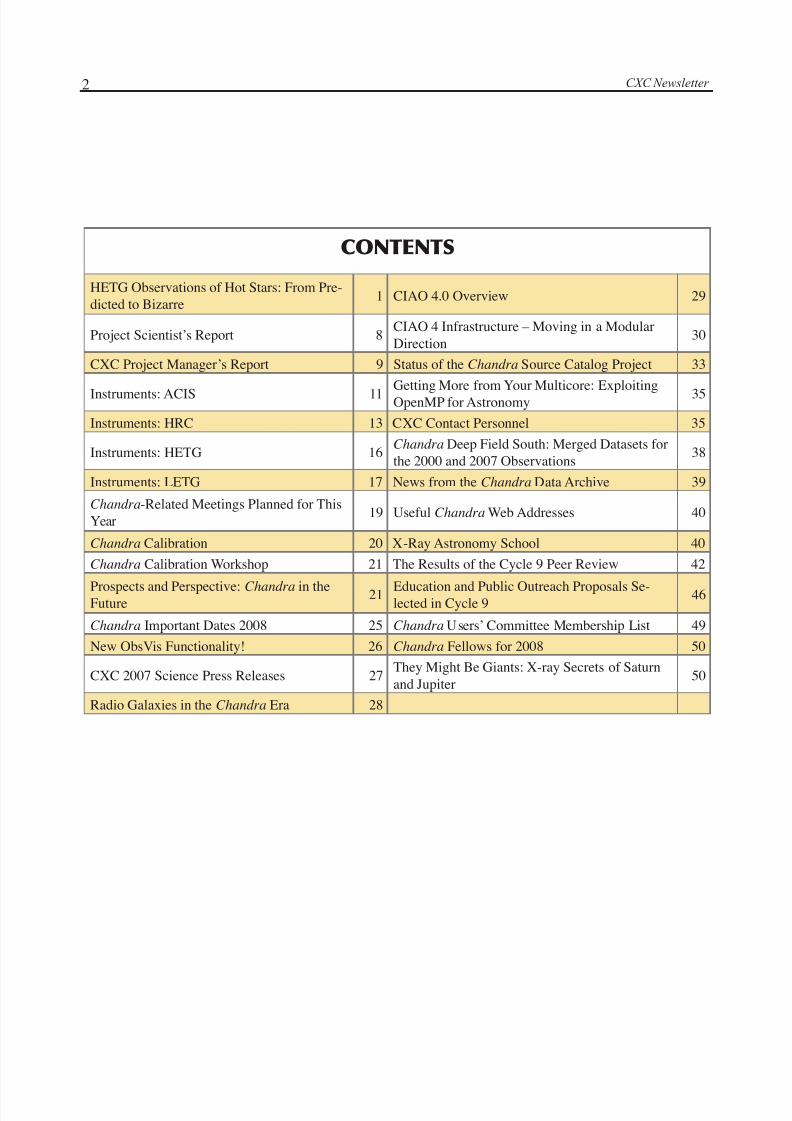
2 CXC Newsletter
CONTENTS
HETG Observations of Hot Stars: From Pre-dicted to Bizarre
1 CIAO 4.0 Overview 29
Project Scientist’s Report 8CIAO 4 Infrastructure – Moving in a ModularDirection
30
CXC Project Manager’s Report 9 Status of the Chandra Source Catalog Project 33
Instruments: ACIS 11 Getting More from Your Multicore: ExploitingOpenMP for Astronomy 35
Instruments: HRC 13 CXC Contact Personnel 35
Instruments: HETG 16Chandra Deep Field South: Merged Datasets forthe 2000 and 2007 Observations
38
Instruments: LETG 17 News from the Chandra Data Archive 39
Chandra-Related Meetings Planned for ThisYear
19 Useful Chandra Web Addresses 40
Chandra Calibration 20 X-Ray Astronomy School 40
Chandra Calibration Workshop 21 The Results of the Cycle 9 Peer Review 42
Prospects and Perspective: Chandra in theFuture 21 Education and Public Outreach Proposals Se-lected in Cycle 9 46
Chandra Important Dates 2008 25 Chandra Users’ Committee Membership List 49
New ObsVis Functionality! 26 Chandra Fellows for 2008 50
CXC 2007 Science Press Releases 27They Might Be Giants: X-ray Secrets of Saturnand Jupiter
50
Radio Galaxies in the Chandra Era 28
5/10/2018 Chandra X-ray Observatory Newsletter 2008 - slidepdf.com
http://slidepdf.com/reader/full/chandra-x-ray-observatory-newsletter-2008 3/52
3Winter, 2007
T he impact of broadband high resolution
X-ray spectroscopy on stellar astronomysince the launch of Chandra and XMM-Newton hasbeen outstanding. Specifically our understandingof the X-ray production in hot stars has made sig-nificant advances. Moreover, many of the observedX-ray spectral properties did not match predictionsfrom standard models and previously analyzed lowresolution spectra. Even today interpretations areincomplete at best and highly debated. In this re-spect young massive stars seem to behave particu-larly oddly and long HETG exposures of young em-bedded clusters cores (Figure 1) have now become
available. This article summarizes advances madefrom Chandra HETG spectra. A comprehensive at-las of HETG spectra of hot stars in the Chandra dataarchive can be found under http://cxc.harvard.edu/
XATLAS and by Westbrook et al. (2007).
X-Ray Emission from Radiation Driven Winds
The Chandra archive currently contains manyHETG observations of OB stars, which have beenre-analyzed and discussed with respect to their na-
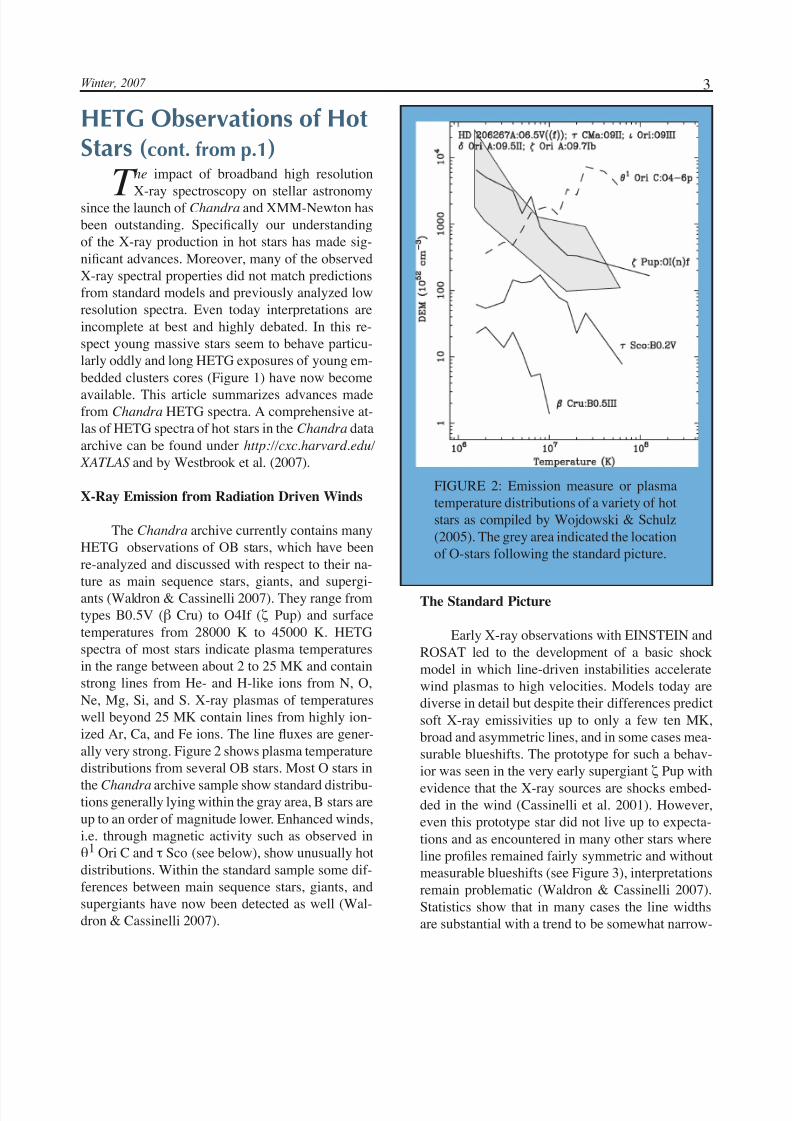
ture as main sequence stars, giants, and supergi-ants (Waldron & Cassinelli 2007). They range fromtypes B0.5V (β Cru) to O4If (ζ Pup) and surfacetemperatures from 28000 K to 45000 K. HETGspectra of most stars indicate plasma temperaturesin the range between about 2 to 25 MK and containstrong lines from He- and H-like ions from N, O,Ne, Mg, Si, and S. X-ray plasmas of temperatureswell beyond 25 MK contain lines from highly ion-ized Ar, Ca, and Fe ions. The line fluxes are gener-ally very strong. Figure 2 shows plasma temperaturedistributions from several OB stars. Most O stars in
the Chandra archive sample show standard distribu-tions generally lying within the gray area, B stars areup to an order of magnitude lower. Enhanced winds,i.e. through magnetic activity such as observed inθ1 Ori C and τ Sco (see below), show unusually hotdistributions. Within the standard sample some dif-ferences between main sequence stars, giants, andsupergiants have now been detected as well (Wal-dron & Cassinelli 2007).
The Standard Picture
Early X-ray observations with EINSTEIN andROSAT led to the development of a basic shockmodel in which line-driven instabilities acceleratewind plasmas to high velocities. Models today arediverse in detail but despite their differences predictsoft X-ray emissivities up to only a few ten MK,broad and asymmetric lines, and in some cases mea-surable blueshifts. The prototype for such a behav-ior was seen in the very early supergiant ζ Pup with
evidence that the X-ray sources are shocks embed-ded in the wind (Cassinelli et al. 2001). However,even this prototype star did not live up to expecta-tions and as encountered in many other stars whereline profiles remained fairly symmetric and withoutmeasurable blueshifts (see Figure 3), interpretationsremain problematic (Waldron & Cassinelli 2007).Statistics show that in many cases the line widthsare substantial with a trend to be somewhat narrow-
FIGURE 2: Emission measure or plasmatemperature distributions of a variety of hotstars as compiled by Wojdowski & Schulz(2005). The grey area indicated the locationof O-stars following the standard picture.
HETG Observations of HotStars (cont. from p.1)
5/10/2018 Chandra X-ray Observatory Newsletter 2008 - slidepdf.com
http://slidepdf.com/reader/full/chandra-x-ray-observatory-newsletter-2008 4/52
4 CXC Newsletter
er in main sequence stars with respect to giants andsupergiants. While some line shifts are seen in thelatter, they remain undetected in most stars.
The Power of Line Ratios
The diagnostic of the metastable line com-ponents in He-like line triplets has been one of thepowerhouses in the analysis of cool star spectra. Theinterpretation of line ratios in hot stars is dramati-cally different as they are heavily affected by the ra-diation field of the high temperature stellar surface.
In this case the value of the forbidden (f) over in-tercombination (i) line ratio has shifted from an im-portant density diagnostic to a measure of distanceof the formation region from the hot stellar surface.
For UV excited lines longward of the Lyman limitsuch as O VII, Ne IX, and Mg XI the photoexcit-ing photons are unattenuated, for EUV excited linessuch as Si XIII and S XV the f/i ratios are predictedby model atmospheres. Details clearly remain prob-lematic, specifically with respect to the question of whether the X-ray formation range for a specific ionis local (Leutenegger et al. 2006) or more distrib-uted in the wind (see Waldron & Cassinelli 2007 fora more detailed discussion).
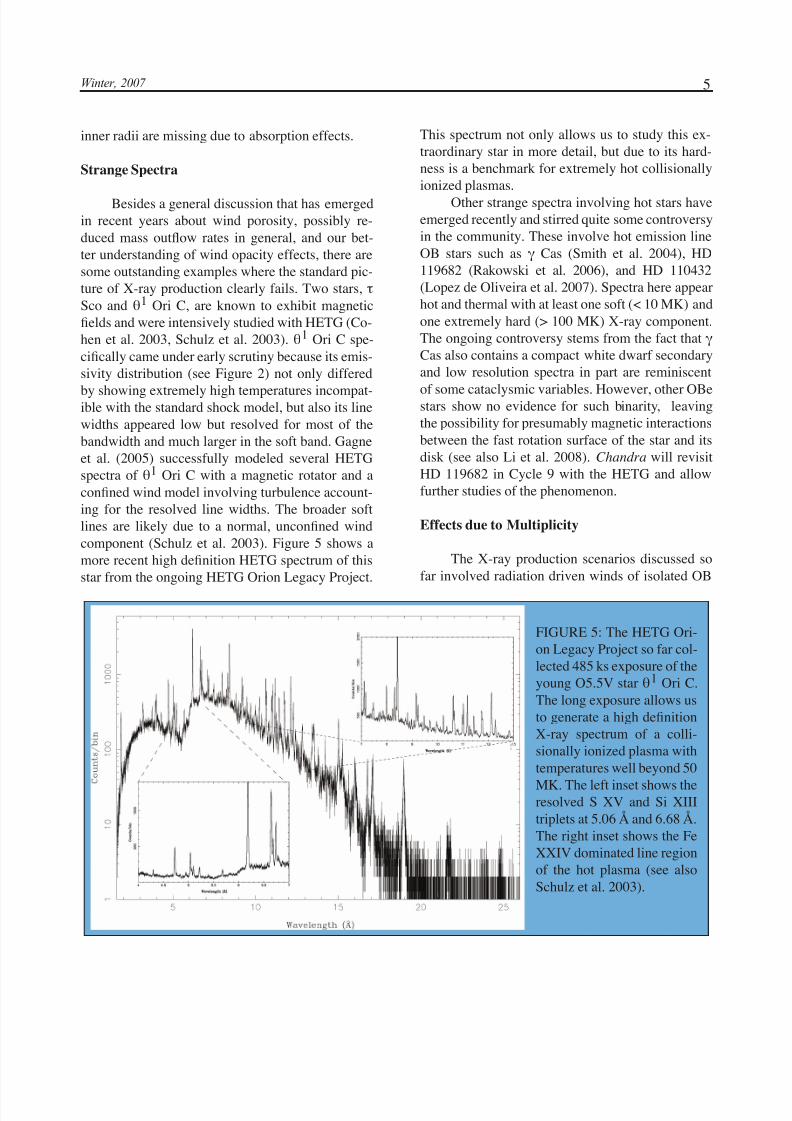
Figure 4 shows the dependence of the X-raytemperature determined from the H- to He-like reso-
nance line flux ratio to the inferred f/i line formationdistance from the stellar surface. It shows that thereis a well defined radial-dependent maximum X-raytemperature in all stellar types. For supergiants the
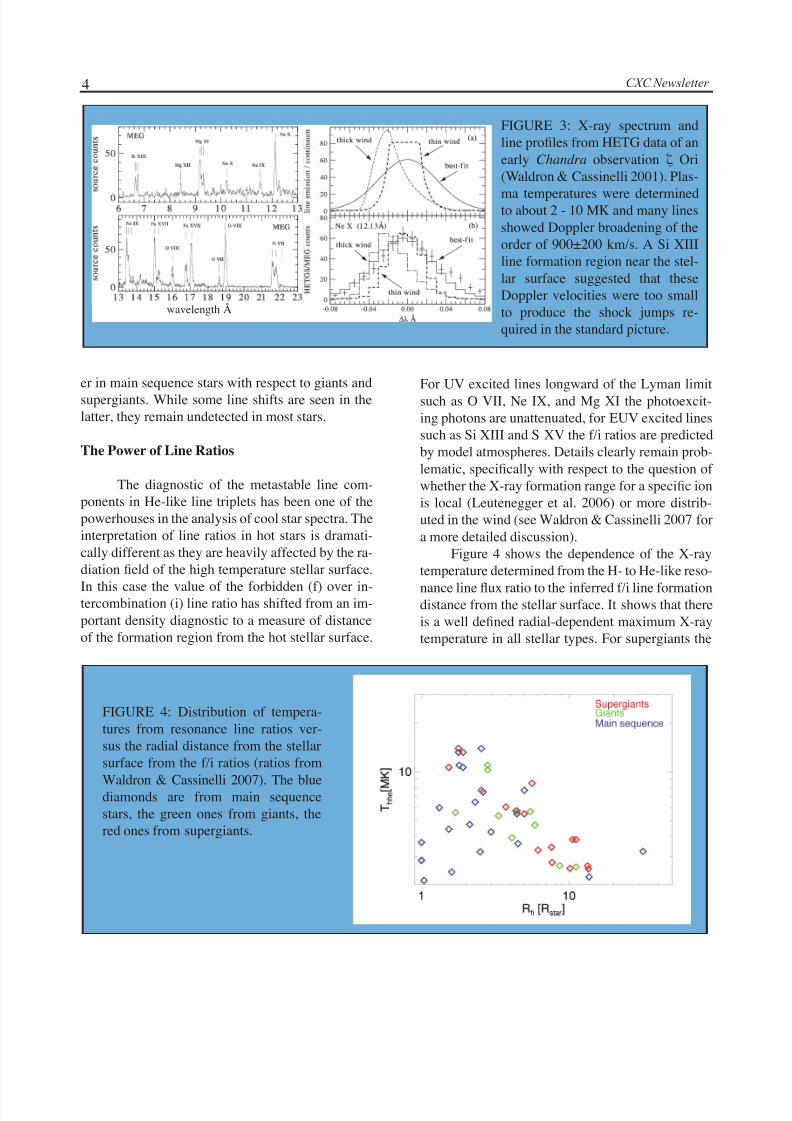
FIGURE 3: X-ray spectrum andline profiles from HETG data of anearly Chandra observation ζ Ori(Waldron & Cassinelli 2001). Plas-
ma temperatures were determinedto about 2 - 10 MK and many linesshowed Doppler broadening of theorder of 900±200 km/s. A Si XIIIline formation region near the stel-lar surface suggested that theseDoppler velocities were too smallto produce the shock jumps re-quired in the standard picture.
FIGURE 4: Distribution of tempera-tures from resonance line ratios ver-sus the radial distance from the stellarsurface from the f/i ratios (ratios from
Waldron & Cassinelli 2007). The bluediamonds are from main sequencestars, the green ones from giants, thered ones from supergiants.
wavelength Å
5/10/2018 Chandra X-ray Observatory Newsletter 2008 - slidepdf.com
http://slidepdf.com/reader/full/chandra-x-ray-observatory-newsletter-2008 5/52
5Winter, 2007
inner radii are missing due to absorption effects.
Strange Spectra
Besides a general discussion that has emergedin recent years about wind porosity, possibly re-duced mass outflow rates in general, and our bet-ter understanding of wind opacity effects, there aresome outstanding examples where the standard pic-ture of X-ray production clearly fails. Two stars, τSco and θ1 Ori C, are known to exhibit magneticfields and were intensively studied with HETG (Co-hen et al. 2003, Schulz et al. 2003). θ1 Ori C spe-cifically came under early scrutiny because its emis-sivity distribution (see Figure 2) not only differed
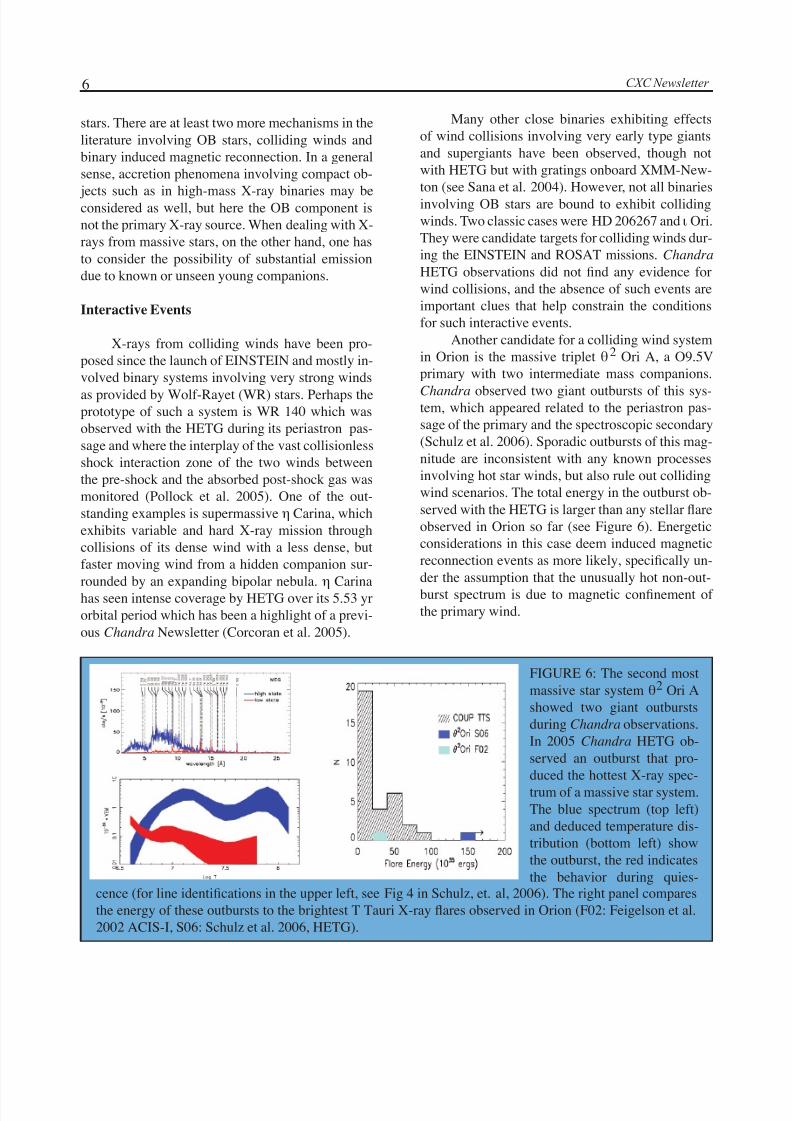
by showing extremely high temperatures incompat-ible with the standard shock model, but also its linewidths appeared low but resolved for most of thebandwidth and much larger in the soft band. Gagneet al. (2005) successfully modeled several HETGspectra of θ1 Ori C with a magnetic rotator and aconfined wind model involving turbulence account-ing for the resolved line widths. The broader softlines are likely due to a normal, unconfined windcomponent (Schulz et al. 2003). Figure 5 shows amore recent high definition HETG spectrum of thisstar from the ongoing HETG Orion Legacy Project.
This spectrum not only allows us to study this ex-traordinary star in more detail, but due to its hard-ness is a benchmark for extremely hot collisionallyionized plasmas.
Other strange spectra involving hot stars haveemerged recently and stirred quite some controversyin the community. These involve hot emission lineOB stars such as γ Cas (Smith et al. 2004), HD119682 (Rakowski et al. 2006), and HD 110432(Lopez de Oliveira et al. 2007). Spectra here appearhot and thermal with at least one soft (< 10 MK) andone extremely hard (> 100 MK) X-ray component.The ongoing controversy stems from the fact that γCas also contains a compact white dwarf secondaryand low resolution spectra in part are reminiscent
of some cataclysmic variables. However, other OBestars show no evidence for such binarity, leavingthe possibility for presumably magnetic interactionsbetween the fast rotation surface of the star and itsdisk (see also Li et al. 2008). Chandra will revisitHD 119682 in Cycle 9 with the HETG and allowfurther studies of the phenomenon.
Effects due to Multiplicity
The X-ray production scenarios discussed sofar involved radiation driven winds of isolated OB
FIGURE 5: The HETG Ori-on Legacy Project so far col-lected 485 ks exposure of theyoung O5.5V star θ1 Ori C.The long exposure allows usto generate a high definitionX-ray spectrum of a colli-sionally ionized plasma withtemperatures well beyond 50
MK. The left inset shows theresolved S XV and Si XIIItriplets at 5.06 Å and 6.68 Å.The right inset shows the FeXXIV dominated line regionof the hot plasma (see alsoSchulz et al. 2003).
5/10/2018 Chandra X-ray Observatory Newsletter 2008 - slidepdf.com
http://slidepdf.com/reader/full/chandra-x-ray-observatory-newsletter-2008 6/52
6 CXC Newsletter
stars. There are at least two more mechanisms in theliterature involving OB stars, colliding winds andbinary induced magnetic reconnection. In a generalsense, accretion phenomena involving compact ob-
jects such as in high-mass X-ray binaries may beconsidered as well, but here the OB component isnot the primary X-ray source. When dealing with X-rays from massive stars, on the other hand, one hasto consider the possibility of substantial emissiondue to known or unseen young companions.
Interactive Events
X-rays from colliding winds have been pro-posed since the launch of EINSTEIN and mostly in-volved binary systems involving very strong winds
as provided by Wolf-Rayet (WR) stars. Perhaps theprototype of such a system is WR 140 which wasobserved with the HETG during its periastron pas-sage and where the interplay of the vast collisionlessshock interaction zone of the two winds betweenthe pre-shock and the absorbed post-shock gas wasmonitored (Pollock et al. 2005). One of the out-standing examples is supermassive η Carina, whichexhibits variable and hard X-ray mission throughcollisions of its dense wind with a less dense, butfaster moving wind from a hidden companion sur-
rounded by an expanding bipolar nebula. η Carinahas seen intense coverage by HETG over its 5.53 yrorbital period which has been a highlight of a previ-ous Chandra Newsletter (Corcoran et al. 2005).
FIGURE 6: The second mostmassive star system θ2 Ori Ashowed two giant outburstsduring Chandra observations.In 2005 Chandra HETG ob-served an outburst that pro-duced the hottest X-ray spec-trum of a massive star system.The blue spectrum (top left)and deduced temperature dis-tribution (bottom left) showthe outburst, the red indicatesthe behavior during quies-
Many other close binaries exhibiting effectsof wind collisions involving very early type giantsand supergiants have been observed, though notwith HETG but with gratings onboard XMM-New-ton (see Sana et al. 2004). However, not all binariesinvolving OB stars are bound to exhibit collidingwinds. Two classic cases were HD 206267 and ι Ori.They were candidate targets for colliding winds dur-ing the EINSTEIN and ROSAT missions. Chandra HETG observations did not find any evidence forwind collisions, and the absence of such events areimportant clues that help constrain the conditionsfor such interactive events.
Another candidate for a colliding wind systemin Orion is the massive triplet θ2 Ori A, a O9.5Vprimary with two intermediate mass companions.
Chandra observed two giant outbursts of this sys-tem, which appeared related to the periastron pas-sage of the primary and the spectroscopic secondary(Schulz et al. 2006). Sporadic outbursts of this mag-nitude are inconsistent with any known processesinvolving hot star winds, but also rule out collidingwind scenarios. The total energy in the outburst ob-served with the HETG is larger than any stellar flareobserved in Orion so far (see Figure 6). Energeticconsiderations in this case deem induced magneticreconnection events as more likely, specifically un-der the assumption that the unusually hot non-out-burst spectrum is due to magnetic confinement of the primary wind.
cence (for line identifications in the upper left, see Fig 4 in Schulz, et. al, 2006). The right panel comparesthe energy of these outbursts to the brightest T Tauri X-ray flares observed in Orion (F02: Feigelson et al.2002 ACIS-I, S06: Schulz et al. 2006, HETG).
5/10/2018 Chandra X-ray Observatory Newsletter 2008 - slidepdf.com
http://slidepdf.com/reader/full/chandra-x-ray-observatory-newsletter-2008 7/52
7Winter, 2007
Massive Orion Trapezium Stars
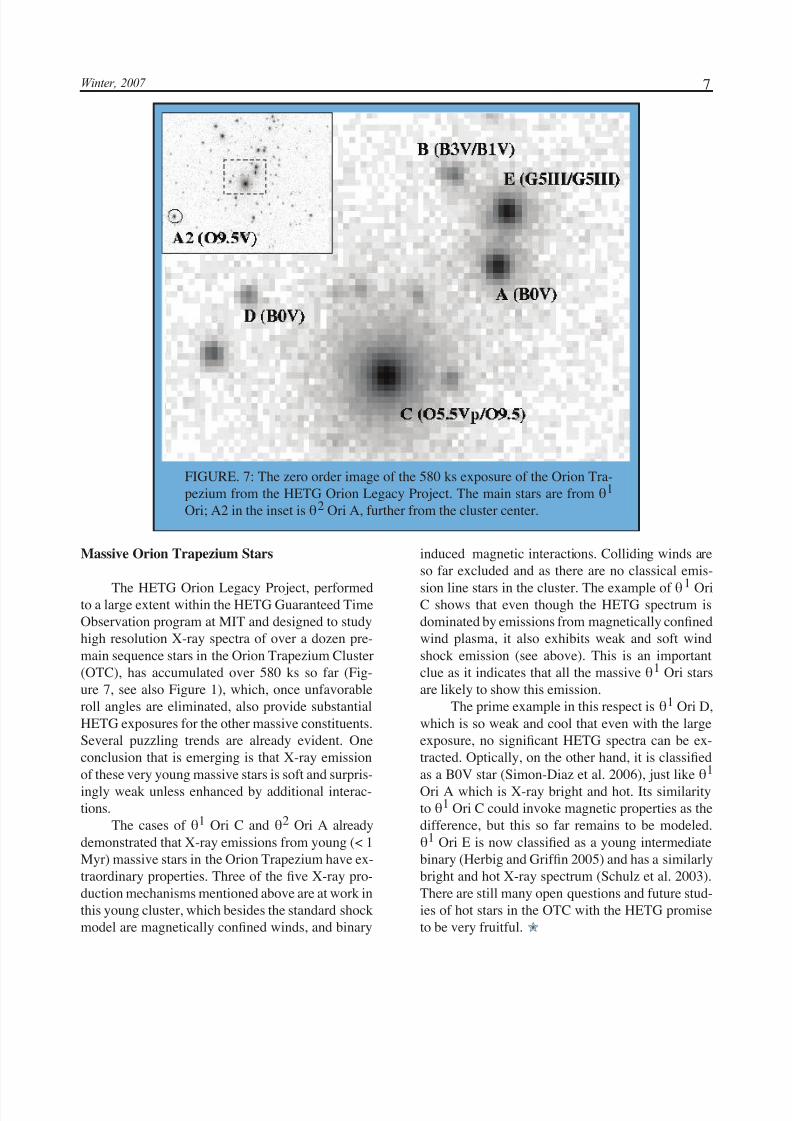
The HETG Orion Legacy Project, performedto a large extent within the HETG Guaranteed TimeObservation program at MIT and designed to studyhigh resolution X-ray spectra of over a dozen pre-main sequence stars in the Orion Trapezium Cluster(OTC), has accumulated over 580 ks so far (Fig-ure 7, see also Figure 1), which, once unfavorableroll angles are eliminated, also provide substantialHETG exposures for the other massive constituents.Several puzzling trends are already evident. Oneconclusion that is emerging is that X-ray emissionof these very young massive stars is soft and surpris-ingly weak unless enhanced by additional interac-tions.
The cases of θ1 Ori C and θ2 Ori A alreadydemonstrated that X-ray emissions from young (< 1Myr) massive stars in the Orion Trapezium have ex-traordinary properties. Three of the five X-ray pro-duction mechanisms mentioned above are at work inthis young cluster, which besides the standard shockmodel are magnetically confined winds, and binary
induced magnetic interactions. Colliding winds areso far excluded and as there are no classical emis-
sion line stars in the cluster. The example of θ1 OriC shows that even though the HETG spectrum isdominated by emissions from magnetically confinedwind plasma, it also exhibits weak and soft windshock emission (see above). This is an importantclue as it indicates that all the massive θ1 Ori starsare likely to show this emission.
The prime example in this respect is θ1 Ori D,which is so weak and cool that even with the largeexposure, no significant HETG spectra can be ex-tracted. Optically, on the other hand, it is classifiedas a B0V star (Simon-Diaz et al. 2006), just like θ1 Ori A which is X-ray bright and hot. Its similarityto θ1 Ori C could invoke magnetic properties as thedifference, but this so far remains to be modeled.θ1 Ori E is now classified as a young intermediatebinary (Herbig and Griffin 2005) and has a similarlybright and hot X-ray spectrum (Schulz et al. 2003).There are still many open questions and future stud-ies of hot stars in the OTC with the HETG promiseto be very fruitful. ✮
FIGURE. 7: The zero order image of the 580 ks exposure of the Orion Tra-pezium from the HETG Orion Legacy Project. The main stars are from θ1 Ori; A2 in the inset is θ2 Ori A, further from the cluster center.
5/10/2018 Chandra X-ray Observatory Newsletter 2008 - slidepdf.com
http://slidepdf.com/reader/full/chandra-x-ray-observatory-newsletter-2008 8/52
8 CXC Newsletter
References
Cassinelli, J. P., Miller, N. A., Waldron, W. L., et al.2001, ApJ, 554, 55
Corcoran, M. F., Seward, F. D., Henley, D. B.,Hamaguchi, K. 2005, Chandra Newsletter, Issue 12
Cohen, D. H., de Messieres, G. E., MacFarlane, J. J.et al. 2003, ApJ, 586, 495
Feigelson, E. D., Broos, P., Gaffney, J. A. 2002, ApJ,574, 258
Herbig, G. H., Griffin, R. F. 2005, AJ, 132, 1763
Leutenegger, M. A., Paerels, F. B., Kahn, S. M., Co-hen, D. H. 2006, ApJ, 650, 1096
Li, Q., Cassinelli, J. P., Brown, J. C. et al. 2008, ApJ,672, 1174
Lopez de Oliveira, R., Motch C., Smith, M. A. et al.2007, A&A, 474, 983
Pollock, A. M. T., Corcoran, M. F., Stevens, I. R.,Williams, P. M. 2005, ApJ, 629, 482
Rakowski, C. E., Schulz, N. S., Wolk, S. J., Testa, P.2006, ApJ, 649, L111
Sana, H., Stevens, I. R., Gosset, E., Rauw, G., Vreux,J.-M. 2004, MNRAS, 350, 809
Schulz, N. S., Testa, P., Huenemoerder, D. P., Ishi-bashi, K., Canizares, C. R. 2006, ApJ, 653, 636
Schulz, N. S., Canizares, C. R., Huenemoerder, D.P., Tibbets, K. 2003, ApJ, 595, 365
Simon-Diaz, S., Herrero, A., Esteban, C., Najarro, F.2006, A&A, 448, 351
Smith, M. A., Cohen, D. H., Gu, M. F. et al. 2004,ApJ, 600, 972
Waldron, W. L. & Cassinelli, J. P. 2007, ApJ, 668,456
Waldron, W. L. & Cassinelli, J. P. 2001, ApJ, 548,L45
Westbrook, O. W., Remage Evans, N., Wolk, S. J. etal. 2007, arXiv: 0712.0610
T he major highlight of this period was theSymposium “Eight Years of Science with
Chandra”, hosted by NASA Marshall Space FlightCenter and the Chandra X-ray Center on 2007 Oc-tober 23-25, in Huntsville, Alabama.
Steve O’Dell (MSFC) and Dan Schwartz(SAO) co-chaired the Science Organizing Commit-tee.
Other committee members were:Max Bonamente (UAH),Graziella Branduardi-Raymont (MSSL),Annalisa Celotti (SISSA/ISAS),Larry David (SAO),Ron Elsner (MSFC),Dan Evans (Harvard),Kathy Flanagan (STScI),Mike Garcia (SAO),Ann Hornschemeier (GSFC),Margarita Karovska (SAO),Vicky Kaspi (McGill),Chryssa Kouveliotou (NASA/MSFC),Kazuhisa Mitsuda (ISAS/JAXA),Dan Patnaude (SAO),
Peter Predehl (MPE),Andrea Prestwich (SAO),Leisa Townsley (Penn State U.), andMeg Urry (Yale).
Susan Tuttle (SAO) did an outstanding jobchairing the Local Organizing Committee. Havingthe food catered for the breaks and lunch was an ex-cellent idea, fostering active interactions amongstparticipants.
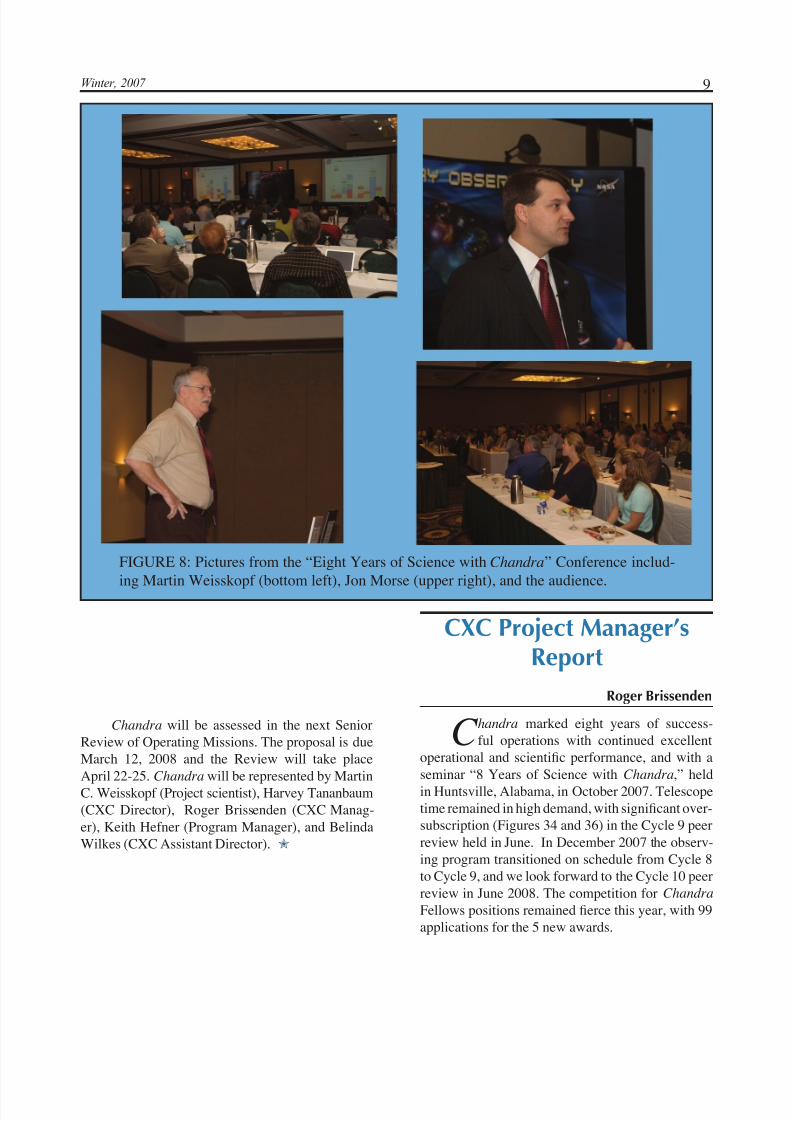
This fourth biennial symposium included akeynote talk by Jon Morse (Director of NASA’s As-trophysics Division, see Figure 8), 11 invited talks,38 contributed talks, and 56 poster presentations.For on-line proceedings of the Symposium, pleasevisit http://cxc.harvard.edu/symposium_2007/pro-
ceedings/ .The Chandra Calibration Workshop, organized
by Vinay Kashyap (SAO), immediately followedthe Symposium. For proceedings of the Workshop,please visit http://cxc.harvard.edu/ccw/proceed-
ings/07_proc/ .
Project Scientist’s Report
Martin C. Weisskopf, Stephen O’Dell
5/10/2018 Chandra X-ray Observatory Newsletter 2008 - slidepdf.com
http://slidepdf.com/reader/full/chandra-x-ray-observatory-newsletter-2008 9/52
9Winter, 2007
Chandra will be assessed in the next SeniorReview of Operating Missions. The proposal is dueMarch 12, 2008 and the Review will take place
April 22-25. Chandra will be represented by MartinC. Weisskopf (Project scientist), Harvey Tananbaum(CXC Director), Roger Brissenden (CXC Manag-er), Keith Hefner (Program Manager), and BelindaWilkes (CXC Assistant Director). ✮
FIGURE 8: Pictures from the “Eight Years of Science with Chandra” Conference includ-
ing Martin Weisskopf (bottom left), Jon Morse (upper right), and the audience.
CXC Project Manager’sReport
Roger Brissenden
C handra marked eight years of success-ful operations with continued excellent
operational and scientific performance, and with aseminar “8 Years of Science with Chandra,” heldin Huntsville, Alabama, in October 2007. Telescopetime remained in high demand, with significant over-subscription (Figures 34 and 36) in the Cycle 9 peerreview held in June. In December 2007 the observ-ing program transitioned on schedule from Cycle 8to Cycle 9, and we look forward to the Cycle 10 peerreview in June 2008. The competition for Chandra Fellows positions remained fierce this year, with 99applications for the 5 new awards.
5/10/2018 Chandra X-ray Observatory Newsletter 2008 - slidepdf.com
http://slidepdf.com/reader/full/chandra-x-ray-observatory-newsletter-2008 10/52
10 CXC Newsletter
The CXC mission planning staff continued tomaximize observing efficiency in spite of tempera-ture constraints on spacecraft pointing. Competingthermal constraints require some longer observationsto be split into multiple short duration segments, to
allow the spacecraft to cool at preferred attitudes.However constraints were eased when ongoing ef-forts relaxed the EPHIN thermal constraints. Over-all the average observing efficiency in the last yearwas 67%, compared to 64% in the prior year, andwith a maximum possible of ~70%.
Operational highlights over the past year in-cluded 9 fast turn-around observing requests thatrequired the mission planning and flight teams to re-schedule and interrupt the on-board command loads.The sun was exceptionally quiet this year, causingno observing interruptions due to high levels of solaractivity. Chandra passed through the 2007 summerand winter eclipse seasons with nominal power andthermal performance, and handled lunar eclipses inMarch and October without incident. Perhaps mostimportant, the mission continued without a signifi-cant anomaly and had no safe mode transitions thisyear.
In addition to the routine training simulationsconducted for the Flight Operations Team (FOT),members of the CXC’s management staff, scienceteams and FOT responded to a surprise operations
simulation in December. The simulation was initiat-ed by the Chandra program office at Marshall SpaceFlight Center and prepared and carried out by a se-lect team at the OCC, who modified actual Chandra telemetry from an early safe mode for the exercise.The simulation, which began after midnight, testedthe team’s response to a perceived spacecraft emer-gency. The staff performed well, investigating theanomaly and making appropriate decisions. As aresult of the experience, actions were identified toimprove procedures and responses in the event of future spacecraft problems.
The FOT marked a year of outstanding op-erations and the seventh continuous year withouta safe mode. To understand Chandra’s long-termoperational capabilities, the FOT calculated Chan-
dra’s orbit through 15 years following launch andexamined the orbit’s effect on mission planning andoperations. The study found no significant limit onChandra’s ability to operate at the current level of observing efficiency over a 15-year mission. The
FOT also continued its preparation for recompil-ing the spacecraft’s software. This major effort willmake it easier in the future to generate, verify andcontrol changes to the flight software.
Both focal plane instruments, the Advanced
CCD Imaging Spectrometer and the High Resolu-tion Camera, have continued to operate well andhave had no major problems. ACIS experienced twominor anomalies: its Front End Processor spontane-ously reset in April, resulting in loss of data fromthree chips for one observation, and its side-B pow-er supply turned off in December, resulting in lossof data from one observation. Such anomalies havebeen rare and do not significantly affect the mission.Mission planners rescheduled the affected observa-tions at later dates.
Because ACIS, along with the overall space-craft, has continued to warm gradually, it was de-cided in 2006 to ask observers to identify ACISchips that could be turned off during observations.Each powered-off chip provides approximately 5deg C of temperature margin, adding flexibility tomission planning. The capability for ACIS chipselection was introduced this year in the proposalplanning software for Cycle 9. As another meansof mitigating ACIS warming, tests were conductedduring 2007 to determine the effect of turning off the ACIS detector housing heater. As a result the
heater is being turned off during perigee passageswith particular spacecraft attitudes, and further testsare planned.
Following successful functional tests during2006, the HRC +Y shutter was partially inserted tosupport a December, 2007, observation of the Crabnebula. The shutter operated properly during the ob-servation.
All systems at the Chandra Operations Con-trol Center continued to perform well in supportingflight operations. The ground system staff and thesystems engineering team successfully completed amajor external IT (information technology) securityaudit. The team updated the online software systemto implement a small number of changes requiredby the audit, and in September NASA headquarterssigned the OCC’s formal Authority to Operate forthe next 3 years. The OCC replaced its aging datastorage system and installed a redundant serverstring in an off-site location to provide a minimumbackup operations capability for use in the event of

5/10/2018 Chandra X-ray Observatory Newsletter 2008 - slidepdf.com
http://slidepdf.com/reader/full/chandra-x-ray-observatory-newsletter-2008 11/52
11Winter, 2007
a major anomaly at the OCC.Chandra data processing and distribution to
observers continued smoothly, with the time fromobservation to delivery of data averaging less than2 days. The Chandra archive holdings grew by 0.8
TB to 4.9 TB (compressed) and now consist of 17.4million files. The large increase is due in part to thethird full reprocessing of Chandra data, which wascompleted in 2007. The reprocessed data incorpo-rate the most recent instrument calibrations.
Work is progressing well on the Chandra source catalog. The CXC Data System program-ming team released several versions of the sourcecatalog processing software to the CXC during theyear for evaluation and testing, and the team expectsto release a full version in summer 2008, with pro-cessing to follow.
The Data System team also released softwareupdates to support the submission deadline for Cy-cle 9 observation proposals (March 2007), the Cy-cle 9 Peer Review (June), and the Cycle 10 Call forProposals(December) and issued a major release of CIAO (December).
The Education and Public Outreach group is-sued 14 Chandra press releases and 18 image re-leases during 2007. The EPO team held two pressconferences, a NASA Media Teleconference, anda NASA Science Update. The EPO team received
the prestigious Pirelli Internet ional award, an inter-national multimedia competition for the communi-cation of science & technology, for its innovativeChandra podcasts. The team continued to releaseChandra podcasts through the CXC website, with12 new podcasts this year.
We look forward to a new year of continuedsmooth operations and exciting science results. ✮
Instruments: ACIS
Controlling the ACIS FocalPlane Temperature
Paul P. Plucinsky
Over the course of the mission, the ACIS focalplane (FP) temperature has been warming above thedesired temperature of -119.7 C when the spacecraftis in an orientation in which the Sun is on the backof the Science Instrument Module (SIM). Warming
of the FP temperature has been observed for pitchangles larger than 130 degrees. The amount of warming depends of course on how long the satellitespends in an orientation with pitch angles larger than130 degrees and how cold the various components
were at the start of the observation. The warmingoccurs because the insulating layers on the outsideof the SIM are degrading with time and more heatis propagating into the interior of the SIM. The FICCDs are more sensitive to deviations in the FPtemperature than the BI CCDs. For deviations of less than 1.0 degree, Chandra GOs should not noticeany difference in the calibration of the FI CCDs. Thecomparable limit for the BI CCDs is 3.0 degrees.
In order to partially counteract this effect,the ACIS instrument team has been conducting
tests in which the Detector Housing (DH) heater isturned off. The DH heater has been used to keep theCamera Body at a steady temperature of about -60C (the Camera Body is essentially the box whichencloses the volume containing the FP). If the DHheater is turned off, the camera body temperaturewill fluctuate between -65 C and -72 C. These lowertemperatures would reduce the heat load on the FPand make it more likely that a temperature of -119.7C could be maintained for tail-Sun orientations.Please note that the FP temperature is regulated by adifferent circuit and turning off the DH heater does
not affect the regulation of the FP temperature.It is desirable to have a constant camera body
temperature because the ACIS fiducial lights aremounted on the camera body. If the camera bodytemperature is fluctuating, the camera body willbe contracting or expanding and the position of the fiducial lights will be changing relative to theAspect system. The CXC has been conducting testsin which the DH heater is turned off to determinehow the positions of the fiducial lights change overthe course of an observation. These tests show thatthe motion of the fiducial lights is small and can becorrected such that there is no impact on the aspectreconstruction for the observations. The CXC DataSystem is incorporating this correction into thestandard processing pipelines. In addition, the ACISinstrument team is conducting additional tests withthe DH heater off when the satellite is in forward-Sun orientations since the thermal models indicatethis will be the coldest orientation for the camerabody. When these tests are completed and the SW
5/10/2018 Chandra X-ray Observatory Newsletter 2008 - slidepdf.com
http://slidepdf.com/reader/full/chandra-x-ray-observatory-newsletter-2008 12/52
12 CXC Newsletter
A Light Echo from the Milky
Way’s Black HolePeter Edmonds
A popular activity for news magazines is tolist the top news stories of the year. As a member of the Education and Public Outreach group, I enjoythese articles because they can give a second roundof publicity to Chandra press releases that we putout months earlier. These publicity “echoes” often
reach a different audience from the one that saw theoriginal stories.
In their January 2008 issue, Discover maga-zine lists their hundred top science stories of 2007.Coming in at number 41 is the discovery of evidencefor a different type of echo, a light echo generatedby the Milky Way’s supermassive black hole, Sagit-tarius A*. This result, announced by Mike Muno of Caltech at the 2007 American Astronomical Society
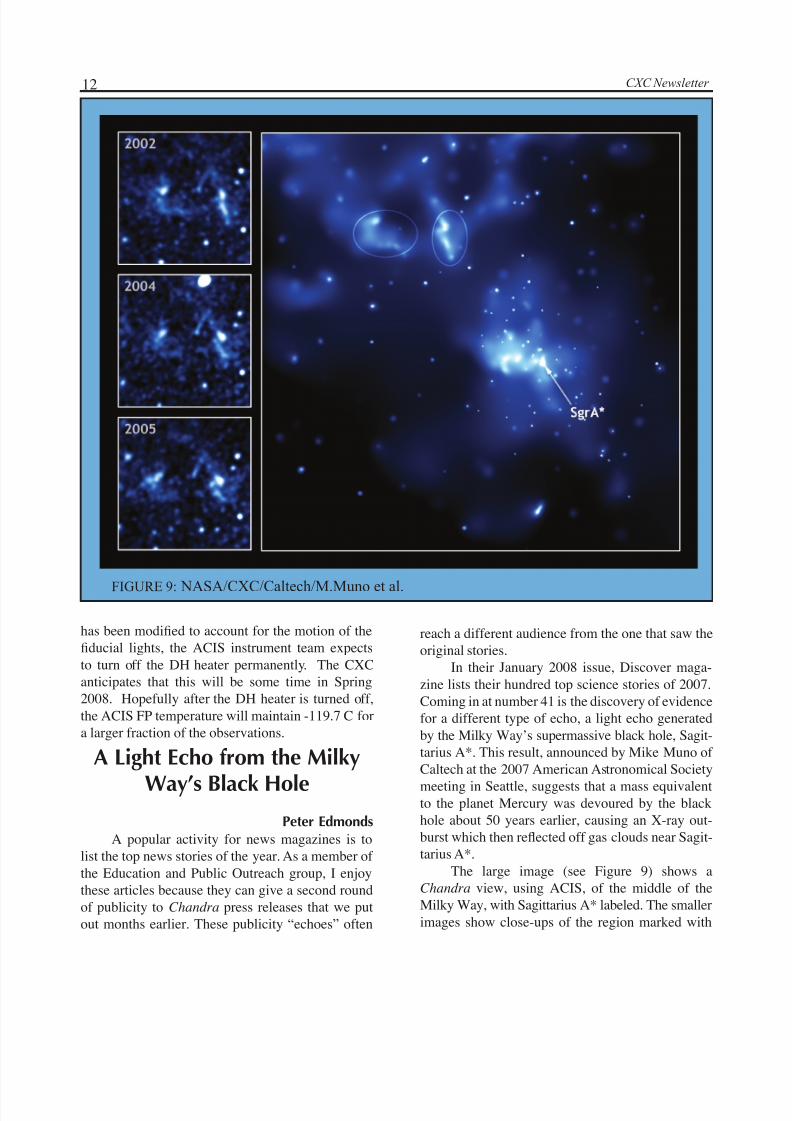
meeting in Seattle, suggests that a mass equivalentto the planet Mercury was devoured by the blackhole about 50 years earlier, causing an X-ray out-burst which then reflected off gas clouds near Sagit-tarius A*.
The large image (see Figure 9) shows aChandra view, using ACIS, of the middle of theMilky Way, with Sagittarius A* labeled. The smallerimages show close-ups of the region marked with
FIGURE 9: NASA/CXC/Caltech/M.Muno et al.
has been modified to account for the motion of thefiducial lights, the ACIS instrument team expectsto turn off the DH heater permanently. The CXCanticipates that this will be some time in Spring2008. Hopefully after the DH heater is turned off,the ACIS FP temperature will maintain -119.7 C fora larger fraction of the observations.
5/10/2018 Chandra X-ray Observatory Newsletter 2008 - slidepdf.com
http://slidepdf.com/reader/full/chandra-x-ray-observatory-newsletter-2008 13/52
13Winter, 2007
Instruments: HRC
Ralph Kraft, Almus Kenter,for the HRC team
At the expense of sounding like a broken re-cord, the HRC continues to operate well
with no anomalies or interruptions. There has been a
measurable but, for most observations, insignificantamount of charge extracted from the MCPs to date.The potential impact of extracted charge on LETGobservations is discussed in the section Instruments:LETG. Any increase in the MCP high voltage andtherefore gain is at least several years away. Ongoingmonitoring/calibration observation show no changein the HRC UV sensitivity (potentially indicative of problems with the UVIS) and a small decrease in theX-ray QE due to extracted charge. One HRC shutterwas used for an observation of the Crab Nebula dur-ing the past year. The shutter performed nominally,
although it is not expected that either will be usedagain. It has been another quiet, routine year forHRC operations.
A wide range of science observations, bothGO and GTO, have been made over the past yearwith the HRC-I, the HRC-S in timing mode, and theHRC-S/LETG combination. The next two sectionspresent some science highlights from the last year,including HRC-I and HRC-S/LETG observations of
ellipses. Clear changes in the shapes and brightnessof the gas clouds are seen between the 3 differentobservations in 2002, 2004 and 2005. This behavioragrees with theoretical predictions for a light echoproduced by Sagittarius A* and helps rule out other
interpretations. While the primary X-rays from theoutburst would have reached Earth about 50 yearsago, before X-ray observatories were in place to seeit, the reflected X-rays took a longer path and ar-rived in time to be recorded by Chandra.
Studying this light echo gives a crucial his-tory of activity from Sagittarius A*, and it illumi-nates and probes the poorly understood gas cloudsnear the center of the galaxy. It also gives an excel-lent example of the innovative science enabled byChandra’s ACIS camera and the scientific advancesthat are possible with observations spread out overseveral years.✮
α Cen A, and HRC-I observations of unidentifiedASCA sources in the Galactic plane.
The Fainting of α Cen A,
ResolvedThomas R. Ayres (University of Colo-
rado), Philip G. Judge (High Altitude Observa-tory), Steven H. Saar (CfA), & Jürgen H. M. M.
Schmitt (Hamburger Sternwarte)
XMM -Newton snapshots of the famous αCentauri binary at six month intervals recorded anabrupt disappearance of the primary’s X-ray coronain early 2005. The “fainting” of α Cen A was con-trary to the previous two decades of X-ray moni-
toring of the system, which had found only modestcoronal variability of the Sun-like star (although itscooler K-type companion was considerably more er-ratic). To be sure, the solar corona varies by factorsof hundreds in hard kilovolt X-rays over the 11-yearactivity cycle, but even at sunspot minimum therestill is a pervasive soft 1 MK “quiet corona” thatalways is present. Thus, the “fainting” of the α CenA X-rays was unexpected and puzzling. At the sametime, the A–B orbit has been closing rapidly over thepast decade, leaving the companions badly blended
in the XMM-Newton MOS1 images; only Chandra now can cleanly separate them.
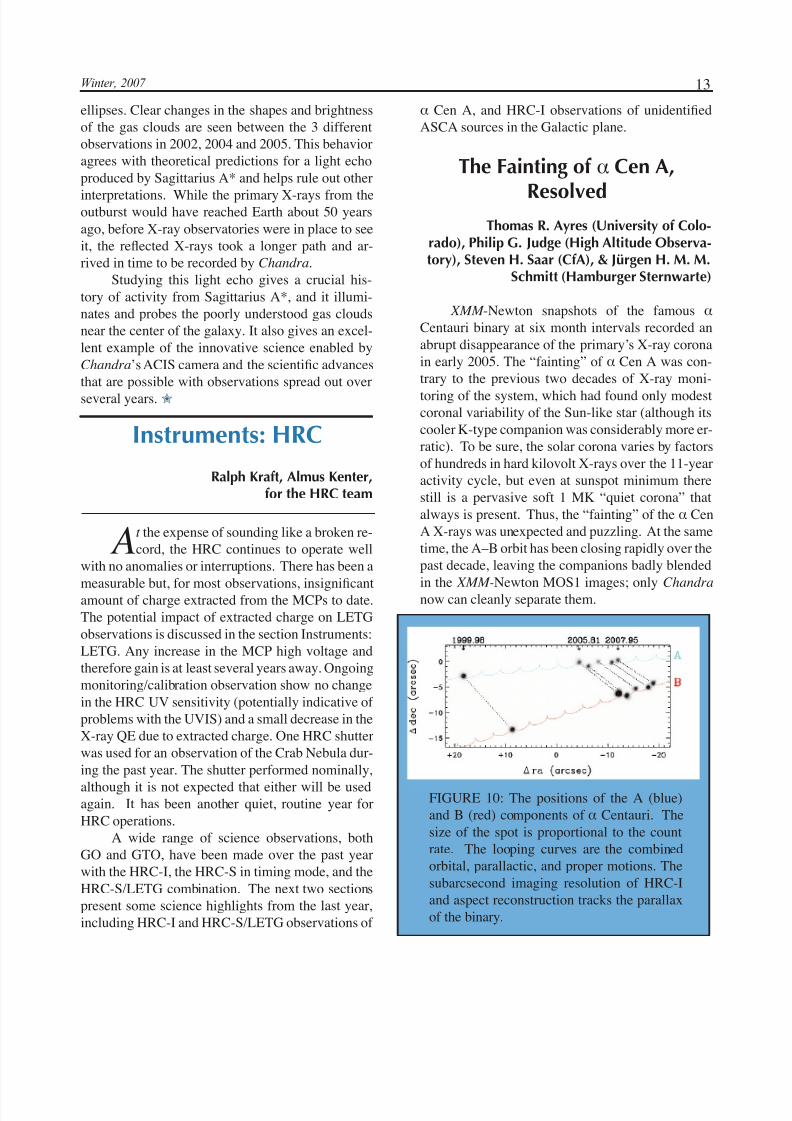
FIGURE 10: The positions of the A (blue)and B (red) components of α Centauri. Thesize of the spot is proportional to the countrate. The looping curves are the combinedorbital, parallactic, and proper motions. Thesubarcsecond imaging resolution of HRC-Iand aspect reconstruction tracks the parallaxof the binary.
5/10/2018 Chandra X-ray Observatory Newsletter 2008 - slidepdf.com
http://slidepdf.com/reader/full/chandra-x-ray-observatory-newsletter-2008 14/52
14 CXC Newsletter
Thanks to a initial grant of Chandra Direc-
tor’s Discretionary Time, our team began acquiringpointings on α Centauri in late 2005. We used theHRC-I camera: the optical brightness of the binaryprecluded ACIS (with its red leak). HRC-I also hasgood soft response. Figure 10 shows the results todate. In each epoch, the A component (the Sun-likestar) is uppermost; the B component (the K dwarf)is below and to the right; and the size of the spot isproportional to the X-ray count rate. The leftmostpair is a 0th-order image from a late-1999 LETGS/HRC-S exposure (scaled to HRC-I sensitivity); the
middle three are HRC-I’s from the initial DDT al-location; and the rightmost two are from a follow-up Cycle 8 GO program. The most recent point-ing was in December 2007. Looping curves are thecombined orbital, parallactic, and proper motions:Chandra’s subarcsecond aspect reconstruction eas-ily tracks the parallax of the nearby binary.
Although α Cen A had faded a factor of 50in the MOS1 frames of early 2005, we see that theprimary is clearly visible in HRC-I, and at flux levels
not very different from the 1990’s, when the system
was monitored on a regular basis by ROSAT . Had αCen A suddenly recovered from its deep X-ray lullof only a few months prior, or was something elsegoing on? Fortunately, an LETGS spectrum takenthis past June 2007 fully resolved the mystery. Andwhile diehard X-ray spectroscopists baldly assertthat spectra are superior to pure imaging for gleaningphysical insight, in this case we actually were right.
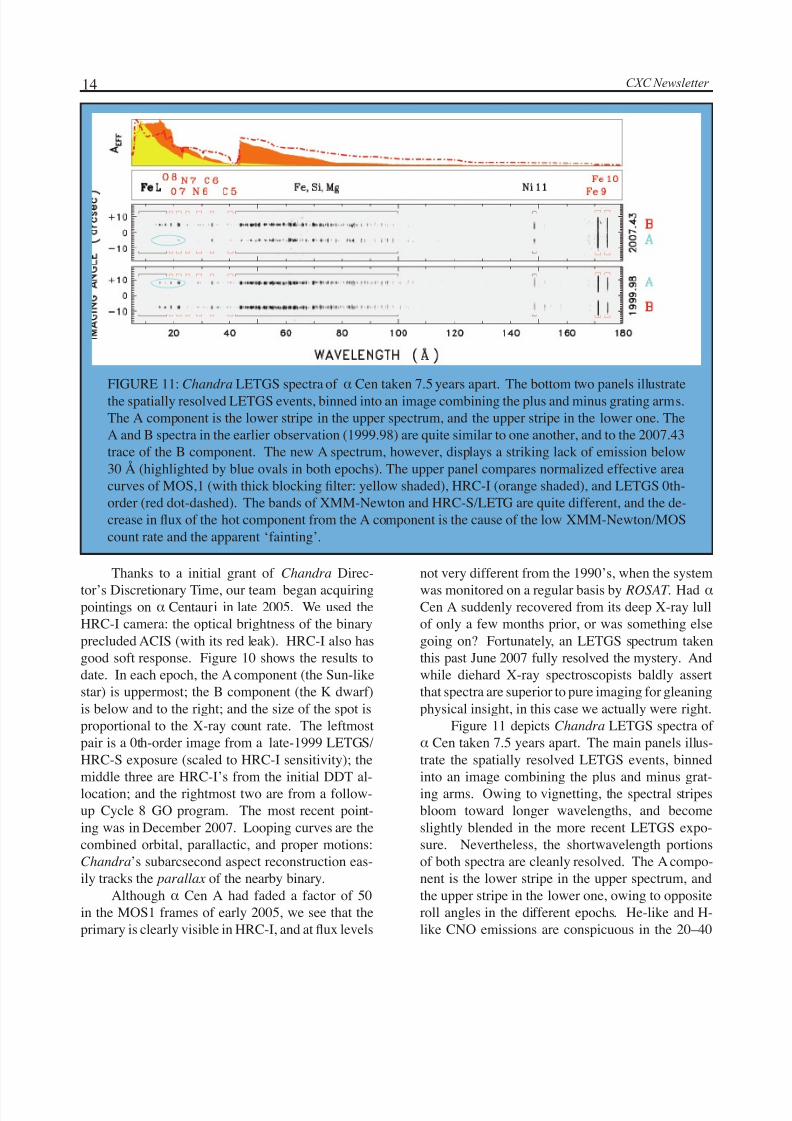
Figure 11 depicts Chandra LETGS spectra of α Cen taken 7.5 years apart. The main panels illus-trate the spatially resolved LETGS events, binned
into an image combining the plus and minus grat-ing arms. Owing to vignetting, the spectral stripesbloom toward longer wavelengths, and becomeslightly blended in the more recent LETGS expo-sure. Nevertheless, the shortwavelength portionsof both spectra are cleanly resolved. The A compo-nent is the lower stripe in the upper spectrum, andthe upper stripe in the lower one, owing to oppositeroll angles in the different epochs. He-like and H-like CNO emissions are conspicuous in the 20–40
FIGURE 11:Chandra
LETGS spectra of α Cen taken 7.5 years apart. The bottom two panels illustratethe spatially resolved LETGS events, binned into an image combining the plus and minus grating arms.The A component is the lower stripe in the upper spectrum, and the upper stripe in the lower one. TheA and B spectra in the earlier observation (1999.98) are quite similar to one another, and to the 2007.43trace of the B component. The new A spectrum, however, displays a striking lack of emission below30 Å (highlighted by blue ovals in both epochs). The upper panel compares normalized effective areacurves of MOS,1 (with thick blocking filter: yellow shaded), HRC-I (orange shaded), and LETGS 0th-order (red dot-dashed). The bands of XMM-Newton and HRC-S/LETG are quite different, and the de-crease in flux of the hot component from the A component is the cause of the low XMM-Newton/MOScount rate and the apparent ‘fainting’.
5/10/2018 Chandra X-ray Observatory Newsletter 2008 - slidepdf.com
http://slidepdf.com/reader/full/chandra-x-ray-observatory-newsletter-2008 15/52
15Winter, 2007
Å interval, while Fe L-shell features below 20 Åare weak in these relatively cool (1–2 MK) coronalsources. Si, Mg, and Fe M-shell emissions crowdthe 40–100 Å interval, and the isolated Fe IX andFe X lines near 170 Å are very bright. The A and B
spectra in the earlier observation (1999.98) are quitesimilar to one another, and to the 2007.43 trace of theB component. The new A spectrum, however, dis-plays a striking lack of emission below 30 Å (high-lighted by blue ovals in both epochs). The upperpanel compares normalized effective area curves of MOS,1 (with thick blocking filter: yellow shaded),HRC-I (orange shaded), and LETGS 0th-order (reddot-dashed). Apparently, a sharp decline in the hot-test components (>2 MK) of the solar twin’s coronahad substantially depleted the line spectrum wherethe XMM -Newton response peaks (λ < 30 Å), butthe overall coronal luminosity, dominated by longerwavelength ~1 MK emissions, had declined onlyslightly. In hindsight, this same behavior is seenover the solar magnetic cycle: sunspot maximumis dominated by hot 2–3 MK active regions scat-tered across the disk, whereas at minimum all thatremains is the ubiquitous cool 1 MK basal corona.However, our appreciation of the solar effect in the0.2–2 kev MOS1 bandpass had been subverted bylack of routine X-ray measurements of the Sun at~0.5 keV. This is an excellent example of the dark
side of the solar-stellar connection informing ourunderstanding of our own star; as well as a specificillustration of the power of spectroscopy to answerriddles posed by low energy resolution imaging; allmade possible, of course, by the unique capabilitiesof Chandra itself.
ChIcAGO: Chasing the Identi-fication of ASCA Galactic
Objects
Gemma Anderson, Bryan Gaensler(University of Sydney), for the ChIcAGO Team
ASCA has surveyed 40 deg2 of the Galacticplane in the flux range 1013 to 1011 erg cm-2 s-1 (Sugizaki et al. 2001), resulting in a catalog of 163sources. This yields a useful logN - log S distributionof Galactic X-ray sources, but the poor spatial reso-lution of ASCA (> 1 arcmin positional uncertainty)
has left two-thirds of these sources unidentified. Forthe last few years, we have been using new and ar-chival data to improve this situation, with consider-able success. Our recent work has demonstrated thatunidentified ASCA sources represent a whole rangeof interesting objects, including massive stars, mag-netars, young supernova remnants (SNRs), pulsarwind nebulae (PWNe) and high mass X-ray binaries(HMXBs). To go beyond this initial sample, we haveconceived the ChIcAGO project (Chasing the Iden-tification of ASCA Galactic Objects), in which weare using the sub-arcsecond resolution of the HRC-Iand ACIS instruments on Chandra to identify >100unidentified low-latitude ASCA sources caught be-tween the bright and faint distributions that havebeen the focus of previous investigations. Combinedwith these existing studies, ChIcAGO will allow us
to derive the lifetimes, birth-rates, and spatial distri-butions of the young populations associated with thelife and death of massive stars in the Milky Way.
Beyond the initial X-ray analysis, the key tosource identifications is an extensive multi-wave-length campaign. Many of our targets should bereadily identifiable with stellar counterparts in DSS,2MASS and GLIMPSE data. For those sources withoptical and infrared counterparts that are obscuredor too faint to be seen in the above shallow surveys
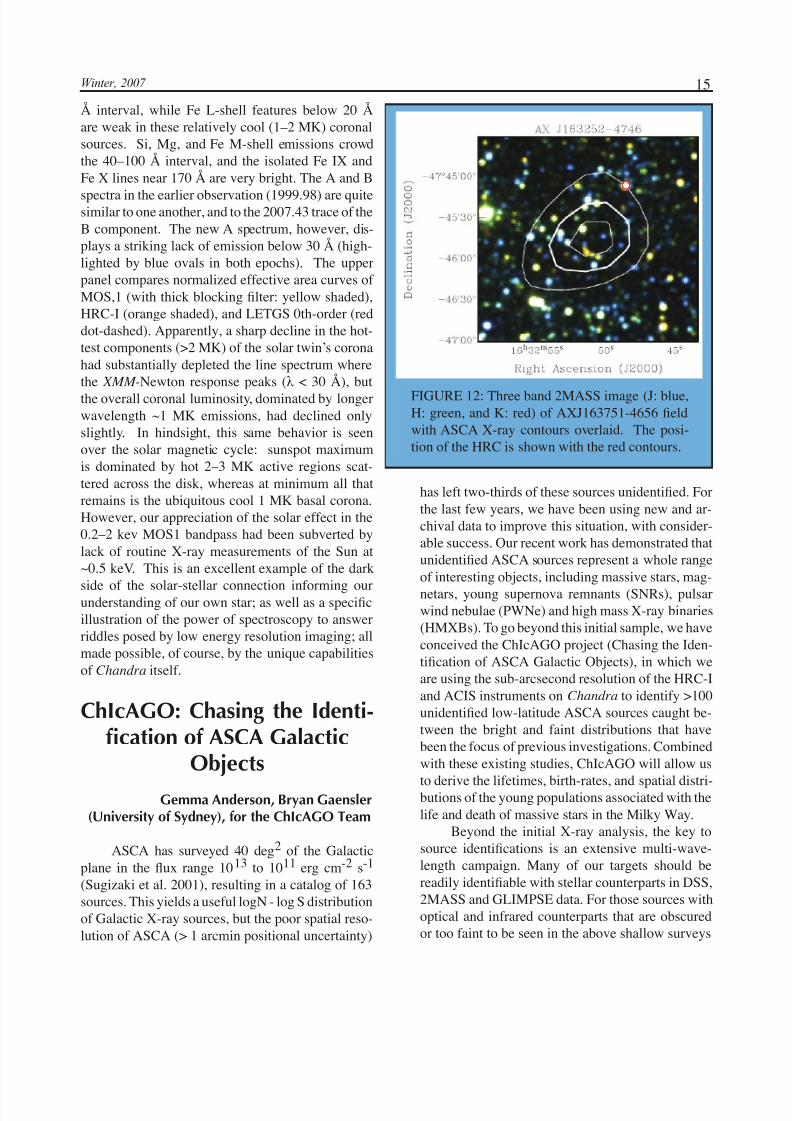
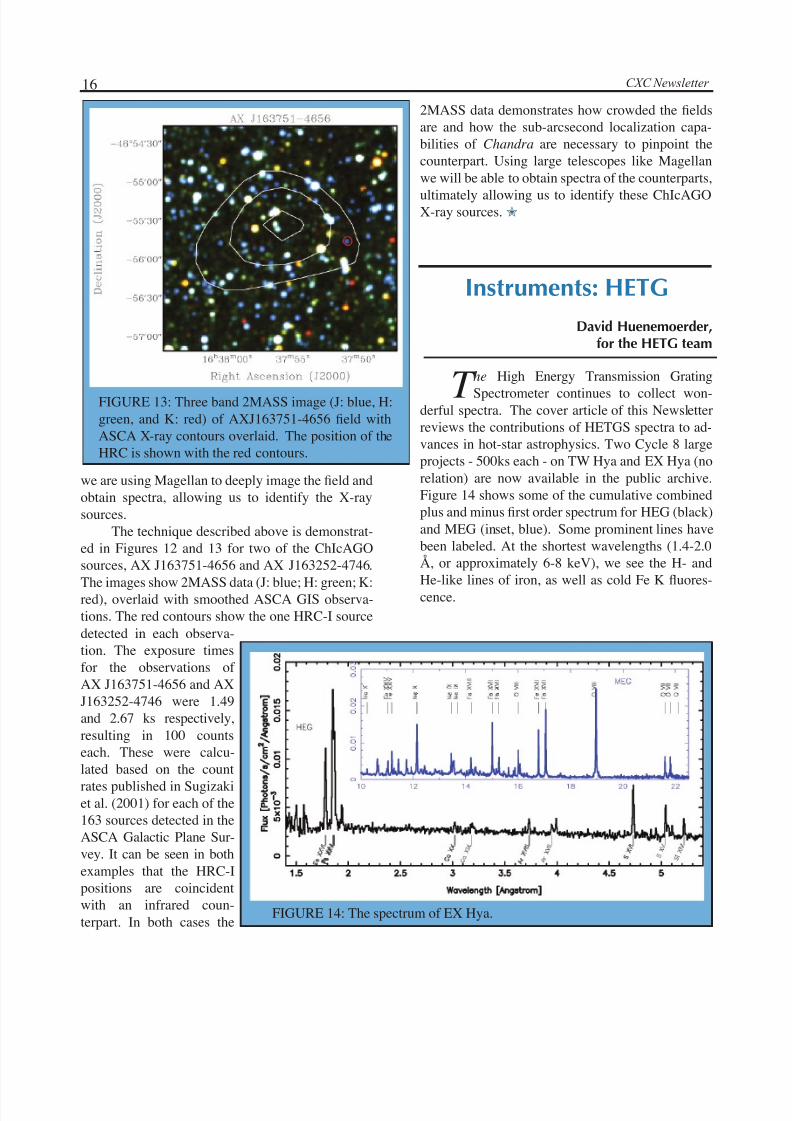
FIGURE 12: Three band 2MASS image (J: blue,H: green, and K: red) of AXJ163751-4656 fieldwith ASCA X-ray contours overlaid. The posi-tion of the HRC is shown with the red contours.
5/10/2018 Chandra X-ray Observatory Newsletter 2008 - slidepdf.com
http://slidepdf.com/reader/full/chandra-x-ray-observatory-newsletter-2008 16/52
16 CXC Newsletter
we are using Magellan to deeply image the field andobtain spectra, allowing us to identify the X-raysources.
The technique described above is demonstrat-ed in Figures 12 and 13 for two of the ChIcAGOsources, AX J163751-4656 and AX J163252-4746.
The images show 2MASS data (J: blue; H: green; K:red), overlaid with smoothed ASCA GIS observa-tions. The red contours show the one HRC-I source
FIGURE 13: Three band 2MASS image (J: blue, H:green, and K: red) of AXJ163751-4656 field withASCA X-ray contours overlaid. The position of theHRC is shown with the red contours.
T he High Energy Transmission Grating
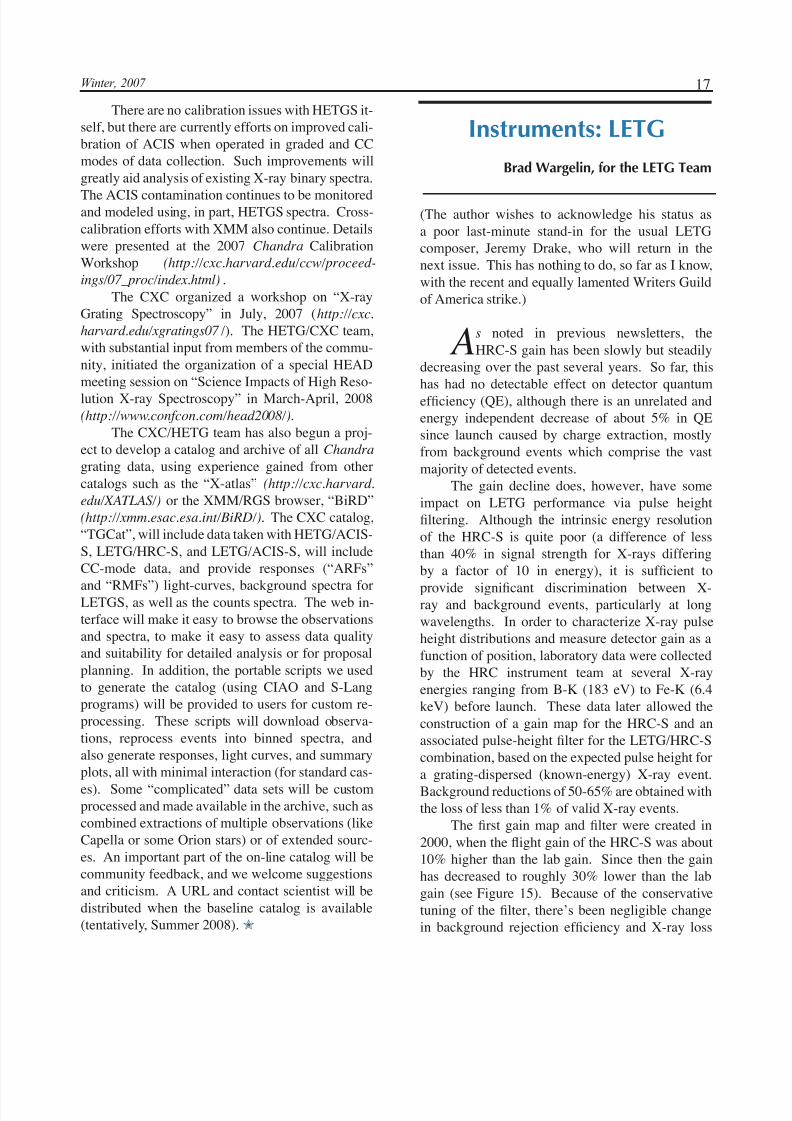
Spectrometer continues to collect won-derful spectra. The cover article of this Newsletterreviews the contributions of HETGS spectra to ad-vances in hot-star astrophysics. Two Cycle 8 largeprojects - 500ks each - on TW Hya and EX Hya (norelation) are now available in the public archive.Figure 14 shows some of the cumulative combinedplus and minus first order spectrum for HEG (black)and MEG (inset, blue). Some prominent lines havebeen labeled. At the shortest wavelengths (1.4-2.0Å, or approximately 6-8 keV), we see the H- and
He-like lines of iron, as well as cold Fe K fluores-cence.
Instruments: HETG
David Huenemoerder,for the HETG team
FIGURE 14: The spectrum of EX Hya.
detected in each observa-tion. The exposure timesfor the observations of AX J163751-4656 and AXJ163252-4746 were 1.49and 2.67 ks respectively,resulting in 100 countseach. These were calcu-lated based on the count
rates published in Sugizakiet al. (2001) for each of the163 sources detected in theASCA Galactic Plane Sur-vey. It can be seen in bothexamples that the HRC-Ipositions are coincidentwith an infrared coun-terpart. In both cases the
2MASS data demonstrates how crowded the fieldsare and how the sub-arcsecond localization capa-bilities of Chandra are necessary to pinpoint thecounterpart. Using large telescopes like Magellanwe will be able to obtain spectra of the counterparts,
ultimately allowing us to identify these ChIcAGOX-ray sources.✮
5/10/2018 Chandra X-ray Observatory Newsletter 2008 - slidepdf.com
http://slidepdf.com/reader/full/chandra-x-ray-observatory-newsletter-2008 17/52
17Winter, 2007
There are no calibration issues with HETGS it-self, but there are currently efforts on improved cali-bration of ACIS when operated in graded and CCmodes of data collection. Such improvements willgreatly aid analysis of existing X-ray binary spectra.
The ACIS contamination continues to be monitoredand modeled using, in part, HETGS spectra. Cross-calibration efforts with XMM also continue. Detailswere presented at the 2007 Chandra CalibrationWorkshop (http://cxc.harvard.edu/ccw/proceed-
ings/07_proc/index.html) .The CXC organized a workshop on “X-ray
Grating Spectroscopy” in July, 2007 (http://cxc.
harvard.edu/xgratings07 /). The HETG/CXC team,with substantial input from members of the commu-nity, initiated the organization of a special HEADmeeting session on “Science Impacts of High Reso-lution X-ray Spectroscopy” in March-April, 2008(http://www.confcon.com/head2008/).
The CXC/HETG team has also begun a proj-ect to develop a catalog and archive of all Chandra grating data, using experience gained from othercatalogs such as the “X-atlas” (http://cxc.harvard.
edu/XATLAS/) or the XMM/RGS browser, “BiRD”(http://xmm.esac.esa.int/BiRD/). The CXC catalog,“TGCat”, will include data taken with HETG/ACIS-S, LETG/HRC-S, and LETG/ACIS-S, will includeCC-mode data, and provide responses (“ARFs”
and “RMFs”) light-curves, background spectra forLETGS, as well as the counts spectra. The web in-terface will make it easy to browse the observationsand spectra, to make it easy to assess data qualityand suitability for detailed analysis or for proposalplanning. In addition, the portable scripts we usedto generate the catalog (using CIAO and S-Langprograms) will be provided to users for custom re-processing. These scripts will download observa-tions, reprocess events into binned spectra, andalso generate responses, light curves, and summaryplots, all with minimal interaction (for standard cas-es). Some “complicated” data sets will be customprocessed and made available in the archive, such ascombined extractions of multiple observations (likeCapella or some Orion stars) or of extended sourc-es. An important part of the on-line catalog will becommunity feedback, and we welcome suggestionsand criticism. A URL and contact scientist will bedistributed when the baseline catalog is available(tentatively, Summer 2008).✮
Instruments: LETG
Brad Wargelin, for the LETG Team
(The author wishes to acknowledge his status asa poor last-minute stand-in for the usual LETGcomposer, Jeremy Drake, who will return in thenext issue. This has nothing to do, so far as I know,with the recent and equally lamented Writers Guildof America strike.)
As noted in previous newsletters, theHRC-S gain has been slowly but steadily
decreasing over the past several years. So far, this
has had no detectable effect on detector quantumefficiency (QE), although there is an unrelated andenergy independent decrease of about 5% in QEsince launch caused by charge extraction, mostlyfrom background events which comprise the vastmajority of detected events.
The gain decline does, however, have someimpact on LETG performance via pulse heightfiltering. Although the intrinsic energy resolutionof the HRC-S is quite poor (a difference of lessthan 40% in signal strength for X-rays differingby a factor of 10 in energy), it is sufficient to
provide significant discrimination between X-ray and background events, particularly at longwavelengths. In order to characterize X-ray pulseheight distributions and measure detector gain as afunction of position, laboratory data were collectedby the HRC instrument team at several X-rayenergies ranging from B-K (183 eV) to Fe-K (6.4keV) before launch. These data later allowed theconstruction of a gain map for the HRC-S and anassociated pulse-height filter for the LETG/HRC-Scombination, based on the expected pulse height fora grating-dispersed (known-energy) X-ray event.Background reductions of 50-65% are obtained withthe loss of less than 1% of valid X-ray events.
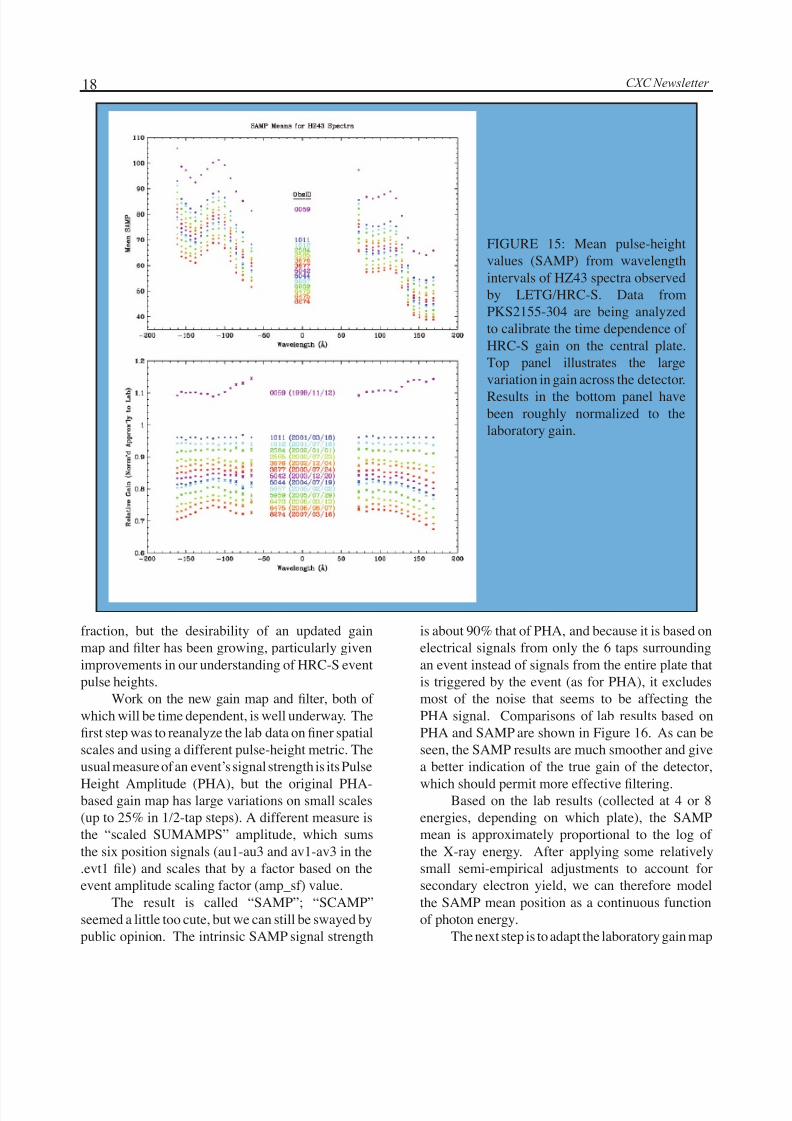
The first gain map and filter were created in2000, when the flight gain of the HRC-S was about10% higher than the lab gain. Since then the gainhas decreased to roughly 30% lower than the labgain (see Figure 15). Because of the conservativetuning of the filter, there’s been negligible changein background rejection efficiency and X-ray loss
5/10/2018 Chandra X-ray Observatory Newsletter 2008 - slidepdf.com
http://slidepdf.com/reader/full/chandra-x-ray-observatory-newsletter-2008 18/52
18 CXC Newsletter
fraction, but the desirability of an updated gainmap and filter has been growing, particularly givenimprovements in our understanding of HRC-S eventpulse heights.
Work on the new gain map and filter, both of which will be time dependent, is well underway. Thefirst step was to reanalyze the lab data on finer spatialscales and using a different pulse-height metric. Theusual measure of an event’s signal strength is its Pulse
Height Amplitude (PHA), but the original PHA-based gain map has large variations on small scales(up to 25% in 1/2-tap steps). A different measure isthe “scaled SUMAMPS” amplitude, which sumsthe six position signals (au1-au3 and av1-av3 in the.evt1 file) and scales that by a factor based on theevent amplitude scaling factor (amp_sf) value.
The result is called “SAMP”; “SCAMP”seemed a little too cute, but we can still be swayed bypublic opinion. The intrinsic SAMP signal strength
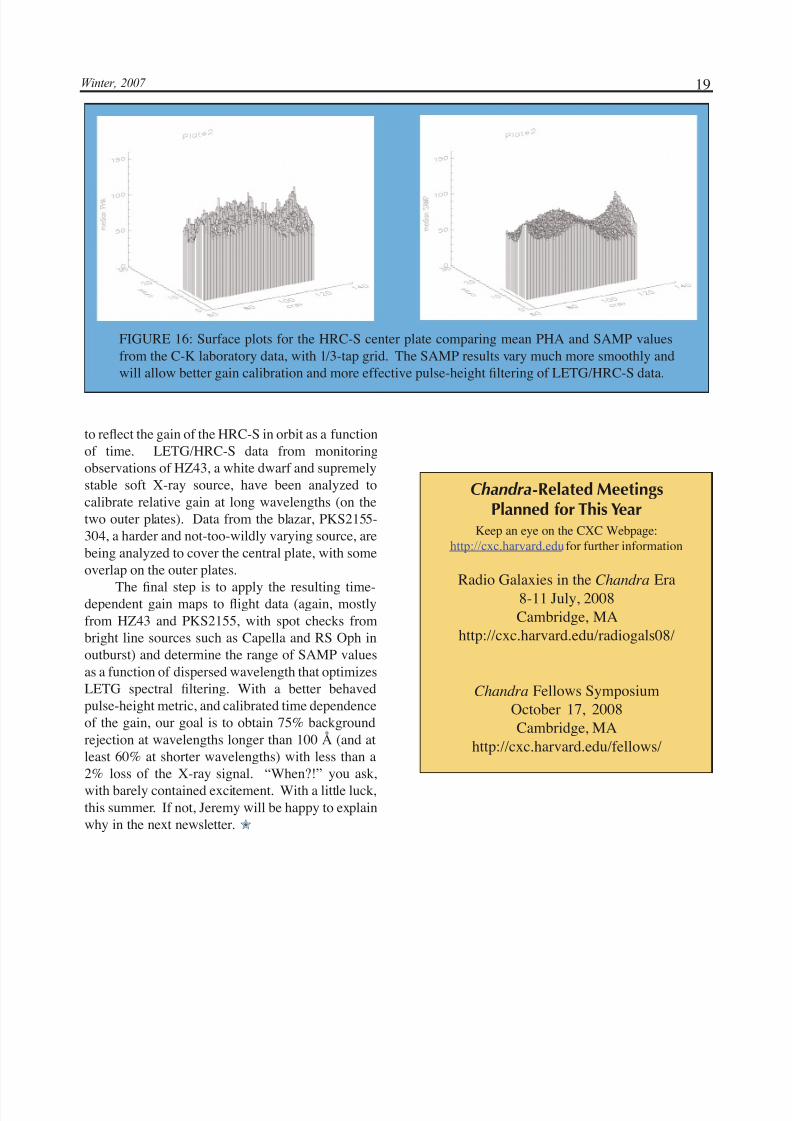
is about 90% that of PHA, and because it is based onelectrical signals from only the 6 taps surroundingan event instead of signals from the entire plate thatis triggered by the event (as for PHA), it excludesmost of the noise that seems to be affecting thePHA signal. Comparisons of lab results based onPHA and SAMP are shown in Figure 16. As can beseen, the SAMP results are much smoother and givea better indication of the true gain of the detector,
which should permit more effective filtering.Based on the lab results (collected at 4 or 8
energies, depending on which plate), the SAMPmean is approximately proportional to the log of the X-ray energy. After applying some relativelysmall semi-empirical adjustments to account forsecondary electron yield, we can therefore modelthe SAMP mean position as a continuous functionof photon energy.
The next step is to adapt the laboratory gain map
FIGURE 15: Mean pulse-heightvalues (SAMP) from wavelengthintervals of HZ43 spectra observedby LETG/HRC-S. Data fromPKS2155-304 are being analyzedto calibrate the time dependence of HRC-S gain on the central plate.Top panel illustrates the largevariation in gain across the detector.
Results in the bottom panel havebeen roughly normalized to thelaboratory gain.
5/10/2018 Chandra X-ray Observatory Newsletter 2008 - slidepdf.com
http://slidepdf.com/reader/full/chandra-x-ray-observatory-newsletter-2008 19/52
19Winter, 2007
to reflect the gain of the HRC-S in orbit as a functionof time. LETG/HRC-S data from monitoringobservations of HZ43, a white dwarf and supremelystable soft X-ray source, have been analyzed tocalibrate relative gain at long wavelengths (on thetwo outer plates). Data from the blazar, PKS2155-304, a harder and not-too-wildly varying source, arebeing analyzed to cover the central plate, with someoverlap on the outer plates.
The final step is to apply the resulting time-dependent gain maps to flight data (again, mostlyfrom HZ43 and PKS2155, with spot checks frombright line sources such as Capella and RS Oph inoutburst) and determine the range of SAMP valuesas a function of dispersed wavelength that optimizesLETG spectral filtering. With a better behavedpulse-height metric, and calibrated time dependenceof the gain, our goal is to obtain 75% backgroundrejection at wavelengths longer than 100 Å (and atleast 60% at shorter wavelengths) with less than a2% loss of the X-ray signal. “When?!” you ask,with barely contained excitement. With a little luck,this summer. If not, Jeremy will be happy to explainwhy in the next newsletter. ✮
FIGURE 16: Surface plots for the HRC-S center plate comparing mean PHA and SAMP valuesfrom the C-K laboratory data, with 1/3-tap grid. The SAMP results vary much more smoothly andwill allow better gain calibration and more effective pulse-height filtering of LETG/HRC-S data.
Chandra-Related MeetingsPlanned for This Year
Keep an eye on the CXC Webpage:http://cxc.harvard.edu for further information
Radio Galaxies in the Chandra Era8-11 July, 2008Cambridge, MA
http://cxc.harvard.edu/radiogals08/
Chandra Fellows SymposiumOctober 17, 2008Cambridge, MA
http://cxc.harvard.edu/fellows/
5/10/2018 Chandra X-ray Observatory Newsletter 2008 - slidepdf.com
http://slidepdf.com/reader/full/chandra-x-ray-observatory-newsletter-2008 20/52
20 CXC Newsletter
Chandra Calibration
Larry David
ACIS
A complete set of cti-corrected calibra-tion products for all 10 ACIS chips was
released in CALDB 3.3 on Dec. 18, 2006. Theseproducts only apply to data taken in timed event(TE) mode with a telemetry format of faint (F) orvery faint (VF) and with a focal plane temperature of -120 C (the ACIS operating temperature since Jan.2000). These data account for the bulk of ACISdata taken since launch.
Since the release of CALDB 3.3, most of theACIS calibration efforts have centered on develop-
ing a set of cti-corrected calibration products fordata taken in TE graded mode and continuous clock-ing (CC) mode. Data taken in graded mode cannotbe cti-corrected in the same manor as data taken in For VF mode, since only the flight event grade is tele-metered and not the 3 by 3 (in F mode) or 5 by 5 (inVF mode) distribution of charge around each event.The flight event grades run from 1 to 256 which arebinned into the 7 ASCA grades during pipe-line pro-cessing.
The analysis of a large set of ground calibra-
tion and in-flight data showed that the flight gradesare actually a very good proxy for the 3 by 3 chargedistribution around an event. Thus, the flight gradealone can be used to accurately estimate the chargedistribution around an event and the data can thenbe cti-corrected in the same manor as F or VF data.A newly developed cti-correction algorithm forgraded mode data has been extensively tested withdata from the ACIS external calibration source aswell as several astronomical sources, in particular,the oxygen rich supernova remnant E0102-72. The1 σ residuals in the gain of cti-corrected TE graded
mode data are 0.3%, and are nearly independent of location on the chips, date of the observation andphoton energy.
With the addition of these new calibrationproducts, the 1 σ residuals in the gain of cti-correcteddata taken in TE mode and any telemetry format arenow 0.3%. The gain on all ACIS chips continues tobe calibrated in 3 month intervals by co-adding datafrom the ACIS external calibration source which
is acquired before and after each perigee pass. Nochanges to the ACIS QE have been made over thepast year. The application of the TE graded modecti-corrected calibration products to ACIS data re-quires some modifications to the CIAO task acis_
process_events which are under development.In addition, the set of ACIS blank sky obser-
vations were reprocessed with the latest calibrationproducts (i.e., the cti-corrected products for TE modedata taken in V or VF telemetry format) in May 2007and released to the public in CALDB 3.4.1.
HRC
An HRC-I raster scan of ArLac is carried outevery six months to a year to monitor the gain of the HRC-I. These raster scans show that the HRC-I gain has decreased by about 20% since launch atthe aim point and by lesser amounts farther off-axis.An updated set of gain correction files for the HRC-I (one for each year) was released in CALDB 3.4in May 2007. For data acquired since May 2007,the pipe-line processing automatically applies theappropriate gain corrections. For data processedearlier than May 2007, users can apply the updatedgain corrections using the CIAO tool hrc_process_events. After applying the time-dependent gain cor-rections, users can then generate energy-invarianthardness ratio images for any HRC-I observation.
The HRC-I gain corrections are discussed in moredetail in Posson-Brown & Kashyap (2007,Proc.SPIE, V6686, 66860V). A set of finer spatial scaletime-dependent gain correction files (one for eachyear) is under development for the HRC-S. Thesecalibration products will improve background filter-ing of LETG/HRC-S data.
Two HRC-I raster scans of Capella have beencarried out over the past two years for a total of 40pointings. These data have been used to update theHRC-I de-gap table, which is used for image recon-struction. The updated de-gap table was released in3.4.1 in Sept., 2007. The use of the new-gap tableimproves the astrometry on the outer regions of theHRC-I. These raster scans of Capella also showthat the QE uniformity (QEU) map of the HRC-I ispresently calibrated to within 2% across the entiredetector. There is also an on-going study to cross-calibrate the HRC-I and HRC-S. The initial resultsof this study show that the absolute effective areasof these two detectors agree to within 10%.✮
5/10/2018 Chandra X-ray Observatory Newsletter 2008 - slidepdf.com
http://slidepdf.com/reader/full/chandra-x-ray-observatory-newsletter-2008 21/52
21Winter, 2007
C handra has a justified reputation as oneof the best calibrated telescopes around.
In many subsystems, the design goals have beenmet, and sometimes exceeded (http://cxc.harvard.
edu/cal/ ). And the continuing accumulation of flightdata, coupled with the treasure trove of ground cali-bration data, has allowed us to understand Chandra’sdetectors and mirrors better than ever before. This
understanding is publicized via the web pages of theCalibration group as well as through updates to theCALDB (http://cxc.harvard.edu/caldb/).
In addition, the Chandra Calibration Work-shops (CCW) provide a venue for sharing the lat-est information on ongoing investigations with thehigh-energy astrophysics community. For the pastcouple of cycles, the CCW has been paired with thebiennial Chandra Symposia, so that the dissemina-tion of calibration information is maximized. Thistime, it was held at Huntsville, AL, at the conclusionof the Eight Years of Chandra symposium, on 25Oct 2007. All CCW presenters were offered the op-portunity to further publicize their work as postersduring the Symposium, and more than 90% availedthemselves of it. We believe that it is perhaps safe tosuggest that perchance it was possibly a somewhatpopular scheme, maybe. Yeah. We thank the orga-nizers of the Symposium for all the help they gaveus, and which led to a seamless integration of theCCW with the Symposium.
The workshop was well attended, and wentoff without a hitch. A standing room only crowd
listened with rapt attention through a poster haikusession and two long session of talks. Topics cov-ered ranged from ACIS (bias maps, CTI corrections,effective areas, CC mode, contamination), to HRC(gain maps, background, QE uniformity), to XMMcross-calibration, and to the somewhat meta topicof how to figure out the error on the errors of fitparameters.
Chandra CalibrationWorkshop
Vinay Kashyap,Jennifer Posson-Brown
The presentations are available online now atthe CCW web site: http://cxc.harvard.edu/ccw/pro-
ceedings/07_proc/ . Proceedings from earlier work-shops are also available at the same place. In orderto make the site more accessible, we are tagging allpresentations and generating a tagging index, avail-able at: http://cxc.harvard.edu/ccw/tags/ . If youhave suggestions for specific tags for any presenta-tion, please send us an email. When complete, wefully expect this supercalifragilisticexplicatedocialtagged index to completely outshine Google.✮
Prospects and Perspective:Chandra
in the FutureSabina Bucher
As Chandra approaches nine years of suc-cessful science operations the Flight Op-
erations Team is looking to the future. The team hascompleted a detailed study of the factors that willinfluence the capability of the spacecraft to supporta 15-year mission. The principal contributing fac-tors are Chandra’s orbit, the vehicle health and the
science-return from the mission. In this article, wepresent a summary of the findings of the 15-yearstudy in each of these areas.
Orbit
Chandra’s orbit is always evolving. Duringthe first seven years of the mission the inclinationof the orbit increased, tipping the orbit up towardthe poles, the eccentricity decreased, making theorbit more circular, and the altitude at perigee in-creased. While the inclination will continue to in-
crease through 2015, the eccentricity and altitude of perigee have turned around. Through 2012 the orbitwill grow increasingly elongated and the altitude atperigee will decrease (see Figure 17), crossing thelowest value experienced to date in 2010. Changesin the orbit will not prevent a 15-year Chandra mis-sion; they will, however, bring some challenges.
5/10/2018 Chandra X-ray Observatory Newsletter 2008 - slidepdf.com
http://slidepdf.com/reader/full/chandra-x-ray-observatory-newsletter-2008 22/52
22 CXC Newsletter
A summary of findings from analysis of the 15-yearorbit is provided below:• Eclipse Times
* All eclipses will be well within the capabili-ties of the vehicle* Eclipse seasons will get longer, but will notimpact observing time
• Communications
* Largely unchanged, no observing impact* Some reduction in redundancy of coverage
• Radiation Zones* Low perigee altitude and increasing inclina-tion will change radiation environment in theradiation zone* Potential to gain science time every orbit
• Perigee Attitude Planning
* Low perigee altitude will cause increasedgravity gradient torques, which, unaccountedfor, can lead to high system angular momen-tum. Mitigation plans are underway and Chan-
dra’s safing system will prevent hardwaredamage, should the momentum reach elevatedlevels.* Low perigee altitude and changing radiationzones will reduce flexibility in attitude selec-tion through perigee* Reduced flexibility through radiation zonesmay reduce ability to prepare for some typesof observations. Benefits from constraint man-agement activities (see Science Return section)should mitigate this potential impact.
Vehicle Health
The Chandra spacecraft is in remarkably good
condition for a vehicle eight years into its mission.To date, there have been no unit failures that impactthe capabilities of the mission. On vendor recom-mendation, one gyro was powered down to preserveits functionality for contingency operations; howev-er, multiple layers of redundancy remain. There areno current hardware issues that pose undue risk tothe prospects of a fifteen year mission.
The remaining spacecraft health issues relateto thermal conditions and trends. The protectivethermal surfaces on the -Z-side (sun side) of the
spacecraft have been slowly degrading over the mis-sion. Such degradation was anticipated pre-launch,but the rate has been higher than expected. It is ex-pected that the degradation will continue, but thatthe rate will slow.
As the passive thermal controls degrade, com-ponents on the sun side of the vehicle are increasing-ly impacted by solar heating. Scheduling constraintshave been imposed to reduce the exposure of certain
FIGURE 17: Changing shape of theChandra orbit
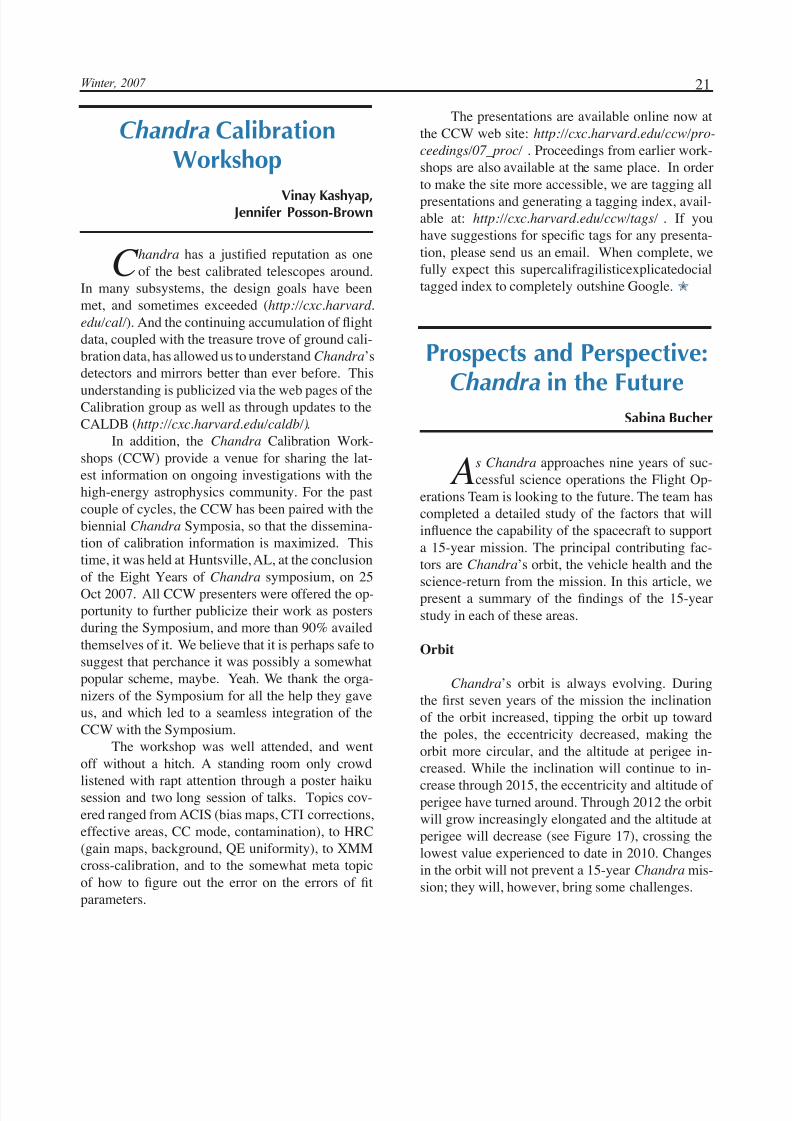
FIGURE 18: Schematic of the Chandra spacecraft showing units with thermal con-straints or concerns
5/10/2018 Chandra X-ray Observatory Newsletter 2008 - slidepdf.com
http://slidepdf.com/reader/full/chandra-x-ray-observatory-newsletter-2008 23/52
23Winter, 2007
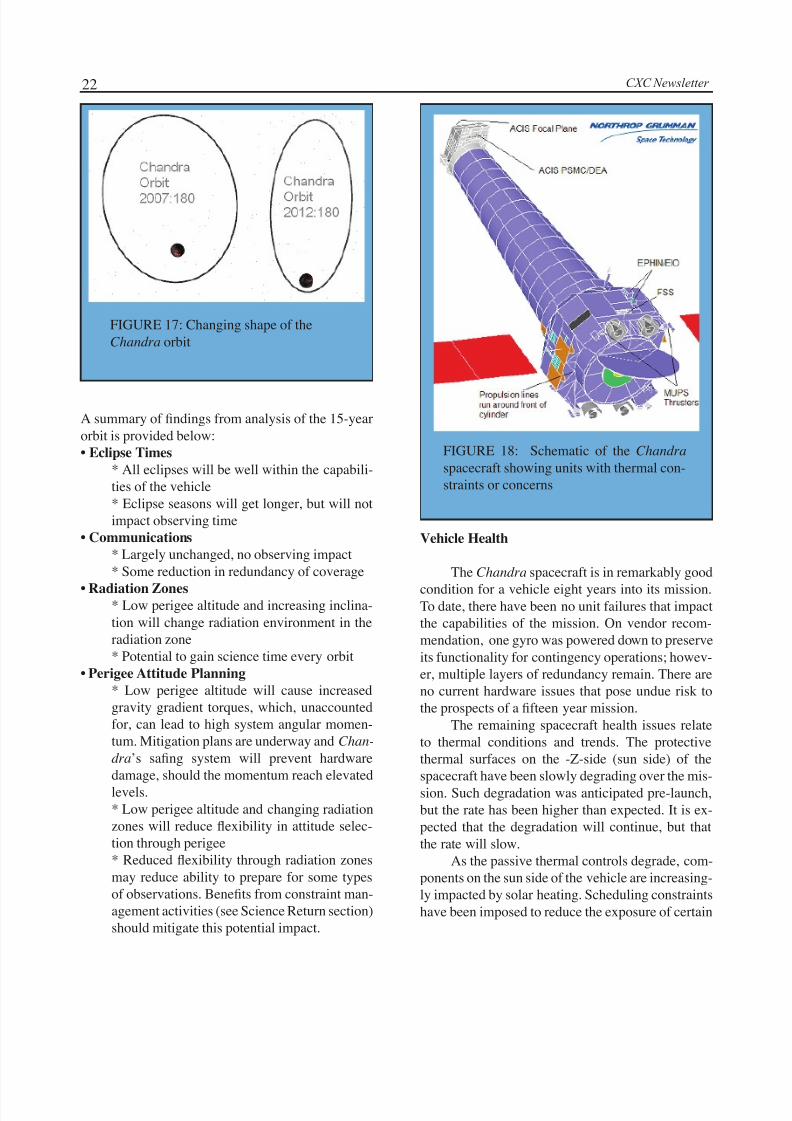
units to extreme temperatures. Figures 18 and 19show the components that have current thermal con-cerns and the pitch regions impacted by them. It isanticipated that scheduling constraints will continueto mitigate most -Z-side heating effects. There are
three notable exceptions: (1) the time constant of theFine Sun Sensor (FSS), used only in safing modes,is too fast for scheduling constraints to feasibly limittemperatures; (2) the temperature of the ACIS FocalPlane could be mitigated through scheduling con-straints, but alternative mitigations are being inves-tigated first; (3) the restrictions required to keep thetemperatures of the EPHIN radiation detector andits electronics (EIO) within limits have been relaxedto increase scheduling flexibility. Based on vendorinput, it is fully expected that the FSS will operateabove the currently established operational limits.However, since it is part of the spacecraft safing sys-tem, preparations for increased performance moni-toring and for operations without it are underway.EPHIN is currently operating acceptably at elevatedtemperatures, but some performance impacts havebeen observed when the unit is at high temperatures.The Flight Software has been modified such that, inthe event that EPHIN fails, the HRC can be usedas a radiation detector. Losing EPHIN would not be
without cost, but the mission can continue success-fully without it. Thermal issues will continue to im-pact scheduling and engineering effort, but there arecurrently no vehicle health concerns that jeopardizethe on-going mission.
Science Return
There are many factors that influence the sci-ence return of the mission, too many to discuss in asingle article. However, one, the ability to scheduleobservations, is a direct result of the orbit and ve-hicle health. Observation scheduling is governed bya set of constraints, which are used to protect thevehicle and to ensure each observation is scheduledfor maximum science quality. Constraints comefrom three sources, the design of the vehicle, ob-servation requests, and vehicle aging. With multiplesources for constraints, it is not hard to imagine thatthe scheduling problem could become over-con-strained. This occurred in late 2004, when efforts toprotect EPHIN and the propulsion lines forced split-ting observations into pieces with large maneuversbetween them.
There are two metrics used to measure sched-uling ability: (1) the ability to schedule any one ob-
Figure 19: Summary of thermal constraints and concerns by pitch region
5/10/2018 Chandra X-ray Observatory Newsletter 2008 - slidepdf.com
http://slidepdf.com/reader/full/chandra-x-ray-observatory-newsletter-2008 24/52
24 CXC Newsletter
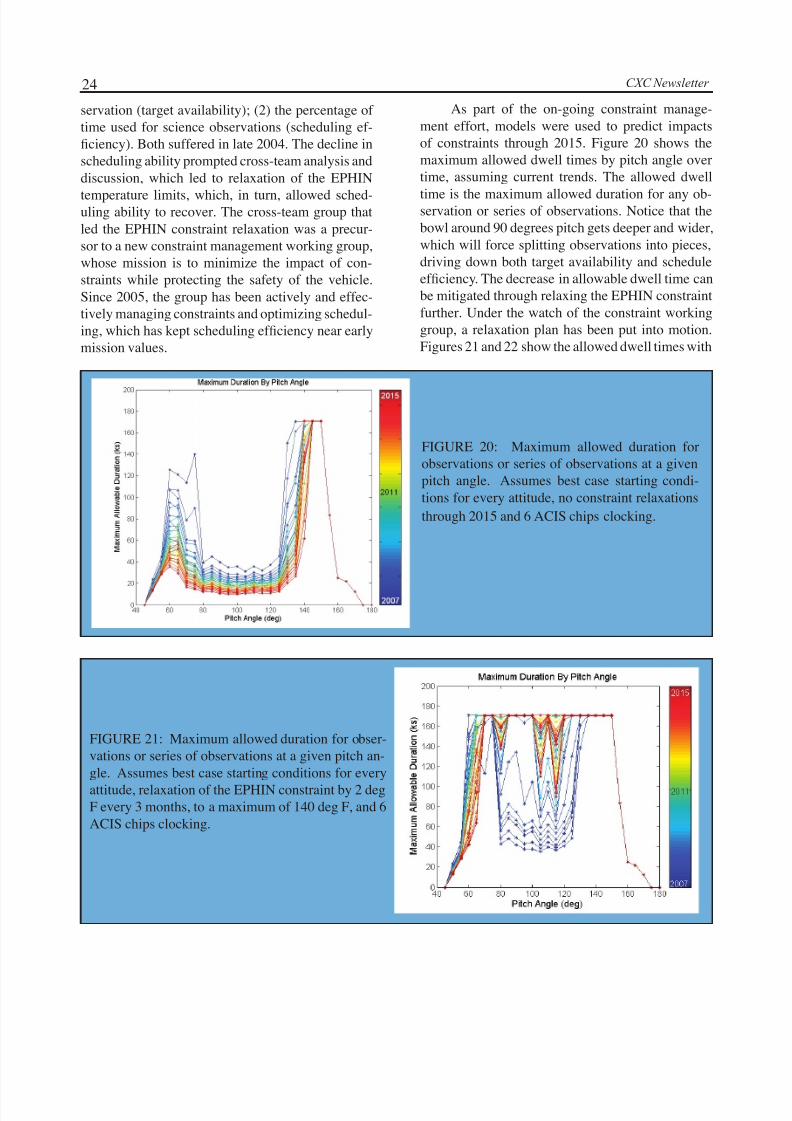
FIGURE 21: Maximum allowed duration for obser-vations or series of observations at a given pitch an-gle. Assumes best case starting conditions for everyattitude, relaxation of the EPHIN constraint by 2 degF every 3 months, to a maximum of 140 deg F, and 6ACIS chips clocking.
FIGURE 20: Maximum allowed duration forobservations or series of observations at a givenpitch angle. Assumes best case starting condi-tions for every attitude, no constraint relaxationsthrough 2015 and 6 ACIS chips clocking.
servation (target availability); (2) the percentage of time used for science observations (scheduling ef-ficiency). Both suffered in late 2004. The decline inscheduling ability prompted cross-team analysis anddiscussion, which led to relaxation of the EPHIN
temperature limits, which, in turn, allowed sched-uling ability to recover. The cross-team group thatled the EPHIN constraint relaxation was a precur-sor to a new constraint management working group,whose mission is to minimize the impact of con-straints while protecting the safety of the vehicle.Since 2005, the group has been actively and effec-tively managing constraints and optimizing schedul-ing, which has kept scheduling efficiency near earlymission values.
As part of the on-going constraint manage-ment effort, models were used to predict impactsof constraints through 2015. Figure 20 shows themaximum allowed dwell times by pitch angle overtime, assuming current trends. The allowed dwell
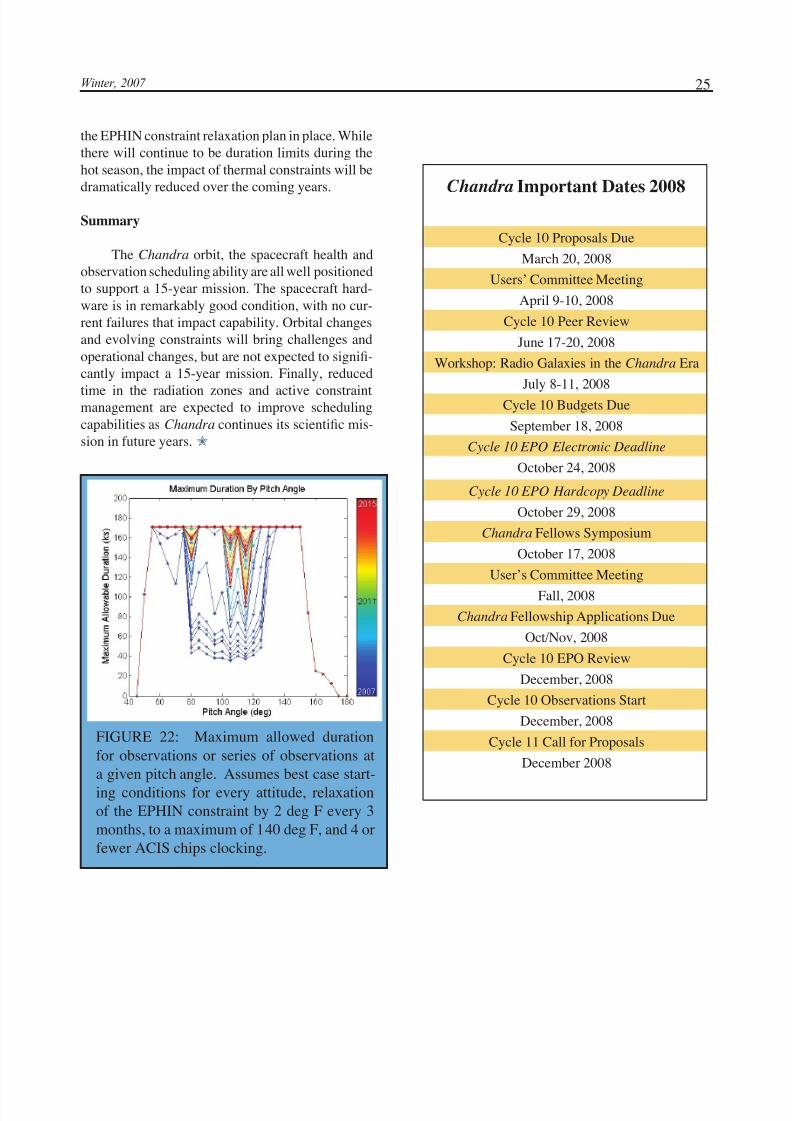
time is the maximum allowed duration for any ob-servation or series of observations. Notice that thebowl around 90 degrees pitch gets deeper and wider,which will force splitting observations into pieces,driving down both target availability and scheduleefficiency. The decrease in allowable dwell time canbe mitigated through relaxing the EPHIN constraintfurther. Under the watch of the constraint workinggroup, a relaxation plan has been put into motion.Figures 21 and 22 show the allowed dwell times with
5/10/2018 Chandra X-ray Observatory Newsletter 2008 - slidepdf.com
http://slidepdf.com/reader/full/chandra-x-ray-observatory-newsletter-2008 25/52
25Winter, 2007
FIGURE 22: Maximum allowed durationfor observations or series of observations ata given pitch angle. Assumes best case start-ing conditions for every attitude, relaxationof the EPHIN constraint by 2 deg F every 3months, to a maximum of 140 deg F, and 4 orfewer ACIS chips clocking.
Chandra Important Dates 2008
Cycle 10 Proposals Due
March 20, 2008
Users’ Committee Meeting
April 9-10, 2008
Cycle 10 Peer Review
June 17-20, 2008
Workshop: Radio Galaxies in the Chandra Era
July 8-11, 2008Cycle 10 Budgets Due
September 18, 2008
Cycle 10 EPO Electronic Deadline
October 24, 2008
Cycle 10 EPO Hardcopy Deadline
October 29, 2008
Chandra Fellows Symposium
October 17, 2008
User’s Committee Meeting
Fall, 2008
Chandra Fellowship Applications Due
Oct/Nov, 2008
Cycle 10 EPO Review
December, 2008
Cycle 10 Observations Start
December, 2008
Cycle 11 Call for Proposals
December 2008
the EPHIN constraint relaxation plan in place. Whilethere will continue to be duration limits during thehot season, the impact of thermal constraints will bedramatically reduced over the coming years.
Summary
The Chandra orbit, the spacecraft health andobservation scheduling ability are all well positionedto support a 15-year mission. The spacecraft hard-ware is in remarkably good condition, with no cur-rent failures that impact capability. Orbital changesand evolving constraints will bring challenges andoperational changes, but are not expected to signifi-cantly impact a 15-year mission. Finally, reduced
time in the radiation zones and active constraintmanagement are expected to improve schedulingcapabilities as Chandra continues its scientific mis-sion in future years. ✮
5/10/2018 Chandra X-ray Observatory Newsletter 2008 - slidepdf.com
http://slidepdf.com/reader/full/chandra-x-ray-observatory-newsletter-2008 26/52
26 CXC Newsletter
New ObsVis Functionality!
Paul Green
T he ObsVis tool for high-fidelity flexibledisplay of Chandra instrument fields-of-
view (FoVs) on sky images has been significantlyrevised and upgraded, and its integration with theds9 image display tool improved. ObsVis allows forthe manipulation of the FoVs in a variety of ways,including adjusting the roll angle, adjusting the X,Y and SIM-Z offsets, and grouping FoVs together.The initial ObsVIs release in CIAO4 was supercededin February 2008 by a release CIAO4.0.1 that also
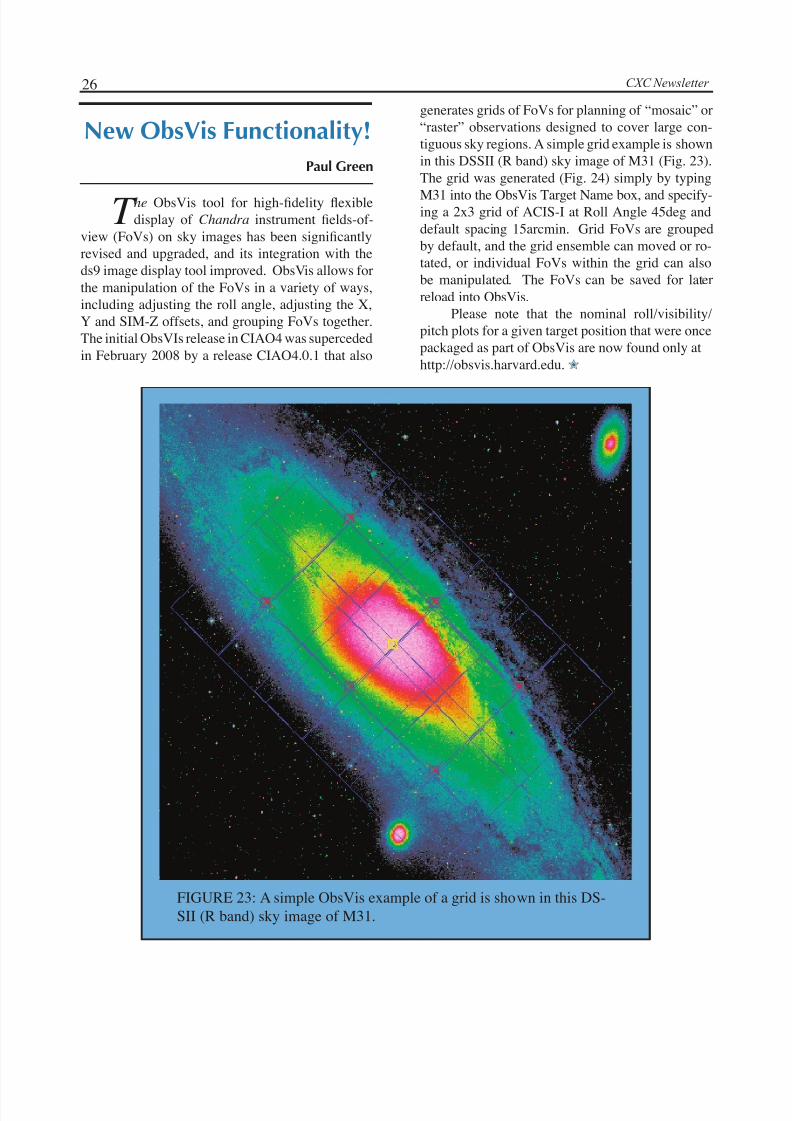
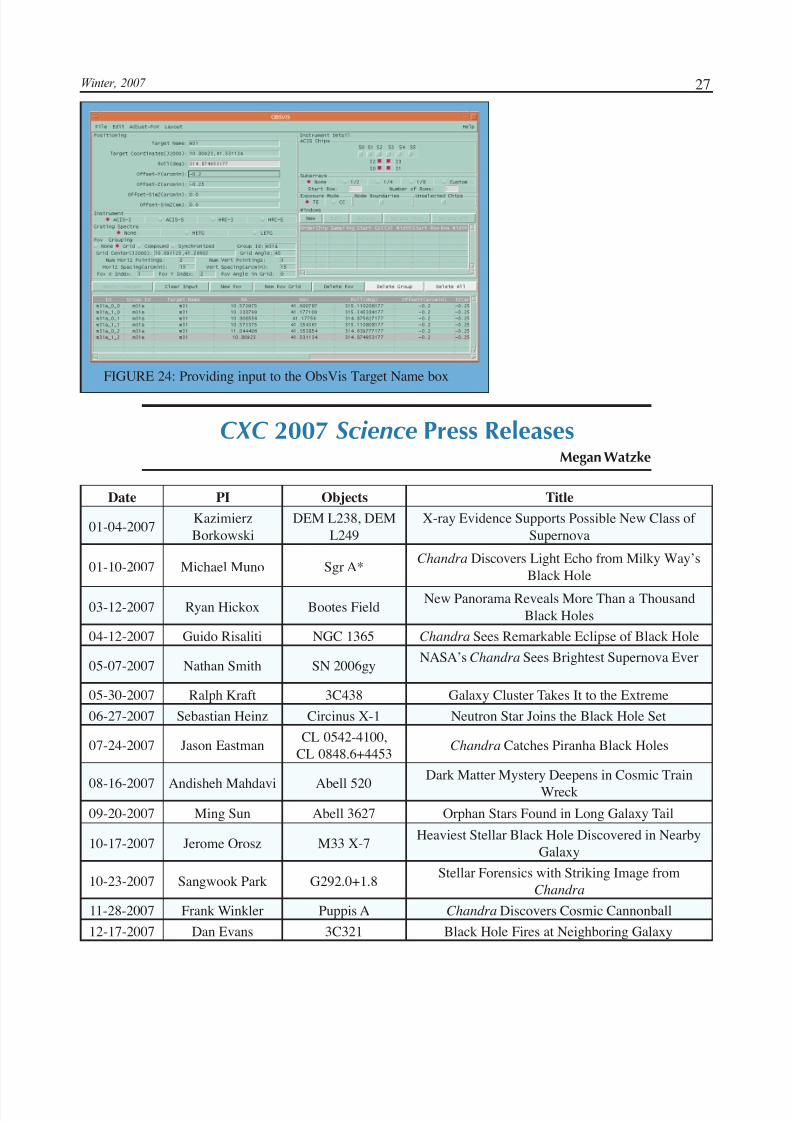
generates grids of FoVs for planning of “mosaic” or“raster” observations designed to cover large con-tiguous sky regions. A simple grid example is shownin this DSSII (R band) sky image of M31 (Fig. 23).The grid was generated (Fig. 24) simply by typing
M31 into the ObsVis Target Name box, and specify-ing a 2x3 grid of ACIS-I at Roll Angle 45deg anddefault spacing 15arcmin. Grid FoVs are groupedby default, and the grid ensemble can moved or ro-tated, or individual FoVs within the grid can alsobe manipulated. The FoVs can be saved for laterreload into ObsVis.
Please note that the nominal roll/visibility/pitch plots for a given target position that were oncepackaged as part of ObsVis are now found only athttp://obsvis.harvard.edu.✮
FIGURE 23: A simple ObsVis example of a grid is shown in this DS-SII (R band) sky image of M31.
5/10/2018 Chandra X-ray Observatory Newsletter 2008 - slidepdf.com
http://slidepdf.com/reader/full/chandra-x-ray-observatory-newsletter-2008 27/52
27Winter, 2007
FIGURE 24: Providing input to the ObsVis Target Name box
CXC 2007 Science Press ReleasesMegan Watzke
Date PI Objects Title
01-04-2007KazimierzBorkowski
DEM L238, DEML249
X-ray Evidence Supports Possible New Class of Supernova
01-10-2007 Michael Muno Sgr A*Chandra Discovers Light Echo from Milky Way’s
Black Hole
03-12-2007 Ryan Hickox Bootes FieldNew Panorama Reveals More Than a Thousand
Black Holes
04-12-2007 Guido Risaliti NGC 1365 Chandra Sees Remarkable Eclipse of Black Hole
05-07-2007 Nathan Smith SN 2006gyNASA’s Chandra Sees Brightest Supernova Ever
05-30-2007 Ralph Kraft 3C438 Galaxy Cluster Takes It to the Extreme
06-27-2007 Sebastian Heinz Circinus X-1 Neutron Star Joins the Black Hole Set
07-24-2007 Jason EastmanCL 0542-4100,
CL 0848.6+4453Chandra Catches Piranha Black Holes
08-16-2007 Andisheh Mahdavi Abell 520Dark Matter Mystery Deepens in Cosmic Train
Wreck
09-20-2007 Ming Sun Abell 3627 Orphan Stars Found in Long Galaxy Tail
10-17-2007 Jerome Orosz M33 X-7Heaviest Stellar Black Hole Discovered in Nearby
Galaxy
10-23-2007 Sangwook Park G292.0+1.8Stellar Forensics with Striking Image from
Chandra
11-28-2007 Frank Winkler Puppis A Chandra Discovers Cosmic Cannonball
12-17-2007 Dan Evans 3C321 Black Hole Fires at Neighboring Galaxy
5/10/2018 Chandra X-ray Observatory Newsletter 2008 - slidepdf.com
http://slidepdf.com/reader/full/chandra-x-ray-observatory-newsletter-2008 28/52
28 CXC Newsletter
Hosted by the Chandra X-ray Center
Cambridge, Massachusetts July 8-11, 2008
Workshop Goals:
Registration and Abstract Submission Deadline:
Chandra has profoundly influenced our understanding of a wide range of astrophysicalphenomena, but one area in which Chandra's influence has arguably been the greatest isinthestudyofradiogalaxiesandradioloudquasars.
Thesuperb angular resolutionof Chandra permits themulticomponentemission fromradiogalaxies to be spatially separated and has given us insights into the accretion and outf lowprocesses. In many cases,however, thewealthof newdata hasprovoked more questionsthan answers. This conference will highlight both theoretical and observational studies of all aspects of radio galaxies including nuclei, jets, lobes, hot spots, and interactions withtheambientmedium.
The goals are to bring together a diverse group of researchers to present the latest resultsanddiscuss theoutstanding problems in radio galaxyphysics, andbest decidehow to usetheunique capabilities ofChandra goingforwardto resolve theoutstandingissues.
Radio Galaxies
in the Chandra Era
Radio Galaxies
in the Chandra Era
Contact: [email protected] Organizing CommitteePaul Green (Chair)Kathlyne Jean, Cathy Oskin,Lisa Paton, Su Tuttle http://cxc.harvard.edu/radiogals08
Chairs: RalphKraft andAneta SiemiginowskaElizabethBlanton (BU)Geoff Bicknell (Stromlo)
AnnalisaCelotti (SISSA)JeanEilek(NRAO/NMIMT)DanEvans(Harvard)HeinoFalcke (Radboud)PaulGreen(SAO)MartinHardcastle (Hertfordshire)
Scientific Organizing Committee:
DanHarris(SAO)SebastianHeinz(UWisc)Jun Kataoka (TokyoTech)
Herman Marshall (MIT)PaulNulsen (SAO)ChrisReynolds(UMd)Jeremy Sanders (IoA)DanSchwartz (SAO)MarekSikora (CAMK, Warsaw)
April 30 (talks and posters)
May 21 (posters only)
5/10/2018 Chandra X-ray Observatory Newsletter 2008 - slidepdf.com
http://slidepdf.com/reader/full/chandra-x-ray-observatory-newsletter-2008 29/52
29Winter, 2007
CIAO 4.0 Overview
Elizabeth Gallefor the CIAO development team
T he Chandra X-Ray Center introduced ver-sion 4.0 of the Chandra Interactive Analy-
sis of Observations (CIAO) software package on 14December 2007. A small patch version 4.0.1 wasreleased on February 22, 2008.
CALDB version 3.4.2 was also released on 14December 2007. CALDB 3.4.0 or higher is requiredfor the proper operation of CIAO 4.0.
Everything is available for download from theCIAO website: http://cxc.harvard.edu/ciao/down-
load/ . The CXC is committed to helping users
transition to new syntax as smoothly as possible. If you have existing ChiPS or Sherpa scripts or savefiles, submit them to us via the CXC Helpdesk as wewill provide the CIAO 4.0 syntax to you.
Overview
CIAO 4.0 is a full installation of the CIAOsoftware. It contains all the enhancements and bugfixes since CIAO 3.4, including those which weremade available in the 4.0 Beta releases.
Since CIAO 4.0 is a major release with sev-eral new packages and applications, the CXC willcontinue to support CIAO 3.4 for the near future.We suggest that users who install CIAO 4.0 keep the
CIAO 3.4 installation available as well.
Read the “Why should I keep the CIAO 3.4installation on my system now that CIAO 4.0 is re-leased?” page for more information: http://cxc.har-
vard.edu/ciao/faq/keep_ciao34.html . In brief, bothChIPS and Sherpa have been re-written, which meansthat the syntax and the language have changed sinceCIAO 3.4. Some time and effort will be required by
users to learn the new system.
ACIS Dead Area Calibration
The most notable change to the CIAO tools inversion 4.0 is that the ACIS dead area correction isturned on by default. For complete details on thedead area correction, read the ACIS Dead Area Cor-rection why topic: http://cxc.harvard.edu/ciao/why/
acisdeadarea.html .
The following CIAO response tools and scriptscan apply the dead area correction: mkarf, mkinst-map, mkgarf, mkwarf, specextract, fullgarf, psex-tract, and acisspec. This change requires the use of an additional data product, the parameter block file(pbk0.fits), when running these tools.
If you have an analysis in progress and do notwant to apply the dead area correction, it is possibleto “turn off” the correction. To do so, set the dafileparameter to “NONE” and leave the pbkfile param-eter blank. For example:
unix% pset mkgarf pbkfile=”” dafile=NONE
Tools and Data Model
There is a new version of tgextract - named
tgextract2 - which provides similar functionality, butallows large and asymmetric regions for better de-termination of background counts. Significant workhas been done on the tool wavdetect, which has twonew parameters. The sso_freeze tool has been en-hanced so that it can create object-centered aspectsolutions which allows an object-centered exposuremap to be generated. A number of bug fixes to theData Model library and several CIAO tools are alsoincluded.
The Data Model library now supports anASCII kernel. This kernel allows users to gener-
ate ASCII format files for use within Data Modelenabled tools (e.g. dmlist, dmcopy), and apply thesuite of Data Model capabilities to those files via itsextended filename syntax. The ASCII kernel is con-sidered beta for this release. The “Using ASCII Filesin CIAO” thread gives an introduction to the newfunctionality: http://cxc.harvard.edu/ciao/threads/
dmascii_basic/ .
Parameter Files
The CIAO 4.0 software establishes a separatelocal parameter file directory, ~/cxcds_param4. Thisallows users to run both CIAO 3.4 and CIAO 4.0without having to worry about parameter file con-flicts.
ChIPS: the CIAO plotting package
The CIAO 4.0 release includes a new, morepowerful version of ChIPS, the CIAO plotting pack-
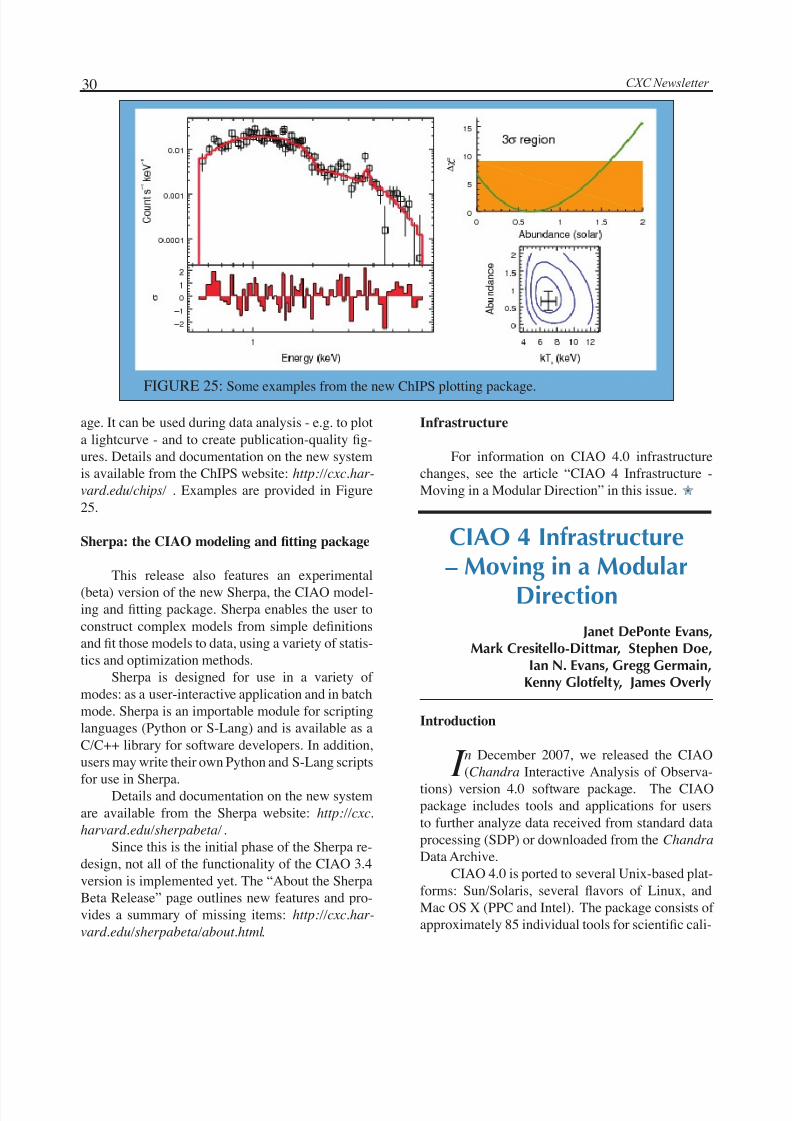
5/10/2018 Chandra X-ray Observatory Newsletter 2008 - slidepdf.com
http://slidepdf.com/reader/full/chandra-x-ray-observatory-newsletter-2008 30/52
30 CXC Newsletter
age. It can be used during data analysis - e.g. to plota lightcurve - and to create publication-quality fig-ures. Details and documentation on the new systemis available from the ChIPS website: http://cxc.har-
vard.edu/chips/ . Examples are provided in Figure25.
Sherpa: the CIAO modeling and fitting package
This release also features an experimental
(beta) version of the new Sherpa, the CIAO model-ing and fitting package. Sherpa enables the user toconstruct complex models from simple definitionsand fit those models to data, using a variety of statis-tics and optimization methods.
Sherpa is designed for use in a variety of modes: as a user-interactive application and in batchmode. Sherpa is an importable module for scriptinglanguages (Python or S-Lang) and is available as aC/C++ library for software developers. In addition,users may write their own Python and S-Lang scripts
for use in Sherpa.Details and documentation on the new systemare available from the Sherpa website: http://cxc.
harvard.edu/sherpabeta/ .Since this is the initial phase of the Sherpa re-
design, not all of the functionality of the CIAO 3.4version is implemented yet. The “About the SherpaBeta Release” page outlines new features and pro-vides a summary of missing items: http://cxc.har-
vard.edu/sherpabeta/about.html .
FIGURE 25: Some examples from the new ChIPS plotting package.
CIAO 4 Infrastructure– Moving in a Modular
DirectionJanet DePonte Evans,
Mark Cresitello-Dittmar, Stephen Doe,Ian N. Evans, Gregg Germain,
Kenny Glotfelty, James Overly
Introduction
I
n December 2007, we released the CIAO(Chandra Interactive Analysis of Observa-
tions) version 4.0 software package. The CIAOpackage includes tools and applications for usersto further analyze data received from standard dataprocessing (SDP) or downloaded from the Chandra Data Archive.
CIAO 4.0 is ported to several Unix-based plat-forms: Sun/Solaris, several flavors of Linux, andMac OS X (PPC and Intel). The package consists of approximately 85 individual tools for scientific cali-
Infrastructure
For information on CIAO 4.0 infrastructurechanges, see the article “CIAO 4 Infrastructure -Moving in a Modular Direction” in this issue. ✮
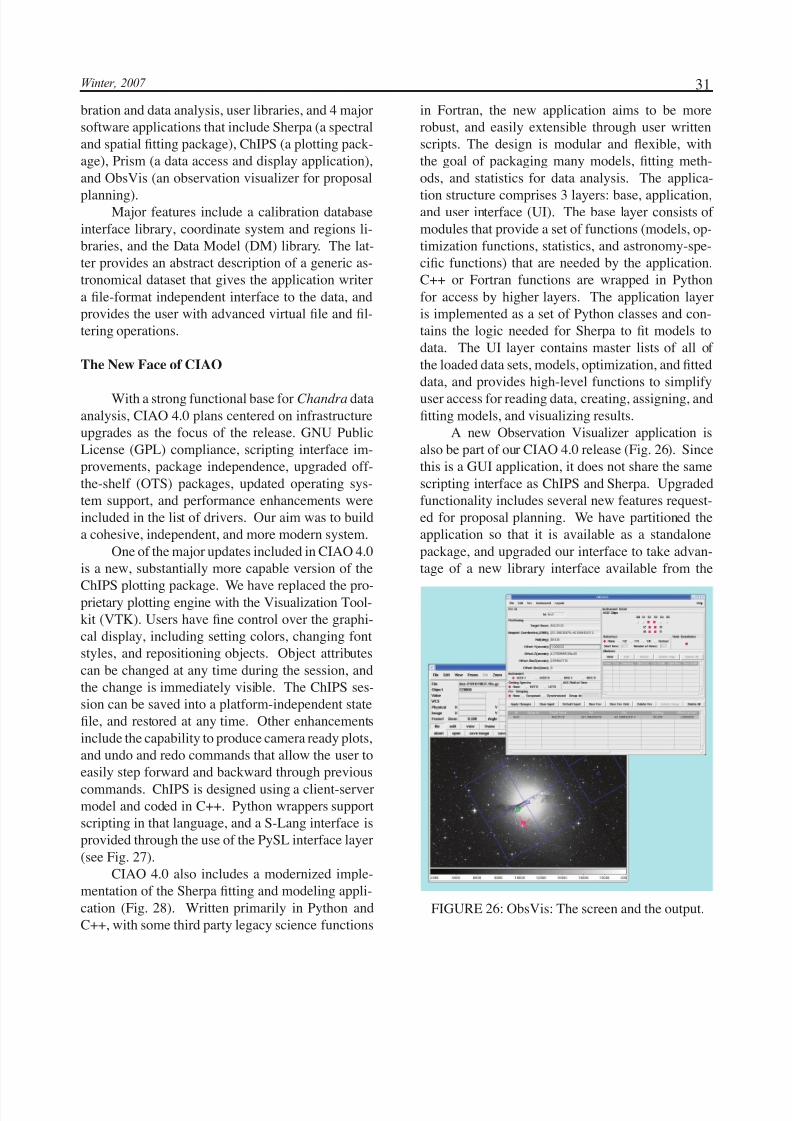
5/10/2018 Chandra X-ray Observatory Newsletter 2008 - slidepdf.com
http://slidepdf.com/reader/full/chandra-x-ray-observatory-newsletter-2008 31/52
31Winter, 2007
bration and data analysis, user libraries, and 4 majorsoftware applications that include Sherpa (a spectraland spatial fitting package), ChIPS (a plotting pack-age), Prism (a data access and display application),and ObsVis (an observation visualizer for proposal
planning).Major features include a calibration database
interface library, coordinate system and regions li-braries, and the Data Model (DM) library. The lat-ter provides an abstract description of a generic as-tronomical dataset that gives the application writera file-format independent interface to the data, andprovides the user with advanced virtual file and fil-tering operations.
The New Face of CIAO
With a strong functional base for Chandra dataanalysis, CIAO 4.0 plans centered on infrastructureupgrades as the focus of the release. GNU PublicLicense (GPL) compliance, scripting interface im-provements, package independence, upgraded off-the-shelf (OTS) packages, updated operating sys-tem support, and performance enhancements wereincluded in the list of drivers. Our aim was to builda cohesive, independent, and more modern system.
One of the major updates included in CIAO 4.0is a new, substantially more capable version of the
ChIPS plotting package. We have replaced the pro-prietary plotting engine with the Visualization Tool-kit (VTK). Users have fine control over the graphi-cal display, including setting colors, changing fontstyles, and repositioning objects. Object attributescan be changed at any time during the session, andthe change is immediately visible. The ChIPS ses-sion can be saved into a platform-independent statefile, and restored at any time. Other enhancementsinclude the capability to produce camera ready plots,and undo and redo commands that allow the user toeasily step forward and backward through previouscommands. ChIPS is designed using a client-servermodel and coded in C++. Python wrappers supportscripting in that language, and a S-Lang interface isprovided through the use of the PySL interface layer(see Fig. 27).
CIAO 4.0 also includes a modernized imple-mentation of the Sherpa fitting and modeling appli-cation (Fig. 28). Written primarily in Python andC++, with some third party legacy science functions
in Fortran, the new application aims to be morerobust, and easily extensible through user writtenscripts. The design is modular and flexible, withthe goal of packaging many models, fitting meth-ods, and statistics for data analysis. The applica-
tion structure comprises 3 layers: base, application,and user interface (UI). The base layer consists of modules that provide a set of functions (models, op-timization functions, statistics, and astronomy-spe-cific functions) that are needed by the application.C++ or Fortran functions are wrapped in Pythonfor access by higher layers. The application layeris implemented as a set of Python classes and con-tains the logic needed for Sherpa to fit models todata. The UI layer contains master lists of all of the loaded data sets, models, optimization, and fitteddata, and provides high-level functions to simplifyuser access for reading data, creating, assigning, andfitting models, and visualizing results.
A new Observation Visualizer application isalso be part of our CIAO 4.0 release (Fig. 26). Sincethis is a GUI application, it does not share the samescripting interface as ChIPS and Sherpa. Upgradedfunctionality includes several new features request-ed for proposal planning. We have partitioned theapplication so that it is available as a standalonepackage, and upgraded our interface to take advan-tage of a new library interface available from the
FIGURE 26: ObsVis: The screen and the output.
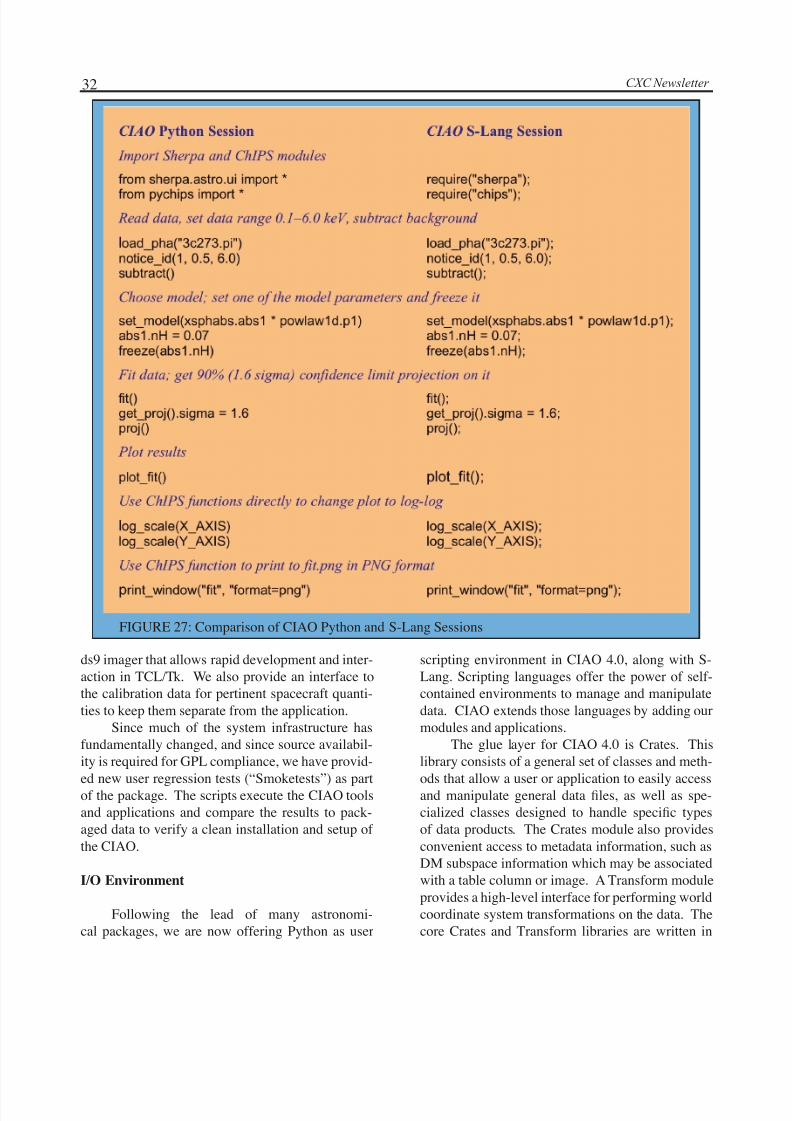
5/10/2018 Chandra X-ray Observatory Newsletter 2008 - slidepdf.com
http://slidepdf.com/reader/full/chandra-x-ray-observatory-newsletter-2008 32/52
32 CXC Newsletter
ds9 imager that allows rapid development and inter-action in TCL/Tk. We also provide an interface tothe calibration data for pertinent spacecraft quanti-ties to keep them separate from the application.
Since much of the system infrastructure hasfundamentally changed, and since source availabil-ity is required for GPL compliance, we have provid-
ed new user regression tests (“Smoketests”) as partof the package. The scripts execute the CIAO toolsand applications and compare the results to pack-aged data to verify a clean installation and setup of the CIAO.
I/O Environment
Following the lead of many astronomi-cal packages, we are now offering Python as user
scripting environment in CIAO 4.0, along with S-Lang. Scripting languages offer the power of self-contained environments to manage and manipulatedata. CIAO extends those languages by adding ourmodules and applications.
The glue layer for CIAO 4.0 is Crates. Thislibrary consists of a general set of classes and meth-
ods that allow a user or application to easily accessand manipulate general data files, as well as spe-cialized classes designed to handle specific typesof data products. The Crates module also providesconvenient access to metadata information, such asDM subspace information which may be associatedwith a table column or image. A Transform moduleprovides a high-level interface for performing worldcoordinate system transformations on the data. Thecore Crates and Transform libraries are written in
FIGURE 27: Comparison of CIAO Python and S-Lang Sessions
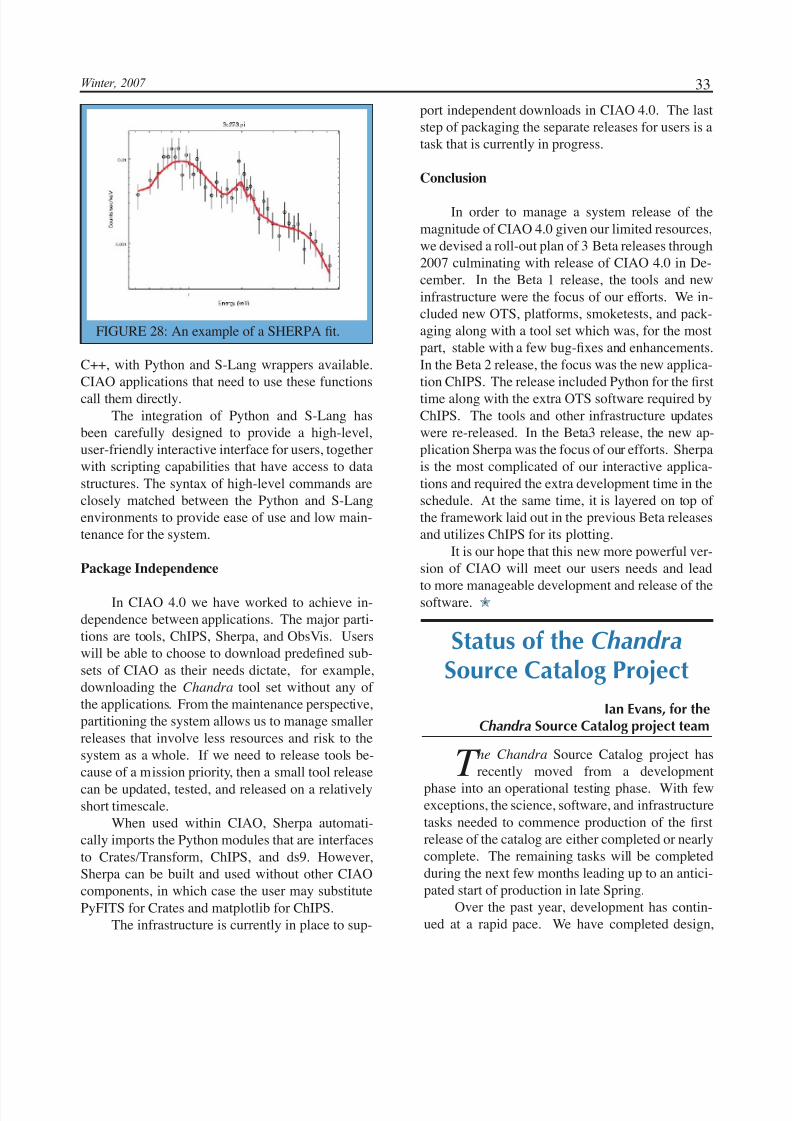
5/10/2018 Chandra X-ray Observatory Newsletter 2008 - slidepdf.com
http://slidepdf.com/reader/full/chandra-x-ray-observatory-newsletter-2008 33/52
33Winter, 2007
C++, with Python and S-Lang wrappers available.CIAO applications that need to use these functionscall them directly.
The integration of Python and S-Lang hasbeen carefully designed to provide a high-level,user-friendly interactive interface for users, togetherwith scripting capabilities that have access to datastructures. The syntax of high-level commands areclosely matched between the Python and S-Langenvironments to provide ease of use and low main-tenance for the system.
Package Independence
In CIAO 4.0 we have worked to achieve in-dependence between applications. The major parti-tions are tools, ChIPS, Sherpa, and ObsVis. Userswill be able to choose to download predefined sub-sets of CIAO as their needs dictate, for example,downloading the Chandra tool set without any of the applications. From the maintenance perspective,partitioning the system allows us to manage smallerreleases that involve less resources and risk to thesystem as a whole. If we need to release tools be-cause of a mission priority, then a small tool releasecan be updated, tested, and released on a relativelyshort timescale.
When used within CIAO, Sherpa automati-cally imports the Python modules that are interfacesto Crates/Transform, ChIPS, and ds9. However,Sherpa can be built and used without other CIAOcomponents, in which case the user may substitutePyFITS for Crates and matplotlib for ChIPS.
The infrastructure is currently in place to sup-
FIGURE 28: An example of a SHERPA fit.
port independent downloads in CIAO 4.0. The laststep of packaging the separate releases for users is atask that is currently in progress.
Conclusion
In order to manage a system release of themagnitude of CIAO 4.0 given our limited resources,we devised a roll-out plan of 3 Beta releases through2007 culminating with release of CIAO 4.0 in De-cember. In the Beta 1 release, the tools and newinfrastructure were the focus of our efforts. We in-cluded new OTS, platforms, smoketests, and pack-aging along with a tool set which was, for the mostpart, stable with a few bug-fixes and enhancements.In the Beta 2 release, the focus was the new applica-tion ChIPS. The release included Python for the firsttime along with the extra OTS software required byChIPS. The tools and other infrastructure updateswere re-released. In the Beta3 release, the new ap-plication Sherpa was the focus of our efforts. Sherpais the most complicated of our interactive applica-tions and required the extra development time in theschedule. At the same time, it is layered on top of the framework laid out in the previous Beta releasesand utilizes ChIPS for its plotting.
It is our hope that this new more powerful ver-sion of CIAO will meet our users needs and lead
to more manageable development and release of thesoftware. ✮
T
he Chandra Source Catalog project hasrecently moved from a development
phase into an operational testing phase. With fewexceptions, the science, software, and infrastructuretasks needed to commence production of the firstrelease of the catalog are either completed or nearlycomplete. The remaining tasks will be completedduring the next few months leading up to an antici-pated start of production in late Spring.
Over the past year, development has contin-ued at a rapid pace. We have completed design,
Status of the Chandra Source Catalog Project
Ian Evans, for theChandra Source Catalog project team
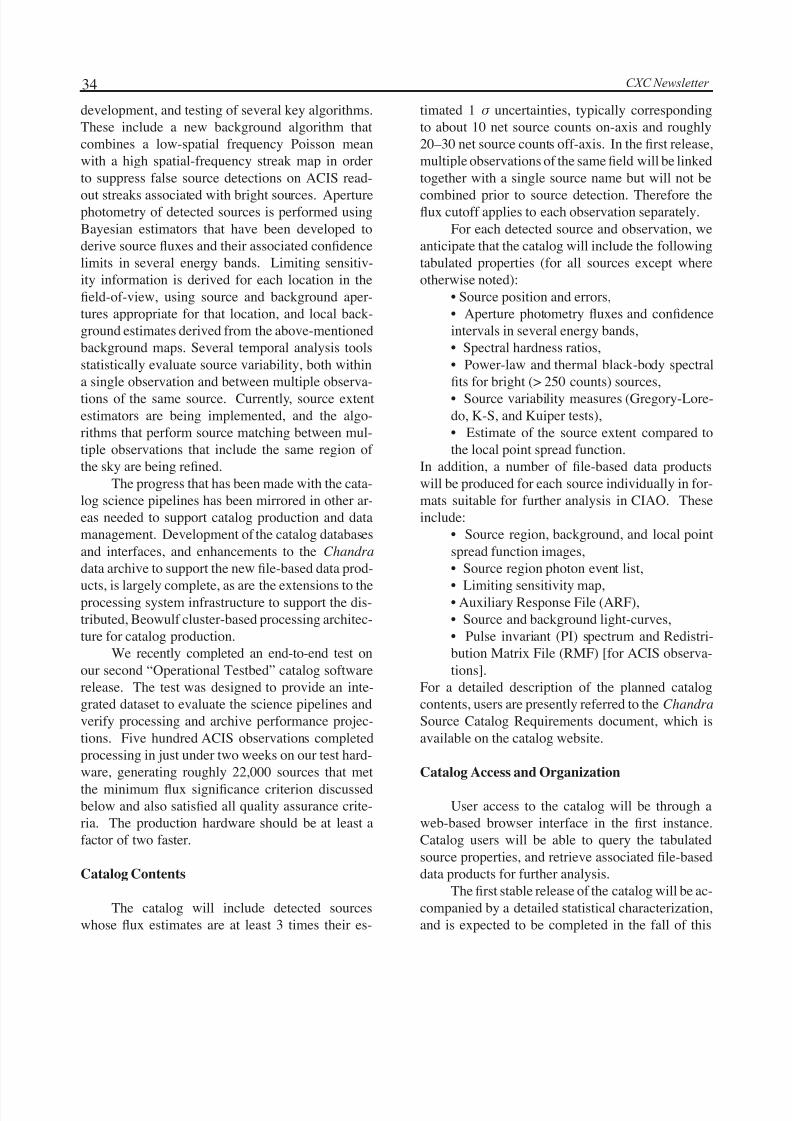
5/10/2018 Chandra X-ray Observatory Newsletter 2008 - slidepdf.com
http://slidepdf.com/reader/full/chandra-x-ray-observatory-newsletter-2008 34/52
34 CXC Newsletter
development, and testing of several key algorithms.These include a new background algorithm thatcombines a low-spatial frequency Poisson meanwith a high spatial-frequency streak map in orderto suppress false source detections on ACIS read-
out streaks associated with bright sources. Aperturephotometry of detected sources is performed usingBayesian estimators that have been developed toderive source fluxes and their associated confidencelimits in several energy bands. Limiting sensitiv-ity information is derived for each location in thefield-of-view, using source and background aper-tures appropriate for that location, and local back-ground estimates derived from the above-mentionedbackground maps. Several temporal analysis toolsstatistically evaluate source variability, both withina single observation and between multiple observa-tions of the same source. Currently, source extentestimators are being implemented, and the algo-rithms that perform source matching between mul-tiple observations that include the same region of the sky are being refined.
The progress that has been made with the cata-log science pipelines has been mirrored in other ar-eas needed to support catalog production and datamanagement. Development of the catalog databasesand interfaces, and enhancements to the Chandra data archive to support the new file-based data prod-
ucts, is largely complete, as are the extensions to theprocessing system infrastructure to support the dis-tributed, Beowulf cluster-based processing architec-ture for catalog production.
We recently completed an end-to-end test onour second “Operational Testbed” catalog softwarerelease. The test was designed to provide an inte-grated dataset to evaluate the science pipelines andverify processing and archive performance projec-tions. Five hundred ACIS observations completedprocessing in just under two weeks on our test hard-ware, generating roughly 22,000 sources that metthe minimum flux significance criterion discussedbelow and also satisfied all quality assurance crite-ria. The production hardware should be at least afactor of two faster.
Catalog Contents
The catalog will include detected sourceswhose flux estimates are at least 3 times their es-
timated 1 σ uncertainties, typically correspondingto about 10 net source counts on-axis and roughly20–30 net source counts off-axis. In the first release,multiple observations of the same field will be linkedtogether with a single source name but will not be
combined prior to source detection. Therefore theflux cutoff applies to each observation separately.
For each detected source and observation, weanticipate that the catalog will include the followingtabulated properties (for all sources except whereotherwise noted):
• Source position and errors,• Aperture photometry fluxes and confidenceintervals in several energy bands,• Spectral hardness ratios,• Power-law and thermal black-body spectralfits for bright (> 250 counts) sources,• Source variability measures (Gregory-Lore-do, K-S, and Kuiper tests),• Estimate of the source extent compared tothe local point spread function.
In addition, a number of file-based data productswill be produced for each source individually in for-mats suitable for further analysis in CIAO. Theseinclude:
• Source region, background, and local pointspread function images,• Source region photon event list,
• Limiting sensitivity map,• Auxiliary Response File (ARF),• Source and background light-curves,• Pulse invariant (PI) spectrum and Redistri-bution Matrix File (RMF) [for ACIS observa-tions].
For a detailed description of the planned catalogcontents, users are presently referred to the Chandra Source Catalog Requirements document, which isavailable on the catalog website.
Catalog Access and Organization
User access to the catalog will be through aweb-based browser interface in the first instance.Catalog users will be able to query the tabulatedsource properties, and retrieve associated file-baseddata products for further analysis.
The first stable release of the catalog will be ac-companied by a detailed statistical characterization,and is expected to be completed in the fall of this
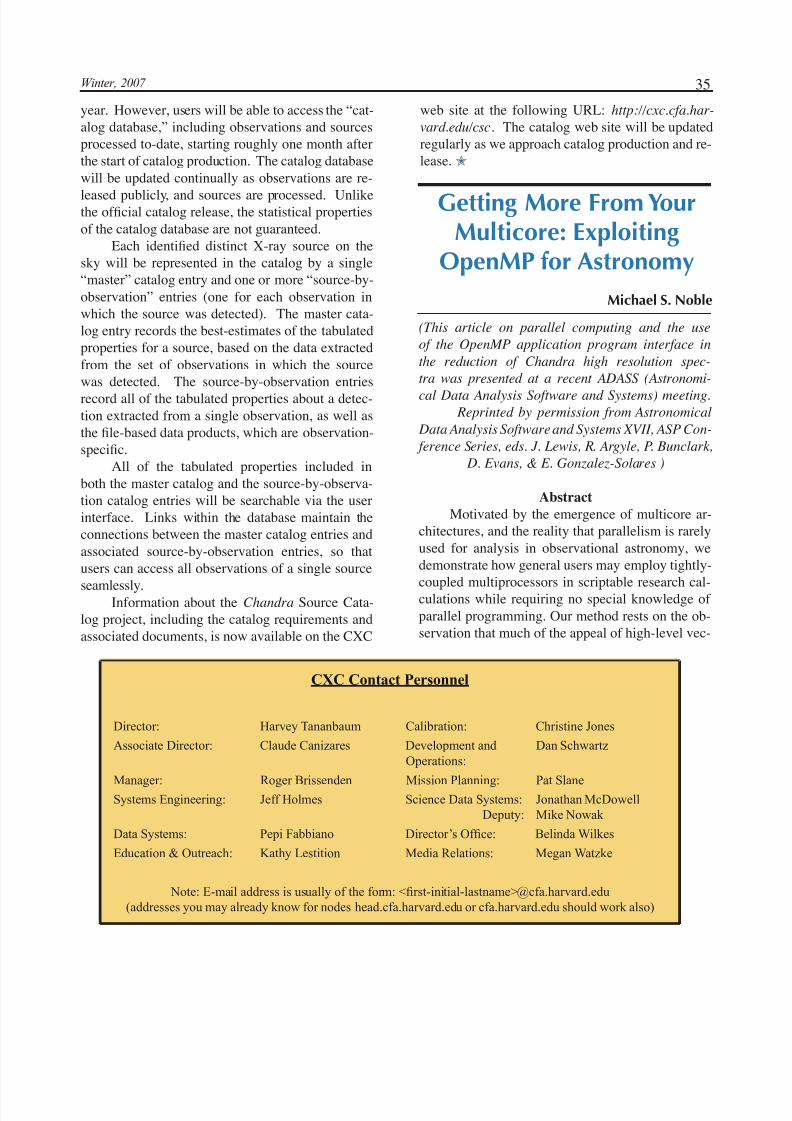
5/10/2018 Chandra X-ray Observatory Newsletter 2008 - slidepdf.com
http://slidepdf.com/reader/full/chandra-x-ray-observatory-newsletter-2008 35/52
35Winter, 2007
CXC Contact Personnel
Director: Harvey Tananbaum Calibration: Christine Jones
Associate Director: Claude Canizares Development and
Operations:
Dan Schwartz
Manager: Roger Brissenden Mission Planning: Pat SlaneSystems Engineering: Jeff Holmes Science Data Systems:
Deputy:
Jonathan McDowell
Mike Nowak
Data Systems: Pepi Fabbiano Director’s Office: Belinda Wilkes
Education & Outreach: Kathy Lestition Media Relations: Megan Watzke
Note: E-mail address is usually of the form: <first-initial-lastname>@cfa.harvard.edu
(addresses you may already know for nodes head.cfa.harvard.edu or cfa.harvard.edu should work also)
year. However, users will be able to access the “cat-alog database,” including observations and sourcesprocessed to-date, starting roughly one month afterthe start of catalog production. The catalog databasewill be updated continually as observations are re-
leased publicly, and sources are processed. Unlikethe official catalog release, the statistical propertiesof the catalog database are not guaranteed.
Each identified distinct X-ray source on thesky will be represented in the catalog by a single“master” catalog entry and one or more “source-by-observation” entries (one for each observation inwhich the source was detected). The master cata-log entry records the best-estimates of the tabulatedproperties for a source, based on the data extractedfrom the set of observations in which the sourcewas detected. The source-by-observation entriesrecord all of the tabulated properties about a detec-tion extracted from a single observation, as well asthe file-based data products, which are observation-specific.
All of the tabulated properties included inboth the master catalog and the source-by-observa-tion catalog entries will be searchable via the userinterface. Links within the database maintain theconnections between the master catalog entries andassociated source-by-observation entries, so thatusers can access all observations of a single source
seamlessly.Information about the Chandra Source Cata-log project, including the catalog requirements andassociated documents, is now available on the CXC
Getting More From YourMulticore: Exploiting
OpenMP for Astronomy
Michael S. Noble
(This article on parallel computing and the use
of the OpenMP application program interface in
the reduction of Chandra high resolution spec-
tra was presented at a recent ADASS (Astronomi-
cal Data Analysis Software and Systems) meeting. Reprinted by permission from Astronomical
Data Analysis Software and Systems XVII, ASP Con-
ference Series, eds. J. Lewis, R. Argyle, P. Bunclark,
D. Evans, & E. Gonzalez-Solares )
Abstract
Motivated by the emergence of multicore ar-chitectures, and the reality that parallelism is rarelyused for analysis in observational astronomy, wedemonstrate how general users may employ tightly-
coupled multiprocessors in scriptable research cal-culations while requiring no special knowledge of parallel programming. Our method rests on the ob-servation that much of the appeal of high-level vec-
web site at the following URL: http://cxc.cfa.har-
vard.edu/csc. The catalog web site will be updatedregularly as we approach catalog production and re-lease.✮
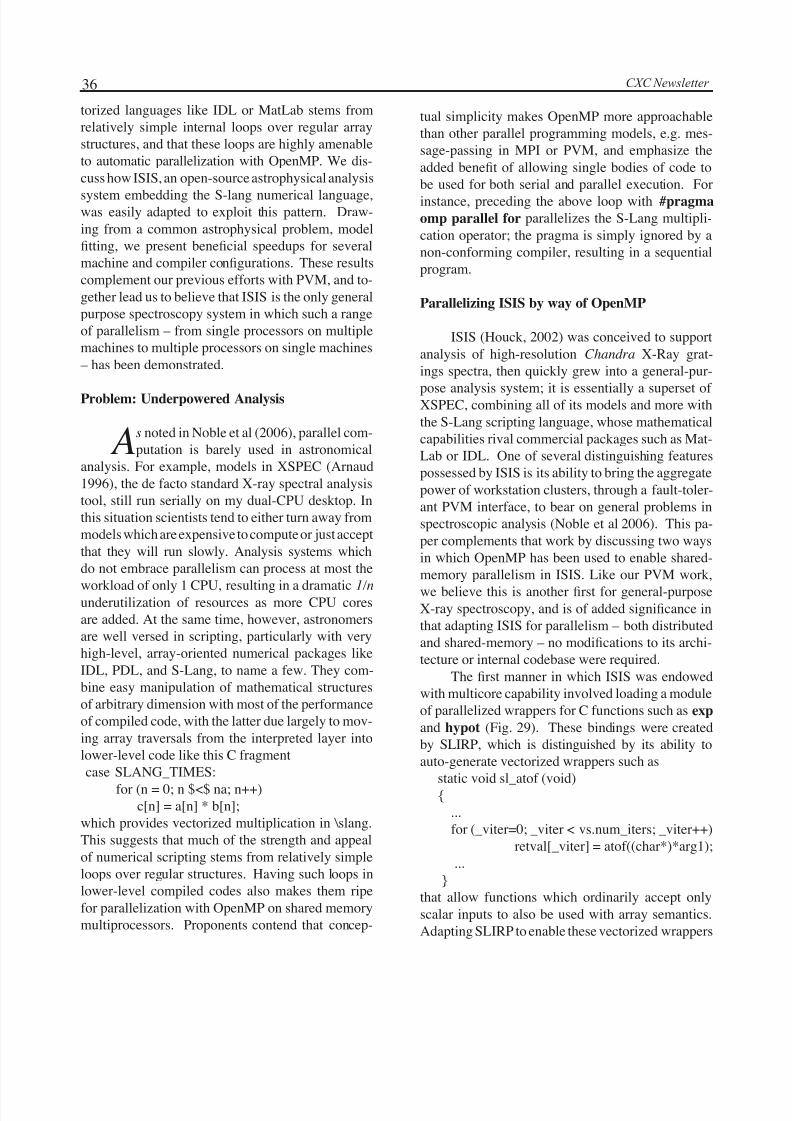
5/10/2018 Chandra X-ray Observatory Newsletter 2008 - slidepdf.com
http://slidepdf.com/reader/full/chandra-x-ray-observatory-newsletter-2008 36/52
36 CXC Newsletter
torized languages like IDL or MatLab stems fromrelatively simple internal loops over regular arraystructures, and that these loops are highly amenableto automatic parallelization with OpenMP. We dis-cuss how ISIS, an open-source astrophysical analysis
system embedding the S-lang numerical language,was easily adapted to exploit this pattern. Draw-ing from a common astrophysical problem, modelfitting, we present beneficial speedups for severalmachine and compiler configurations. These resultscomplement our previous efforts with PVM, and to-gether lead us to believe that ISIS is the only generalpurpose spectroscopy system in which such a rangeof parallelism – from single processors on multiplemachines to multiple processors on single machines – has been demonstrated.
Problem: Underpowered Analysis
As noted in Noble et al (2006), parallel com-putation is barely used in astronomical
analysis. For example, models in XSPEC (Arnaud1996), the de facto standard X-ray spectral analysistool, still run serially on my dual-CPU desktop. Inthis situation scientists tend to either turn away frommodels which are expensive to compute or just acceptthat they will run slowly. Analysis systems whichdo not embrace parallelism can process at most the
workload of only 1 CPU, resulting in a dramatic 1/nunderutilization of resources as more CPU coresare added. At the same time, however, astronomersare well versed in scripting, particularly with veryhigh-level, array-oriented numerical packages likeIDL, PDL, and S-Lang, to name a few. They com-bine easy manipulation of mathematical structuresof arbitrary dimension with most of the performanceof compiled code, with the latter due largely to mov-ing array traversals from the interpreted layer intolower-level code like this C fragmentcase SLANG_TIMES:
for (n = 0; n $<$ na; n++)c[n] = a[n] * b[n];
which provides vectorized multiplication in \slang.This suggests that much of the strength and appealof numerical scripting stems from relatively simpleloops over regular structures. Having such loops inlower-level compiled codes also makes them ripefor parallelization with OpenMP on shared memorymultiprocessors. Proponents contend that concep-
tual simplicity makes OpenMP more approachablethan other parallel programming models, e.g. mes-sage-passing in MPI or PVM, and emphasize theadded benefit of allowing single bodies of code tobe used for both serial and parallel execution. Forinstance, preceding the above loop with #pragma
omp parallel for parallelizes the S-Lang multipli-cation operator; the pragma is simply ignored by anon-conforming compiler, resulting in a sequentialprogram.
Parallelizing ISIS by way of OpenMP
ISIS (Houck, 2002) was conceived to supportanalysis of high-resolution Chandra X-Ray grat-ings spectra, then quickly grew into a general-pur-
pose analysis system; it is essentially a superset of XSPEC, combining all of its models and more withthe S-Lang scripting language, whose mathematicalcapabilities rival commercial packages such as Mat-Lab or IDL. One of several distinguishing featurespossessed by ISIS is its ability to bring the aggregatepower of workstation clusters, through a fault-toler-ant PVM interface, to bear on general problems inspectroscopic analysis (Noble et al 2006). This pa-per complements that work by discussing two waysin which OpenMP has been used to enable shared-memory parallelism in ISIS. Like our PVM work,
we believe this is another first for general-purposeX-ray spectroscopy, and is of added significance inthat adapting ISIS for parallelism – both distributedand shared-memory – no modifications to its archi-tecture or internal codebase were required.
The first manner in which ISIS was endowedwith multicore capability involved loading a moduleof parallelized wrappers for C functions such as exp
and hypot (Fig. 29). These bindings were createdby SLIRP, which is distinguished by its ability toauto-generate vectorized wrappers such as
static void sl_atof (void){...for (_viter=0; _viter < vs.num_iters; _viter++)
retval[_viter] = atof((char*)*arg1);...
}that allow functions which ordinarily accept onlyscalar inputs to also be used with array semantics.Adapting SLIRP to enable these vectorized wrappers
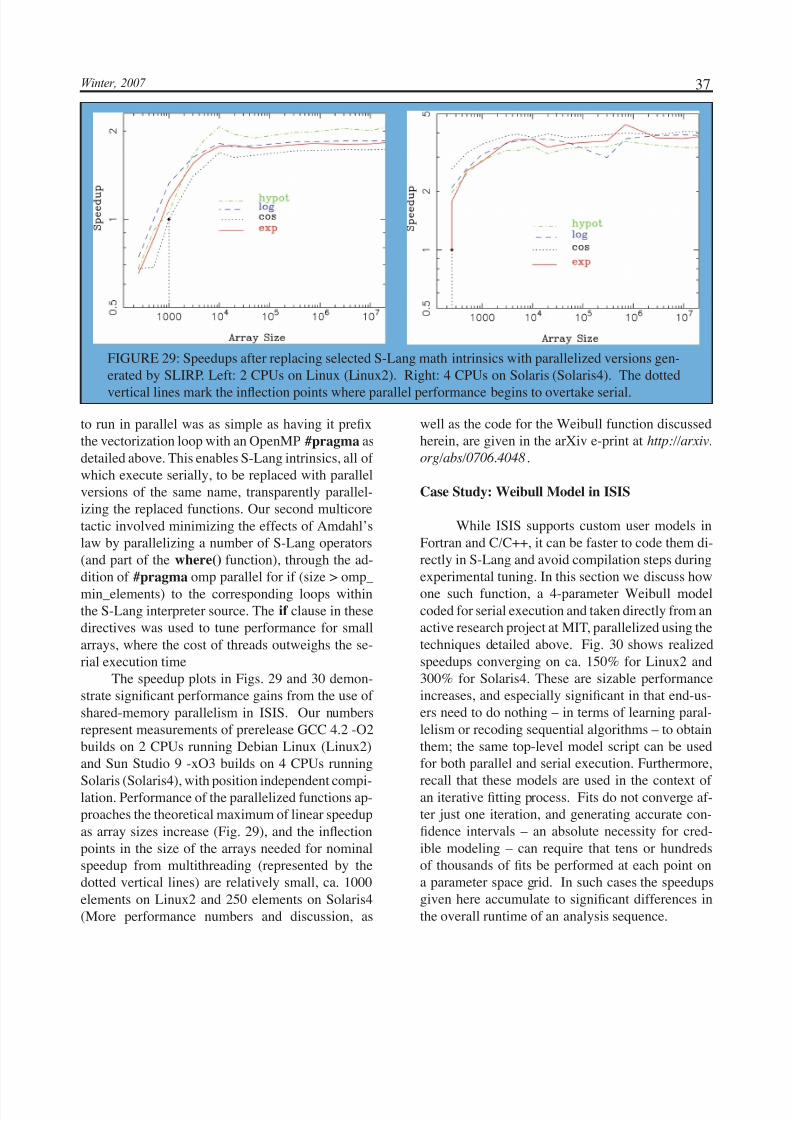
5/10/2018 Chandra X-ray Observatory Newsletter 2008 - slidepdf.com
http://slidepdf.com/reader/full/chandra-x-ray-observatory-newsletter-2008 37/52
37Winter, 2007
to run in parallel was as simple as having it prefixthe vectorization loop with an OpenMP #pragma asdetailed above. This enables S-Lang intrinsics, all of which execute serially, to be replaced with parallelversions of the same name, transparently parallel-izing the replaced functions. Our second multicoretactic involved minimizing the effects of Amdahl’slaw by parallelizing a number of S-Lang operators(and part of the where() function), through the ad-dition of #pragma omp parallel for if (size > omp_min_elements) to the corresponding loops withinthe S-Lang interpreter source. The if clause in thesedirectives was used to tune performance for smallarrays, where the cost of threads outweighs the se-rial execution time
The speedup plots in Figs. 29 and 30 demon-strate significant performance gains from the use of shared-memory parallelism in ISIS. Our numbersrepresent measurements of prerelease GCC 4.2 -O2builds on 2 CPUs running Debian Linux (Linux2)and Sun Studio 9 -xO3 builds on 4 CPUs running
Solaris (Solaris4), with position independent compi-lation. Performance of the parallelized functions ap-proaches the theoretical maximum of linear speedupas array sizes increase (Fig. 29), and the inflectionpoints in the size of the arrays needed for nominalspeedup from multithreading (represented by thedotted vertical lines) are relatively small, ca. 1000elements on Linux2 and 250 elements on Solaris4(More performance numbers and discussion, as
well as the code for the Weibull function discussedherein, are given in the arXiv e-print at http://arxiv.
org/abs/0706.4048 .
Case Study: Weibull Model in ISIS
While ISIS supports custom user models inFortran and C/C++, it can be faster to code them di-rectly in S-Lang and avoid compilation steps duringexperimental tuning. In this section we discuss howone such function, a 4-parameter Weibull modelcoded for serial execution and taken directly from anactive research project at MIT, parallelized using thetechniques detailed above. Fig. 30 shows realizedspeedups converging on ca. 150% for Linux2 and300% for Solaris4. These are sizable performanceincreases, and especially significant in that end-us-ers need to do nothing – in terms of learning paral-lelism or recoding sequential algorithms – to obtainthem; the same top-level model script can be usedfor both parallel and serial execution. Furthermore,
recall that these models are used in the context of an iterative fitting process. Fits do not converge af-ter just one iteration, and generating accurate con-fidence intervals – an absolute necessity for cred-ible modeling – can require that tens or hundredsof thousands of fits be performed at each point ona parameter space grid. In such cases the speedupsgiven here accumulate to significant differences inthe overall runtime of an analysis sequence.
FIGURE 29: Speedups after replacing selected S-Lang math intrinsics with parallelized versions gen-erated by SLIRP. Left: 2 CPUs on Linux (Linux2). Right: 4 CPUs on Solaris (Solaris4). The dotted
vertical lines mark the inflection points where parallel performance begins to overtake serial.
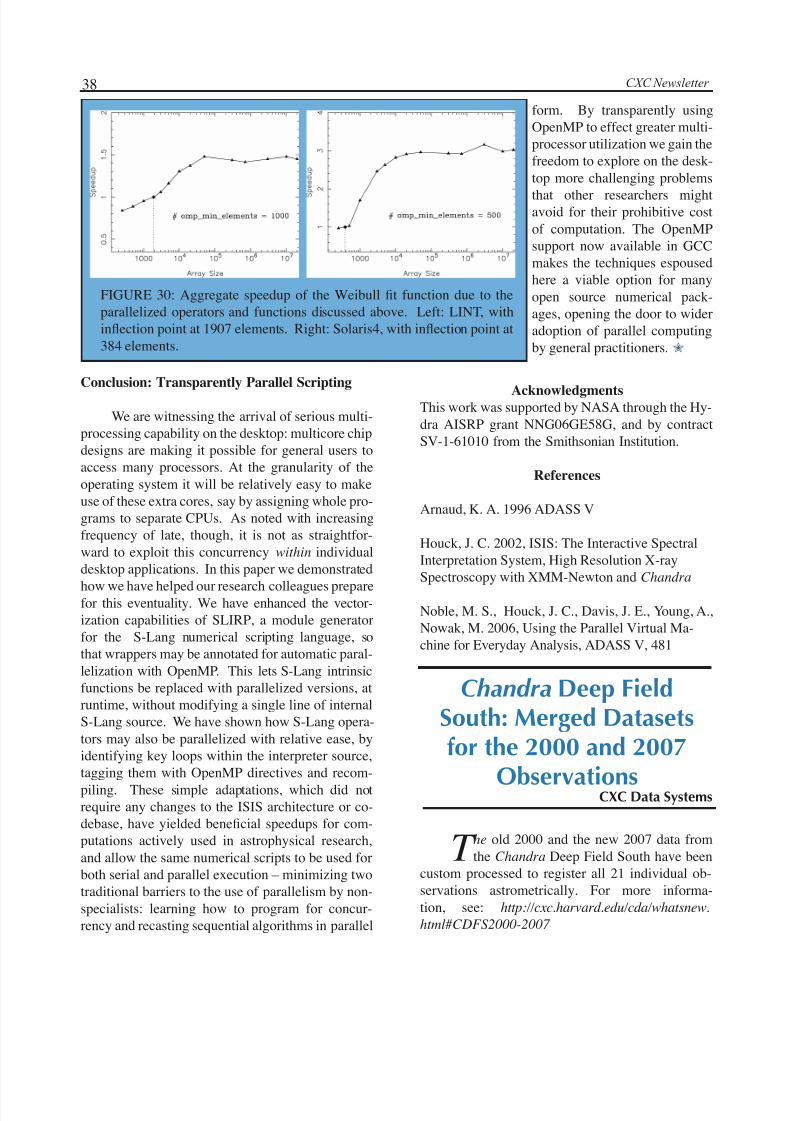
5/10/2018 Chandra X-ray Observatory Newsletter 2008 - slidepdf.com
http://slidepdf.com/reader/full/chandra-x-ray-observatory-newsletter-2008 38/52
38 CXC Newsletter
Conclusion: Transparently Parallel Scripting
We are witnessing the arrival of serious multi-processing capability on the desktop: multicore chipdesigns are making it possible for general users toaccess many processors. At the granularity of theoperating system it will be relatively easy to makeuse of these extra cores, say by assigning whole pro-grams to separate CPUs. As noted with increasingfrequency of late, though, it is not as straightfor-ward to exploit this concurrency within individualdesktop applications. In this paper we demonstrated
how we have helped our research colleagues preparefor this eventuality. We have enhanced the vector-ization capabilities of SLIRP, a module generatorfor the S-Lang numerical scripting language, sothat wrappers may be annotated for automatic paral-lelization with OpenMP. This lets S-Lang intrinsicfunctions be replaced with parallelized versions, atruntime, without modifying a single line of internalS-Lang source. We have shown how S-Lang opera-tors may also be parallelized with relative ease, byidentifying key loops within the interpreter source,tagging them with OpenMP directives and recom-piling. These simple adaptations, which did notrequire any changes to the ISIS architecture or co-debase, have yielded beneficial speedups for com-putations actively used in astrophysical research,and allow the same numerical scripts to be used forboth serial and parallel execution – minimizing twotraditional barriers to the use of parallelism by non-specialists: learning how to program for concur-rency and recasting sequential algorithms in parallel
form. By transparently usingOpenMP to effect greater multi-processor utilization we gain thefreedom to explore on the desk-top more challenging problems
that other researchers mightavoid for their prohibitive costof computation. The OpenMPsupport now available in GCCmakes the techniques espousedhere a viable option for manyopen source numerical pack-ages, opening the door to wideradoption of parallel computingby general practitioners. ✮
FIGURE 30: Aggregate speedup of the Weibull fit function due to theparallelized operators and functions discussed above. Left: LINT, withinflection point at 1907 elements. Right: Solaris4, with inflection point at384 elements.
Chandra Deep FieldSouth: Merged Datasetsfor the 2000 and 2007
ObservationsCXC Data Systems
T he old 2000 and the new 2007 data fromthe Chandra Deep Field South have been
custom processed to register all 21 individual ob-servations astrometrically. For more informa-tion, see: http://cxc.harvard.edu/cda/whatsnew.
html#CDFS2000-2007
AcknowledgmentsThis work was supported by NASA through the Hy-dra AISRP grant NNG06GE58G, and by contractSV-1-61010 from the Smithsonian Institution.
References
Arnaud, K. A. 1996 ADASS V
Houck, J. C. 2002, ISIS: The Interactive SpectralInterpretation System, High Resolution X-raySpectroscopy with XMM-Newton and Chandra
Noble, M. S., Houck, J. C., Davis, J. E., Young, A.,Nowak, M. 2006, Using the Parallel Virtual Ma-chine for Everyday Analysis, ADASS V, 481
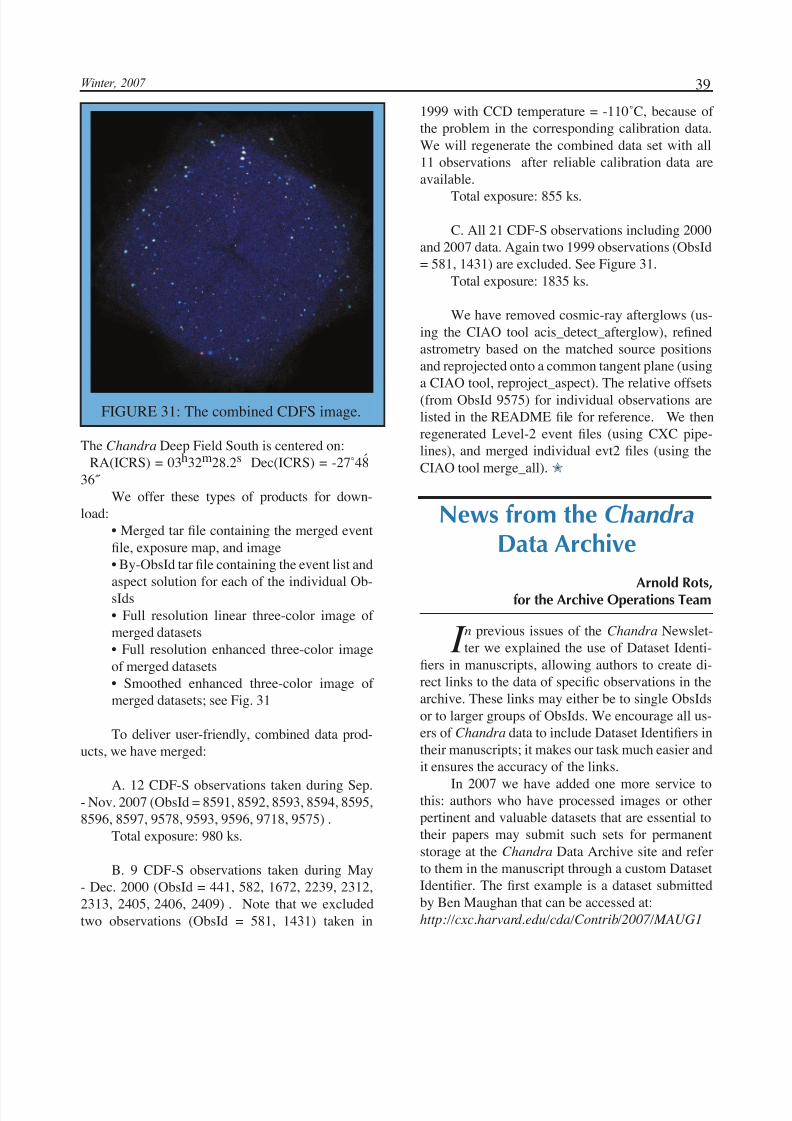
5/10/2018 Chandra X-ray Observatory Newsletter 2008 - slidepdf.com
http://slidepdf.com/reader/full/chandra-x-ray-observatory-newsletter-2008 39/52
39Winter, 2007
News from the Chandra Data Archive
Arnold Rots,for the Archive Operations Team
The Chandra Deep Field South is centered on:RA(ICRS) = 03h32m28.2s Dec(ICRS) = -27˚48́
36˝ We offer these types of products for down-
load:• Merged tar file containing the merged eventfile, exposure map, and image• By-ObsId tar file containing the event list and
aspect solution for each of the individual Ob-sIds• Full resolution linear three-color image of merged datasets• Full resolution enhanced three-color imageof merged datasets• Smoothed enhanced three-color image of merged datasets; see Fig. 31
To deliver user-friendly, combined data prod-ucts, we have merged:
A. 12 CDF-S observations taken during Sep.- Nov. 2007 (ObsId = 8591, 8592, 8593, 8594, 8595,8596, 8597, 9578, 9593, 9596, 9718, 9575) .
Total exposure: 980 ks.
B. 9 CDF-S observations taken during May- Dec. 2000 (ObsId = 441, 582, 1672, 2239, 2312,2313, 2405, 2406, 2409) . Note that we excludedtwo observations (ObsId = 581, 1431) taken in
1999 with CCD temperature = -110˚C, because of the problem in the corresponding calibration data.We will regenerate the combined data set with all11 observations after reliable calibration data areavailable.
Total exposure: 855 ks.
C. All 21 CDF-S observations including 2000and 2007 data. Again two 1999 observations (ObsId= 581, 1431) are excluded. See Figure 31.
Total exposure: 1835 ks.
We have removed cosmic-ray afterglows (us-ing the CIAO tool acis_detect_afterglow), refinedastrometry based on the matched source positionsand reprojected onto a common tangent plane (usinga CIAO tool, reproject_aspect). The relative offsets(from ObsId 9575) for individual observations arelisted in the README file for reference. We thenregenerated Level-2 event files (using CXC pipe-lines), and merged individual evt2 files (using theCIAO tool merge_all). ✮
FIGURE 31: The combined CDFS image.
I n previous issues of the Chandra Newslet-ter we explained the use of Dataset Identi-
fiers in manuscripts, allowing authors to create di-rect links to the data of specific observations in thearchive. These links may either be to single ObsIdsor to larger groups of ObsIds. We encourage all us-ers of Chandra data to include Dataset Identifiers intheir manuscripts; it makes our task much easier andit ensures the accuracy of the links.
In 2007 we have added one more service tothis: authors who have processed images or otherpertinent and valuable datasets that are essential totheir papers may submit such sets for permanentstorage at the Chandra Data Archive site and referto them in the manuscript through a custom DatasetIdentifier. The first example is a dataset submittedby Ben Maughan that can be accessed at:http://cxc.harvard.edu/cda/Contrib/2007/MAUG1
5/10/2018 Chandra X-ray Observatory Newsletter 2008 - slidepdf.com
http://slidepdf.com/reader/full/chandra-x-ray-observatory-newsletter-2008 40/52
40 CXC Newsletter
Useful Chandra Web Addresses
To Change Your Mailing Address:http://cxc.harvard.edu/cdo/udb/userdat.html
CXC: http://chandra.harvard.edu/
CXC Science Support:http://cxc.harvard.edu/
CXC Education and Outreach:http://chandra.harvard.edu/pub.html
ACIS: Penn Statehttp://www.astro.psu.edu/xray/axaf/
High Resolution Camera:http://hea-www.harvard.edu/HRC/HomePage.html
HETG: MIThttp://space.mit.edu/HETG/
LETG: MPEhttp://wave.xray.mpe.mpg.de/chandra/
LETG: SRONhttp://www.sron.nl/divisions/hea/chandra/
CIAO:
http://cxc.harvard.edu/ciao/ Chandra Calibration:
http://cxc.harvard.edu/cal/
MARX simulatorhttp://space.mit.edu/ASC/MARX/
MSFC: Project Science:http://wwwastro.msfc.nasa.gov/xray/axafps.html
T he 5th International X-ray AstronomySchool, sponsored by the Chandra X-ray
Center and NASA Goddard Space Flight Center,was held at The George Washington University inWashington, DC on August 6-10, 2007. The X-rayAstronomy school is organized every other year andis intended for graduate students and recent postdocswho want to understand the intricacies of X-ray as-tronomy. Emphasis is placed on the foundationsof X-ray astronomy rather than on any particular
software tools. The lectures presented at the recentschool covered a broad range of X-ray astronomytopics including characteristics of X-ray detectors,techniques used to analyze the data and recent ad-vances in several fields of X-ray astronomy, e.g.stars, galaxies, AGNs and clusters of galaxies.
Twenty-five students attended the school, rep-resenting such countries as Germany, Italy, England,Finland, Switzerland and Canada, as well as severaluniversities across the United States. Morning ses-sions were devoted to classes and lectures, whilethe afternoons were hands-on sessions with the
computer to work with real data. The students weregiven several projects to work on during the weekof school and they gave a short presentation on thefinal day of the school.
The students were very attentive and partici-pated with great interest in the entire program. Theyattended the lectures, asked plenty of questions and- as was clear from their final presentations - workedhard both on their analysis projects and on improv-ing their understanding of X-ray data analysis. Inthe evenings, students had a chance to get to knowtheir colleagues with informal group dinners, socialtime, and the traditional reading of “Copenhagen”,a play dramatizing a meeting between the physicistsNiels Bohr and Werner Heisenberg that took placein 1941.
Many thanks to the instructors who workedon their lectures, the administration and computergroups for their support, and to the computer spe-cialists for their help at the hands-on sessions.✮
X-Ray Astronomy School
Aneta Siemiginowska,Elizabeth Galle
Requests for storing these special datasets maybe submitted to [email protected]. Weask that users provide a justification and submit atarfile containing an index.html file and a subdirec-tory with the actual data files. The index file should
provide an explanation of the dataset and all accessto the dataset’s files need to go through the indexfile. In other words, it should be a self-containedweb tree that we can just drop into a directory onour web server; see the example mentioned above.
We are excited about the opportunity to collectvaluable analysis products and hope you will findthis service helpful. ✮
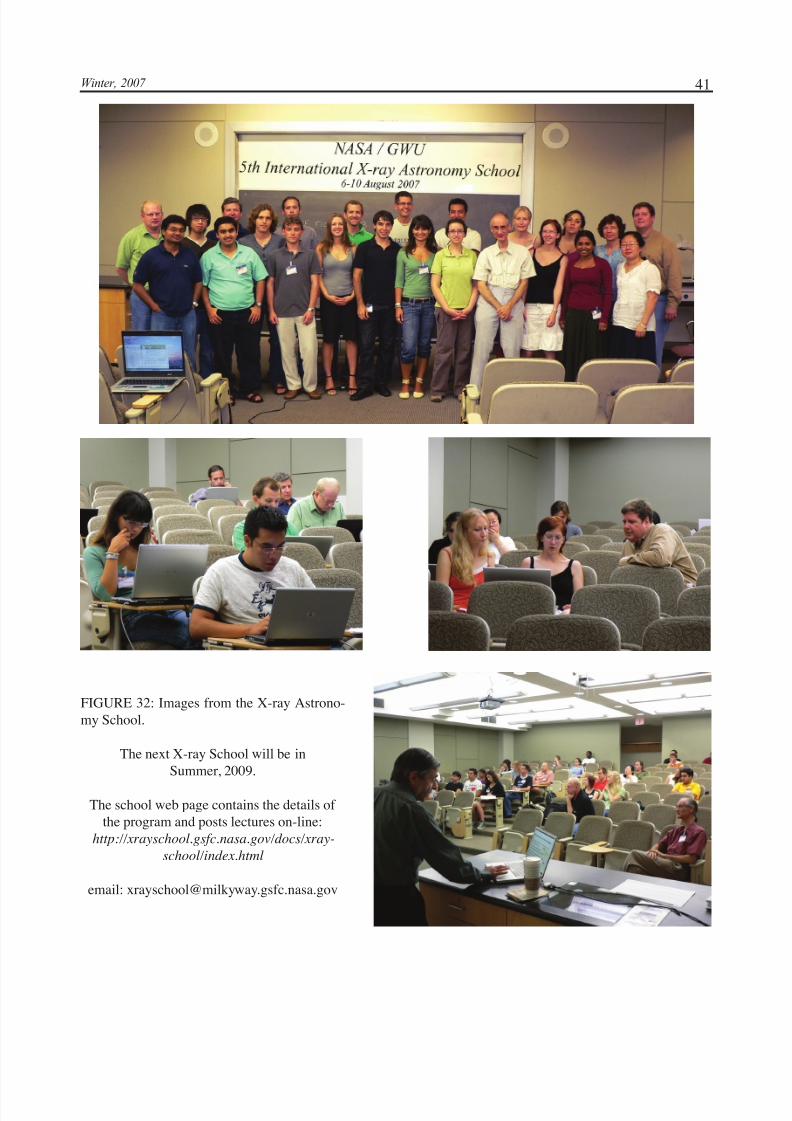
5/10/2018 Chandra X-ray Observatory Newsletter 2008 - slidepdf.com
http://slidepdf.com/reader/full/chandra-x-ray-observatory-newsletter-2008 41/52
41Winter, 2007
FIGURE 32: Images from the X-ray Astrono-my School.
The next X-ray School will be inSummer, 2009.
The school web page contains the details of the program and posts lectures on-line:
http://xrayschool.gsfc.nasa.gov/docs/xray-
school/index.html
email: [email protected]
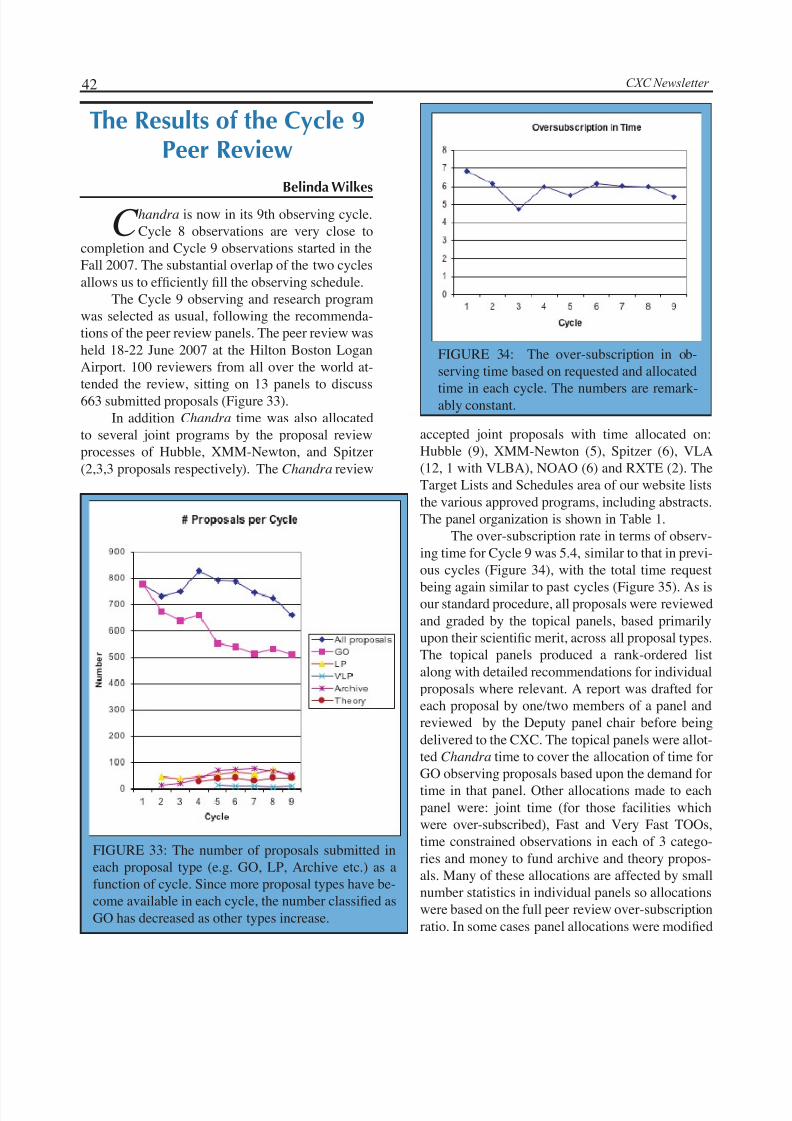
5/10/2018 Chandra X-ray Observatory Newsletter 2008 - slidepdf.com
http://slidepdf.com/reader/full/chandra-x-ray-observatory-newsletter-2008 42/52
42 CXC Newsletter
C handra is now in its 9th observing cycle.Cycle 8 observations are very close to
completion and Cycle 9 observations started in theFall 2007. The substantial overlap of the two cyclesallows us to efficiently fill the observing schedule.
The Cycle 9 observing and research programwas selected as usual, following the recommenda-tions of the peer review panels. The peer review washeld 18-22 June 2007 at the Hilton Boston LoganAirport. 100 reviewers from all over the world at-
tended the review, sitting on 13 panels to discuss663 submitted proposals (Figure 33).In addition Chandra time was also allocated
to several joint programs by the proposal reviewprocesses of Hubble, XMM-Newton, and Spitzer(2,3,3 proposals respectively). The Chandra review
The Results of the Cycle 9Peer Review
Belinda Wilkes
FIGURE 33: The number of proposals submitted ineach proposal type (e.g. GO, LP, Archive etc.) as afunction of cycle. Since more proposal types have be-come available in each cycle, the number classified asGO has decreased as other types increase.
accepted joint proposals with time allocated on:Hubble (9), XMM-Newton (5), Spitzer (6), VLA(12, 1 with VLBA), NOAO (6) and RXTE (2). TheTarget Lists and Schedules area of our website liststhe various approved programs, including abstracts.The panel organization is shown in Table 1.
The over-subscription rate in terms of observ-ing time for Cycle 9 was 5.4, similar to that in previ-ous cycles (Figure 34), with the total time request
being again similar to past cycles (Figure 35). As isour standard procedure, all proposals were reviewedand graded by the topical panels, based primarilyupon their scientific merit, across all proposal types.The topical panels produced a rank-ordered listalong with detailed recommendations for individualproposals where relevant. A report was drafted foreach proposal by one/two members of a panel andreviewed by the Deputy panel chair before beingdelivered to the CXC. The topical panels were allot-ted Chandra time to cover the allocation of time forGO observing proposals based upon the demand fortime in that panel. Other allocations made to eachpanel were: joint time (for those facilities whichwere over-subscribed), Fast and Very Fast TOOs,time constrained observations in each of 3 catego-ries and money to fund archive and theory propos-als. Many of these allocations are affected by smallnumber statistics in individual panels so allocationswere based on the full peer review over-subscriptionratio. In some cases panel allocations were modified
FIGURE 34: The over-subscription in ob-serving time based on requested and allocated
time in each cycle. The numbers are remark-ably constant.
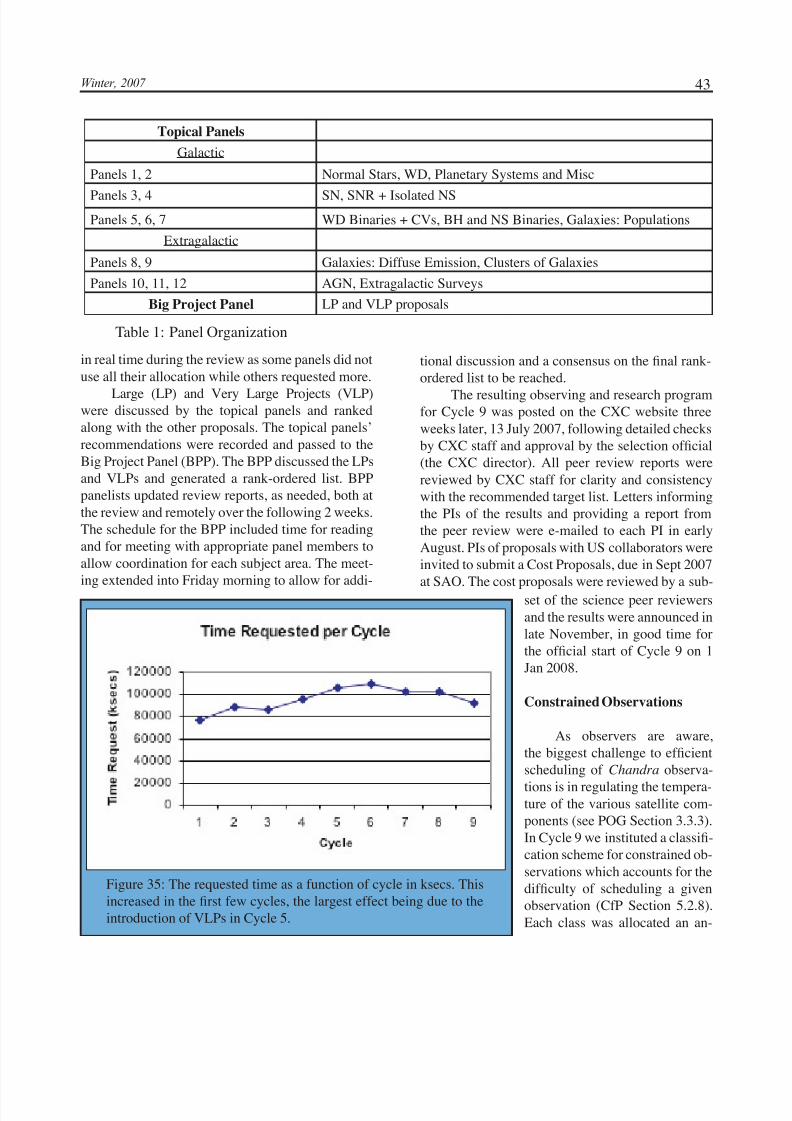
5/10/2018 Chandra X-ray Observatory Newsletter 2008 - slidepdf.com
http://slidepdf.com/reader/full/chandra-x-ray-observatory-newsletter-2008 43/52
43Winter, 2007
Topical Panels
Galactic
Panels 1, 2 Normal Stars, WD, Planetary Systems and Misc
Panels 3, 4 SN, SNR + Isolated NSPanels 5, 6, 7 WD Binaries + CVs, BH and NS Binaries, Galaxies: Populations
Extragalactic
Panels 8, 9 Galaxies: Diffuse Emission, Clusters of Galaxies
Panels 10, 11, 12 AGN, Extragalactic Surveys
Big Project Panel LP and VLP proposals
Table 1: Panel Organization
in real time during the review as some panels did notuse all their allocation while others requested more.
Large (LP) and Very Large Projects (VLP)were discussed by the topical panels and rankedalong with the other proposals. The topical panels’recommendations were recorded and passed to theBig Project Panel (BPP). The BPP discussed the LPsand VLPs and generated a rank-ordered list. BPPpanelists updated review reports, as needed, both atthe review and remotely over the following 2 weeks.The schedule for the BPP included time for readingand for meeting with appropriate panel members toallow coordination for each subject area. The meet-
ing extended into Friday morning to allow for addi-
tional discussion and a consensus on the final rank-ordered list to be reached.
The resulting observing and research programfor Cycle 9 was posted on the CXC website threeweeks later, 13 July 2007, following detailed checksby CXC staff and approval by the selection official(the CXC director). All peer review reports werereviewed by CXC staff for clarity and consistencywith the recommended target list. Letters informingthe PIs of the results and providing a report fromthe peer review were e-mailed to each PI in earlyAugust. PIs of proposals with US collaborators wereinvited to submit a Cost Proposals, due in Sept 2007
at SAO. The cost proposals were reviewed by a sub-
Figure 35: The requested time as a function of cycle in ksecs. Thisincreased in the first few cycles, the largest effect being due to theintroduction of VLPs in Cycle 5.
set of the science peer reviewersand the results were announced inlate November, in good time forthe official start of Cycle 9 on 1Jan 2008.
Constrained Observations
As observers are aware,the biggest challenge to efficientscheduling of Chandra observa-
tions is in regulating the tempera-ture of the various satellite com-ponents (see POG Section 3.3.3).In Cycle 9 we instituted a classifi-cation scheme for constrained ob-servations which accounts for thedifficulty of scheduling a givenobservation (CfP Section 5.2.8).Each class was allocated an an-
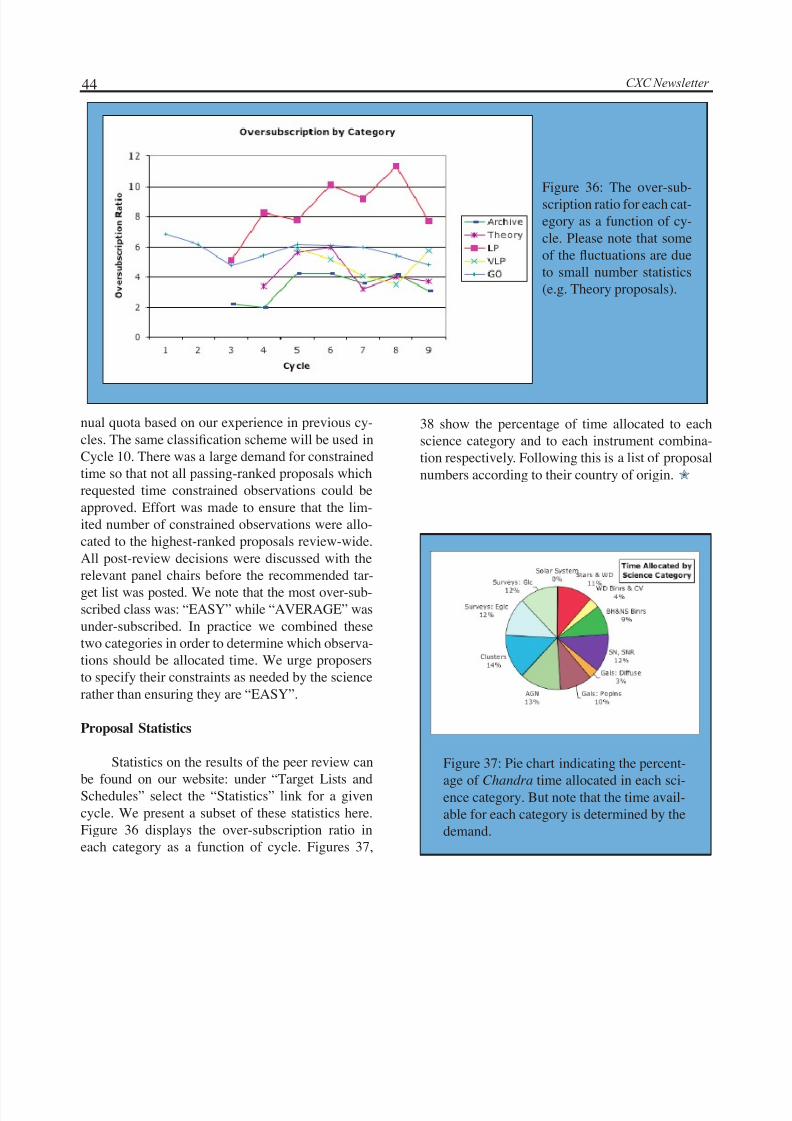
5/10/2018 Chandra X-ray Observatory Newsletter 2008 - slidepdf.com
http://slidepdf.com/reader/full/chandra-x-ray-observatory-newsletter-2008 44/52
44 CXC Newsletter
nual quota based on our experience in previous cy-cles. The same classification scheme will be used inCycle 10. There was a large demand for constrainedtime so that not all passing-ranked proposals whichrequested time constrained observations could beapproved. Effort was made to ensure that the lim-ited number of constrained observations were allo-cated to the highest-ranked proposals review-wide.All post-review decisions were discussed with therelevant panel chairs before the recommended tar-
get list was posted. We note that the most over-sub-scribed class was: “EASY” while “AVERAGE” wasunder-subscribed. In practice we combined thesetwo categories in order to determine which observa-tions should be allocated time. We urge proposersto specify their constraints as needed by the sciencerather than ensuring they are “EASY”.
Proposal Statistics
Statistics on the results of the peer review can
be found on our website: under “Target Lists andSchedules” select the “Statistics” link for a givencycle. We present a subset of these statistics here.Figure 36 displays the over-subscription ratio ineach category as a function of cycle. Figures 37,
38 show the percentage of time allocated to eachscience category and to each instrument combina-tion respectively. Following this is a list of proposalnumbers according to their country of origin. ✮
Figure 36: The over-sub-scription ratio for each cat-egory as a function of cy-cle. Please note that someof the fluctuations are dueto small number statistics(e.g. Theory proposals).
Figure 37: Pie chart indicating the percent-
age of Chandra time allocated in each sci-ence category. But note that the time avail-able for each category is determined by thedemand.
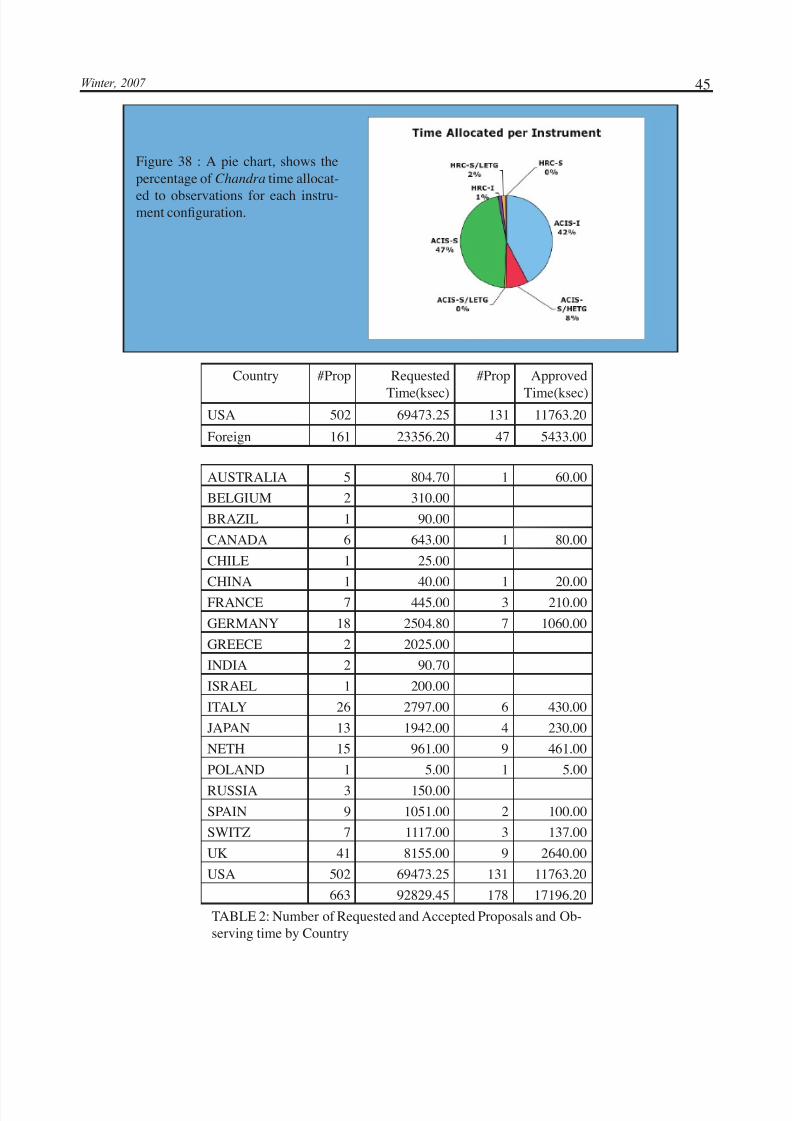
5/10/2018 Chandra X-ray Observatory Newsletter 2008 - slidepdf.com
http://slidepdf.com/reader/full/chandra-x-ray-observatory-newsletter-2008 45/52
45Winter, 2007
Figure 38 : A pie chart, shows thepercentage of Chandra time allocat-
ed to observations for each instru-ment configuration.
Country #Prop Requested
Time(ksec)
#Prop Approved
Time(ksec)USA 502 69473.25 131 11763.20
Foreign 161 23356.20 47 5433.00
AUSTRALIA 5 804.70 1 60.00
BELGIUM 2 310.00
BRAZIL 1 90.00
CANADA 6 643.00 1 80.00
CHILE 1 25.00
CHINA 1 40.00 1 20.00FRANCE 7 445.00 3 210.00
GERMANY 18 2504.80 7 1060.00
GREECE 2 2025.00
INDIA 2 90.70
ISRAEL 1 200.00
ITALY 26 2797.00 6 430.00
JAPAN 13 1942.00 4 230.00
NETH 15 961.00 9 461.00
POLAND 1 5.00 1 5.00
RUSSIA 3 150.00SPAIN 9 1051.00 2 100.00
SWITZ 7 1117.00 3 137.00
UK 41 8155.00 9 2640.00
USA 502 69473.25 131 11763.20
663 92829.45 178 17196.20
TABLE 2: Number of Requested and Accepted Proposals and Ob-serving time by Country
5/10/2018 Chandra X-ray Observatory Newsletter 2008 - slidepdf.com
http://slidepdf.com/reader/full/chandra-x-ray-observatory-newsletter-2008 46/52
46 CXC Newsletter
T he Cycle 9 Chandra EPO Peer Review,conducted by the CXC, was held in Cam-
bridge MA on Dec. 5-7, 2007. A panel represent-ing science, education, museum, Forum, and NASAmission and management perspectives reviewed12 proposals. Three individual and 9 institutional
proposals were submitted. Two individual and 5 in-stitutional proposals were selected for funding. Anoverview of the selected proposals by type follows,alphabetically in order of PI last name.
Individual Proposals
1) The Extreme Universe Video Conference Field
Trips for Grades 6-10
Science PI: Dr. Mark Voit/Michigan State Univer-sity, [email protected] Co-I: Judy Smyth/MSU Museum,
[email protected] Partner
• Michigan State University MuseumThe proposal will develop and provide science
content around the theme of “The Extreme Universe”for an on-going teleconferencing project (Learningand Developing Distance Education Resources -LADDERS) being carried out by the MSU museumfor remote middle schools in Michigan under a grantfrom the Institute of Museum and Library Services.The content is presented as virtual field trips that in-
clude inquiry-based, hands-on classroom activities.The content will address National Education stan-dards for grades 5-10 as well as Project 2061 goalsto advance literacy in science. In addition to servingMichigan schools, the program will be offered toclassrooms across the country through LADDERS’partnerships with national distance learning websites and listservs. MSU’s Virtual Outreach Websitewill connect participants to additional NASA re-sources and will utilize NASA materials. With an
Education andPublic Outreach Proposals
Selected in Cycle 9Kathleen Lestition
Education & Outreach Coordinator
existing infrastructure and in-place program staff aswell as participant schools, the program will remainin existence beyond the term of this grant.
2) Creating a Tour of the Center of the Galaxy in the
World Wide TelescopeScience PI: Dr. Farhad Yusef-Zadeh/NorthwesternUniversity, zadeh@
northwestern.eduEPO-Co-I: Doug Roberts/Adler Planetarium, [email protected] Partner
• Adler Planetarium and Astronomy Museum,Chicago, IL
This proposal will use data from NASA’s GreatObservatories to create a story-driven “tour” of thecenter of the Milky Way Galaxy in multi-wavelengthfor the World Wide Telescope (WWT) interactivevisualization system. The WWT enables users to ac-tively explore the sky with targeted images. Captionsand an audio option (to be provided in English andSpanish) make the tour accessible. Some data fromeach of NASA’s Great Observatories has alreadybeen incorporated into the WWT, and this proposalwill expand the offerings. Two versions of the tourwill be created: one aimed at middle school children,one aimed at adults with a high school education orabove. The system will be developed and tested with
target audiences at the Adler. The finished productswill be available through MicroSoft’s release of theWWT and also deployed at Adler’s Space Visualiza-tion Lab and the CyberSpace installation, ensuringlongevity beyond the term of this grant. Adler staff will develop outreach presentations in the form of Informal public interpretation programs as well asvideo-conferenced field trips. The adult version of the tour will be used in an Adler adult education as-tronomy class.
Team/Institutional Proposals
1) Rooftop Variables
Science PI: Dr. Marcel Agueros/Columbia Univer-sity, [email protected] Partners
• Summer Research Program for Teachers (SRP),Columbia University
• American Association of Variable Star Observ-ers (AAVSO), Cambridge, MA
5/10/2018 Chandra X-ray Observatory Newsletter 2008 - slidepdf.com
http://slidepdf.com/reader/full/chandra-x-ray-observatory-newsletter-2008 47/52
47Winter, 2007
This program leverages the existing SummerResearch Program at Columbia University which hasprovided ~200 New York City teachers with profes-sional development programs in the sciences since1990. Teachers gain hands-on experience by becom-
ing integral participants in their mentors’ labs fortwo consecutive summers. To date there has been noformal astronomy opportunity, which this programaddresses. Initially 4-6 teachers will be competitive-ly selected to learn observational and data reductiontechniques on amateur observing targets suggestedby the AAVSO, under the guidance of mentors fromthe Columbia astronomy department. The AAVSOmonitors sources which can become targets of op-portunity for telescopes such as Chandra and par-ticipants will be expected to contribute data to theAAVSO data base. Teachers will also be presentedwith astronomy teaching resources and opportuni-ties to develop their own astronomy-related mate-rials, and have access to department sponsored ob-serving nights and dark-sky field trips. The ultimategoal of the program is the establishment of on-goingastronomy clubs at each of the participants schoolsunder continued mentorship from the Columbia as-tronomy department.
2) Chandra Astrophysics Institute
Science PI: Dr. Deepto Chakrabarty/MIT Kavli In-
stitute for Astrophysics and Space Research (MKI),[email protected] Co-I: Dr. Irene Porro/MKI,[email protected] Partners
• Lynn Public School District, Lynn MA• Urban Science Academy, West Roxbury MA• The Engineering School, Hyde Park MA• New Mission High School, Boston MA• Community Charter School of Cambridge,Cambridge MA
This program continues the previously fundedCAI. The goal of the CAI is to provide underservedstudents with effective learning opportunities in sci-ence. Through CAI, students build the backgroundskills and knowledge necessary to understand howresearch science is done, by actually doing it. Stu-dents participate in an intensive, 5 week summersession at MIT, and then apply their skills during
the next full year to undertake investigative projectsin X-ray astronomy developed in collaboration withmentors from MKI. Several new schools have beenadded, and contact time with participating studentshas been increased. A pilot outreach component,
working with math/science/technology clubs at par-ticipating schools will be implemented. In additionto the traditional public presentations, a portfolio of the final product of the student investigations will becreated for public dissemination via a public website.
3) Adding Loops To The STEM Pipeline: Mentoring
and After-School Activities for Girls Scouts
Science PI: Dr. Ann Hornschemeier/Goddard SpaceFlight Center,
[email protected] Co-I: Christine Lamgerton/Teen Program Spe-cialist, Girl Scouts of
Central Maryland, [email protected] Partners
• Girl Scouts of Central Maryland (GSCM), Bal-timore MD
• GSFC Astrophysics (ASD) EPO, BaltimoreMD
• GSFC Heliophysics (HSD) EPO, BaltimoreMD
The program will transfer existing activitiesfrom the Big Explosions/Strong Gravity (BESG)program (previously funded by Chandra and now ina national expansion phase with ROSES funding),as well as new content to be developed and adaptedfrom EPO programs in the GSFC ASD, HSD andSolar Dynamics Lab, to the 8-week after school“feeder” program that engages younger, inner citygirls to graduate into the Girls Scouts’ ACE mentor-ing program. This program (as well as the earlierBESG) combines STEM content with a mentoringexperience provided by a scientist volunteer net-work including GSFC, JHU, UMd, CUA and STScI.This grant will fund the preparation of a core groupof GSCM staff to train the mentors, as well as thestart up funds for four after school programs utiliz-ing the NASA content to be held during the 2008-2009 school year.
5/10/2018 Chandra X-ray Observatory Newsletter 2008 - slidepdf.com
http://slidepdf.com/reader/full/chandra-x-ray-observatory-newsletter-2008 48/52
48 CXC Newsletter
4) Connecting Kids to the Universe with the Beyond
Einstein Explorers Program
Science PI: Dong Lai/Cornell University,[email protected]
EPO Co-I: Nancy Schaff/Center for Radiophys-ics and Space Research, Cornell University,[email protected] Partner
• Cornell Cooperative Extension 4-H Youth De-velopment
This program will leverage NASA’s BeyondEinstein Explorers Program (BEEP) by funding thedevelopment of teaching kits, and the implementa-tion of a regional training workshop in collaborationwith the 4-H Youth Development program in NewYork State to extend the geographical reach of theBEEP program and materials. The 4-H educationpartner will particularly seek to reach underrepre-sented and underserved youth. The trained leaderswill develop the capacity to implement the projectwith youth as well as train other leaders. The re-source kits will be available for loan on a regionallevel. The participants intend to use this pilot pro-gram as a development opportunity to develop aworking paradigm for expansion. They plan seekadditional funding to expand the program through
other 4-H groups on a wider geographical basis.
5) The Nature of Science: A Planetarium Show on
Globular Clusters at the Science Museum of Vir-
gina
Science PI: Dr. Craig Sarazin/Univeristy of Virginia,[email protected] Co-I: Dr. Edward Murphy/University of Virgina,[email protected] Partner
• The Science Museum of Virgina, RichmondVA
The purpose of this program is to introduce stu-dents and the public to the nature of science throughthe development and production of a planetariumshow on globular clusters at the Science Museumof Virginia. The focus of the show will be to demon-strate how scientists know basic properties of glob-ular clusters through the nature of science and the
scientific method. The factual content of what sci-entists know will be introduced incidentally to dis-cussing how scientists work. Throughout the show,the differences between facts, hypotheses, theoriesand laws will be emphasized. In addition to the PI
and EPO Co-I, the development team includes expe-rienced staff at the planetarium of the Science Mu-seum of Virginia who will oversee the production of the show and define and manage production of theassociated study guide. ✮
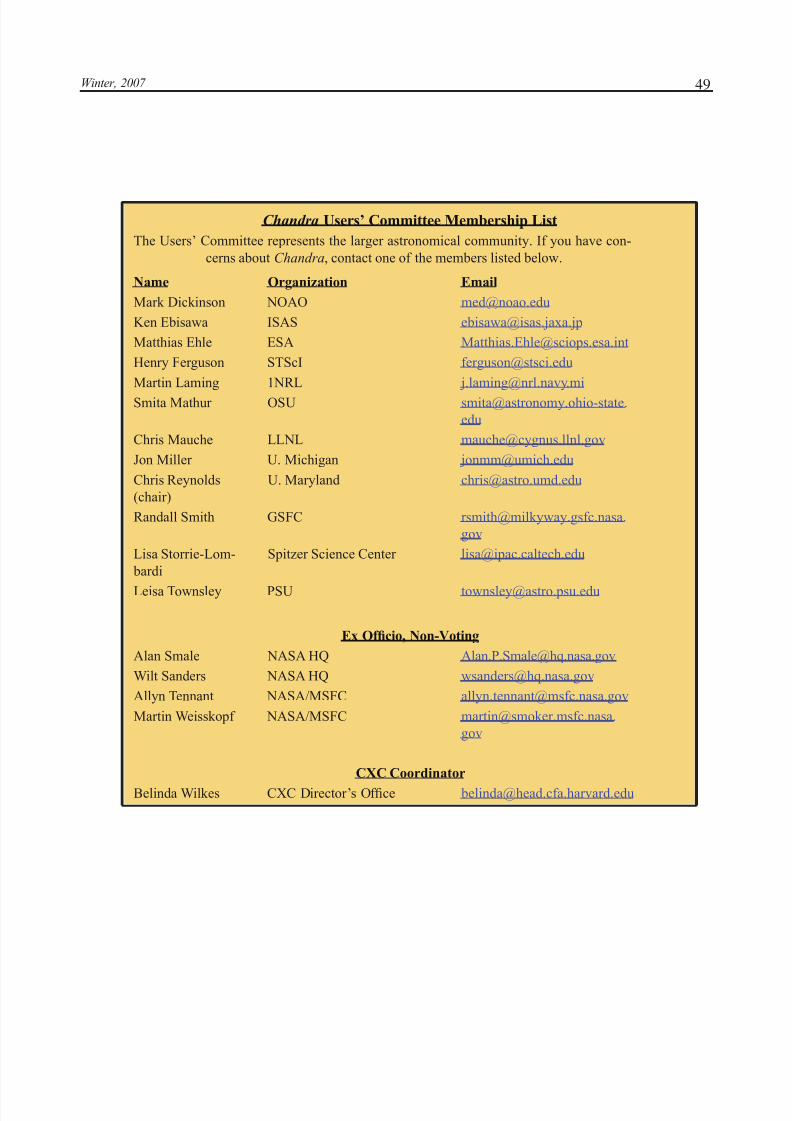
5/10/2018 Chandra X-ray Observatory Newsletter 2008 - slidepdf.com
http://slidepdf.com/reader/full/chandra-x-ray-observatory-newsletter-2008 49/52
49Winter, 2007
Chandra Users’ Committee Membership List
The Users’ Committee represents the larger astronomical community. If you have con-
cerns about Chandra, contact one of the members listed below.
Name Organization Email
Mark Dickinson NOAO [email protected]
Ken Ebisawa ISAS [email protected]
Matthias Ehle ESA [email protected]
Henry Ferguson STScI [email protected]
Martin Laming 1NRL [email protected]
Smita Mathur OSU [email protected].
edu
Chris Mauche LLNL [email protected]
Jon Miller U. Michigan [email protected]
Chris Reynolds
(chair)
U. Maryland [email protected]
Randall Smith GSFC [email protected].
gov
Lisa Storrie-Lom-
bardi
Spitzer Science Center [email protected]
Leisa Townsley PSU [email protected]
Ex Officio, Non-Voting
Alan Smale NASA HQ [email protected]
Wilt Sanders NASA HQ [email protected]
Allyn Tennant NASA/MSFC [email protected]
Martin Weisskopf NASA/MSFC [email protected].
gov
CXC Coordinator
Belinda Wilkes CXC Director’s Office [email protected]
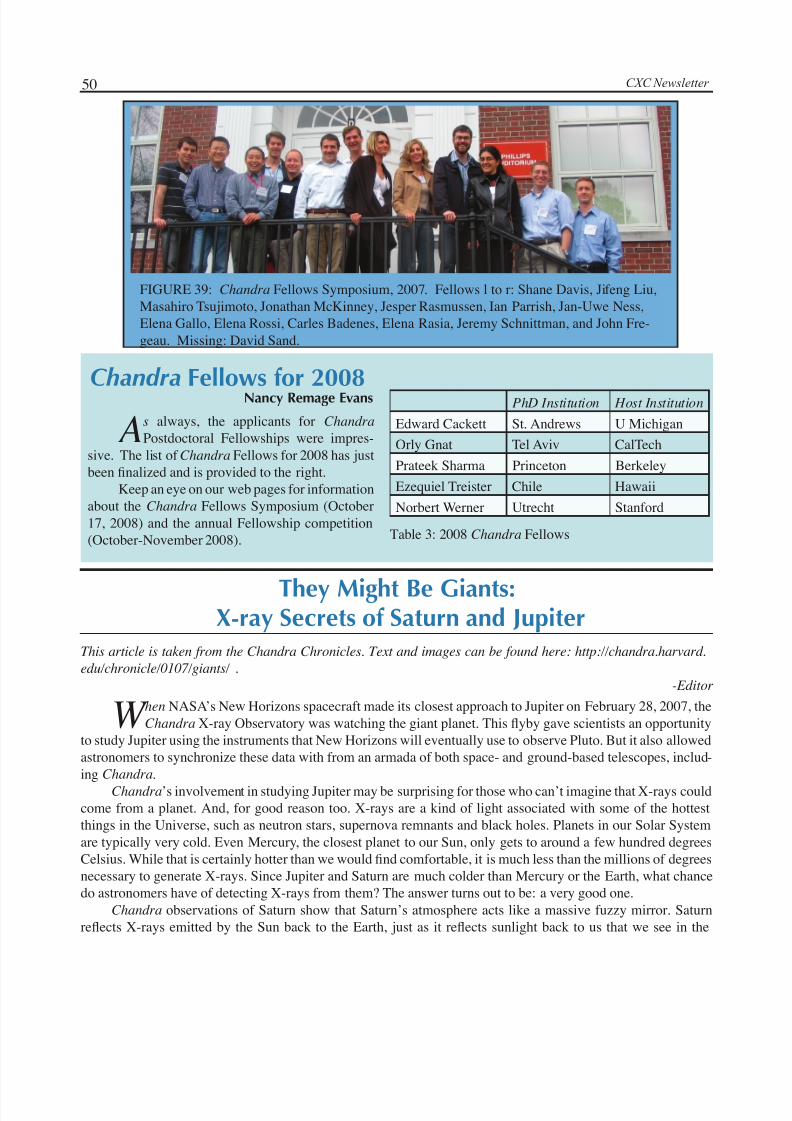
5/10/2018 Chandra X-ray Observatory Newsletter 2008 - slidepdf.com
http://slidepdf.com/reader/full/chandra-x-ray-observatory-newsletter-2008 50/52
50 CXC Newsletter
W hen NASA’s New Horizons spacecraft made its closest approach to Jupiter on February 28, 2007, theChandra X-ray Observatory was watching the giant planet. This flyby gave scientists an opportunity
to study Jupiter using the instruments that New Horizons will eventually use to observe Pluto. But it also allowedastronomers to synchronize these data with from an armada of both space- and ground-based telescopes, includ-ing Chandra.
Chandra’s involvement in studying Jupiter may be surprising for those who can’t imagine that X-rays couldcome from a planet. And, for good reason too. X-rays are a kind of light associated with some of the hottestthings in the Universe, such as neutron stars, supernova remnants and black holes. Planets in our Solar Systemare typically very cold. Even Mercury, the closest planet to our Sun, only gets to around a few hundred degreesCelsius. While that is certainly hotter than we would find comfortable, it is much less than the millions of degreesnecessary to generate X-rays. Since Jupiter and Saturn are much colder than Mercury or the Earth, what chancedo astronomers have of detecting X-rays from them? The answer turns out to be: a very good one.
Chandra observations of Saturn show that Saturn’s atmosphere acts like a massive fuzzy mirror. Saturnreflects X-rays emitted by the Sun back to the Earth, just as it reflects sunlight back to us that we see in the
They Might Be Giants:X-ray Secrets of Saturn and Jupiter
This article is taken from the Chandra Chronicles. Text and images can be found here: http://chandra.harvard.
edu/chronicle/0107/giants/ .
-Editor
FIGURE 39: Chandra Fellows Symposium, 2007. Fellows l to r: Shane Davis, Jifeng Liu,Masahiro Tsujimoto, Jonathan McKinney, Jesper Rasmussen, Ian Parrish, Jan-Uwe Ness,Elena Gallo, Elena Rossi, Carles Badenes, Elena Rasia, Jeremy Schnittman, and John Fre-geau. Missing: David Sand.
As always, the applicants for Chandra Postdoctoral Fellowships were impres-
sive. The list of Chandra Fellows for 2008 has justbeen finalized and is provided to the right.
Keep an eye on our web pages for informationabout the Chandra Fellows Symposium (October17, 2008) and the annual Fellowship competition(October-November 2008).
Chandra
Fellows for 2008Nancy Remage Evans PhD Institution Host Institution
Edward Cackett St. Andrews U Michigan
Orly Gnat Tel Aviv CalTech
Prateek Sharma Princeton Berkeley
Ezequiel Treister Chile Hawaii
Norbert Werner Utrecht Stanford
Table 3: 2008 Chandra Fellows
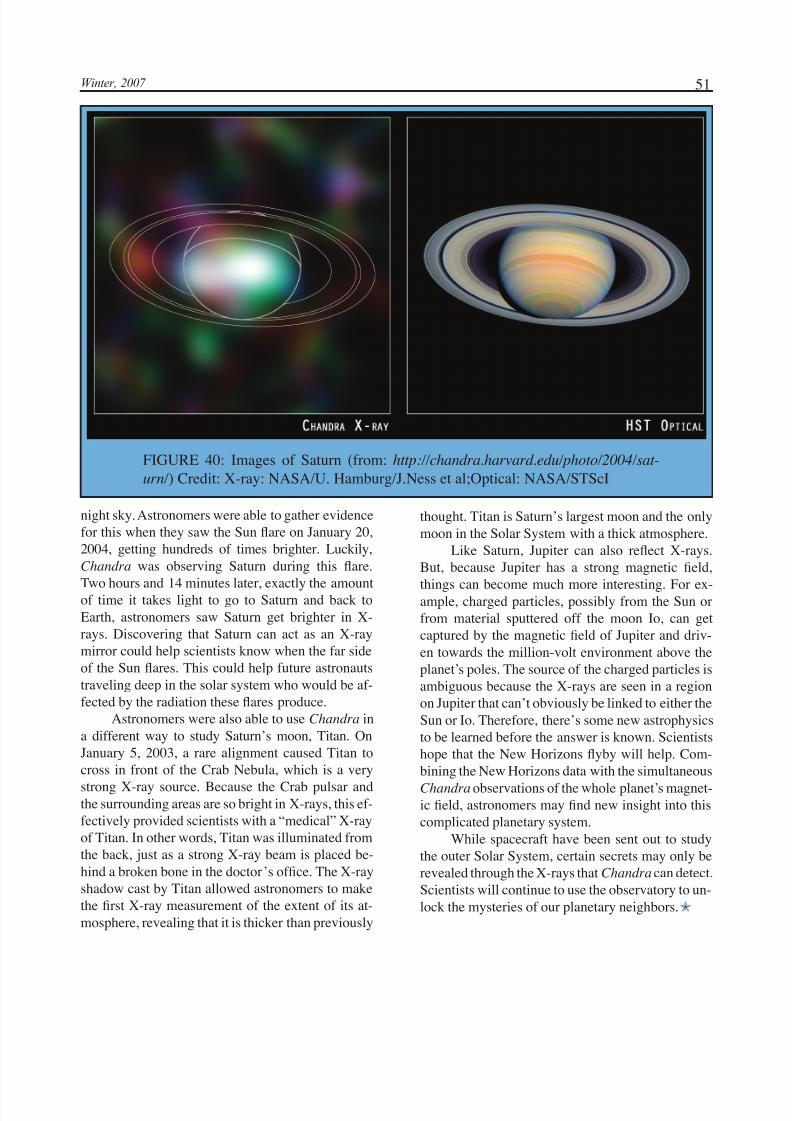
5/10/2018 Chandra X-ray Observatory Newsletter 2008 - slidepdf.com
http://slidepdf.com/reader/full/chandra-x-ray-observatory-newsletter-2008 51/52
51Winter, 2007
night sky. Astronomers were able to gather evidencefor this when they saw the Sun flare on January 20,2004, getting hundreds of times brighter. Luckily,Chandra was observing Saturn during this flare.
Two hours and 14 minutes later, exactly the amountof time it takes light to go to Saturn and back toEarth, astronomers saw Saturn get brighter in X-rays. Discovering that Saturn can act as an X-raymirror could help scientists know when the far sideof the Sun flares. This could help future astronautstraveling deep in the solar system who would be af-fected by the radiation these flares produce.
Astronomers were also able to use Chandra ina different way to study Saturn’s moon, Titan. OnJanuary 5, 2003, a rare alignment caused Titan tocross in front of the Crab Nebula, which is a very
strong X-ray source. Because the Crab pulsar andthe surrounding areas are so bright in X-rays, this ef-fectively provided scientists with a “medical” X-rayof Titan. In other words, Titan was illuminated fromthe back, just as a strong X-ray beam is placed be-hind a broken bone in the doctor’s office. The X-rayshadow cast by Titan allowed astronomers to makethe first X-ray measurement of the extent of its at-mosphere, revealing that it is thicker than previously
thought. Titan is Saturn’s largest moon and the onlymoon in the Solar System with a thick atmosphere.
Like Saturn, Jupiter can also reflect X-rays.But, because Jupiter has a strong magnetic field,
things can become much more interesting. For ex-ample, charged particles, possibly from the Sun orfrom material sputtered off the moon Io, can getcaptured by the magnetic field of Jupiter and driv-en towards the million-volt environment above theplanet’s poles. The source of the charged particles isambiguous because the X-rays are seen in a regionon Jupiter that can’t obviously be linked to either theSun or Io. Therefore, there’s some new astrophysicsto be learned before the answer is known. Scientistshope that the New Horizons flyby will help. Com-bining the New Horizons data with the simultaneousChandra observations of the whole planet’s magnet-ic field, astronomers may find new insight into thiscomplicated planetary system.
While spacecraft have been sent out to studythe outer Solar System, certain secrets may only berevealed through the X-rays that Chandra can detect.Scientists will continue to use the observatory to un-lock the mysteries of our planetary neighbors.✮
FIGURE 40: Images of Saturn (from: http://chandra.harvard.edu/photo/2004/sat-
urn/ ) Credit: X-ray: NASA/U. Hamburg/J.Ness et al;Optical: NASA/STScI
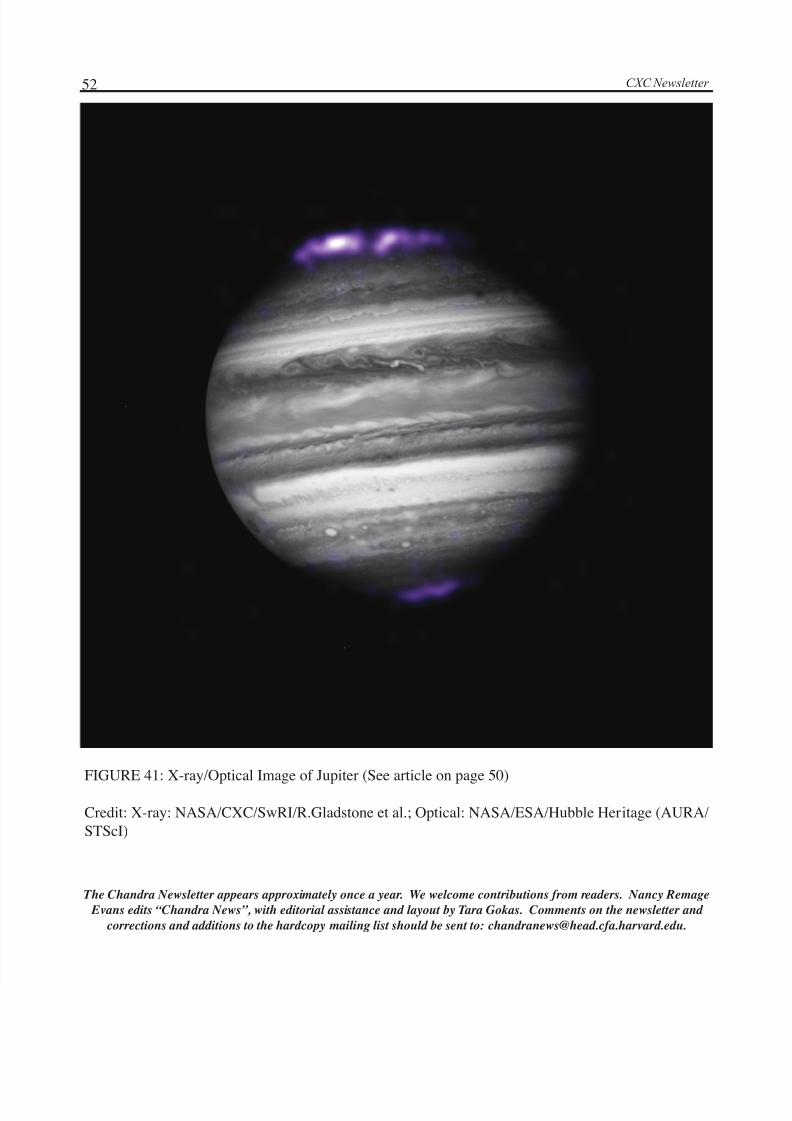
5/10/2018 Chandra X-ray Observatory Newsletter 2008 - slidepdf.com
http://slidepdf.com/reader/full/chandra-x-ray-observatory-newsletter-2008 52/52
52 CXC Newsletter
FIGURE 41: X-ray/Optical Image of Jupiter (See article on page 50)Credit: X-ray: NASA/CXC/SwRI/R.Gladstone et al.; Optical: NASA/ESA/Hubble Heritage (AURA/STScI)
The Chandra Newsletter appears approximately once a year. We welcome contributions from readers. Nancy Remage
Evans edits “Chandra News”, with editorial assistance and layout by Tara Gokas. Comments on the newsletter and
corrections and additions to the hardcopy mailing list should be sent to: [email protected].