CH4 and δ18O of O
12
HAL Id: hal-01103841 https://hal.archives-ouvertes.fr/hal-01103841 Submitted on 11 Jan 2021 HAL is a multi-disciplinary open access archive for the deposit and dissemination of sci- entific research documents, whether they are pub- lished or not. The documents may come from teaching and research institutions in France or abroad, or from public or private research centers. L’archive ouverte pluridisciplinaire HAL, est destinée au dépôt et à la diffusion de documents scientifiques de niveau recherche, publiés ou non, émanant des établissements d’enseignement et de recherche français ou étrangers, des laboratoires publics ou privés. CH4 and δ 18O of O2 records from Antarctic and Greenland ice: A clue for stratigraphic disturbance in the bottom part of the Greenland Ice Core Project and the Greenland Ice Sheet Project 2 ice cores Jérôme Chappellaz, E. Brook, Thomas Blunier, Bruno Malaizé To cite this version: Jérôme Chappellaz, E. Brook, Thomas Blunier, Bruno Malaizé. CH4 and δ18O of O2 records from Antarctic and Greenland ice: A clue for stratigraphic disturbance in the bottom part of the Greenland Ice Core Project and the Greenland Ice Sheet Project 2 ice cores. Journal of Geophysical Research, American Geophysical Union, 1997, 102 (C12), pp.26547. 10.1029/97JC00164. hal-01103841
Transcript of CH4 and δ18O of O
HAL Id: hal-01103841https://hal.archives-ouvertes.fr/hal-01103841
Submitted on 11 Jan 2021
HAL is a multi-disciplinary open accessarchive for the deposit and dissemination of sci-entific research documents, whether they are pub-lished or not. The documents may come fromteaching and research institutions in France orabroad, or from public or private research centers.
L’archive ouverte pluridisciplinaire HAL, estdestinée au dépôt et à la diffusion de documentsscientifiques de niveau recherche, publiés ou non,émanant des établissements d’enseignement et derecherche français ou étrangers, des laboratoirespublics ou privés.
CH4 and δ18O of O2 records from Antarctic andGreenland ice: A clue for stratigraphic disturbance in
the bottom part of the Greenland Ice Core Project andthe Greenland Ice Sheet Project 2 ice cores
Jérôme Chappellaz, E. Brook, Thomas Blunier, Bruno Malaizé
To cite this version:Jérôme Chappellaz, E. Brook, Thomas Blunier, Bruno Malaizé. CH4 and δ18O of O2 records fromAntarctic and Greenland ice: A clue for stratigraphic disturbance in the bottom part of the GreenlandIce Core Project and the Greenland Ice Sheet Project 2 ice cores. Journal of Geophysical Research,American Geophysical Union, 1997, 102 (C12), pp.26547. �10.1029/97JC00164�. �hal-01103841�
JOURNAL OF GEOPHYSICAL RESEARCH, VOL. 102, NO. C12, PAGES 26,547-26,557, NOVEMBER 30, 1997
CH 4 and •180 of O2 records from Antarctic and Greenland ice: A clue for stratigraphic disturbance in the bottom part of the Greenland Ice Core Project and the Greenland Ice Sheet Project 2 ice cores
Jfir6me Chappellaz, • Ed Brook, 2'3 Thomas Blunier, 4 and Bruno Malaizfi •
Abstract. The suggestion of climatic instability during the last interglacial period (Eem), based on the bottom 10% of the Greenland Ice core Project (GRIP) isotopic profile, has been questioned because the bottom record from the neighboring Greenland Ice Sheet Project 2 (GISP2) core (28 km away) is strikingly different over the same interval and because records of the/5180 of atmospheric 02 from both cores showed unexpected rapid fluctuations. Here we present detailed methane records from the Vostok (Antarctica), GRIP, and GISP2 cores over the relevant intervals. The GRIP and GISP2 data show rapid and large changes in methane concentration, which are correlative with variations of the /5180 of the ice, while the Vostok record shows no such variations. This discrepancy reinforces the suggestion that the bottom sections of the Greenland records are disturbed. By combining the methane data with measurements of/51•O of 02 in the same samples, we attempt to constrain the nature of the stratigraphic disturbance and the age of the analyzed ice samples. Our results suggest that ice layers from part of the last interglacial period exist in the lower section of both ice cores and that some of the apparent climate instabili- ties in the GRIP core would be the result of a mixture of ice from the last interglacial with ice from the beginning of the last glaciation or from the penultimate glaciation.
1. Introduction
One of the most puzzling results from the Greenland Ice Core Project (GRIP) ice core drilled at Summit (central Greenland) concerns the behavior of the Eem Interglaciation (European terminology), usually correlated with the marine isotope stage 5e (MIS-5e) and expected to be recorded in the bottom 200-300 m of the core. The fil80 of ice (noted •18Oic e hereafter) profile over that period suggests large temperature fluctuations of variable duration, in sharp contrast with stable climate inferred from other paleoclimate records for the same period [GRIP Project Members, 1993]. Recent studies of paleorecords in marine sediments and continental deposits have either reinforced or contradicted the GRIP interpretation of the Eemian climate [Guiot et al., 1993; Keigwin et al., 1994; McManus et al., 1994; Thouveny et al., 1994]. If
•Laboratoire de Glaciologie et G•ophysique de l'Environne- ment, Centre National de la Recherche Scientifique, St Martin d'H•res, France.
2Graduate School of Oceanography, University of Rhode Island, Narragansett.
3Now at: Department of Geology, Department of Environ- mental Science, Washington State University, Vancouver.
4physikalisches Institut, Universit•it Bern, Bern, Switzerland. 5Laboratoire de Mod•lisation du Climat et de l'Environne-
ment, Commissariat h l'Energie Atomique, Gif sur Yvette, France.
Copyright 1997 by the American Geophysical Union.
Paper number 97JC00164. 0148-0227/97/97JC-00164509.00
observed at all, the fluctuations in the other records are
weaker than in the GRIP fil8Oic o profile. Analysis of the companion Greenland Ice Sheet Project 2
(GISP2) core revealed remarkable agreement of the fil•Oic c record with GRIP over the first -2750 m of both cores, but below that point, there are substantial differences, suggesting a significant stratigraphic disturbance in one or both cores [Grootes et al., 1993]. This was later corroborated by studies of ice-core fabric in GISP2 [Alley et al., 1995]. Such observations led to the suggestion that the "unstable Eemian" period might in fact be an artifact of stratigraphic disturbance [Grootes et al., 1993]. On the other hand, several arguments could be made for the validity of the GRIP Eemian record: no layer with identical isotopic and chemical signature is found twice in the stratigraphy, the visible layering has essentially unchanged tilt down to the early Eem (2848 m of depth), and the fil•Oi• e signal remains practically unchanged after correction for the self-diffusion of water molecules in the ice [Johnsen et al., 1995].
An independent means of evaluating the fidelity of the bottom sections of the GRIP and GISP2 records is to
compare the composition of trapped gases in the two cores with the well-dated gas records from the Vostok ice core, covering the Eemian period but also the previous glacial/interglacial cycle back to MIS-7e [Vostok Project Members, 1995]. To use a gas record (either the concentration or isotopic composition of a gas) in this way, it must satisfy several criteria: (1) the residence time of the gas in the atmosphere must be longer than the interhemispheric mixing time (-1 year), (2) the concentration or isotopic composition must show significant variations with
26,547
26,548 CHAPPELLAZ ET AL.: CH 4 AND •5180 2 OVER THE EEMIAN PERIOD
time, and (3) the atmospheric signal must not be altered during or after trapping in the ice.
Only two gas measurements so far meet these requirements: CH 4 mixing ratio and 15•aO of 02. The 15•80 of atmospheric 02 (noted •518Oat m hereafter) has been used for correlating the Vostok records to the marine oxygen isotope stratigraphy [Sowers et al., 1991, 1993], as it is mainly controlled by the global ice volume. It also was used recently to correlate the GISP2, Byrd, and Vostok ice-core paleotemperature records [Bender et al., 1994b; Sowers and Bender, 1995]. Below 2800 m in the GISP2 core (110 kyr B.P.), the •518Oat m record exhibits rapid fluctuations which were not observed in the Vostok core. Bender et al. [1994b] concluded that this discrepancy was due to physical disturbance of the GISP2 stratigraphy in the lowest 350 m of the core. They also noted that the GISP2 •518Oat m record did not contain values higher than +0.9%0, which are found in the Vostok record at the very end of MIS-6, from -140 to 130 kyr B.P. (Extended Glaciological Timescale (EGT) of Jouzel et al. [1993]). The GRIP •518Oatm signal over the last deglaciation agrees well with similar records from GISP2, Byrd, and Vostok; however, as in GISP2, the record below 2750 m appears totally different from the Vostok signal [Fuchs and Leuenberger, 1996]. The authors interpret this discrepancy as probably the result of a disturbed stratigraphy.
The sampling interval of the GRIP •518Oatm record does not yet allow us to examine all of the rapid variations in 15•8Oico. Thus we cannot rule out the possibility that part of the GRIP record is in correct order and that some of the cold shifts are
not glaciological artifacts. Also, the stable behavior of the Vostok •518Oatm signal over the last interglacial cannot rule out short climatic events on the global scale, which would have been smoothed out by the large residence time of atmospheric 02 [Bender et al., 1994a].
In this regard, methane is another useful gas: its residence time in the atmosphere is of the order of 10 years, which is long enough for the concentration to be globally homogeneous but short enough for it to react quickly to a budget imbalance, linked for instance to a climate change. Its concentration over Greenland is slightly higher today (by about 8%) than over Antarctica [Dlugokencky et al., 1994], but the difference can be estimated in the past by comparing detailed measurements in ice cores from both ice sheets. The
natural CH 4 cycle is dominated by production from wetlands [Fung et al., 1991; Chappellaz et al., 1993a]; the long-term CH• fluctuations are expected to reflect changes of the hydrological budget over the producing regions, and they are thus of climatic significance.
The CH 4 records available over the last 220 kyr show that most of the temperature fluctuations inferred from isotopic measurements on the Greenland and Antarctic ice cores are
accompanied by an excursion in the atmospheric CH 4 concentration [Chappellaz et al., 1990, 1993b; Blunier et al., 1995; Brook et al., 1996]. In addition, all cold events recorded at GISP2 over the last 110 kyr have a corresponding low CH 4 level [Brook et al., 1996]. Finally, the detailed GRIP Holocene CH 4 record contains both long- term and short-term fluctuations [Blunier et al., 1995]. Overall, the CH 4 records suggest a high sensitivity of the CH 4 cycle to climate change under warm or mild conditions and a damping of the methane variations only during the most intense phases of the glacial stages. One would thus expect that the Eemian cold shifts in the GRIP 15•8Oic ½ record
are associated with significant CH 4 variations; if such CH 4 events existed, they must be recorded both in Greenland and Antarctic ice, although perhaps slightly attenuated in the Vostok record due to the longer time required for trapping the gases in the ice at this site [Barnola et al., 1991; Schwander et al. , 1993].
In the following sections, we present a refined profile of methane from the Vostok core over the last interglacial period, two detailed CH 4 records from the GRIP and GISP2 cores below 2750-m depth, and a refined GRIP •518Oat m profile. We then combine the CH 4 and 15•Oatm records, including previously published GISP2 •518Oat m data [Bender et al., 1994b], and we attempt to constrain the age of the layers analyzed in GRIP and GISP2, with respect to the Vostok chronology.
2. The Vostok CH 4 Record
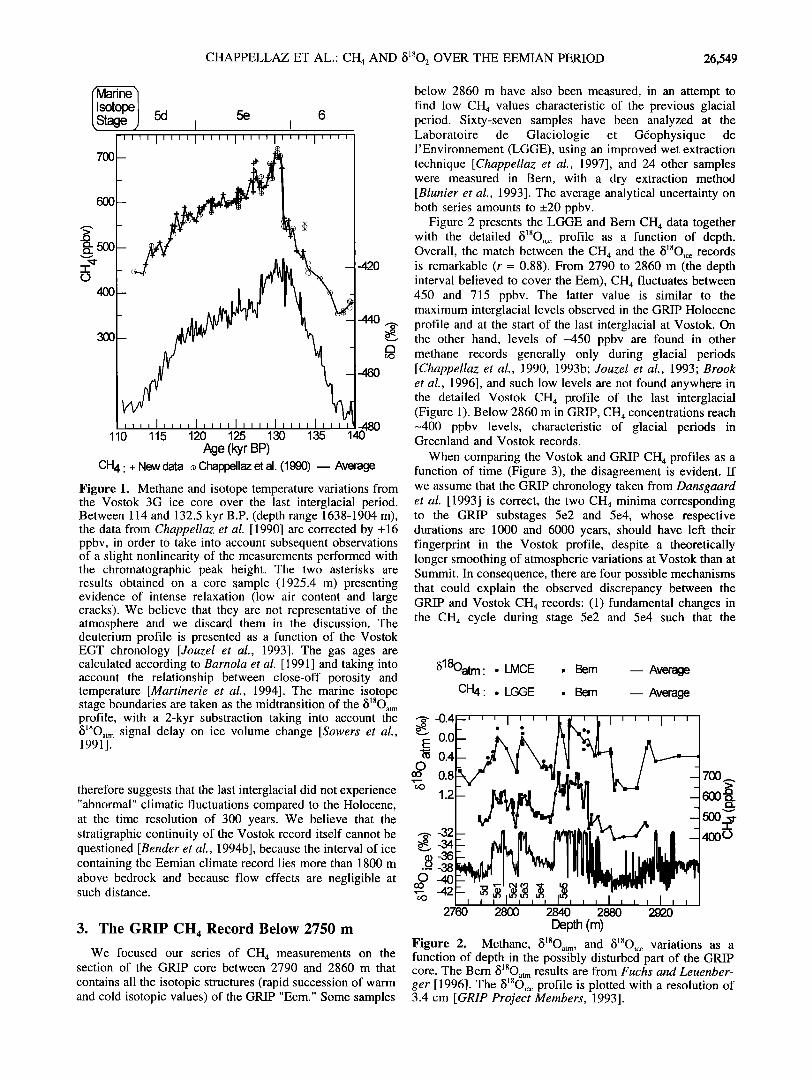
Past CH 4 changes during the last interglacial period were studied initially with samples from the Vostok 3G ice core [Chappellaz et al., 1990]. Methane rose to -700 parts per billion by volume (ppbv) at the beginning of the last interglacial period and then slowly decreased over the next -15 kyr. In general, the methane variations closely resemble the temperature variations inferred from the deuterium isotope profile (Figure 1), and no rapid changes are evident, apart from the onset of the interglacial. However, the mean time sampling of the profile is 1300 years over the time period of concern, and it might not have resolved rapid variations.
Our first aim was to refine the Vostok CH 4 profile. The trapping of gases in the ice matrix is a slow process, smoothing the original atmospheric concentration variations. Under interglacial conditions at the Vostok site, this smoothing is estimated to have a width of-300 years [Barnola et al., 1991]. This is "in theory" the best time resolution attainable in the Vostok CH 4 profile. Indeed, CH 4 excursions of shorter duration would still affect the 300-year average and would be imprinted in the Vostok record, although attenuated. In addition, extra CH 4 measurements between 29 and 40 kyr B.P. (J. Chappellaz, unpublished data, 1996) reveal intersradial CH 4 fluctuations, lasting less than 1 kyr, with a similar amplitude to the GRIP and GISP2 records. This suggests that the theoretical width of gas trapping at Vostok under glacial conditions,-900 years [Barnola et al., 1991], is probably overestimated and that the atmospheric CH 4 variations during the Eem are also less attenuated than expected at Vostok. We measured 68 additional samples on the 3G core over the period of interest, leading to a mean sampling interval of 270 years (maximum: 730 years). We used a conventional wet extraction technique on the trapped gases; the analytical uncertainty associated with these results is _+37 ppbv [Blunier et al., 1993].
The resulting profile is presented in Figure 1 together with the Vostok isotopic profile. The general structure observed in the original profile of Chappellaz et al. [1990] is not altered and the methane/isotope coherency is conserved. A single new event appears about 3000 years after the early interglacial maximum, with a small CH 4 spike of about 50 ppbv over a period of 1000 years. Both in terms of amplitude and duration, this event does not appear exceptional when compared to the CH 4 behavior during the Holocene [Blunier et al., 1995]. Considering methane as a climate proxy, it
CHAPPELLAZ ET AL.' CH 4 AND 15•O 2 OVER THE EEMIAN PERIOD 26,549
ladne') sotope rage )
5d 5e 6 I I
7oo
3oo
,,,,I,,,,I,,,•1111•1•,,I, 110 115 120 125 130 135
Age (kyr BP)
I I
-42O
CH4. + New data ß Chappellaz et al. (1990) -- Average
Figure 1. Methane and isotope temperature variations from the Vostok 3G ice core over the last interglacial period. Between 114 and 132.5 kyr B.P. (depth range 1638-1904 m), the data from Chappellaz et al. [ 1990] are corrected by + 16 ppbv, in order to take into account subsequent observations of a slight nonlinearity of the measurements performed with the chromatographic peak height. The two asterisks are results obtained on a core sample (1925.4 m) presenting evidence of intense relaxation (low air content and large cracks). We believe that they are not representative of the atmosphere and we discard them in the discussion. The deuterium profile is presented as a function of the Vostok EGT chronology [Jouzel et al., 1993]. The gas ages are calculated according to Barnola et al. [ 1991 ] and taking into account the relationship between close-off porosity and temperature [Martinerie et al., 1994]. The marine isotope stage boundaries are taken as the midtransition of the •518Oat m profile, with a 2-kyr substraction taking into account the •518Oatm signal delay on ice volume change [Sowers et al., 1991].
therefore suggests that the last interglacial did not experience "abnormal" climatic fluctuations compared to the Holocene, at the time resolution of 300 years. We believe that the stratigraphic continuity of the Vostok record itself cannot be questioned [Bender et al., 1994b], because the interval of ice containing the Eemian climate record lies more than 1800 m above bedrock and because flow effects are negligible at such distance.
3. The GRIP CH 4 Record Below 2750 m
We focused our series of CH 4 measurements on the section of the GRIP core between 2790 and 2860 m that
contains all the isotopic structures (rapid succession of warm and cold isotopic values) of the GRIP "Eem." Some samples
below 2860 m have also been measured, in an attempt to find low CH 4 values characteristic of the previous glacial period. Sixty-seven samples have been analyzed at the Laboratoire de Glaciologie et G6ophysique de l'Environnement (LGGE), using an improved wet extraction technique [Chappellaz et al., 1997], and 24 other samples were measured in Bern, with a dry extraction method [Blunier et al., 1993]. The average analytical uncertainty on both series amounts to +_20 ppbv.
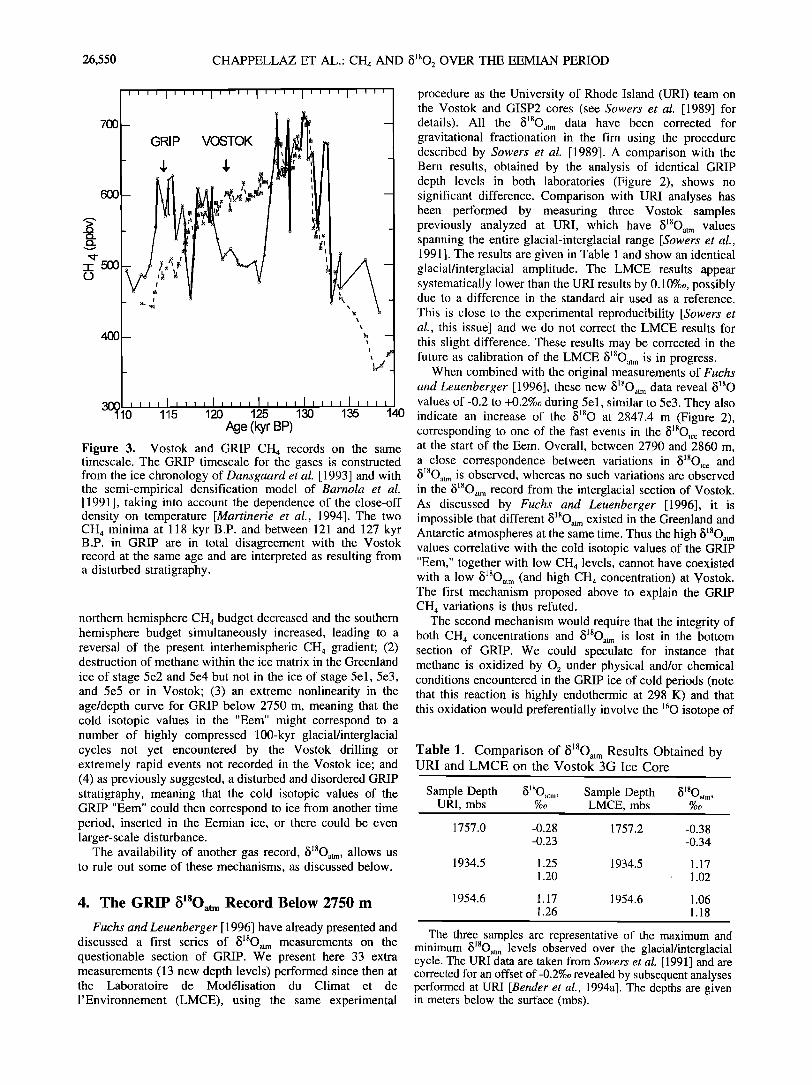
Figure 2 presents the LGGE and Bern CH 4 data together with the detailed 15•aO,c o profile as a function of depth. Overall, the match between the CH 4 and the 15•aOice records is remarkable (r = 0.88). From 2790 to 2860 m (the depth interval believed to cover the Eem), CH 4 fluctuates between 450 and 715 ppbv. The latter value is similar to the maximum interglacial levels observed in the GRIP Holocene profile and at the start of the last interglacial at Vostok. On the other hand, levels of-450 ppbv are found in other methane records generally only during glacial periods [Chappellaz et al., 1990, 1993b; Jouzel et al., 1993; Brook et alo, 1996], and such low levels are not found anywhere in the detailed Vostok CH 4 profile of the last interglacial (Figure 1). Below 2860 m in GRIP, CH 4 concentrations reach -400 ppbv levels, characteristic of glacial periods in Greenland and Vostok records.
When comparing the Vostok and GRIP CH 4 profiles as a function of time (Figure 3), the disagreement is evident. If we assume that the GRIP chronology taken from Dansgaard et al. [1993] is correct, the two CH 4 minima corresponding to the GRIP substages 5e2 and 5e4, whose respective durations are 1000 and 6000 years, should have left their fingerprint in the Vostok profile, despite a theoretically longer smoothing of atmospheric variations at Vostok than at Summit. In consequence, there are four possible mechanisms that could explain the observed discrepancy between the GRIP and Vostok CH 4 records: (1) fundamental changes in the CH 4 cycle during stage 5e2 and 5e4 such that the
;518Oatm ' o LMCE ßBem -- Average CH4' ß LGGE ßBem Average
'•'-0.4•-''' I''' ''• ' ' I ' ' ' I ' '
'• 0.4 o
0.8 -7oo
• 4000
2760 2800 2840 2880 2920
Depth (m)
Figure 2. Methane, iS•aOat m, and •5•Oic o variations as a function of depth in the possibly disturbed part of the GRIP core. The Bern •518Oatm results are from Fuchs and Leuenber- get [1996]. The 15•aOi• o profile is plotted with a resolution of 3.4 cm [GRIP Project Members, 1993].
26,550 CHAPPELLAZ ET AL.' CH 4 AND •1802 OVER THE EEMIAN PERIOD
700- GRIP VOSTOK
,', -
v ;
3• ,', I• , , ,• , , ,;½ , , ,• , , , I , , , , 11 1 1 1 Age (•r BP)
Figure 3. Vostok and timescale. •h½ GRiP timescale •or the gases is constructed ½rom the ice c•onology o• D•n•g•rg et ½I. []993] and with the scmi-•pirical dcnsification modal o• B•rnol• et •I. []99l], taking into accourn density on temperature [M•rtinerie et •I., ]994]. •h½ two C•4 •ini•a at ] ]8 kyr B.P. and between ]2] and ]2? kyr B.P. in GRiP are in total disagreement with the Vostok record at the same age and are interpreted as resulting [rob a disturbed stratigraphy.
northern hemisphere CH 4 budget decreased and the southern hemisphere budget simultaneously increased, leading to a reversal of the present interhemispheric CH 4 gradient; (2) destruction of methane within the ice matrix in the Greenland
ice of stage 5e2 and 5e4 but not in the ice of stage 5el, 5e3, and 5e5 or in Vostok; (3) an extreme nonlinearity in the age/depth curve for GRIP below 2750 m, meaning that the cold isotopic values in the "Eem" might correspond to a number of highly compressed 100-kyr glacial/interglacial cycles not yet encountered by the Vostok drilling or extremely rapid events not recorded in the Vostok ice; and (4) as previously suggested, a disturbed and disordered GRIP stratigraphy, meaning that the cold isotopic values of the GRIP "Eem" could then correspond to ice from another time period, inserted in the Eemian ice, or there could be even larger-scale disturbance.
The availability of another gas record, •18Oatm, allows us to rule out some of these mechanisms, as discussed below.
4. The GRIP •18Oat m Record Below 2750 in Fuchs and Leuenberger [1996] have already presented and
discussed a first series of •18Oat m measurements on the questionable section of GRIP. We present here 33 extra measurements (13 new depth levels) performed since then at the Laboratoire de Moddlisation du Climat et de
l'Environnement (LMCE), using the same experimental
procedure as the University of Rhode Island (URI) team on the Vostok and GISP2 cores (see Sowers et al. [1989] for details). All the •18Oat m data have been corrected for gravitational fractionation in the firn using the procedure described by Sowers et al. [1989]. A comparison with the Bern results, obtained by the analysis of identical GRIP depth levels in both laboratories (Figure 2), shows no significant difference. Comparison with URI analyses has been performed by measuring three Vostok samples previously analyzed at URI, which have •18Oat m values spanning the entire glacial-interglacial range [Sowers et aI., 1991]. The results are given in Table 1 and show an identical glacial/interglacial amplitude. The LMCE results appear systematically lower than the URI results by 0.10%o, possibly due to a difference in the standard air used as a reference.
This is close to the experimental reproducibility [Sowers et aI., this issue] and we do not correct the LMCE results for this slight difference. These results may be corrected in the future as calibration of the LMCE •18Oat m is in progress.
When combined with the original measurements of Fuchs and Leuenberger [1996], these new •5•80•,tm data reveal values of-0.2 to +0.2%o during 5el, similar to 5e3. They also indicate an increase of the •5•80 at 2847.4 m (Figure 2), corresponding to one of the fast events in the •5•8Oio e record at the start of the Eem. Overall, between 2790 and 2860 m, a close correspondence between variations in •5•8Oioe and 15•8OaL m is observed, whereas no such variations are observed in the •18Oat m record from the interglacial section of Vostok. As discussed by Fuchs and Leuenberger [1996], it is impossible that different •18Oat m existed in the Greenland and Antarctic atmospheres at the same time. Thus the high •18Oat m values correlative with the cold isotopic values of the GRIP "Eem," together with low CH 4 levels, cannot have coexisted with a low •18Oat m (and high CH 4 concentration) at Vostok. The first mechanism proposed above to explain the GRIP CH 4 variations is thus refuted.
The second mechanism would require that the integrity of both CH 4 concentrations and •18Oat m is lost in the bottom section of GRIP. We could speculate for instance that methane is oxidized by 02 under physical and/or chemical conditions encountered in the GRIP ice of cold periods (note that this reaction is highly endothermic at 298 K) and that this oxidation would preferentially involve the •60 isotope of
Table 1. Comparison of •18Oat m Results Obtained by URI and LMCE on the Vostok 3G Ice Core
18
Sample Depth •5 Oat .... Sample Depth •18Oatm, URI, mbs %0 LMCE, mbs
1757.0 -0.28 1757.2 -0.38 -0.23 -0.34
1934.5 1.25 1934.5 1.17 1.20 , 1.02
1954.6 1.17 1954.6 1.06 1.26 1.18
The three samples are representative of the maximum and minimum •18Oal m levels observed over the glacial/interglacial cycle. The URI data are taken from Sowers et al. [1991] and are corrected for an offset of-0.2%o revealed by subsequent analyses performed at URI [Bender et al., 1994a]. The depths are given in meters below the surface (mbs).
CHAPPELLAZ ET AL.' CH 4 AND •5•O2 OVER THE EEMIAN PERIOD 26,551
02, leaving the remaining 0 2 enriched in •ao. But quantitatively, the removal of 150 ppbv of CH 4 (i.e., change from 5e5 to 5e4) by oxidation with •602 alone would change •5•aO•,tm by 6 x 10 -7 %o, which is totally negligible. In addition, the excellent agreement observed between the CH 4 profiles over the last 110 kyr from GISP2 and Vostok (ice cores which experienced different gas trapping conditions, drilling techniques, temperature, and duration of storage) makes a strong argument about the fidelity of CH 4 records in ice and argues against the second mechanism of selective CH 4 destruction in ice [Brook et aI., 1996].
Therefore we are left with possible explanations involving a stratigraphic disturbance, either in the form of a highly variable depth/age relationship or as discontinuities. We can immediately refute the hypothesis that the cold periods happened even faster than originally dated in GRIP. For example, we observe an 0.8%o change of •18Oat m in about 100 years (chronology of Dansgaard et aI. [1993]) at -2847 m, which is impossible to reconcile with a mean residence time of oxygen in the atmosphere of 1200 years [Bender et aI., 1994a]. The remaining possibility, that either several glacial/interglacial cycles are compressed in the sequence of GRIP assumed to be from the Eem period or that the isotopic fluctuations result from ice mixing, will be discussed further below.
5. The GISP2 CH 4 Record Below 2800 m
Methane on GISP2 was measured in -80 samples between 2800 and 3040 m, at 2 to 4-m intervals (Figure 4). Analytical techniques are described by Sowers et aI. [this issue]. As is the case with the GRIP record, comparison of the GISP2 data with Vostok data for the period before 110 kyr also indicates little agreement. The sharp methane peak exceeding 700 ppbv in the Vostok record (Figure 1), corresponding to MIS-
-0.4
o.o 0.4
0.8
'1.2
800,•
7oo
2840 2880 2920 2960 3000 3040
Depth (m)
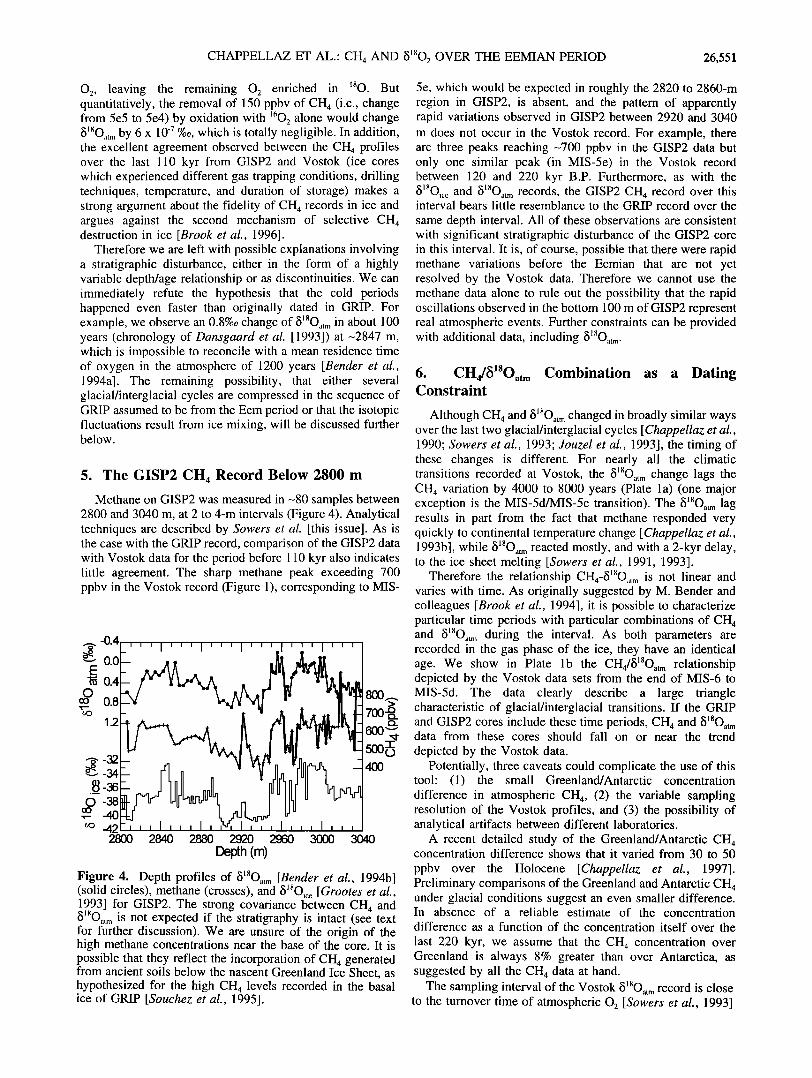
Figure 4. Depth profiles of •18Oatrn [Bender et aI., 1994b] (solid circles), methane (crosses), and blSOice [Grootes et aI., 1993] for GISP2. The strong covariance between CH 4 and •18Oat m is not expected if the stratigraphy is intact (see text for further discussion). We are unsure of the origin of the high methane concentrations near the base of the core. It is possible that they reflect the incorporation of CH 4 generated from ancient soils below the nascent Greenland Ice Sheet, as hypothesized for the high CH 4 levels recorded in the basal ice of GRIP [Souchez et aI., 1995].
5e, which would be expected in roughly the 2820 to 2860-m region in GISP2, is absent, and the pattern of apparently rapid variations observed in GISP2 between 2920 and 3040 m does not occur in the Vostok record. For example, there are three peaks reaching -700 ppbv in the GISP2 data but only one similar peak (in MIS-5e) in the Vostok record between 120 and 220 kyr B.P. Furthermore, as with the •5•O,•o and •18Oat m records, the GISP2 CH 4 record over this interval bears little resemblance to the GRIP record over the
same depth interval. All of these observations are consistent with significant stratigraphic disturbance of the GISP2 core in this interval. It is, of course, possible that there were rapid methane variations before the Eemian that are not yet resolved by the Vostok data. Therefore we cannot use the methane data alone to rule out the possibility that the rapid oscillations observed in the bottom 100 m of GISP2 represent real atmospheric events. Further constraints can be provided with additional data, including •18Oat m.
6. CH4/•18Oatm Combination as a Dating Constraint
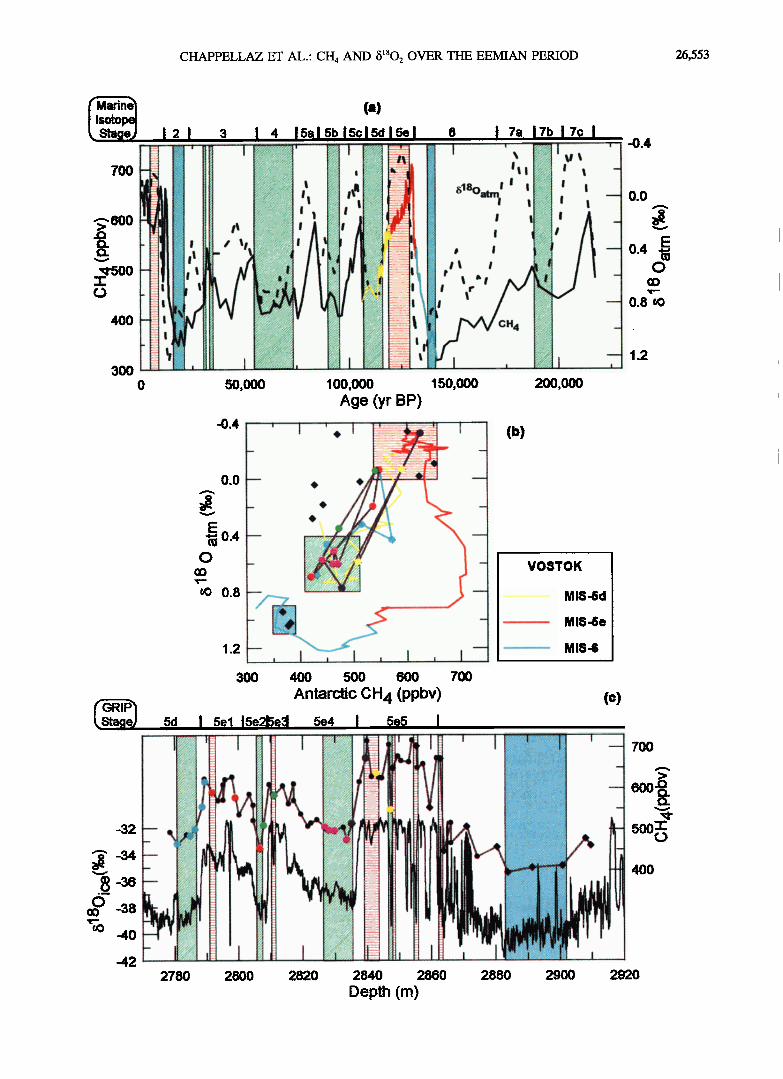
Although CH 4 and •18Oat m changed in broadly similar ways over the last two glacial/interglacial cycles [Chappellaz et aI., 1990; Sowers et al., 1993; JouzeI et aI., 1993], the timing of these changes is different. For nearly all the climatic transitions recorded at Vostok, the •18Oat m change lags the CH4 variation by 4000 to 8000 years (Plate l a) (one major exception is the MIS-5d/MIS-5c transition). The •18Oat m lag results in part from the fact that methane responded very quickly to continental temperature change [Chappellaz et al., 1993b], while •5•aO•,tm reacted mostly, and with a 2-kyr delay, to the ice sheet melting [Sowers et aI., 1991, 1993].
Therefore the relationship CH4-•lgoat m is not linear and varies with time. As originally suggested by M. Bender and colleagues [Brook et aI., 1994], it is possible to characterize particular time periods with particular combinations of CH 4 and •18Oat m during the interval. As both parameters are recorded in the gas phase of the ice, they have an identical age. We show in Plate lb the cm4/•18Oatrn relationship depicted by the Vostok data sets from the end of MIS-6 to MIS-5d. The data clearly describe a large triangle characteristic of glacial/interglacial transitions. If the GRIP and GISP2 cores include these time periods, CH 4 and •18Oat m data from these cores should fall on or near the trend
depicted by the Vostok data. Potentially, three caveats could complicate the use of this
tool: (1) the small Greenland/Antarctic concentration difference in atmospheric CH4, (2) the variable sampling resolution of the Vostok profiles, and (3) the possibility of analytical artifacts between different laboratories.
A recent detailed study of the Greenland/Antarctic CH 4 concentration difference shows that it varied from 30 to 50
ppbv over the Holocene [ChappeIIaz et al., 1997]. Preliminary comparisons of the Greenland and Antarctic CH 4 under glacial conditions suggest an even smaller difference. In absence of a reliable estimate of the concentration
difference as a function of the concentration itself over the
last 220 kyr, we assume that the CH 4 concentration over Greenland is always 8% greater than over Antarctica, as suggested by all the CH 4 data at hand.
The sampling interval of the Vostok •18Oat m record is close to the turnover time of atmospheric 02 [Sowers et al., 1993]
26,552 CHAPPELLAZ ET AL.: CH 4 AND •5•O 2 OVER THE EEMIAN PERIOD
and can be considered as reflecting the "true" atmospheric signal, apart from MIS-3 where the core quality did not allow a regular sampling step. The detailed Vostok CH 4 record discussed above, covering the full MIS-5e period with a mean sampling interval of-300 years, cannot rule out atmospheric CH 4 variations of shorter duration that could have been recorded at Summit where the gas-trapping process happens faster. Over the rest of the Vostok CH 4 profile, the sampling interval is highly variable and can be as long as -5000 years in the MIS-6 and MIS-7 periods. In these periods, the Vostok CH 4 profile is far from resolving all the atmospheric CH 4 variability. This is the biggest present limitation in using the Vostok CH 4 record as a dating constraint.
The CH 4 and •18Oat m measurements performed in different laboratories, apart from LMCE, have been intercalibrated recently [Sowers et al., this issue], allowing us to apply the required correction factors. The calibration of LMCE •18Oat m data is still under progress, but the comparison with URI results on Vostok (Table 1) suggests a good agreement in the first order (difference of-0.1%o).
6.1. GRIP
So far, 29 depth levels have been analyzed both in CH 4 and $18Oatrn below 2750 m on the GRIP core. They are represented by single points in Plate lb, together with the Vostok "reference" line. We note first that they fall neither into the very end of MIS-6 nor into the start of MIS-5e. It is still possible that ice from these periods is present at GRIP but was not analyzed for both gases. Further measurements should clarify this issue. We note, however, that no ice with these characteristics is found in the GISP2 record below 2800
m either (see below). The colored line in Plate lb runs through the data pairs from 2781 to 2847 m, with changing color at each corresponding $•Oico extremum. From 2781 to 2789 m (stage 5el), the GRIP line seems to follow well the Mostok line, with corresponding age (EGT timescale) of 113 and 119 kyr B.P., respectively. With the present sampling of the data pairs, this suggests that the GRIP stratigraphy is undisturbed down to the depth of 2789 m. Then from 2789 to 2847 m, the data pairs go back and forth between two regions of the graph: one characterized by moderately high CH 4 and the lowest •18Oat m and the other with CH 4 ranging
from 420 to 500 ppbv and •5•aO•i,. from +0.5 to +0.75%o. Plate l c shows where the ice enclosing these data pairs is located in the GRIP •5•aOico profile. In Plate l a, we present in the form of bars the time periods in the Vostok chronology where the corresponding data pairs are observed.
The first region mentioned above is observed only twice in the 220-kyr Vostok record, soon after the interglacial maxima at 10 and 130 kyr B.P. These data pairs thus suggest that the GRIP warm stages in the "Eem" correspond indeed to the period between 118 and 128 kyr B.P. in the Vostok EGT chronology [Jouzel et al., 1993], covering the major part of MIS-5e. The second region includes all the GRIP data pairs correlative with the cold isotopic values of the "Eem" and the undisturbed GRIP ice of MIS-5d. According to Plate 1 a, we find comparable data pairs in Vostok MIS-5d but also in other time periods including MIS-7b [Vostok Project Members, 1995], MIS-5b, MIS-4, and maybe part of MIS-3. However, if this ice corresponds to a repeated sequence of younger ice in the GRIP profile, the ice parameters such as •sOic o or Ca 2+ should depict comparable levels. Indeed, among MIS-3, 4, 5b, and 5d, MIS-5d is the stage depicting the closest values for both ice parameters [GRIP Project Members, 1993]. Of course, this "cold" ice could also correspond to MIS-7b or even older ice. But it seems more probable to envisage, due to the repeatability of high and low levels of •5•O•o and CH 4 along the 5el to 5e5 sequence, that this sequence results from the mixing of ice from MIS-5d and MIS-5e.
Another region of interest, with low CH 4 and high •18Oatrn , includes the measurements between 2883 and 2901 m. The
•SlaOi•o is fairly stable there and indicates the coldest conditions in the record below 2860 m. In Vostok, the corresponding region is encountered at only two occasions over the last 220 kyr: between -138 and 142 kyr B.P. (EGT chronology) and between 16 and 21 kyr B.P. (Plate l a). Most probably, we observe at these depths in GRIP ice formed during the coldest part of MIS-6, but it is also possible that it corresponds to a previous glaciation, not yet characterized in the Vostok record. The current extension of the Vostok
drilling will allow us to investigate this possibility. The rest of the data pairs fall in a region which is not
easily characterized in the Vostok records. These samples will probably be the most difficult to date with respect to the
Plate 1. CH 4 and •18Oat m combinations as a dating constraint for the GRIP core. (a) CH 4 and •18Oat m covariations over the last 220 kyr as depicted by the Vostok ice core. We note the quasi-systematic lag of •18Oat m over CH4, allowing us to characterize some time periods with a specific CH4/•18Oat m data pair. The CH 4 trends from the end of MIS-6 to MIS-Sd are shown with color codes. As in Figure 1, the marine isotope stage boundaries correspond to the midtransition of the •180at m profile minus 2 kyr (delay on ice volume). (b) Phase plane of CH 4 and •180at m from the end of MIS-6 to MIS-Sd (142-104 kyr B.P. in the EGT chronology of Jouzel et al. [1993]), illustrated by the colored line without symbols and obtained by extrapolating the Vostok •18Oat m results to the depths of the CH 4 samples. The solid circles and diamonds correspond to GRIP data pairs between 2780 and 2910 m. The GRIP CH 4 data are corrected for the Greenland/Antarctic concentration difference as explained in the text. From 2781 to 2789 m, the data pairs (blue) are linked by a blue colored line. This part seems in agreement with the Vostok phase plane from 113 to 119 kyr B.P. From 2789 to 2847 m, they are color coded and linked with a grey solid line. We note that the data pairs go back and forth between the green and red boxes, which are identified by corresponding bars in the Plate 1 a. The blue box includes three data pairs with characteristics of MIS-6 and MIS-2 in Plate la. (c) GRIP b•8Oi•e and CH 4 profiles as a function of depth. The colored solid circles and the solid diamonds on the CH 4 curve follow the same coding as in Plate lb. The colored bars allow one to visualize the time periods on Vostok (Plate l a) when comparable CH4/•18Oatrn data pairs are found over the last 220 kyr.
CHAPPELLAZ ET AL.' CH 4 AND •5]aO 2 OVER THE EEMIAN PERIOD 26,553
Marine• (a) sotopel Stage•J • I 2 I 3 I ..... ,4,, ........... 15a I 5b..I.5c I. _S__d_. 15e i 6 I 7a 17b 1 7c I
0 50,000 100,000 150,000 200,000 Age (yr BP)
-0.4
0.0
v
0.4 .• 0
0.• m
1.2
0.0
0.8
1.2
' t '. (b)
VOSTOK
MIS-Sd
-. - MIS-Se
MIS-6
300 400 500 600 700
Antarctic CH 4 (ppbv) (c) • 5d I 5ei 15e215e31 5e4 I 5e5 I .......
ß
•-36
-40 -42
2780 2800 2820 2880 2900
700._. >
600 •::•.
500t,,•
4OO
2840 2860
Depth (m) 292O
26,554 CHAPPELLAZ ET AL.: CH4 AND 15•sO 2 OVER THE EEMIAN PERIOD
Vostok record, except if a record of a third gas with a different behavior than CH 4 and 15•O,,m is available in the future.
In conclusion, the preliminary sequence depicted by the data pairs CH4/•lSOatm suggests that the sequence from 5el to 5e5 is a mixing of ice from MIS-5d or possibly MIS-7 and MIS-5e. None of our samples analyzed to date depict conditions characterizing the warmer part of the interglacial in Vostok (end of MIS-6 and start of MIS-5e). Finally, some samples have MIS-6 signatures.
6.2. GISP2
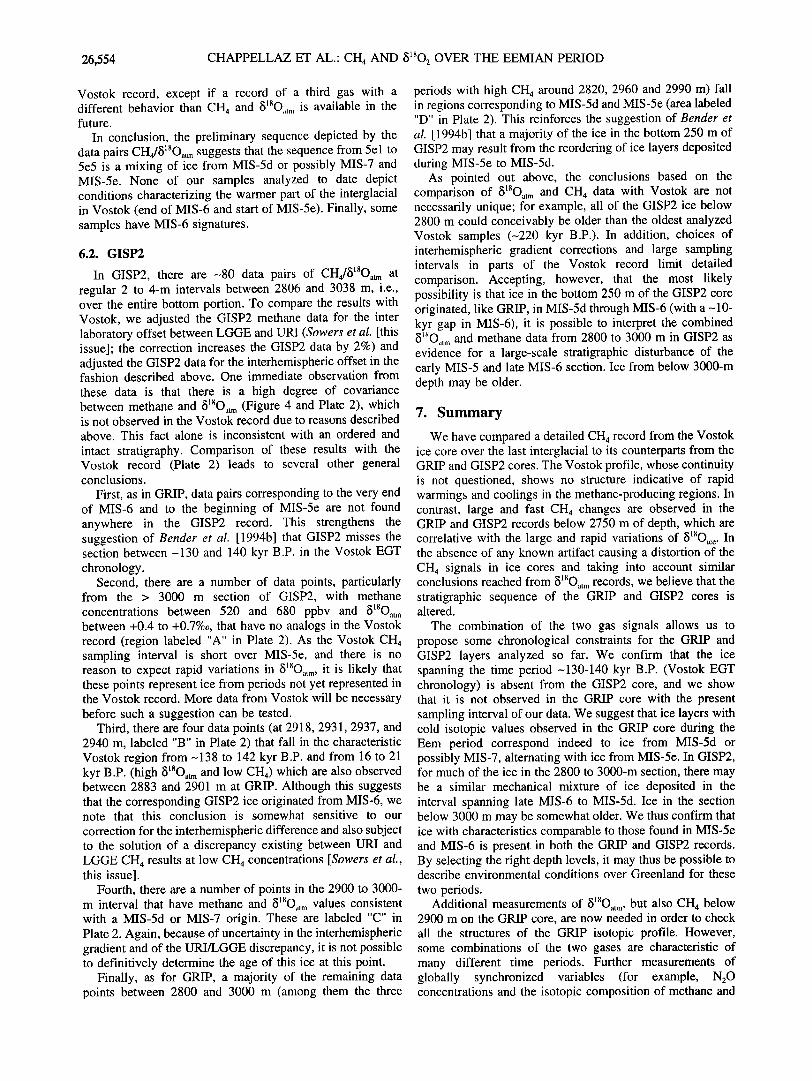
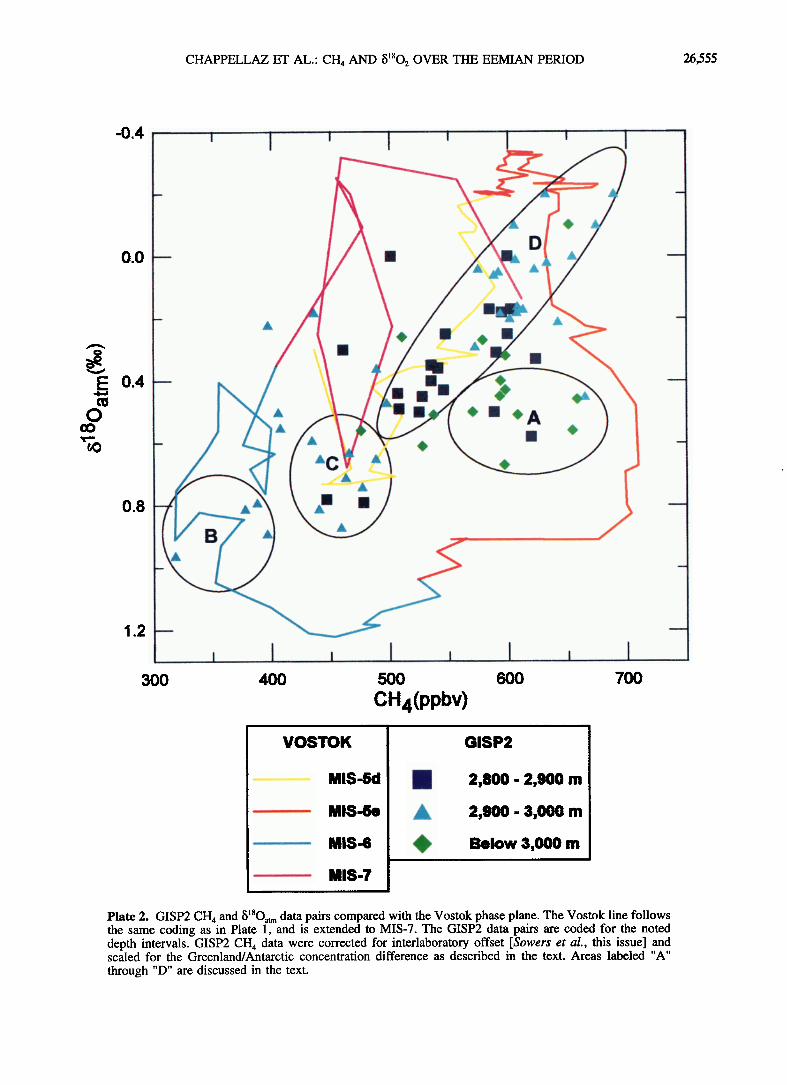
In GISP2, there are -80 data pairs of CH4/•laOatm at regular 2 to 4-m intervals between 2806 and 3038 m, i.e., over the entire bottom portion. To compare the results with Vostok, we adjusted the GISP2 methane data for the inter laboratory offset between LGGE and URI (Sowers et al. [this issue]; the correction increases the GISP2 data by 2%) and adjusted the GISP2 data for the interhemispheric offset in the fashion described above. One immediate observation from these data is that there is a high degree of covariance between methane and •18Oat m (Figure 4 and Plate 2), which is not observed in the Vostok record due to reasons described above. This fact alone is inconsistent with an ordered and intact stratigraphy. Comparison of these results with the Vostok record (Plate 2) leads to several other general conclusions.
First, as in GRIP, data pairs corresponding to the very end of MIS-6 and to the beginning of MIS-5e are not found anywhere in the GISP2 record. This strengthens the suggestion of Bender et al. [1994b] that GISP2 misses the section between -130 and 140 kyr B.P. in the Vostok EGT chronology.
Second, there are a number of data points, particularly from the > 3000 m section of GISP2, with methane concentrations between 520 and 680 ppbv and •18Oat m between +0.4 to +0.7%0, that have no analogs in the Vostok record (region labeled "A" in Plate 2). As the Vostok CH 4 sampling interval is short over MIS-5e, and there is no reason to expect rapid variations in •j18Oatm, it is likely that these points represent ice from periods not yet represented in the Vostok record. More data from Vostok will be necessary before such a suggestion can be tested.
Third, there are four data points (at 2918, 2931, 2937, and 2940 m, labeled "B" in Plate 2) that fall in the characteristic Vostok region from -138 to 142 kyr B.P. and from 16 to 21 kyr B.P. (high •18Oat m and low CH4) which are also observed between 2883 and 2901 m at GRIP. Although this suggests that the corresponding GISP2 ice originated from MIS-6, we note that this conclusion is somewhat sensitive to our
correction for the interhemispheric difference and also subject to the solution of a discrepancy existing between URI and LGGE CH 4 results at low CH 4 concentrations [Sowers et al., this issue].
Fourth, there are a number of points in the 2900 to 3000- m interval that have methane and •18Oat m values consistent with a MIS-5d or MIS-7 origin. These are labeled "C" in Plate 2. Again, because of uncertainty in the interhemispheric gradient and of the URI/LGGE discrepancy, it is not possible to definitively determine the age of this ice at this point.
Finally, as for GRIP, a majority of the remaining data points between 2800 and 3000 m (among them the three
periods with high CH 4 around 2820, 2960 and 2990 m) fall in regions corresponding to MIS-5d and MIS-5e (area labeled "D" in Plate 2). This reinforces the suggestion of Bender et al. [1994b] that a majority of the ice in the bottom 250 m of GISP2 may result from the reordering of ice layers deposited during MIS-5e to MIS-5d.
As pointed out above, the conclusions based on the comparison of •18Oat m and CH 4 data with Vostok are not necessarily unique; for example, all of the GISP2 ice below 2800 m could conceivably be older than the oldest analyzed Vostok samples (-220 kyr B.P.). In addition, choices of interhemispheric gradient corrections and large sampling intervals in parts of the Vostok record limit detailed comparison. Accepting, however, that the most likely possibility is that ice in the bottom 250 m of the GISP2 core originated, like GRIP, in MIS-5d through MIS-6 (with a -10- kyr gap in MIS-6), it is possible to interpret the combined 15•O•,Lm and methane data from 2800 to 3000 m in GISP2 as evidence for a large-scale stratigraphic disturbance of the early MIS-5 and late MIS-6 section. Ice from below 3000-m depth may be older.
7. Summary
We have compared a detailed CH 4 record from the Vostok ice core over the last interglacial to its counterparts from the GRIP and GISP2 cores. The Vostok profile, whose continuity is not questioned, shows no structure indicative of rapid warmings and coolings in the methane-producing regions. In contrast, large and fast CH 4 changes are observed in the GRIP and GISP2 records below 2750 m of depth, which are correlative with the large and rapid variations of 15•8Oice . In the absence of any known artifact causing a distortion of the CH 4 signals in ice cores and taking into account similar conclusions reached from •18Oat m records, we believe that the stratigraphic sequence of the GRIP and GISP2 cores is altered.
The combination of the two gas signals allows us to propose some chronological constraints for the GRIP and GISP2 layers analyzed so far. We confirm that the ice spanning the time period -130-140 kyr B.P. (Vostok EGT chronology) is absent from the GISP2 core, and we show that it is not observed in the GRIP core with the present sampling interval of our data. We suggest that ice layers with cold isotopic values observed in the GRIP core during the Eem period correspond indeed to ice from MIS-5d or possibly MIS-7, alternating with ice from MIS-5e. In GISP2, for much of the ice in the 2800 to 3000-m section, there may be a similar mechanical mixture of ice deposited in the interval spanning late MIS-6 to MIS-5d. Ice in the section below 3000 m may be somewhat older. We thus confirm that ice with characteristics comparable to those found in MIS-5e and MIS-6 is present in both the GRIP and GISP2 records. By selecting the right depth levels, it may thus be possible to describe environmental conditions over Greenland for these
two periods. Additional measurements of 8•O•tm, but also CH 4 below
2900 m on the GRIP core, are now needed in order to check all the structures of the GRIP isotopic profile. However, some combinations of the two gases are characteristic of many different time periods. Further measurements of globally synchronized variables (for example, N20 concentrations and the isotopic composition of methane and
CHAPPELLAZ ET AL.' CH 4 AND 8•O2 OVER THE EEMIAN PERIOD 26,555
-0.4
0.0
v
0.4
1.2
300 400 500 600
VOSTOK
MIS-Sd
.... MIS-Se
............... MIS-6
.... - ........ MIS-7
CH4(ppbv) , ,
GISP2
D
A
L , ,I
2,800 - 2,900 m
2,900 - 3,000 m
Below 3,000 m
I 7O0
Plate 2. GISP2 CH 4 and •18Oat m data pairs compared with the Vostok phase plane. The Vostok line follows the same coding as in Plate 1, and is extended to MIS-7. The GISP2 data pairs are coded for the noted depth intervals. GISP2 CH 4 data were corrected for interlaboratory offset [Sowers et al., this issue] and scaled for the Greenland/Antarctic concentration difference as described in the text. Areas labeled "A" through "D" are discussed in the text.
26,556 CHAPPELLAZ ET AL.: CH 4 AND b•O2 OVER THE EEMIAN PERIOD
N20 ), as well as more measurements of methane and b18Oatm in Vostok and the early glacial part of GRIP and GISP2, may provide additional constraints in the future.
Acknowledgments. This work is a contribution to the Greenland Ice Core Project (GRIP), coordinated and supported by the European Science Foundation. We thank the national funding organizations in Belgium, Denmark, France, Germany, Iceland, Italy, Switzerland and the United Kingdom, together with the XII Directorate of CEC and the Fondation de France.
Measurements of CH 4 and •18Oat m in the GISP2 core were supported by grants from the U.S. National Science Foundation. We thank all participants to the field work, both at Summit and at Vostok, for ice drilling and sampling. We are most grateful to A. Vadrot for measurements of part of the new Vostok samples, to J. Orchardo and M. Swanson for measurements of GISP2
samples, and to C. Bourg for b18Oau, analyses at LMCE. We are much indebted to M. Bender, A. Fuchs, S. Johnsen, J. Jouzel, M. Leuenberger, D. Raynaud, T. Sowers, B. Stauffer, and M. Stievenard for fruitful discussions and critical review of the
paper. J.C. deeply thanks D. Haan and F. Candaudap for sampling of the GRIP Eem in Copenhagen.
References
Alley, R. B., A.J. Gow, S.J. Johnsen, J. Kipfstuhl, D.A. Meese, and T. Thorsteinsson, Comparison of deep ice cores, Nature, 373, 393-394, 1995.
Barnola, J.-M., P. Pimienta, D. Raynaud, and Y.S. Korotkevich, CO2-climate relationship deduced from the Vostok ice core: A re-examination based on new measurements and on a re-
evaluation of the air dating, Tellus, 43 Ser. B, 83-90, 1991. Bender, M., T. Sowers, and L. Labeyrie, The Dole effect and its
variations during the last 130,000 years as measured in the Vostok ice core, Global Biogeochem. Cycles, 8, 363-376, 1994a.
Bender, M., T. Sowers, M.-L. Dickson, J. Orchardo, P. Grootes, P. Mayewski, and D. Meese, Climate connections between Greenland and Antarctica during the last 100,000 years, Nature, 372, 663-666, 1994b.
Blunier, T., J. Chappellaz, J. Schwander, J.M. Barnola, T. Desperts, B. Stauffer, and D. Raynaud, Atmospheric methane, record from a Greenland ice core over the last 1,000 years, Geophys. Res. Lett., 20, 2219-2222, 1993.
Blunier, T., J. Chappellaz, J. Schwander, B. Stauffer, and D. Raynaud, Variations in atmospheric methane concentration during the Holocene epoch, Nature, 374, 46-49, 1995.
Brook, E. J., M.L. Bender, J. Orchardo, and T.A. Sowers, Atmospheric methane and climate during the last 110 kyr: Results from the GISP II ice core, Eos Trans. A GU, 75 (44), Fall Meet. Suppl., 381, 1994.
Brook, E.J., T. Sowers, and J. Orchardo, Rapid variations in atmospheric methane concentration during the past 110,000 years, Science, 273, 1087-1091, 1996.
Chappellaz, J., J.-M. Barnola, D. Raynaud, Y.S. Korotkevich, and C. Lorius, Atmospheric CH 4 record over the last climatic cycle revealed by the Vostok ice core, Nature, 345, 127-131, 1990.
Chappellaz, J. A., I.Y. Fung, and A.M. Thompson, The atmospheric CH 4 increase since the last glacial maximum, 1, Source estimates, Tellus, 45 Ser. B, 228-241, 1993a.
Chappellaz, J., T. Blunier, D. Raynaud, J.-M. Barnola, J. Schwander, and B. Stauffer, Synchronous changes in atmospheric CH 4 and Greenland climate between 40 and 8 kyr B.P., Nature, 366, 443-445, 1993b.
Chappellaz, J., T. B lunier, S. Kints, A. D•illenbach, J.-M. Barnola, J. Schwander, D. Raynaud, and B. Stauffer, Changes in the atmospheric CH 4 gradient between Greenland and
Antarctica during the Holocene, J. Geophys. Res., in press, 1997.
Dansgaard, W., et al., Evidence for general instability of past climate from a 250-kyr ice-core record, Nature, 364, 218-220, 1993.
Dlugokericky, E.J., L.P. Steele, P.M. Lang, and K.A. Masarie, The growth rate and distribution of atmospheric methane, J. Geophys. Res., 99, 17,021-17,043, 1994.
Fuchs, A., and M. Leuenberger, •5•80 of atmospheric oxygen measured on GRIP ice core documents stratigraphic disturbances in the lowest 10% of the core, Geophys. Res. Lett., 23, 1049-1052, 1996.
Fung, I., J. John, J. Lerner, E. Matthews, M. Prather, L.P. Steele, and P.J. Fraser, Three-dimensional model synthesis of the global methane cycle, J. Geophys. Res., 96, 13,033-13,065, 1991.
Greenland Ice Core Project (GRIP) Project Members, Climate instability during the last interglacial period recorded in the GRIP ice core, Nature, 364, 203-207, 1993.
Grootes, P.M., M. Stuiver, J.W.C. White, S. Johnsen, and J. Jouzel, Comparison of oxygen isotope records from the GISP2 and GRIP Greenland ice cores, Nature, 366, 552-554, 1993.
Guiot, J., J.L. de Beaulieu, R. Cheddadi, F. David, P. Ponel, and M. Reille, The climate in western Europe during the last glacial/interglacial cycle derived from pollen and insect remains, Palaeogeogr. Palaeoclimatol. Palaeoecol., 103, 73- 93, 1993.
Johnsen, S.J., H.B. Clausen, W. Dansgaard, N.S. Gundestrup, C.U. Hammer, and H. Tauber, The Eem stable isotope record along the GRIP ice core and its interpretation, Quat. Res., 43, 117-124, 1995.
Jouzel, J., et al., Extending the Vostok ice-core record of palcoclimate to the penultimate glacial period, Nature, 364, 407-412, 1993.
Keigwin, L.D., W.B. Curry, S.J. Lehman, and S.J. Johnsen, The role of the deep ocean in North Atlantic climate change between 70 and 130 kyr ago, Nature, 371,323-326, 1994.
Martinerie, P., V.Y. Lipenkov, D. Raynaud, J. Chappellaz, N.I. Barkov, and C. Lorius, Air content palco record in the Vostok ice core (Antarctica): A mixed record of climatic and glaciological parameters, J. Geophys. Res., 99, 10,565-10,576, 1994.
McManus, J. F., G.C. Bond, W.S. Broecker, S. Johnsen, L. Labeyrie, and S. Higgins, High-resolution climate records from the North Atlantic during the last interglacial, Nature, 371, 326-329, 1994.
Schwander, J., J.-M. Barnola, C. Andri6, M. Leuenberger, A. Ludin, D. Raynaud, and B. Stauffer, The age of the air in the firn and the ice at Summit, Greenland, J. Geophys. Res., 98, 2831-2838, 1993.
Souchez, R., M. Lemmens, and J. Chappellaz, Flow-induced mixing in the GRIP basal ice deduced from the CO 2 and CH 4 records, Geophys. Res. Lett., 22, 41-44, 1995.
Sowers, T. A., and M. Bender, Climate records during the last deglaciation, Science, 269, 210-214, 1995.
Sowers, T., M. Bender, and D. Raynaud, Elemental and isotopic composition of occluded 02 and N2 in polar ice, J. Geophys. Res., 94, 5137-5150, 1989.
Sowers, T., M. Bender, D. Raynaud, Y.S. Korotkevich, and J. Orchardo, The/5•80 of atmospheric 02 from air inclusions in the Vostok ice core: Timing of CO 2 and ice volume changes during the penultimate deglaciation, Paleoceanography, 6, 679-696, 1991.
Sowers, T., M. Bender, L. Labeyrie, D. Martinson, J. Jouzel, D. Raynaud, J.J. Pichon, and Y.S. Korotkevich, A 135,000-year Vostok-SPECMAP common temporal framework, Paleoceanography, 8, 737-766, 1993.
Sowers, T., et al., An interlaboratory comparison of techniques for extracting and analyzing trapped gases in ice cores, J. Geophys. Res., this issue.
CHAPPELLAZ ET AL.: CH 4 AND 15•SO 2 OVER THE EEMIAN PERIOD 26,557
Thouveny, N., et al., A high resolution record of the last climate cycle in western Europe from magnetic susceptibility in Maar lake sequences, Nature, 371,503-506, 1994.
Vostok Project Members, International effort helps decipher mysteries of paleoclimate from Antarctic ice cores, Eos Trans. AGU, 76 (17), 169,179, 1995.
T. Blunier, Physikalisches Institut, Universitiit Bern, Sidlerstrasse 5, CH-3012 Bern, Switzerland. (e-mail: tblunier@ climate.unibe.ch)
E. Brook, Department of Geology, Department of Environmental Science, Washington State University, 14204 Salmon Creek Avenue, Vancouver, WA 98686 (e-mail: brook@ vancouver.wsu.edu)
J. Chappellaz, Laboratoire de Glaciologie et G6ophysique de l'Environnement, CNRS, 54 rue Moli•re, BP 96, 38402 St. Martin d'H•res Cedex, France. (e-mail' [email protected] grenoble.fr)
B. Malaiz6, Laboratoire de Mod61isation du Climat et de l'Environnement, Commissariat h l'Energie Atomique, CE Saclay, 91191 Gif sur Yvette, France. (e-mail: malaize@asterix. . saclay.cea.fr)
(Received January 22, 1996; revised August 14, 1996; accepted January 16, 1997.)