
Ch. 9 examples
29
Ch. 9 examples
-
Upload
xander-farley -
Category
Documents
-
view
47 -
download
0
description
Ch. 9 examples. Summary of Hypothesis test steps. Null hypothesis H 0 , alternative hypothesis H 1 , and preset α Test statistic and sampling distribution P-value and/or critical value 4.Test conclusion If p-value ≤ α, we reject H 0 and say that the data are significant at level α - PowerPoint PPT Presentation
Transcript of Ch. 9 examples

Ch. 9 examples
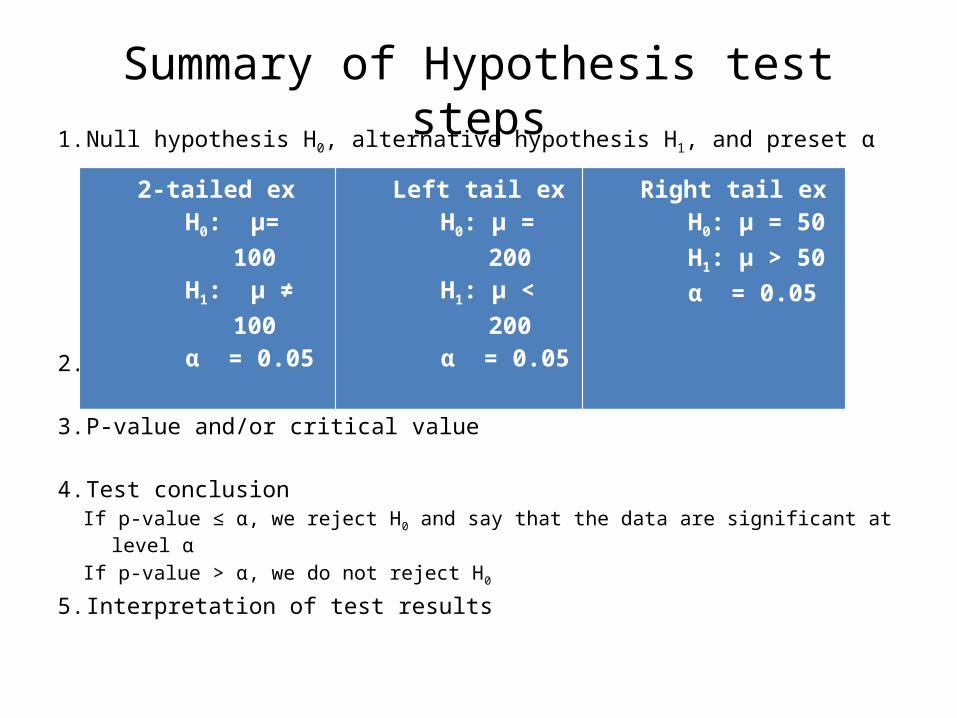
Summary of Hypothesis test steps1. Null hypothesis H0, alternative hypothesis H1, and preset α
2. Test statistic and sampling distribution
3. P-value and/or critical value
4. Test conclusionIf p-value ≤ α, we reject H0 and say that the data are significant at level α
If p-value > α, we do not reject H0
5. Interpretation of test results
2-tailed exH0: µ= 100H1: µ ≠ 100α = 0.05
Left tail exH0: µ = 200H1: µ < 200α = 0.05
Right tail exH0: µ = 50H1: µ > 50α = 0.05
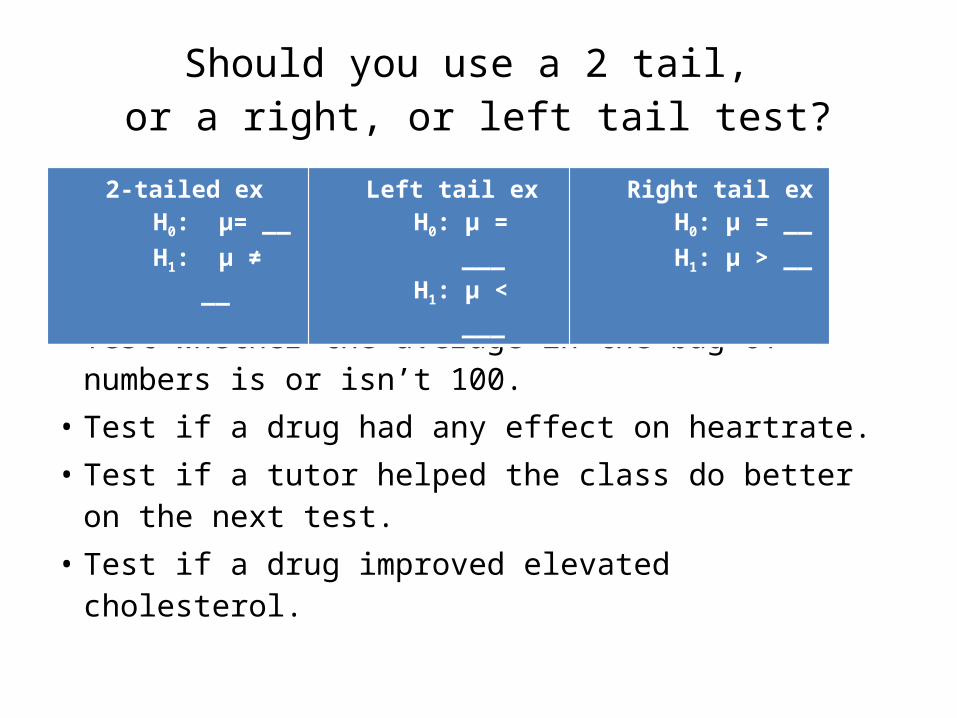
Should you use a 2 tail, or a right, or left tail test?
• Test whether the average in the bag of numbers is or isn’t 100.
• Test if a drug had any effect on heartrate.• Test if a tutor helped the class do better on the
next test.• Test if a drug improved elevated cholesterol.
2-tailed exH0: µ= __H1: µ ≠ __
Left tail exH0: µ = ___H1: µ < ___
Right tail exH0: µ = __H1: µ > __
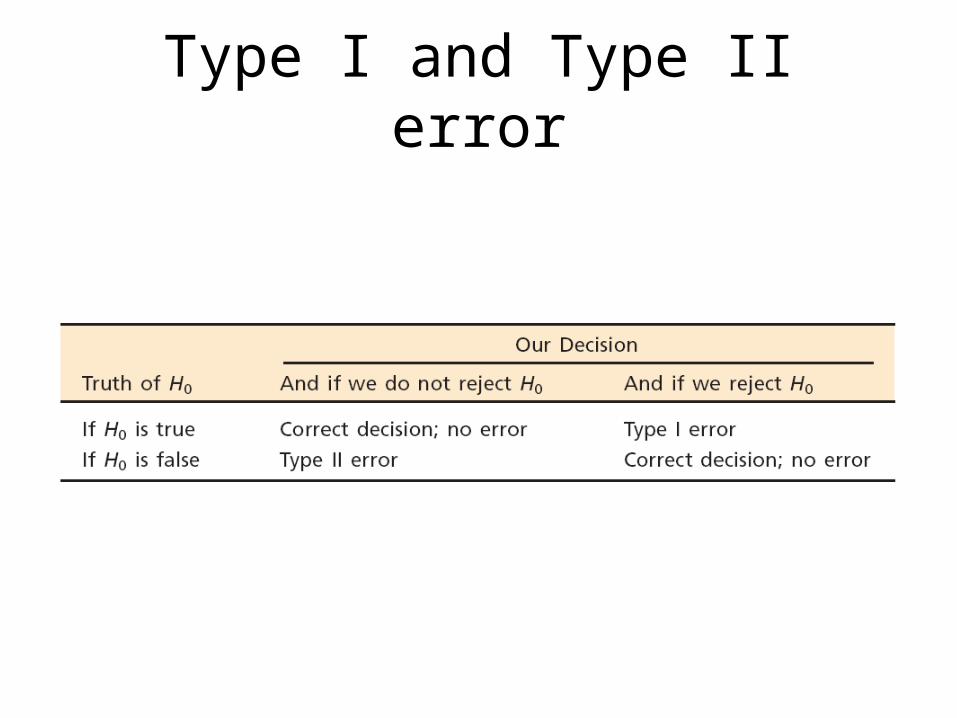
Type I and Type II error
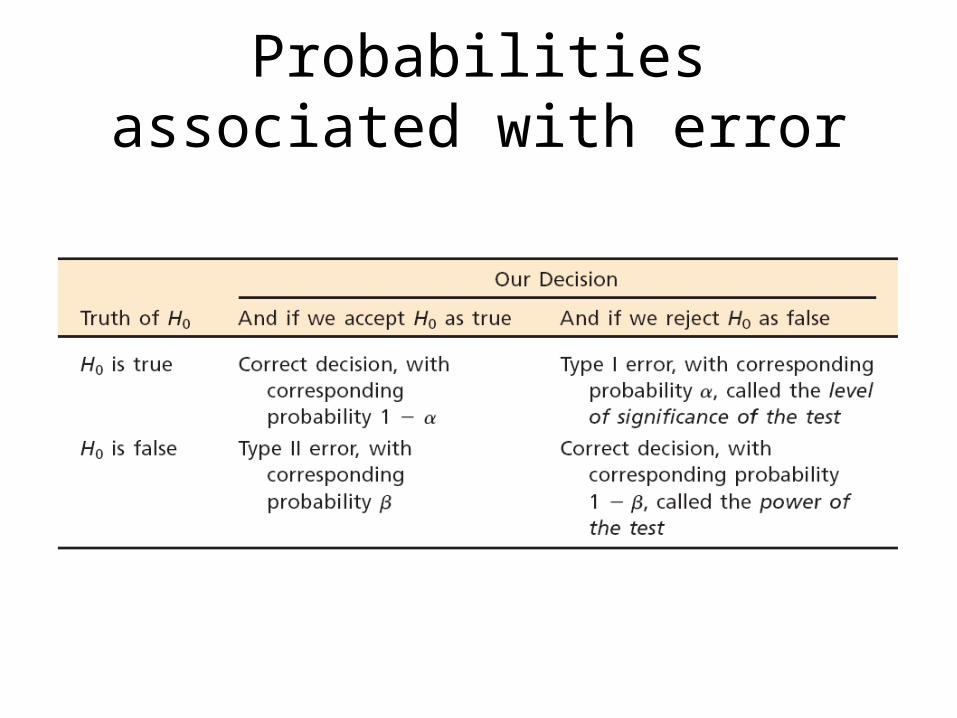
Probabilities associated with error
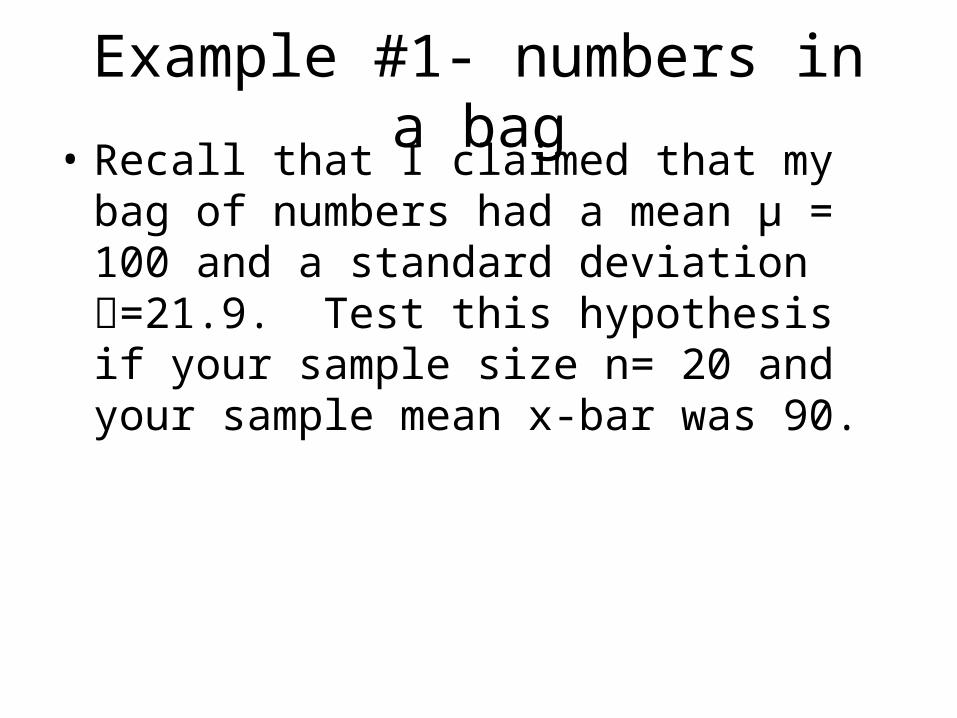
Example #1- numbers in a bag• Recall that I claimed that my bag of numbers
had a mean µ = 100 and a standard deviation =21.9. Test this hypothesis if your sample size n= 20 and your sample mean x-bar was 90.
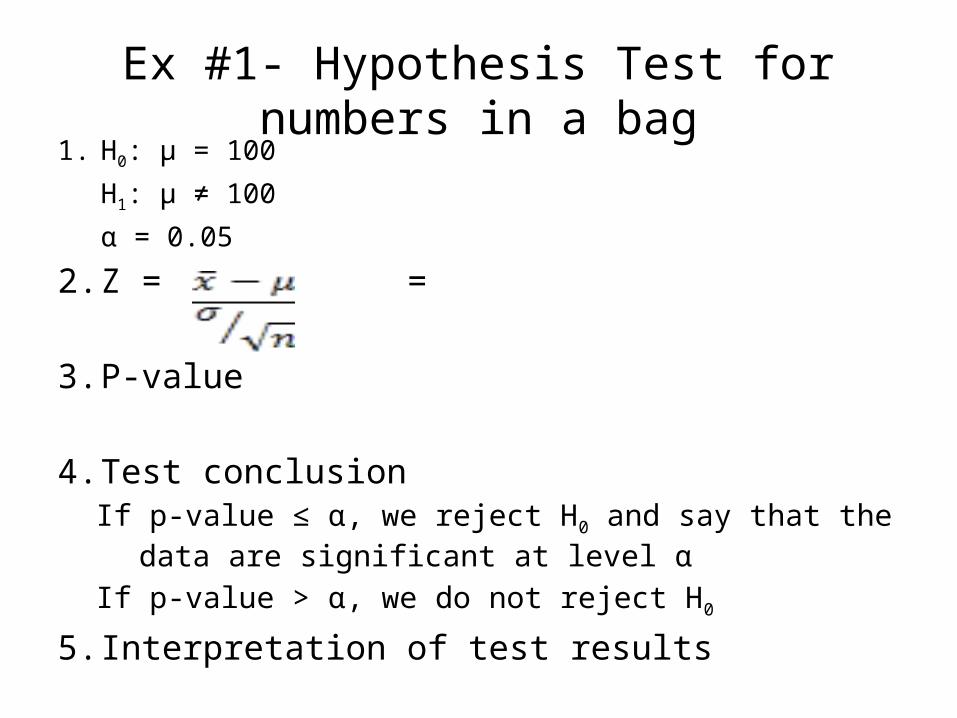
Ex #1- Hypothesis Test for numbers in a bag1. H0: µ = 100
H1: µ ≠ 100
α = 0.05
2. Z = =
3. P-value
4. Test conclusionIf p-value ≤ α, we reject H0 and say that the data are significant
at level αIf p-value > α, we do not reject H0
5. Interpretation of test results
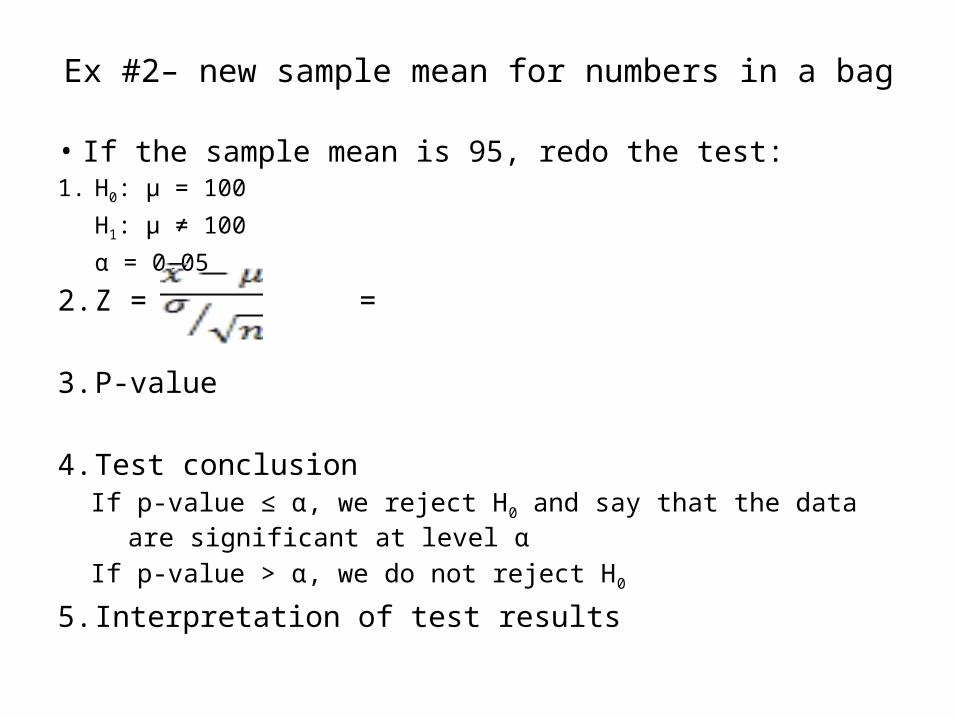
Ex #2– new sample mean for numbers in a bag
• If the sample mean is 95, redo the test:1. H0: µ = 100
H1: µ ≠ 100
α = 0.05
2. Z = =
3. P-value
4. Test conclusionIf p-value ≤ α, we reject H0 and say that the data are significant at level α
If p-value > α, we do not reject H0
5. Interpretation of test results
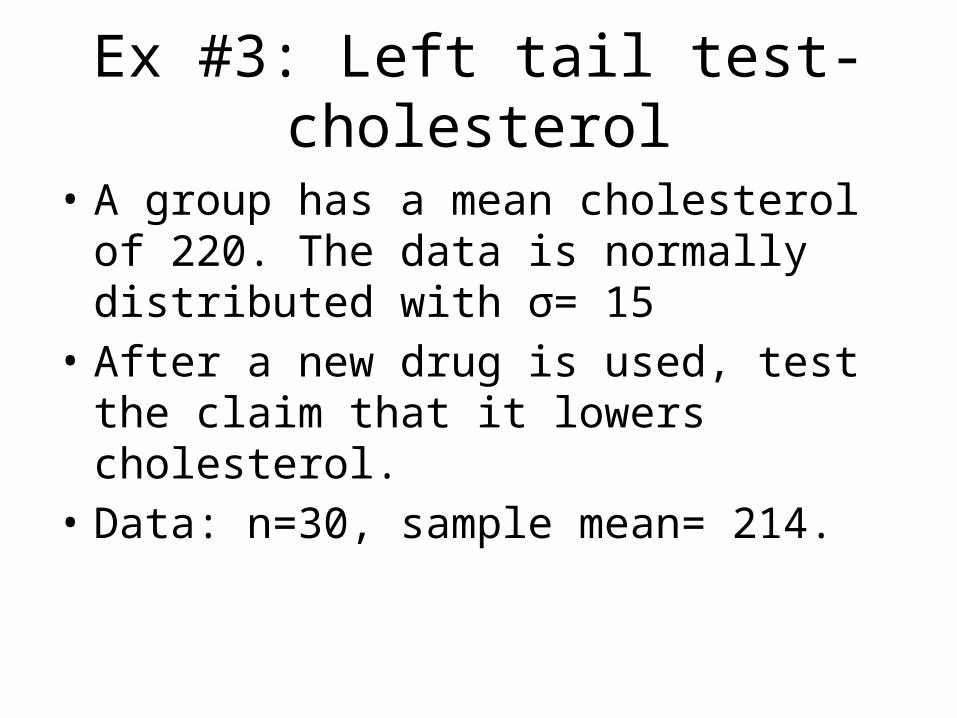
Ex #3: Left tail test- cholesterol
• A group has a mean cholesterol of 220. The data is normally distributed with σ= 15
• After a new drug is used, test the claim that it lowers cholesterol.
• Data: n=30, sample mean= 214.
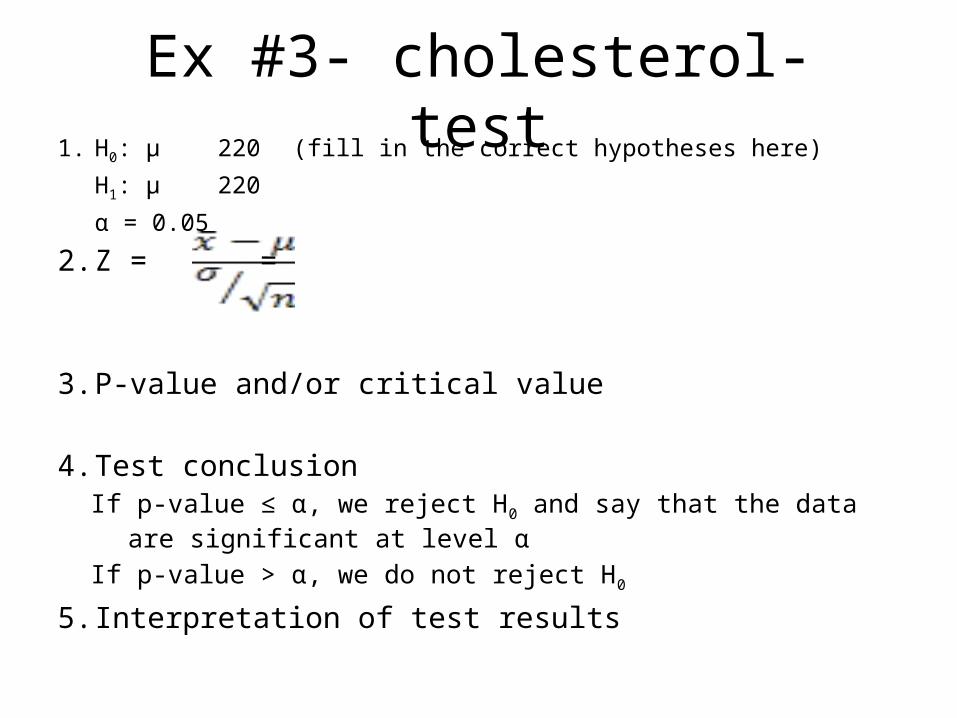
Ex #3- cholesterol- test1. H0: µ 220 (fill in the correct hypotheses here)
H1: µ 220
α = 0.05
2. Z = =
3. P-value and/or critical value
4. Test conclusionIf p-value ≤ α, we reject H0 and say that the data are significant at level α
If p-value > α, we do not reject H0
5. Interpretation of test results

Ex #4- right tail- tutor
• Scores in a MATH117 class have been normally distributed, with a mean of 60 all semester. The teacher believes that a tutor would help. After a few weeks with the tutor, a sample of 35 students’ scores is taken. The sample mean is now 62. Assume a population standard deviation of 5. Has the tutor had a positive effect?

Ex #4: tutor1. H0: µ 60 (fill in the correct hypotheses here)
H1: µ 60
α = 0.05
2. Z = =
3. P-value and/or critical value
4. Test conclusionIf p-value ≤ α, we reject H0 and say that the data are significant at level α
If p-value > α, we do not reject H0
5. Interpretation of test results
9.2– t tests
• Just like with confidence intervals, if we do not know the population standard deviation, we– substitute it with s (the sample standard
deviation) and– Run a t test instead of a z test

Ex #5– t test – placement scores
• The placement director states that the average placement score is 75. Based on the following data, test this claim.
• Data: 42 88 99 51 57 78 92 46 57

Ex #5 t test – placement scores
• 1. H0: µ 75 fill in the correct hypothesis hereH1: µ 75α = 0.05
2. t = =
3. P-value and/or critical value
4. Test conclusionIf p-value ≤ α, we reject H0 and say the data are significant at level αIf p-value > α, we do not reject H0
5. Interpretation of test results

Ex #6- placement scores
• The head of the tutoring department claims that the average placement score is below 80. Based on the following data, test this claim.
• Data: 42 88 99 51 57 78 92 46 57
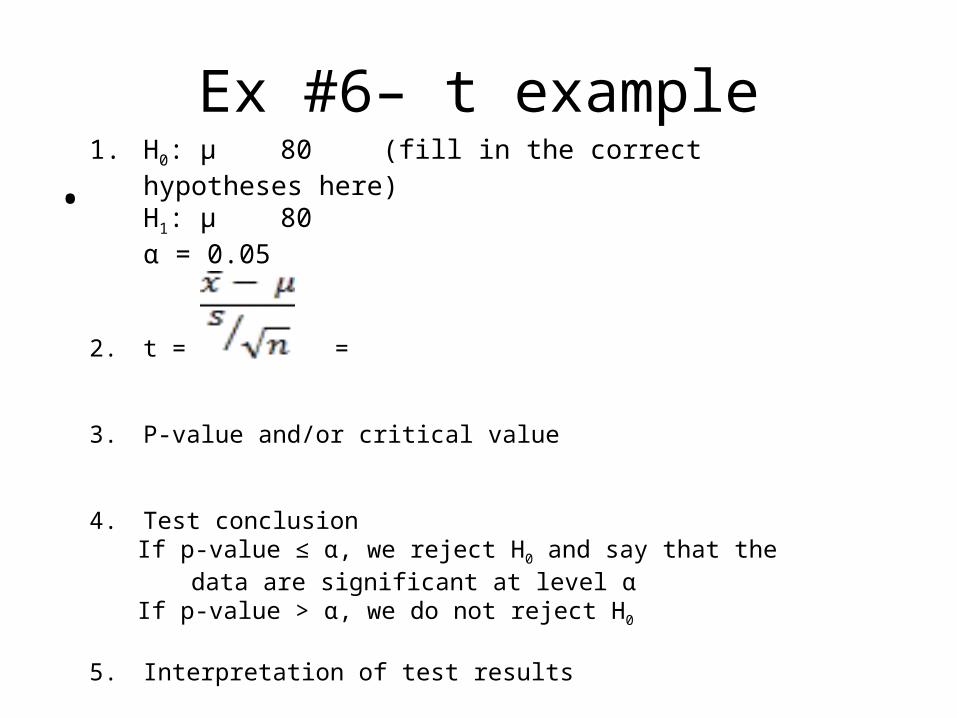
Ex #6– t example
• 1. H0: µ 80 (fill in the correct hypotheses here)
H1: µ 80α = 0.05
2. t = =
3. P-value and/or critical value
4. Test conclusionIf p-value ≤ α, we reject H0 and say that the data are significant at
level αIf p-value > α, we do not reject H0
5. Interpretation of test results

Ex #7- salaries– t
• A national study shows that nurses earn $40,000. A career director claims that salaries in her town are higher than the national average. A sample provides the following data:
• 41,000 42,500 39,000 39,999• 43,000 43,550 44,200

Ex #7- salaries
• 1. H0: µ 40000 (fill in the correct hypotheses here)
H1: µ 40000α = 0.05
2. t = =
3. P-value and/or critical value
4. Test conclusionIf p-value ≤ α, we reject H0 and say that the data are significant at
level αIf p-value > α, we do not reject H0
5. Interpretation of test results
Traditional Critical Value Approach
• Redo Example #1• Recall that I claimed that my bag of numbers
had a mean µ = 100 and a standard deviation =21.9. Test this hypothesis if your sample size n= 20 and your sample mean x-bar was 90.
•
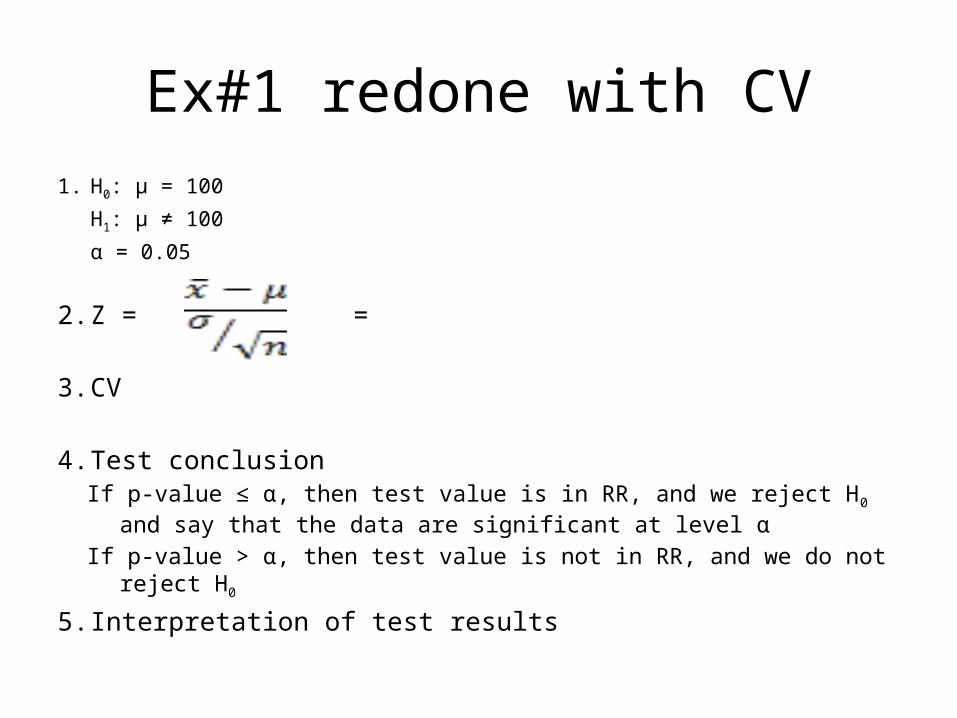
Ex#1 redone with CV1. H0: µ = 100
H1: µ ≠ 100
α = 0.05
2. Z = =
3. CV
4. Test conclusionIf p-value ≤ α, then test value is in RR, and we reject H0 and say that the data
are significant at level αIf p-value > α, then test value is not in RR, and we do not reject H0
5. Interpretation of test results
Ex #3 redone with CV
• A group has a mean cholesterol of 220. The data is normally distributed with σ= 15
• After a new drug is used, test the claim that it lowers cholesterol.
• Data: n=30, sample mean= 214.
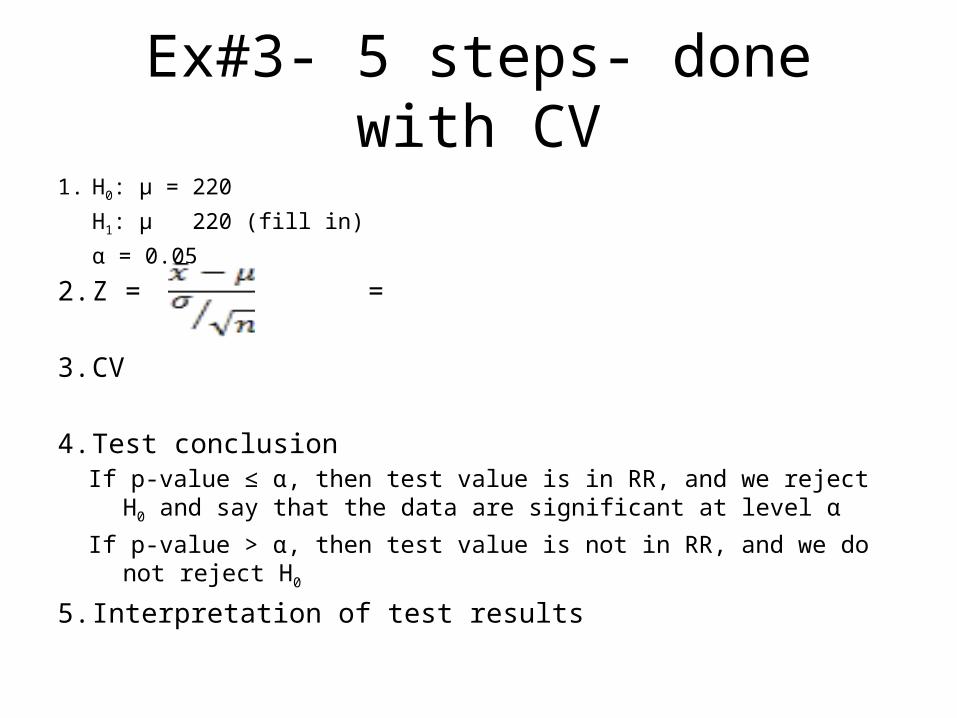
Ex#3- 5 steps- done with CV1. H0: µ = 220
H1: µ 220 (fill in)
α = 0.05
2. Z = =
3. CV
4. Test conclusionIf p-value ≤ α, then test value is in RR, and we reject H0 and say that the
data are significant at level αIf p-value > α, then test value is not in RR, and we do not reject H0
5. Interpretation of test results
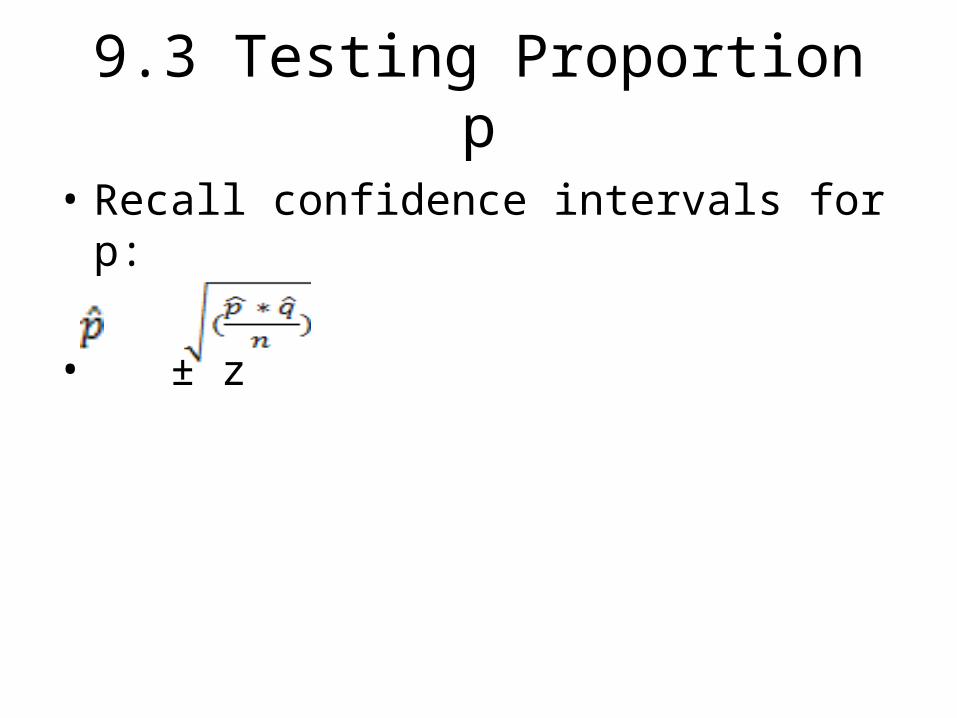
9.3 Testing Proportion p
• Recall confidence intervals for p:
• ± z
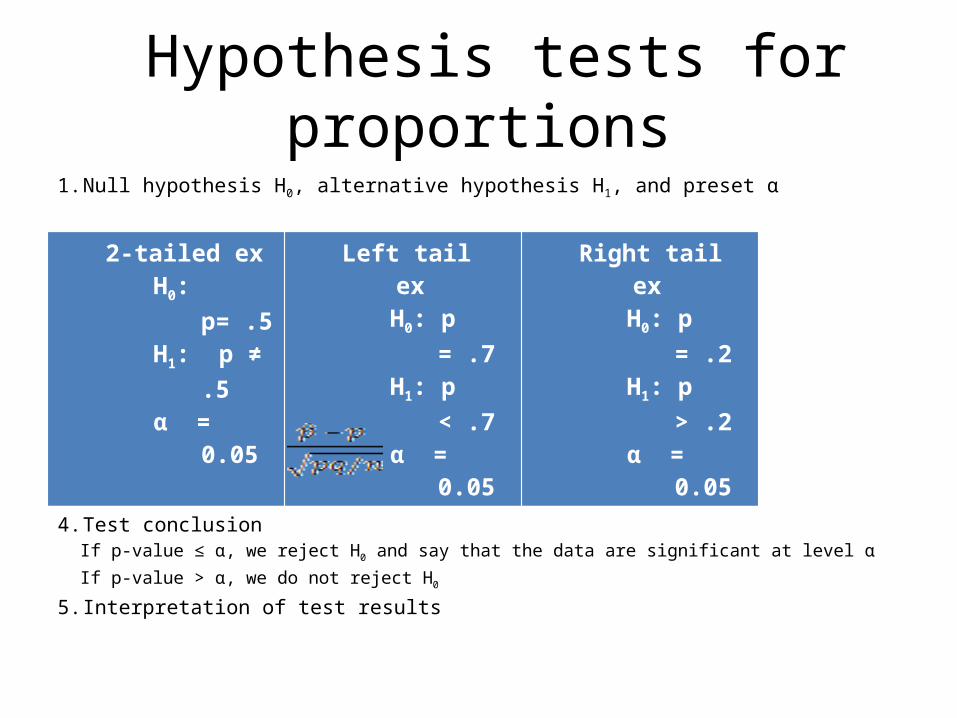
Hypothesis tests for proportions1. Null hypothesis H0, alternative hypothesis H1, and preset α
2. Test statistic and sampling distribution3. P-value and/or critical value
z= =
4. Test conclusionIf p-value ≤ α, we reject H0 and say that the data are significant at level α
If p-value > α, we do not reject H0
5. Interpretation of test results
2-tailed exH0: p= .5H1: p ≠ .5α = 0.05
Left tail exH0: p = .7H1: p < .7α = 0.05
Right tail exH0: p = .2H1: p > .2α = 0.05

Ex #8- proportion who like job
• The HR director at a large corporation estimates that 75% of employees enjoy their jobs. From a sample of 200 people, 142 answer that they do. Test the HR director’s claim.

Ex #81. Null hypothesis H0, alternative hypothesis H1, and preset α
H0: p=.75 (fill in hypothesis)
H1: p
α = 2. Test statistic and sampling distribution
Z = =
3. P-value and/or critical value4. Test conclusion
If p-value ≤ α, we reject H0 and say that the data are significant at level α
If p-value > α, we do not reject H0
5. Interpretation of test results

Ex #9
• Previous studies show that 29% of eligible voters vote in the mid-terms. News pundits estimate that turnout will be lower than usual. A random sample of 800 adults reveals that 200 planned to vote in the mid-term elections. At the 1% level, test the news pundits’ predictions.

Ex #91. Null hypothesis H0, alternative hypothesis H1, and preset α
H0: p (fill in hypothesis)
H1: p
α = 2. Test statistic and sampling distribution
Z = =3. P-value and/or critical value4. Test conclusion
If p-value ≤ α, we reject H0 and say that the data are significant at level α
If p-value > α, we do not reject H0
5. Interpretation of test results