
cfd simulation of a bubbling fluidized bed biomass gasifier using ...
13
5 th ANSA & μETA International Conference CFD SIMULATION OF A BUBBLING FLUIDIZED BED BIOMASS GASIFIER USING ANSA MESHING AND ANSYS FLUENT 1 Dimitrios Mertzis * , 2 Savvas Savvakis, 1 Zissis Samaras 1 Lab of Applied Thermodynamics, Mechanical Engineering Department, Aristotle University of Thessaloniki 2 BETA-CAE Systems SA, Greece KEYWORDS – Multiphase flow, biomass gasification, fludized bed, ANSA, FLUENT ABSTRACT – Biomass is considered to be a renewable energy source with high potential to contribute to the cover of the global energy needs. The exploitation of biomass for energy production through gasification procedures is an environmentally benign solution because it provides heat, electrical energy as well as transportation fuels whose life cycle emits less CO 2 , sulphur and heavy metals in the atmosphere rather than the conventional fuels. The gasification process is very challenging regarding modelling because among others it concerns multiphase fluid dynamics, gas–solid flow, volumetric and particle chemical reactions. Simulating the process using the tools ANSA, ANSYS FLUENT and μETA eventually helped the design and optimization of an industrial-scale biomass gasifier. This paper describes the simulation procedure of a bubbling fluidized bed reactor, where three different meshing approaches were applied. A 180° symmetric cylindrical reactor was used in all models and a special consideration has been given to the effect of the fluidization medium (air) velocity profile to the sand-bed fluidization behaviour. The validation of the results has been based on experimental pressure measurements. TECHNICAL PAPER - 1. INTRODUCTION With gasification in general, residues or waste products such as biomass, tires, municipal waste, refinery residues, and generally any carbonaceous materials, can be utilized to produce heat and power efficiently, while the rural income and energy security through the substitution of coal, oil and natural gas is improved potentially (1). The majority of bioenergy is produced from woody wastes followed by Municipal Solid Wastes (MSW), landfill gases as well as agricultural residues, such as cotton stalks, wheat straw, rice straw, coconut shells, corn stover, rice husks, etc. (2), (3). Therefore, the agricultural sector has the potential to provide substantial amounts of raw material for energy production. Especially, small scale mobile power generation units for the energy utilization of agricultural residues from rural areas where large amounts of biomass agro-residues are available are of great importance towards a sustainable energy world by promoting decentralized energy production. Various technologies have been developed regarding energy conversion in biomass-fuelled in combined heat and power (CHP) systems, including a primary conversion technology that converts biomass into hot water, steam, gaseous or liquid products by means of pyrolysis, combustion or gasification and a secondary conversion technology that transforms these products to heat and power by applying steam engine, steam turbines, stirling engines, internal combustion engines, gas turbines or fuel cells. One of the most widely used combination technology is gasification and ICE, which is particularly utilized for large-scale and medium-scale biomass-fuelled CHP systems. Gasification is a thermo-chemical process that converts carbonaceous materials (coal, petroleum coke, biomass, etc.) into a combustible gas called producer gas. The producer gas can be further utilized either for power generation in CHP plants or in secondary processes (e.g. Fischer Tropsch synthesis, methanation), which convert syngas into synthetic biofuels.
Transcript of cfd simulation of a bubbling fluidized bed biomass gasifier using ...
5th
ANSA & μETA International Conference
CFD SIMULATION OF A BUBBLING FLUIDIZED BED BIOMASS GASIFIER USING ANSA MESHING AND ANSYS FLUENT 1Dimitrios Mertzis*, 2Savvas Savvakis, 1Zissis Samaras 1Lab of Applied Thermodynamics, Mechanical Engineering Department, Aristotle University of Thessaloniki 2BETA-CAE Systems SA, Greece KEYWORDS – Multiphase flow, biomass gasification, fludized bed, ANSA, FLUENT ABSTRACT – Biomass is considered to be a renewable energy source with high potential to contribute to the cover of the global energy needs. The exploitation of biomass for energy production through gasification procedures is an environmentally benign solution because it provides heat, electrical energy as well as transportation fuels whose life cycle emits less CO2, sulphur and heavy metals in the atmosphere rather than the conventional fuels. The gasification process is very challenging regarding modelling because among others it concerns multiphase fluid dynamics, gas–solid flow, volumetric and particle chemical reactions. Simulating the process using the tools ANSA, ANSYS FLUENT and μETA eventually helped the design and optimization of an industrial-scale biomass gasifier. This paper describes the simulation procedure of a bubbling fluidized bed reactor, where three different meshing approaches were applied. A 180° symmetric cylindrical reactor was used in all models and a special consideration has been given to the effect of the fluidization medium (air) velocity profile to the sand-bed fluidization behaviour. The validation of the results has been based on experimental pressure measurements. TECHNICAL PAPER - 1. INTRODUCTION With gasification in general, residues or waste products such as biomass, tires, municipal waste, refinery residues, and generally any carbonaceous materials, can be utilized to produce heat and power efficiently, while the rural income and energy security through the substitution of coal, oil and natural gas is improved potentially (1). The majority of bioenergy is produced from woody wastes followed by Municipal Solid Wastes (MSW), landfill gases as well as agricultural residues, such as cotton stalks, wheat straw, rice straw, coconut shells, corn stover, rice husks, etc. (2), (3). Therefore, the agricultural sector has the potential to provide substantial amounts of raw material for energy production. Especially, small scale mobile power generation units for the energy utilization of agricultural residues from rural areas where large amounts of biomass agro-residues are available are of great importance towards a sustainable energy world by promoting decentralized energy production. Various technologies have been developed regarding energy conversion in biomass-fuelled in combined heat and power (CHP) systems, including a primary conversion technology that converts biomass into hot water, steam, gaseous or liquid products by means of pyrolysis, combustion or gasification and a secondary conversion technology that transforms these products to heat and power by applying steam engine, steam turbines, stirling engines, internal combustion engines, gas turbines or fuel cells. One of the most widely used combination technology is gasification and ICE, which is particularly utilized for large-scale and medium-scale biomass-fuelled CHP systems. Gasification is a thermo-chemical process that converts carbonaceous materials (coal, petroleum coke, biomass, etc.) into a combustible gas called producer gas. The producer gas can be further utilized either for power generation in CHP plants or in secondary processes (e.g. Fischer Tropsch synthesis, methanation), which convert syngas into synthetic biofuels.
5th
ANSA & μETA International Conference
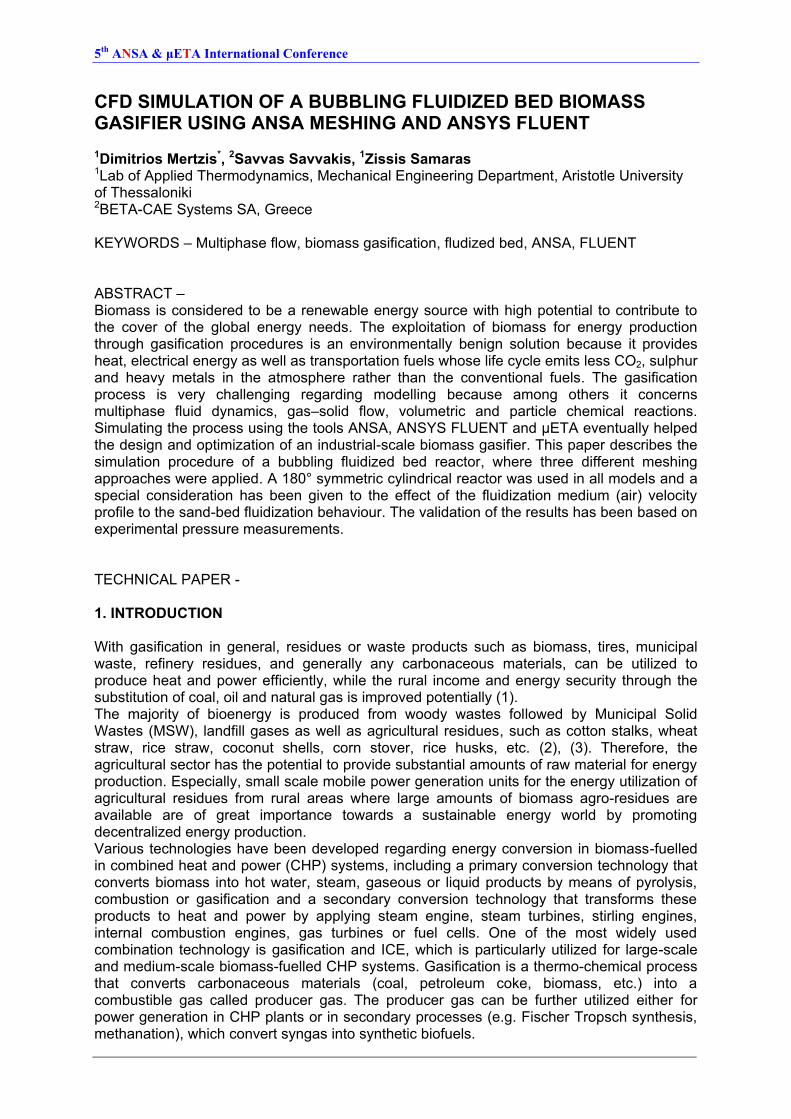
The Laboratory of Applied Thermodynamics (Mechanical Engineering Department of the Aristotle University of Thessaloniki) has developed a small mobile cogeneration unit based on biomass gasification. The unit utilises agricultural residues produced in rural areas of Greece. It consists of a Bubbling Fluidized Bed Gasifier (BFBG) and an Internal Combustion Engine (ICE). The total layout of the unit is illustrated in Figure 1.
Figure 1: CHP unit layout
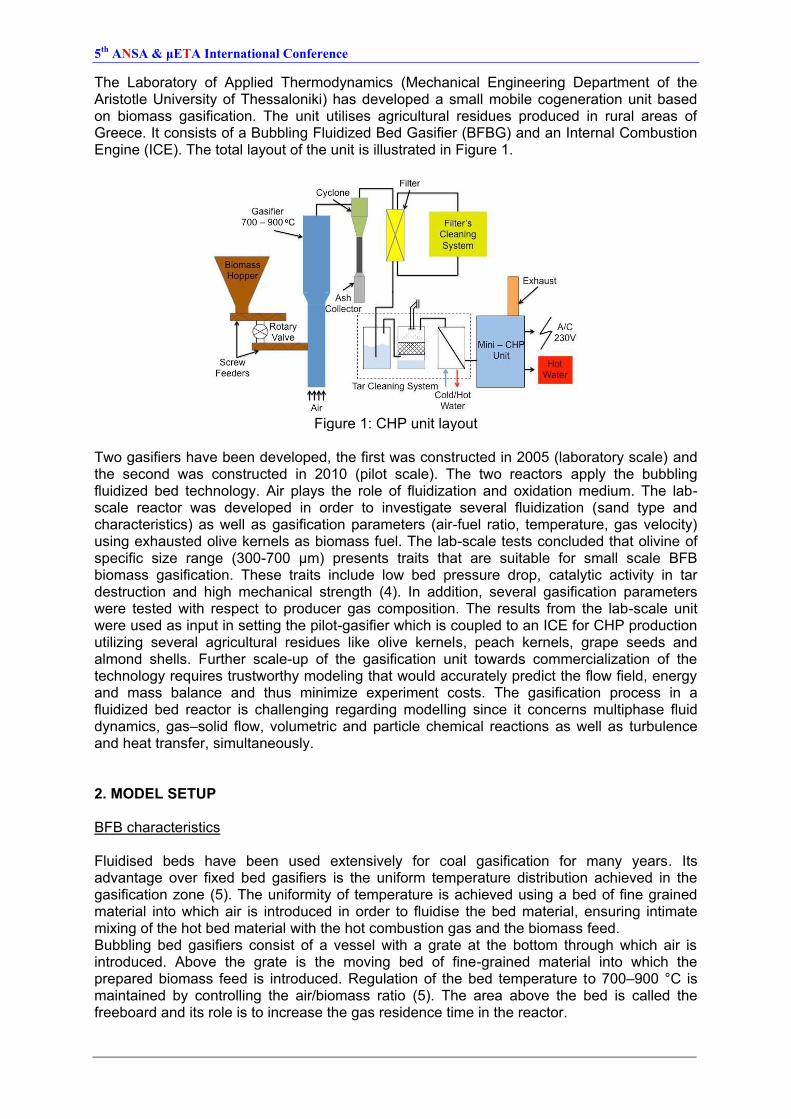
Two gasifiers have been developed, the first was constructed in 2005 (laboratory scale) and the second was constructed in 2010 (pilot scale). The two reactors apply the bubbling fluidized bed technology. Air plays the role of fluidization and oxidation medium. The lab-scale reactor was developed in order to investigate several fluidization (sand type and characteristics) as well as gasification parameters (air-fuel ratio, temperature, gas velocity) using exhausted olive kernels as biomass fuel. The lab-scale tests concluded that olivine of specific size range (300-700 μm) presents traits that are suitable for small scale BFB biomass gasification. These traits include low bed pressure drop, catalytic activity in tar destruction and high mechanical strength (4). In addition, several gasification parameters were tested with respect to producer gas composition. The results from the lab-scale unit were used as input in setting the pilot-gasifier which is coupled to an ICE for CHP production utilizing several agricultural residues like olive kernels, peach kernels, grape seeds and almond shells. Further scale-up of the gasification unit towards commercialization of the technology requires trustworthy modeling that would accurately predict the flow field, energy and mass balance and thus minimize experiment costs. The gasification process in a fluidized bed reactor is challenging regarding modelling since it concerns multiphase fluid dynamics, gas–solid flow, volumetric and particle chemical reactions as well as turbulence and heat transfer, simultaneously. 2. MODEL SETUP BFB characteristics Fluidised beds have been used extensively for coal gasification for many years. Its advantage over fixed bed gasifiers is the uniform temperature distribution achieved in the gasification zone (5). The uniformity of temperature is achieved using a bed of fine grained material into which air is introduced in order to fluidise the bed material, ensuring intimate mixing of the hot bed material with the hot combustion gas and the biomass feed. Bubbling bed gasifiers consist of a vessel with a grate at the bottom through which air is introduced. Above the grate is the moving bed of fine-grained material into which the prepared biomass feed is introduced. Regulation of the bed temperature to 700–900 °C is maintained by controlling the air/biomass ratio (5). The area above the bed is called the freeboard and its role is to increase the gas residence time in the reactor.
5th
ANSA & μETA International Conference
Figure 2: Bubbling fludised bed reactor
In a fluidized bed, the gravitational pull on fluidized particles is offset by the upward fluid drag of the gas. This keeps the particles in a semi-suspended condition. A fluidized bed displays characteristics similar to those of a liquid. The transition from fixed to fluidized bed is controlled through the minimum fluidisation velocity which depends mainly on the fluidization material characteristics (particle density and diameter), as it is shown in Equation 1. The minimum fluidization velocity is a primary design parameter in bubbling fluidized beds as it is used to determine the air flow and subsequently biomass flow in the reactor.
Equation 1
1650
2
pgp
mf
gdU
where, ρp = particle density [kg/m3] ρg = gas density [kg/m3] g = gravity acceleration [m/s2] dp = particle eq. diameter [m] μ = gas viscosity [kg/ms] The bed pressure drop is expressed differently depending whether the air velocity is lower of higher than the minimum fluidization velocity. The pressure drop of the fixed bed (air velocity is lower than the minimum fluidization velocity) is calculated by Ergun (6) through Equation 2.
.
Equation 2
p
g
pd
U
d
U
L
p
2
323
21
75.11
150
Where,
ε = voidage fraction
ɸ = particle sphericity
L = bed height
U = gas superficial velocity
When the gas velocity is equal to the minimum fluidization velocity, the bed pressure drop becomes equal to its weight per unit volume and thus the pressure drop in the fluidized condition is calculated as (7):
5th
ANSA & μETA International Conference
Equation 3 gL
pgp ))(1(
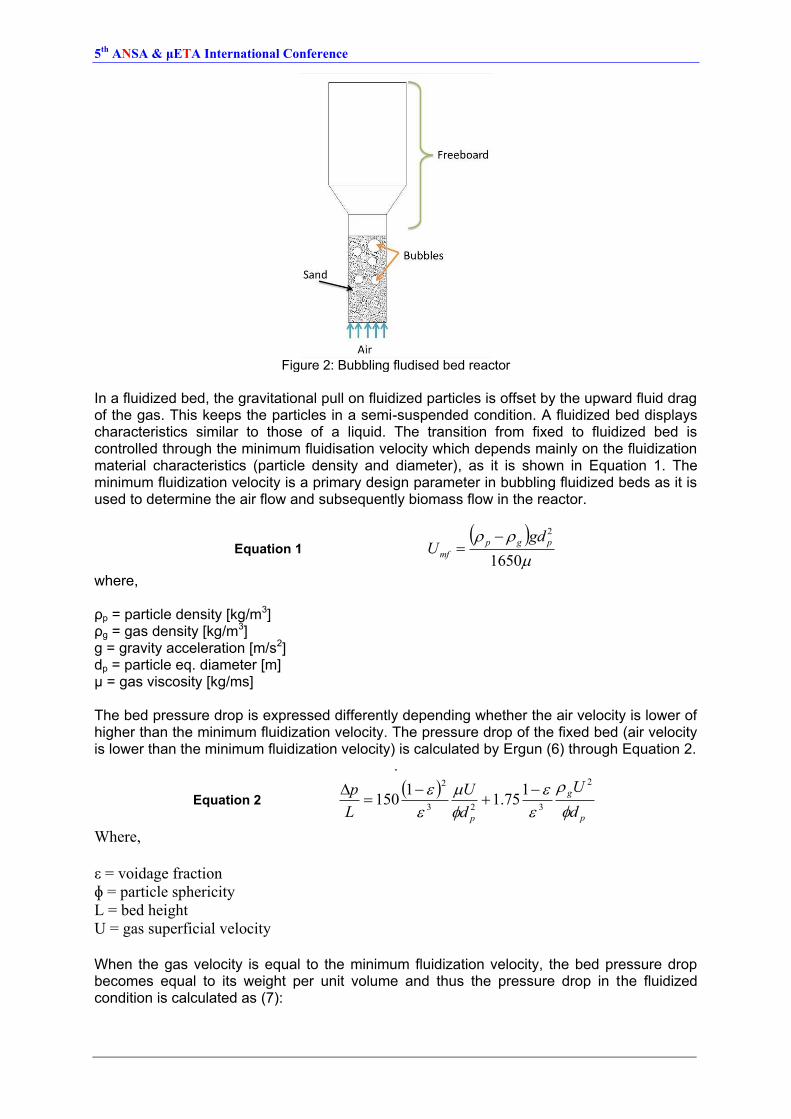
Depending on the gas velocity, the sand characteristics and the air distributor, the fluidization regime varies between bubbling, slugging and turbulent fluidization. For given sand properties and reactor geometry, the transition between fluidization regimes is solely dependent on inlet air conditions (pressure, temperature). The most suitable regime is determined by certain criteria i.e. pressure drop, back-mixing, residence time based on the process target. A rule of thumb for BFBs is to calculate the minimum fluidization velocity (umf) and operate at velocities 50% higher of umf. (8)
Figure 3: Schematics of flow regimes in fluidized bed systems (9)
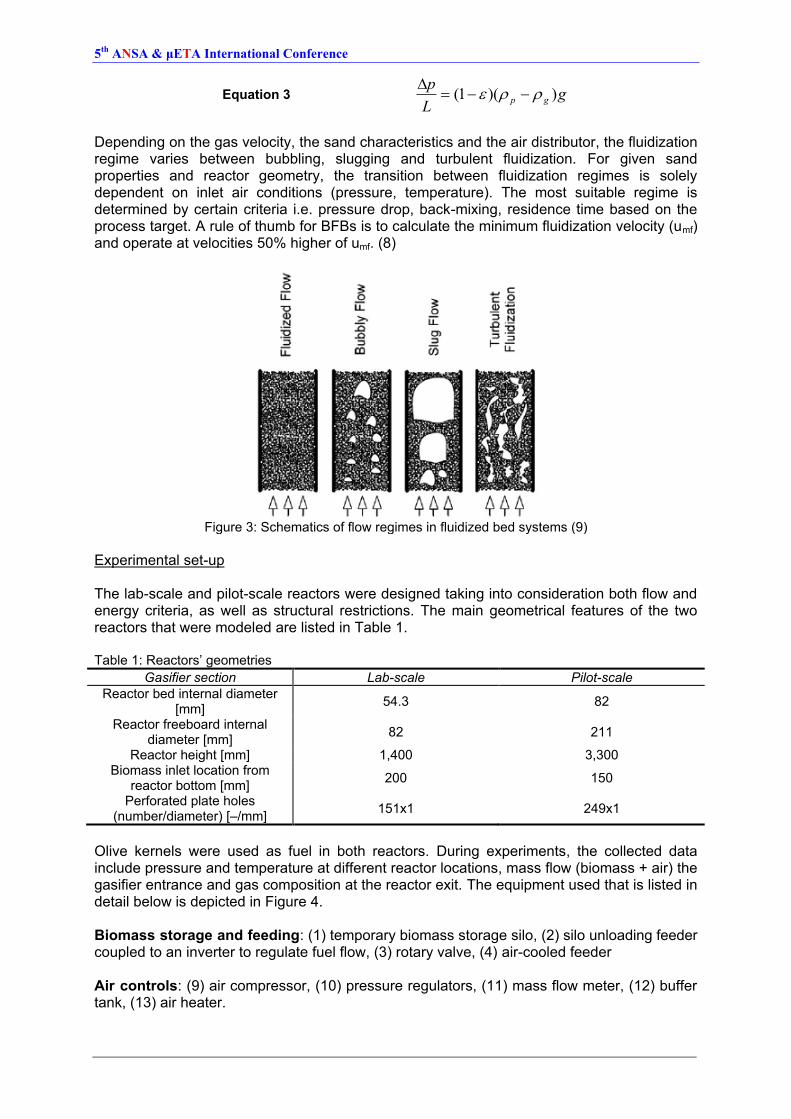
Experimental set-up The lab-scale and pilot-scale reactors were designed taking into consideration both flow and energy criteria, as well as structural restrictions. The main geometrical features of the two reactors that were modeled are listed in Table 1. Table 1: Reactors’ geometries
Gasifier section Lab-scale Pilot-scale
Reactor bed internal diameter [mm]
54.3 82
Reactor freeboard internal diameter [mm]
82 211
Reactor height [mm] 1,400 3,300 Biomass inlet location from
reactor bottom [mm] 200 150
Perforated plate holes (number/diameter) [–/mm]
151x1 249x1
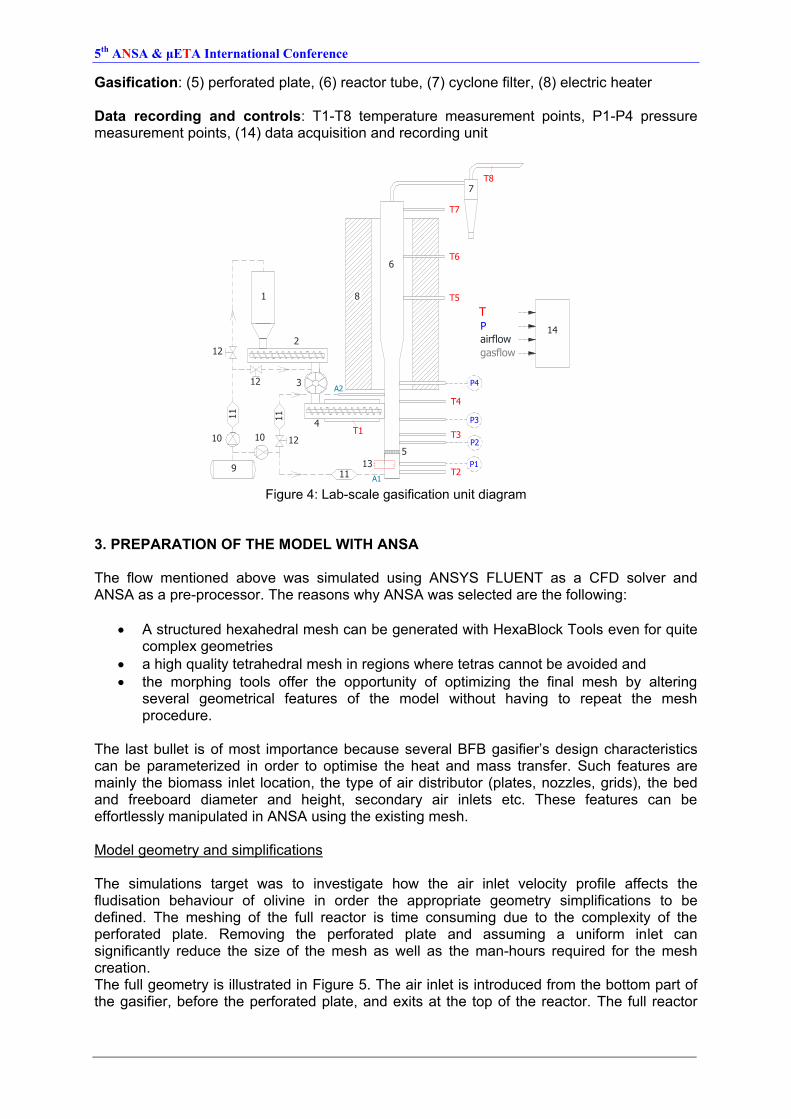
Olive kernels were used as fuel in both reactors. During experiments, the collected data include pressure and temperature at different reactor locations, mass flow (biomass + air) the gasifier entrance and gas composition at the reactor exit. The equipment used that is listed in detail below is depicted in Figure 4. Biomass storage and feeding: (1) temporary biomass storage silo, (2) silo unloading feeder coupled to an inverter to regulate fuel flow, (3) rotary valve, (4) air-cooled feeder Air controls: (9) air compressor, (10) pressure regulators, (11) mass flow meter, (12) buffer tank, (13) air heater.
5th
ANSA & μETA International Conference
Gasification: (5) perforated plate, (6) reactor tube, (7) cyclone filter, (8) electric heater Data recording and controls: T1-T8 temperature measurement points, P1-P4 pressure measurement points, (14) data acquisition and recording unit
Τ1
Τ2
1
122
3
4
10 10
9
5
6
7
8
12
Τ3
Τ4
Τ5
Τ7
Τ8
P1
P2
P3
P4
11
11
Τ6
13
ΤP
airflow
gasflow
14
11
12
A2
A1 Figure 4: Lab-scale gasification unit diagram
3. PREPARATION OF THE MODEL WITH ANSA The flow mentioned above was simulated using ANSYS FLUENT as a CFD solver and ANSA as a pre-processor. The reasons why ANSA was selected are the following:
A structured hexahedral mesh can be generated with HexaBlock Tools even for quite complex geometries
a high quality tetrahedral mesh in regions where tetras cannot be avoided and
the morphing tools offer the opportunity of optimizing the final mesh by altering several geometrical features of the model without having to repeat the mesh procedure.
The last bullet is of most importance because several BFB gasifier’s design characteristics can be parameterized in order to optimise the heat and mass transfer. Such features are mainly the biomass inlet location, the type of air distributor (plates, nozzles, grids), the bed and freeboard diameter and height, secondary air inlets etc. These features can be effortlessly manipulated in ANSA using the existing mesh. Model geometry and simplifications The simulations target was to investigate how the air inlet velocity profile affects the fludisation behaviour of olivine in order the appropriate geometry simplifications to be defined. The meshing of the full reactor is time consuming due to the complexity of the perforated plate. Removing the perforated plate and assuming a uniform inlet can significantly reduce the size of the mesh as well as the man-hours required for the mesh creation. The full geometry is illustrated in Figure 5. The air inlet is introduced from the bottom part of the gasifier, before the perforated plate, and exits at the top of the reactor. The full reactor

5th
ANSA & μETA International Conference
geometry includes the gasifier bed, the freeboard, the perforated plate and the air plenum upstream the plate. The simplified geometry is illustrated in Figure 6. Here. the bottom part where the perforated plate and the air plenum are located has been completely removed. The biomass enters the mesh at the same location as the full geometry. The rest of the model remains the same.
Figure 5: Full reactor geometry
Figure 6: Simplified reactor geometry
Simple geometry meshing – uniform velocity inlet In the simplified model, HEXA BLOCK tools were able to construct an entirely structured mesh with a non-conformal interface at the top of the gasifier without losing any useful information though as the flow direction is towards the finer mesh. The model geometry is divided into 8 primary boxes (Figure 7). The association of boxes with geometry is accomplished with some treatment at the biomass inlet (Figure 8). The CHECK>MODEL FIT tool confirms that the boxes successfully express the geometry of the model with a tolerance of 0.5mm (see Table 1).
Figure 7: The HEXABLOCK boxes before the association with geometry
Figure 8: HEXABLOCK edge associations at biomass inlet junction
5th
ANSA & μETA International Conference
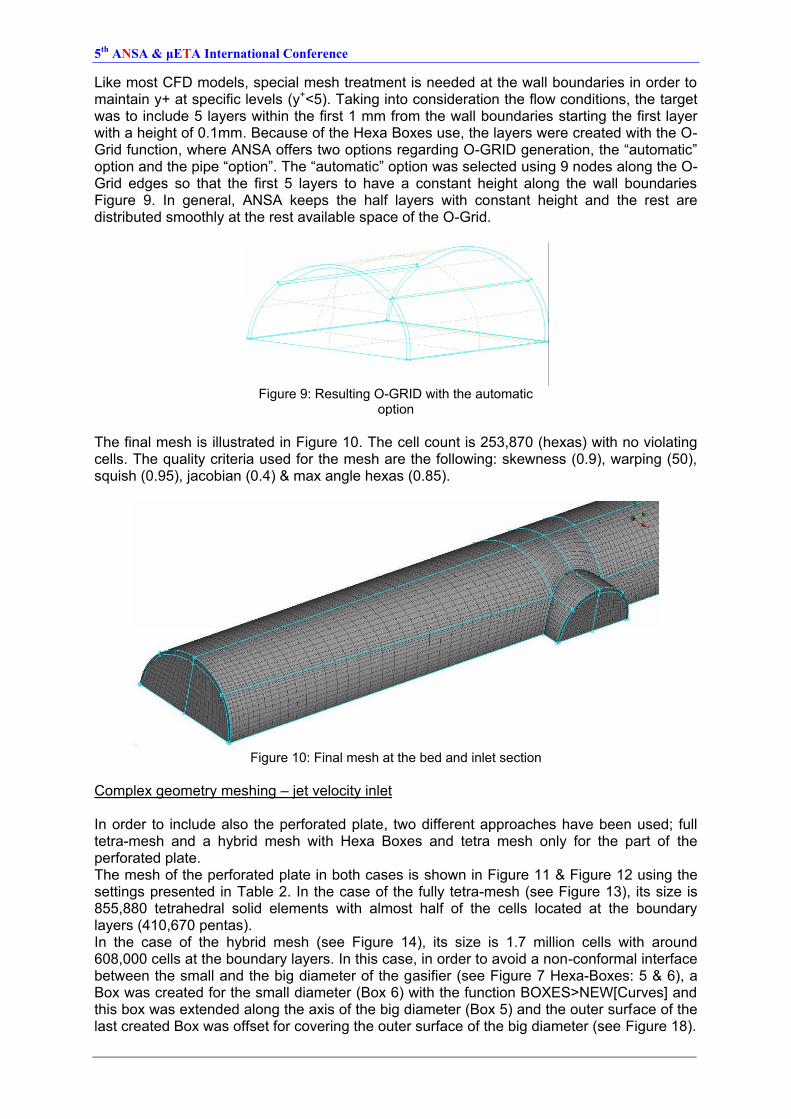
Like most CFD models, special mesh treatment is needed at the wall boundaries in order to maintain y+ at specific levels (y+<5). Taking into consideration the flow conditions, the target was to include 5 layers within the first 1 mm from the wall boundaries starting the first layer with a height of 0.1mm. Because of the Hexa Boxes use, the layers were created with the O-Grid function, where ANSA offers two options regarding O-GRID generation, the “automatic” option and the pipe “option”. The “automatic” option was selected using 9 nodes along the O-Grid edges so that the first 5 layers to have a constant height along the wall boundaries Figure 9. In general, ANSA keeps the half layers with constant height and the rest are distributed smoothly at the rest available space of the O-Grid.
Figure 9: Resulting O-GRID with the automatic
option
The final mesh is illustrated in Figure 10. The cell count is 253,870 (hexas) with no violating cells. The quality criteria used for the mesh are the following: skewness (0.9), warping (50), squish (0.95), jacobian (0.4) & max angle hexas (0.85).
Figure 10: Final mesh at the bed and inlet section
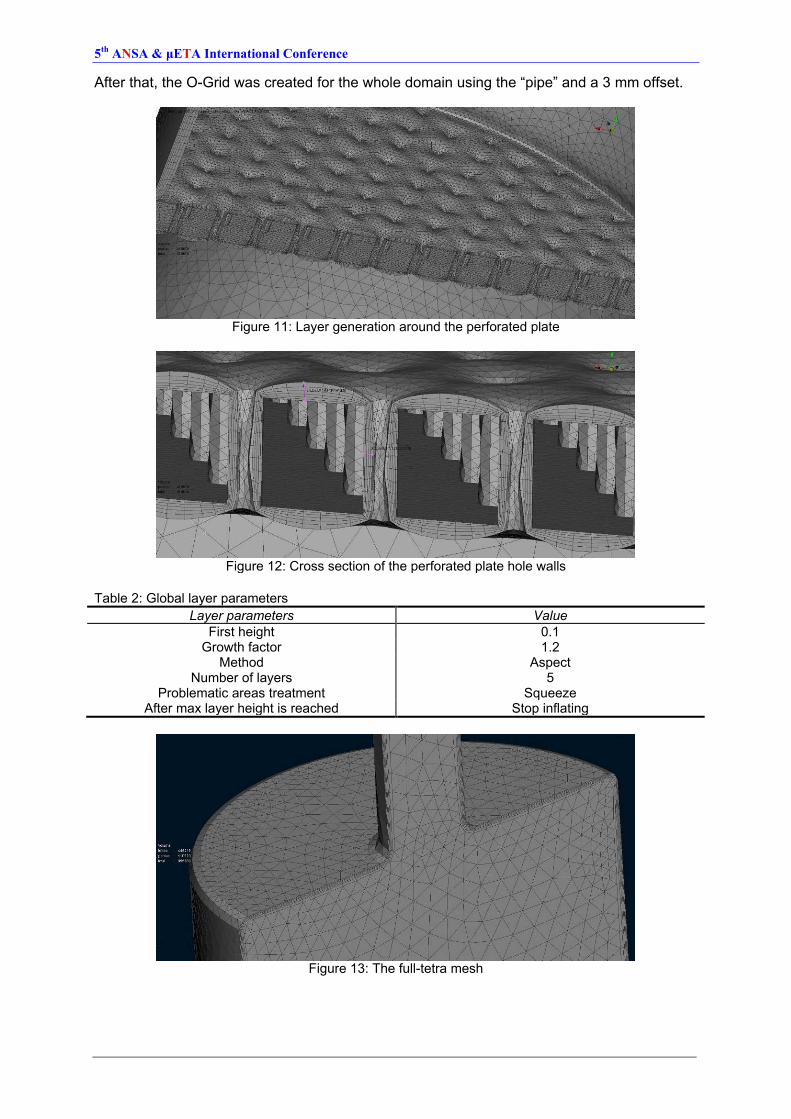
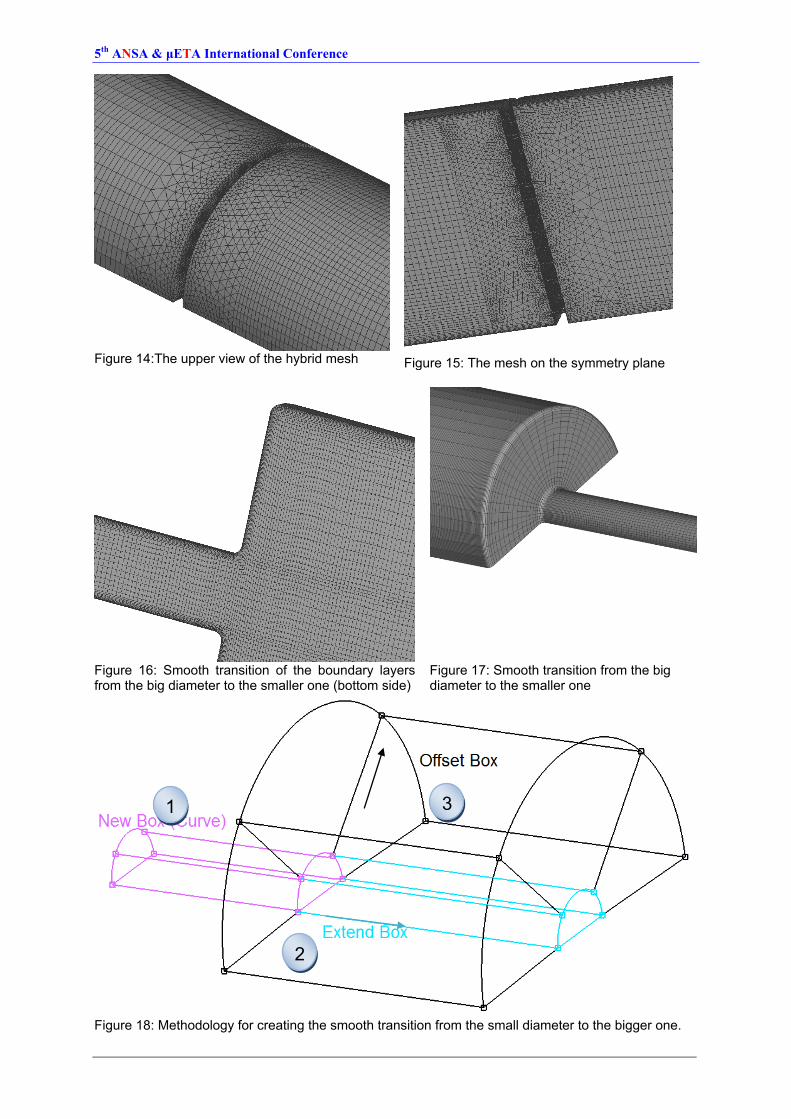
Complex geometry meshing – jet velocity inlet In order to include also the perforated plate, two different approaches have been used; full tetra-mesh and a hybrid mesh with Hexa Boxes and tetra mesh only for the part of the perforated plate. The mesh of the perforated plate in both cases is shown in Figure 11 & Figure 12 using the settings presented in Table 2. In the case of the fully tetra-mesh (see Figure 13), its size is 855,880 tetrahedral solid elements with almost half of the cells located at the boundary layers (410,670 pentas). In the case of the hybrid mesh (see Figure 14), its size is 1.7 million cells with around 608,000 cells at the boundary layers. In this case, in order to avoid a non-conformal interface between the small and the big diameter of the gasifier (see Figure 7 Hexa-Boxes: 5 & 6), a Box was created for the small diameter (Box 6) with the function BOXES>NEW[Curves] and this box was extended along the axis of the big diameter (Box 5) and the outer surface of the last created Box was offset for covering the outer surface of the big diameter (see Figure 18).
5th
ANSA & μETA International Conference
After that, the O-Grid was created for the whole domain using the “pipe” and a 3 mm offset.
Figure 11: Layer generation around the perforated plate
Figure 12: Cross section of the perforated plate hole walls
Table 2: Global layer parameters
Layer parameters Value
First height 0.1 Growth factor 1.2
Method Aspect Number of layers 5
Problematic areas treatment Squeeze After max layer height is reached Stop inflating
Figure 13: The full-tetra mesh
5th
ANSA & μETA International Conference
Figure 14:The upper view of the hybrid mesh
Figure 15: The mesh on the symmetry plane
Figure 16: Smooth transition of the boundary layers from the big diameter to the smaller one (bottom side)
Figure 17: Smooth transition from the big diameter to the smaller one
Figure 18: Methodology for creating the smooth transition from the small diameter to the bigger one.
1
2
3
5th
ANSA & μETA International Conference
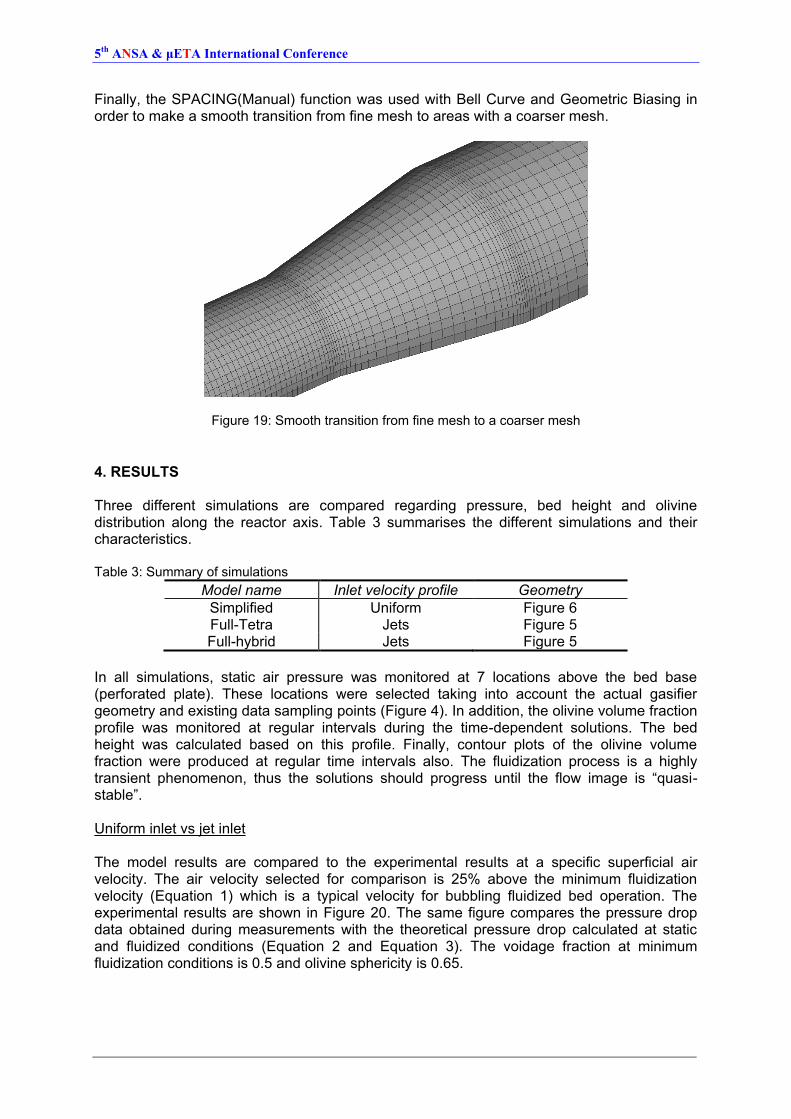
Finally, the SPACING(Manual) function was used with Bell Curve and Geometric Biasing in order to make a smooth transition from fine mesh to areas with a coarser mesh.
Figure 19: Smooth transition from fine mesh to a coarser mesh
4. RESULTS Three different simulations are compared regarding pressure, bed height and olivine distribution along the reactor axis. Table 3 summarises the different simulations and their characteristics. Table 3: Summary of simulations
Model name Inlet velocity profile Geometry
Simplified Uniform Figure 6 Full-Tetra Jets Figure 5 Full-hybrid Jets Figure 5
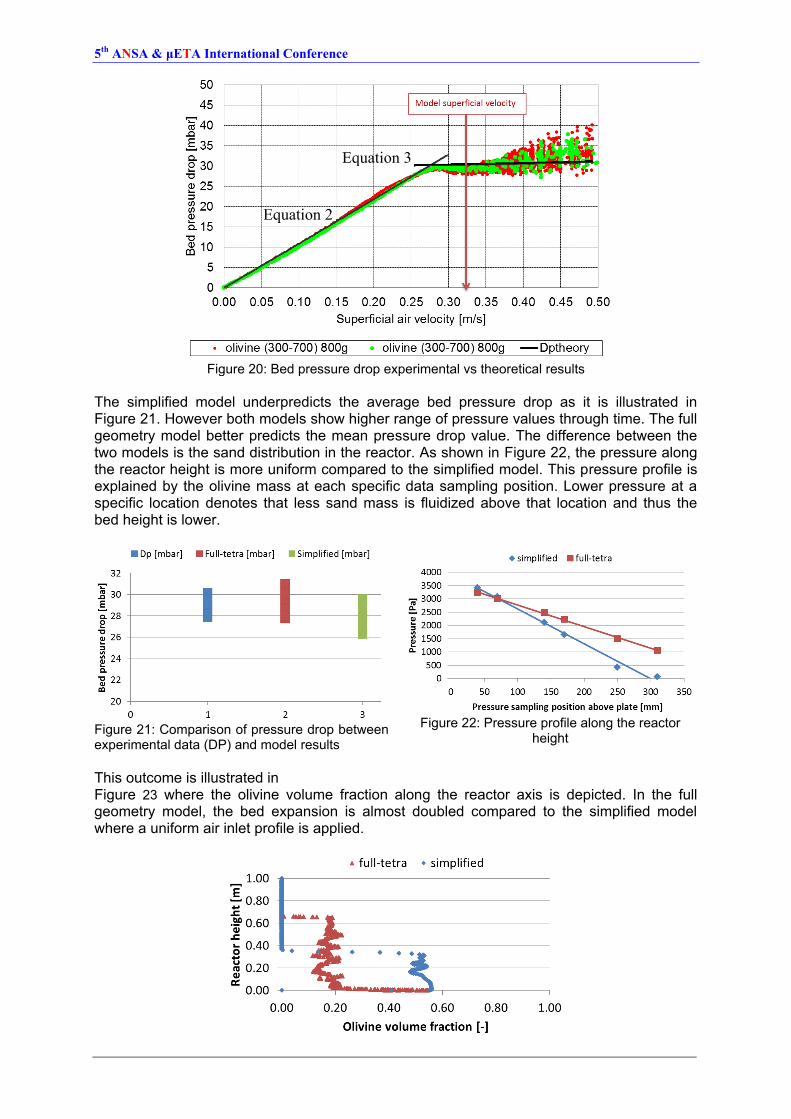
In all simulations, static air pressure was monitored at 7 locations above the bed base (perforated plate). These locations were selected taking into account the actual gasifier geometry and existing data sampling points (Figure 4). In addition, the olivine volume fraction profile was monitored at regular intervals during the time-dependent solutions. The bed height was calculated based on this profile. Finally, contour plots of the olivine volume fraction were produced at regular time intervals also. The fluidization process is a highly transient phenomenon, thus the solutions should progress until the flow image is “quasi-stable”. Uniform inlet vs jet inlet The model results are compared to the experimental results at a specific superficial air velocity. The air velocity selected for comparison is 25% above the minimum fluidization velocity (Equation 1) which is a typical velocity for bubbling fluidized bed operation. The experimental results are shown in Figure 20. The same figure compares the pressure drop data obtained during measurements with the theoretical pressure drop calculated at static and fluidized conditions (Equation 2 and Equation 3). The voidage fraction at minimum fluidization conditions is 0.5 and olivine sphericity is 0.65.
5th
ANSA & μETA International Conference
Figure 20: Bed pressure drop experimental vs theoretical results
The simplified model underpredicts the average bed pressure drop as it is illustrated in Figure 21. However both models show higher range of pressure values through time. The full geometry model better predicts the mean pressure drop value. The difference between the two models is the sand distribution in the reactor. As shown in Figure 22, the pressure along the reactor height is more uniform compared to the simplified model. This pressure profile is explained by the olivine mass at each specific data sampling position. Lower pressure at a specific location denotes that less sand mass is fluidized above that location and thus the bed height is lower.
Figure 21: Comparison of pressure drop between experimental data (DP) and model results
Figure 22: Pressure profile along the reactor
height
This outcome is illustrated in Figure 23 where the olivine volume fraction along the reactor axis is depicted. In the full geometry model, the bed expansion is almost doubled compared to the simplified model where a uniform air inlet profile is applied.
Equation 2
Equation 3
5th
ANSA & μETA International Conference
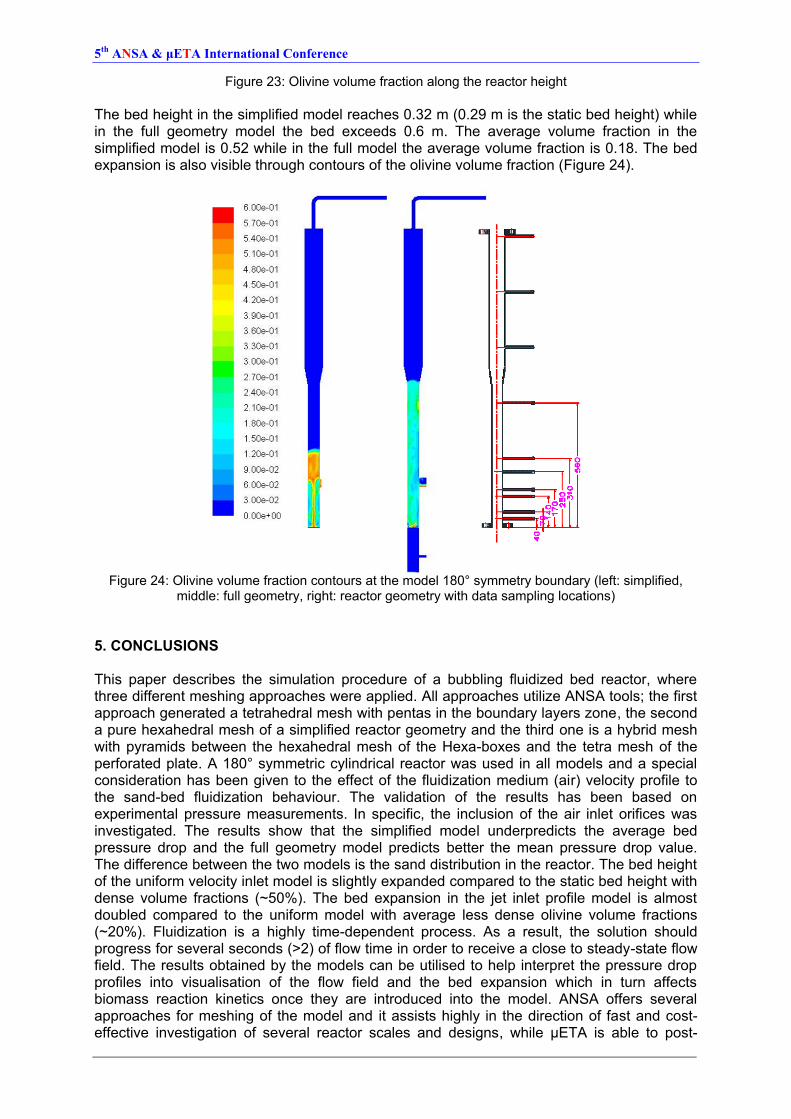
Figure 23: Olivine volume fraction along the reactor height The bed height in the simplified model reaches 0.32 m (0.29 m is the static bed height) while in the full geometry model the bed exceeds 0.6 m. The average volume fraction in the simplified model is 0.52 while in the full model the average volume fraction is 0.18. The bed expansion is also visible through contours of the olivine volume fraction (Figure 24).
Figure 24: Olivine volume fraction contours at the model 180° symmetry boundary (left: simplified,
middle: full geometry, right: reactor geometry with data sampling locations)
5. CONCLUSIONS This paper describes the simulation procedure of a bubbling fluidized bed reactor, where three different meshing approaches were applied. All approaches utilize ANSA tools; the first approach generated a tetrahedral mesh with pentas in the boundary layers zone, the second a pure hexahedral mesh of a simplified reactor geometry and the third one is a hybrid mesh with pyramids between the hexahedral mesh of the Hexa-boxes and the tetra mesh of the perforated plate. A 180° symmetric cylindrical reactor was used in all models and a special consideration has been given to the effect of the fluidization medium (air) velocity profile to the sand-bed fluidization behaviour. The validation of the results has been based on experimental pressure measurements. In specific, the inclusion of the air inlet orifices was investigated. The results show that the simplified model underpredicts the average bed pressure drop and the full geometry model predicts better the mean pressure drop value. The difference between the two models is the sand distribution in the reactor. The bed height of the uniform velocity inlet model is slightly expanded compared to the static bed height with dense volume fractions (~50%). The bed expansion in the jet inlet profile model is almost doubled compared to the uniform model with average less dense olivine volume fractions (~20%). Fluidization is a highly time-dependent process. As a result, the solution should progress for several seconds (>2) of flow time in order to receive a close to steady-state flow field. The results obtained by the models can be utilised to help interpret the pressure drop profiles into visualisation of the flow field and the bed expansion which in turn affects biomass reaction kinetics once they are introduced into the model. ANSA offers several approaches for meshing of the model and it assists highly in the direction of fast and cost-effective investigation of several reactor scales and designs, while μETA is able to post-
5th
ANSA & μETA International Conference
process multiphase flows, so that the ANSA-μΕΤΑ software package is proved to be able to fully support the BFB CFD models. REFERENCES (1) I. Bioenergy, Annual Report 2008 (2008). (2) A. Demirbas, Biomass resource facilities and biomass conversion processing for fuels
and chemicals, Energy Conversion and Management 42 (11) (2001) 1357–1378. (3) M. Demirbas, Hydrogen from various biomass species via pyrolysis and steam
gasification processes, Energy Sources, Part A: Recovery, Utilization, and Environmental Effects 28 (3) (2006) 245–252.
(4) S. Rapagnà, N. Jand, A. Kiennemann, P.U. Foscolo, Steam-gasification of biomass in a fluidised-bed of olivine particles, Biomass and Bioenergy, 19 (3), 2000, 187-197
(5) Peter McKendry, Energy production from biomass (part 3): gasification technologies, Bioresource Technology, 83 (1), 2002, 55-63
(6) S. Ergun, Fluid flow through packed columns, Chemical Engineering Progress, 48, 1952, 89 – 94
(7) S. Ergun, A.A. Orning, Fluid Flow through Randomly Packed Columns and Fluidized Beds, Industrial & Engineering Chemistry, 41 (6), 1949, 1179 – 1184
(8) D Geldart, Chapter 4 - Mixing in fluidized beds, In: N Harnby, M.F. Edwards and A.W. Nienow, Editor(s), Mixing in the Process Industries, Butterworth-Heinemann, Oxford, 1997, 62-78
(9) Evgeny Rabinovich, Haim Kalman, Flow regime diagram for vertical pneumatic conveying and fluidized bed systems, Powder Technology, 207 (1–3), 2011, 119-133
![BUBBLING ALONG BOUNDARY GEODESICS FOR LANE …yzhou173/BC67.pdfcondition. Hence we extend the result in [del Pino, Musso and Pacard, J. Eur. Math. Soc. 12 (2010), 1553-1605] to lower](https://static.fdocument.org/doc/165x107/61235a279588dc075464a262/bubbling-along-boundary-geodesics-for-lane-yzhou173bc67pdf-condition-hence-we.jpg)
![PV L2 TB NUOL Khmer 09 05 03 end - DGS · REEPROMANUAL Biomass books English KHMER Biogas CIv³]sμ½n Rocket Stove cRgáan r:ukEkt Rural Gasifier karplit³]sμ½ntamCnbT PV books](https://static.fdocument.org/doc/165x107/5ffbf9d41d16762824743c66/pv-l2-tb-nuol-khmer-09-05-03-end-dgs-reepromanual-biomass-books-english-khmer.jpg)