Cerebral adenosine A1 receptors are upregulated in … receptors are upregulated in rodent...
7
Cerebral adenosine A 1 receptors are upregulated in rodent encephalitis Soumen Paul a , Shivashankar Khanapur a , Wytske Boersma b , Jurgen W. Sijbesma a , Kiichi Ishiwata c , Philip H. Elsinga a , Peter Meerlo d , Janine Doorduin a , Rudi A. Dierckx a , Aren van Waarde a, ⁎ a University of Groningen, University Medical Center Groningen, Nuclear Medicine and Molecular Imaging, Hanzeplein 1, 9713GZ Groningen, The Netherlands b University of Groningen, University Medical Center Groningen, Department of Medical Oncology, Hanzeplein 1, 9713GZ Groningen, The Netherlands c Tokyo Metropolitan Institute of Gerontology, Research Team for Neuroimaging, 35-2 Sakae-cho, Itabashi-ku, Tokyo 173-0015, JAPAN d University of Groningen, Center for Behaviour and Neurosciences, Nijenborgh 7, 9747AG Groningen, The Netherlands abstract article info Article history: Accepted 30 January 2014 Available online 7 February 2014 Keywords: Herpes simplex virus-1 MicroPET Neuroinflammation Rats Adenosine A1 receptors Kinetic modeling Adenosine A 1 receptors (A1Rs) are implied in the modulation of neuroinflammation. Activation of cerebral A1Rs acts as a brake on the microglial response after traumatic brain injury and has neuroprotective properties in animal models of Parkinson's disease and multiple sclerosis. Neuroinflammatory processes in turn may affect the expression of A1Rs, but the available data is limited and inconsistent. Here, we applied an animal model of encephalitis to assess how neuroinflammation affects the expression of A1Rs. Two groups of animals were studied: Infected rats (n = 7) were intranasally inoculated with herpes simplex virus-1 (HSV-1, 1 × 10 7 plaque forming units), sham-infected rats (n = 6) received only phosphate-buffered saline. Six or seven days later, microPET scans (60 min with arterial blood sampling) were made using the tracer 8-dicyclopropyl-1- 11 C- methyl-3-propyl-xanthine ( 11 C-MPDX). Tracer clearance from plasma and partition coefficient (K 1 /k 2 estimated from a 2-tissue compartment model fit) were not significantly altered after virus infection. PET tracer distribution volume calculated from a Logan plot was significantly increased in the hippocampus (+37%) and medulla (+27%) of virus infected rats. Tracer binding potential (k 3 /k 4 estimated from the model fit) was significantly in- creased in the cerebellum (+87%) and the medulla (+148%) which may indicate increased A1R expression. This was confirmed by immunohistochemical analysis showing a strong increase of A1R immunoreactivity in the cer- ebellum of HSV-1-infected rats. Both the quantitative PET data and immunohistochemical analysis indicate that A1Rs are upregulated in brain areas where active virus is present. © 2014 Elsevier Inc. All rights reserved. Introduction Neuroinflammation is an important aspect of the pathophysiology of neurodegenerative diseases. The nucleoside adenosine may have neu- roprotective properties by reducing neuronal excitability (Paul et al., 2011a) and acting as an anti-inflammatory agent (Cronstein, 1994). Such effects appear to be mediated by adenosine A1 receptors (A1Rs) which are expressed both on neurons and on glia (Gebicke-Haerter et al., 1996). Activation of cerebral A1Rs acts as a brake on the microglial response after traumatic brain injury (Haselkorn et al., 2010) and has neuroprotective effects in animal models of Parkinson's disease (Liu et al., 2006) and multiple sclerosis (MS) (Chen et al., 2010; Tsutsui et al., 2004). Neuroinflammation after chronic infusion of lipopolysac- charide (LPS) into the fourth ventricle of young rats, and natural mi- croglia activation in aged rats are both attenuated after treatment of animals with the A1/A2A antagonist caffeine (Brothers et al., 2010). Upregulation of A1Rs and/or blockade of A2ARs in the human brain may also have neuroprotective properties and suppress neuroinflam- mation. A recent paper reported that a higher cerebrospinal fluid caf- feine concentration is associated with a more favorable outcome after severe traumatic brain injury (Sachse et al., 2008). Moreover, regular caffeine consumption is associated with lower risk for developing Parkinson's disease (Palacios et al., 2012) or Alzheimer dementia (Cao et al., 2012). Changes of A1R signaling have been reported in patients with MS. Plasma levels of adenosine in such patients are significantly reduced. Stimulation of peripheral blood mononuclear cells (PBMC) with a selec- tive A1R agonist R-PIA inhibits the mitogen-stimulated production of the inflammatory marker TNF-α in healthy volunteers but not in sub- jects with MS (Mayne et al., 1999). Taken together, the above-mentioned studies indicate that A1R up- regulation and stimulation may affect neurodegenerative and neuro- inflammatory processes. In addition, some studies have suggested that neuroinflammation itself may also affect the expression of A1Rs. For ex- ample, A1R densities in PBMC and in brain tissue from MS-patients are significantly decreased (by 53% and 49%, respectively) compared to those from age-matched controls, which may result in impaired neuro- protection and more neuroinflammation (Johnston et al., 2001). In NeuroImage 92 (2014) 83–89 ⁎ Corresponding author at: University of Groningen, University Medical Center Groningen, Department of Nuclear Medicine and Molecular Imaging, Hanzeplein 1, 9713GZ Groningen, The Netherlands. E-mail address: [email protected] (A. van Waarde). 1053-8119/$ – see front matter © 2014 Elsevier Inc. All rights reserved. http://dx.doi.org/10.1016/j.neuroimage.2014.01.054 Contents lists available at ScienceDirect NeuroImage journal homepage: www.elsevier.com/locate/ynimg
Transcript of Cerebral adenosine A1 receptors are upregulated in … receptors are upregulated in rodent...
NeuroImage 92 (2014) 83–89
Contents lists available at ScienceDirect
NeuroImage
j ourna l homepage: www.e lsev ie r .com/ locate /yn img
Cerebral adenosine A1 receptors are upregulated in rodent encephalitis
Soumen Paul a, Shivashankar Khanapur a, Wytske Boersma b, Jurgen W. Sijbesma a, Kiichi Ishiwata c,Philip H. Elsinga a, Peter Meerlo d, Janine Doorduin a, Rudi A. Dierckx a, Aren van Waarde a,⁎a University of Groningen, University Medical Center Groningen, Nuclear Medicine and Molecular Imaging, Hanzeplein 1, 9713GZ Groningen, The Netherlandsb University of Groningen, University Medical Center Groningen, Department of Medical Oncology, Hanzeplein 1, 9713GZ Groningen, The Netherlandsc Tokyo Metropolitan Institute of Gerontology, Research Team for Neuroimaging, 35-2 Sakae-cho, Itabashi-ku, Tokyo 173-0015, JAPANd University of Groningen, Center for Behaviour and Neurosciences, Nijenborgh 7, 9747AG Groningen, The Netherlands
⁎ Corresponding author at: University of GroningeGroningen, Department of Nuclear Medicine and Mol9713GZ Groningen, The Netherlands.
E-mail address: [email protected] (A. van Waard
1053-8119/$ – see front matter © 2014 Elsevier Inc. All rihttp://dx.doi.org/10.1016/j.neuroimage.2014.01.054
a b s t r a c t
a r t i c l e i n f oArticle history:Accepted 30 January 2014Available online 7 February 2014
Keywords:Herpes simplex virus-1MicroPETNeuroinflammationRatsAdenosine A1 receptorsKinetic modeling
Adenosine A1 receptors (A1Rs) are implied in themodulation of neuroinflammation. Activation of cerebral A1Rsacts as a brake on the microglial response after traumatic brain injury and has neuroprotective properties inanimal models of Parkinson's disease and multiple sclerosis. Neuroinflammatory processes in turn may affectthe expression of A1Rs, but the available data is limited and inconsistent. Here, we applied an animal model ofencephalitis to assess how neuroinflammation affects the expression of A1Rs. Two groups of animals werestudied: Infected rats (n = 7) were intranasally inoculated with herpes simplex virus-1 (HSV-1, 1 × 10⁷ plaqueforming units), sham-infected rats (n = 6) received only phosphate-buffered saline. Six or seven days later,microPET scans (60 min with arterial blood sampling) were made using the tracer 8-dicyclopropyl-1-11C-methyl-3-propyl-xanthine (11C-MPDX). Tracer clearance from plasma and partition coefficient (K1/k2 estimatedfrom a 2-tissue compartmentmodelfit)were not significantly altered after virus infection. PET tracer distributionvolume calculated from a Logan plot was significantly increased in the hippocampus (+37%) and medulla(+27%) of virus infected rats. Tracer binding potential (k3/k4 estimated from the model fit) was significantly in-creased in the cerebellum (+87%) and themedulla (+148%)whichmay indicate increased A1R expression. Thiswas confirmed by immunohistochemical analysis showing a strong increase of A1R immunoreactivity in the cer-ebellum of HSV-1-infected rats. Both the quantitative PET data and immunohistochemical analysis indicate thatA1Rs are upregulated in brain areas where active virus is present.
© 2014 Elsevier Inc. All rights reserved.
Introduction
Neuroinflammation is an important aspect of the pathophysiology ofneurodegenerative diseases. The nucleoside adenosine may have neu-roprotective properties by reducing neuronal excitability (Paul et al.,2011a) and acting as an anti-inflammatory agent (Cronstein, 1994).Such effects appear to be mediated by adenosine A1 receptors (A1Rs)which are expressed both on neurons and on glia (Gebicke-Haerteret al., 1996). Activation of cerebral A1Rs acts as a brake on themicroglialresponse after traumatic brain injury (Haselkorn et al., 2010) and hasneuroprotective effects in animal models of Parkinson's disease (Liuet al., 2006) and multiple sclerosis (MS) (Chen et al., 2010; Tsutsuiet al., 2004). Neuroinflammation after chronic infusion of lipopolysac-charide (LPS) into the fourth ventricle of young rats, and natural mi-croglia activation in aged rats are both attenuated after treatment ofanimals with the A1/A2A antagonist caffeine (Brothers et al., 2010).
n, University Medical Centerecular Imaging, Hanzeplein 1,
e).
ghts reserved.
Upregulation of A1Rs and/or blockade of A2ARs in the human brainmay also have neuroprotective properties and suppress neuroinflam-mation. A recent paper reported that a higher cerebrospinal fluid caf-feine concentration is associated with a more favorable outcome aftersevere traumatic brain injury (Sachse et al., 2008). Moreover, regularcaffeine consumption is associated with lower risk for developingParkinson's disease (Palacios et al., 2012) or Alzheimer dementia (Caoet al., 2012).
Changes of A1R signaling have been reported in patients with MS.Plasma levels of adenosine in such patients are significantly reduced.Stimulation of peripheral bloodmononuclear cells (PBMC)with a selec-tive A1R agonist R-PIA inhibits the mitogen-stimulated production ofthe inflammatory marker TNF-α in healthy volunteers but not in sub-jects with MS (Mayne et al., 1999).
Taken together, the above-mentioned studies indicate that A1R up-regulation and stimulation may affect neurodegenerative and neuro-inflammatory processes. In addition, some studies have suggested thatneuroinflammation itself may also affect the expression of A1Rs. For ex-ample, A1R densities in PBMC and in brain tissue from MS-patients aresignificantly decreased (by 53% and 49%, respectively) compared tothose from age-matched controls, whichmay result in impaired neuro-protection and more neuroinflammation (Johnston et al., 2001). In
84 S. Paul et al. / NeuroImage 92 (2014) 83–89
agreement with this is the finding of reduced densities of A1Rs in mi-croglia of wild-type mice during experimental autoimmune encephalo-myelitis (Tsutsui et al., 2004). However, acute inflammation of mousebrain after administration of LPS was shown to increase A1R expressionin cortical areas and this response was dependent on the transcriptionfactor NF-kappaB (Jhaveri et al., 2007). If combined, these data suggestthat A1Rs are up-regulated in acute forms of neuroinflammation butdown-regulated in chronic forms. Clearly, more data is required.
Here, we performed a microPET study with the potent (Ki 3.0 nM)antagonist 8-dicylopropyl-1-11C-methyl-3-propylxanthine (11C-MPDX)in a rodent model of encephalitis. 11C-MPDX has been used previouslyfor PET studies of A1Rs, both in animals (Nariai et al., 2003; Paul et al.,2011a,2011b; Shimada et al., 2002) and humans (Fukumitsu et al.,2003, 2005, 2008). The present study aimed to assess whether bindingof 11C-MPDX and immunoreactivity of the A1R protein are altered inrat brain as a consequence of neuroinflammation.
Materials and methods
Animals and housing
The animal experiments were performed by licensed investigators incompliance with the Law on Animal Experiments of The Netherlands.The protocol was approved by the Committee on Animal Ethics of theUniversity of Groningen. Male outbred Wistar–Unilever rats wereobtained from Charles River. The rats were housed in Macrolon cages(38 × 26 × 24 cm) maintained at a 12-h light/12-h dark regime andwere fed standard laboratory chow ad libitum. Two groups of animalswere studied: rats infected with HSV-1 (n = 7) and sham-infected rats(n = 6).
HSV-1 inoculation
The HSV-1 strain was obtained from a human clinical isolate cul-tured in Vero-cells and assayed for plaque forming units (PFU) per mL.In order to infect rats with HSV-1, the animals were anesthetized with5% isoflurane. Subsequently, 1 × 10⁷ PFU HSV-1 in 100 μL phosphate-buffered saline (PBS) was applied in the nose using a micropipette(50 μL in each nostril). Sham-infected rats received 100 μL PBS withoutany virus. Clinical symptoms in all ratswere observed daily andwere re-corded by scoring them in an animalwelfare diary. Scores ranged from0to 3, with 0 indicating no particular response or symptoms; 1 meaningruffled fur, dried oral and nasal secretions on the fur, loss of weight; 2indicating animals showed a hunched posture, increased aggressionand paralysis symptoms in the posterior part of the abdomen; andscore 3 indicating seizures, severe paralysis, difficulty of breathing, ordeath. In our study, score 3 was not reached as the ethics committeedid not allow a longer interval than 8 days between virus inoculationand PET imaging. On day 6 or 7, the ratswere transported to the imagingfacility for microPET scanning.
PET scanning
The radioligand 11C-MPDX was prepared by reaction of 11C-methyliodide with the appropriate 1-N-desmethyl precursor. Briefly, 11C-methyl iodide was trapped in 0.3 mL of N,N-dimethylformamide con-taining 1 mg of 1-N-desmethyl precursor and 5 μL of NaOH and washeated at 120 °C for 5 min. After 1.0 mL of 0.1 M HCl had been added,the solution was loaded onto a high-performance liquid chromatogra-phy column (Econosphere, C18, 5mm [Altech]; 10× 250mm) and elut-ed with a mixture of 0.1 M NaH2PO4 and ethanol (70/30) at a flow rateof 4 mL/min. The fractions containing 11C-MPDXwere collected. Reten-tion time of 11C-MPDX was 14 min. The decay-corrected radiochemicalyield was 35% ± 5% (based on 11C-methyl iodide), and the radiochemi-cal purity was greater than 98%.
MicroPET (Focus 220 camera, Siemens-Concorde) scans were madeon day 6 or 7 after the inoculation with HSV-1. Two rats were scannedsimultaneously in each data acquisition protocol. Approximately30–40 min before tracer injection, animals were anesthetized with amixture of isoflurane/air (inhalation anesthesia, 5% ratio during induc-tion, later reduced to 2%). During this time, surgery was performed toplace a cannula in a femoral artery for blood sampling. Also, a transmis-sion scan was made for attenuation correction (515 s, with Co-57 pointsource). After completion of the transmission scan, the PET tracer11C-MPDX (13.0 ± 1.8 MBq, specific radioactivity N11 TBq/mmol) wasinjected through the penile vein. A dynamic emission scan (76 min)was started during injection of radioactivity in the lower rat; theupper animal was injected 16 min later. A series of blood samples (14samples; volume, 0.10–0.15mL)was drawn, initially in rapid succession(every 15 s) and later at longer intervals (up to 30 min). Plasma wasacquired from these samples by short centrifugation (Eppendorf centri-fuge, 5 min at 13,000 rpm). Radioactivity in 25 μL of plasma was count-ed and used as an arterial input function. List-mode data were reframedinto a dynamic sequence of 8 × 30, 3 × 60, 2 × 120, 2 × 180, 3 × 300,1 × 480, 2 × 600, and 1 × 960 s frames. The data were reconstructedper time frame using an iterative reconstruction algorithm (attenua-tion-weighted 2-dimensional ordered-subset expectation maximiza-tion, provided by Siemens; 4 iterations, 16 subsets; zoom factor 2).The final datasets consisted of 95 slices, with a slice thickness of 0.8 mmand an in-plane image matrix of 128 × 128 pixels of size 1 × 1 mm.Datasets were fully corrected for random coincidences, scatter,and attenuation. Images were smoothed with a Gaussian filter(1.35 mm in both directions).
PET image data analysis
Time–activity curves, volumes (mL) for the ROIs, partition co-efficient (K1/k2) and binding potential (k3/k4) by two-tissue reversiblecompartmentmodel (2TCM) were calculated using the Siemens InveonResearchwork place 4.0 (IRW 4.0). ROIs were drawn around the bulbusolfactorius, frontal cortex, striatum, amygdala, parietal/temporal/occipital cortex, medulla, cerebellum, pons and hippocampus in a tem-plate MRI scan that was co-registered with the PET scan of interest byimage fusion (Schweinhardt et al., 2003). The cerebral distribution vol-ume (VT) of the tracer was estimated from a Logan plot (Logan, 2000).The Loganfit (linear regression)was started at 10min, as described pre-viously (Paul et al., 2011b).
Biodistribution studies
After the PET scan and 80min after tracer injection, the anesthetizedanimals were sacrificed. Blood was collected, and plasma was obtainedfrom the blood sample by short centrifugation (5 min at 1000 ×g).Several areas of the brain were dissected and peripheral organs wereexcised (see Table 2). The brain areas and peripheral organs wereweighed and the radioactivity in these tissue samples was measuredwith a gamma counter, applying a decay correction. Tracer uptake wasexpressed as a dimensionless biodistribution SUV [tissue activity con-centration (MBq/g)]/[(injected dose (MBq)/body weight (g)].
A1R immunohistochemistry
In a parallel experiment, male Wistar–Unilever rats were sham-infected or infected with HSV-1 as described above. On day 6 or 7,animals were terminated by deep anesthesia with a mixture ofisoflurane/air (ratio 5%) and perfused intracardially with 150 mL of0.9% saline followed by 250–300 mL of freshly prepared 4% paraformal-dehyde in 0.1Mphosphate buffer (PBS), pH 7.4. The brainwas removedand post-fixed in paraformaldehyde for 24 h. The next day, the organwas embedded in paraffin. Coronal brain sections of 4 μm were cut,using a microtome. Sections were collected on slides, dried in a hot air
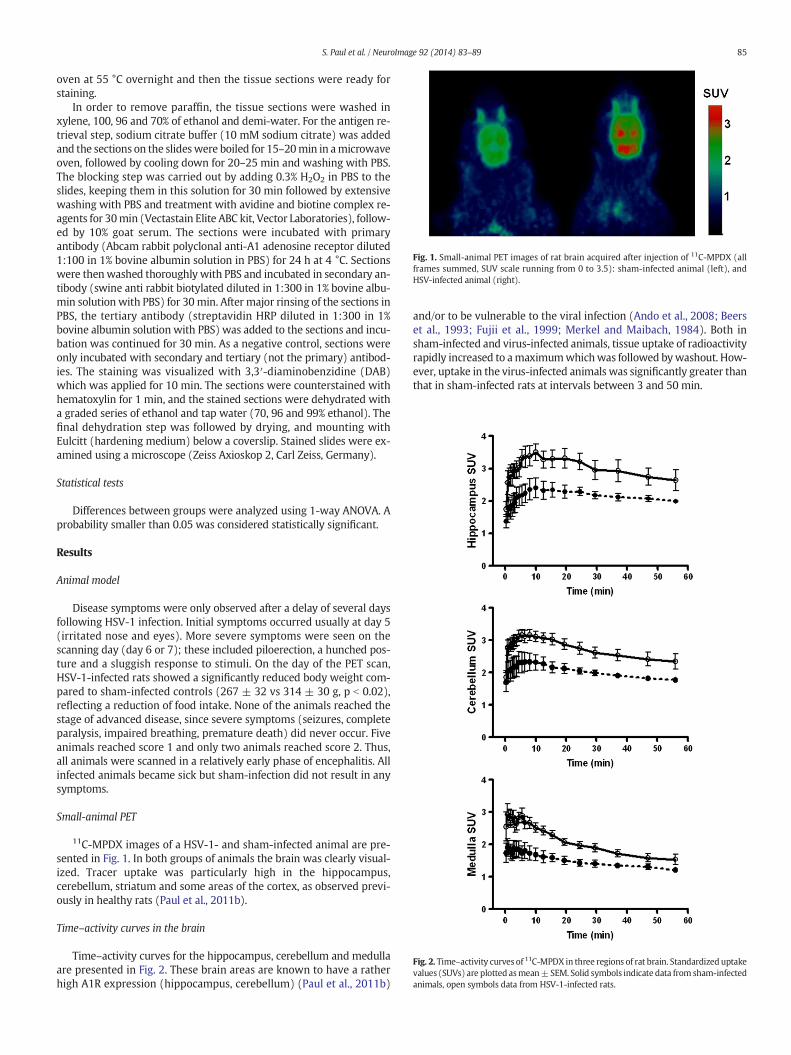
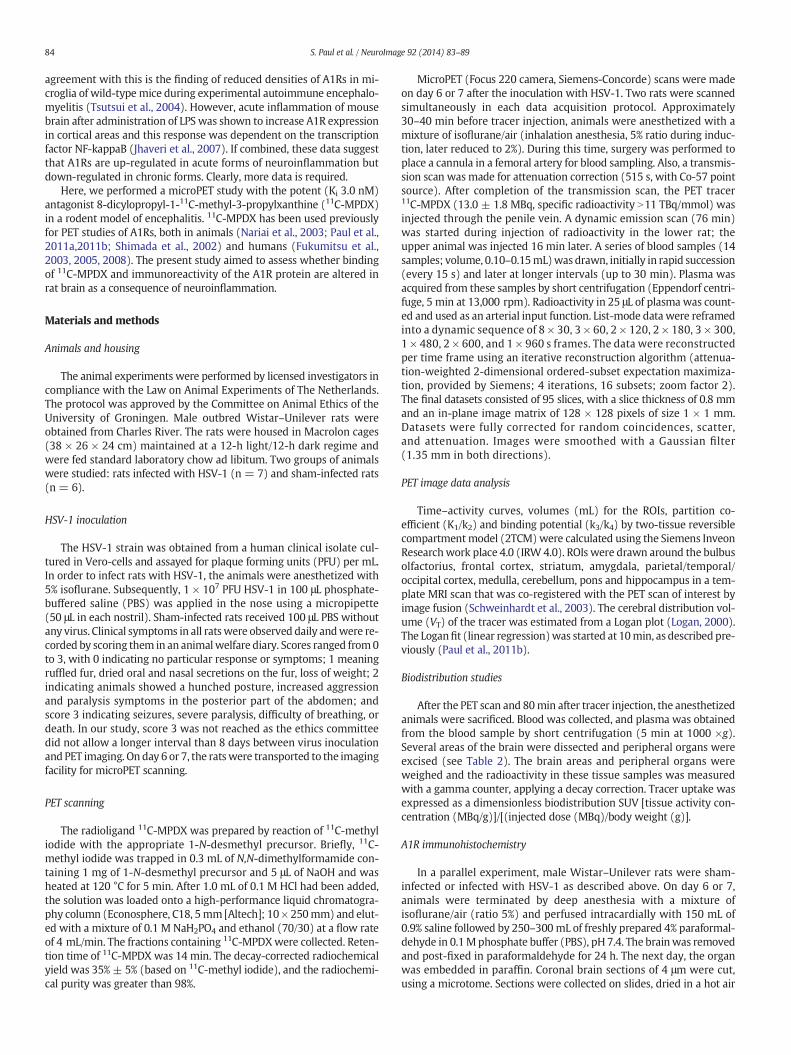
Fig. 1. Small-animal PET images of rat brain acquired after injection of 11C-MPDX (allframes summed, SUV scale running from 0 to 3.5): sham-infected animal (left), andHSV-infected animal (right).
Fig. 2. Time–activity curves of 11C-MPDX in three regions of rat brain. Standardized uptakevalues (SUVs) are plotted asmean±SEM. Solid symbols indicate data from sham-infectedanimals, open symbols data from HSV-1-infected rats.
85S. Paul et al. / NeuroImage 92 (2014) 83–89
oven at 55 °C overnight and then the tissue sections were ready forstaining.
In order to remove paraffin, the tissue sections were washed inxylene, 100, 96 and 70% of ethanol and demi-water. For the antigen re-trieval step, sodium citrate buffer (10 mM sodium citrate) was addedand the sections on the slideswere boiled for 15–20min in amicrowaveoven, followed by cooling down for 20–25 min and washing with PBS.The blocking step was carried out by adding 0.3% H2O2 in PBS to theslides, keeping them in this solution for 30 min followed by extensivewashing with PBS and treatment with avidine and biotine complex re-agents for 30min (Vectastain Elite ABC kit, Vector Laboratories), follow-ed by 10% goat serum. The sections were incubated with primaryantibody (Abcam rabbit polyclonal anti-A1 adenosine receptor diluted1:100 in 1% bovine albumin solution in PBS) for 24 h at 4 °C. Sectionswere thenwashed thoroughly with PBS and incubated in secondary an-tibody (swine anti rabbit biotylated diluted in 1:300 in 1% bovine albu-min solution with PBS) for 30min. After major rinsing of the sections inPBS, the tertiary antibody (streptavidin HRP diluted in 1:300 in 1%bovine albumin solution with PBS) was added to the sections and incu-bation was continued for 30 min. As a negative control, sections wereonly incubated with secondary and tertiary (not the primary) antibod-ies. The staining was visualized with 3,3′-diaminobenzidine (DAB)which was applied for 10 min. The sections were counterstained withhematoxylin for 1 min, and the stained sections were dehydrated witha graded series of ethanol and tap water (70, 96 and 99% ethanol). Thefinal dehydration step was followed by drying, and mounting withEulcitt (hardening medium) below a coverslip. Stained slides were ex-amined using a microscope (Zeiss Axioskop 2, Carl Zeiss, Germany).
Statistical tests
Differences between groups were analyzed using 1-way ANOVA. Aprobability smaller than 0.05 was considered statistically significant.
Results
Animal model
Disease symptoms were only observed after a delay of several daysfollowing HSV-1 infection. Initial symptoms occurred usually at day 5(irritated nose and eyes). More severe symptoms were seen on thescanning day (day 6 or 7); these included piloerection, a hunched pos-ture and a sluggish response to stimuli. On the day of the PET scan,HSV-1-infected rats showed a significantly reduced body weight com-pared to sham-infected controls (267 ± 32 vs 314 ± 30 g, p b 0.02),reflecting a reduction of food intake. None of the animals reached thestage of advanced disease, since severe symptoms (seizures, completeparalysis, impaired breathing, premature death) did never occur. Fiveanimals reached score 1 and only two animals reached score 2. Thus,all animals were scanned in a relatively early phase of encephalitis. Allinfected animals became sick but sham-infection did not result in anysymptoms.
Small-animal PET
11C-MPDX images of a HSV-1- and sham-infected animal are pre-sented in Fig. 1. In both groups of animals the brain was clearly visual-ized. Tracer uptake was particularly high in the hippocampus,cerebellum, striatum and some areas of the cortex, as observed previ-ously in healthy rats (Paul et al., 2011b).
Time–activity curves in the brain
Time–activity curves for the hippocampus, cerebellum and medullaare presented in Fig. 2. These brain areas are known to have a ratherhigh A1R expression (hippocampus, cerebellum) (Paul et al., 2011b)
and/or to be vulnerable to the viral infection (Ando et al., 2008; Beerset al., 1993; Fujii et al., 1999; Merkel and Maibach, 1984). Both insham-infected and virus-infected animals, tissue uptake of radioactivityrapidly increased to amaximumwhichwas followed bywashout. How-ever, uptake in the virus-infected animals was significantly greater thanthat in sham-infected rats at intervals between 3 and 50 min.
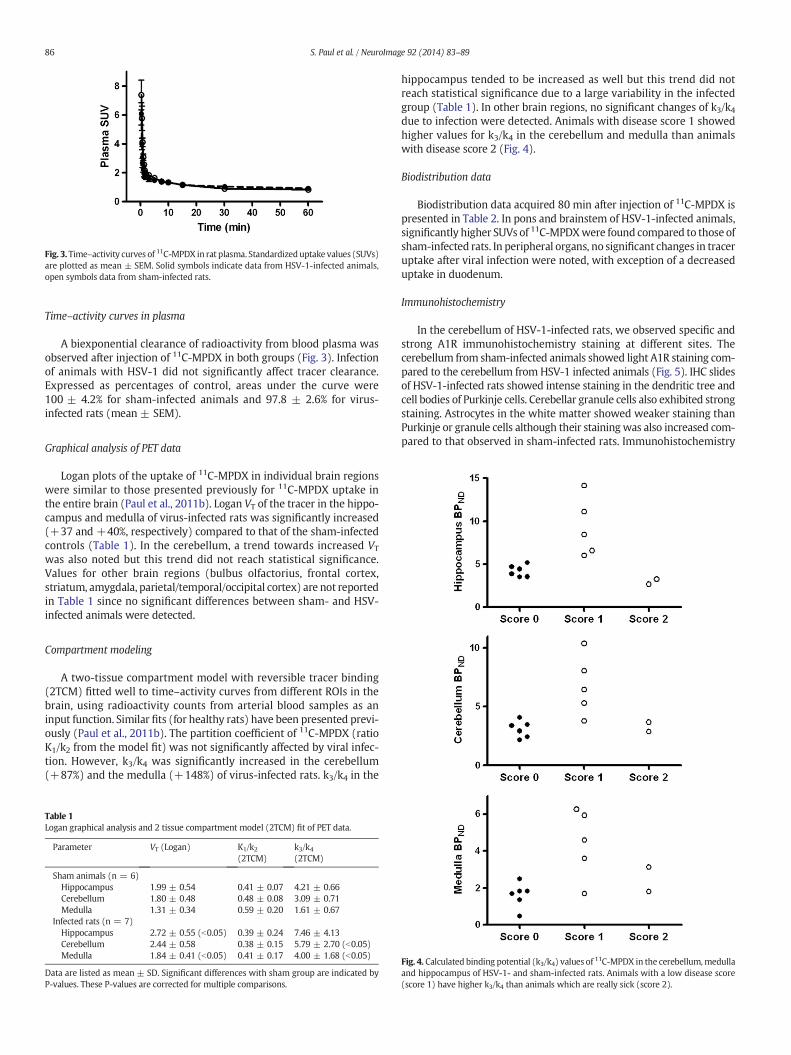
Fig. 3.Time–activity curves of 11C-MPDX in rat plasma. Standardizeduptake values (SUVs)are plotted as mean ± SEM. Solid symbols indicate data from HSV-1-infected animals,open symbols data from sham-infected rats.
86 S. Paul et al. / NeuroImage 92 (2014) 83–89
Time–activity curves in plasma
A biexponential clearance of radioactivity from blood plasma wasobserved after injection of 11C-MPDX in both groups (Fig. 3). Infectionof animals with HSV-1 did not significantly affect tracer clearance.Expressed as percentages of control, areas under the curve were100 ± 4.2% for sham-infected animals and 97.8 ± 2.6% for virus-infected rats (mean ± SEM).
Graphical analysis of PET data
Logan plots of the uptake of 11C-MPDX in individual brain regionswere similar to those presented previously for 11C-MPDX uptake inthe entire brain (Paul et al., 2011b). Logan VT of the tracer in the hippo-campus and medulla of virus-infected rats was significantly increased(+37 and +40%, respectively) compared to that of the sham-infectedcontrols (Table 1). In the cerebellum, a trend towards increased VT
was also noted but this trend did not reach statistical significance.Values for other brain regions (bulbus olfactorius, frontal cortex,striatum, amygdala, parietal/temporal/occipital cortex) are not reportedin Table 1 since no significant differences between sham- and HSV-infected animals were detected.
Compartment modeling
A two-tissue compartment model with reversible tracer binding(2TCM) fitted well to time–activity curves from different ROIs in thebrain, using radioactivity counts from arterial blood samples as aninput function. Similar fits (for healthy rats) have been presented previ-ously (Paul et al., 2011b). The partition coefficient of 11C-MPDX (ratioK1/k2 from the model fit) was not significantly affected by viral infec-tion. However, k3/k4 was significantly increased in the cerebellum(+87%) and the medulla (+148%) of virus-infected rats. k3/k4 in the
Table 1Logan graphical analysis and 2 tissue compartment model (2TCM) fit of PET data.
Parameter VT (Logan) K1/k2(2TCM)
k3/k4(2TCM)
Sham animals (n = 6)Hippocampus 1.99 ± 0.54 0.41 ± 0.07 4.21 ± 0.66Cerebellum 1.80 ± 0.48 0.48 ± 0.08 3.09 ± 0.71Medulla 1.31 ± 0.34 0.59 ± 0.20 1.61 ± 0.67
Infected rats (n = 7)Hippocampus 2.72 ± 0.55 (b0.05) 0.39 ± 0.24 7.46 ± 4.13Cerebellum 2.44 ± 0.58 0.38 ± 0.15 5.79 ± 2.70 (b0.05)Medulla 1.84 ± 0.41 (b0.05) 0.41 ± 0.17 4.00 ± 1.68 (b0.05)
Data are listed as mean ± SD. Significant differences with sham group are indicated byP-values. These P-values are corrected for multiple comparisons.
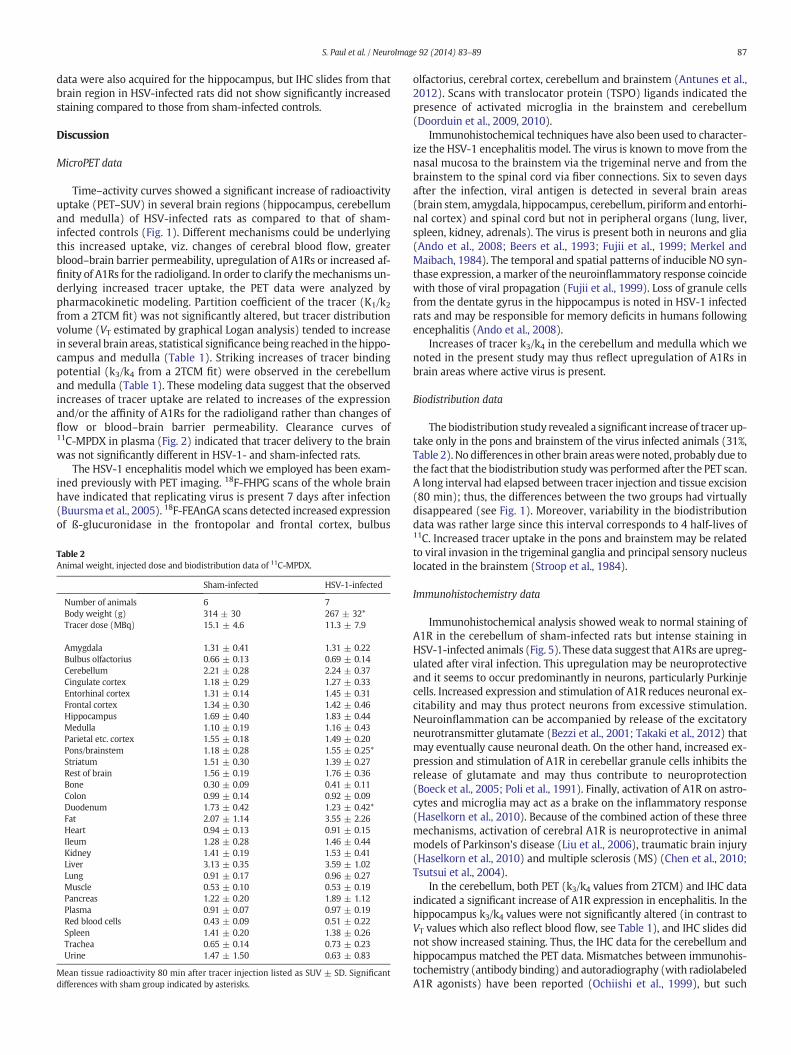
hippocampus tended to be increased as well but this trend did notreach statistical significance due to a large variability in the infectedgroup (Table 1). In other brain regions, no significant changes of k3/k4due to infection were detected. Animals with disease score 1 showedhigher values for k3/k4 in the cerebellum and medulla than animalswith disease score 2 (Fig. 4).
Biodistribution data
Biodistribution data acquired 80 min after injection of 11C-MPDX ispresented in Table 2. In pons and brainstem of HSV-1-infected animals,significantly higher SUVs of 11C-MPDXwere found compared to those ofsham-infected rats. In peripheral organs, no significant changes in traceruptake after viral infection were noted, with exception of a decreaseduptake in duodenum.
Immunohistochemistry
In the cerebellum of HSV-1-infected rats, we observed specific andstrong A1R immunohistochemistry staining at different sites. Thecerebellum from sham-infected animals showed light A1R staining com-pared to the cerebellum from HSV-1 infected animals (Fig. 5). IHC slidesof HSV-1-infected rats showed intense staining in the dendritic tree andcell bodies of Purkinje cells. Cerebellar granule cells also exhibited strongstaining. Astrocytes in the white matter showed weaker staining thanPurkinje or granule cells although their stainingwas also increased com-pared to that observed in sham-infected rats. Immunohistochemistry
Fig. 4. Calculated binding potential (k3/k4) values of 11C-MPDX in the cerebellum,medullaand hippocampus of HSV-1- and sham-infected rats. Animals with a low disease score(score 1) have higher k3/k4 than animals which are really sick (score 2).
87S. Paul et al. / NeuroImage 92 (2014) 83–89
data were also acquired for the hippocampus, but IHC slides from thatbrain region in HSV-infected rats did not show significantly increasedstaining compared to those from sham-infected controls.
Discussion
MicroPET data
Time–activity curves showed a significant increase of radioactivityuptake (PET–SUV) in several brain regions (hippocampus, cerebellumand medulla) of HSV-infected rats as compared to that of sham-infected controls (Fig. 1). Different mechanisms could be underlyingthis increased uptake, viz. changes of cerebral blood flow, greaterblood–brain barrier permeability, upregulation of A1Rs or increased af-finity of A1Rs for the radioligand. In order to clarify themechanisms un-derlying increased tracer uptake, the PET data were analyzed bypharmacokinetic modeling. Partition coefficient of the tracer (K1/k2from a 2TCM fit) was not significantly altered, but tracer distributionvolume (VT estimated by graphical Logan analysis) tended to increasein several brain areas, statistical significance being reached in the hippo-campus and medulla (Table 1). Striking increases of tracer bindingpotential (k3/k4 from a 2TCM fit) were observed in the cerebellumand medulla (Table 1). These modeling data suggest that the observedincreases of tracer uptake are related to increases of the expressionand/or the affinity of A1Rs for the radioligand rather than changes offlow or blood–brain barrier permeability. Clearance curves of11C-MPDX in plasma (Fig. 2) indicated that tracer delivery to the brainwas not significantly different in HSV-1- and sham-infected rats.
The HSV-1 encephalitis model which we employed has been exam-ined previously with PET imaging. 18F-FHPG scans of the whole brainhave indicated that replicating virus is present 7 days after infection(Buursma et al., 2005). 18F-FEAnGA scans detected increased expressionof ß-glucuronidase in the frontopolar and frontal cortex, bulbus
Table 2Animal weight, injected dose and biodistribution data of 11C-MPDX.
Sham-infected HSV-1-infected
Number of animals 6 7Body weight (g) 314 ± 30 267 ± 32*Tracer dose (MBq) 15.1 ± 4.6 11.3 ± 7.9
Amygdala 1.31 ± 0.41 1.31 ± 0.22Bulbus olfactorius 0.66 ± 0.13 0.69 ± 0.14Cerebellum 2.21 ± 0.28 2.24 ± 0.37Cingulate cortex 1.18 ± 0.29 1.27 ± 0.33Entorhinal cortex 1.31 ± 0.14 1.45 ± 0.31Frontal cortex 1.34 ± 0.30 1.42 ± 0.46Hippocampus 1.69 ± 0.40 1.83 ± 0.44Medulla 1.10 ± 0.19 1.16 ± 0.43Parietal etc. cortex 1.55 ± 0.18 1.49 ± 0.20Pons/brainstem 1.18 ± 0.28 1.55 ± 0.25*Striatum 1.51 ± 0.30 1.39 ± 0.27Rest of brain 1.56 ± 0.19 1.76 ± 0.36Bone 0.30 ± 0.09 0.41 ± 0.11Colon 0.99 ± 0.14 0.92 ± 0.09Duodenum 1.73 ± 0.42 1.23 ± 0.42*Fat 2.07 ± 1.14 3.55 ± 2.26Heart 0.94 ± 0.13 0.91 ± 0.15Ileum 1.28 ± 0.28 1.46 ± 0.44Kidney 1.41 ± 0.19 1.53 ± 0.41Liver 3.13 ± 0.35 3.59 ± 1.02Lung 0.91 ± 0.17 0.96 ± 0.27Muscle 0.53 ± 0.10 0.53 ± 0.19Pancreas 1.22 ± 0.20 1.89 ± 1.12Plasma 0.91 ± 0.07 0.97 ± 0.19Red blood cells 0.43 ± 0.09 0.51 ± 0.22Spleen 1.41 ± 0.20 1.38 ± 0.26Trachea 0.65 ± 0.14 0.73 ± 0.23Urine 1.47 ± 1.50 0.63 ± 0.83
Mean tissue radioactivity 80 min after tracer injection listed as SUV ± SD. Significantdifferences with sham group indicated by asterisks.
olfactorius, cerebral cortex, cerebellum and brainstem (Antunes et al.,2012). Scans with translocator protein (TSPO) ligands indicated thepresence of activated microglia in the brainstem and cerebellum(Doorduin et al., 2009, 2010).
Immunohistochemical techniques have also been used to character-ize the HSV-1 encephalitis model. The virus is known to move from thenasal mucosa to the brainstem via the trigeminal nerve and from thebrainstem to the spinal cord via fiber connections. Six to seven daysafter the infection, viral antigen is detected in several brain areas(brain stem, amygdala, hippocampus, cerebellum, piriform and entorhi-nal cortex) and spinal cord but not in peripheral organs (lung, liver,spleen, kidney, adrenals). The virus is present both in neurons and glia(Ando et al., 2008; Beers et al., 1993; Fujii et al., 1999; Merkel andMaibach, 1984). The temporal and spatial patterns of inducible NO syn-thase expression, amarker of the neuroinflammatory response coincidewith those of viral propagation (Fujii et al., 1999). Loss of granule cellsfrom the dentate gyrus in the hippocampus is noted in HSV-1 infectedrats and may be responsible for memory deficits in humans followingencephalitis (Ando et al., 2008).
Increases of tracer k3/k4 in the cerebellum and medulla which wenoted in the present study may thus reflect upregulation of A1Rs inbrain areas where active virus is present.
Biodistribution data
The biodistribution study revealed a significant increase of tracer up-take only in the pons and brainstem of the virus infected animals (31%,Table 2). No differences in other brain areaswere noted, probably due tothe fact that the biodistribution studywas performed after the PET scan.A long interval had elapsed between tracer injection and tissue excision(80 min); thus, the differences between the two groups had virtuallydisappeared (see Fig. 1). Moreover, variability in the biodistributiondata was rather large since this interval corresponds to 4 half-lives of11C. Increased tracer uptake in the pons and brainstem may be relatedto viral invasion in the trigeminal ganglia and principal sensory nucleuslocated in the brainstem (Stroop et al., 1984).
Immunohistochemistry data
Immunohistochemical analysis showed weak to normal staining ofA1R in the cerebellum of sham-infected rats but intense staining inHSV-1-infected animals (Fig. 5). These data suggest that A1Rs are upreg-ulated after viral infection. This upregulation may be neuroprotectiveand it seems to occur predominantly in neurons, particularly Purkinjecells. Increased expression and stimulation of A1R reduces neuronal ex-citability and may thus protect neurons from excessive stimulation.Neuroinflammation can be accompanied by release of the excitatoryneurotransmitter glutamate (Bezzi et al., 2001; Takaki et al., 2012) thatmay eventually cause neuronal death. On the other hand, increased ex-pression and stimulation of A1R in cerebellar granule cells inhibits therelease of glutamate and may thus contribute to neuroprotection(Boeck et al., 2005; Poli et al., 1991). Finally, activation of A1R on astro-cytes and microglia may act as a brake on the inflammatory response(Haselkorn et al., 2010). Because of the combined action of these threemechanisms, activation of cerebral A1R is neuroprotective in animalmodels of Parkinson's disease (Liu et al., 2006), traumatic brain injury(Haselkorn et al., 2010) and multiple sclerosis (MS) (Chen et al., 2010;Tsutsui et al., 2004).
In the cerebellum, both PET (k3/k4 values from 2TCM) and IHC dataindicated a significant increase of A1R expression in encephalitis. In thehippocampus k3/k4 values were not significantly altered (in contrast toVT values which also reflect blood flow, see Table 1), and IHC slides didnot show increased staining. Thus, the IHC data for the cerebellum andhippocampus matched the PET data. Mismatches between immunohis-tochemistry (antibody binding) and autoradiography (with radiolabeledA1R agonists) have been reported (Ochiishi et al., 1999), but such
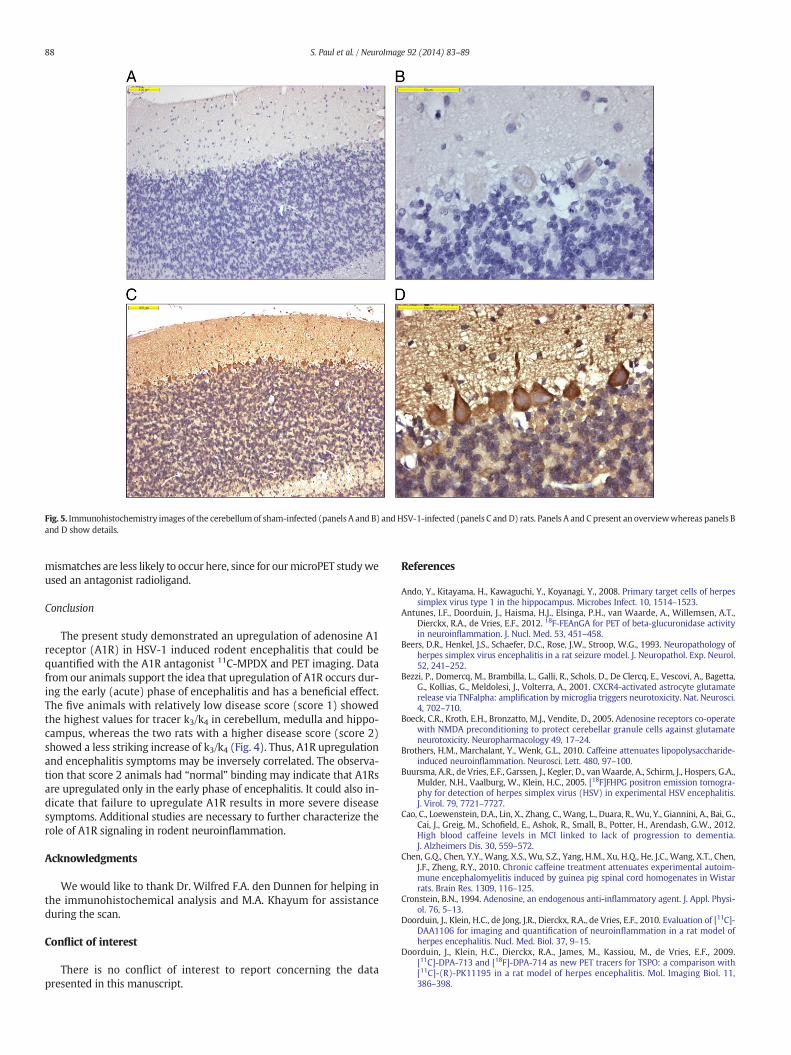
Fig. 5. Immunohistochemistry images of the cerebellum of sham-infected (panels A and B) andHSV-1-infected (panels C and D) rats. Panels A and C present an overviewwhereas panels Band D show details.
88 S. Paul et al. / NeuroImage 92 (2014) 83–89
mismatches are less likely to occur here, since for ourmicroPET studyweused an antagonist radioligand.
Conclusion
The present study demonstrated an upregulation of adenosine A1receptor (A1R) in HSV-1 induced rodent encephalitis that could bequantified with the A1R antagonist 11C-MPDX and PET imaging. Datafrom our animals support the idea that upregulation of A1R occurs dur-ing the early (acute) phase of encephalitis and has a beneficial effect.The five animals with relatively low disease score (score 1) showedthe highest values for tracer k3/k4 in cerebellum, medulla and hippo-campus, whereas the two rats with a higher disease score (score 2)showed a less striking increase of k3/k4 (Fig. 4). Thus, A1R upregulationand encephalitis symptoms may be inversely correlated. The observa-tion that score 2 animals had “normal” binding may indicate that A1Rsare upregulated only in the early phase of encephalitis. It could also in-dicate that failure to upregulate A1R results in more severe diseasesymptoms. Additional studies are necessary to further characterize therole of A1R signaling in rodent neuroinflammation.
Acknowledgments
We would like to thank Dr. Wilfred F.A. den Dunnen for helping inthe immunohistochemical analysis and M.A. Khayum for assistanceduring the scan.
Conflict of interest
There is no conflict of interest to report concerning the datapresented in this manuscript.
References
Ando, Y., Kitayama, H., Kawaguchi, Y., Koyanagi, Y., 2008. Primary target cells of herpessimplex virus type 1 in the hippocampus. Microbes Infect. 10, 1514–1523.
Antunes, I.F., Doorduin, J., Haisma, H.J., Elsinga, P.H., van Waarde, A., Willemsen, A.T.,Dierckx, R.A., de Vries, E.F., 2012. 18F-FEAnGA for PET of beta-glucuronidase activityin neuroinflammation. J. Nucl. Med. 53, 451–458.
Beers, D.R., Henkel, J.S., Schaefer, D.C., Rose, J.W., Stroop, W.G., 1993. Neuropathology ofherpes simplex virus encephalitis in a rat seizure model. J. Neuropathol. Exp. Neurol.52, 241–252.
Bezzi, P., Domercq, M., Brambilla, L., Galli, R., Schols, D., De Clercq, E., Vescovi, A., Bagetta,G., Kollias, G., Meldolesi, J., Volterra, A., 2001. CXCR4-activated astrocyte glutamaterelease via TNFalpha: amplification by microglia triggers neurotoxicity. Nat. Neurosci.4, 702–710.
Boeck, C.R., Kroth, E.H., Bronzatto, M.J., Vendite, D., 2005. Adenosine receptors co-operatewith NMDA preconditioning to protect cerebellar granule cells against glutamateneurotoxicity. Neuropharmacology 49, 17–24.
Brothers, H.M., Marchalant, Y., Wenk, G.L., 2010. Caffeine attenuates lipopolysaccharide-induced neuroinflammation. Neurosci. Lett. 480, 97–100.
Buursma, A.R., de Vries, E.F., Garssen, J., Kegler, D., vanWaarde, A., Schirm, J., Hospers, G.A.,Mulder, N.H., Vaalburg, W., Klein, H.C., 2005. [18F]FHPG positron emission tomogra-phy for detection of herpes simplex virus (HSV) in experimental HSV encephalitis.J. Virol. 79, 7721–7727.
Cao, C., Loewenstein, D.A., Lin, X., Zhang, C., Wang, L., Duara, R.,Wu, Y., Giannini, A., Bai, G.,Cai, J., Greig, M., Schofield, E., Ashok, R., Small, B., Potter, H., Arendash, G.W., 2012.High blood caffeine levels in MCI linked to lack of progression to dementia.J. Alzheimers Dis. 30, 559–572.
Chen, G.Q., Chen, Y.Y., Wang, X.S., Wu, S.Z., Yang, H.M., Xu, H.Q., He, J.C., Wang, X.T., Chen,J.F., Zheng, R.Y., 2010. Chronic caffeine treatment attenuates experimental autoim-mune encephalomyelitis induced by guinea pig spinal cord homogenates in Wistarrats. Brain Res. 1309, 116–125.
Cronstein, B.N., 1994. Adenosine, an endogenous anti-inflammatory agent. J. Appl. Physi-ol. 76, 5–13.
Doorduin, J., Klein, H.C., de Jong, J.R., Dierckx, R.A., de Vries, E.F., 2010. Evaluation of [11C]-DAA1106 for imaging and quantification of neuroinflammation in a rat model ofherpes encephalitis. Nucl. Med. Biol. 37, 9–15.
Doorduin, J., Klein, H.C., Dierckx, R.A., James, M., Kassiou, M., de Vries, E.F., 2009.[11C]-DPA-713 and [18F]-DPA-714 as new PET tracers for TSPO: a comparison with[11C]-(R)-PK11195 in a rat model of herpes encephalitis. Mol. Imaging Biol. 11,386–398.
89S. Paul et al. / NeuroImage 92 (2014) 83–89
Fujii, S., Akaike, T., Maeda, H., 1999. Role of nitric oxide in pathogenesis of herpes simplexvirus encephalitis in rats. Virology 256, 203–212.
Fukumitsu, N., Ishii, K., Kimura, Y., Oda, K., Hashimoto, M., Suzuki, M., Ishiwata, K.,2008. Adenosine A(1) receptors using 8-dicyclopropylmethyl-1-[11C]methyl-3-propylxanthine PET in Alzheimer's disease. Ann. Nucl. Med. 22, 841–847.
Fukumitsu, N., Ishii, K., Kimura, Y., Oda, K., Sasaki, T., Mori, Y., Ishiwata, K., 2005. Adeno-sine A1 receptor mapping of the human brain by PET with 8-dicyclopropylmethyl-1-11C-methyl-3-propylxanthine. J. Nucl. Med. 46, 32–37.
Fukumitsu, N., Ishii, K., Kimura, Y., Oda, K., Sasaki, T., Mori, Y., Ishiwata, K., 2003. Imagingof adenosine A1 receptors in the human brain by positron emission tomographywith[11C]MPDX. Ann. Nucl. Med. 17, 511–515.
Gebicke-Haerter, P.J., Christoffel, F., Timmer, J., Northoff, H., Berger, M., Van Calker, D.,1996. Both adenosine A1- and A2-receptors are required to stimulate microglial pro-liferation. Neurochem. Int. 29, 37–42.
Haselkorn, M.L., Shellington, D.K., Jackson, E.K., Vagni, V.A., Janesko-Feldman, K., Dubey,R.K., Gillespie, D.G., Cheng, D., Bell, M.J., Jenkins, L.W., Homanics, G.E., Schnermann, J.,Kochanek, P.M., 2010. Adenosine A1 receptor activation as a brake on the microglialresponse after experimental traumatic brain injury in mice. J. Neurotrauma 27,901–910.
Jhaveri, K.A., Reichensperger, J., Toth, L.A., Sekino, Y., Ramkumar, V., 2007. Reduced basaland lipopolysaccharide-stimulated adenosine A1 receptor expression in the brain ofnuclear factor-kappaB p50−/− mice. Neuroscience 146, 415–426.
Johnston, J.B., Silva, C., Gonzalez, G., Holden, J., Warren, K.G., Metz, L.M., Power, C., 2001.Diminished adenosine A1 receptor expression on macrophages in brain and bloodof patients with multiple sclerosis. Ann. Neurol. 49, 650–658.
Liu, H.Q., Zhang, W.Y., Luo, X.T., Ye, Y., Zhu, X.Z., 2006. Paeoniflorin attenuates neuroin-flammation and dopaminergic neurodegeneration in the MPTP model of Parkinson'sdisease by activation of adenosine A1 receptor. Br. J. Pharmacol. 148, 314–325.
Logan, J., 2000. Graphical analysis of PET data applied to reversible and irreversibletracers. Nucl. Med. Biol. 27, 661–670.
Mayne, M., Shepel, P.N., Jiang, Y., Geiger, J.D., Power, C., 1999. Dysregulation of adenosineA1 receptor-mediated cytokine expression in peripheral blood mononuclear cellsfrom multiple sclerosis patients. Ann. Neurol. 45, 633–639.
Merkel, K.H., Maibach, E.A., 1984. Experimental herpes simplex encephalitis in rats afterintranasal inoculation. An immunohistologic study. Histochem. J. 16, 467–469.
Nariai, T., Shimada, Y., Ishiwata, K., Nagaoka, T., Shimada, J., Kuroiwa, T., Ono, K., Ohno, K.,Hirakawa, K., Senda,M., 2003. PET imaging of adenosine A1 receptors with 11C-MPDXas an indicator of severe cerebral ischemic insult. J. Nucl. Med. 44, 1839–1844.
Ochiishi, T., Chen, L., Yukawa, A., Saitoh, Y., Sekino, Y., Arai, T., Nakata, H., Miyamoto, H.,1999. Cellular localization of adenosine A1 receptors in rat forebrain: immunohisto-chemical analysis using adenosine A1 receptor-specific monoclonal antibody.J. Comp. Neurol. 411, 301–316.
Palacios, N., Gao, X., McCullough, M.L., Schwarzschild, M.A., Shah, R., Gapstur, S., Ascherio,A., 2012. Caffeine and risk of Parkinson's disease in a large cohort of men andwomen.Mov. Disord. 27, 1276–1282.
Paul, S., Elsinga, P.H., Ishiwata, K., Dierckx, R.A., van Waarde, A., 2011a. Adenosine A1receptors in the central nervous system: their functions in health and disease, andpossible elucidation by PET imaging. Curr. Med. Chem. 18, 4820–4835.
Paul, S., Khanapur, S., Rybczynska, A.A., Kwizera, C., Sijbesma, J.W., Ishiwata, K.,Willemsen, A.T., Elsinga, P.H., Dierckx, R.A., van Waarde, A., 2011b. Small-animalPET study of adenosine A1 receptors in rat brain: blocking receptors and raising ex-tracellular adenosine. J. Nucl. Med. 52, 1293–1300.
Poli, A., Lucchi, R., Vibio, M., Barnabei, O., 1991. Adenosine and glutamate modulate eachother's release from rat hippocampal synaptosomes. J. Neurochem. 57, 298–306.
Sachse, K.T., Jackson, E.K., Wisniewski, S.R., Gillespie, D.G., Puccio, A.M., Clark, R.S., Dixon,C.E., Kochanek, P.M., 2008. Increases in cerebrospinal fluid caffeine concentration areassociated with favorable outcome after severe traumatic brain injury in humans.J. Cereb. Blood Flow Metab. 28, 395–401.
Schweinhardt, P., Fransson, P., Olson, L., Spenger, C., Andersson, J.L., 2003. A template forspatial normalisation of MR images of the rat brain. J. Neurosci. Methods 129,105–113.
Shimada, Y., Ishiwata, K., Kiyosawa, M., Nariai, T., Oda, K., Toyama, H., Suzuki, F., Ono, K.,Senda, M., 2002. Mapping adenosine A1 receptors in the cat brain by positron emis-sion tomography with [11C]MPDX. Nucl. Med. Biol. 29, 29–37.
Stroop, W.G., Rock, D.L., Fraser, N.W., 1984. Localization of herpes simplex virus in the tri-geminal and olfactory systems of themouse central nervous system during acute andlatent infections by in situ hybridization. Lab. Invest. 51, 27–38.
Takaki, J., Fujimori, K., Miura, M., Suzuki, T., Sekino, Y., Sato, K., 2012. L-glutamate releasedfrom activated microglia downregulates astrocytic L-glutamate transporterexpression in neuroinflammation: the ‘collusion’ hypothesis for increased extra-cellular L-glutamate concentration in neuroinflammation. J. Neuroinflammation 9,275. http://dx.doi.org/10.1186/1742-2094-9-275.
Tsutsui, S., Schnermann, J., Noorbakhsh, F., Henry, S., Yong, V.W., Winston, B.W., Warren,K., Power, C., 2004. A1 adenosine receptor upregulation and activation attenuatesneuroinflammation and demyelination in a model of multiple sclerosis. J. Neurosci.24, 1521–1529.


![Original Article EMMPRIN, SP1 and microRNA-27a mediate ... · pathways and mechanisms, including loss of function of the tumor suppressor p53 [10], upregulated vascular endothelial](https://static.fdocument.org/doc/165x107/5e22380d3a89c23c53196456/original-article-emmprin-sp1-and-microrna-27a-mediate-pathways-and-mechanisms.jpg)