Centroid Distance Function and the Fourier Descriptor with ...Computing Centroid A contour may be...
29
Swati Bhonsle and Alissa Klinzmann
Transcript of Centroid Distance Function and the Fourier Descriptor with ...Computing Centroid A contour may be...
Swati Bhonsle and Alissa Klinzmann
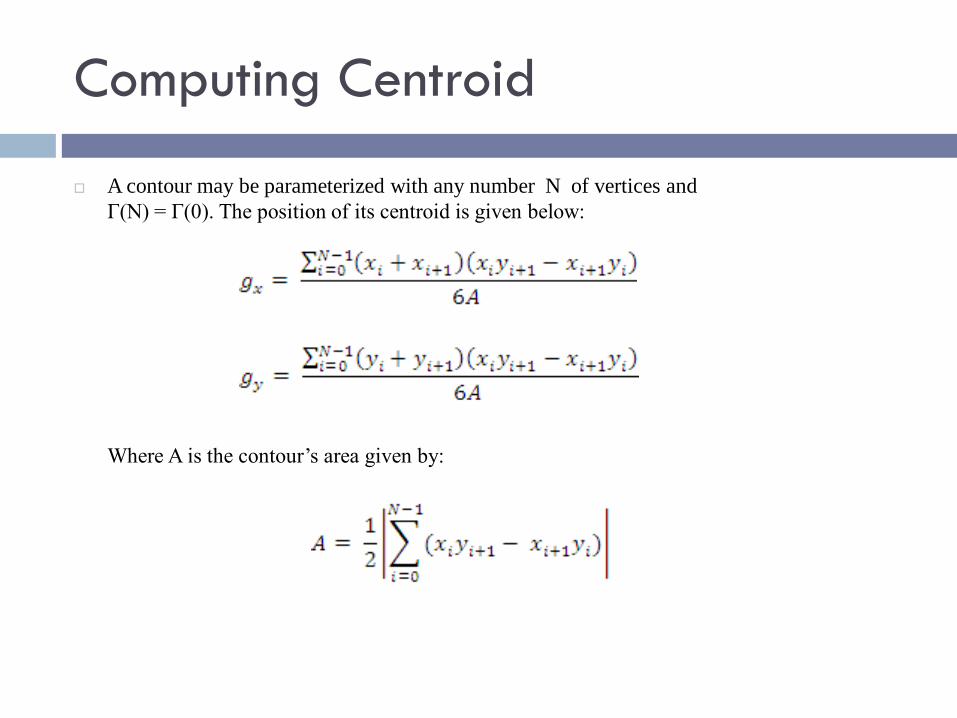
Computing Centroid
A contour may be parameterized with any number N of vertices and
Γ(N) = Γ(0). The position of its centroid is given below:
Where A is the contour’s area given by:
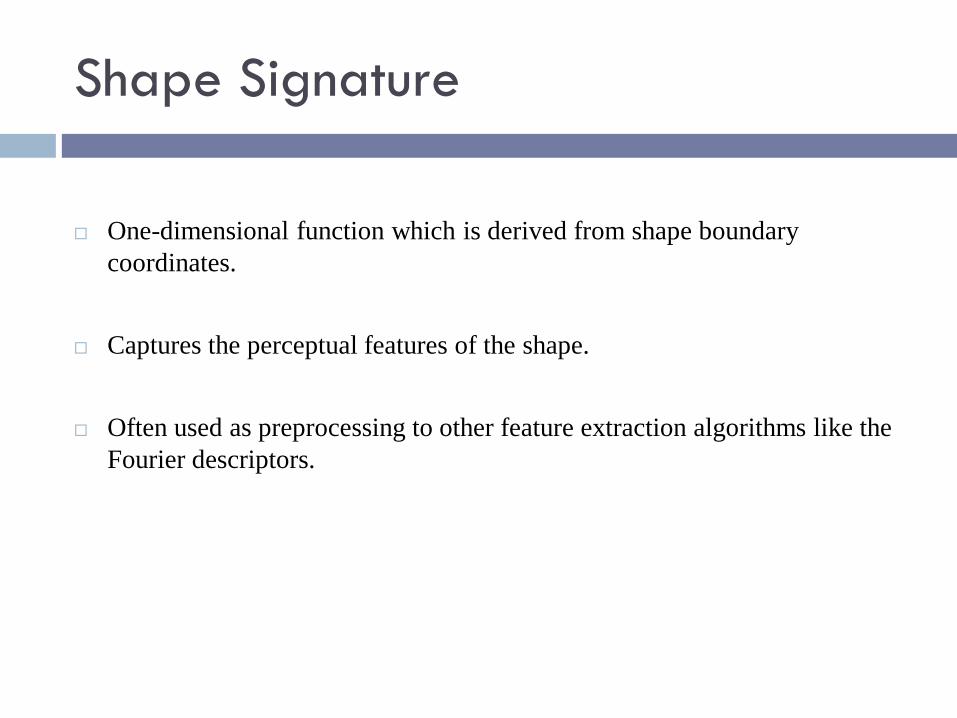
Shape Signature
One-dimensional function which is derived from shape boundary
coordinates.
Captures the perceptual features of the shape.
Often used as preprocessing to other feature extraction algorithms like the
Fourier descriptors.
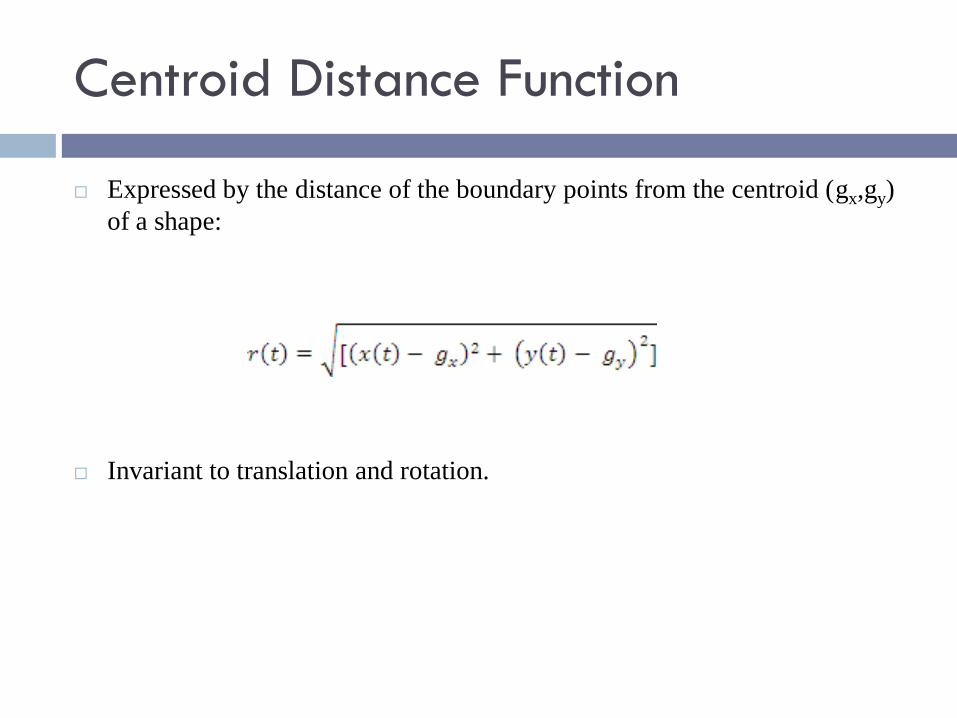
Centroid Distance Function
Expressed by the distance of the boundary points from the centroid (gx,gy)
of a shape:
Invariant to translation and rotation.
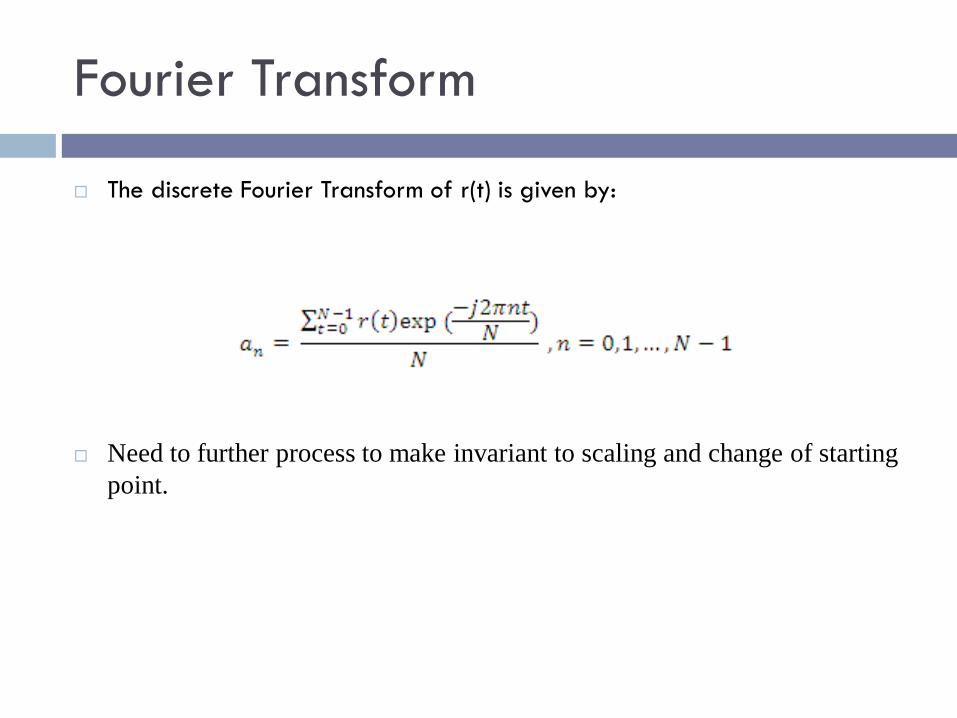
Fourier Transform
The discrete Fourier Transform of r(t) is given by:
Need to further process to make invariant to scaling and change of starting
point.
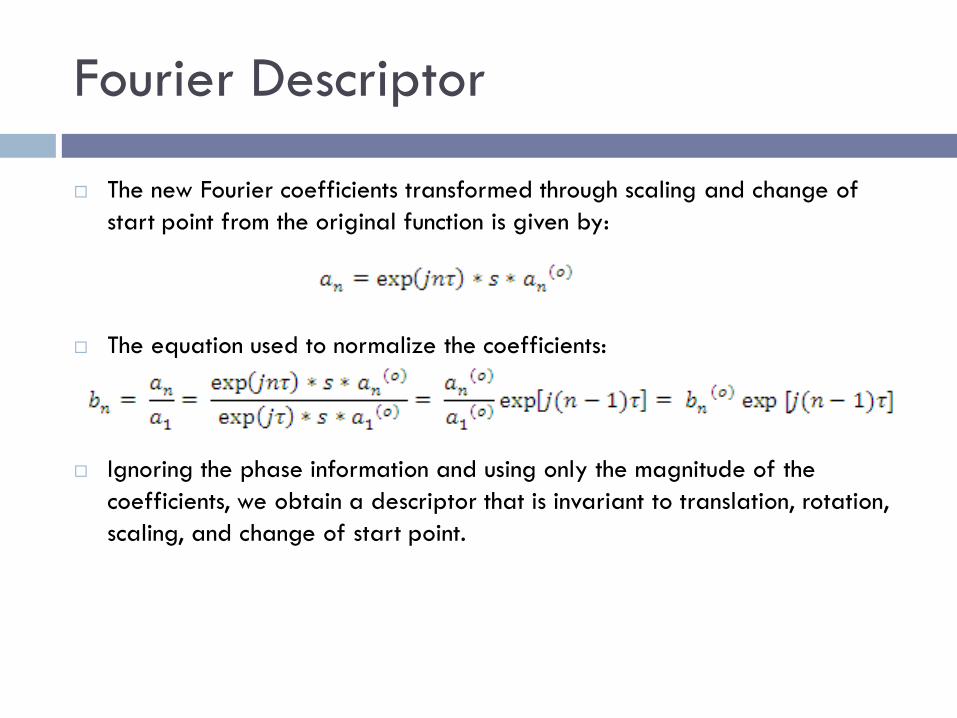
Fourier Descriptor
The new Fourier coefficients transformed through scaling and change of
start point from the original function is given by:
The equation used to normalize the coefficients:
Ignoring the phase information and using only the magnitude of the
coefficients, we obtain a descriptor that is invariant to translation, rotation,
scaling, and change of start point.
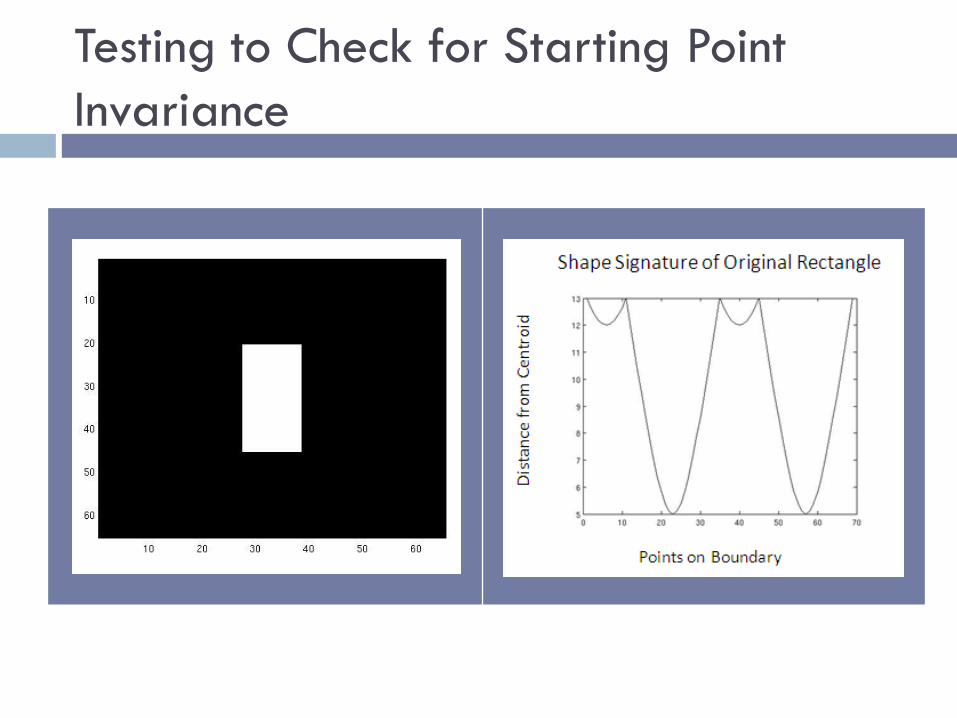
Testing to Check for Starting Point
Invariance
Testing to Check for Starting Point
Invariance
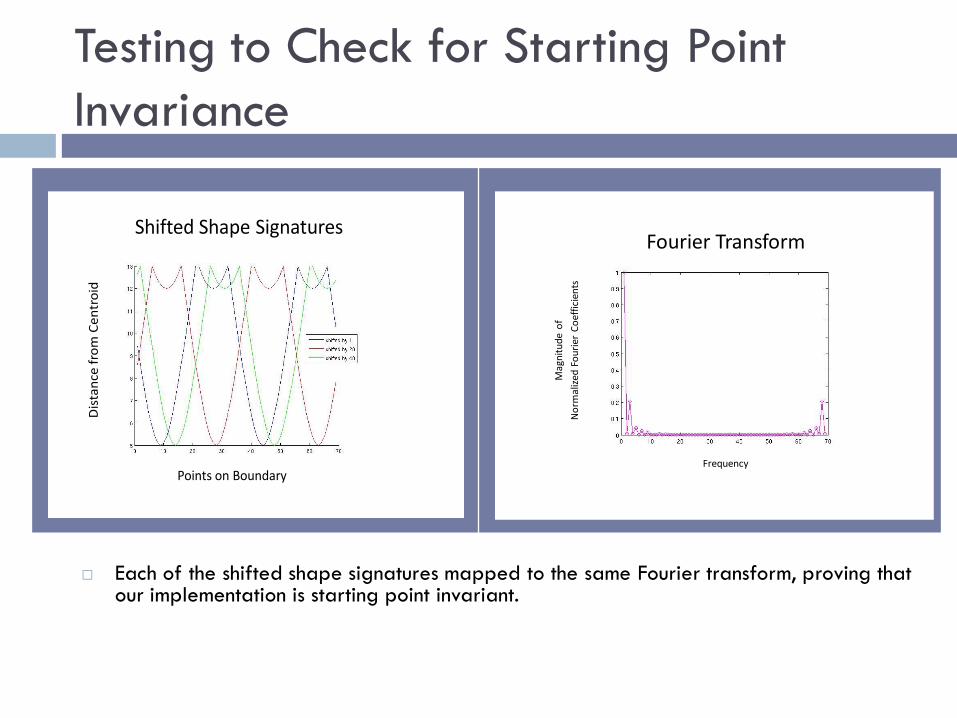
Shifted Shape Signatures
Points on Boundary
Dis
tan
cefr
om
Ce
ntr
oid
Fourier Transform
Frequency
Mag
nit
ud
e o
f
No
rmal
ized
Fo
uri
er C
oef
fici
ents
Each of the shifted shape signatures mapped to the same Fourier transform, proving that our implementation is starting point invariant.
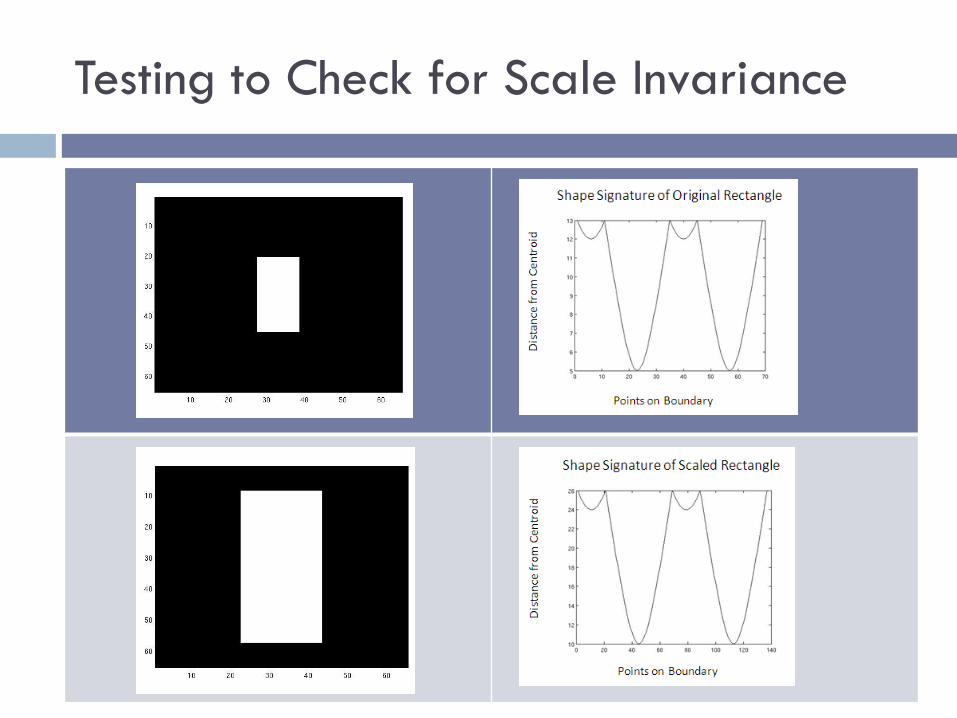
Testing to Check for Scale Invariance
Testing to Check for Scale Invariance
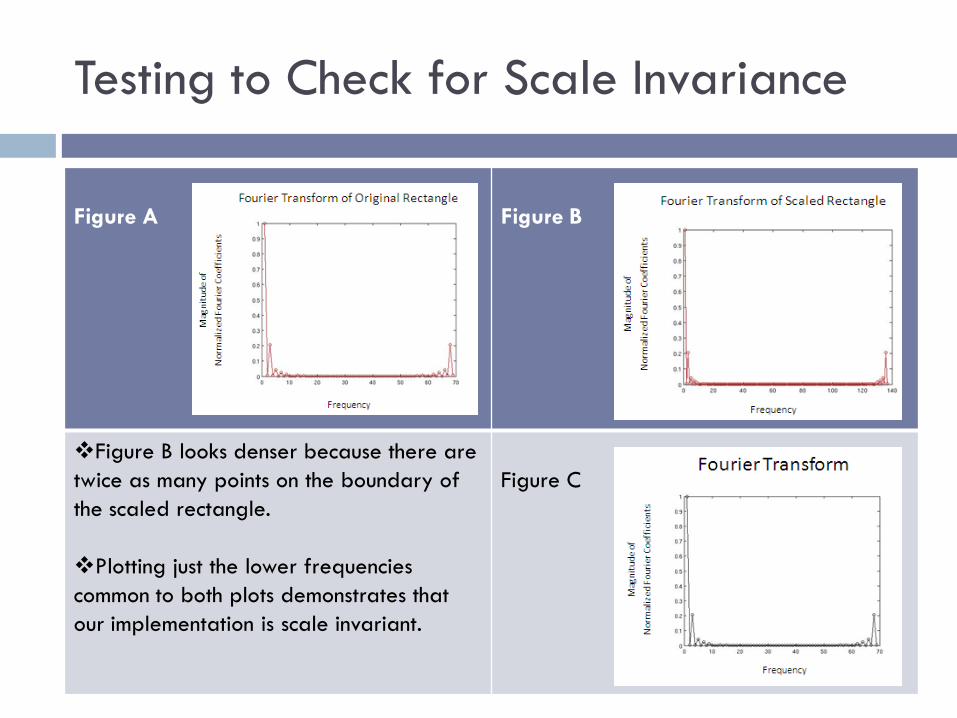
Figure A Figure B
Figure B looks denser because there are
twice as many points on the boundary of
the scaled rectangle.
Plotting just the lower frequencies
common to both plots demonstrates that
our implementation is scale invariant.
Figure C
Reconstruction and Retrieval
The Fourier descriptors represent the shape of the object in a frequency
domain.
The lower frequency descriptors contain information about the general
shape, and the higher frequency descriptors contain information about
smaller details.
Taking into consideration both accuracy and efficiency, 10 FDs are sufficient
for shape representation.
Reconstruction
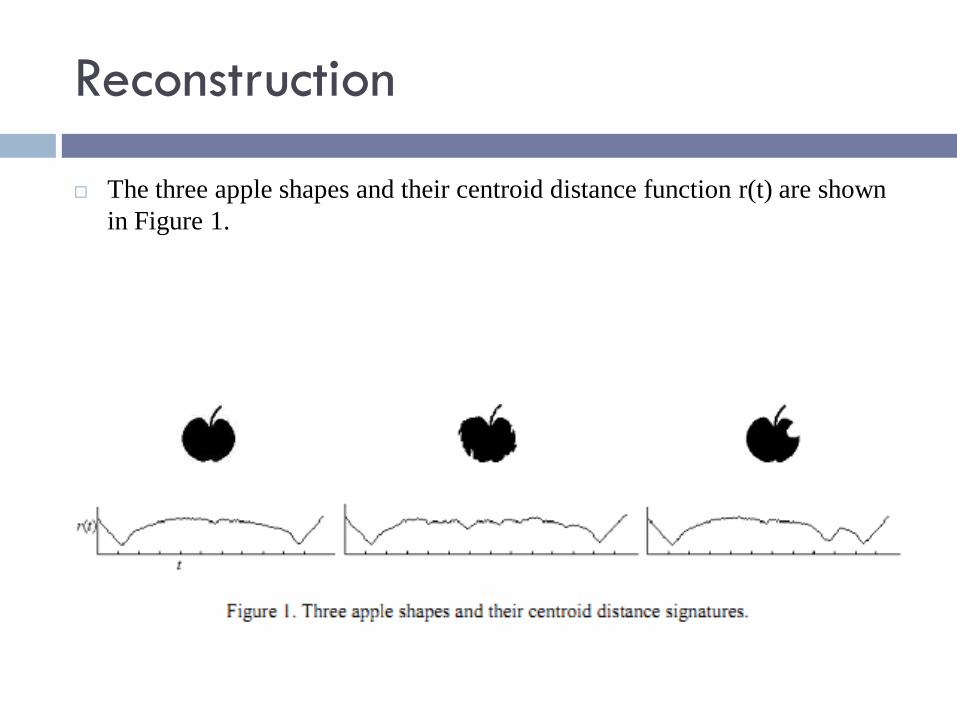
The three apple shapes and their centroid distance function r(t) are shown
in Figure 1.
Reconstruction
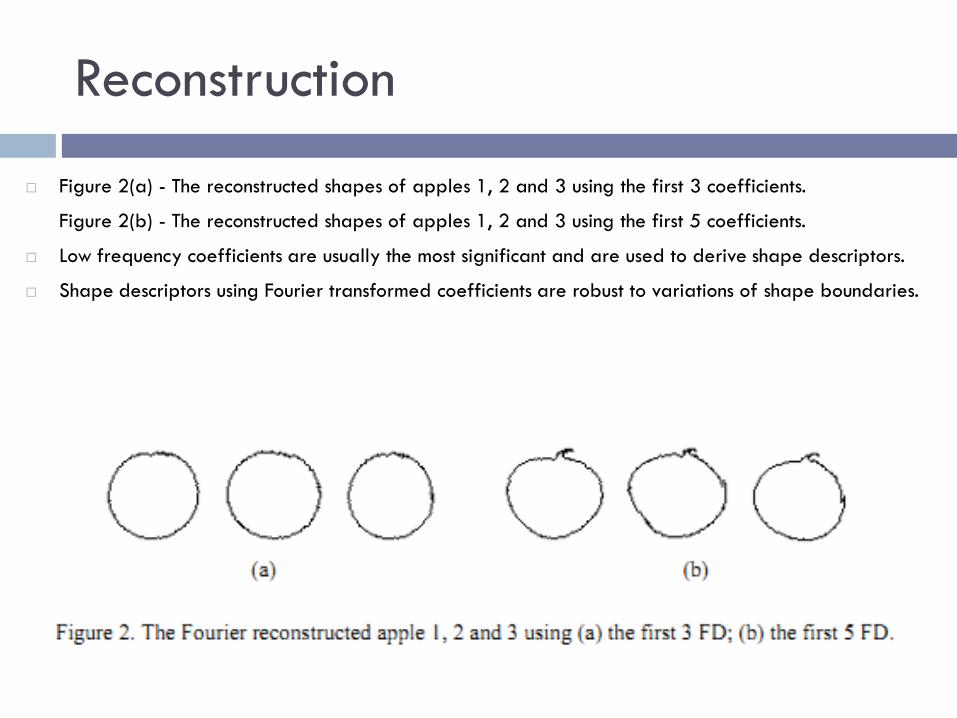
Figure 2(a) - The reconstructed shapes of apples 1, 2 and 3 using the first 3 coefficients.
Figure 2(b) - The reconstructed shapes of apples 1, 2 and 3 using the first 5 coefficients.
Low frequency coefficients are usually the most significant and are used to derive shape descriptors.
Shape descriptors using Fourier transformed coefficients are robust to variations of shape boundaries.
Retrieval
Each shape in a database is used as a query, and the common retrieval
performance measure – precision and the recall – is used to evaluate each
query.
Precision is defined as the ratio of the number of retrieved relevant shapes
to the total number of retrieved shapes. It measures the accuracy of the
retrieval.
Recall is defined as the ratio of the number of retrieved relevant images to
the total number of relevant shapes in the whole database. It measures the
robustness (completeness) of the retrieval performance.
Retrieval
To test the retrieval performance of the FDs a Java online indexing and
retrieval frame work is implemented and a database of 1400 shapes is
created.
The precision of the retrieval at each level of the recall is obtained for each
query. The result precision of retrieval using a type of FD is the average
precision of all the query retrievals using the type of FD.
The similarity between a query shape Q and a target shape T is measured by
the Euclidean distance between their FD representations.
Retrieval
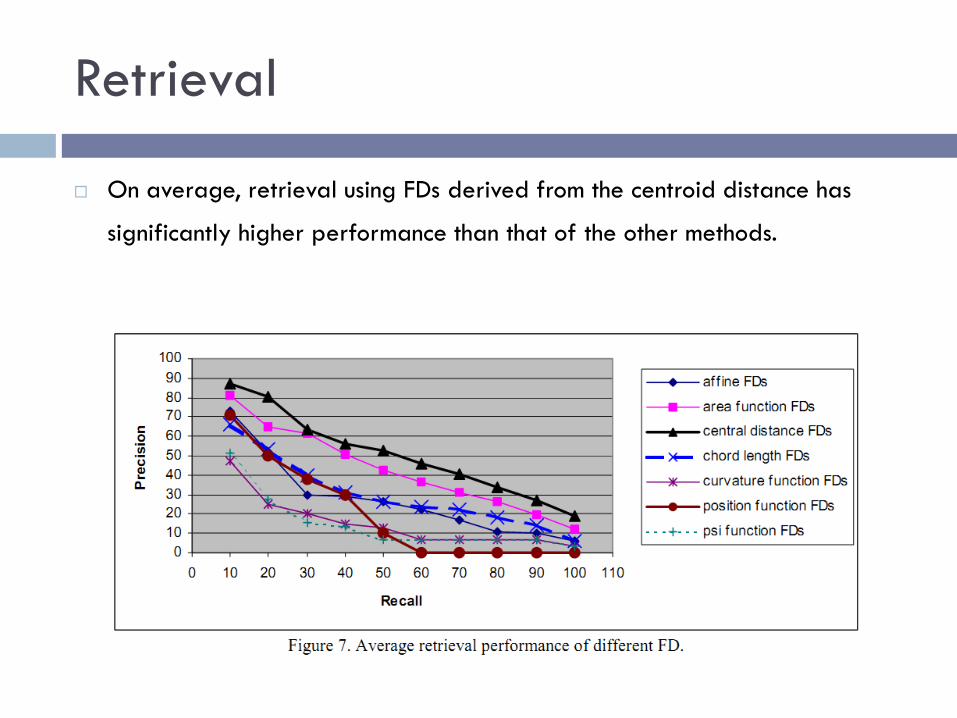
On average, retrieval using FDs derived from the centroid distance has
significantly higher performance than that of the other methods.
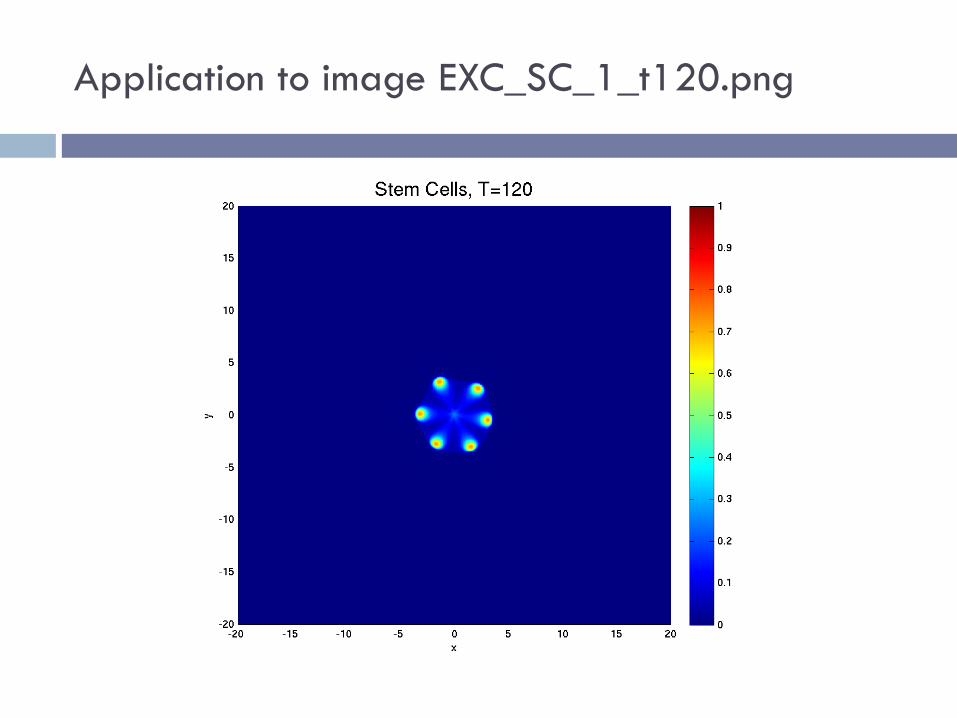
Application to image EXC_SC_1_t120.png
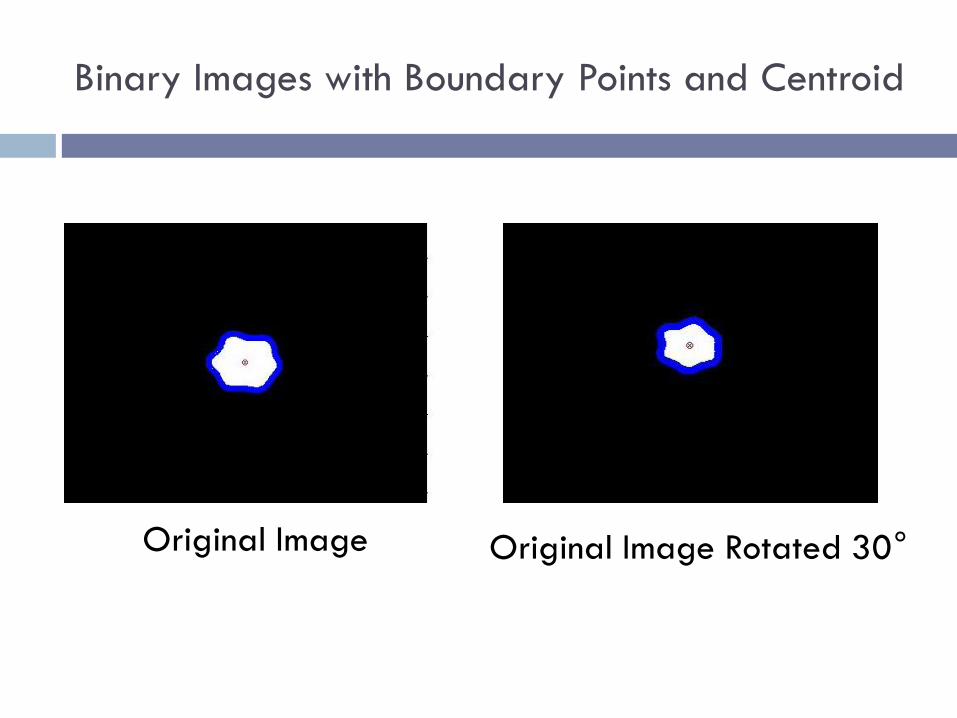
Binary Images with Boundary Points and Centroid
Original Image Original Image Rotated 30°
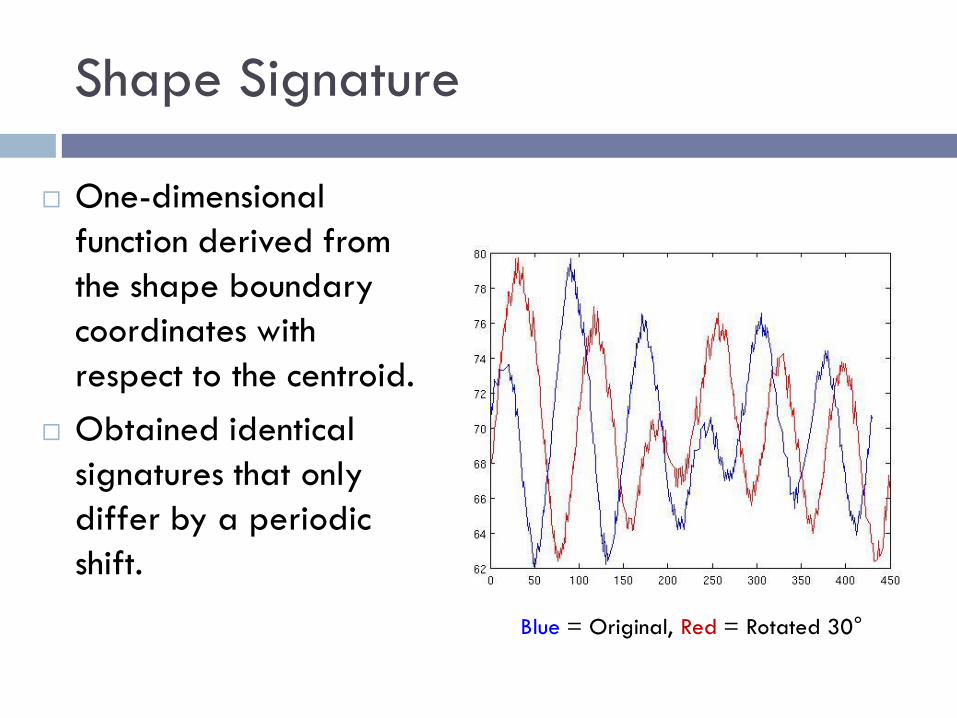
Shape Signature
One-dimensional
function derived from
the shape boundary
coordinates with
respect to the centroid.
Obtained identical
signatures that only
differ by a periodic
shift.
Blue = Original, Red = Rotated 30°
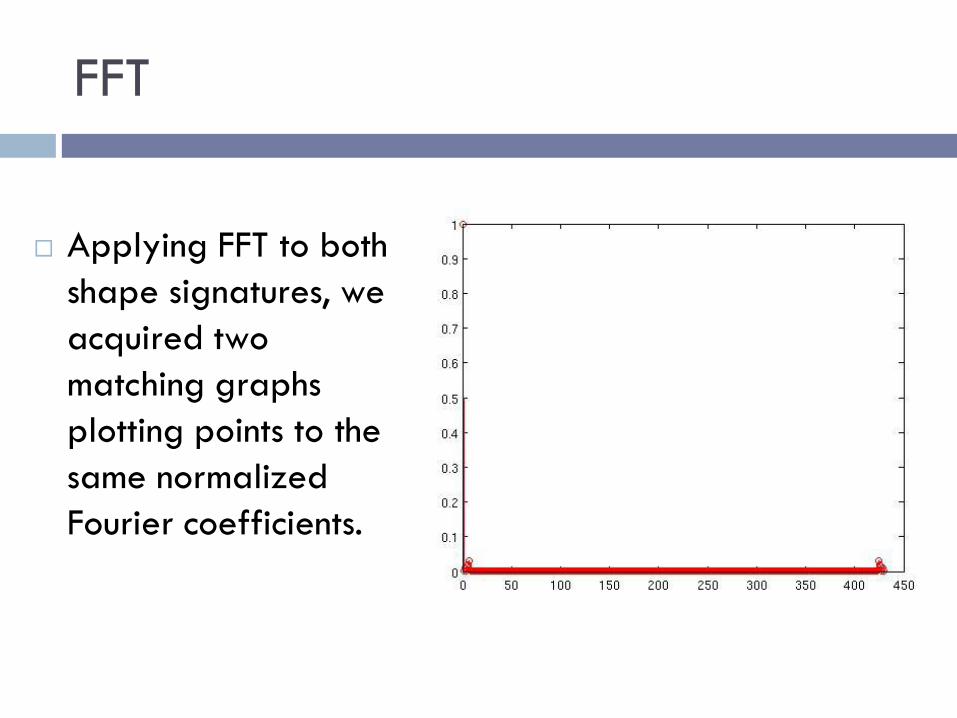
FFT
Applying FFT to both
shape signatures, we
acquired two
matching graphs
plotting points to the
same normalized
Fourier coefficients.
Polar Rectangles
Converts pixels in image from Cartesian to Polar
Allows for partitions both in Θ and r
Quantifies the distance from the centroid where the
stem cell lies
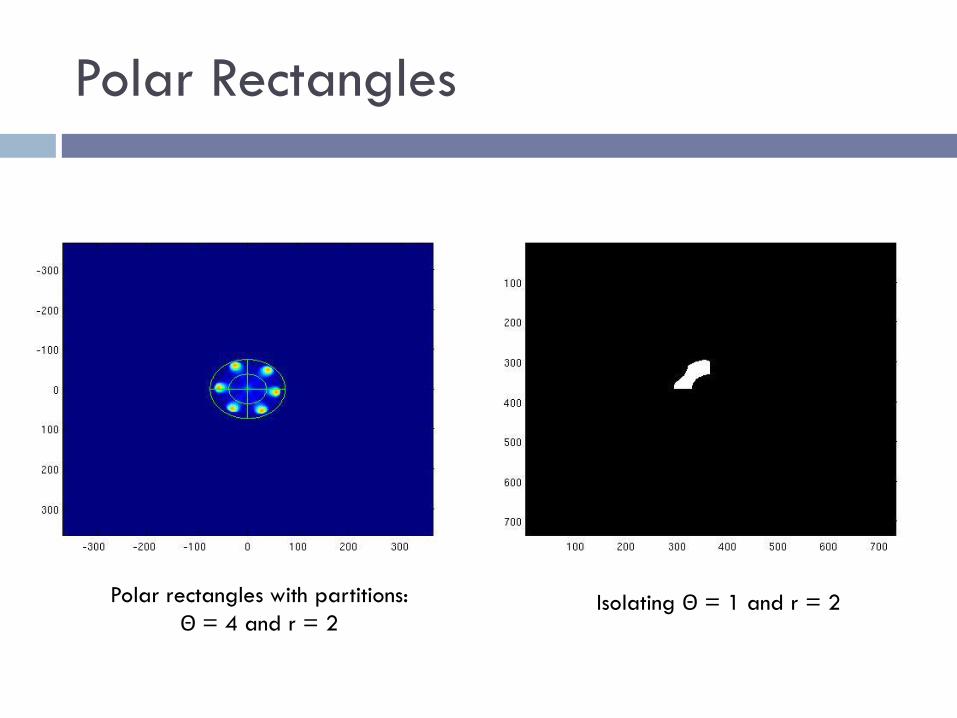
Polar Rectangles
Polar rectangles with partitions:
Θ = 4 and r = 2Isolating Θ = 1 and r = 2
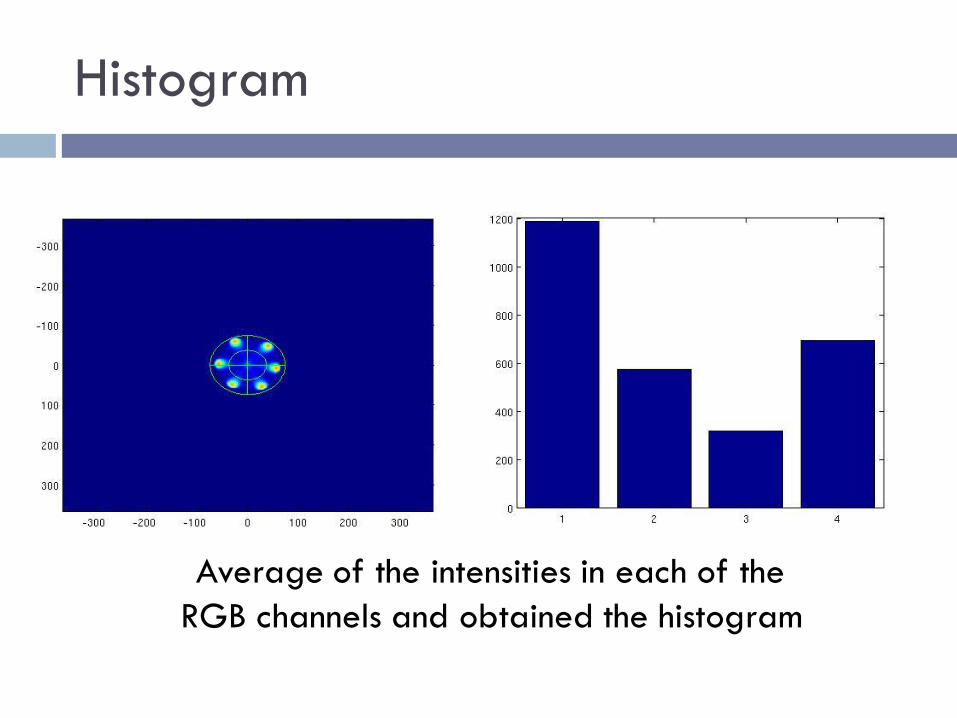
Histogram
Average of the intensities in each of the
RGB channels and obtained the histogram
Polar Rectangles
Further Research:
Integrate within the polar rectangles
Seeing the stem cell concentrations around the
boundary, look at the average curvature of the
boundary and relate to cell deformation
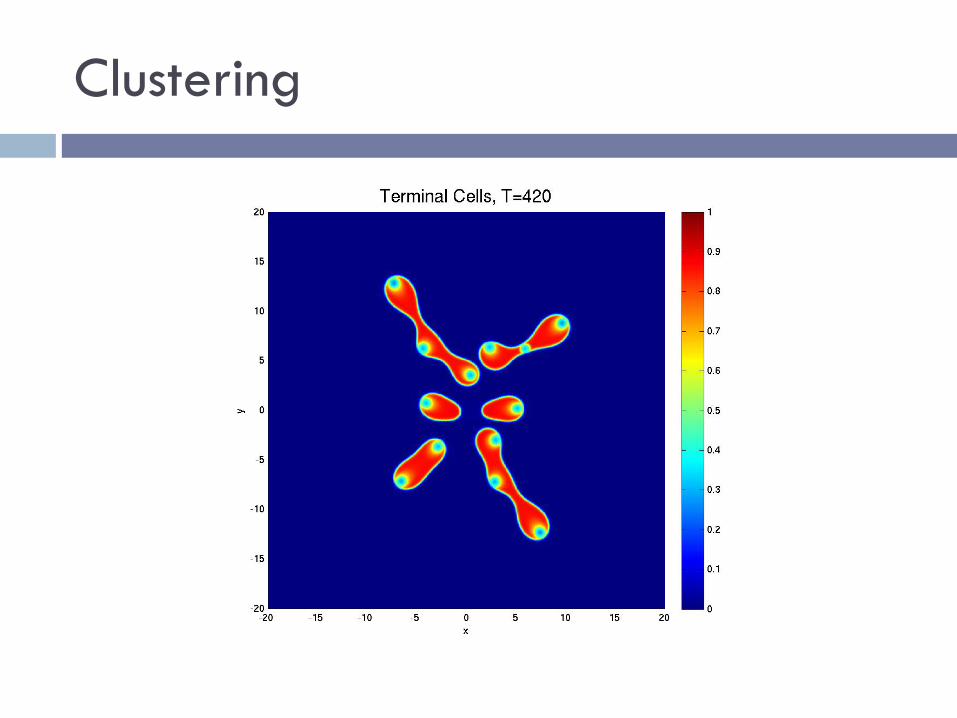
Clustering
Clustering
Isolated the different cell regions
Applied FFT with centroid distance to the cells
Up-sampled the boundary points to resize all
images to the same vector length
Applied K-means
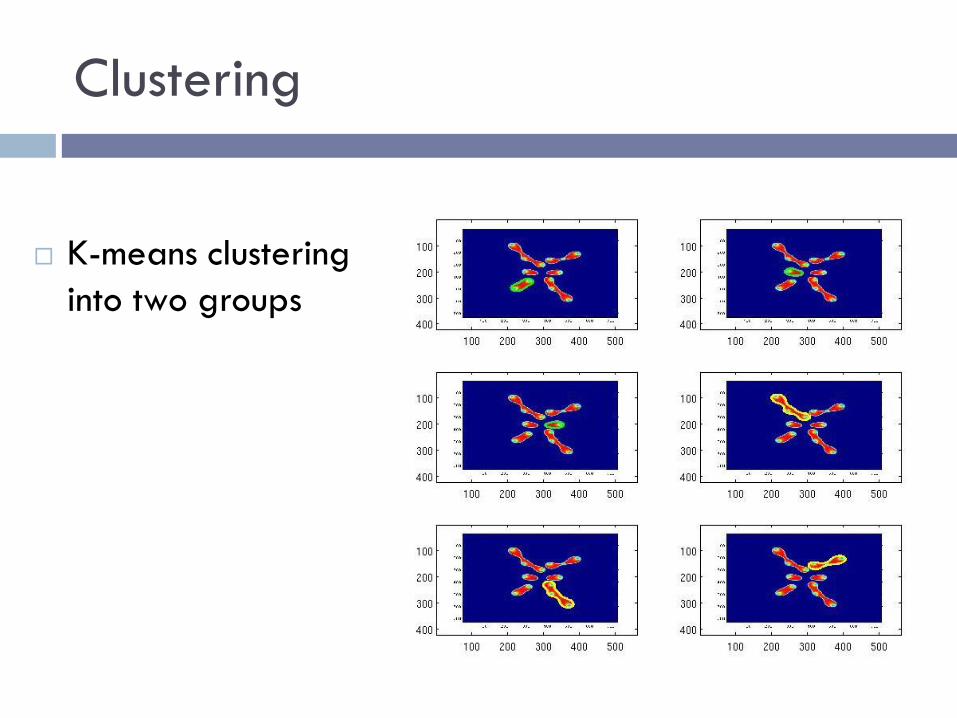
Clustering
K-means clustering
into two groups
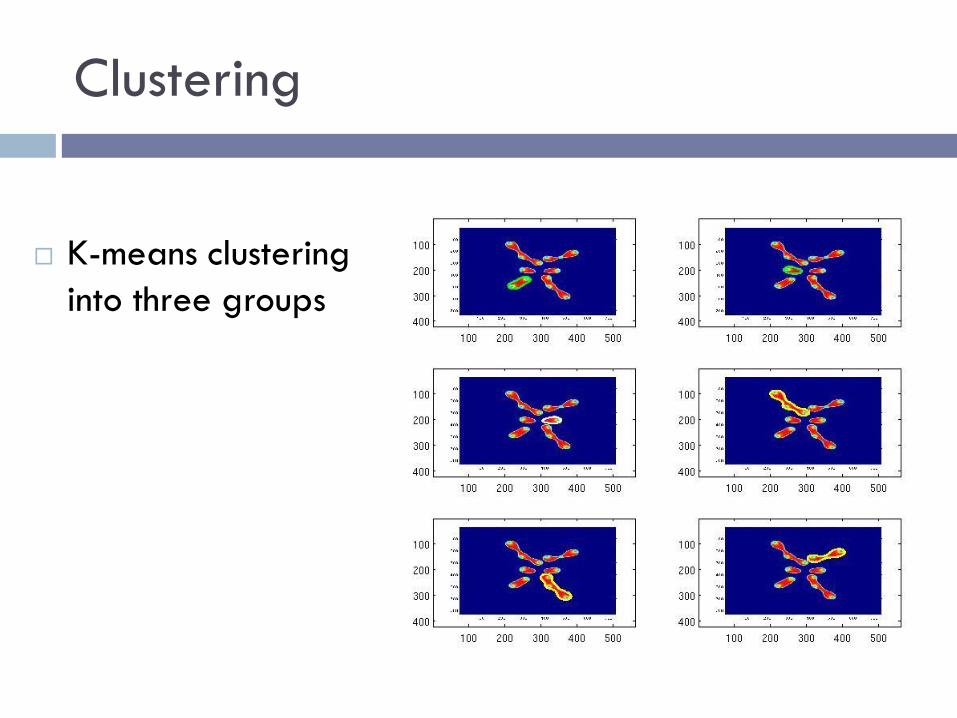
Clustering
K-means clustering
into three groups
Clustering
Further Research:
Use both the shape descriptor along with the contextual
data to classify and cluster cancer cells
Classifications to be used in distinguishing cancer cells
from non-cancer cells or even characterizing the
different stages of cancer cells


![) and K · f1(1285)! a0(980)ˇ decay: formalism Vertices: f1 K (K 1) K (K).. it1 = igf1C1ϵ ϵ′ gf1 = 7555 MeV, evaluated as the residue at the pole of T = [1 VG] 1V for K K c:c:](https://static.fdocument.org/doc/165x107/5f08d6ad7e708231d423f7ef/-and-k-f11285-a0980-decay-formalism-vertices-f1-k-k-1-k-k-it1-.jpg)