Mobility and Core-Protein Binding Patterns of Disordered C ...

Correction
CELL BIOLOGYCorrection for “CCAAT/enhancer binding protein α (C/EBPα)-induced transdifferentiation of pre-B cells into macrophagesinvolves no overt retrodifferentiation,” by Alessandro Di Tullio,Thien Phong Vu Manh, Alexis Schubert, Robert Månsson, andThomas Graf, which appeared in issue 41, October 11, 2011, ofProc Natl Acad Sci USA (108:17016–17021; first published Oc-tober 3, 2011; 10.1073/pnas.1112169108).The authors note that Giancarlo Castellano should be added
to the author list between Alexis Schubert and Robert Månsson.Giancarlo Castellano should be credited with analyzing data.The corrected author and affiliation lines, and author contribu-tions appear below. The online version has been corrected.
Alessandro Di Tullioa, Thien Phong Vu Manha, AlexisSchuberta, Giancarlo Castellanob, Robert Månssonc,and Thomas Grafa,d
aCancer and Differentiation Program, Center for Genomic Regulation andPompeu Fabra University, 08003 Barcelona, Spain; bGene RegulationProgram, Center for Genomic Regulation and Pompeu Fabra University,08003 Barcelona, Spain; cLund Strategic Research Center for Stem CellBiology and Cell Therapy, Lund University, 22184 Lund, Sweden; anddInstitució Catalana de Recerca i Estudis Avançats, 08010 Barcelona, Spain
Author contributions: A.D. and T.G. designed research; A.D. and A.S. performed research;R.M. contributed new reagents/analytic tools; A.D., T.P.V.M., and G.C. analyzed data; andA.D., T.P.V.M., and T.G. wrote the paper.
www.pnas.org/cgi/doi/10.1073/pnas.1208762109
www.pnas.org PNAS | July 3, 2012 | vol. 109 | no. 27 | 11053
CORR
ECTION
CCAAT/enhancer binding protein α (C/EBPα)-inducedtransdifferentiation of pre-B cells into macrophagesinvolves no overt retrodifferentiationAlessandro Di Tullioa,1, Thien Phong Vu Manha,1,2, Alexis Schuberta, Giancarlo Castellanob, Robert Månssonc,and Thomas Grafa,d,3
aCancer and Differentiation Program, Center for Genomic Regulation and Pompeu Fabra University, 08003 Barcelona, Spain; bGene Regulation Program,Center for Genomic Regulation and Pompeu Fabra University, 08003 Barcelona, Spain; cLund Strategic Research Center for Stem Cell Biology and Cell Therapy,Lund University, 22184 Lund, Sweden; and dInstitució Catalana de Recerca i Estudis Avançats, 08010 Barcelona, Spain
Edited by Rudolf Jaenisch, Whitehead Institute for Biomedical Research, Cambridge, MA, and approved September 7, 2011 (received for review July 26, 2011)
Earlier work has shown that pre-B cells can be converted intomacrophages by the transcription factor CCAAT/enhancer bindingprotein α at very high frequencies. Using this system, we performeda systematic analysis ofwhether during transdifferentiation the cellstransiently reactivate progenitor-restricted genes or even retrodif-ferentiate. A transcriptome analysis of transdifferentiating cellsshowed that most genes are up- or down-regulated continuously,acquiring a macrophage phenotype within 5 d. In addition, we ob-served the transient reactivation of a subset of immature myeloidmarkers, as well as low levels of the progenitor markers Kit andFMS-like tyrosine kinase 3 and a few lineage-inappropriate genes.Importantly, however, we were unable to observe the reexpressionof cell-surface marker combinations that characterize hematopoieticstem and progenitor cells, including c-Kit and FMS-like tyrosinekinase 3, even when CAAT/enhancer binding protein α was acti-vated in pre-B cells under culture conditions that favor growth ofhematopoietic stem and progenitor cells or when the transcriptionfactorwas activated in a time-limited fashion. Together, ourfindingsare consistent with the notion that the conversion from pre-B cellsto macrophages is mostly direct and does not involve overt retro-differentiation.
cell fate decision | cell reprogramming | hematopoietic differentiationlineage commitment
Transcription factor-induced cell reprogramming has becomea major field within stem cell research. Two major types of
forced cell-fate changes have been described: the induction ofsomatic cells into induced pluripotent stem (iPS) cells and thetransdifferentiation of cells from one lineage into another (1, 2).The number of transcription factor-mediated lineage conversionshas increased steadily in recent years, mostly involving “shortjumps” between closely related cell types, although ”long jumps”from mesoderm to either ectoderm or endoderm also have beenreported recently (3, 4). It has been suggested that lineage con-versions represent direct transitions from one differentiated stateinto another, with cells “hopping over mountains” within Wad-dington’s epigenetic landscape (5). This argument is based pri-marily on the findings that transdifferentiation does not requirecell divisions (3, 6, 7), that the process is fast, and that no stableintermediates are generated. Consistent with this notion, noreactivation of selected transcription factors characteristic ofprogenitors could be observed during the conversion of fibroblastsinto cardiomyocytes (8) or of exocrine into endocrine pancreaticcells (6), although this question has not been systematically studied.In an interesting example of physiological transdifferentiation inCaenorhabditis elegans, in which a gut epithelial cell transforms intoa neuron, the cell transits through an intermediate stage duringwhich it completely erases its identity before redifferentiating intoa motoneuron, in a mechanism that requires Uncoordinated familymember 3 (unc-3) activity (9).The transdifferentiation of pre-B cells into macrophages in-
duced by CCAAT/enhancer binding protein α (C/EBPα) con-
stitutes an ideal system to examine whether cells retrodifferentiateor reactivate progenitor genes during the process, because cellscan be converted at essentially 100% efficiency within 3–5 d,during which time the population doubles once (10, 11). In addi-tion, the system offers the advantage that hematopoietic stem cellsand various intermediate progenitor cells (HSPCs) are defined byspecific cell-surface antigen combinations and that expression arraydatabases are available. In this study we asked whether over-expression of C/EBPα induces pre-B cells to “hop over the moun-tain” or whether it reactivates progenitor traits and markers (Fig.S1A). We conclude that, although a few progenitor markers be-come reactivated, the transdifferentiation process is mostly direct.
ResultsC/EBPα Converts the Transcriptome of Pre-B Cells into One Resem-bling Normal Macrophages and Strongly Represses Cell-Cycle Genes.To address whether during reprogramming of pre-B cells intomacrophage cells transiently reactivates progenitor markers, weanalyzed transdifferentiating cells by gene-expression arrays. Aprerequisite for these experiments was that the cells studiedswitch at high frequencies. Earlier work with a pre–B-cell lineexpressing C/EBPα fused with the estrogen receptor (CEBPαER)had shown that these cells could be converted at 100% efficiency(11), a significant improvement over the 65% conversion observedwith primary pre-B cells carrying a wild-type C/EBPα (10). How-ever, a cell line is not suitable for our studies, because as it is notidentical to its normal counterparts and is separated from normalprogenitors by many population doublings. We therefore tested ifprimary cells could be switched at high frequencies by preparingbone marrow, sorting primary CD19+ cells, infecting them withC/EBPαER-GFP virus, and seeding them for 2 d on stromal cells(OP9 or S17) in the presence of IL-7. After their expansion, GFP+
cells were sorted again, seeded on stroma under conditions per-missive for hematopoietic progenitors, B-lineage cells, and mye-loid-lineage cells [stem cell factor (SCF), IL-7, FMS-like tyrosinekinase 3 (Flt3), IL-3, and macrophage colony-stimulating factor(M-CSF)], and induced them with β-estradiol (β-Est). As shown inFig. S1B, the infected cells began to down-regulate CD19 and up-
Author contributions: A.D. and T.G. designed research; A.D. and A.S. performed research;R.M. contributed new reagents/analytic tools; A.D., T.P.V.M., and G.C. analyzed data; andA.D., T.P.V.M., and T.G. wrote the paper.
The authors declare no conflict of interest.
This article is a PNAS Direct Submission.
Data deposition: The data for normal progenitors have been deposited in the GeneExpression Omnibus (GEO) database, www.ncbi.nlm.nih.gov/geo (accession no.GSE14833). The expression array data for the cells during reprogramming will be sub-mitted to GEO.1A.D. and T.P.V.M. contributed equally to this work.2Present address: Centre d’Immunologie de Marseille-Luminy, Marseille, France.3To whom correspondence should be addressed. E-mail: [email protected].
This article contains supporting information online at www.pnas.org/lookup/suppl/doi:10.1073/pnas.1112169108/-/DCSupplemental.
17016–17021 | PNAS | October 11, 2011 | vol. 108 | no. 41 www.pnas.org/cgi/doi/10.1073/pnas.1112169108
regulate member of AAA family binding CED-4 (Mac-1) at 24 hand turned into fully CD19− Mac-1+ cells within 96–120 h atnearly 100% efficiency. Finally we sorted GFP+ cells from twobiological replicates at 0, 3, 12, 48, and 120 h to extract RNA, aswell as from bone marrow-derived macrophages cultured underthe same conditions.The RNAs were analyzed by Affymetrix 430.2 arrays, con-
taining ∼45,000 gene probes corresponding to 25,000 genes. Ofthese gene probes, 9,650 changed more than twofold at any time
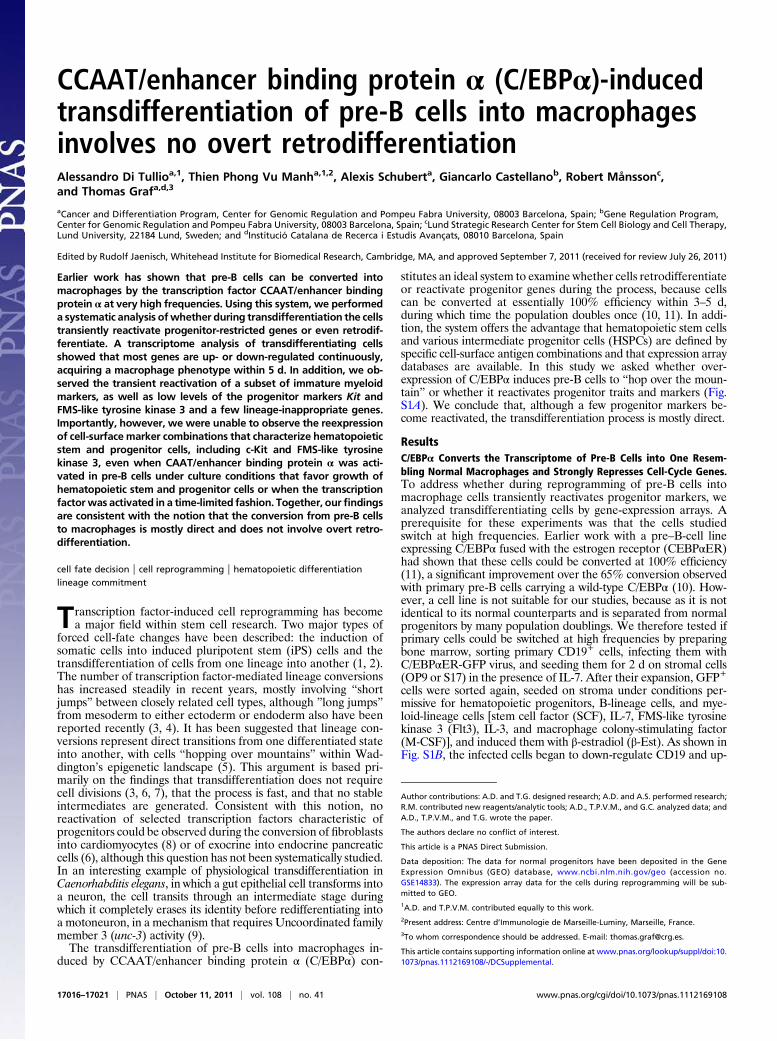
point, with 2,992 probes becoming up-regulated and 3,536becoming down-regulated (Fig. S1C). An unsupervised gene-expression clustering of all genes revealed two predominatinggroups: genes that became up-regulated (Fig. 1, on the left) andgenes that became down-regulated (Fig. 1, on the right). In ad-dition, some genes were transiently up- or down-regulated. Thegene-expression pattern obtained 120 h after induction differeddramatically from the starting cells and resembled that of bonemarrow-derived macrophages, showing a Pearson correlation co-
Fig 1. Gene-expression profiles of cells during C/EBPα-induced reprogramming. Unsupervised hierarchical cluster-ing of Affymetrix gene-expression array data of pre-B cellsinduced for the times indicated. All probes that showeda greater than twofold change in expression at any timeduring the experiment were included. Negative peaks inblack represent probes expressed below the median value;positive peaks in red represent probes expressed above themedian value. Affymetrix expression values are indicated ina log2 scale. Positions corresponding to the expression ofMac1 and Cd19 genes are shown above the profiles.
A B C
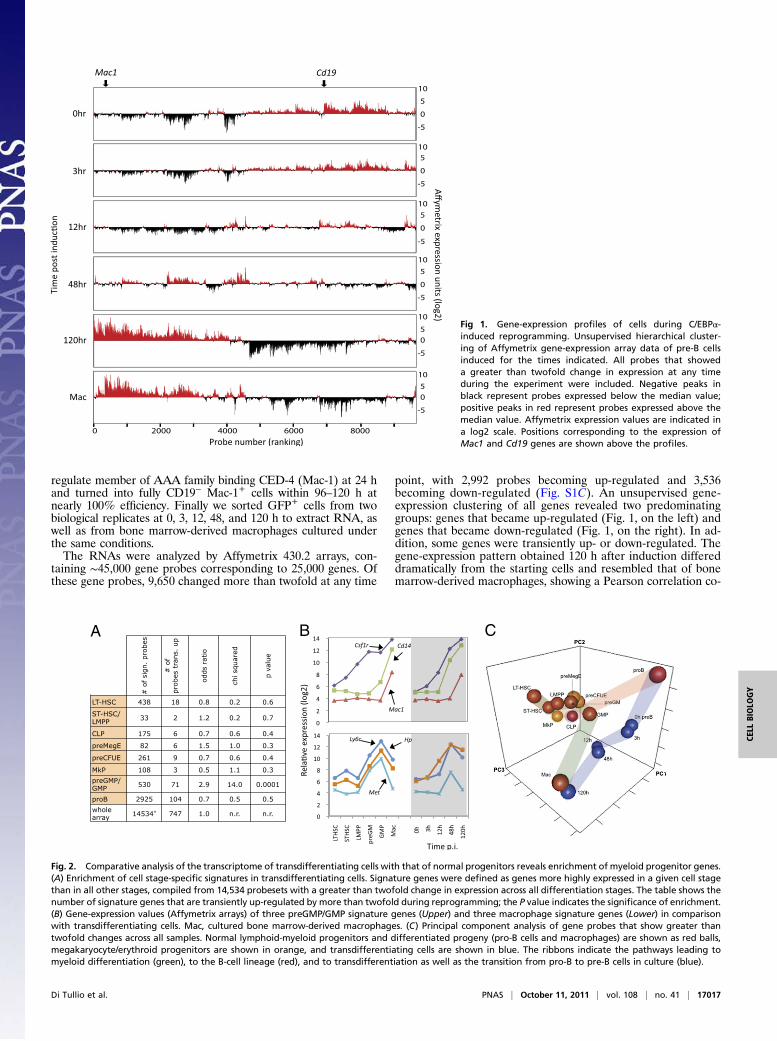
Fig. 2. Comparative analysis of the transcriptome of transdifferentiating cells with that of normal progenitors reveals enrichment of myeloid progenitor genes.(A) Enrichment of cell stage-specific signatures in transdifferentiating cells. Signature genes were defined as genes more highly expressed in a given cell stagethan in all other stages, compiled from 14,534 probesets with a greater than twofold change in expression across all differentiation stages. The table shows thenumber of signature genes that are transiently up-regulated by more than twofold during reprogramming; the P value indicates the significance of enrichment.(B) Gene-expression values (Affymetrix arrays) of three preGMP/GMP signature genes (Upper) and three macrophage signature genes (Lower) in comparisonwith transdifferentiating cells. Mac, cultured bone marrow-derived macrophages. (C) Principal component analysis of gene probes that show greater thantwofold changes across all samples. Normal lymphoid-myeloid progenitors and differentiated progeny (pro-B cells and macrophages) are shown as red balls,megakaryocyte/erythroid progenitors are shown in orange, and transdifferentiating cells are shown in blue. The ribbons indicate the pathways leading tomyeloid differentiation (green), to the B-cell lineage (red), and to transdifferentiation as well as the transition from pro-B to pre-B cells in culture (blue).
Di Tullio et al. PNAS | October 11, 2011 | vol. 108 | no. 41 | 17017
CELL
BIOLO
GY
efficient of 0.876 for genes that change and of 0.964 for all genes(Fig. 1 and Fig. S1 D and E). Furthermore, the 120-h expressionlevels of macrophage and B-cell–associated genes reached levelsclose to those seen in bone marrow-derived macrophages(Fig. S1F). However, many genes became down-regulated to levelsbelow those of normal macrophages (Fig. 1G). Functional analysisof these genes using the Database for Annotation, Visualizationand IntegratedDiscovery (DAVID) revealed a high enrichment ofgenes involved in cell cycle, mitosis, and DNA replication andsynthesis. Therefore it is likely that the strong repression of genesin this group is caused mostly by the known cell-cycle inhibitoryactivity of C/EBPα through its ability to inactivate the transcrip-tion factor E2F (12). These findings imply that the majority ofgenes whose expression changes establish the differentiationphenotype of characteristic macrophages.
A Small Subset of Myelomonocytic Precursor Genes Becomes Tran-siently Activated. If cells retrodifferentiate during transdifferen-tiation or diverge into alternative lineages before acquiring theirfinal fate, they should transiently activate hematopoietic precursoror lineage-restricted genes. We therefore compared our array datawith gene-expression data from normal hematopoietic progenitors(13, 14). To this end we first determined cell stage-specific sig-natures consisting of the most highly expressed gene probes ina given cell type relative to all other cell types (sometimes twogroups were combined to obtain statistically meaningful numbers).The following stages/groups (Fig. 2A) were included: long-termhematopoietic stem cells (LT-HSCs); a combination short-termhematopoietic stem cells (ST-HSCs) and lymphoid-primed mul-tipotential progenitors (LMPPs); common lymphoid progenitors(CPLs); pro-B cells (proBs); granulocyte monocyte precursors(preGMs) plus granulocyte monocyte progenitors (GMPs);megakaryocyte erythroid precursors (preMegEs); erythroid pre-cursors (preCFUEs); and megakaryocyte precursors (MkPs).Among the 14,534 gene probes that showed >1.7-fold changes inexpression across all progenitor stages, 747 were transiently up-regulated in at least one time point of the reprogramming process.Of the transiently up-regulated probes only preGM/GMP-specificprobes showed a significant enrichment among transiently up-regulated genes (Fig. 2A). Specifically, 55 of the 530 signatureprobes (10.4%) showed their highest expression at 48 h post in-duction (p.i.), 9 peaked at 12 h p.i., and 5 peaked at 3–12 h p.i.(Table S1 and Fig. S2A). Three genes of the 48-h group [lym-phocyte antigen 6 complex (Ly6c), Met, and haptoglobin (Hp)] il-lustrate the concordance of expression with preGM/GMPs (Fig.2B, Lower), whereas three macrophage-specific genes [colony-stimulating factor 1 receptor (Csf1r), Mac1, and Cd14] reachedtheir peaks only at 120 h p.i. (Fig. 2B, Upper). Ly6C is a gran-ulocyte/monocyte-associated glycosylphosphatidylinositol-linkedcell-surface antigen (15), Met corresponds to the hepatocytegrowth factor receptor, and haptoglobin is a hormone secreted bygranulocytes and hepatocytes (16), but a function during myelo-poiesis is not known for any of these proteins. The difference in thetiming of expression between Ly6c and Mac1 was confirmed byquantitative RT-PC (qRT-PCR) (Fig. S2B) and by FACS analysis(Fig. S2C). The observed lack of a global reactivation of progenitorgenes also is supported by a principal component analysis showingthat the trajectory of the transdifferentiating cells does not deviatesubstantially toward early progenitors (Fig. 2C).
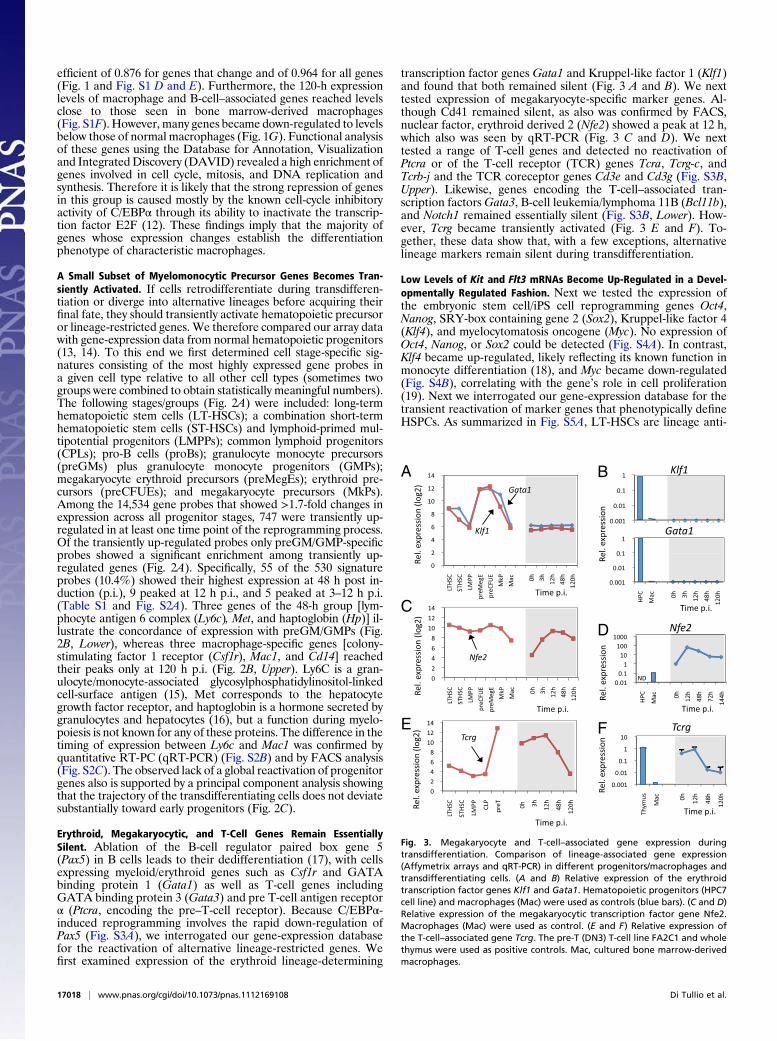
Erythroid, Megakaryocytic, and T-Cell Genes Remain EssentiallySilent. Ablation of the B-cell regulator paired box gene 5(Pax5) in B cells leads to their dedifferentiation (17), with cellsexpressing myeloid/erythroid genes such as Csf1r and GATAbinding protein 1 (Gata1) as well as T-cell genes includingGATA binding protein 3 (Gata3) and pre T-cell antigen receptorα (Ptcra, encoding the pre–T-cell receptor). Because C/EBPα-induced reprogramming involves the rapid down-regulation ofPax5 (Fig. S3A), we interrogated our gene-expression databasefor the reactivation of alternative lineage-restricted genes. Wefirst examined expression of the erythroid lineage-determining
transcription factor genes Gata1 and Kruppel-like factor 1 (Klf1)and found that both remained silent (Fig. 3 A and B). We nexttested expression of megakaryocyte-specific marker genes. Al-though Cd41 remained silent, as also was confirmed by FACS,nuclear factor, erythroid derived 2 (Nfe2) showed a peak at 12 h,which also was seen by qRT-PCR (Fig. 3 C and D). We nexttested a range of T-cell genes and detected no reactivation ofPtcra or of the T-cell receptor (TCR) genes Tcra, Tcrg-c, andTcrb-j and the TCR coreceptor genes Cd3e and Cd3g (Fig. S3B,Upper). Likewise, genes encoding the T-cell–associated tran-scription factorsGata3, B-cell leukemia/lymphoma 11B (Bcl11b),and Notch1 remained essentially silent (Fig. S3B, Lower). How-ever, Tcrg became transiently activated (Fig. 3 E and F). To-gether, these data show that, with a few exceptions, alternativelineage markers remain silent during transdifferentiation.
Low Levels of Kit and Flt3 mRNAs Become Up-Regulated in a Devel-opmentally Regulated Fashion. Next we tested the expression ofthe embryonic stem cell/iPS cell reprogramming genes Oct4,Nanog, SRY-box containing gene 2 (Sox2), Kruppel-like factor 4(Klf4), and myelocytomatosis oncogene (Myc). No expression ofOct4, Nanog, or Sox2 could be detected (Fig. S4A). In contrast,Klf4 became up-regulated, likely reflecting its known function inmonocyte differentiation (18), and Myc became down-regulated(Fig. S4B), correlating with the gene’s role in cell proliferation(19). Next we interrogated our gene-expression database for thetransient reactivation of marker genes that phenotypically defineHSPCs. As summarized in Fig. S5A, LT-HSCs are lineage anti-
A B
C
D
E F
Fig. 3. Megakaryocyte and T-cell–associated gene expression duringtransdifferentiation. Comparison of lineage-associated gene expression(Affymetrix arrays and qRT-PCR) in different progenitors/macrophages andtransdifferentiating cells. (A and B) Relative expression of the erythroidtranscription factor genes Klf1 and Gata1. Hematopoietic progenitors (HPC7cell line) and macrophages (Mac) were used as controls (blue bars). (C and D)Relative expression of the megakaryocytic transcription factor gene Nfe2.Macrophages (Mac) were used as control. (E and F) Relative expression ofthe T-cell–associated gene Tcrg. The pre-T (DN3) T-cell line FA2C1 and wholethymus were used as positive controls. Mac, cultured bone marrow-derivedmacrophages.
17018 | www.pnas.org/cgi/doi/10.1073/pnas.1112169108 Di Tullio et al.
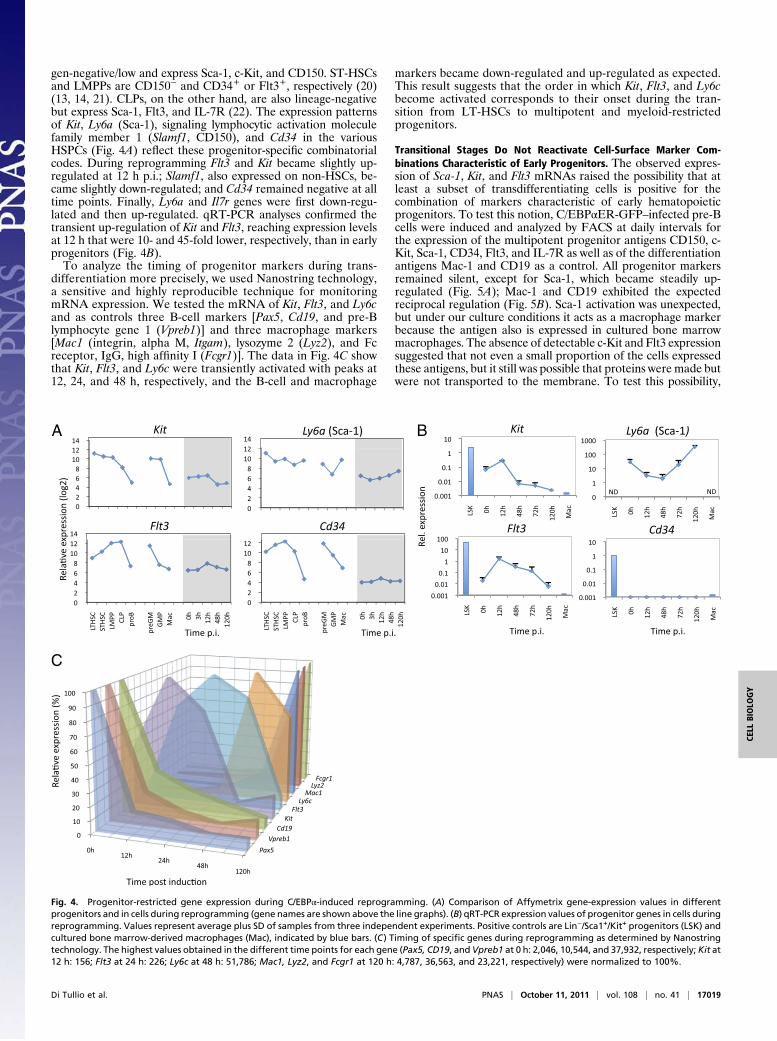
gen-negative/low and express Sca-1, c-Kit, and CD150. ST-HSCsand LMPPs are CD150− and CD34+ or Flt3+, respectively (20)(13, 14, 21). CLPs, on the other hand, are also lineage-negativebut express Sca-1, Flt3, and IL-7R (22). The expression patternsof Kit, Ly6a (Sca-1), signaling lymphocytic activation moleculefamily member 1 (Slamf1, CD150), and Cd34 in the variousHSPCs (Fig. 4A) reflect these progenitor-specific combinatorialcodes. During reprogramming Flt3 and Kit became slightly up-regulated at 12 h p.i.; Slamf1, also expressed on non-HSCs, be-came slightly down-regulated; and Cd34 remained negative at alltime points. Finally, Ly6a and Il7r genes were first down-regu-lated and then up-regulated. qRT-PCR analyses confirmed thetransient up-regulation of Kit and Flt3, reaching expression levelsat 12 h that were 10- and 45-fold lower, respectively, than in earlyprogenitors (Fig. 4B).To analyze the timing of progenitor markers during trans-
differentiation more precisely, we used Nanostring technology,a sensitive and highly reproducible technique for monitoringmRNA expression. We tested the mRNA of Kit, Flt3, and Ly6cand as controls three B-cell markers [Pax5, Cd19, and pre-Blymphocyte gene 1 (Vpreb1)] and three macrophage markers[Mac1 (integrin, alpha M, Itgam), lysozyme 2 (Lyz2), and Fcreceptor, IgG, high affinity I (Fcgr1)]. The data in Fig. 4C showthat Kit, Flt3, and Ly6c were transiently activated with peaks at12, 24, and 48 h, respectively, and the B-cell and macrophage
markers became down-regulated and up-regulated as expected.This result suggests that the order in which Kit, Flt3, and Ly6cbecome activated corresponds to their onset during the tran-sition from LT-HSCs to multipotent and myeloid-restrictedprogenitors.
Transitional Stages Do Not Reactivate Cell-Surface Marker Com-binations Characteristic of Early Progenitors. The observed expres-sion of Sca-1, Kit, and Flt3 mRNAs raised the possibility that atleast a subset of transdifferentiating cells is positive for thecombination of markers characteristic of early hematopoieticprogenitors. To test this notion, C/EBPαER-GFP–infected pre-Bcells were induced and analyzed by FACS at daily intervals forthe expression of the multipotent progenitor antigens CD150, c-Kit, Sca-1, CD34, Flt3, and IL-7R as well as of the differentiationantigens Mac-1 and CD19 as a control. All progenitor markersremained silent, except for Sca-1, which became steadily up-regulated (Fig. 5A); Mac-1 and CD19 exhibited the expectedreciprocal regulation (Fig. 5B). Sca-1 activation was unexpected,but under our culture conditions it acts as a macrophage markerbecause the antigen also is expressed in cultured bone marrowmacrophages. The absence of detectable c-Kit and Flt3 expressionsuggested that not even a small proportion of the cells expressedthese antigens, but it still was possible that proteins were made butwere not transported to the membrane. To test this possibility,
A B
C
Fig. 4. Progenitor-restricted gene expression during C/EBPα-induced reprogramming. (A) Comparison of Affymetrix gene-expression values in differentprogenitors and in cells during reprogramming (gene names are shown above the line graphs). (B) qRT-PCR expression values of progenitor genes in cells duringreprogramming. Values represent average plus SD of samples from three independent experiments. Positive controls are Lin−/Sca1+/Kit+ progenitors (LSK) andcultured bone marrow-derived macrophages (Mac), indicated by blue bars. (C) Timing of specific genes during reprogramming as determined by Nanostringtechnology. The highest values obtained in the different time points for each gene (Pax5, CD19, andVpreb1 at 0 h: 2,046, 10,544, and 37,932, respectively; Kit at12 h: 156; Flt3 at 24 h: 226; Ly6c at 48 h: 51,786; Mac1, Lyz2, and Fcgr1 at 120 h: 4,787, 36,563, and 23,221, respectively) were normalized to 100%.
Di Tullio et al. PNAS | October 11, 2011 | vol. 108 | no. 41 | 17019
CELL
BIOLO
GY
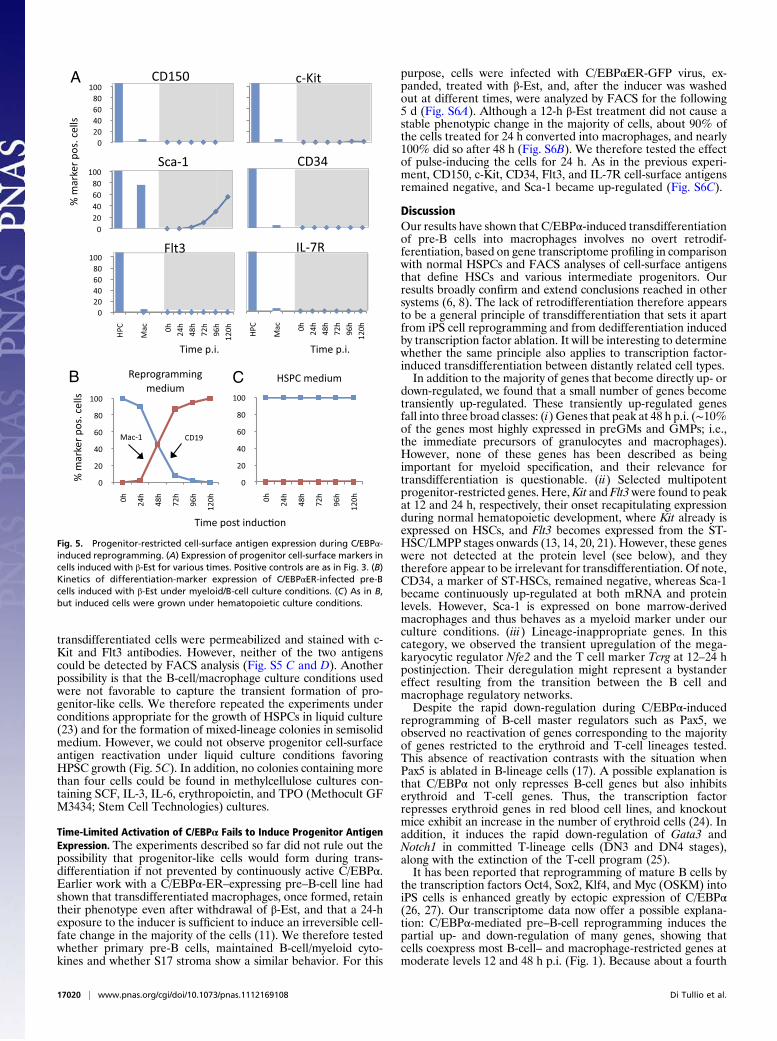
transdifferentiated cells were permeabilized and stained with c-Kit and Flt3 antibodies. However, neither of the two antigenscould be detected by FACS analysis (Fig. S5 C and D). Anotherpossibility is that the B-cell/macrophage culture conditions usedwere not favorable to capture the transient formation of pro-genitor-like cells. We therefore repeated the experiments underconditions appropriate for the growth of HSPCs in liquid culture(23) and for the formation of mixed-lineage colonies in semisolidmedium. However, we could not observe progenitor cell-surfaceantigen reactivation under liquid culture conditions favoringHPSC growth (Fig. 5C). In addition, no colonies containing morethan four cells could be found in methylcellulose cultures con-taining SCF, IL-3, IL-6, erythropoietin, and TPO (Methocult GFM3434; Stem Cell Technologies) cultures.
Time-Limited Activation of C/EBPα Fails to Induce Progenitor AntigenExpression. The experiments described so far did not rule out thepossibility that progenitor-like cells would form during trans-differentiation if not prevented by continuously active C/EBPα.Earlier work with a C/EBPα-ER–expressing pre–B-cell line hadshown that transdifferentiated macrophages, once formed, retaintheir phenotype even after withdrawal of β-Est, and that a 24-hexposure to the inducer is sufficient to induce an irreversible cell-fate change in the majority of the cells (11). We therefore testedwhether primary pre-B cells, maintained B-cell/myeloid cyto-kines and whether S17 stroma show a similar behavior. For this
purpose, cells were infected with C/EBPαER-GFP virus, ex-panded, treated with β-Est, and, after the inducer was washedout at different times, were analyzed by FACS for the following5 d (Fig. S6A). Although a 12-h β-Est treatment did not cause astable phenotypic change in the majority of cells, about 90% ofthe cells treated for 24 h converted into macrophages, and nearly100% did so after 48 h (Fig. S6B). We therefore tested the effectof pulse-inducing the cells for 24 h. As in the previous experi-ment, CD150, c-Kit, CD34, Flt3, and IL-7R cell-surface antigensremained negative, and Sca-1 became up-regulated (Fig. S6C).
DiscussionOur results have shown that C/EBPα-induced transdifferentiationof pre-B cells into macrophages involves no overt retrodif-ferentiation, based on gene transcriptome profiling in comparisonwith normal HSPCs and FACS analyses of cell-surface antigensthat define HSCs and various intermediate progenitors. Ourresults broadly confirm and extend conclusions reached in othersystems (6, 8). The lack of retrodifferentiation therefore appearsto be a general principle of transdifferentiation that sets it apartfrom iPS cell reprogramming and from dedifferentiation inducedby transcription factor ablation. It will be interesting to determinewhether the same principle also applies to transcription factor-induced transdifferentiation between distantly related cell types.In addition to the majority of genes that become directly up- or
down-regulated, we found that a small number of genes becometransiently up-regulated. These transiently up-regulated genesfall into three broad classes: (i) Genes that peak at 48 h p.i. (∼10%of the genes most highly expressed in preGMs and GMPs; i.e.,the immediate precursors of granulocytes and macrophages).However, none of these genes has been described as beingimportant for myeloid specification, and their relevance fortransdifferentiation is questionable. (ii) Selected multipotentprogenitor-restricted genes. Here,Kit and Flt3were found to peakat 12 and 24 h, respectively, their onset recapitulating expressionduring normal hematopoietic development, where Kit already isexpressed on HSCs, and Flt3 becomes expressed from the ST-HSC/LMPP stages onwards (13, 14, 20, 21). However, these geneswere not detected at the protein level (see below), and theytherefore appear to be irrelevant for transdifferentiation. Of note,CD34, a marker of ST-HSCs, remained negative, whereas Sca-1became continuously up-regulated at both mRNA and proteinlevels. However, Sca-1 is expressed on bone marrow-derivedmacrophages and thus behaves as a myeloid marker under ourculture conditions. (iii) Lineage-inappropriate genes. In thiscategory, we observed the transient upregulation of the mega-karyocytic regulator Nfe2 and the T cell marker Tcrg at 12–24 hpostinjection. Their deregulation might represent a bystandereffect resulting from the transition between the B cell andmacrophage regulatory networks.Despite the rapid down-regulation during C/EBPα-induced
reprogramming of B-cell master regulators such as Pax5, weobserved no reactivation of genes corresponding to the majorityof genes restricted to the erythroid and T-cell lineages tested.This absence of reactivation contrasts with the situation whenPax5 is ablated in B-lineage cells (17). A possible explanation isthat C/EBPα not only represses B-cell genes but also inhibitserythroid and T-cell genes. Thus, the transcription factorrepresses erythroid genes in red blood cell lines, and knockoutmice exhibit an increase in the number of erythroid cells (24). Inaddition, it induces the rapid down-regulation of Gata3 andNotch1 in committed T-lineage cells (DN3 and DN4 stages),along with the extinction of the T-cell program (25).It has been reported that reprogramming of mature B cells by
the transcription factors Oct4, Sox2, Klf4, and Myc (OSKM) intoiPS cells is enhanced greatly by ectopic expression of C/EBPα(26, 27). Our transcriptome data now offer a possible explana-tion: C/EBPα-mediated pre–B-cell reprogramming induces thepartial up- and down-regulation of many genes, showing thatcells coexpress most B-cell– and macrophage-restricted genes atmoderate levels 12 and 48 h p.i. (Fig. 1). Because about a fourth
A
B C
Fig. 5. Progenitor-restricted cell-surface antigen expression during C/EBPα-induced reprogramming. (A) Expression of progenitor cell-surface markers incells induced with β-Est for various times. Positive controls are as in Fig. 3. (B)Kinetics of differentiation-marker expression of C/EBPαER-infected pre-Bcells induced with β-Est under myeloid/B-cell culture conditions. (C) As in B,but induced cells were grown under hematopoietic culture conditions.
17020 | www.pnas.org/cgi/doi/10.1073/pnas.1112169108 Di Tullio et al.
of all genes in the genome are involved in this process, it ispossible that the chromatin of intermediate-stage cells exhibits amore open configuration than that of cells at either end of thespectrum, without significantly affecting progenitor-restrictedgenes. The relaxed configuration, in turn, might facilitate theaccessibility to OSKM factors, thereby enhancing the frequencywith which iPS cells can be obtained. This speculation predictsthat in B cells expression of C/EBPα together with alternativelineage-instructive transcription factors might generate cell fatesother than macrophages. Such an approach, if feasible, alsomight be applicable to nonhematopoietic cell types, offering apotential strategy for generating cells desired for cell therapy.
MethodsCells and Viral Constructs. B-cell precursors and macrophages were obtainedfrom mouse bone marrow as described (10, 28). The hematopoietic pro-genitor line HPC7 was kindly provided by L. Carlsson (Umeå Center forMolecular Medicine, Umeå University, Umeå, Sweden) (29). The LSK cellpopulation was sorted as described (30). The construction and production ofa murine stem cell virus (MSCV) C/EBPαER internal ribosome entry site (IRES)GFP virus was as described (11).
Cell Reprogramming and FACS Analyses. SortedprimaryB cellswere infected for2 d with C/EBPαER-GFP (infection efficiencies between 30 and 70%), sortedagain, induced with 100 nM β-Est (Calbiochem), and grown on S17 cells inspecial induction medium containing 10 ng/mL IL-7, IL-3, SCF, Flt3 ligand(Peprotech), and human colony-stimulating factor 1 (hCSF-1). For HSC growthconditions, C/EBPαER-infected cells were plated ontoOP9 stromal cells plus SCF,TPO, insulin-like growth factor 1 (IGf1), FGF-1, and heparin (23). Antibodies tocell-surface antigens were purchased (BD PharMingen). Cells were analyzedwith a FACS LSRIIflow cytometer (BD Biosciences), using FlowJo software (TreeStar). For pulse-induction experiments cells were washed thoroughly and in-cubated with 10 uM of the β-Est antagonist ICI (Tocris Bioscience).
Gene-Expression Profiling by Microarrays and Real-Time RT-PCR. Biologicalduplicates of pre-B cells infected with C/EBPαER were induced, and RNA wasextracted at various times thereafter, after GFP+ cells were separated from thestromal cells. RNA was extracted with the RNeasy Micro Kit (Qiagen) [qualitydetermined by Bioanalyzer (Agilent 2100)], biotinylated, and amplified in twocycles. The amplified RNAs were hybridized against Affymetrix 430.2 mousearrays. Gene-expression array data of hematopoietic precursors were fromsorted cells (13). qRT-PCR reactions were carried out in triplicate as described
(11). Ct values were normalized to glucuronidase beta (GusB), and the relativeexpression was calculated by the Pfaffl method (31). The Ct values obtainedwere expressed relative to hematopoietic progenitor cells (Lin−/Kit+) in thecase of Cd34, Kit, and Flt3 and to 0-h cells in the case of Ly6c and Met.
Nanostring Gene-Expression Analysis. Nanostring technology uses molecularbarcodes to detect and count mRNA molecules in a digital mode (32). Accu-racy and reproducibility were verified by spiking each sample with a dilutionseries of a known concentration of an RNA control, showing a coefficient ofvariation of <5% and an essentially linear dynamic range within three ordersof magnitude.
Bioinformatics Analyses. Analysis of the Affymetrix gene-expression data wasperformed as published (11).
Principal Component Analysis. Principal component analysis was performedafter scaling the values of the data matrix containing all the probes thatpassed the filter criteria as described above with the stats package in R(version 2.7.0). The image of the three principal components in a 3D scatterplot was generated using the RGL package.
Identification of Cell Type-Specific Genes. After the raw data from the pro-genitorswerenormalizedbyRMA(Affy v2.7.0), expression values for eachprobewere averaged among replicates. Probes not reaching 5 (log2 scale) in any celltype were discarded. When a probe’s expression value in a specific cell type wasgreater than 0.8 (log2 scale) as compared with its values in all other cell types, itwas considered a signature probe. A signature probe was considered to betransiently up-regulated during transdifferentiation whenever one of its ex-pression values at 3 h, 12 h, and 48 h was more than 1.7-fold higher than itsexpression value at both 0 h and 120 h. To determine enrichment, we calculatedan odds ratio between the transiently up-regulated probes and the totalnumber of signature probes, comparing this enrichment with the enrichmentobserved in the whole array; we tested the significance of enrichment using thePearson’s χ2 test.
ACKNOWLEDGMENTS. We thank S. E. Jacobsen for facilitating the progenitorexpression array data, M. Stadtfeld, H. Xie, M. Ye, P. Cosma, and members ofthe T.G. laboratory for comments, R. Stanley for providing hCSF-1, L. Sumoy,M. Hummel, and G. Castellano for bioinformatics support, and V. Chigancasand L. de Andres for technical assistance. We give special thanks toP. Lundberg, H. Pahl, and R. Roelz for collaborating in the early phase of thiswork. We received funding from the Ministerio Educación y Ciencia (GrantsSAF.2007-63058 and CSD 2006-00049) and from the HEROIC consortium.
1. Yamanaka S (2009) Elite and stochastic models for induced pluripotent stem cellgeneration. Nature 460:49–52.
2. Graf T, Enver T (2009) Forcing cells to change lineages. Nature 462:587–594.3. Vierbuchen T, et al. (2010) Direct conversion of fibroblasts to functional neurons by
defined factors. Nature 463:1035–1041.4. Huang P, et al. (2011) Induction of functional hepatocyte-like cells from mouse fi-
broblasts by defined factors. Nature 475:386–389.5. Zhou Q, Melton DA (2008) Extreme makeover: Converting one cell into another. Cell
Stem Cell 3:382–388.6. Zhou Q, Brown J, Kanarek A, Rajagopal J, Melton DA (2008) In vivo reprogramming of
adult pancreatic exocrine cells to beta-cells. Nature 455:627–632.7. Heinrich C, et al. (2010) Directing astroglia from the cerebral cortex into subtype
specific functional neurons. PLoS Biol 8:e1000373.8. Ieda M, et al. (2010) Direct reprogramming of fibroblasts into functional car-
diomyocytes by defined factors. Cell 142:375–386.9. Richard JP, et al. (2011) Direct in vivo cellular reprogramming involves transition
through discrete, non-pluripotent steps. Development 138:1483–1492.10. Xie H, Ye M, Feng R, Graf T (2004) Stepwise reprogramming of B cells into macro-
phages. Cell 117:663–676.11. Bussmann LH, et al. (2009) A robust and highly efficient immune cell reprogramming
system. Cell Stem Cell 5:554–566.12. Porse BT, et al.; Pedersen TA (2001) E2F repression by C/EBPalpha is required for
adipogenesis and granulopoiesis in vivo. Cell 107:247–258.13. Pronk CJ, et al. (2007) Elucidation of the phenotypic, functional, and molecular to-
pography of a myeloerythroid progenitor cell hierarchy. Cell Stem Cell 1:428–442.14. Månsson R, et al. (2007) Molecular evidence for hierarchical transcriptional lineage
priming in fetal and adult stem cells and multipotent progenitors. Immunity 26:407–419.15. Daley JM, Thomay AA, Connolly MD, Reichner JS, Albina JE (2008) Use of Ly6G-specific
monoclonal antibody to deplete neutrophils in mice. J Leukoc Biol 83:64–70.16. Theilgaard-Mönch K, et al. (2006) Haptoglobin is synthesized during granulocyte
differentiation, stored in specific granules, and released by neutrophils in response toactivation. Blood 108:353–361.
17. Nutt SL, Heavey B, Rolink AG, Busslinger M (1999) Commitment to the B-lymphoidlineage depends on the transcription factor Pax5. Nature 401:556–562.
18. Feinberg MW, et al. (2007) The Kruppel-like factor KLF4 is a critical regulator of
monocyte differentiation. EMBO J 26:4138–4148.19. Singh AM, Dalton S (2009) The cell cycle and Myc intersect with mechanisms that
regulate pluripotency and reprogramming. Cell Stem Cell 5:141–149.20. Akashi K, Traver D, Miyamoto T, Weissman IL (2000) A clonogenic common myeloid
progenitor that gives rise to all myeloid lineages. Nature 404:193–197.21. Kiel MJ, et al. (2005) SLAM family receptors distinguish hematopoietic stem and
progenitor cells and reveal endothelial niches for stem cells. Cell 121:1109–1121.22. Kondo M, Weissman IL, Akashi K (1997) Identification of clonogenic common lym-
phoid progenitors in mouse bone marrow. Cell 91:661–672.23. Zhang CC, Lodish HF (2005) Murine hematopoietic stem cells change their surface
phenotype during ex vivo expansion. Blood 105:4314–4320.24. Suh HC, et al. (2006) C/EBPalpha determines hematopoietic cell fate in multipotential
progenitor cells by inhibiting erythroid differentiation and inducing myeloid differ-
entiation. Blood 107:4308–4316.25. Laiosa CV, Stadtfeld M, Xie H, de Andres-Aguayo L, Graf T (2006) Reprogramming of
committed T cell progenitors to macrophages and dendritic cells by C/EBP alpha and
PU.1 transcription factors. Immunity 25:731–744.26. Hanna J, et al. (2008) Direct reprogramming of terminally differentiated mature B
lymphocytes to pluripotency. Cell 133:250–264.27. Eminli S, et al. (2009) Differentiation stage determines potential of hematopoietic
cells for reprogramming into induced pluripotent stem cells. Nat Genet 41:968–976.28. Xie H, Laiosa CV, Graf T (2010) Reprogramming of committed lymphoid cells by en-
forced transcription factor expression. Methods Mol Biol 636:219–232.29. Pinto do O P, Richter K, Carlsson L, Pinto do (2002) Hematopoietic progenitor/stem
cells immortalized by Lhx2 generate functional hematopoietic cells in vivo. Blood 99:
3939–3946.30. Ye M, et al. (2003) Hematopoietic stem cells expressing the myeloid lysozyme gene
retain long-term, multilineage repopulation potential. Immunity 19:689–699.31. Pfaffl MW (2001) A new mathematical model for relative quantification in real-time
RT-PCR. Nucleic Acids Res 29:e45.32. Fortina P, Surrey S (2008) Digital mRNA profiling. Nat Biotechnol 26:293–294.
Di Tullio et al. PNAS | October 11, 2011 | vol. 108 | no. 41 | 17021
CELL
BIOLO
GY