Simulation of Prokaryotic Genetic Circuits Jonny Wells and Jimmy Bai.
1
Capacitated Cellular Manufacturing System Design: A Genetic Algorithm
Approach
Gökhan EḡilmezϾΦ
, Gürsel A. SüerΦ
and Orhan Özgünerᴪ
ΦISE Department, Ohio University
ΦAthens, OH 45701, USA
ᴪDepartment of Computer Science, Johns Hopkins University
ᴪBaltimore, MD 21218, USA
and [email protected]ᴪ
ΦPhone: (740) 593-1542 Φ
Fax: (740) 593-0778
Abstract
In this study, a genetic algorithm approach is proposed to solve the capacitated cellular manufacturing
system (CMS) design problem. The problem is observed in both machine and labor-intensive cells where
cells are utilized based on the operation times and customer demand. The objective is to design a CMS
with product families that are formed with most possible like products. Suer et al. (2010) proposed a
modified capacitated p-median mathematical model to the problem. In this study, genetic algorithm is
proposed to deal with larger problems by varying the number of cells per family restriction. Suer et al.’s
mathematical model and proposed genetic algorithm are compared. GA found optimal solution in small
problems in all replications and near-optimal solution in moderate to big sized problems with high
frequency. In terms of execution times, significant reductions are achieved with GA on moderate to big
sized problems.
2
1. Introduction
Manufacturing system design has been a challenging issue where various approaches have been
proposed in literature and implemented in manufacturing industries. Cellular manufacturing
system (CMS) design gained popularity due to the increase in product variety and fluctuation in
customer demand. Cellular manufacturing is an application of group technology to
manufacturing systems. A typical cellular manufacturing system consists of manufacturing cells
which are responsible for manufacturing of similar products with one-piece-flow principle. A
manufacturing cell is small manufacturing unit designed to have people, dissimilar equipment
and machines together to produce like products with lower lead times, work-in-process inventory
(WIP), setup times, workforce (Wemmerlov U. and Johnson D. J. 1997). Unit-peace flow
principle and manufacturing products as families in cells bring such advantages, there are few
disadvantages of using cellular manufacturing philosophy such as being less flexible to rapid
changes in job mix and demand volumes (Satoglu and Suresh 2009).
Manufacturing cells can be classified as machine-intensive cell and labor-intensive. In a
machine-intensive manufacturing cell, operator involvement for an operation is usually limited
and the machine has the major impact on the operation performance in other words processing
time, e.g. milling with CNC. The operator usually performs loading the raw material, unloading
the finished good and quality control. On the other hand, in labor-intensive manufacturing cells,
the operation is mainly carried out by the operator due to the necessity of continuous operator
involvement in operation, e.g. jewelry manufacturing.
There are several approaches proposed in literature to deal with the cell formation problem (e.g.
coding and classification systems, part-machine group analysis based clustering, similarity
coefficient-based clustering, mathematical programming and graph theoretic methods) (Singh
3
and Rajamani 1996). In solving cell formation problem with the assistance of similarity
coefficient, identification of product similarity is one of the most important steps in cellular
manufacturing system design since it has crucial impact on the overall manufacturing system
performance. Majority of works in literature evaluate product similarity based on the process
route similarity. Jaccard’s similarity coefficient is found as the most stable similarity coefficient
which performs well with the most of the cell formation problems (Y. Yin and K. Yasuda 2005).
Various cell formation approaches have been proposed in literature. Most of the studies used
mathematical optimization to find the best configuration of product families and cells. The rest
of the studies includes simulation, heuristics and metaheuristics as the cell formation approach.
In one of the earliest works, Purcheck (1974) employed linear programming. Kusiak (1987)
developed the p-median linear programming model which forms the product families and cells
simultaneously based on similarity coefficients. Akturk and Turkcan (2000) proposed an
integrated algorithm which solves the machine - cell and part-family formation problem
simultaneously along with an efficiency measure of cell formation with monetary terms.
Albadawi, Bashir and Mingyuan (2005) developed a two-phase mathematical model. Machine-
cell formation is identified via applying factor analysis and the assignment of products to the
machine cells and a case study is provided. For a comprehensive review of similarity coefficient
based methods, see Yong Yin and Kazuhiko Yasuda (2006).
In addition to mathematical optimization, metaheuristics have been proposed due to the
NP-Hard nature of cell formation problems. Such metaheuristics as Genetic Algorithms (GA),
Simulated Annealing (SA) and Tabu Search (TS) are widely applied to the cell formation
problem. Moon, Gen and Suer (1999) developed a GA based model for minimizing additional
capital investment in manufacturing cell design. Asokan, Prabhakaran and Kumar (2001)
4
proposed both GA and SA in order to minimize the total moves and cell load variation. Suer,
Pena and Vazques (2003) worked on the deterministic CMS design problem to minimize the
total machine investment cost. An evolutionary algorithm is developed and applied to three
different problems with seven different cost schemes. Cao and Chen (2004) proposed an
integrated approach for manufacturing cell formation with fixed charge cost, which includes a
mixed integer non-linear programming model and a TS algorithm for the NP-Hard problems.
Jayaswal and Adil (2004) developed a model and solution methodology comprised of simulated
annealing and local search heuristics for the problem of cell formation to minimize the sum of
costs of inter-cell moves, machine investment and machine operating costs. Solimanpur, Vrat
and Shankar (2004) applied a multi-objective integer programming model and a GA with
multiple fitness functions to the design of cellular manufacturing systems with independent cells.
Majority of the works in literature takes the cell formation problem as grouping product families
based on the operational route-based similarities. However, while product similarity is being
used as metric to form product families, demand volumes thus capacity requirements are usually
neglected. In this study, capacity utilization is considered in addition to product similarity. The
problem studied is explained in detail in the next section.
2. Problem Statement
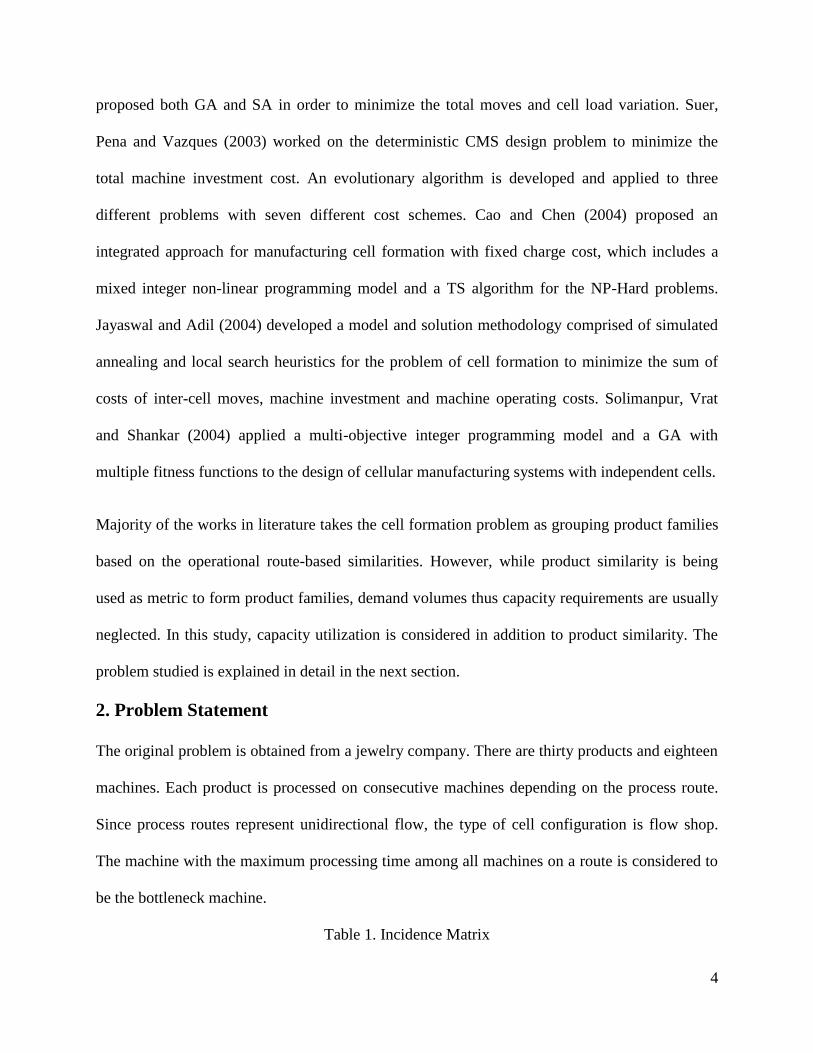
The original problem is obtained from a jewelry company. There are thirty products and eighteen
machines. Each product is processed on consecutive machines depending on the process route.
Since process routes represent unidirectional flow, the type of cell configuration is flow shop.
The machine with the maximum processing time among all machines on a route is considered to
be the bottleneck machine.
Table 1. Incidence Matrix
5
Machines
Parts 1 2 3 4 5 6 7 8 9 10 11 12 13 14 15 16 17 18 Annual Demand
1 15 19 17 16
19 1631
2 15 16 17 15 18
19
18
19 727
3 16 18 15 17
20
18 17
20 2297
4
19
18
20 20
20 1046
5 18 17 15 18
17
15
19 1181
6
16
20
19
16
16
19
20 2005
7 15 17 20
18
20
20 20 1683
8 16
17 20 16
17
20 2371
9 16 17 17
18
15
19 1398
10
15
18
17
20 1320
11 19 16 15
19
18
20 2464
12 16 18 17 19
19
20 1441
13
16 17 16
15
17 2185
14 16 19 15 18 17 16
17
15
16
19 1971
15 15 16
17
16
17 877
16
18
15
19
20 884
17 16 17 15 15
15
15 19
20 1172
18
19 19 15 17
19
20 1266
19 18 19 15 18
20
16
17
20 2324
20 18 18 17
19
19
20 523
21 19 18 17
16
18
18
20 975
22
16
16
15
17 1443
23 18 15 19 15
20 777
24 16 17 19
18 20
20 2294
25 17 18 16 19
18
19
16
20 1165
26 17 16 17 15
17 18
18 916
27 18 20 17
17
20
20 902
28
19
17
19
19 2260
29 19 16 20
19
20 724
30
16
16
17
17 1166
Cells are assumed as independent from each other (dedicated to one product family) and
inter-cell movement of products is not allowed. Such restrictions have been also observed in
manufacturing systems such as pharmaceutical, medical device and food manufacturing. In some
of these industries, independent cell configuration is a requirement since the potential product
mix-up may cause serious health and hygiene problems. Each dedicated cell is responsible for
6
the production of only one family and each product can only be assigned to one family. Machine
setup times are insignificant, they are assumed to be zero in this study. The single-piece flow is
adapted for moving products in all cells. Annual cell capacity is taken as 2000 hours (50
weeks/yr * 40 hours/week). The annual demand and processing time for each product are known
and constant. The product-machine matrix for the 30 parts is shown in Table 1. The objective is
to design a cellular manufacturing system with the minimum number of cells such that the total
similarity is maximized.
3. Methodology
In a deterministic case, annual demand, processing times and therefore capacity requirements are
known exactly. Suer et al. (2010) developed the capacitated P-Median model to address the cell
utilization and similarity trade-off for the deterministic CMS design. The hierarchical framework
used includes the identification of similarities and determination of capacity requirements and
solution with the deterministic capacitated p-median mathematical model. In this study, a
Genetic Algorithm is developed and compared with mathematical model.
3.1. Identification of Similarities and Capacity Requirements
The similarity matrix is constructed based on the similarity coefficients. The similarity
coefficient for each pair of products is calculated via the suggested equation by Suer et al. (Suer,
Huang, and Sripathi 2010) as shown in Equation 1 which is basically the ratio of the common
number of machines to the total number of machines required to produce pairs of i and j.
7
Once similarities are calculated, the capacity requirements are obtained via Equation 2,
where PTi is the processing time in minutes, ADi is annual demand in units and ACRi is the
annual capacity requirement for the product i in hours.
3.2. Deterministic Capacitated P-Median Model
The deterministic model uses two types of information, namely: capacity requirements and
machine similarity coefficients. Product families and cells are formed based on available cell
capacity and similarity of products. The indices, parameters and decision variables are listed as
follows.
Indices:
i Product index
j Product index and family/cell index
Parameters:
Sij Similarity coefficient between product i and j
CRi Percentage of capacity requirement for product i
n Number of products
TU Upper limit for cell capacity
Decision Variables:
Xij 1, if product i is assigned to family j ; 0, otherwise
8
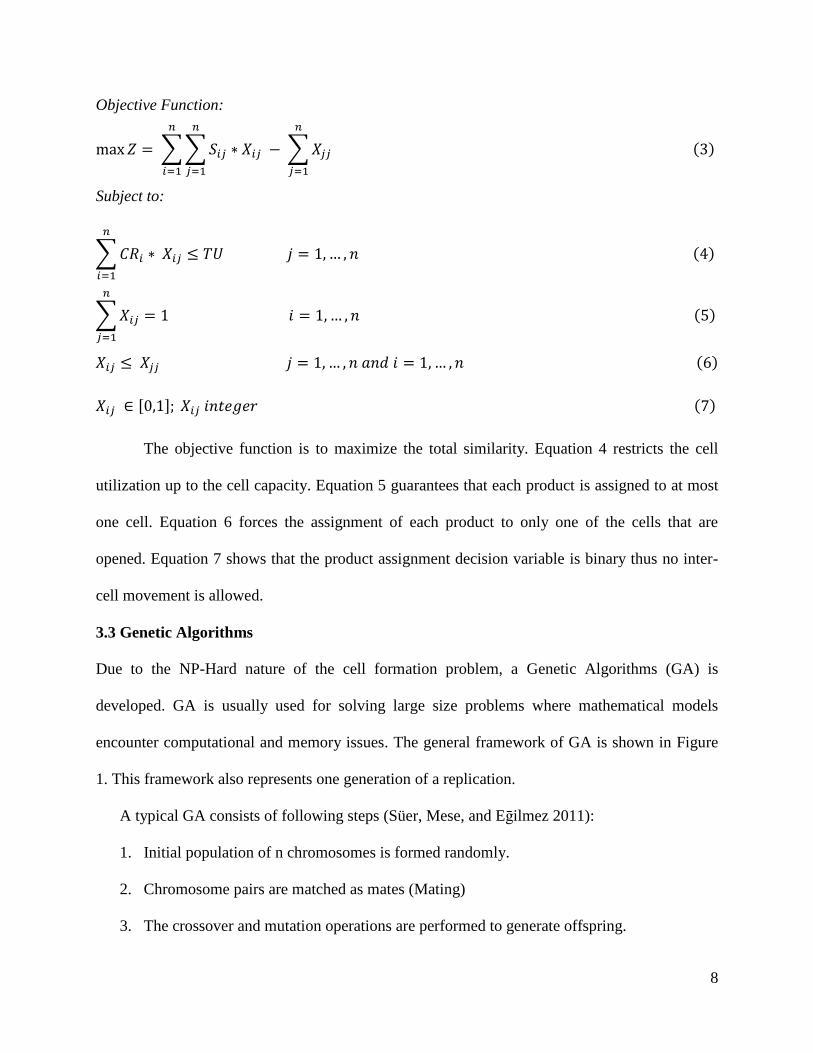
Objective Function:
Subject to:
The objective function is to maximize the total similarity. Equation 4 restricts the cell
utilization up to the cell capacity. Equation 5 guarantees that each product is assigned to at most
one cell. Equation 6 forces the assignment of each product to only one of the cells that are
opened. Equation 7 shows that the product assignment decision variable is binary thus no inter-
cell movement is allowed.
3.3 Genetic Algorithms
Due to the NP-Hard nature of the cell formation problem, a Genetic Algorithms (GA) is
developed. GA is usually used for solving large size problems where mathematical models
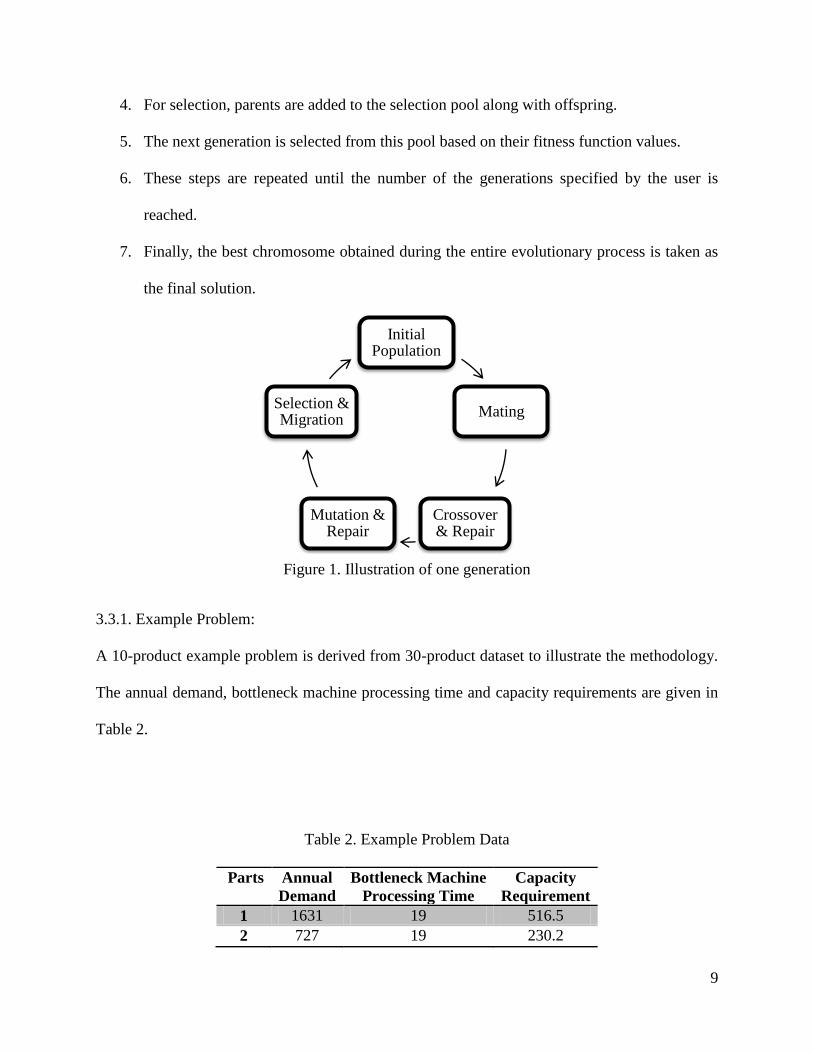
encounter computational and memory issues. The general framework of GA is shown in Figure
1. This framework also represents one generation of a replication.
A typical GA consists of following steps (Süer, Mese, and Eḡilmez 2011):
1. Initial population of n chromosomes is formed randomly.
2. Chromosome pairs are matched as mates (Mating)
3. The crossover and mutation operations are performed to generate offspring.
9
4. For selection, parents are added to the selection pool along with offspring.
5. The next generation is selected from this pool based on their fitness function values.
6. These steps are repeated until the number of the generations specified by the user is
reached.
7. Finally, the best chromosome obtained during the entire evolutionary process is taken as
the final solution.
Figure 1. Illustration of one generation
3.3.1. Example Problem:
A 10-product example problem is derived from 30-product dataset to illustrate the methodology.
The annual demand, bottleneck machine processing time and capacity requirements are given in
Table 2.
Table 2. Example Problem Data
Parts Annual
Demand
Bottleneck Machine
Processing Time
Capacity
Requirement
1 1631 19 516.5
2 727 19 230.2
Initial Population
Mating
Crossover & Repair
Mutation & Repair
Selection & Migration
10
3 2297 20 765.7
4 1046 20 348.7
5 1181 19 374.0
6 2005 20 668.3
7 1683 20 561.0
8 2371 20 790.3
9 1398 19 442.7
10 1320 20 440.0
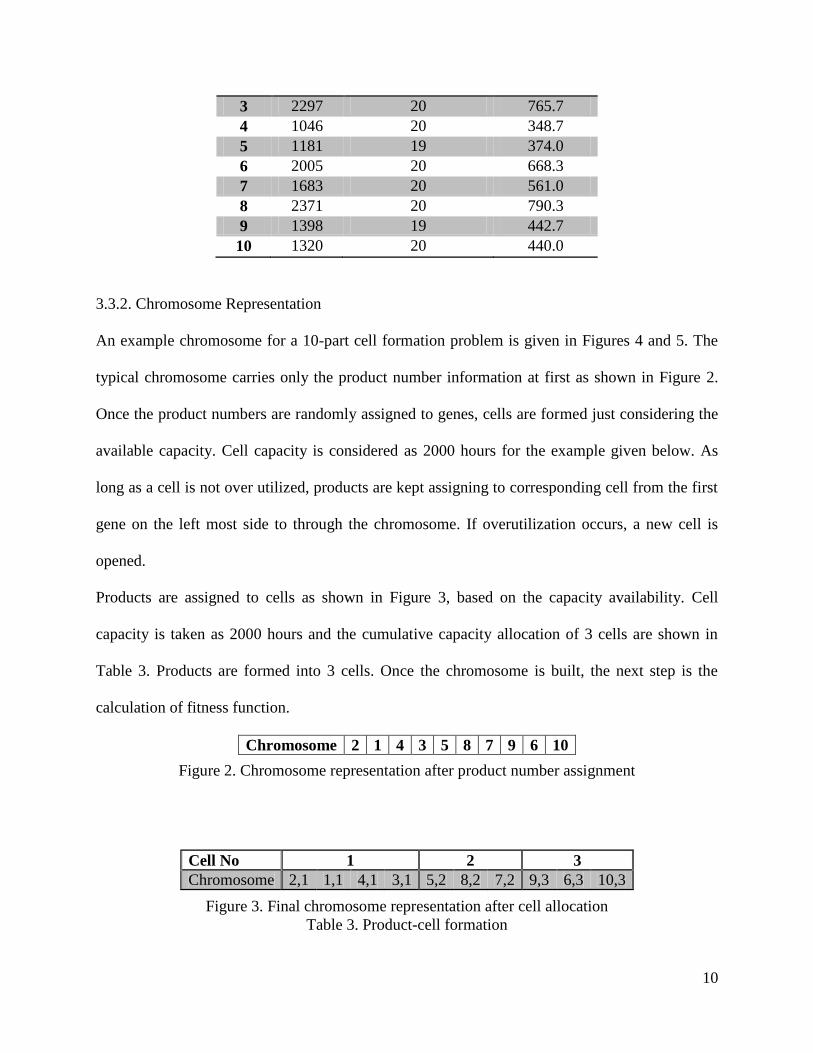
3.3.2. Chromosome Representation
An example chromosome for a 10-part cell formation problem is given in Figures 4 and 5. The
typical chromosome carries only the product number information at first as shown in Figure 2.
Once the product numbers are randomly assigned to genes, cells are formed just considering the
available capacity. Cell capacity is considered as 2000 hours for the example given below. As
long as a cell is not over utilized, products are kept assigning to corresponding cell from the first
gene on the left most side to through the chromosome. If overutilization occurs, a new cell is
opened.
Products are assigned to cells as shown in Figure 3, based on the capacity availability. Cell
capacity is taken as 2000 hours and the cumulative capacity allocation of 3 cells are shown in
Table 3. Products are formed into 3 cells. Once the chromosome is built, the next step is the
calculation of fitness function.
Chromosome 2 1 4 3 5 8 7 9 6 10
Figure 2. Chromosome representation after product number assignment
Cell No 1 2 3
Chromosome 2,1 1,1 4,1 3,1 5,2 8,2 7,2 9,3 6,3 10,3
Figure 3. Final chromosome representation after cell allocation
Table 3. Product-cell formation
11
Product Capacity Requirement Cumulative Capacity Requirement Cell Number
2 230.2 230.2 Family 1
Assigned to
Cell 1
1 516.5 746.7
4 348.7 1095.4
3 765.7 1861.0
5 374.0 374.0 Family 2
Assigned to
Cell 2
8 790.3 1164.3
7 561.0 1725.3
9 442.7 442.7 Family 3
Assigned to
Cell 3
6 668.3 1111.0
10 440.0 1551.0
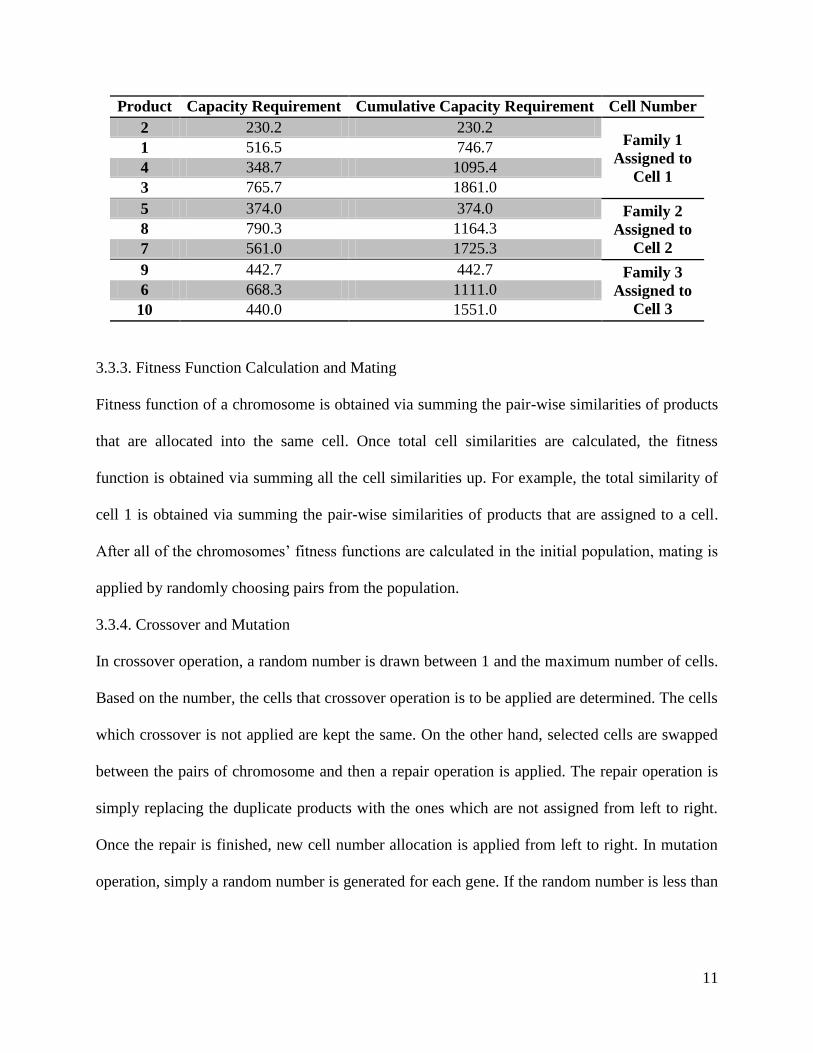
3.3.3. Fitness Function Calculation and Mating
Fitness function of a chromosome is obtained via summing the pair-wise similarities of products
that are allocated into the same cell. Once total cell similarities are calculated, the fitness
function is obtained via summing all the cell similarities up. For example, the total similarity of
cell 1 is obtained via summing the pair-wise similarities of products that are assigned to a cell.
After all of the chromosomes’ fitness functions are calculated in the initial population, mating is
applied by randomly choosing pairs from the population.
3.3.4. Crossover and Mutation
In crossover operation, a random number is drawn between 1 and the maximum number of cells.
Based on the number, the cells that crossover operation is to be applied are determined. The cells
which crossover is not applied are kept the same. On the other hand, selected cells are swapped
between the pairs of chromosome and then a repair operation is applied. The repair operation is
simply replacing the duplicate products with the ones which are not assigned from left to right.
Once the repair is finished, new cell number allocation is applied from left to right. In mutation
operation, simply a random number is generated for each gene. If the random number is less than
12
the mutation probability, then the corresponding gene (product number) is replaced with another
randomly picked product.
3.3.5. Selection
After a generation (one cycle of GA) is finished, a selection pool is obtained which consists all of
the off-spring and parents. The best chromosome is selected as best-so-far solution and kept. On
the other hand, a predetermined portion of existing generation is selected from the selection pool
for the next generation and remaining portion is randomly generated. For example, assume that p
is the desired percentage of migration; best p % of pool is going to be kept for the further
generations. P is basically an experimentation parameter.
4. Experimentation and Results
In the experimentation, three datasets are used, namely: cell formation with 10, 20 and 30
products. The 10 and 20-product datasets are built by taking first 10 and 20 products from the
30-product dataset. All datasets are solved with both Suer et al.’s (2010) mathematical model and
the proposed GA.
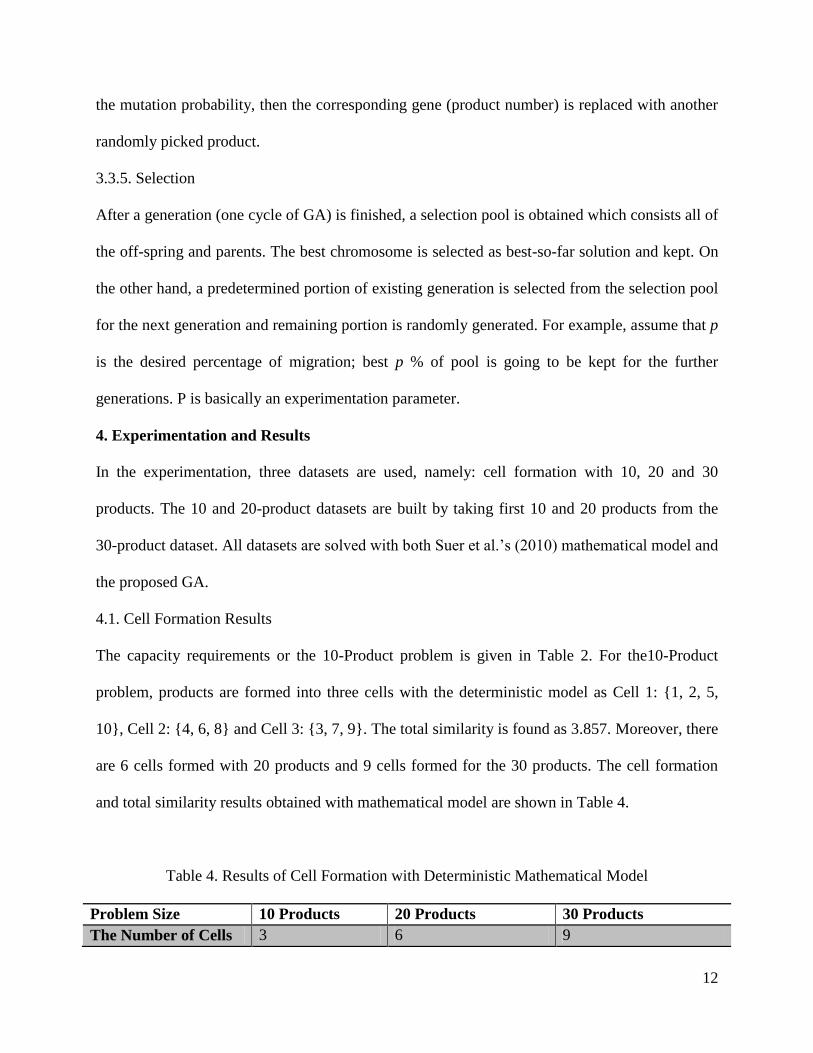
4.1. Cell Formation Results
The capacity requirements or the 10-Product problem is given in Table 2. For the10-Product
problem, products are formed into three cells with the deterministic model as Cell 1: {1, 2, 5,
10}, Cell 2: {4, 6, 8} and Cell 3: {3, 7, 9}. The total similarity is found as 3.857. Moreover, there
are 6 cells formed with 20 products and 9 cells formed for the 30 products. The cell formation
and total similarity results obtained with mathematical model are shown in Table 4.
Table 4. Results of Cell Formation with Deterministic Mathematical Model
Problem Size 10 Products 20 Products 30 Products
The Number of Cells 3 6 9
13
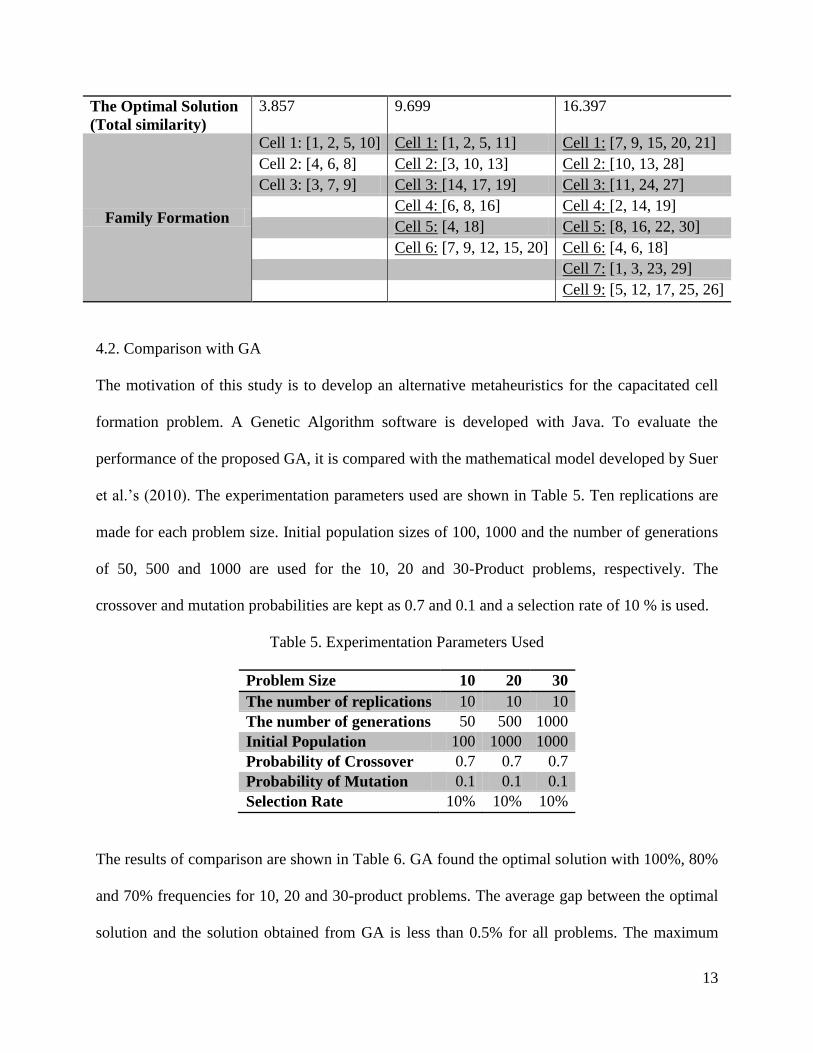
The Optimal Solution
(Total similarity)
3.857 9.699 16.397
Family Formation
Cell 1: [1, 2, 5, 10] Cell 1: [1, 2, 5, 11] Cell 1: [7, 9, 15, 20, 21]
Cell 2: [4, 6, 8] Cell 2: [3, 10, 13] Cell 2: [10, 13, 28]
Cell 3: [3, 7, 9] Cell 3: [14, 17, 19] Cell 3: [11, 24, 27]
Cell 4: [6, 8, 16] Cell 4: [2, 14, 19]
Cell 5: [4, 18] Cell 5: [8, 16, 22, 30]
Cell 6: [7, 9, 12, 15, 20] Cell 6: [4, 6, 18]
Cell 7: [1, 3, 23, 29]
Cell 9: [5, 12, 17, 25, 26]
4.2. Comparison with GA
The motivation of this study is to develop an alternative metaheuristics for the capacitated cell
formation problem. A Genetic Algorithm software is developed with Java. To evaluate the
performance of the proposed GA, it is compared with the mathematical model developed by Suer
et al.’s (2010). The experimentation parameters used are shown in Table 5. Ten replications are
made for each problem size. Initial population sizes of 100, 1000 and the number of generations
of 50, 500 and 1000 are used for the 10, 20 and 30-Product problems, respectively. The
crossover and mutation probabilities are kept as 0.7 and 0.1 and a selection rate of 10 % is used.
Table 5. Experimentation Parameters Used
Problem Size 10 20 30
The number of replications 10 10 10
The number of generations 50 500 1000
Initial Population 100 1000 1000
Probability of Crossover 0.7 0.7 0.7
Probability of Mutation 0.1 0.1 0.1
Selection Rate 10% 10% 10%
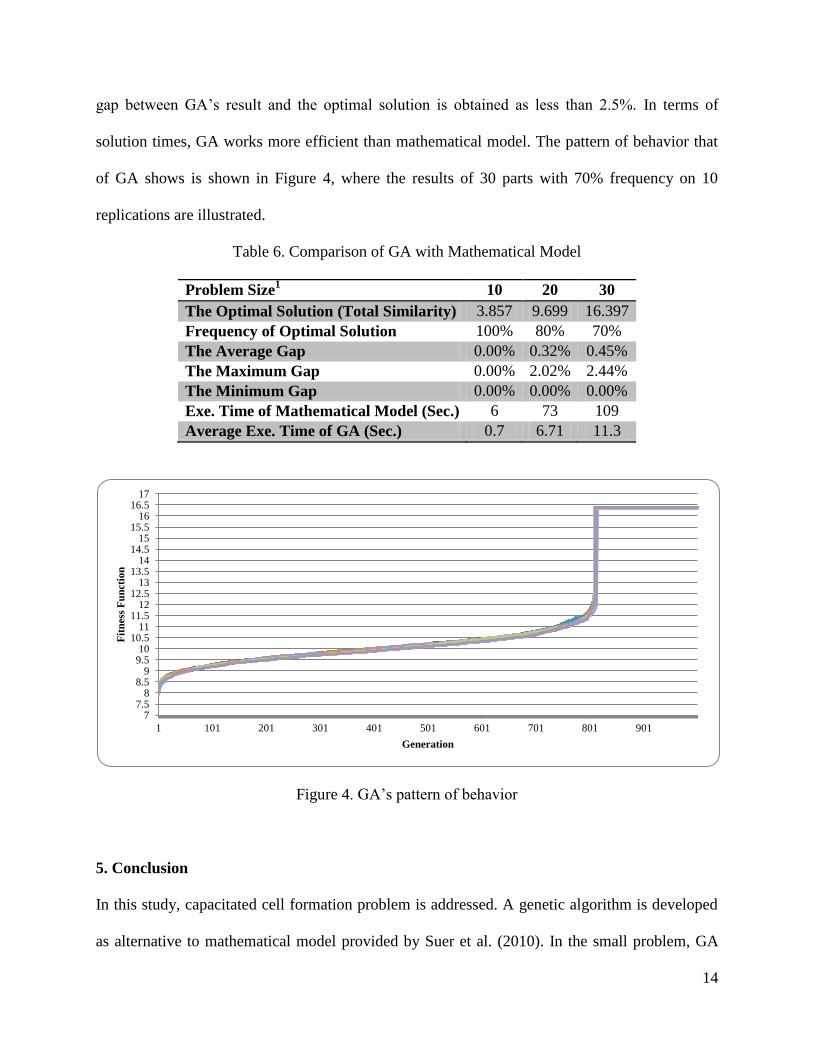
The results of comparison are shown in Table 6. GA found the optimal solution with 100%, 80%
and 70% frequencies for 10, 20 and 30-product problems. The average gap between the optimal
solution and the solution obtained from GA is less than 0.5% for all problems. The maximum
14
gap between GA’s result and the optimal solution is obtained as less than 2.5%. In terms of
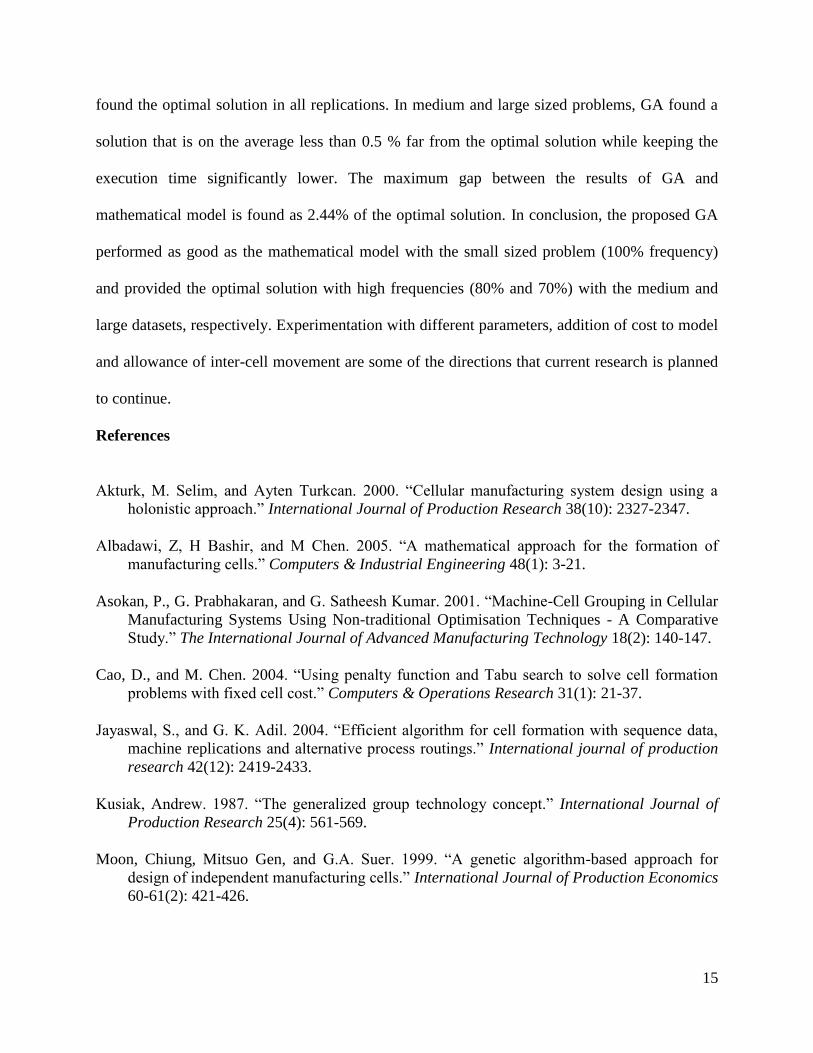
solution times, GA works more efficient than mathematical model. The pattern of behavior that
of GA shows is shown in Figure 4, where the results of 30 parts with 70% frequency on 10
replications are illustrated.
Table 6. Comparison of GA with Mathematical Model
Problem Size1
10 20 30
The Optimal Solution (Total Similarity) 3.857 9.699 16.397
Frequency of Optimal Solution 100% 80% 70%
The Average Gap 0.00% 0.32% 0.45%
The Maximum Gap 0.00% 2.02% 2.44%
The Minimum Gap 0.00% 0.00% 0.00%
Exe. Time of Mathematical Model (Sec.) 6 73 109
Average Exe. Time of GA (Sec.) 0.7 6.71 11.3
Figure 4. GA’s pattern of behavior
5. Conclusion
In this study, capacitated cell formation problem is addressed. A genetic algorithm is developed
as alternative to mathematical model provided by Suer et al. (2010). In the small problem, GA
7 7.5
8 8.5
9 9.5 10
10.5 11
11.5 12
12.5 13
13.5 14
14.5 15
15.5 16
16.5 17
1 101 201 301 401 501 601 701 801 901
Fit
ness
Fu
ncti
on
Generation
15
found the optimal solution in all replications. In medium and large sized problems, GA found a
solution that is on the average less than 0.5 % far from the optimal solution while keeping the
execution time significantly lower. The maximum gap between the results of GA and
mathematical model is found as 2.44% of the optimal solution. In conclusion, the proposed GA
performed as good as the mathematical model with the small sized problem (100% frequency)
and provided the optimal solution with high frequencies (80% and 70%) with the medium and
large datasets, respectively. Experimentation with different parameters, addition of cost to model
and allowance of inter-cell movement are some of the directions that current research is planned
to continue.
References
Akturk, M. Selim, and Ayten Turkcan. 2000. “Cellular manufacturing system design using a
holonistic approach.” International Journal of Production Research 38(10): 2327-2347.
Albadawi, Z, H Bashir, and M Chen. 2005. “A mathematical approach for the formation of
manufacturing cells.” Computers & Industrial Engineering 48(1): 3-21.
Asokan, P., G. Prabhakaran, and G. Satheesh Kumar. 2001. “Machine-Cell Grouping in Cellular
Manufacturing Systems Using Non-traditional Optimisation Techniques - A Comparative
Study.” The International Journal of Advanced Manufacturing Technology 18(2): 140-147.
Cao, D., and M. Chen. 2004. “Using penalty function and Tabu search to solve cell formation
problems with fixed cell cost.” Computers & Operations Research 31(1): 21-37.
Jayaswal, S., and G. K. Adil. 2004. “Efficient algorithm for cell formation with sequence data,
machine replications and alternative process routings.” International journal of production
research 42(12): 2419-2433.
Kusiak, Andrew. 1987. “The generalized group technology concept.” International Journal of
Production Research 25(4): 561-569.
Moon, Chiung, Mitsuo Gen, and G.A. Suer. 1999. “A genetic algorithm-based approach for
design of independent manufacturing cells.” International Journal of Production Economics
60-61(2): 421-426.
16
Purcheck, Gunter F.K. 1974. “A mathematical classification as a basis for the design of group-
technology production cells.” Production Engineer 54(1): 35-48.
Satoglu, Sule Itir, and Nallan C. Suresh. 2009. “A goal-programming approach for design of
hybrid cellular manufacturing systems in dual resource constrained environments.”
Computers & Industrial Engineering 56(2): 560-575.
Singh, N., and D. Rajamani. 1996. 277 Cellular Manufacturing Systems: Design, planning and
control. Springer.
Solimanpur, M., P. Vrat, and R. Shankar. 2004. “A multi-objective genetic algorithm approach
to the design of cellular manufacturing systems.” International Journal of Production
Research 42: 1419-1441.
Suer, G.A., J. Huang, and M. Sripathi. 2010. “Design of dedicated, shared and remainder cells in
a probabilistic demand environment.” International journal of production research 48(19-
20): 5613-5646.
Suer, G.A., Y. Pena, and R. Vazques. 2003. “Cellular design to minimise investment costs by
using evolutionary programming.” International Journal of Manufacturing Technology and
Management 5(1): 118-132.
Süer, G. A., E. M. Mese, and G. Eḡilmez. 2011. “Cell Loading , Family and Job Scheduling to
minimize TT.” In International Conference on IML,.
Wemmerlov U. and Johnson D. J. 1997. “Cellular manufacturing at 46 user plants:
implementation experiences and performance improvements.” International Journal of
Production Research 35(1): 29-49.
Yin, Y., and K. Yasuda. 2005. “Similarity coefficient methods applied to the cell formation
problem: a comparative investigation.” Computers & Industrial Engineering 48(3): 471-
489.
Yin, Yong, and Kazuhiko Yasuda. 2006. “Similarity coefficient methods applied to the cell
formation problem: A taxonomy and review.” International Journal of Production
Economics 101(2): 329-352.


![Prenatal Screening for Co-Inheritance of Sickle Cell ... · Sickle cell anemia and β-thalassemia are genetic disorders caused by different genetic mutations [11]. Therefore, patients](https://static.fdocument.org/doc/165x107/5f5a186f300c56026200ab34/prenatal-screening-for-co-inheritance-of-sickle-cell-sickle-cell-anemia-and.jpg)