Calcium Stimulates Self-Assembly of Protein Kinase...
21
RESEARCH ARTICLE Calcium Stimulates Self-Assembly of Protein Kinase C α In Vitro Carter J. Swanson 1 , Ruth F. Sommese 2 , Karl J. Petersen 3 , Michael Ritt 2 , Joshua Karslake 1 , David D. Thomas 3 , Sivaraj Sivaramakrishnan 2 * 1 Biophysics Program, University of Michigan, Ann Arbor, 48109, United States of America, 2 Dept. of Genetics, Cell Biology and Development, University of Minnesota, Twin Cities, 55455, United States of America, 3 Dept. of Biochemistry, Molecular Biology, and Biophysics, University of Minnesota, Twin Cities, 55455, United States of America * [email protected] Abstract Protein kinase C α (PKCα) is a nodal regulator in several intracellular signaling networks. PKCα is composed of modular domains that interact with each other to dynamically regu- late spatial-temporal function. We find that PKCα specifically, rapidly and reversibly self- assembles in the presence of calcium in vitro. This phenomenon is dependent on, and can be modulated by an intramolecular interaction between the C1a and C2 protein domains of PKCα. Next, we monitor self-assembly of PKC—mCitrine fusion proteins using time- resolved and steady-state homoFRET. HomoFRET between full-length PKCα molecules is observed when in solution with both calcium and liposomes containing either diacylglycerol (DAG) or phosphatidylinositol 4,5-bisphosphate (PI(4,5)P 2 ). Surprisingly, the C2 domain is sufficient to cluster on liposomes containing PI(4,5)P 2 , indicating the C1a domain is not required for self-assembly in this context. We conclude that three distinct clustered states of PKCα can be formed depending on what combination of cofactors are bound, but Ca 2+ is minimally required and sufficient for clustering. Introduction Signaltransductionincellsemergesfromtransientproteininteractionsthatoccurinhighly crowdedcytoplasmicandplasmamembraneenvironments[1, 2].Pairingofsignalinginput andoutputisoftenachievedbycompartmentalizationofmoleculesonamembraneorprotein scaffold[3].Anorthogonalmechanismforsegregatingmolecularcomponentsinvolvesthe self-assemblyofmacro-scalecomplexesnucleatedbyoneormoreproteins[4].Whilesuch self-assembledmacro-molecularcomplexesarefairlycommonincellularprocessessuchas vesicletrafficking[5],cytoskeletalorganization[6],andcelldivision[7]theyaremuchless appreciatedinthecontextofcellsignalingandformthefocusofthisstudy. ThePKCfamilyofproteinkinasesfunctionsasanodalregulatorinsignalingnetworks[8]. PKCsfunctionatmultiplelocationswithinthecellandtunetheirfunctiontocouplediverse stimulitodistinctoutputs[9].ThediversityofPKCfunctionisachieved,inpart,byaseriesof modulardomainslinkedtothecatalyticdomain.ThesemodulardomainsrenderPKCsensitive PLOS ONE | DOI:10.1371/journal.pone.0162331 October 5, 2016 1 / 21 a11111 OPEN ACCESS Citation: Swanson CJ, Sommese RF, Petersen KJ, Ritt M, Karslake J, Thomas DD, et al. (2016) Calcium Stimulates Self-Assembly of Protein Kinase C α In Vitro. PLoS ONE 11(10): e0162331. doi:10.1371/journal.pone.0162331 Editor: Arun Rishi, Wayne State University, UNITED STATES Received: April 21, 2016 Accepted: August 22, 2016 Published: October 5, 2016 Copyright: © 2016 Swanson et al. This is an open access article distributed under the terms of the Creative Commons Attribution License, which permits unrestricted use, distribution, and reproduction in any medium, provided the original author and source are credited. Data Availability Statement: All relevant data are within the paper and its Supporting Information files. Funding: The reported time-resolved fluorescence measurements were performed in the Biophysical Technology Center, University of Minnesota, with support from an NIH Small Business Technology Transfer grant (R42 DA037622). This study was supported by the American Heart Association Scientist Development Grant (13SDG14270009) & the NIH (1DP2 CA186752-01 & 1-R01-GM- 105646-01-A1) to S.S. K.J.P. was supported by an
Transcript of Calcium Stimulates Self-Assembly of Protein Kinase...
RESEARCH ARTICLE
Calcium Stimulates Self-Assembly of ProteinKinase C α In VitroCarter J. Swanson1, Ruth F. Sommese2, Karl J. Petersen3, Michael Ritt2,
Joshua Karslake1, David D. Thomas3, Sivaraj Sivaramakrishnan2*
1 Biophysics Program, University of Michigan, Ann Arbor, 48109, United States of America, 2 Dept. of
Genetics, Cell Biology and Development, University of Minnesota, Twin Cities, 55455, United States of
America, 3 Dept. of Biochemistry, Molecular Biology, and Biophysics, University of Minnesota, Twin Cities,
55455, United States of America
AbstractProtein kinase C α (PKCα) is a nodal regulator in several intracellular signaling networks.
PKCα is composed of modular domains that interact with each other to dynamically regu-
late spatial-temporal function. We find that PKCα specifically, rapidly and reversibly self-
assembles in the presence of calcium in vitro. This phenomenon is dependent on, and can
be modulated by an intramolecular interaction between the C1a and C2 protein domains of
PKCα. Next, we monitor self-assembly of PKC—mCitrine fusion proteins using time-
resolved and steady-state homoFRET. HomoFRET between full-length PKCα molecules is
observed when in solution with both calcium and liposomes containing either diacylglycerol
(DAG) or phosphatidylinositol 4,5-bisphosphate (PI(4,5)P2). Surprisingly, the C2 domain is
sufficient to cluster on liposomes containing PI(4,5)P2, indicating the C1a domain is not
required for self-assembly in this context. We conclude that three distinct clustered states
of PKCα can be formed depending on what combination of cofactors are bound, but Ca2+ is
minimally required and sufficient for clustering.
Introduction
Signal transduction in cells emerges from transient protein interactions that occur in highlycrowded cytoplasmic and plasma membrane environments [1, 2]. Pairing of signaling inputand output is often achieved by compartmentalization of molecules on a membrane or proteinscaffold [3]. An orthogonal mechanism for segregatingmolecular components involves theself-assembly of macro-scale complexes nucleated by one or more proteins [4]. While suchself-assembledmacro-molecular complexes are fairly common in cellular processes such asvesicle trafficking [5], cytoskeletal organization [6], and cell division [7] they are much lessappreciated in the context of cell signaling and form the focus of this study.The PKC family of protein kinases functions as a nodal regulator in signaling networks [8].
PKCs function at multiple locations within the cell and tune their function to couple diversestimuli to distinct outputs [9]. The diversity of PKC function is achieved, in part, by a series ofmodular domains linked to the catalytic domain. These modular domains render PKC sensitive
PLOS ONE | DOI:10.1371/journal.pone.0162331 October 5, 2016 1 / 21
a11111
OPENACCESS
Citation: Swanson CJ, Sommese RF, Petersen KJ,
Ritt M, Karslake J, Thomas DD, et al. (2016)
Calcium Stimulates Self-Assembly of Protein
Kinase C α In Vitro. PLoS ONE 11(10): e0162331.
doi:10.1371/journal.pone.0162331
Editor: Arun Rishi, Wayne State University,
UNITED STATES
Received: April 21, 2016
Accepted: August 22, 2016
Published: October 5, 2016
Copyright: © 2016 Swanson et al. This is an open
access article distributed under the terms of the
Creative Commons Attribution License, which
permits unrestricted use, distribution, and
reproduction in any medium, provided the original
author and source are credited.
Data Availability Statement: All relevant data are
within the paper and its Supporting Information
files.
Funding: The reported time-resolved fluorescence
measurements were performed in the Biophysical
Technology Center, University of Minnesota, with
support from an NIH Small Business Technology
Transfer grant (R42 DA037622). This study was
supported by the American Heart Association
Scientist Development Grant (13SDG14270009) &
the NIH (1DP2 CA186752-01 & 1-R01-GM-
105646-01-A1) to S.S. K.J.P. was supported by an
to different factors. For instance the C2 domain in PKC binds Ca2+ ions, phosphatidylserine(PS) and PI(4,5)P2, whereas the C1 domains bind diacylglycerol (DAG), and the catalyticdomain binds nucleotides and phosphosubstrates [8].Several researchers have documented the sub-cellular focal accumulation of fluorescently
labeled PKCs in response to distinct stimuli and have suggested this as a mechanism to localizeand multiplex PKC function in response to different inputs [10–13]. The molecularmecha-nisms driving these events and the underlying biomolecules that lead to PKC ‘clustering’remain unknown.Here, we test the hypothesis that interactions between the modular domainsof PKC are necessary and sufficient to drive self-assembly of PKC into clusters without theneed for membrane scaffolds or other regulatory co-factors.In this study, we report that PKCα self-assembles into large clusters in vitro in the presence
of calcium. Self-assembly of PKCα is reversible, it occurs at calcium concentrations consistentwith reported Ca2+- C2 domain binding, and is largely abolished by a single point-mutation inthe C2 domain. Endogenous PKCα in clarifiedHEK lysates differentially fractionates in thepresence of calcium, consistent with self-assembly. We find that PKCα clustering requires atleast the C1a and C2 domains. The number of clusters can bemodulated by the strength of theC1a-C2 intramolecular interaction, suggesting a mechanism to regulate this phenomenon.Self-assembly of C1a-C2 occurs on times scales< 1 s both in vitro and in cells. Finally, wemonitor clustering of PKC on liposomes by measuring homoFRET. In the presence of calciumand liposomes containing either DAG or PI(4,5)P2 homoFRET is observedbetween PKCαfusion proteins. Interestingly, only the C2 domain is required to cluster on liposomes contain-ing PI(4,5)P2 indicating that, in this context, the C1a domain is not necessary for self-assembly.We conclude that three distinct clustered states of PKCα can be formed depending on whatcombination of cofactors are bound, but that Ca2+ is minimally required.
Materials and Methods
DNA constructs
All full-length constructs used in this study with human PKCα were previously reported andshown to be functional and to be appropriately phosphorylated [14]. The pBiex1 (Novagen)plasmid vector was used for Sf9 expression and pcDNA/FRT (Invitrogen) was used for CHOexpression. All constructs contained a C-terminal FLAG tag for purification. (Gly-Ser-Gly)2linkers were inserted between each fusion element for rotational freedom. The C1a-C2 biosen-sors (with three different lengths of SPASM linkers) were sub-cloned with restriction enzymesinto the SPASM backbone as previously described [15]. The C1a domain is defined as aa 32–100, C1b as aa 101–151, and C2 as aa 158–292. Site-directedmutagenesis was performedwithPfu-turbo (Agilent).
Cell lines
Sf9, CHO Flp-In and HEK293T Flp-In are all from ThermoFisher Scientific.
Sf9 protein expression and purification
Sf9 protein expression and purificationwas performed as previously described [14]. Briefly, Sf9cells in suspension were transiently transfected with desired DNA constructs using Escort IVtransfection reagent (Sigma-Aldrich) and harvested 60–72 h later. Protein was batch purifiedwith anti-FLAGM2 Affinity gel (Sigma-Aldrich), eluted with FLAG peptide, and buffer-exchanged using Zeba Spin Desalting columns (Pierce) into the working buffer (20 mMHEPES, 0.5 mM EGTA, 5 mMMgCl2, 2 mM dithiothreitol (DTT), pH 7.5). Protein was further
PKC Self-Assembly
PLOS ONE | DOI:10.1371/journal.pone.0162331 October 5, 2016 2 / 21
NIH training grant (T32 AR007612). R.F.S. is a Life
Sciences Research Foundation postdoctoral fellow.
Competing Interests: The authors have declared
that no competing interests exist.
diluted into this working buffer plus 0.1 mg/ml BSA for all experiments unless otherwisedescribed. Prior to each experiment, de-salted protein was centrifuged (2.8 x 10⁵ rcf, 10 min,4°C) and the concentration was quantified using either an absorbance at 280 nm and a extinc-tion coefficient calculated using ProtParam (http://web.expasy.org/ProtParam) or using mCi-trine (mCit) fluorescence fit to a standard curve (FluoroMax-4, Horiba Scientific). Proteinbatches were made fresh and experiments performedwithin 72 hours of Sf9 cell harvesting.
Fluorescence coverslip assay
Data acquisition. All experiments contained 200 nM of PKCα-mCit incubated at 25°Cunless otherwise stated. For calcium cycling experiments, an aliquot of stock sample was incu-bated at a final free calcium concentration of 300 μM for 10 min. A small amount was removedfor imaging, and the rest was incubated with saturating EGTA (final 1 mM) for 10 min. Againa small amount was removed for imaging. For imaging, each sample was gently sandwichedbetween an ethanol cleaned slide and coverslip and sealed by valap (vasoline/lanolin/paraffin).Slides were imaged on a Nikon TiE equipped with a mercury arc lamp, a yellow GFP filter cube(Nikon; 500/20 nm excitation, 515 nm LP, 535/30 nm emission), perfect focus system (Nikon),a 100X 1.4 NA Plan-Apo oil-immersion objective (Nikon), Evolve EMCCD camera (Photo-metrics), and the Nikon NIS-elements software. Image planes were focused on the coverslipsurface and ND filters and exposure time were adjusted to avoid saturation before being heldconstant for all slides in the matched experiment. Stage translation was performedwith theshutter closed to avoid field of view bias and images were taken at 5–15 locations per slide. Thefree calcium concentration was assessed using MAXCHELATOR (http://maxchelator.stanford.edu/CaEGTA-TS.html). For experiments where mCerulean (mCer) and mCit were monitored,a dual viewmodule (Photometrics; 505 nm beam splitter, D480/30 nm and 535/40nm)designed to monitor mCer and mCit emission was used, and two images were sequentiallytaken with mCer excitation (custom filter cube 436/20 nm excitation, 455 nm LP) followed bymCit excitation (see above). Only the mCer excitation/–mCer emission and mCit excitation–mCit emission channels were analyzed. Visual inspection of mCer-mCit and mCit-mCer chan-nels showed negligible bleed-through and cross-excitation.Spot identifier. Coverslip assays were quantified with customMatlab code. Briefly, a back-
ground slide was subtracted and the image was median filtered. Spots were identified based onlocal intensity ratios (center pixel intensity Icenter > 1.12 hIilocal where hIilocal is the mean inten-sity of surrounding 21 x 21 pixels; only one pixel / neighborhood). Spot intensities were quanti-fied as the sum of pixels with greater than half maximum difference in intensity:
Ispot ¼X10
x¼� 10
X10
y¼� 10I 0xy
I 0xy ¼
(
Ixy : Ixy >Icenter þ hIilocal
2
0 : Otherwise
Differential fractionation: The indicated protein (300 nM) was fractionated with a 30 minspin at 2.8 x 10⁵ rcf at 22°C. The supernatant was separated, and the ‘pellet’ fractionwas resus-pended by pipetting in an equal volume of matched buffer. An equal volume aliquot wasretained from each fraction for subsequent analysis, and the supernatant fractionwas broughtto a free calcium concentration of 300 μM and incubated at 22°C for 10 min before a secondfractionation (30 min, 2.8 x 10⁵ rcf at 22°C). Following fractionation, the supernatant was sepa-rated, and the pellet fractionwas resuspended in an equal volume of matched buffer without
PKC Self-Assembly
PLOS ONE | DOI:10.1371/journal.pone.0162331 October 5, 2016 3 / 21
free calcium. Aliquots were retained, and the pellet fraction volume was adjusted for a finalEGTA concentration of 700 μM and incubated for 10 min at 22°C. A third fractionation wasperformedwith matched conditions (30 min, 2.8 x 10⁵ rcf at 22°C). All aliquots were separatedby SDS-PAGE, and, for the PKCα-mCit-FLAG experiment, visualized by mCit fluorescence(Typhoon imager, GE Life Sciences), and the PKCα-FLAG transferred and probed with aPKCα specific antibody (see next section for Western analysis). Fractionation was quantifiedin ImageJ by manually selecting regions, subtracting backgrounds, and comparing the bandintensities in the pellet and supernatant fractions.HEK lysate experiment. HEK cells were trypsinizedand resuspended in DMEM contain-
ing 10% FBS (ThermoFisher Scientific) and Glutamax (ThermoFisher Scientific) and pelletedby low speed centrifugation (250 rcf) at 22°C. The cells were resuspended (~ 5 fold dilution) inworking buffer containing 5 μg/ml Aprotinin, 5 μg/ml Leupeptin, 50 μg/ml phenylmethylsulfo-nyl fluoride, 2 mMDTT, pH 7.5, and incubated with rotation at 4°C for 20 min before mechan-ical lysis with a 26 gauge 1 mL syringe. All subsequent steps were carried out at 4°C. The lysatewas spun at 2.8 x 10⁵ rcf for 30 min and the soluble fraction (clarified lysate) was immediatelyseparated from the pellet fraction. The clarified lysate was treated with 800 μM of EGTA orCaCl2 incubated for 3 min and fractionated (2.8 x 10⁵ rcf for 30 min). The supernatant wasremoved and the pelleted fractionwas resuspended in a volume of matching buffer equal to thesupernatant. Samples were separated by 10% SDS-PAGE before being transferred to PVDFmembrane for 3 h at 300 mA. Orthogonally, a standard curvewas made to quantify lipid con-centration in the supernatant before and after the clarification spin. The standard relied on theincreased fluorescence of DiI (ThermoFisher Scientific) in hydrophobic environments. Blotswere blocked with 2% BSA/TBS + 0.1% Tween (TBST) for 1 h at room temperature. PrimaryPKCα antibody (sc-8393, Santa Cruz Biotechnology, 1:10,000) was added and incubated over-night at 4°C. Blots were washed with TBST and incubated for 1 h with secondary (goat anti-Rabbit—Jackson ImmunoResearch Laboratories, Inc., 1:10,000 in 2% BSA/TBST). Blots werewashed with TBST, developedwith ImmobilinWestern chemiluminescent HRP substrate(Millipore), and imaged with ChemiDoc-it imaging system (UVP). Silver-stain analysis per-formed according to manufacturer’s protocol (Pierce).
Dynamic light scattering
DLS data was collected on a DynaPro NanoStar (Wyatt Technology) at 25°C. Protein (1 μM)was in the working buffer with no BSA added. Sequentially, the buffer was brought to a finalconcentration of 800 μM CaCl2 and 1 mM EGTA using concentrated stocks at (less than 2.5%of the final volume of buffer was added). Each autocorrelation is the mean of 10 repetitive read-ings of 10s each, and error bars represent the mean and standard deviation of 3 independentreadings. Autocorrelation data were least squares fit to a single exponential decay function(GraphPad) to obtain τ values. Additionally, the regularization and cumulant fits were per-formed using theWyatt Technology software platform (Dynamics V7.1.7) utilizing the isotro-pic spheres model. The mean of the monomer peak was obtained by averaging the MW fromeach acquisition from 3 batches of protein. The particlemass was determined by a single cumu-lant fit, and each reading was normalized by the mean of the initial EGTA buffered condition.
Size-exclusion chromatography
A Superdex 200 10/300 GL Size-exclusion column (GE) on an FPLC (BioRad) was pre-equili-brated with 3 column volumes of HEPES buffer, 100 mMNaCl2, 500 μM EGTA (EGTA) or+ 800 μM CaCl2 (calcium condition). PKCα-mCit or PKCα(D246N)-mCit (9.5 μM) was incu-bated with matched buffer condition for indicated time and 100 μL was injected and flowed
PKC Self-Assembly
PLOS ONE | DOI:10.1371/journal.pone.0162331 October 5, 2016 4 / 21
through the column. Fractions were collected (200 μL) in a black clear bottom 96 well plate(Grenier) and scanned for mCit or mCer fluorescence (SpectraMaxM5e). Chromatographyand pre-incubation of protein were all performed at 4°C. The column was pre-calibrated usingknown protein standards (Bio-Rad) to analytically determine protein size. Select fractions wererun on SDS-PAGE gel and scanned for mCit fluorescence (Typhoon imager), and eitherprobed with PKCα antibody or stained with Coomassie brilliant blue to verify that fractionscorrespondedwith anticipated molecular weights.
Time-resolved fluorescence anisotropy
We performed and analyzed time-resolved fluorescence anisotropy of mCit data using time-correlated single photon counting and direct waveform recording methods as describedprevi-ously [16, 17]. A 480 nm laser line with 515 nm LP was used in TCSPC experiments and a 532nm laser line with 570 nm LP was used for DWR experiments. All time-resolved experimentsstarted with 500 nM of protein, and sequential, polarizedmeasurements of 0°, 54.7° and 90°were recorded for each condition. Using analysis software describedpreviously [18], the singleexponential fluorescence lifetime (τ) was first assessed using fluorescent recordings obtained at54.7°. Subsequently the fluorescence data at 0° and 90° were fit to a 2 exponential decay func-tion using a fixed τ value. Steady-state anisotropies were calculated as the weighted average ofthe anisotropy decay given by the best-fit model parameters:
r ¼R1
0rðtÞFðtÞdtR1
0FðtÞdt
¼ r0 w1
�1
�1 þ tþ ð1 � w1Þ
�2
�2 þ t
� �
where r0 is the initial anisotropy, ϕ1,ϕ2 are the correlation times, χ1 is the fractional contribu-tion to the anisotropy decay, τ is the fluorescence lifetime, and the final anisotropy is assumedto be zero.
Liposome preparation
Liposomes were prepared fresh from chloroform stocks (Avanti) and mol % was calculatedusing manufacturer provided concentrations and molecular weights. The chloroform wasdried with nitrogen and incubation under vacuum for 1 h. The lipids were brought to a work-ing concentration of 1.27 mMwith addition of working buffer and were allowed to hydrateat 60°C for 1 h with intermittent suspension by pipetting. Liposomes were generated by 10rounds of sonication (10 s on, 50 s off).Data presented are representative of multiple batchesof liposome preparations, but were all performedwith the same stocks of lipid. For the time-resolved anisotropy measurements instead of sonication, the liposomemixture was extrudedusing a 100 nm nitrocellulosemembrane (Millipore) according to manufacturer’s protocol(Avanti).
Kinase activity
Kinase activity was assessed as previously described [14]. ATP consumption was measuredusing the Kinase-GloMax Luminescence assay kit (Promega) measured in a white, opaque 96well plate (Nunc) on a SpectraMaxM5e spectraphotometer (Molecular Devices). Reactionsoccurred in individual wells with starting concentrations of 100 μM ATP, 100 μMmyelinbasic protein peptide (4–14; Genscript), 100 nM PKCα-mCit-FLAG, 300 μM free Ca2+, and30 μM of the indicated liposomes. Reactions were initiated with the addition of ATP, andwere arrested with addition of the Kinase-Glo substrate after 4 min at room temperature(22.0 ± 0.5°C).
PKC Self-Assembly
PLOS ONE | DOI:10.1371/journal.pone.0162331 October 5, 2016 5 / 21
Steady-state fluorescence anisotropy plate reader
A SpectraMaxM5e (Molecular Devices) was used to record fluorescence anisotropy. Theinstrument was calibrated with FITC (1 μM pH 8.0; excitation 483 nm, emission 515 nm) insolutions of water and 0, 10, 30, 50, 70 and 90% glycerol in a black, clear bottom 96 well plate(n = 12; Greiner). The high and low ends were in good agreement with anticipated anisotropyvalues (0.046 ± 0.025 and 0.392 ± 0.020) and no correction factor was used (G-factor = 1).These same standards were applied to the microscope where a G-factor was applied (seebelow). For protein experimentsmCit (excitation 485 nm, emission 515 nm) was monitored,and buffer blanks were subtracted before anisotropy calculation. The starting concentration ofmCit-containing protein is 200 nM in a 50 μL volume unless otherwise stated, and, for sequen-tial addition of calcium and EGTA, was performed by addition of concentrated stocks (lessthan 2.5% of the final volume was added). For each condition, 4–8 wells were monitored intriplicate. All experiments were performed at room temperature (22.0 ± 0.5°C).
Steady-state anisotropy optical set-up
Experiments were collectedusing a TiE microscope (see above for description). A 40X DICM/N2 0.75 NA objective combined with the 1.5X optovar (Nikon) was used for imaging cells. FITCcalibration samples were placed on glass bottom tissue culture plates (MatTek Corp.) and imagedwith polarized excitation and a dual view polarized beam splitter (Photometrics). As with theplate reader, the instrument was calibrated with FITC (1 μM pH 8.0; excitation 483 nm, emission515 nm) in solutions of water and 0, 10, 30, 50, 70 and 90% glycerol. Qualitatively, the relativeanisotropy values matched those obtained from the fluorimeter, but with systematically lowerabsolute values. A G-factor was applied such that the 0% glycerol sample had an anisotropy valueof 0.00 (i.e., equal emission in both polarized channels)[19]. This G-factor (0.773) was applied toall additional anisotropy analysis and no further correction factor was used.
Mammalian cell imaging
CHO Flp-in cells were cultured as previously described [14]. Cells were transiently transfectedwith indicated constructs using X-tremeGENEHP (Roche). Cells were transferred to fibronec-tin (Sigma-Aldrich) coated (1:100 dilution in PBS incubated for 1 hr) glass bottom 35 mm tis-sue culture plates (MatTek Corp.) 24–48 h post transfection as previously described.Cells wereallowed to adhere for 1–4 h in culturingmedia before cells were imaged. Cells were washed andimaged in freshly prepared HBS (20 mMHEPES, 5mMKCl, 45mMNaCl, 2mMCaCl2, 1mMMgCl2, 0.2% dextrose, brought to pH 7.4 by NaOH) media. The plates were transferred to thescope and a field of viewwas manually selected, guided by fluorescence expression and mor-phology of cells. Cells were imaged every 200 ms or 500 ms over a 5 min time course. Eitherionomycin (final 10 μM) or EGTA (final 4 mM) in matched buffer was manually pipetted ontothe culture plate during imaging at predetermined time points. Experiments were performed at22°C. Anisotropy image data was analyzed with customMatLab code. Both polarized imagesper frame were registered using the imregisterMatLab function. A background region is manu-ally selected, and the mean of the background in each polarization channel is subtracted fromthe corresponding image. The anisotropy value r is calculated using the parallel and perpendic-ular pixel intensities corrected for the G factor:
r ¼Ik � G � I?
Ik þ 2G � I?
PKC Self-Assembly
PLOS ONE | DOI:10.1371/journal.pone.0162331 October 5, 2016 6 / 21
Anisotropy values above and below theoretical limits are excluded and a mean of all anisot-ropy values are calculated for each image in the series. For representative images the imageswere cropped, median filtered and the ‘Fire’ look up table was applied (ImageJ). The correlationcoefficientwas calculated in the same customMatLab code as the anisotropy analysis. Follow-ing registration and background subtraction, an image of the total mCit intensity (Ik + 2G � I?)was generated. The corrcoef functionwas applied between each frame and the first frame.Translocation in this metric is defined by a redistribution of fluorescence intensity within thecell.
Statistics
All statistics were performed in GraphPad Prism 6. Unless otherwise stated, a student’sunpaired, two-tailed t-test was performed and is represented as symbols corresponding top-values. n.s.> 0.05; � = 0.05–0.001; �� = 0.001–0.0005; ��� = 0.0005–0.0001; ���� < 0.0001.
Results and Discussion
Calcium induced self-assembly in vitro
Self-assembly is specific and reversible. Previous work fromHuang et al suggested thatboth calcium and phosphatidylserine were necessary for PKCα self-assembly [20]. In contrast,our previous study observed that calcium alone was sufficient for PKCα self-assembly, albeit atan attenuated level [14]. Both of these studies used chemical cross-linking to assess self-assem-bly, which may be dependent on the conformational state of the protein and bias the conclu-sions. We chose to re-address whether PKCα self-assembles in the presence of calcium usingtechniques based on the size and diffusivity of particles including differential sedimentation(Fig 1A), dynamic light scattering (DLS) (Fig 1B), single-particle fluorescencemicroscopy(Fig 1C) and size-exclusion chromatography (SEC) (S1 Fig). Where possible, PKCα self-assembly was assessed without a fluorophore (Fig 1B and 1C), and in all cases constructs withfluorophores utilized the monomeric versions of Cerulean and Citrine (mCer and mCit respec-tively). Overall, each methodology supports our conclusion that PKCα specifically and revers-ibly oligomerizes in the presence of free calcium in vitro. When Ca2+ ion coordination isblocked by introducing the D246N point mutation in the C2 domain [21], this self-assembly issignificantly reduced compared to wild type (p<0.0001, Fig 1B and S1 Fig). Additionally,cycling PKCα between low (< 1 nM) and high (>100 μM) free calcium conditions demon-strates that the phenomenon is partially reversible. Interestingly, the oligomers have severalunexpected characteristics. Notably, they are much larger than the previously reported homo-dimers [14, 20]. Following a 30 min incubation in high free calcium conditions, SEC analysisindicates that oligomers are at least 10-fold larger than monomers (S1 Text), and DLS analysissupports a mean increase in particle size of ~13-fold (Fig 1B, S1 Text, S2 Fig). Second, thenumber of oligomers, their size, and the fraction of PKCαmolecules oligomerized are time-and concentration- dependent. This result is most evident in quantitative analysis of single-particle fluorescencemicroscopy (S1 Text, S3 Fig). We tested if oligomerization is observablewhen using physiologically relevant free calcium concentrations (<10 μM)[22]. PKCα oligo-merization was monitored as a function of free calcium concentration by differential sedimen-tation and single-particle fluorescencemicroscopy. In both cases, oligomerization fit well tosingle-phase binding curveswith KD values falling within physiologically relevant ranges (KD =1.6 ± 0.3 μM by microscopy, KD = 0.32 ± 0.26 μM by sedimentation) (Fig 1D).EndogenousmammalianPKCα self-assembles. All of the above experiments used
recombinant human PKCαminimally fused with a C-terminal FLAG peptide purification tag.To assess whether the observed self-assembly was an artifact of either Sf9 expression or the
PKC Self-Assembly
PLOS ONE | DOI:10.1371/journal.pone.0162331 October 5, 2016 7 / 21
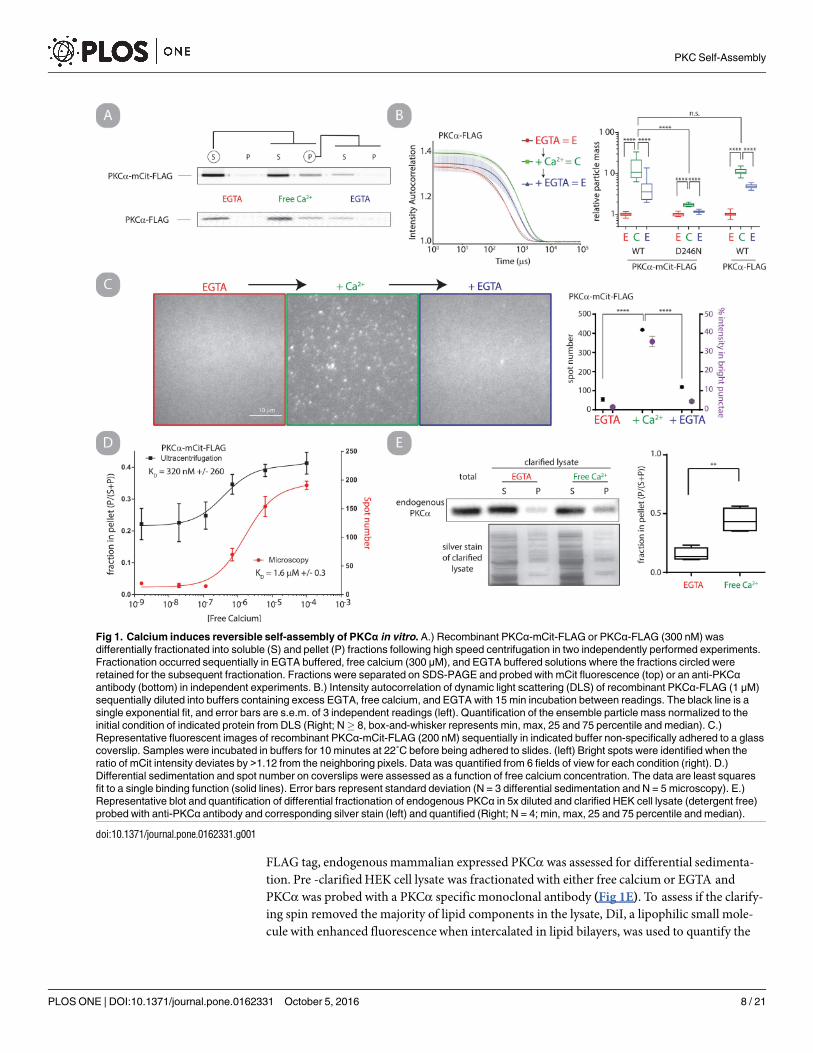
FLAG tag, endogenousmammalian expressed PKCα was assessed for differential sedimenta-tion. Pre -clarifiedHEK cell lysate was fractionated with either free calcium or EGTA andPKCα was probed with a PKCα specificmonoclonal antibody (Fig 1E). To assess if the clarify-ing spin removed the majority of lipid components in the lysate, DiI, a lipophilic small mole-cule with enhanced fluorescencewhen intercalated in lipid bilayers, was used to quantify the
Fig 1. Calcium induces reversible self-assembly of PKCα in vitro. A.) Recombinant PKCα-mCit-FLAG or PKCα-FLAG (300 nM) was
differentially fractionated into soluble (S) and pellet (P) fractions following high speed centrifugation in two independently performed experiments.
Fractionation occurred sequentially in EGTA buffered, free calcium (300 μM), and EGTA buffered solutions where the fractions circled were
retained for the subsequent fractionation. Fractions were separated on SDS-PAGE and probed with mCit fluorescence (top) or an anti-PKCαantibody (bottom) in independent experiments. B.) Intensity autocorrelation of dynamic light scattering (DLS) of recombinant PKCα-FLAG (1 μM)
sequentially diluted into buffers containing excess EGTA, free calcium, and EGTA with 15 min incubation between readings. The black line is a
single exponential fit, and error bars are s.e.m. of 3 independent readings (left). Quantification of the ensemble particle mass normalized to the
initial condition of indicated protein from DLS (Right; N� 8, box-and-whisker represents min, max, 25 and 75 percentile and median). C.)
Representative fluorescent images of recombinant PKCα-mCit-FLAG (200 nM) sequentially in indicated buffer non-specifically adhered to a glass
coverslip. Samples were incubated in buffers for 10 minutes at 22˚C before being adhered to slides. (left) Bright spots were identified when the
ratio of mCit intensity deviates by >1.12 from the neighboring pixels. Data was quantified from 6 fields of view for each condition (right). D.)
Differential sedimentation and spot number on coverslips were assessed as a function of free calcium concentration. The data are least squares
fit to a single binding function (solid lines). Error bars represent standard deviation (N = 3 differential sedimentation and N = 5 microscopy). E.)
Representative blot and quantification of differential fractionation of endogenous PKCα in 5x diluted and clarified HEK cell lysate (detergent free)
probed with anti-PKCα antibody and corresponding silver stain (left) and quantified (Right; N = 4; min, max, 25 and 75 percentile and median).
doi:10.1371/journal.pone.0162331.g001
PKC Self-Assembly
PLOS ONE | DOI:10.1371/journal.pone.0162331 October 5, 2016 8 / 21
lipid concentration before and after the spin (S4 Fig). The clarifying spin reduced the lipid con-centration by 13.6 fold. A significantly larger fraction of endogenous PKCα pelleted in the pres-ence of free calcium (p< 0.01, Fig 1E). This experiment provides direct experimental evidenceof altered PKC particle mass in lipid-depleted endogenous cell lysate.
C1a and C2 domains are minimally sufficient for calcium induced self-
assembly
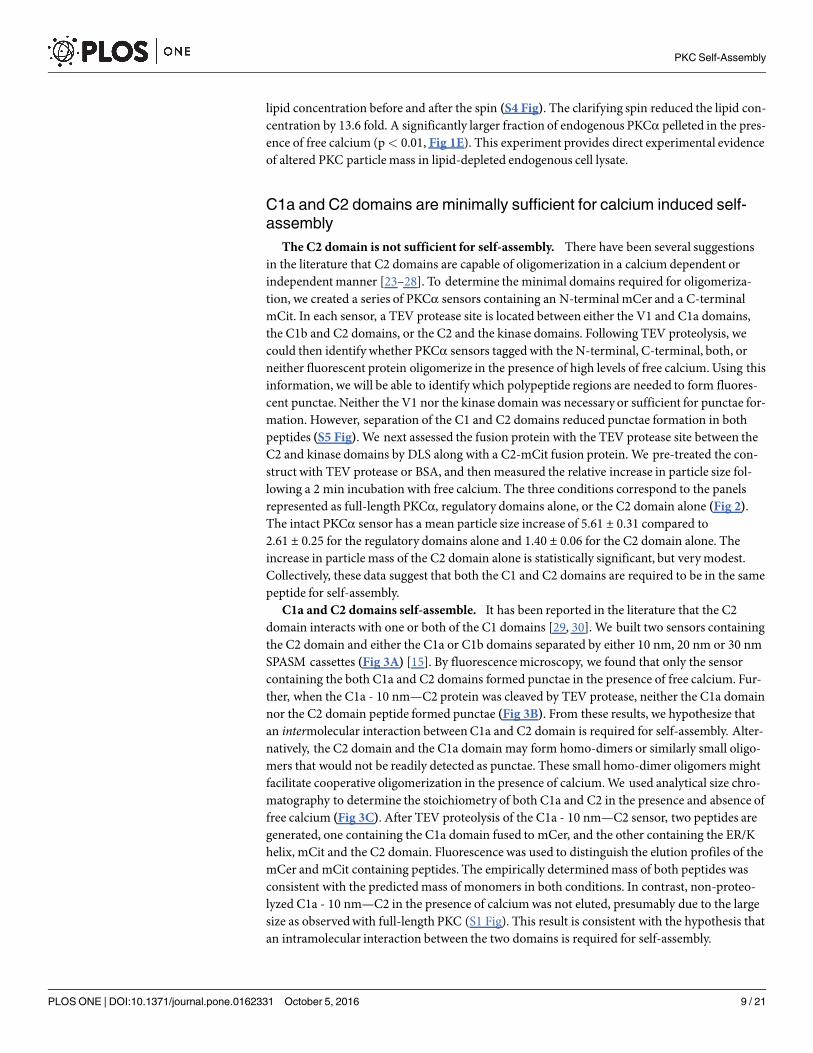
The C2 domain is not sufficient for self-assembly. There have been several suggestionsin the literature that C2 domains are capable of oligomerization in a calcium dependent orindependentmanner [23–28]. To determine the minimal domains required for oligomeriza-tion, we created a series of PKCα sensors containing an N-terminal mCer and a C-terminalmCit. In each sensor, a TEV protease site is located between either the V1 and C1a domains,the C1b and C2 domains, or the C2 and the kinase domains. Following TEV proteolysis, wecould then identify whether PKCα sensors taggedwith the N-terminal, C-terminal, both, orneither fluorescent protein oligomerize in the presence of high levels of free calcium. Using thisinformation, we will be able to identify which polypeptide regions are needed to form fluores-cent punctae. Neither the V1 nor the kinase domain was necessary or sufficient for punctae for-mation. However, separation of the C1 and C2 domains reduced punctae formation in bothpeptides (S5 Fig). We next assessed the fusion protein with the TEV protease site between theC2 and kinase domains by DLS along with a C2-mCit fusion protein. We pre-treated the con-struct with TEV protease or BSA, and then measured the relative increase in particle size fol-lowing a 2 min incubation with free calcium. The three conditions correspond to the panelsrepresented as full-length PKCα, regulatory domains alone, or the C2 domain alone (Fig 2).The intact PKCα sensor has a mean particle size increase of 5.61 ± 0.31 compared to2.61 ± 0.25 for the regulatory domains alone and 1.40 ± 0.06 for the C2 domain alone. Theincrease in particle mass of the C2 domain alone is statistically significant, but verymodest.Collectively, these data suggest that both the C1 and C2 domains are required to be in the samepeptide for self-assembly.C1a and C2 domains self-assemble. It has been reported in the literature that the C2
domain interacts with one or both of the C1 domains [29, 30]. We built two sensors containingthe C2 domain and either the C1a or C1b domains separated by either 10 nm, 20 nm or 30 nmSPASM cassettes (Fig 3A) [15]. By fluorescencemicroscopy, we found that only the sensorcontaining the both C1a and C2 domains formed punctae in the presence of free calcium. Fur-ther, when the C1a - 10 nm—C2 protein was cleaved by TEV protease, neither the C1a domainnor the C2 domain peptide formed punctae (Fig 3B). From these results, we hypothesize thatan intermolecular interaction betweenC1a and C2 domain is required for self-assembly. Alter-natively, the C2 domain and the C1a domain may form homo-dimers or similarly small oligo-mers that would not be readily detected as punctae. These small homo-dimer oligomers mightfacilitate cooperative oligomerization in the presence of calcium.We used analytical size chro-matography to determine the stoichiometry of both C1a and C2 in the presence and absence offree calcium (Fig 3C). After TEV proteolysis of the C1a - 10 nm—C2 sensor, two peptides aregenerated, one containing the C1a domain fused to mCer, and the other containing the ER/Khelix, mCit and the C2 domain. Fluorescence was used to distinguish the elution profiles of themCer and mCit containing peptides. The empirically determinedmass of both peptides wasconsistent with the predictedmass of monomers in both conditions. In contrast, non-proteo-lyzed C1a - 10 nm—C2 in the presence of calciumwas not eluted, presumably due to the largesize as observedwith full-length PKC (S1 Fig). This result is consistent with the hypothesis thatan intramolecular interaction between the two domains is required for self-assembly.
PKC Self-Assembly
PLOS ONE | DOI:10.1371/journal.pone.0162331 October 5, 2016 9 / 21
Basal intramolecular interaction betweenC1a and C2. It is expected that the C1a andC2 domains interact in the absence of calcium [29]. To test this hypothesis, we compared threesensors containing SPASM cassettes fused between the C1a and C2 domains. The SPASM cas-settes have fully extended α-helices with lengths of 10, 20 and 30 nm and are designed, throughspontaneous helix breaking, to have intra-molecular effective concentrations of 4 μM, 0.4 μMand 0.1 μM respectively [15]. The heteroFRET from these sensors are designed to report on theequilibrium between bound and unbound intramolecular interactions if the total concentrationof sensor is<< the bi-molecularKD of the interacting peptides [15]. The heteroFRET isreduced as a function of effective concentration (all constructs at 50 nM) consistent with thehypothesis of an intramolecular C1a-C2 interaction basally (Fig 3D). We tested two putativeresidues at the C1a-C2 binding interface but point mutations at these residues in the SPASMsensor did not disrupt the interaction (S6 Fig) [29].HeteroFRET detects calcium stimulated self-assemblyof C1a - 10 nm—C2. We consid-
ered if heteroFRET of C1a - 10 nm—C2 sensor could additionally report on calcium stimulatedself-assembly. We observed that heteroFRET of C1a - 10 nm—C2 increased and decreasedafter sequential treatment with free calcium and EGTA (Fig 3E). In contrast, no increase inheteroFRET was observed if C1a - 10 nm—C2 was TEV proteolyzed, and only a modest butsignificant increase was observed if the D246N point mutation was inserted into the sensor. Todistinguish the intramolecular and intermolecular contributions to heteroFRET, the concen-tration dependencywas assessed. The increase in heteroFRET after addition of free calcium isplotted as a function of sensor concentration (Fig 3F). This data is fit well by a Hill bindingmodel, providing a half-maximal value of 61.1 ± 1.2 nM (best fit and standard error), whichserves as an estimate of the free in solution equilibriumdissociation constant. These resultsdemonstrate that two factors, intramolecular and intermolecular interactions contribute toobservedheteroFRET in the presence of calcium.IntramolecularC1a –C2 interaction regulates self-assembly. We next wanted to explore
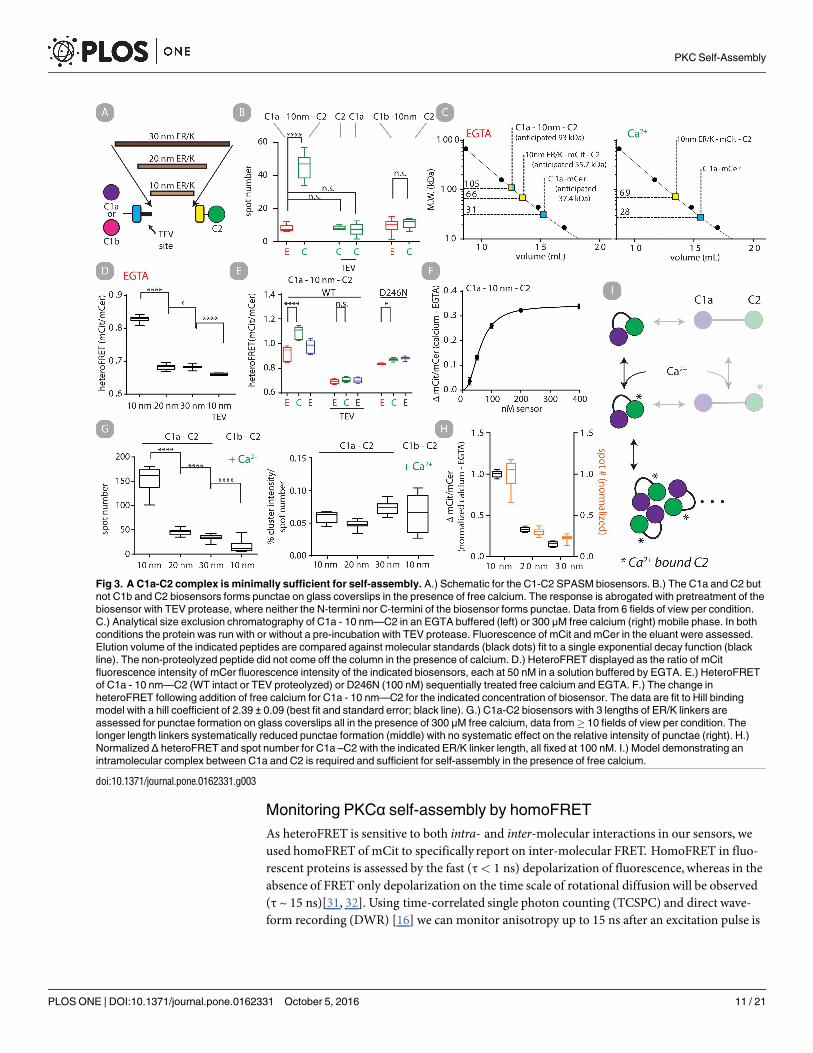
the dependency of self-assembly on the intramolecular interaction betweenC1a and C2. Usingthe fluorescencemicroscopy assay we found that the number, but not the size of self-assembledpunctae was dependent on the effective concentration of C1a –C2 as dictated by the length ofER/K helix (Fig 3G). We additionally monitored the increase in heteroFRET upon free calciumaddition for the same constructs.We found that both metrics of self-assembly were highly cor-related (Fig 3H) (linear correlation r2 = 0.936). From these data we propose a model in which(i) the C1a and C2 domains are the minimal unit required for self-assembly and(ii) an intra-molecular C1a�C2 interaction is required for self-assembly (Fig 3I).
Fig 2. Regulatory domains self-assemble. Mean DLS autocorrelation data before (red) or after addition of free calcium (green) of full-length PKCα (left),
the regulatory domains (middle), and C2 domain (right) at matched time points (2 min incubation) and concentration. Normalized particle mass is
quantified at the far right. Box and whisker plots represent min, max, 25 and 75 percentile and median of N > 5. Each particle mass increased significantly
following calcium addition (p>0.0001).
doi:10.1371/journal.pone.0162331.g002
PKC Self-Assembly
PLOS ONE | DOI:10.1371/journal.pone.0162331 October 5, 2016 10 / 21
Monitoring PKCα self-assembly by homoFRET
As heteroFRET is sensitive to both intra- and inter-molecular interactions in our sensors, weused homoFRET of mCit to specifically report on inter-molecular FRET. HomoFRET in fluo-rescent proteins is assessed by the fast (τ< 1 ns) depolarization of fluorescence, whereas in theabsence of FRET only depolarization on the time scale of rotational diffusionwill be observed(τ ~ 15 ns)[31, 32]. Using time-correlated single photon counting (TCSPC) and direct wave-form recording (DWR) [16] we can monitor anisotropy up to 15 ns after an excitation pulse is
Fig 3. A C1a-C2 complex is minimally sufficient for self-assembly. A.) Schematic for the C1-C2 SPASM biosensors. B.) The C1a and C2 but
not C1b and C2 biosensors forms punctae on glass coverslips in the presence of free calcium. The response is abrogated with pretreatment of the
biosensor with TEV protease, where neither the N-termini nor C-termini of the biosensor forms punctae. Data from 6 fields of view per condition.
C.) Analytical size exclusion chromatography of C1a - 10 nm—C2 in an EGTA buffered (left) or 300 μM free calcium (right) mobile phase. In both
conditions the protein was run with or without a pre-incubation with TEV protease. Fluorescence of mCit and mCer in the eluant were assessed.
Elution volume of the indicated peptides are compared against molecular standards (black dots) fit to a single exponential decay function (black
line). The non-proteolyzed peptide did not come off the column in the presence of calcium. D.) HeteroFRET displayed as the ratio of mCit
fluorescence intensity of mCer fluorescence intensity of the indicated biosensors, each at 50 nM in a solution buffered by EGTA. E.) HeteroFRET
of C1a - 10 nm—C2 (WT intact or TEV proteolyzed) or D246N (100 nM) sequentially treated free calcium and EGTA. F.) The change in
heteroFRET following addition of free calcium for C1a - 10 nm—C2 for the indicated concentration of biosensor. The data are fit to Hill binding
model with a hill coefficient of 2.39 ± 0.09 (best fit and standard error; black line). G.) C1a-C2 biosensors with 3 lengths of ER/K linkers are
assessed for punctae formation on glass coverslips all in the presence of 300 μM free calcium, data from� 10 fields of view per condition. The
longer length linkers systematically reduced punctae formation (middle) with no systematic effect on the relative intensity of punctae (right). H.)
Normalized Δ heteroFRET and spot number for C1a –C2 with the indicated ER/K linker length, all fixed at 100 nM. I.) Model demonstrating an
intramolecular complex between C1a and C2 is required and sufficient for self-assembly in the presence of free calcium.
doi:10.1371/journal.pone.0162331.g003
PKC Self-Assembly
PLOS ONE | DOI:10.1371/journal.pone.0162331 October 5, 2016 11 / 21
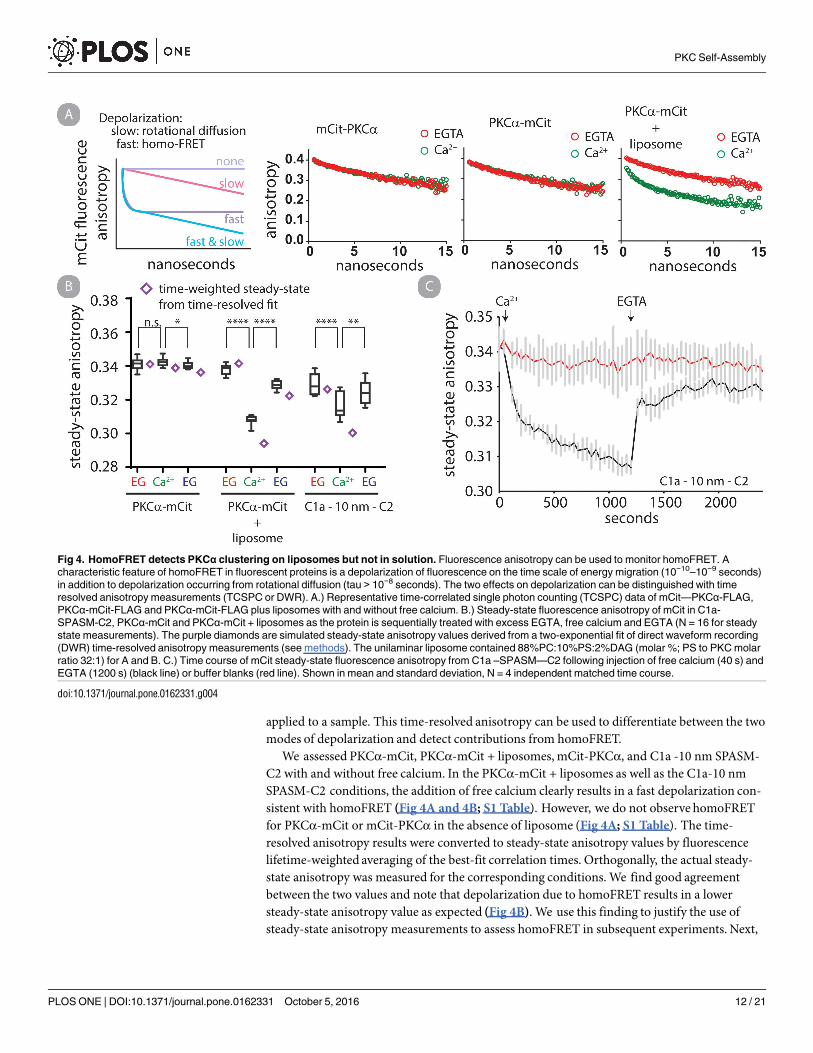
applied to a sample. This time-resolved anisotropy can be used to differentiate between the twomodes of depolarization and detect contributions from homoFRET.We assessed PKCα-mCit, PKCα-mCit + liposomes, mCit-PKCα, and C1a -10 nm SPASM-
C2 with and without free calcium. In the PKCα-mCit + liposomes as well as the C1a-10 nmSPASM-C2 conditions, the addition of free calcium clearly results in a fast depolarization con-sistent with homoFRET (Fig 4A and 4B; S1 Table). However, we do not observe homoFRETfor PKCα-mCit or mCit-PKCα in the absence of liposome (Fig 4A; S1 Table). The time-resolved anisotropy results were converted to steady-state anisotropy values by fluorescencelifetime-weighted averaging of the best-fit correlation times. Orthogonally, the actual steady-state anisotropy was measured for the corresponding conditions.We find good agreementbetween the two values and note that depolarization due to homoFRET results in a lowersteady-state anisotropy value as expected (Fig 4B). We use this finding to justify the use ofsteady-state anisotropy measurements to assess homoFRET in subsequent experiments. Next,
Fig 4. HomoFRET detects PKCα clustering on liposomes but not in solution. Fluorescence anisotropy can be used to monitor homoFRET. A
characteristic feature of homoFRET in fluorescent proteins is a depolarization of fluorescence on the time scale of energy migration (10−10–10−9 seconds)
in addition to depolarization occurring from rotational diffusion (tau > 10−8 seconds). The two effects on depolarization can be distinguished with time
resolved anisotropy measurements (TCSPC or DWR). A.) Representative time-correlated single photon counting (TCSPC) data of mCit—PKCα-FLAG,
PKCα-mCit-FLAG and PKCα-mCit-FLAG plus liposomes with and without free calcium. B.) Steady-state fluorescence anisotropy of mCit in C1a-
SPASM-C2, PKCα-mCit and PKCα-mCit + liposomes as the protein is sequentially treated with excess EGTA, free calcium and EGTA (N = 16 for steady
state measurements). The purple diamonds are simulated steady-state anisotropy values derived from a two-exponential fit of direct waveform recording
(DWR) time-resolved anisotropy measurements (see methods). The unilaminar liposome contained 88%PC:10%PS:2%DAG (molar %; PS to PKC molar
ratio 32:1) for A and B. C.) Time course of mCit steady-state fluorescence anisotropy from C1a –SPASM—C2 following injection of free calcium (40 s) and
EGTA (1200 s) (black line) or buffer blanks (red line). Shown in mean and standard deviation, N = 4 independent matched time course.
doi:10.1371/journal.pone.0162331.g004
PKC Self-Assembly
PLOS ONE | DOI:10.1371/journal.pone.0162331 October 5, 2016 12 / 21
we monitored a time course of steady-state anisotropy of C1a - 10 nm—C2 being sequentiallytreated with free calcium and EGTA. Within seconds of free calcium injection anisotropydecreases and resolves to near its starting point within seconds as EGTA is injected (Fig 4C).This observation is consistent with an interpretation that C1a - 10 nm—C2 clusters to enablehomoFRET in solution in the presence of free calcium and disassembles upon free calciumchelation.
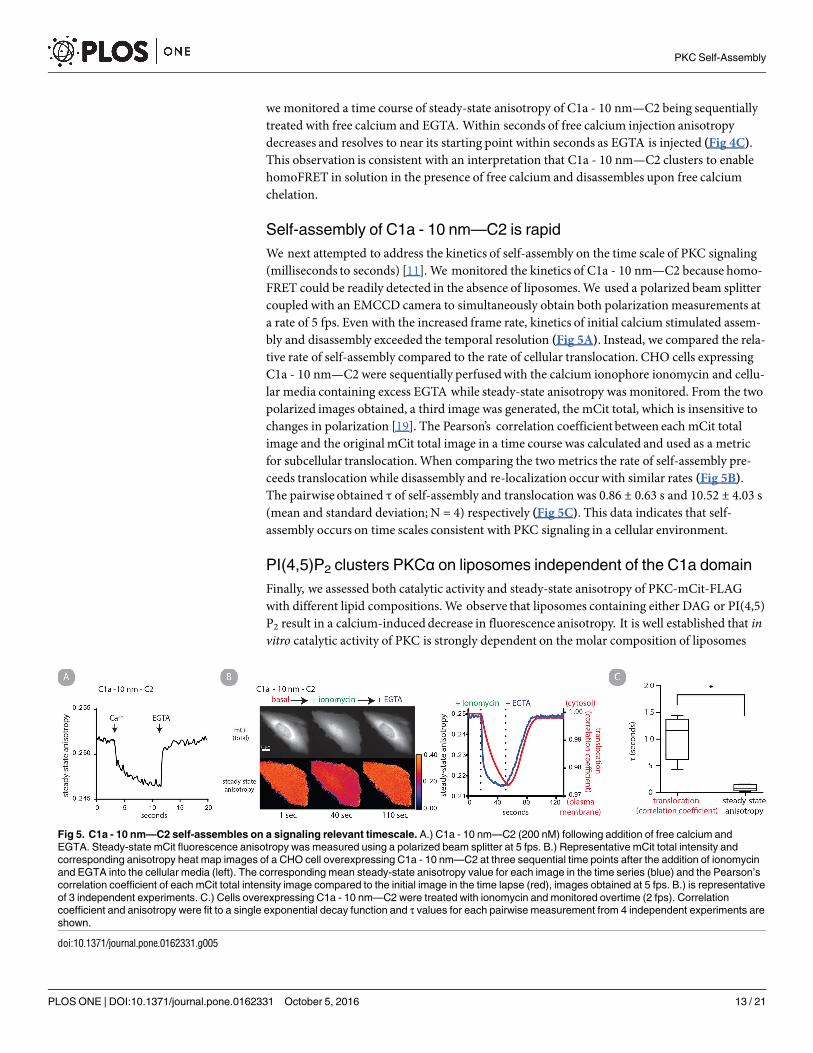
Self-assembly of C1a - 10 nm—C2 is rapid
We next attempted to address the kinetics of self-assembly on the time scale of PKC signaling(milliseconds to seconds) [11]. We monitored the kinetics of C1a - 10 nm—C2 because homo-FRET could be readily detected in the absence of liposomes.We used a polarized beam splittercoupled with an EMCCD camera to simultaneously obtain both polarizationmeasurements ata rate of 5 fps. Even with the increased frame rate, kinetics of initial calcium stimulated assem-bly and disassembly exceeded the temporal resolution (Fig 5A). Instead, we compared the rela-tive rate of self-assembly compared to the rate of cellular translocation. CHO cells expressingC1a - 10 nm—C2 were sequentially perfusedwith the calcium ionophore ionomycin and cellu-lar media containing excess EGTA while steady-state anisotropy was monitored. From the twopolarized images obtained, a third image was generated, the mCit total, which is insensitive tochanges in polarization [19]. The Pearson’s correlation coefficient between each mCit totalimage and the originalmCit total image in a time course was calculated and used as a metricfor subcellular translocation.When comparing the two metrics the rate of self-assembly pre-ceeds translocation while disassembly and re-localization occur with similar rates (Fig 5B).The pairwise obtained τ of self-assembly and translocation was 0.86 ± 0.63 s and 10.52 ± 4.03 s(mean and standard deviation; N = 4) respectively (Fig 5C). This data indicates that self-assembly occurs on time scales consistent with PKC signaling in a cellular environment.
PI(4,5)P2 clusters PKCα on liposomes independent of the C1a domain
Finally, we assessed both catalytic activity and steady-state anisotropy of PKC-mCit-FLAGwith different lipid compositions.We observe that liposomes containing either DAG or PI(4,5)P2 result in a calcium-induceddecrease in fluorescence anisotropy. It is well established that invitro catalytic activity of PKC is strongly dependent on the molar composition of liposomes
Fig 5. C1a - 10 nm—C2 self-assembles on a signaling relevant timescale. A.) C1a - 10 nm—C2 (200 nM) following addition of free calcium and
EGTA. Steady-state mCit fluorescence anisotropy was measured using a polarized beam splitter at 5 fps. B.) Representative mCit total intensity and
corresponding anisotropy heat map images of a CHO cell overexpressing C1a - 10 nm—C2 at three sequential time points after the addition of ionomycin
and EGTA into the cellular media (left). The corresponding mean steady-state anisotropy value for each image in the time series (blue) and the Pearson’s
correlation coefficient of each mCit total intensity image compared to the initial image in the time lapse (red), images obtained at 5 fps. B.) is representative
of 3 independent experiments. C.) Cells overexpressing C1a - 10 nm—C2 were treated with ionomycin and monitored overtime (2 fps). Correlation
coefficient and anisotropy were fit to a single exponential decay function and τ values for each pairwise measurement from 4 independent experiments are
shown.
doi:10.1371/journal.pone.0162331.g005
PKC Self-Assembly
PLOS ONE | DOI:10.1371/journal.pone.0162331 October 5, 2016 13 / 21
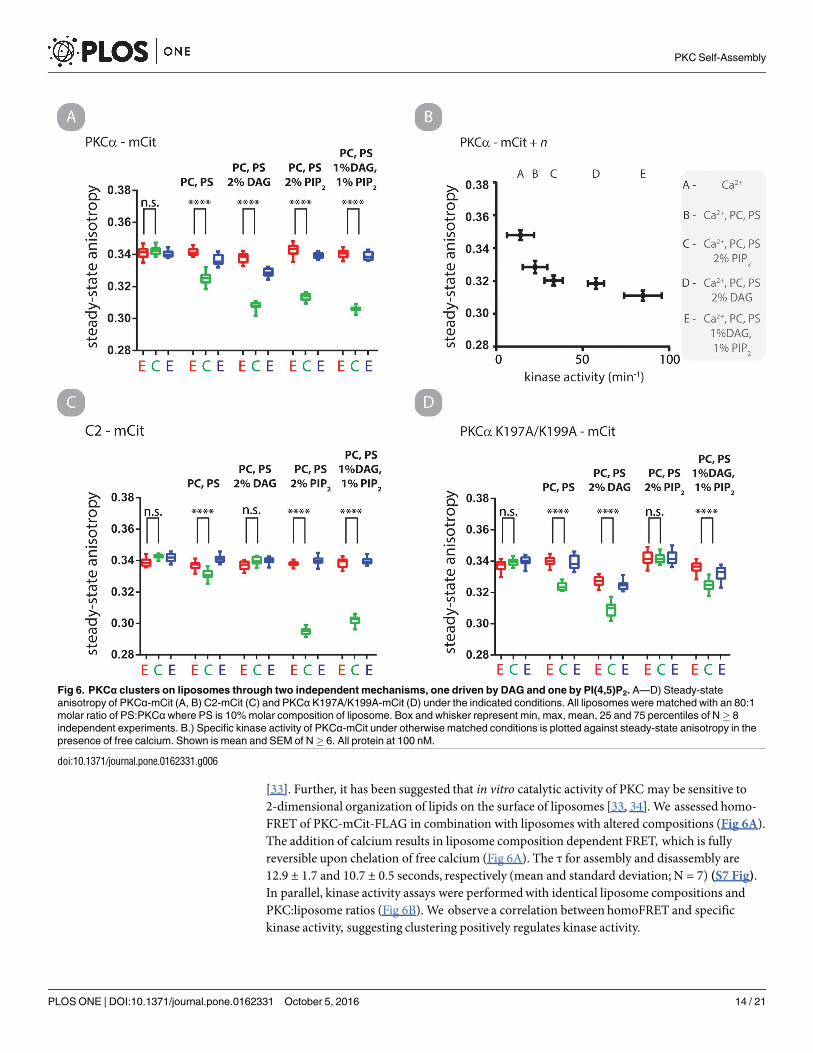
[33]. Further, it has been suggested that in vitro catalytic activity of PKC may be sensitive to2-dimensional organization of lipids on the surface of liposomes [33, 34]. We assessed homo-FRET of PKC-mCit-FLAG in combination with liposomes with altered compositions (Fig 6A).The addition of calcium results in liposome composition dependent FRET, which is fullyreversible upon chelation of free calcium (Fig 6A). The τ for assembly and disassembly are12.9 ± 1.7 and 10.7 ± 0.5 seconds, respectively (mean and standard deviation; N = 7) (S7 Fig).In parallel, kinase activity assays were performedwith identical liposome compositions andPKC:liposome ratios (Fig 6B). We observe a correlation between homoFRET and specifickinase activity, suggesting clustering positively regulates kinase activity.
Fig 6. PKCα clusters on liposomes through two independent mechanisms, one driven by DAG and one by PI(4,5)P2. A—D) Steady-state
anisotropy of PKCα-mCit (A, B) C2-mCit (C) and PKCα K197A/K199A-mCit (D) under the indicated conditions. All liposomes were matched with an 80:1
molar ratio of PS:PKCαwhere PS is 10% molar composition of liposome. Box and whisker represent min, max, mean, 25 and 75 percentiles of N� 8
independent experiments. B.) Specific kinase activity of PKCα-mCit under otherwise matched conditions is plotted against steady-state anisotropy in the
presence of free calcium. Shown is mean and SEM of N� 6. All protein at 100 nM.
doi:10.1371/journal.pone.0162331.g006
PKC Self-Assembly
PLOS ONE | DOI:10.1371/journal.pone.0162331 October 5, 2016 14 / 21
We were surprised that liposomes containing PI(4,5)P2 in the absence of DAG elicited highspecific activity and homoFRET as DAG is typically considered a required co-factor for PKCαactivity. However, several recent reports have demonstrated that PI(4,5)P2 (i) is a potent activa-tor of PKCα in vitro [35], (ii) forms clusters in liposomes in the presence of free calcium [36]and, (iii) induces clustering of PS if calcium and PKCα C2 domain are present (which bindsboth PS and PI(4,5)P2) [23]. The latter two observations suggest that PI(4,5)P2 induce cluster-ing of PKCα independently of a C1a-C2 interaction.We tested this by monitoring steady-stateanisotropy of C2-mCit-FLAG undermatched conditions (Fig 6C). HomoFRET for the C2 con-struct is observed if PI(4,5)P2 is present in the liposome.We next inserted point mutations tospecifically disrupt the C2—PI(4,5)P2 interaction [13]. HomoFRET of PKC-mCit-FLAGK197A/K199A is abrogated in solution with liposomes containing PI(4,5)P2 while not affectingthe response from liposomes containing DAG (Fig 6D). These results provide positive evi-dence that clustering of PKC on liposomes in vitro is dependent on calcium as well as DAG orPI(4,5)P2 binding.
Conclusions
We here report the in vitro phenomenon that PKCα self-assembles specifically, rapidly andreversibly in the presence of calcium.We find that the C1a and C2 domains are required forself-assembly. These domains have been previously reported to interact but under contradic-tory conditions [29, 30]. In the study by the Cho group, it was anticipated that an intramolecu-lar interaction between the two domains is present in the absence of calcium, but that theinteraction is abrogated upon lipid binding [29]. In contrast, in a study by the Stubbs group, ahigh affinity intermolecular interaction (4 nM) was reported betweenC1a and C2 domains inthe presence of calcium and phorbol ester [30]. Our present findings support both an intramo-lecular and intermolecular interaction betweenC1a and C2 domains (Figs 3 and 4). Our intra-molecular FRET data directly support an intramolecular interaction between the C1a and C2domains in the absence of calcium (Fig 3D). Upon calcium binding, intermolecular self-assem-bly of C1a and C2 occurs (Figs 3–5). The degree of self-assembly of C1a-C2 can be tuned if theintramolecular C1a-C2 interaction is partially or fully disrupted (Fig 3). We speculate that dis-tinct cellular locations, including local plasma membrane environments may tune the intramo-lecular C1a-C2 complex, and in that way self-assembly may be regulated. To probe thispossibility, we explored the degree by which self-assembly of full-length PKC is regulated bylipid composition on liposomes in vitro. We found that the degree of self-assembly of PKC-mCit measured by homoFRET can be regulated by both DAG and PI(4,5)P2 (Fig 6). We foundthat a higher degree of self-assembly on liposomes generally correlates with higher kinase activ-ity (Fig 6B). These data support the potential role of a regulatory intramolecular interactionbetween the C1a and C2 domain in tuning PKC function.It remains unknown (i) if the calcium stimulated self-assembly of PKC phenomenon occurs
in cells and (ii) what biological functions it may be involved in. Previously, we provided evi-dence supporting the functional relevance of homo-oligomerization of PKCα in LPA andPMA stimulated phosphorylation of ERK 1/2 in CHO cells [14]. Here we provide homoFRETdata indicating that the C1a and C2 domains can self-assemble in cells (Fig 5). While FRET-basedmethodologies can be useful in assessing if an interaction occurs, it can be challenging toassess other characteristics including stoichiometry and distribution of oligomeric states with-out complimentary data. In this report we have deliberately chosen to study homo-oligomeri-zation of PKCα in the absence of lipids so that methodologies based on hydrodynamicproperties of PKC (DLS, size exclusion chromatography, differential sedimentation) or spa-tially resolved fluorescence intensity can provide insight into this phenomenon and
PKC Self-Assembly
PLOS ONE | DOI:10.1371/journal.pone.0162331 October 5, 2016 15 / 21
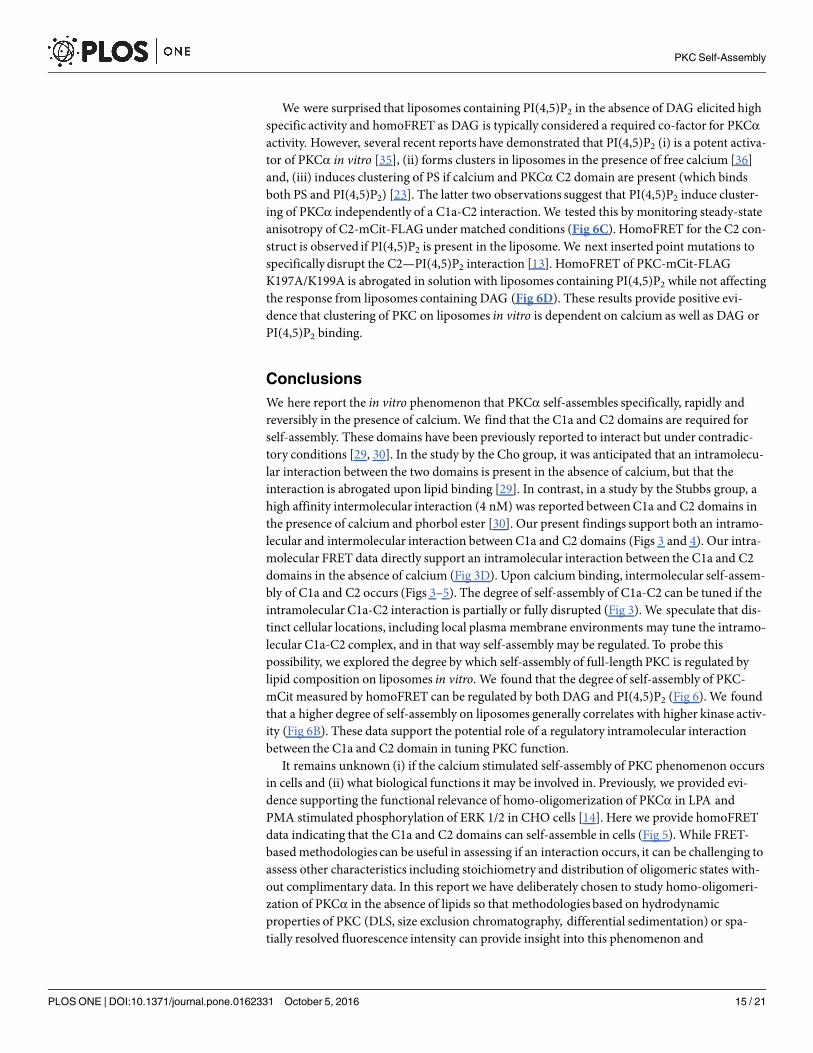
complement studies of PKC in the presence of lipids/liposomes.What can be clearly distin-guished in our current report is that PKC is capable of clustering in a calcium specificmannerindependent of lipid components (Fig 1). Despite this, lipid components, namely DAG and PI(4,5)P2, play critical roles in the self-assembly of PKC in the presence of calcium (Fig 6). Wespeculate that clustering may be a mechanism that modulates spatial-temporal regulation ofPKC in select physiological situations. It should be noted that calcium stimulated self-assemblyis typically not fully reversible on the time scales we have investigated, although it is not yetclear if this will have physiological consequences.We are intrigued by the shared characteristicsbetween self-assembly of PKCα and ideal information processingmolecules, as defined in thefield of supramolecular chemistry [37]. In line with this, our data distinguish three uniquesupramolecular states of PKC formed upon calcium binding which may each have uniquefunctional properties (Fig 7).We speculate that PKCα self-assemblymay be critical in the spatial organization of dynamic
signaling hubs. It has been previously demonstrated that the PKCα C2 domain clusters intodiffraction limited punctae on the plasma membrane, a phenomenon dependent on PIP2 bind-ing [13]. Corresponding in vitro reports suggest that PIP2 clusters on the surface of liposomesin the presence of calcium [36] and the PKC C2 domain can additionally facilitate clustering ofPS [23]. Our current finding that PIP2 plus calcium leads to PKC clustering (Fig 6) is consistentwith a model in which PIP2 clusters can focally accumulate PKC and moleculeswhich directlybind to PKC (PS, DAG, substrate et. ct.). A recent report demonstrated how PKC activationand phosphorylation of MARCKS protein, which sequesters PIP2 unless phosphorylated byPKC, can lead to accumulation and activation of PI3K to newly exposed PIP2 on supportedlipid bilayers in vitro [40]. Such a finding in conjunction with clustering may provide a mecha-nism by which PKC can generate and spatially organize a signaling hub with a mechanismindependent of direct scaffolding.Numerous other signaling and cytoskeletal proteins includ-ing calcium insensitive PKC, AKT and vinculin also interact with PIP2, however on time scales
Fig 7. PKC forms distinguishable supramolecular states with different combinations of inputs. Using two experimental criteria PKC can be
parsed into three unique supramolecular states. FRET puts a physical constraint on the proximity of PKC molecules within ~1.6 of Ro (mCer-mCit
Ro = 5.4 nm; 8.6 nm) suggestive of direct interactions [38], but is sensitive to the orientation between chromophore dipoles such that the absence of
FRET does not rule out an interaction. Calcium alone causes self-assembly of PKC which can be directly observed using biophysical approaches
(Fig 1), is not detectable by FRET (Fig 4), and requires both the C2 and C1a domain (Figs 2 and 3). Calcium plus liposomes containing DAG result in
intermolecular FRET between PKC–mCit (Fig 4), but require the full-length protein and not just the C2 domain (presumably requires C1 domains
which are only known DAG binding sites; Fig 6). Calcium plus liposomes containing PI(4,5)P2 result in intermolecular FRET and the C2 domain is
sufficient for this result (Fig 6). Schematic is organized to parallel schematics initially describing supramolecular structures proposed by John-Marie
Lehn [39].
doi:10.1371/journal.pone.0162331.g007
PKC Self-Assembly
PLOS ONE | DOI:10.1371/journal.pone.0162331 October 5, 2016 16 / 21
anticipated to be slower than calcium sensitive PKCs [41]. The ability for PKC to self-assembleon the surface of the plasma membrane and locally phosphorylate substrate (e.g. MARCKS)may facilitate localized recruitment of signalingmolecules. A recurring phenomenon in PKCbiology, especially in calcium sensitive PKCs, is the role in spatially organizing membranelocalized signaling hubs at, for example, focal adhesion complexes (both focal adhesion kinaseand vinculin bind to and cluster with PIP2 in vitro [42, 43]), or cell-cell junctions [10]. Wespeculate that self-assembly of PKC can be functional interdependently of kinase activity byregulating the spatial localization of other signalingmolecules on short or long time scales.
Supporting Information
S1 Fig. D246N point mutation blocks calcium induced oligomerization of PKCα-mCit.Size exclusion chromatography elution profile of PKCα-mCit wild-type (A) or D246N (B)under indicated incubation conditions. (C) Differential fractionation of the same fusion pro-teins following a 30 min incubation with or without 300 μM free calcium. The soluble (S) andpelleted (P) fractions were run on an SDS-PAGE gel and imaged on a typhoon imager for mCitfluorescence. The fluorescent degradation products observed in gel-filtration will have effectson the quantification of some of the other experimental results. As protein concentration isnormalized by mCitrine fluorescence, the concentration of intact PKC protein will be less thananticipated. (i) For DLS, degradation components will lead to a lower ensemble mass predictedin both the EGTA and Calcium conditions. (ii)_For time resolved fluorescence anisotropy itwill lead to the ‘fraction 1’ parameter being artificially lower by the degree of fluorophores thatare incapable of self-assembling. (iii) For the coverslip assay, it will decrease the intensity ofPKC punctae Overall, it will lead to an underestimation of the effects of self-assembly.(EPS)
S2 Fig. Representative analysis of DLS data of PKCα-mCit in EGTA buffer. (A) The inten-sity autocorrelation data (blue dots) is fit by a regularizationmodel (black line) with residualsin bottom panel. (B) An isotropic spheres model is applied to calculate the distribution of parti-cle mass. This panel is representative of most experiments where two populations are observed,the predominant peak near the expectedmass of particles, and a second peak of much largerparticles that was not removed despite high-speedultracentrifugation immediately prior to themeasurement.(EPS)
S3 Fig. Two step growth of PKC oligomers. (A) The number of identified spots on a coverslipof PKCα-mCit (100 nM) with and without free calciumwas assessed at time points up to 60minutes. The data are fit to a linear regression for visualization. The points represent mean andstandard deviation of 4 images (left). A cumulative histogram of the mean intensity of eachspot normalized to the total intensity of the image from the corresponding images (right). (B)The concentration of PKCα-mCit was held constant (50 nM) and unlabeled PKCα (0, 50, 100,200, 400 nM) was added such that the concentration of PKCα (represented on the x-axis) isthe sum of the two species. The mean spot number and the mean intensity with standard devia-tion (6 images) of all the spots are plotted at 3 time points after the addition of free calcium.The mean intensity of the 450 nM PKCα condition at the 60 and 180 minute time points arenot reported due to saturation of spots in the imaging conditions. (C) A schematic depictingthe two processes in PKC self-assembly observed.The initial increase in spot number is theresult of nucleation events. The subsequent decrease in spot number as well as the increase inmean particles size is the result of smaller oligomers joining into larger oligomers.(EPS)
PKC Self-Assembly
PLOS ONE | DOI:10.1371/journal.pone.0162331 October 5, 2016 17 / 21
S4 Fig. Depletion of lipids in clarifiedHEK lysate. This experiment was conducted alongsidethe representative gel images in Fig 1E. A constant concentration of DiI, a lipophilic membranestain, was added to serial dilutions of a 1 mg/mL stock solution of POPC sonicated in lysisbuffer. The sample was excited at 521 nm and DiI emission was monitored from 550 nm– 610nm. A matched DiI free spectra was measured and subtracted from the DiI sample.The back-ground corrected spectra was integrated and plotted above. The serial dilution is fit to a linearcurve (black line). A matched protocol was applied to the HEK lysate and clarifiedHEK lysate.The measured DiI intensities are represented by the dashed lines.(EPS)
S5 Fig. Separating the C1 and C2 domains eliminates calciumclustering on coverslip. (A)A schematic shows the modular strategy by which we previously created three PKCα biosen-sors. All three biosensors specifically clustered in the presence of calcium. (B) We then usedTEV protease to site specifically generate two peptide fragments, the N-terminus always con-taining the mCer, and the C-terminus the mCit fluorophore. We then took two images of eachsample using a dual view emission splitter optimized for mCer and mCit, with two excitationsoptimized for mCer and mCit. In total 4 images of each field of viewwere obtained (mCer exci-tation: mCer emission; mCer excitation: mCit emission; mCit excitation: mCer emission; mCitexcitation: mCit emission) of which we only analyzed the mCer excitation: mCer emission, andmCit excitation: mCit emission images which had negligible cross excitation and bleed throughfor the purposes of our spot identifier program. The spot numbers for both channels aredepicted normalized to the mean number of spots in the corresponding non-TEV treated sam-ple (4 images in each channel/ condition).(EPS)
S6 Fig. D55A and R252A do not disrupt C1a –C2 interactions.Experiment were performedas described in Fig 3E with the indicated point mutants.(EPS)
S7 Fig. Reversible FRET between full-lengthPKC on liposomes.Bi-molecular heteroFRETbetween the indicated protein (40 nM donor and 120 nM acceptor) was monitored followingthe sequential addition of buffer containing free calcium (green) or EGTA (black). Liposomeswere made from porcine polar brain extract with 2% w/wDAG as describedpreviously [14].Shown is the mean and standard deviation of N = 7 experiments. Association and dissociationwere fit to single exponential functions (not shown). The τ’s for assembly and disassembly is12.9 ± 1.7 and 10.7 ± 0.5 seconds, respectively (mean and standard deviation).(EPS)
S1 Table. Values from TCSPC and DWR analysis. Fluorescence lifetime of the sampleobtained at the magic angle was fit by a single exponential function. The lifetime value was con-strained as the anisotropy profile was fit to a 2-exponential functionwhere the two correlationtime parameters and the fractional contribution of the faster correlation time were co-esti-mated. Initial and final anisotropies were constrained to 0.4 and 0, respectively. For the condi-tions with only one reported correlation time, only a single correlation time was resolved bythe fit (i.e., the fraction of the faster component was zero). Steady-state anisotropy was calcu-lated as the fluorescenceweighted average of the anisotropy decay given by the best-fit parame-ters. Standard errors of the fit (67% confidence interval) are listed in brackets.(DOCX)
S2 Table. Data used for statistics throughout themanuscript.(XLSX)
PKC Self-Assembly
PLOS ONE | DOI:10.1371/journal.pone.0162331 October 5, 2016 18 / 21
S1 Text. Analysis supplemental to results in Fig 1.(DOCX)
Acknowledgments
DLS experiments were performed using the Biophysics Program common research facilities atthe University of Michigan with acknowledgment to Samuel Kotler and A. Rams Rama-moorthy for technical advice and assistance with the instrument. Thomas van Zanten andSatyajit Mayor provided valuable feedback on the manuscript preparation and performed pre-liminary time-resolved fluorescence experiments. The reported time-resolved fluorescencemeasurements were performed in the Biophysical Technology Center, University of Minne-sota, with support from an NIH Small Business Technology Transfer grant (R42 DA037622).This study was supported by the American Heart Association Scientist Development Grant(13SDG14270009) & the NIH (1DP2 CA186752-01 & 1-R01-GM-105646-01-A1) to S.S. K.J.P.was supported by an NIH training grant (T32 AR007612). R.F.S. is a Life Sciences ResearchFoundation postdoctoral fellow.
Author Contributions
Conceptualization:CJS SS.
Formal analysis:CJS KJP JK DDT SS.
Funding acquisition:DDT SS.
Methodology:CJS RFSMR KJP DDT SS.
Resources:DDT SS.
Software:DDT SS.
Supervision:DDT SS.
Writing – original draft:CJS SS.
Writing – review& editing: RFSMR KJP JK DDT.
References1. Ellis RJ, Minton AP. Cell biology: join the crowd. Nature. 2003; 425(6953):27–8. doi: 10.1038/425027a
PMID: 12955122.
2. Csete ME, Doyle JC. Reverse engineering of biological complexity. Science. 2002; 295(5560):1664–9.
doi: 10.1126/science.1069981 PMID: 11872830.
3. Bhattacharyya RP, Remenyi A, Yeh BJ, Lim WA. Domains, motifs, and scaffolds: the role of modular
interactions in the evolution and wiring of cell signaling circuits. Annual review of biochemistry. 2006;
75:655–80. doi: 10.1146/annurev.biochem.75.103004.142710 PMID: 16756506.
4. Whitesides GM, Grzybowski B. Self-assembly at all scales. Science. 2002; 295(5564):2418–21. doi:
10.1126/science.1070821 PMID: 11923529.
5. Brodsky FM, Chen CY, Knuehl C, Towler MC, Wakeham DE. Biological basket weaving: formation
and function of clathrin-coated vesicles. Annual review of cell and developmental biology. 2001;
17:517–68. doi: 10.1146/annurev.cellbio.17.1.517 PMID: 11687498.
6. Pollard TD. Regulation of actin filament assembly by Arp2/3 complex and formins. Annu Rev Biophys
Biomol Struct. 2007; 36:451–77. doi: 10.1146/annurev.biophys.35.040405.101936 PMID: 17477841.
7. Karsenti E, Vernos I. The mitotic spindle: a self-made machine. Science. 2001; 294(5542):543–7. doi:
10.1126/science.1063488 PMID: 11641489.
PKC Self-Assembly
PLOS ONE | DOI:10.1371/journal.pone.0162331 October 5, 2016 19 / 21
8. Steinberg SF. Structural basis of protein kinase C isoform function. Physiological reviews. 2008; 88
(4):1341–78. doi: 10.1152/physrev.00034.2007 PMID: 18923184; PubMed Central PMCID:
PMC2899688.
9. Newton AC. Protein kinase C: structural and spatial regulation by phosphorylation, cofactors, and mac-
romolecular interactions. Chem Rev. 2001; 101(8):2353–64. doi: 10.1021/cr0002801 PMID:
11749377.
10. Rosse C, Linch M, Kermorgant S, Cameron AJ, Boeckeler K, Parker PJ. PKC and the control of local-
ized signal dynamics. Nat Rev Mol Cell Biol. 2010; 11(2):103–12. Epub 2010/01/23. doi: 10.1038/
nrm2847 PMID: 20094051.
11. Reither G, Schaefer M, Lipp P. PKCalpha: a versatile key for decoding the cellular calcium toolkit. J
Cell Biol. 2006; 174(4):521–33. doi: 10.1083/jcb.200604033 PMID: 16893971; PubMed Central
PMCID: PMC2064258.
12. Maasch C, Wagner S, Lindschau C, Alexander G, Buchner K, Gollasch M, et al. Protein kinase calpha
targeting is regulated by temporal and spatial changes in intracellular free calcium concentration [Ca(2
+)](i). FASEB J. 2000; 14(11):1653–63. doi: 10.1096/fj.14.11.1653 PMID: 10929000.
13. Evans JH, Murray D, Leslie CC, Falke JJ. Specific translocation of protein kinase Calpha to the plasma
membrane requires both Ca2+ and PIP2 recognition by its C2 domain. Molecular biology of the cell.
2006; 17(1):56–66. doi: 10.1091/mbc.E05-06-0499 PMID: 16236797; PubMed Central PMCID:
PMC1345646.
14. Swanson CJ, Ritt M, Wang W, Lang MJ, Narayan A, Tesmer JJ, et al. Conserved modular domains
team up to latch-open active protein kinase Calpha. The Journal of biological chemistry. 2014; 289
(25):17812–29. doi: 10.1074/jbc.M113.534750 PMID: 24790081; PubMed Central PMCID:
PMC4067214.
15. Sivaramakrishnan S, Spudich JA. Systematic control of protein interaction using a modular ER/K
alpha-helix linker. Proceedings of the National Academy of Sciences of the United States of America.
2011; 108(51):20467–72. doi: 10.1073/pnas.1116066108 PMID: 22123984; PubMed Central PMCID:
PMC3251109.
16. Muretta JM, Kyrychenko A, Ladokhin AS, Kast DJ, Gillispie GD, Thomas DD. High-performance time-
resolved fluorescence by direct waveform recording. The Review of scientific instruments. 2010; 81
(10):103101. doi: 10.1063/1.3480647 PMID: 21034069; PubMed Central PMCID: PMC2980540.
17. Muretta JM, Petersen KJ, Thomas DD. Direct real-time detection of the actin-activated power stroke
within the myosin catalytic domain. Proc Natl Acad Sci U S A. 2013; 110(18):7211–6. doi: 10.1073/
pnas.1222257110 PMID: 23589853; PubMed Central PMCID: PMC3645529.
18. Petersen KJ, Peterson KC, Muretta JM, Higgins SE, Gillispie GD, Thomas DD. Fluorescence lifetime
plate reader: resolution and precision meet high-throughput. The Review of scientific instruments.
2014; 85(11):113101. doi: 10.1063/1.4900727 PMID: 25430092; PubMed Central PMCID:
PMC4242087.
19. Ghosh S, Saha S, Goswami D, Bilgrami S, Mayor S. Dynamic imaging of homo-FRET in live cells by
fluorescence anisotropy microscopy. Methods Enzymol. 2012; 505:291–327. doi: 10.1016/B978-0-12-
388448-0.00024–3 PMID: 22289460.
20. Huang SM, Leventhal PS, Wiepz GJ, Bertics PJ. Calcium and phosphatidylserine stimulate the self-
association of conventional protein kinase C isoforms. Biochemistry. 1999; 38(37):12020–7. Epub
1999/10/03. bi990594m [pii]. doi: 10.1021/bi990594m PMID: 10508405.
21. Medkova M, Cho W. Mutagenesis of the C2 domain of protein kinase C-alpha. Differential roles of Ca2
+ ligands and membrane binding residues. J Biol Chem. 1998; 273(28):17544–52. doi: 10.1074/jbc.
273.28.17544 PMID: 9651347.
22. Clapham DE. Calcium signaling. Cell. 2007; 131(6):1047–58. doi: 10.1016/j.cell.2007.11.028 PMID:
18083096.
23. Egea-Jimenez AL, Fernandez-Martinez AM, Perez-Lara A, de Godos A, Corbalan-Garcia S, Gomez-
Fernandez JC. Phosphatidylinositol-4,5-bisphosphate enhances anionic lipid demixing by the C2
domain of PKCalpha. PLoS One. 2014; 9(4):e95973. doi: 10.1371/journal.pone.0095973 PMID:
24763383; PubMed Central PMCID: PMC3999146.
24. Sutton RB, Sprang SR. Structure of the protein kinase Cbeta phospholipid-binding C2 domain com-
plexed with Ca2+. Structure. 1998; 6(11):1395–405. doi: 10.1016/s0969-2126(98)00139-7 PMID:
9817842.
25. Chapman ER, An S, Edwardson JM, Jahn R. A novel function for the second C2 domain of synaptotag-
min. Ca2+-triggered dimerization. J Biol Chem. 1996; 271(10):5844–9. doi: 10.1074/jbc.271.10.5844
PMID: 8621455.
PKC Self-Assembly
PLOS ONE | DOI:10.1371/journal.pone.0162331 October 5, 2016 20 / 21
26. Xu L, Pallikkuth S, Hou Z, Mignery GA, Robia SL, Han R. Dysferlin forms a dimer mediated by the C2
domains and the transmembrane domain in vitro and in living cells. PLoS One. 2011; 6(11):e27884.
doi: 10.1371/journal.pone.0027884 PMID: 22110769; PubMed Central PMCID: PMC3215728.
27. Ramakrishnan NA, Drescher MJ, Morley BJ, Kelley PM, Drescher DG. Calcium regulates molecular
interactions of otoferlin with soluble NSF attachment protein receptor (SNARE) proteins required for
hair cell exocytosis. J Biol Chem. 2014; 289(13):8750–66. doi: 10.1074/jbc.M113.480533 PMID:
24478316; PubMed Central PMCID: PMC3979417.
28. Kang CH, Moon BC, Park HC, Koo SC, Chi YH, Cheong YH, et al. Rice small C2-domain proteins are
phosphorylated by calcium-dependent protein kinase. Molecules and cells. 2013; 35(5):381–7. doi: 10.
1007/s10059-013-2185-0 PMID: 23456295; PubMed Central PMCID: PMC3887858.
29. Stahelin RV, Wang J, Blatner NR, Rafter JD, Murray D, Cho W. The origin of C1A-C2 interdomain
interactions in protein kinase Calpha. The Journal of biological chemistry. 2005; 280(43):36452–63.
doi: 10.1074/jbc.M506224200 PMID: 16079140.
30. Slater SJ, Seiz JL, Cook AC, Buzas CJ, Malinowski SA, Kershner JL, et al. Regulation of PKC alpha
activity by C1-C2 domain interactions. The Journal of biological chemistry. 2002; 277(18):15277–85.
doi: 10.1074/jbc.M112207200 PMID: 11850425.
31. Gautier I, Tramier M, Durieux C, Coppey J, Pansu RB, Nicolas JC, et al. Homo-FRET microscopy in liv-
ing cells to measure monomer-dimer transition of GFP-tagged proteins. Biophys J. 2001; 80(6):3000–
8. doi: 10.1016/S0006-3495(01)76265-0 PMID: 11371472; PubMed Central PMCID: PMC1301483.
32. Sharma P, Varma R, Sarasij RC, Ira, Gousset K, Krishnamoorthy G, et al. Nanoscale organization of
multiple GPI-anchored proteins in living cell membranes. Cell. 2004; 116(4):577–89. doi: 10.1016/
s0092-8674(04)00167-9 PMID: 14980224.
33. Sando JJ, Chertihin OI, Owens JM, Kretsinger RH. Contributions to maxima in protein kinase C activa-
tion. J Biol Chem. 1998; 273(51):34022–7. Epub 1998/12/16. doi: 10.1074/jbc.273.51.34022 PMID:
9852057.
34. Yang L, Glaser M. Formation of membrane domains during the activation of protein kinase C. Bio-
chemistry. 1996; 35(44):13966–74. Epub 1996/11/05. doi: 10.1021/bi9610008 PMID: 8909294.
35. Egea-Jimenez AL, Perez-Lara A, Corbalan-Garcia S, Gomez-Fernandez JC. Phosphatidylinositol 4,5-
bisphosphate decreases the concentration of Ca2+, phosphatidylserine and diacylglycerol required for
protein kinase C alpha to reach maximum activity. PLoS One. 2013; 8(7):e69041. doi: 10.1371/journal.
pone.0069041 PMID: 23874859; PubMed Central PMCID: PMC3707892.
36. Wang YH, Collins A, Guo L, Smith-Dupont KB, Gai F, Svitkina T, et al. Divalent cation-induced cluster
formation by polyphosphoinositides in model membranes. J Am Chem Soc. 2012; 134(7):3387–95.
doi: 10.1021/ja208640t PMID: 22280226; PubMed Central PMCID: PMC3445022.
37. Lehn JM. Toward complex matter: supramolecular chemistry and self-organization. Proc Natl Acad Sci
U S A. 2002; 99(8):4763–8. Epub 2002/04/04. doi: 10.1073/pnas.072065599 PMID: 11929970;
PubMed Central PMCID: PMC122664.
38. Lam AJ, St-Pierre F, Gong Y, Marshall JD, Cranfill PJ, Baird MA, et al. Improving FRET dynamic range
with bright green and red fluorescent proteins. Nature methods. 2012; 9(10):1005–12. doi: 10.1038/
nmeth.2171 PMID: 22961245; PubMed Central PMCID: PMC3461113.
39. Lehn JM. Supramolecular chemistry: receptors, catalysts, and carriers. Science. 1985; 227
(4689):849–56. doi: 10.1126/science.227.4689.849 PMID: 17821215.
40. Ziemba BP, Burke JE, Masson G, Williams RL, Falke JJ. Regulation of PI3K by PKC and MARCKS:
Single-Molecule Analysis of a Reconstituted Signaling Pathway. Biophys J. 2016; 110(8):1811–25.
doi: 10.1016/j.bpj.2016.03.001 PMID: 27119641; PubMed Central PMCID: PMC4850241.
41. Gamper N, Shapiro MS. Target-specific PIP(2) signalling: how might it work? The Journal of physiol-
ogy. 2007; 582(Pt 3):967–75. doi: 10.1113/jphysiol.2007.132787 PMID: 17412762; PubMed Central
PMCID: PMC2075238.
42. Chinthalapudi K, Rangarajan ES, Patil DN, George EM, Brown DT, Izard T. Lipid binding promotes
oligomerization and focal adhesion activity of vinculin. J Cell Biol. 2014; 207(5):643–56. doi: 10.1083/
jcb.201404128 PMID: 25488920; PubMed Central PMCID: PMC4259812.
43. Goni GM, Epifano C, Boskovic J, Camacho-Artacho M, Zhou J, Bronowska A, et al. Phosphatidylinosi-
tol 4,5-bisphosphate triggers activation of focal adhesion kinase by inducing clustering and conforma-
tional changes. Proc Natl Acad Sci U S A. 2014; 111(31):E3177–86. doi: 10.1073/pnas.1317022111
PMID: 25049397; PubMed Central PMCID: PMC4128148.
PKC Self-Assembly
PLOS ONE | DOI:10.1371/journal.pone.0162331 October 5, 2016 21 / 21

![Ethernet - Amirkabir University of Technologybme2.aut.ac.ir/~towhidkhah/MPC/seminars-ppt/seminar... · Ethernet was developed at Xerox PARC between 1973 and 1974.[1][2] It was inspired](https://static.fdocument.org/doc/165x107/5e8574eb8427ad2de61103b7/ethernet-amirkabir-university-of-towhidkhahmpcseminars-pptseminar-ethernet.jpg)