BRD7389 paper
12
Small-molecule inducers of insulin expression in pancreatic α-cells Dina Fomina-Yadlin a,b,c,1 , Stefan Kubicek a,b,1 , Deepika Walpita b , Vlado Dan cik b,d , Jacob Hecksher-Sørensen b,2 , Joshua A. Bittker b , Tanaz Sharifnia b,e , Alykhan Shamji b , Paul A. Clemons b , Bridget K. Wagner b , and Stuart L. Schreiber a,b,f,3 a Howard Hughes Medical Institute, b Broad Institute of Harvard and Massachusetts Institute of Technology, Cambridge, MA 02142; c Department of Molecular and Cellular Biology, Harvard University, Cambridge, MA 02138; d Mathematical Institute, Slovak Academy of Sciences, Košice, 040 01, Slovakia; e Department Biological and Biomedical Sciences, Harvard Medical School, Boston, MA 02115; and f Department of Chemistry and Chemical Biology, Harvard University, Cambridge, MA 02138 Contributed by Stuart L. Schreiber, July 15, 2010 (sent for review June 22, 2010) High-content screening for small-molecule inducers of insulin expression identied the compound BRD7389, which caused α-cells to adopt several morphological and gene expression features of a β-cell state. Assay-performance prole analysis suggests kinase inhibition as a mechanism of action, and we show that biochemical and cellular inhibition of the RSK kinase family by BRD7389 is likely related to its ability induce a β-cell-like state. BRD7389 also in- creases the endocrine cell content and function of donor human pancreatic islets in culture. BRD7389 | pancreatic islets | Rsk kinase | transdifferentiation | beta cells T ype 1 diabetes is an autoimmune disease characterized by the loss of insulin-producing β-cells in pancreatic islets of Lang- erhans. Islet transplantation into the liver can effectively cure the disease (1), but is not an ideal treatment due to limited donor material and immunological complications. An alternative ap- proach, not yet feasible, is to create new β-cells (2), either by stepwise differentiation of undifferentiated stem or stem-like cells (3), or by transdifferentiation (4), the heritable change of cell identity to an insulin-producing (β-like) cell. The latter approach could result in a replacement source for the decient cell type directly from patient material (either in vivo or ex vivo). Increasing β-cell mass by small-molecule drug-induced transdifferentiation is a speculative but exciting approach to treating diabetes—one that is signicantly different from currently available small-molecule drugs that increase insulin secretion in existing β-cells and are therefore ineffective in the later stages of type 1 diabetes, in which most β-cell mass has been lost. Cell-type specication in the pancreas is regulated by a set of master regulatory transcription factors that control the transition from one progenitor cell state to the next, ultimately yielding mature endocrine cell types in islets (5). Recently, it has been shown that misexpression of these master regulatory transcription factors causes direct transdifferentiation between cell types. For example, ectopic overexpression of a single transcription factor (Arx) is sufcient for in vivo conversion of β-cells to α-cells in the adult mouse pancreas (6). Similarly, viral delivery of three tran- scription factors (Pdx1, Ngn3, MafA) to an adult mouse pancreas causes the transdifferentiation of acinar cells to β-cells (7). Finally, in vivo conversion of α-cells to β-cells has recently been achieved in mature mouse α-cells by ectopic overexpression of Pax4 (8). Results Because a single gene is sufcient to induce transdifferentiation of α-cells to β-cells, we sought to determine whether a small molecule could have the same effect. Possible readouts for induction of a β- cell state include insulin production and insulin secretion. We chose to target the production of insulin protein because we imagined that this would be more feasible to achieve in the course of a 3-d small-molecule treatment than insulin secretion. To that end, we developed a high-content, cell-based assay to detect in- sulin protein expression in the mouse α-cell line αTC1. Normal mouse α-cells are insulin negative, but have the ability to adopt a β-cell phenotype after extreme β-cell loss (9). Similarly, the α-cell line we used spontaneously reexpressed small but detectable levels of insulin, despite being a subclone selected for low insulin protein (10). During assay development and optimization, we could show, by spiking in β-cells and by antibody competition, that our assay was sensitive enough to reliably detect insulin levels in as few as 3% of cells, and at 15-fold lower levels than in β-cells (Fig. S1). We screened 30,710 compounds for induction of insulin pro- duction using this assay and identied a molecule, BRD7389 (Fig. 1A), that after 3-d treatment induced insulin expression in mouse α-cells. BRD7389 induced a dose-dependent up-regulation of Ins2 mRNA, peaking at ≈0.85 M; 5-d treatment with BRD7389 resulted in greater induction of insulin gene expression, about 50- fold at 0.85 M (Fig. 1B), which could not be further increased by longer treatments up to 21 d. This compound appears to be spe- cic to α-cells, because a pancreatic ductal cell line (PANC-1) showed no induction, and a mouse β-cell line (βTC3) no further increase of insulin expression. In addition to insulin expression, BRD7389 signicantly up-regulated expression of Pdx1 (Fig. 1C), a master regulatory transcription factor that species pancreatic progenitors and directly activates the insulin promoter (11). We also observed a dose-dependent increase in the expression of other β-cell markers, including Pax4, Iapp, and Npy, after a 5-d treatment with BRD7389 (Fig. S2). Treatment with BRD7389 caused a stable change in cell shape from a broblast-like morphology, characteristic of α-cells, to a clustered state resembling β-cells in culture (Fig. 1 D–F, Left). Finally, we detected low levels of insulin protein in compound- treated α-cells by immunouorescence (Fig. 1 D–F, Right). Rela- tive to background uorescence in DMSO-treated α-cells, insulin staining is induced 1.5-fold following 5-d treatment with BRD7389, compared with 4-fold higher levels in β-cells. Both insulin mRNA and protein levels are signicantly increased from a basal α-cell state in compound-treated cells, but do no reach levels detected in mature β-cells. Therefore, although these cells have not achieved a β-cell state, they have adopted several features of β-cells. To identify the mechanism of action of BRD7389, we used screening data in ChemBank (12) to compare assay performance Author contributions: D.F.-Y., S.K., J.H.-S., B.K.W., and S.L.S. designed research; D.F.-Y., S.K., and T.S. performed research; D.W. and V.D. contributed new reagents/analytic tools; D.F.-Y., S.K., J.A.B., and P.A.C. analyzed data; and D.F.-Y., S.K., A.S., B.K.W., and S.L.S wrote the paper. The authors declare no conict of interest. Freely available online through the PNAS open access option. 1 D.F.-Y. and S.K. contributed equally to this work. 2 Present address: Hagedorn Research Institute, DK-2820 Gentofte, Denmark. 3 To whom correspondence should be addressed. E-mail: [email protected]. This article contains supporting information online at www.pnas.org/lookup/suppl/doi:10. 1073/pnas.1010018107/-/DCSupplemental. www.pnas.org/cgi/doi/10.1073/pnas.1010018107 PNAS | August 24, 2010 | vol. 107 | no. 34 | 15099–15104 CELL BIOLOGY
-
Upload
dina-a-fomina-yadlin-phd -
Category
Documents
-
view
30 -
download
0
Transcript of BRD7389 paper
Small-molecule inducers of insulin expression inpancreatic !-cellsDina Fomina-Yadlina,b,c,1, Stefan Kubiceka,b,1, Deepika Walpitab, Vlado Dan!cikb,d, Jacob Hecksher-Sørensenb,2,Joshua A. Bittkerb, Tanaz Sharifniab,e, Alykhan Shamjib, Paul A. Clemonsb, Bridget K. Wagnerb, andStuart L. Schreibera,b,f,3
aHoward Hughes Medical Institute, bBroad Institute of Harvard and Massachusetts Institute of Technology, Cambridge, MA 02142; cDepartment of Molecularand Cellular Biology, Harvard University, Cambridge, MA 02138; dMathematical Institute, Slovak Academy of Sciences, Ko!ice, 040 01, Slovakia; eDepartmentBiological and Biomedical Sciences, Harvard Medical School, Boston, MA 02115; and fDepartment of Chemistry and Chemical Biology, Harvard University,Cambridge, MA 02138
Contributed by Stuart L. Schreiber, July 15, 2010 (sent for review June 22, 2010)
High-content screening for small-molecule inducers of insulinexpression identi!ed the compound BRD7389, which caused !-cellsto adopt several morphological and gene expression features ofa "-cell state. Assay-performance pro!le analysis suggests kinaseinhibition as a mechanism of action, and we show that biochemicaland cellular inhibition of the RSK kinase family by BRD7389 is likelyrelated to its ability induce a "-cell-like state. BRD7389 also in-creases the endocrine cell content and function of donor humanpancreatic islets in culture.
BRD7389 | pancreatic islets | Rsk kinase | transdifferentiation | beta cells
Type 1 diabetes is an autoimmune disease characterized by theloss of insulin-producing !-cells in pancreatic islets of Lang-
erhans. Islet transplantation into the liver can effectively cure thedisease (1), but is not an ideal treatment due to limited donormaterial and immunological complications. An alternative ap-proach, not yet feasible, is to create new !-cells (2), either bystepwise differentiation of undifferentiated stem or stem-like cells(3), or by transdifferentiation (4), the heritable change of cellidentity to an insulin-producing (!-like) cell. The latter approachcould result in a replacement source for the de!cient cell typedirectly frompatientmaterial (either in vivo or ex vivo). Increasing!-cell mass by small-molecule drug-induced transdifferentiation isa speculative but exciting approach to treating diabetes—one thatis signi!cantly different from currently available small-moleculedrugs that increase insulin secretion in existing !-cells and aretherefore ineffective in the later stages of type 1 diabetes, in whichmost !-cell mass has been lost.Cell-type speci!cation in the pancreas is regulated by a set of
master regulatory transcription factors that control the transitionfrom one progenitor cell state to the next, ultimately yieldingmature endocrine cell types in islets (5). Recently, it has beenshown that misexpression of these master regulatory transcriptionfactors causes direct transdifferentiation between cell types. Forexample, ectopic overexpression of a single transcription factor(Arx) is suf!cient for in vivo conversion of !-cells to "-cells in theadult mouse pancreas (6). Similarly, viral delivery of three tran-scription factors (Pdx1, Ngn3, MafA) to an adult mouse pancreascauses the transdifferentiation of acinar cells to !-cells (7). Finally,in vivo conversion of "-cells to !-cells has recently been achieved inmature mouse "-cells by ectopic overexpression of Pax4 (8).
ResultsBecause a single gene is suf!cient to induce transdifferentiation of"-cells to !-cells, we sought to determine whether a small moleculecould have the same effect. Possible readouts for induction of a !-cell state include insulin production and insulin secretion. Wechose to target the production of insulin protein because weimagined that this would be more feasible to achieve in the courseof a 3-d small-molecule treatment than insulin secretion. To thatend, we developed a high-content, cell-based assay to detect in-
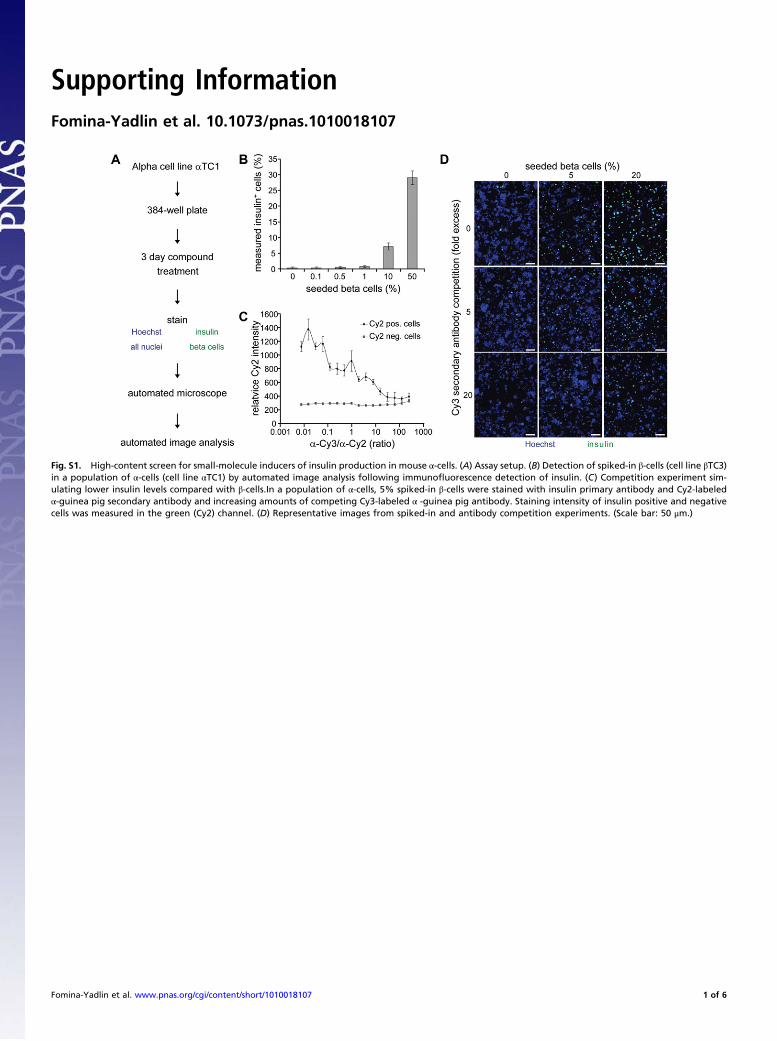
sulin protein expression in the mouse "-cell line "TC1. Normalmouse "-cells are insulin negative, but have the ability to adopta !-cell phenotype after extreme !-cell loss (9). Similarly, the "-cellline we used spontaneously reexpressed small but detectable levelsof insulin, despite being a subclone selected for low insulin protein(10). During assay development and optimization, we could show,by spiking in !-cells and by antibody competition, that our assaywas sensitive enough to reliably detect insulin levels in as few as3% of cells, and at 15-fold lower levels than in !-cells (Fig. S1).We screened 30,710 compounds for induction of insulin pro-
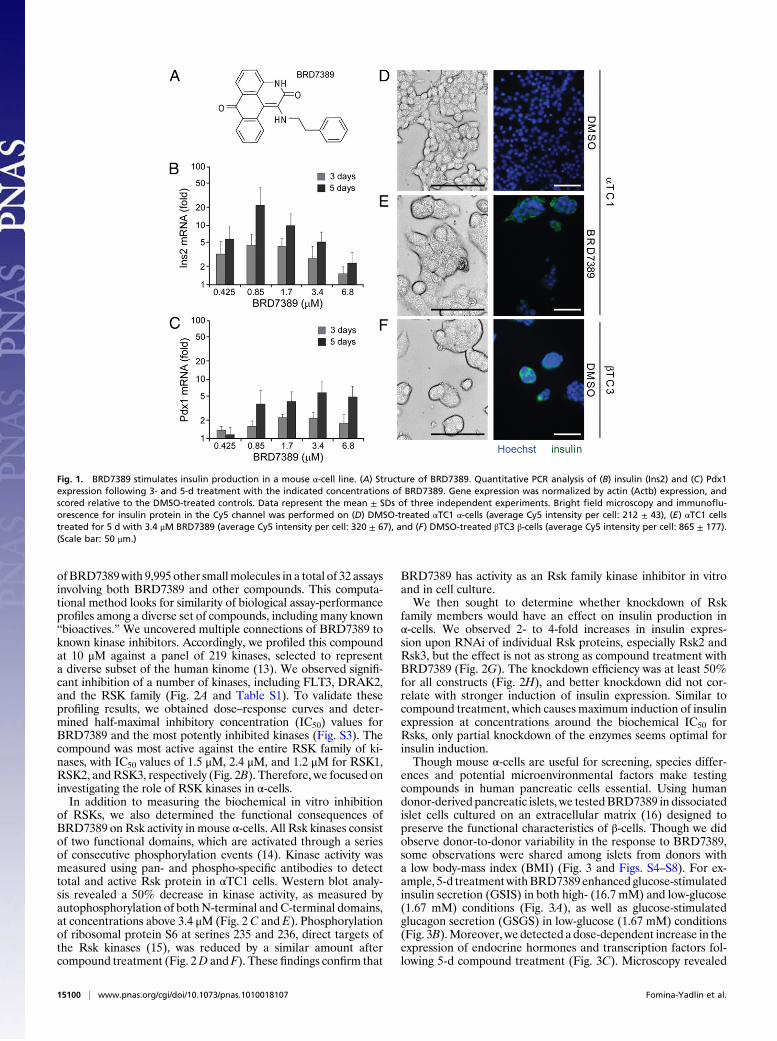
duction using this assay and identi!ed a molecule, BRD7389 (Fig.1A), that after 3-d treatment induced insulin expression in mouse"-cells. BRD7389 induced a dose-dependent up-regulation ofIns2 mRNA, peaking at !0.85 #M; 5-d treatment with BRD7389resulted in greater induction of insulin gene expression, about 50-fold at 0.85 #M (Fig. 1B), which could not be further increased bylonger treatments up to 21 d. This compound appears to be spe-ci!c to "-cells, because a pancreatic ductal cell line (PANC-1)showed no induction, and a mouse !-cell line (!TC3) no furtherincrease of insulin expression. In addition to insulin expression,BRD7389 signi!cantly up-regulated expression of Pdx1 (Fig. 1C),a master regulatory transcription factor that speci!es pancreaticprogenitors and directly activates the insulin promoter (11). Wealso observed a dose-dependent increase in the expression ofother !-cell markers, including Pax4, Iapp, and Npy, after a 5-dtreatment with BRD7389 (Fig. S2).Treatment with BRD7389 caused a stable change in cell shape
from a !broblast-like morphology, characteristic of "-cells, toa clustered state resembling !-cells in culture (Fig. 1 D–F, Left).Finally, we detected low levels of insulin protein in compound-treated "-cells by immuno"uorescence (Fig. 1 D–F, Right). Rela-tive to background "uorescence in DMSO-treated "-cells, insulinstaining is induced 1.5-fold following 5-d treatment withBRD7389,compared with 4-fold higher levels in !-cells. Both insulin mRNAand protein levels are signi!cantly increased from a basal "-cellstate in compound-treated cells, but do no reach levels detected inmature !-cells. Therefore, although these cells have not achieveda !-cell state, they have adopted several features of !-cells.To identify the mechanism of action of BRD7389, we used
screening data in ChemBank (12) to compare assay performance
Author contributions: D.F.-Y., S.K., J.H.-S., B.K.W., and S.L.S. designed research; D.F.-Y.,S.K., and T.S. performed research; D.W. and V.D. contributed new reagents/analytic tools;D.F.-Y., S.K., J.A.B., and P.A.C. analyzed data; and D.F.-Y., S.K., A.S., B.K.W., and S.L.S wrotethe paper.
The authors declare no con!ict of interest.
Freely available online through the PNAS open access option.1D.F.-Y. and S.K. contributed equally to this work.2Present address: Hagedorn Research Institute, DK-2820 Gentofte, Denmark.3To whom correspondence should be addressed. E-mail: [email protected].
This article contains supporting information online at www.pnas.org/lookup/suppl/doi:10.1073/pnas.1010018107/-/DCSupplemental.
www.pnas.org/cgi/doi/10.1073/pnas.1010018107 PNAS | August 24, 2010 | vol. 107 | no. 34 | 15099–15104
CELL
BIOLO
GY
ofBRD7389with 9,995 other smallmolecules in a total of 32 assaysinvolving both BRD7389 and other compounds. This computa-tional method looks for similarity of biological assay-performancepro!les among a diverse set of compounds, including many known“bioactives.” We uncovered multiple connections of BRD7389 toknown kinase inhibitors. Accordingly, we pro!led this compoundat 10 #M against a panel of 219 kinases, selected to representa diverse subset of the human kinome (13). We observed signi!-cant inhibition of a number of kinases, including FLT3, DRAK2,and the RSK family (Fig. 2A and Table S1). To validate thesepro!ling results, we obtained dose–response curves and deter-mined half-maximal inhibitory concentration (IC50) values forBRD7389 and the most potently inhibited kinases (Fig. S3). Thecompound was most active against the entire RSK family of ki-nases, with IC50 values of 1.5 #M, 2.4 #M, and 1.2 #M for RSK1,RSK2, andRSK3, respectively (Fig. 2B). Therefore, we focused oninvestigating the role of RSK kinases in "-cells.In addition to measuring the biochemical in vitro inhibition
of RSKs, we also determined the functional consequences ofBRD7389 on Rsk activity in mouse "-cells. All Rsk kinases consistof two functional domains, which are activated through a seriesof consecutive phosphorylation events (14). Kinase activity wasmeasured using pan- and phospho-speci!c antibodies to detecttotal and active Rsk protein in "TC1 cells. Western blot analy-sis revealed a 50% decrease in kinase activity, as measured byautophosphorylation of both N-terminal and C-terminal domains,at concentrations above 3.4 #M (Fig. 2C and E). Phosphorylationof ribosomal protein S6 at serines 235 and 236, direct targets ofthe Rsk kinases (15), was reduced by a similar amount aftercompound treatment (Fig. 2D and F). These !ndings con!rm that
BRD7389 has activity as an Rsk family kinase inhibitor in vitroand in cell culture.We then sought to determine whether knockdown of Rsk
family members would have an effect on insulin production in"-cells. We observed 2- to 4-fold increases in insulin expres-sion upon RNAi of individual Rsk proteins, especially Rsk2 andRsk3, but the effect is not as strong as compound treatment withBRD7389 (Fig. 2G). The knockdown ef!ciency was at least 50%for all constructs (Fig. 2H), and better knockdown did not cor-relate with stronger induction of insulin expression. Similar tocompound treatment, which causes maximum induction of insulinexpression at concentrations around the biochemical IC50 forRsks, only partial knockdown of the enzymes seems optimal forinsulin induction.Though mouse "-cells are useful for screening, species differ-
ences and potential microenvironmental factors make testingcompounds in human pancreatic cells essential. Using humandonor-derived pancreatic islets, we testedBRD7389 in dissociatedislet cells cultured on an extracellular matrix (16) designed topreserve the functional characteristics of !-cells. Though we didobserve donor-to-donor variability in the response to BRD7389,some observations were shared among islets from donors witha low body-mass index (BMI) (Fig. 3 and Figs. S4–S8). For ex-ample, 5-d treatmentwithBRD7389 enhanced glucose-stimulatedinsulin secretion (GSIS) in both high- (16.7 mM) and low-glucose(1.67 mM) conditions (Fig. 3A), as well as glucose-stimulatedglucagon secretion (GSGS) in low-glucose (1.67 mM) conditions(Fig. 3B).Moreover, we detected a dose-dependent increase in theexpression of endocrine hormones and transcription factors fol-lowing 5-d compound treatment (Fig. 3C). Microscopy revealed
Fig. 1. BRD7389 stimulates insulin production in a mouse "-cell line. (A) Structure of BRD7389. Quantitative PCR analysis of (B) insulin (Ins2) and (C) Pdx1expression following 3- and 5-d treatment with the indicated concentrations of BRD7389. Gene expression was normalized by actin (Actb) expression, andscored relative to the DMSO-treated controls. Data represent the mean ± SDs of three independent experiments. Bright "eld microscopy and immuno!u-orescence for insulin protein in the Cy5 channel was performed on (D) DMSO-treated "TC1 "-cells (average Cy5 intensity per cell: 212 ± 43), (E) "TC1 cellstreated for 5 d with 3.4 #M BRD7389 (average Cy5 intensity per cell: 320 ± 67), and (F) DMSO-treated !TC3 !-cells (average Cy5 intensity per cell: 865 ± 177).(Scale bar: 50 #m.)
15100 | www.pnas.org/cgi/doi/10.1073/pnas.1010018107 Fomina-Yadlin et al.
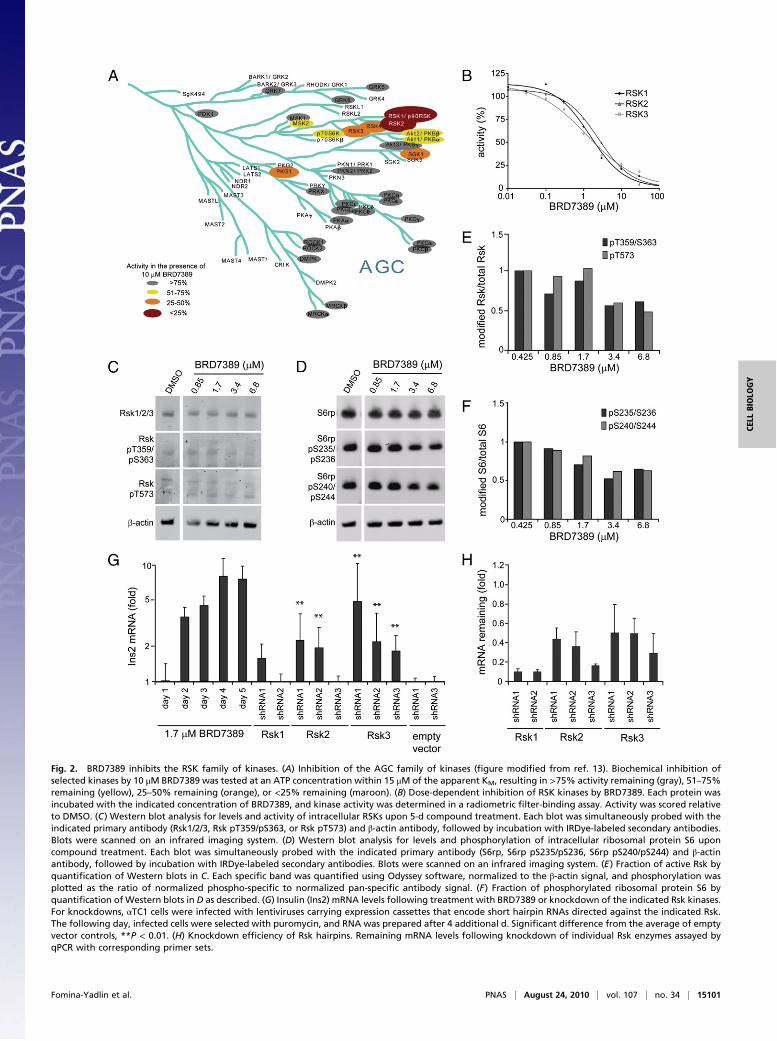
Fig. 2. BRD7389 inhibits the RSK family of kinases. (A) Inhibition of the AGC family of kinases ("gure modi"ed from ref. 13). Biochemical inhibition ofselected kinases by 10 #M BRD7389 was tested at an ATP concentration within 15 #M of the apparent KM, resulting in >75% activity remaining (gray), 51–75%remaining (yellow), 25–50% remaining (orange), or <25% remaining (maroon). (B) Dose-dependent inhibition of RSK kinases by BRD7389. Each protein wasincubated with the indicated concentration of BRD7389, and kinase activity was determined in a radiometric "lter-binding assay. Activity was scored relativeto DMSO. (C) Western blot analysis for levels and activity of intracellular RSKs upon 5-d compound treatment. Each blot was simultaneously probed with theindicated primary antibody (Rsk1/2/3, Rsk pT359/pS363, or Rsk pT573) and !-actin antibody, followed by incubation with IRDye-labeled secondary antibodies.Blots were scanned on an infrared imaging system. (D) Western blot analysis for levels and phosphorylation of intracellular ribosomal protein S6 uponcompound treatment. Each blot was simultaneously probed with the indicated primary antibody (S6rp, S6rp pS235/pS236, S6rp pS240/pS244) and !-actinantibody, followed by incubation with IRDye-labeled secondary antibodies. Blots were scanned on an infrared imaging system. (E) Fraction of active Rsk byquanti"cation of Western blots in C. Each speci"c band was quanti"ed using Odyssey software, normalized to the !-actin signal, and phosphorylation wasplotted as the ratio of normalized phospho-speci"c to normalized pan-speci"c antibody signal. (F) Fraction of phosphorylated ribosomal protein S6 byquanti"cation of Western blots in D as described. (G) Insulin (Ins2) mRNA levels following treatment with BRD7389 or knockdown of the indicated Rsk kinases.For knockdowns, "TC1 cells were infected with lentiviruses carrying expression cassettes that encode short hairpin RNAs directed against the indicated Rsk.The following day, infected cells were selected with puromycin, and RNA was prepared after 4 additional d. Signi"cant difference from the average of emptyvector controls, **P < 0.01. (H) Knockdown ef"ciency of Rsk hairpins. Remaining mRNA levels following knockdown of individual Rsk enzymes assayed byqPCR with corresponding primer sets.
Fomina-Yadlin et al. PNAS | August 24, 2010 | vol. 107 | no. 34 | 15101
CELL
BIOLO
GY
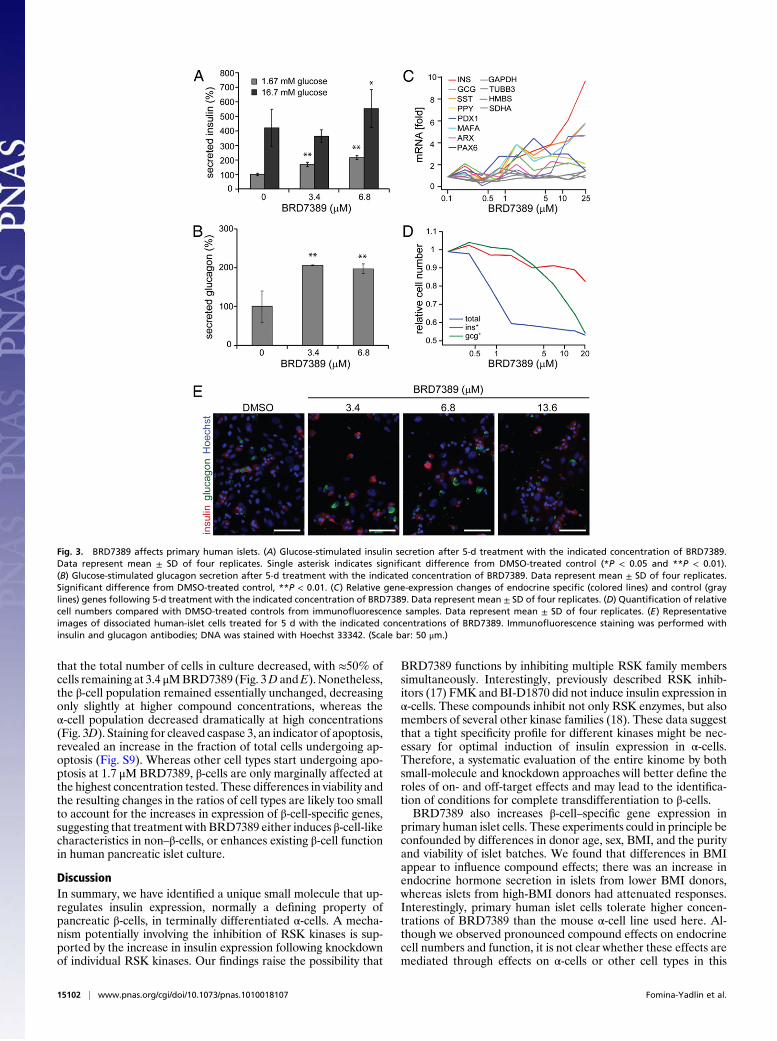
that the total number of cells in culture decreased, with !50% ofcells remaining at 3.4 #MBRD7389 (Fig. 3D andE). Nonetheless,the !-cell population remained essentially unchanged, decreasingonly slightly at higher compound concentrations, whereas the"-cell population decreased dramatically at high concentrations(Fig. 3D). Staining for cleaved caspase 3, an indicator of apoptosis,revealed an increase in the fraction of total cells undergoing ap-optosis (Fig. S9). Whereas other cell types start undergoing apo-ptosis at 1.7 #M BRD7389, !-cells are only marginally affected atthe highest concentration tested. These differences in viability andthe resulting changes in the ratios of cell types are likely too smallto account for the increases in expression of !-cell-speci!c genes,suggesting that treatment with BRD7389 either induces !-cell-likecharacteristics in non–!-cells, or enhances existing !-cell functionin human pancreatic islet culture.
DiscussionIn summary, we have identi!ed a unique small molecule that up-regulates insulin expression, normally a de!ning property ofpancreatic !-cells, in terminally differentiated "-cells. A mecha-nism potentially involving the inhibition of RSK kinases is sup-ported by the increase in insulin expression following knockdownof individual RSK kinases. Our !ndings raise the possibility that
BRD7389 functions by inhibiting multiple RSK family memberssimultaneously. Interestingly, previously described RSK inhib-itors (17) FMK and BI-D1870 did not induce insulin expression in"-cells. These compounds inhibit not only RSK enzymes, but alsomembers of several other kinase families (18). These data suggestthat a tight speci!city pro!le for different kinases might be nec-essary for optimal induction of insulin expression in "-cells.Therefore, a systematic evaluation of the entire kinome by bothsmall-molecule and knockdown approaches will better de!ne theroles of on- and off-target effects and may lead to the identi!ca-tion of conditions for complete transdifferentiation to !-cells.BRD7389 also increases !-cell–speci!c gene expression in
primary human islet cells. These experiments could in principle beconfounded by differences in donor age, sex, BMI, and the purityand viability of islet batches. We found that differences in BMIappear to in"uence compound effects; there was an increase inendocrine hormone secretion in islets from lower BMI donors,whereas islets from high-BMI donors had attenuated responses.Interestingly, primary human islet cells tolerate higher concen-trations of BRD7389 than the mouse "-cell line used here. Al-though we observed pronounced compound effects on endocrinecell numbers and function, it is not clear whether these effects aremediated through effects on "-cells or other cell types in this
Fig. 3. BRD7389 affects primary human islets. (A) Glucose-stimulated insulin secretion after 5-d treatment with the indicated concentration of BRD7389.Data represent mean ± SD of four replicates. Single asterisk indicates signi"cant difference from DMSO-treated control (*P < 0.05 and **P < 0.01).(B) Glucose-stimulated glucagon secretion after 5-d treatment with the indicated concentration of BRD7389. Data represent mean ± SD of four replicates.Signi"cant difference from DMSO-treated control, **P < 0.01. (C) Relative gene-expression changes of endocrine speci"c (colored lines) and control (graylines) genes following 5-d treatment with the indicated concentration of BRD7389. Data represent mean ± SD of four replicates. (D) Quanti"cation of relativecell numbers compared with DMSO-treated controls from immuno!uorescence samples. Data represent mean ± SD of four replicates. (E) Representativeimages of dissociated human-islet cells treated for 5 d with the indicated concentrations of BRD7389. Immuno!uorescence staining was performed withinsulin and glucagon antibodies; DNA was stained with Hoechst 33342. (Scale bar: 50 #m.)
15102 | www.pnas.org/cgi/doi/10.1073/pnas.1010018107 Fomina-Yadlin et al.
culture system. Future experiments involving in vivo !-cell abla-tion, lineage tracing in animal models, and puri!ed human "-cellswill help illuminate the effects of BRD7389 in greater detail.These !ndings show the feasibility of identifying compounds that
induce insulin expression in "-cells and suggest small-moleculeapproaches to increase !-cell mass by transdifferentiation in vivo.
Materials and MethodsReagents. Compound BRD7389 (kbsa-0113758) was obtained from AuroraFine Chemicals Ltd. All other reagents were obtained from Sigma Aldrichunless otherwise stated. Primers were bought from Euro"ns MWG Operon,except for Rsk2 and Rsk3 primers, which were ordered from Applied Bio-systems. Antibodies used in this study were insulin (Sigma I8510), glucagon(Sigma G2654), RSK1/RSK2/RSK3 (32D7; Cell Signaling Technology, CST 9355),phospho-p90RSK (Thr359/Ser363; CST 9344), phospho-p90RSK (Thr573; CST9346), S6 ribosomal protein (CST 2217), phospho-S6 ribosomal protein (Ser235/236; CST 2211), phospho-S6 ribosomal protein (Ser240/244; CST 2215), !-actin(Sigma A1978), and cleaved-caspase 3 (Abcam, ab13847). Fluorescently la-beled secondary antibodies were purchased from Jackson ImmunoResearch.IRDye antibodies for Western blots were purchased from Odyssey.
Cell and Human Islet Culture. Mouse pancreatic cell lines "TC1 and !TC3 weregrown in low-glucose DMEM supplemented with 10% FBS, 50 U/mL peni-cillin, and 50 #g/mL streptomycin.
Human islets were obtained through the Islet Cell Resource Consortium(http://icr.coh.org/) and through the National Disease Research Interchange(http://www.ndriresource.org/). The purity and viability of human islets arereported to be 70–93% and 70–98%, respectively, and the average age ofcadaveric donors was 40.7 ± 9.0 y (range 32–57 y; n = 6). Speci"c data onindividual donors is reported in Table S2. Islets were washed with PBS andincubated in CMRL medium supplemented with 10% FBS, 2 mM glutamine,100 U/mL penicillin, and 100 #g/mL streptomycin. Islets were gently dissoci-ated into a cell suspension by incubating in Accutase (37 °C, 10 min), andseeded in 96-well plates containing extracellular matrix secreted by theHTB9 human bladder carcinoma cell line [adapted from Beattie et al. (16)].
Compound treatments for both cell lines and primary human islet cultureswere performed as follows: cells were plated and allowed to adhere over-night, after which compound solutions in DMSO were added to achieve theindicated concentrations in 0.1% DMSO. For 5-d treatment, media waschanged and new compound added on day 3.
High-Content Screening. A total of 10,000 "TC1 cells per well were plated in50 #L media in black, optical bottom, tissue-culture-treated 384-well plates(Corning) and allowed to attach overnight. Compounds (100 nL per well)were pin-transferred from concentrated DMSO stocks. Three days after thebeginning of compound treatment, cells were "xed with 1% formaldehydein PBS for 30 min at room temperature. Following one wash with PBS, cellswere permeabilized by addition of 50 #L PBS-T (PBS supplemented with0.1% Triton X-100) for 60 min at room temperature and blocked with 2%BSA/PBS-T for 60 min. Twenty microliters of primary antiinsulin antibody,diluted 1:4,000 in 2% BSA/PBS-T, was added per well and incubated over-night at 4 °C. Following two PBS-T washes, 20 #L Cy-2–labeled donkey-"-guinea pig antibody diluted 1:500 in 2% BSA, 10 #g/mL Hoechst 33342/PBS-T was added per well and incubated for 1 h at room temperature in thedark. After two washes with 50 #L PBS-T, plates were stored in PBS in thedark at 4 °C until analysis.
Images were acquired on an ImageXpress Micro automated microscope(Molecular Devices) using a 4! objective (binning 2, gain 2), with laser- andimage-based focusing (offset "130 #m, range ±50 #m, step 25 #m). Imageswere exposed for 10 ms in the DAPI channel (Hoechst) and 500 ms in the GFPchannel (insulin). Image analysis was performed using the cell-scoring mod-ule of MetaXpress software (Molecular Devices). All nuclei were detectedwith aminimumwidth of 1 pixel, maximumwidth of 3 pixels, and an intensityof 200 gray levels above background. Cytoplasmic regions around thesenuclei were evaluated for Cy2 staining in the green GFP channel (minimumwidth of 5 pixels, maximum width of 30 pixels, intensity >200 gray levelsabove background, 10 #mminimum stained area). In total, 75,264 wells werescreened, corresponding to 30,710 unique compounds in duplicate pluscontrol wells. The compounds screened were selected from a number of su-blibraries in the Broad Institute compound collection. The screening set wascomprised of 1,920 molecules with previously annotated biological activity,purchased from commercial vendors Biomol International Inc., Calbiochem,EMD Biosciences, Microsource Discovery Systems Inc., Prestwick Chemical Inc.,and Sigma-Aldrich; 1,280 puri"ed natural products from Analyticon Discov-
ery; 15,356 commercial drug-like compounds from ChemDiv Inc., Maybridge,and TimTec LLC; and 12,154 diversity-oriented synthetic (DOS) compoundsgenerated at the Broad Institute. The commercial drug-like compounds werepre"ltered by the suppliers to avoid undesired reactive functional groups andmeet physical property "lters based on Lipinski’s rule of "ve. The DOS com-pounds consisted of a series of stereochemically diverse eight- and nine-membered macrocycles ranging in molecular mass from 307 to 727 Da, withan average molecular mass of 572 Da.
Compound purity and identity were determined by UPLC-MS (Waters).Purity was measured by UV absorbance at 210 nm. Identity was determinedon a SQ mass spectrometer by positive electrospray ionization. Mobile phaseA consisted of 0.1% ammonium hydroxide; mobile phase B consisted of 0.1%ammonium hydroxide in acetonitrile. The gradient ran from 5% to 95%mobile phase B over 0.8min at 0.45mL/min. An Acquity BEH C18, 1.7 #m, 1.0 !50-mm column was used with column temperature maintained at 65 °C.Compounds were dissolved in DMSO at a nominal concentration of 1 mg/mL,and 0.25 #L of this solution was injected.
Hits were selected based on the intensity of staining in the Cy2 channel andthe number of Cy2 positive cells, and counterscreened in the same assaywithout the use of primary antibody and with Cy3-labeled secondary anti-body to remove inactive auto!uorescent compounds.
In all subsequent immuno!uorescence experiments, Cy3 and Cy5 sec-ondary antibodies were used to avoid effects of compound auto!uorescencein the Cy2 channel.
Gene Expression Analysis. Following compound treatment, cells were lysedand RNA isolated using the RNeasy Mini Kit (Qiagen) according to themanufacturer’s protocol. RNA was reverse transcribed with random primersusing the High Capacity cDNA Reverse Transcription Kit with RNase inhibitor(Applied Biosystems).
Quantitative PCR was performed with Power SYBR Green PCR Master Mix(Applied Biosystems) on an Applied Biosystems 7900HT real-time PCR ma-chine using primers in Table S3.
Kinase Pro!ling. Kinase pro"ling and dose–response curves were performedat Millipore’s KinasePro"ler according to the manufacturer’s protocols. ATPconcentrations were within 15 #M of the apparent KM for each enzyme.
Western Blot Analysis. Cell extracts were generated by lysing cells in modi"edRIPA buffer containing 1% Nonidet P-40, 0.1% Na deoxycholate, 150 mMNaCl, 1 mM EDTA, and 50 mM Tris (pH 7.5), and supplemented with proteaseand phosphatase inhibitors. A total of 20 #g of each sample were run on E-Page 48 gels (Invitrogen) and transferred to PVDF membranes using Invi-trogen iBlot technology. Each blot was simultaneously probed with indicatedprimary antibody (all at 1:1,000) and 1:10,000 !-actin antibody, following byincubation with 1:5,000 IRDye-labeled secondary antibody. Blots were scan-ned on LI-COR Odyssey Infrared Imaging System and analyzed using Odysseysoftware. Each speci"c band was normalized to the !-actin signal, andphosphorylation was plotted as a ratio of normalized phospho-speci"c tonormalized pan-antibody signal.
RNAi Experiments. Lentiviruses resulting in the expression of shRNAs againstRSK family members were obtained from the RNAi Consortion (TRC) (19). Thefollowing hairpins were used: Rsk1 shRNA1: NM_009097.1-559s1c1, Rsk1shRNA2: NM_009097.1-685s1c1, Rsk2 shRNA1: NM_148945.1-269s1c1, Rsk2shRNA2: NM_148945.1-1345s1c1, Rsk2 shRNA3: NM_148945.1-1833s1c1,Rsk3 shRNA1: NM_011299.3-384s1c1, Rsk3 shRNA2: NM_011299.3-627s1c1,Rsk3 shRNA3: NM_011299.3-2351s1c1. Mouse "TC1 cells were plated in 96-well plates at 15,000 cells per well in 200 #L of DMEM. The next day, poly-brene was added to each well (8 #g/mL), and cells were spin-infected with8 #L virus at 2,250 rpm for 30 min at 30 °C. Media was changed the followingday to fresh, low-glucose DMEM containing 1 #g/mL puromycin and culturedfor 4 additional d. Cells were lysed in RLT buffer and mRNA extracted usingQiagen RNeasy 96 Kit.
Hormone Secretion in Human Islets.Dissociatedhuman islets cultured in96-wellplates were washed once with 100 #L per well of PBS and incubated for 1 h in100 #L low-glucose (1.67 mM) KRB buffer (138 mM NaCl, 5.4 mM KCl, 2.6 mMMgCl2, 2.6mMCaCl2, 5mMNaHCO3, 0.1%BSA), and for an additional hour ineither high-glucose (16.7 mM) or low-glucose KRB buffer. Supernatant fromthe"rst hourwas used for glucose-stimulated glucagon secretion using ALPCOGlucagon (human, mouse, rat) ELISA (following manufacturer’s protocol for50 #L of sample). Supernatant from the second hour was used to measureglucose-stimulated insulin secretion using ALPCO Insulin ELISA (human).
Fomina-Yadlin et al. PNAS | August 24, 2010 | vol. 107 | no. 34 | 15103
CELL
BIOLO
GY
ACKNOWLEDGMENTS. We thank Andrew Stern, Michelle Palmer, LynnVerplank, and the entire Chemical Biology Platform at the Broad Institute forhelpful suggestions in assay development and with high-content screening;Thomas Nieland, Serena Silver, and David Root from the Broad RNAi platformfor lentiviral knockdown constructs and advice for optimization of the infectionprotocol; Jack Taunton (University of California, San Francisco) for a sample ofthe RSK inhibitor FMK and advice on RSK biology; Yuan Yuan (Chemistry andChemical Biology Department, Harvard University) for expression primers;Robert Gould and the entire CB/NT Diabetes Team for helpful discussion andadvice; and Alejandro Wolf Yadlin (Chemistry and Chemical Biology Depart-
ment, Harvard University) for performingWestern blot quanti"cation. Fundingfor this project was provided by the Juvenile Diabetes Research Foundation andNational Institute for General Medical Sciences Grant GM38627 (to S.L.S.); Na-tional Institutes of Health Grant RL1-HG004671 for computationalwork towardtarget-hypothesis generation (toV.D. andP.A.C.); Ernst ScheringResearch Foun-dation and European Union FP7 Marie Curie Program Grant PIOF-GA-2008-221135 (to S.K.); an MCO training grant from Harvard University (to D.F.); andType 1 Diabetes Path"nder Award DP2-DK083048 from the National Institutesof Health–National Institute of Diabetes and Digestive and Kidney Diseases (toB.K.W.). S.L.S. is an Investigator at the Howard Hughes Medical Institute.
1. Shapiro AM, et al. (2000) Islet transplantation in seven patients with type 1 diabetesmellitus using a glucocorticoid-free immunosuppressive regimen. N Engl J Med 343:230–238.
2. Borowiak M, Melton DA (2009) How to make beta cells? Curr Opin Cell Biol 21:727–732.
3. Kroon E, et al. (2008) Pancreatic endoderm derived from human embryonic stem cellsgenerates glucose-responsive insulin-secreting cells in vivo. Nat Biotechnol 26:443–452.
4. Zhou Q, Melton DA (2008) Extreme makeover: Converting one cell into another. CellStem Cell 3:382–388.
5. Pearl EJ, Horb ME (2008) Promoting ectopic pancreatic fates: Pancreas developmentand future diabetes therapies. Clin Genet 74:316–324.
6. Collombat P, et al. (2007) Embryonic endocrine pancreas and mature beta cellsacquire alpha and PP cell phenotypes upon Arx misexpression. J Clin Invest 117:961–970.
7. Zhou Q, Brown J, Kanarek A, Rajagopal J, Melton DA (2008) In vivo reprogramming ofadult pancreatic exocrine cells to beta-cells. Nature 455:627–632.
8. Collombat P, et al. (2009) The ectopic expression of Pax4 in the mouse pancreasconverts progenitor cells into alpha and subsequently beta cells. Cell 138:449–462.
9. Thorel F, et al. (2010) Conversion of adult pancreatic alpha-cells to beta-cells afterextreme beta-cell loss. Nature 464:1149–1154.
10. Hamaguchi K, Leiter EH (1990) Comparison of cytokine effects on mouse pancreaticalpha-cell and beta-cell lines. Viability, secretory function, and MHC antigenexpression. Diabetes 39:415–425.
11. Iype T, et al. (2005) Mechanism of insulin gene regulation by the pancreatic transcriptionfactor Pdx-1: Application of pre-mRNA analysis and chromatin immunoprecipitation toassess formation of functional transcriptional complexes. J Biol Chem 280:16798–16807.
12. Seiler KP, et al. (2008) ChemBank: A small-molecule screening and cheminformaticsresource database. Nucleic Acids Res 36 (Database issue):D351–D359.
13. Manning G, Whyte DB, Martinez R, Hunter T, Sudarsanam S (2002) The protein kinasecomplement of the human genome. Science 298:1912–1934.
14. Carriere A, Ray H, Blenis J, Roux PP (2008) The RSK factors of activating the Ras/MAPKsignaling cascade. Front Biosci 13:4258–4275.
15. Anjum R, Blenis J (2008) The RSK family of kinases: Emerging roles in cellularsignalling. Nat Rev Mol Cell Biol 9:747–758.
16. Beattie GM, Cirulli V, Lopez AD, Hayek A (1997) Ex vivo expansion of humanpancreatic endocrine cells. J Clin Endocrinol Metab 82:1852–1856.
17. Nguyen TL (2008) Targeting RSK: An overview of small molecule inhibitors.Anticancer Agents Med Chem 8:710–716.
18. Bain J, et al. (2007) The selectivity of protein kinase inhibitors: A further update.Biochem J 408:297–315.
19. Moffat J, et al. (2006) A lentiviral RNAi library for human and mouse genes applied toan arrayed viral high-content screen. Cell 124:1283–1298.
15104 | www.pnas.org/cgi/doi/10.1073/pnas.1010018107 Fomina-Yadlin et al.
Supporting InformationFomina-Yadlin et al. 10.1073/pnas.1010018107
Fig. S1. High-content screen for small-molecule inducers of insulin production in mouse !-cells. (A) Assay setup. (B) Detection of spiked-in "-cells (cell line "TC3)in a population of !-cells (cell line !TC1) by automated image analysis following immuno!uorescence detection of insulin. (C) Competition experiment sim-ulating lower insulin levels compared with "-cells.In a population of !-cells, 5% spiked-in "-cells were stained with insulin primary antibody and Cy2-labeled!-guinea pig secondary antibody and increasing amounts of competing Cy3-labeled ! -guinea pig antibody. Staining intensity of insulin positive and negativecells was measured in the green (Cy2) channel. (D) Representative images from spiked-in and antibody competition experiments. (Scale bar: 50 #m.)
Fomina-Yadlin et al. www.pnas.org/cgi/content/short/1010018107 1 of 6
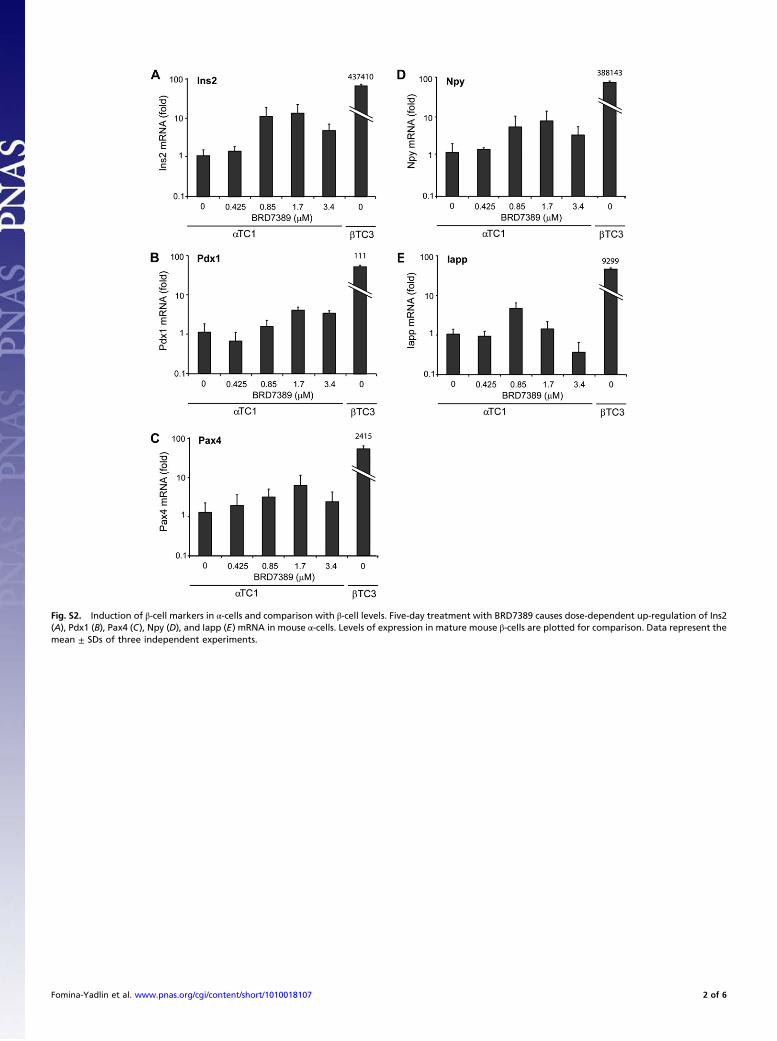
Fig. S2. Induction of "-cell markers in !-cells and comparison with "-cell levels. Five-day treatment with BRD7389 causes dose-dependent up-regulation of Ins2(A), Pdx1 (B), Pax4 (C), Npy (D), and Iapp (E) mRNA in mouse !-cells. Levels of expression in mature mouse "-cells are plotted for comparison. Data represent themean ± SDs of three independent experiments.
Fomina-Yadlin et al. www.pnas.org/cgi/content/short/1010018107 2 of 6
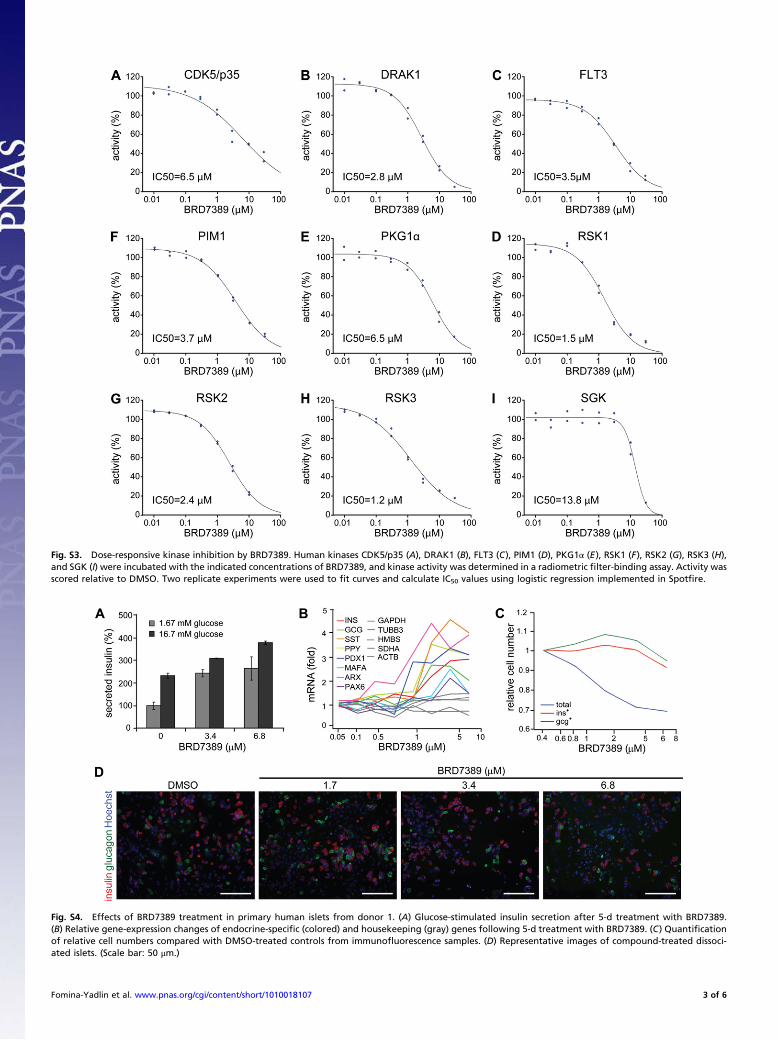
Fig. S3. Dose-responsive kinase inhibition by BRD7389. Human kinases CDK5/p35 (A), DRAK1 (B), FLT3 (C), PIM1 (D), PKG1! (E), RSK1 (F), RSK2 (G), RSK3 (H),and SGK (I) were incubated with the indicated concentrations of BRD7389, and kinase activity was determined in a radiometric "lter-binding assay. Activity wasscored relative to DMSO. Two replicate experiments were used to "t curves and calculate IC50 values using logistic regression implemented in Spot"re.
Fig. S4. Effects of BRD7389 treatment in primary human islets from donor 1. (A) Glucose-stimulated insulin secretion after 5-d treatment with BRD7389.(B) Relative gene-expression changes of endocrine-speci"c (colored) and housekeeping (gray) genes following 5-d treatment with BRD7389. (C) Quanti"cationof relative cell numbers compared with DMSO-treated controls from immuno!uorescence samples. (D) Representative images of compound-treated dissoci-ated islets. (Scale bar: 50 #m.)
Fomina-Yadlin et al. www.pnas.org/cgi/content/short/1010018107 3 of 6
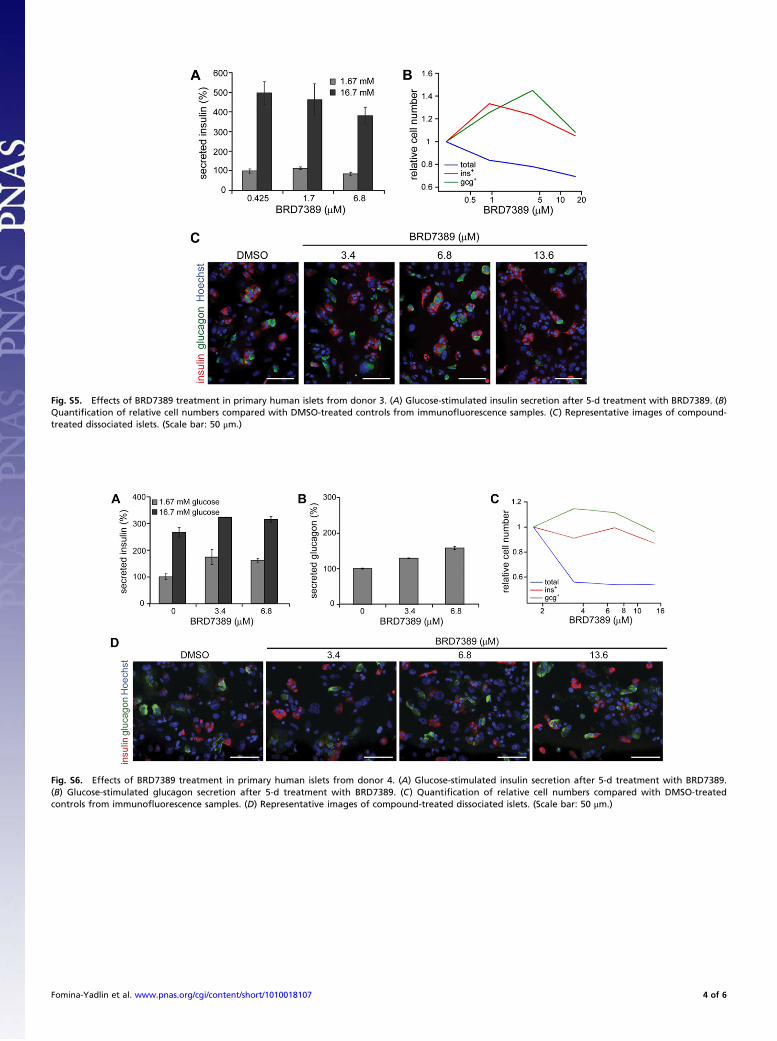
Fig. S5. Effects of BRD7389 treatment in primary human islets from donor 3. (A) Glucose-stimulated insulin secretion after 5-d treatment with BRD7389. (B)Quanti"cation of relative cell numbers compared with DMSO-treated controls from immuno!uorescence samples. (C) Representative images of compound-treated dissociated islets. (Scale bar: 50 #m.)
Fig. S6. Effects of BRD7389 treatment in primary human islets from donor 4. (A) Glucose-stimulated insulin secretion after 5-d treatment with BRD7389.(B) Glucose-stimulated glucagon secretion after 5-d treatment with BRD7389. (C) Quanti"cation of relative cell numbers compared with DMSO-treatedcontrols from immuno!uorescence samples. (D) Representative images of compound-treated dissociated islets. (Scale bar: 50 #m.)
Fomina-Yadlin et al. www.pnas.org/cgi/content/short/1010018107 4 of 6
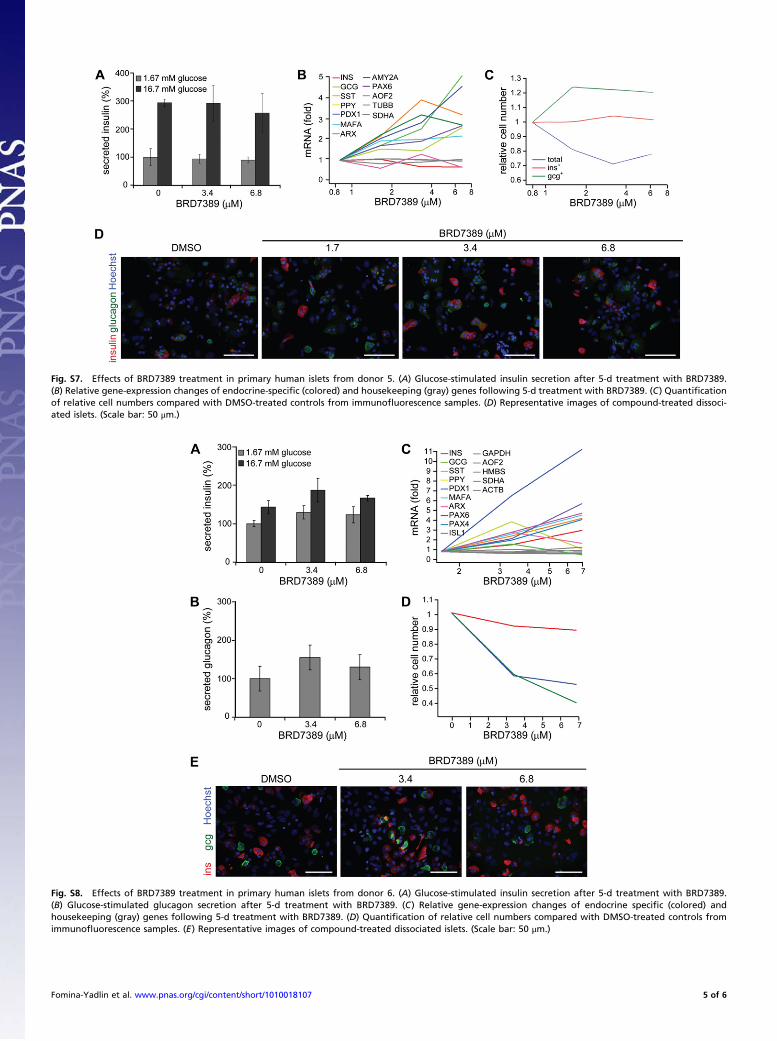
Fig. S7. Effects of BRD7389 treatment in primary human islets from donor 5. (A) Glucose-stimulated insulin secretion after 5-d treatment with BRD7389.(B) Relative gene-expression changes of endocrine-speci"c (colored) and housekeeping (gray) genes following 5-d treatment with BRD7389. (C) Quanti"cationof relative cell numbers compared with DMSO-treated controls from immuno!uorescence samples. (D) Representative images of compound-treated dissoci-ated islets. (Scale bar: 50 #m.)
Fig. S8. Effects of BRD7389 treatment in primary human islets from donor 6. (A) Glucose-stimulated insulin secretion after 5-d treatment with BRD7389.(B) Glucose-stimulated glucagon secretion after 5-d treatment with BRD7389. (C) Relative gene-expression changes of endocrine speci"c (colored) andhousekeeping (gray) genes following 5-d treatment with BRD7389. (D) Quanti"cation of relative cell numbers compared with DMSO-treated controls fromimmuno!uorescence samples. (E) Representative images of compound-treated dissociated islets. (Scale bar: 50 #m.)
Fomina-Yadlin et al. www.pnas.org/cgi/content/short/1010018107 5 of 6
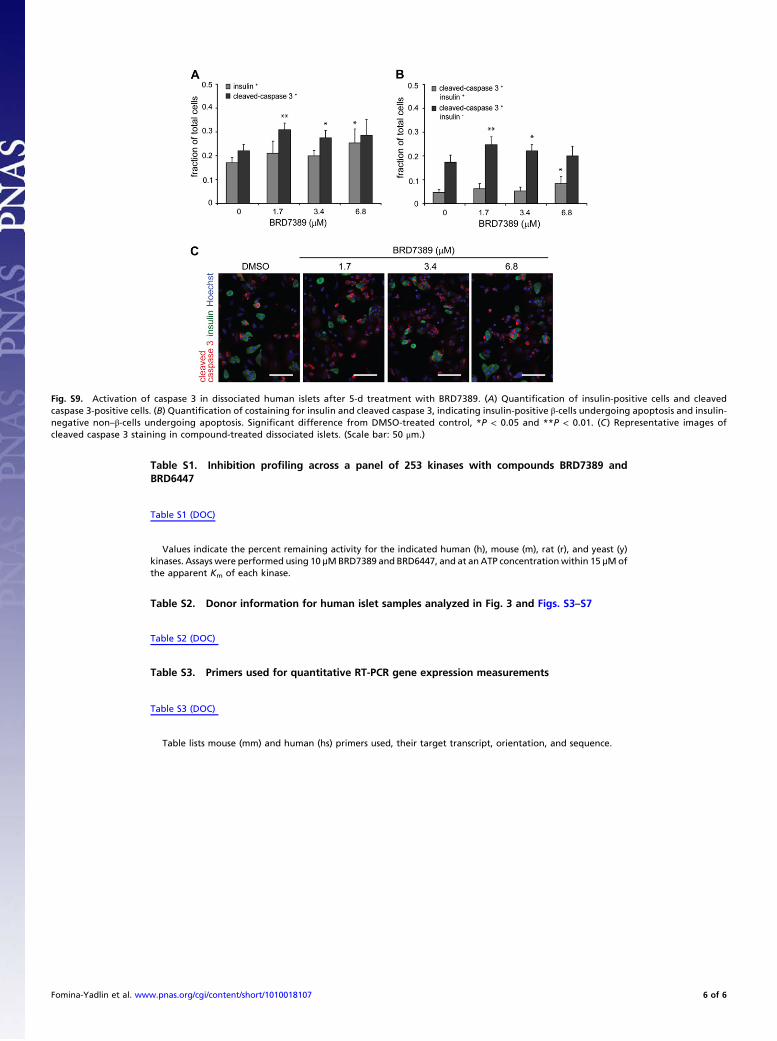
Fig. S9. Activation of caspase 3 in dissociated human islets after 5-d treatment with BRD7389. (A) Quanti"cation of insulin-positive cells and cleavedcaspase 3-positive cells. (B) Quanti"cation of costaining for insulin and cleaved caspase 3, indicating insulin-positive "-cells undergoing apoptosis and insulin-negative non–"-cells undergoing apoptosis. Signi"cant difference from DMSO-treated control, *P < 0.05 and **P < 0.01. (C) Representative images ofcleaved caspase 3 staining in compound-treated dissociated islets. (Scale bar: 50 #m.)
Table S1. Inhibition pro!ling across a panel of 253 kinases with compounds BRD7389 andBRD6447
Table S1 (DOC)
Values indicate the percent remaining activity for the indicated human (h), mouse (m), rat (r), and yeast (y)kinases. Assays were performed using 10 !MBRD7389 and BRD6447, and at an ATP concentrationwithin 15 !Mofthe apparent Km of each kinase.
Table S2. Donor information for human islet samples analyzed in Fig. 3 and Figs. S3–S7
Table S2 (DOC)
Table S3. Primers used for quantitative RT-PCR gene expression measurements
Table S3 (DOC)
Table lists mouse (mm) and human (hs) primers used, their target transcript, orientation, and sequence.
Fomina-Yadlin et al. www.pnas.org/cgi/content/short/1010018107 6 of 6