BMC Bioinformatics BioMed Central -...
20
BioMed Central Page 1 of 20 (page number not for citation purposes) BMC Bioinformatics Open Access Research article Single TNFα trimers mediating NF-κB activation: stochastic robustness of NF-κB signaling Tomasz Lipniacki* 1 , Krzysztof Puszynski 3 , Pawel Paszek 2,4 , Allan R Brasier 5 and Marek Kimmel 2,3 Address: 1 Institute of Fundamental Technological Research, Swietokrzyska 21, 00-049 Warsaw, Poland, 2 Department of Statistics, Rice University, 6100 Main St. MS-138, Houston, TX 77005, USA, 3 Institute of Automation, Silesian Technical University, 44-100 Gliwice, Poland, 4 Centre for Cell Imaging, School of Biological Sciences, Bioscience Research Building, Crown St., University of Liverpool, Liverpool L69 7ZB, UK and 5 Department of Internal Medicine, University of Texas Medical Branch, Galveston, TX 77555-1060, USA Email: Tomasz Lipniacki* - [email protected]; Krzysztof Puszynski - [email protected]; Pawel Paszek - [email protected]; Allan R Brasier - [email protected]; Marek Kimmel - [email protected] * Corresponding author Abstract Background: The NF-κB regulatory network controls innate immune response by transducing variety of pathogen-derived and cytokine stimuli into well defined single-cell gene regulatory events. Results: We analyze the network by means of the model combining a deterministic description for molecular species with large cellular concentrations with two classes of stochastic switches: cell-surface receptor activation by TNFα ligand, and IκBα and A20 genes activation by NF-κB molecules. Both stochastic switches are associated with amplification pathways capable of translating single molecular events into tens of thousands of synthesized or degraded proteins. Here, we show that at a low TNFα dose only a fraction of cells are activated, but in these activated cells the amplification mechanisms assure that the amplitude of NF-κB nuclear translocation remains above a threshold. Similarly, the lower nuclear NF-κB concentration only reduces the probability of gene activation, but does not reduce gene expression of those responding. Conclusion: These two effects provide a particular stochastic robustness in cell regulation, allowing cells to respond differently to the same stimuli, but causing their individual responses to be unequivocal. Both effects are likely to be crucial in the early immune response: Diversity in cell responses causes that the tissue defense is harder to overcome by relatively simple programs coded in viruses and other pathogens. The more focused single-cell responses help cells to choose their individual fates such as apoptosis or proliferation. The model supports the hypothesis that binding of single TNFα ligands is sufficient to induce massive NF-κB translocation and activation of NF-κB dependent genes. Background Living cells are considered noisy or stochastic biochemical reactors. Most of the cell to cell variability is due to exist- ence of stochastic switches or slow reaction channels involving limited numbers of reacting molecules. Stochas- tic switches provide inputs for amplification cascades, Published: 9 October 2007 BMC Bioinformatics 2007, 8:376 doi:10.1186/1471-2105-8-376 Received: 23 February 2007 Accepted: 9 October 2007 This article is available from: http://www.biomedcentral.com/1471-2105/8/376 © 2007 Lipniacki et al; licensee BioMed Central Ltd. This is an Open Access article distributed under the terms of the Creative Commons Attribution License (http://creativecommons.org/licenses/by/2.0 ), which permits unrestricted use, distribution, and reproduction in any medium, provided the original work is properly cited.
Transcript of BMC Bioinformatics BioMed Central -...
BioMed CentralBMC Bioinformatics
ss
Open AcceResearch articleSingle TNFα trimers mediating NF-κB activation: stochastic robustness of NF-κB signalingTomasz Lipniacki*1, Krzysztof Puszynski3, Pawel Paszek2,4, Allan R Brasier5 and Marek Kimmel2,3Address: 1Institute of Fundamental Technological Research, Swietokrzyska 21, 00-049 Warsaw, Poland, 2Department of Statistics, Rice University, 6100 Main St. MS-138, Houston, TX 77005, USA, 3Institute of Automation, Silesian Technical University, 44-100 Gliwice, Poland, 4Centre for Cell Imaging, School of Biological Sciences, Bioscience Research Building, Crown St., University of Liverpool, Liverpool L69 7ZB, UK and 5Department of Internal Medicine, University of Texas Medical Branch, Galveston, TX 77555-1060, USA
Email: Tomasz Lipniacki* - [email protected]; Krzysztof Puszynski - [email protected]; Pawel Paszek - [email protected]; Allan R Brasier - [email protected]; Marek Kimmel - [email protected]
* Corresponding author
AbstractBackground: The NF-κB regulatory network controls innate immune response by transducingvariety of pathogen-derived and cytokine stimuli into well defined single-cell gene regulatoryevents.
Results: We analyze the network by means of the model combining a deterministic descriptionfor molecular species with large cellular concentrations with two classes of stochastic switches:cell-surface receptor activation by TNFα ligand, and IκBα and A20 genes activation by NF-κBmolecules. Both stochastic switches are associated with amplification pathways capable oftranslating single molecular events into tens of thousands of synthesized or degraded proteins.Here, we show that at a low TNFα dose only a fraction of cells are activated, but in these activatedcells the amplification mechanisms assure that the amplitude of NF-κB nuclear translocationremains above a threshold. Similarly, the lower nuclear NF-κB concentration only reduces theprobability of gene activation, but does not reduce gene expression of those responding.
Conclusion: These two effects provide a particular stochastic robustness in cell regulation,allowing cells to respond differently to the same stimuli, but causing their individual responses tobe unequivocal. Both effects are likely to be crucial in the early immune response: Diversity in cellresponses causes that the tissue defense is harder to overcome by relatively simple programscoded in viruses and other pathogens. The more focused single-cell responses help cells to choosetheir individual fates such as apoptosis or proliferation. The model supports the hypothesis thatbinding of single TNFα ligands is sufficient to induce massive NF-κB translocation and activation ofNF-κB dependent genes.
BackgroundLiving cells are considered noisy or stochastic biochemicalreactors. Most of the cell to cell variability is due to exist-
ence of stochastic switches or slow reaction channelsinvolving limited numbers of reacting molecules. Stochas-tic switches provide inputs for amplification cascades,
Published: 9 October 2007
BMC Bioinformatics 2007, 8:376 doi:10.1186/1471-2105-8-376
Received: 23 February 2007Accepted: 9 October 2007
This article is available from: http://www.biomedcentral.com/1471-2105/8/376
© 2007 Lipniacki et al; licensee BioMed Central Ltd. This is an Open Access article distributed under the terms of the Creative Commons Attribution License (http://creativecommons.org/licenses/by/2.0), which permits unrestricted use, distribution, and reproduction in any medium, provided the original work is properly cited.
Page 1 of 20(page number not for citation purposes)
BMC Bioinformatics 2007, 8:376 http://www.biomedcentral.com/1471-2105/8/376
which translate the single molecule events into a largerpopulation of downstream effector molecules.
The most studied example of stochastic regulation is geneexpression, where stochasticity, in eukaryotic organisms,arises mostly from fluctuation in gene activity [1-5] andmRNA synthesis or decay [6-10] reviewed recently in [11].Control of gene activity is mediated by transcription fac-tors that bind to specific promoter regions, switching thegene on or off. When the gene is active, RNA polymerasemay bind to the gene promoter and enter the transcrip-tional elongation mode, producing full length pre-mRNAtranscripts. The edited mRNA is then exported to the cyto-plasm, where the protein translation occurs. In this way, asingle gene activation event results (if the activationperiod is sufficiently long) in a burst of mRNA molecules[12], which is then translated into an even larger burst ofproteins.
Another example of stochastic regulation is provided bycell surface receptors and amplification of successive cas-cade of downstream kinases. There is a large body of evi-dence that cells are capable of responding to a single- or avery limited number of activating molecules. For example,retinal Rod cells are able to transduce a single photon intoa hyperpolarization response [13]. For the present study,signal amplification from a small number of receptorsdetecting pathogen presence is specially important since itenables cells to respond with protective cytokine cascadesto protect the tissue before adaptive immune response canbe generated. For example, T-lymphocytes are able todetect a single foreign peptide antigen and only three pep-tides are required for induction of T-cell cytotoxicity[14,15]. Similar behavior is seen for the toll-interleukin(TIR) superfamily of receptors, where IL-1 signal transduc-tion has been observed in cells expressing only about 10IL-1 receptors per cell [16]. Similarly, cells respond toTNFα stimulation at femtomolar concentration, i.e.,when the number of TNFα ligands per cell is very limited[17]. In all cases, the activation of receptors leads to theinitiation of a signal transduction-amplification cascade,involving activation (phosphorylation) of downstreameffector kinases. More generally, it is important to pointout that cells can detect and respond to single moleculeintracellular events such as DNA damage (leading to p53activation) or presence of single viral RNAs. Although thephenomenon of cell sensitivity to single activating mole-cules is well established in biological systems, very fewtheoretical studies have addressed the effect of stochasticcell surface signaling and its consequences for the down-stream cellular responses.
Innate immunity is an intensively studied cellular signal-ing response to pathogens and pathogen-associated pat-terns which results in the expression of protective
cytokines, such as interferon β, that serve to limit thespread of infection until more specific adaptive immunitycan be generated. In this regard, the cytoplasmic transcrip-tion factor NF-κB is a major mediator of innate immuneresponses [18,19]. In resting cells NF-κB is sequestered inthe cytoplasm by dimerization with inhibitory proteinscalled IκB. Although several IκB isoforms have been iden-tified, the primary inhibitor is IκBα. In the classical NF-κBactivation pathway, extracellular signals such as tumornecrosis factor-alpha (TNFα) and interleukin-1 (IL-1)bind to cell surface receptors coupled to the cytoplasmicIκB kinase (IKK), a multiprotein complex that phosphor-ylates IκBα, leading to its ubiquitination and then to itsrapid proteasomal degradation [20]. Liberated NF-κB isthen rapidly translocated into the nucleus to bind to highaffinity sites in the genome, thereby influencing targetgene expression. Experimental findings have shown thatNF-κB nuclear residence is transient and dynamic, anobservation that has led to the discovery of negative feed-back NF-κB-IκBα loop in the NF-κB pathway [21].
The two levels of autoregulatory negative feedback con-trol, termed the NF-κB-IκBα and NF-κB-A20-IKK feedbackloops, arise because both IκBα and A20 genes are directlyregulated by NF-κB binding. In the NF-κB-IκBα feedbackloop, NF-κB enters the nucleus after IκBα degradation,NF-κB induces IκBα resynthesis to recapture activatednuclear NF-κB and return it to the cytoplasm. In the NF-κB-A20-IKK feedback loop, A20, a protein that is notexpressed prior to stimulation is also strongly NF-κBresponsive [22]. A20 is an inhibitor of IKK kinase thatcomplexes with an IKK regulatory subunit leading to itsinactivation and that induces degradation of RIP a neces-sary component of the active TNFR1 receptor complex.Without A20 expression, the IKK retains activity whichleads to rapid degradation of the newly resynthesizedIκBα, which destroys the NF-κB-IκBα feedback loop [23].As an illustration, genetically A20 deficient mice arehypersensitive to TNFα and develop severe in inflamma-tion even though they have an intact IκBα mRNA expres-sion [24].
Nuclear NF-κB activates groups of genes through a processinitiated by its binding to high affinity DNA binding sitesin regulatory regions of their promoters. Although NF-κBbinding to some genes results in rate-limiting complexformation of coactivators, pre-initiation factors, and RNApolymerase (Pol) II, the mode of regulation of rapidlyinduced negative feedback inhibitors appears to be dis-tinct. Interestingly, chromatin immunoprecipitationassays have shown that the IκBα and A20 promoters are"pre-loaded"- already bound by general transcription fac-tors, coactivators and RNA Pol II, waiting for the presenceof NF-κB binding to activate expression [25,26]. In thesepromoters, RNA Pol II is stalled in an activated state; upon
Page 2 of 20(page number not for citation purposes)
BMC Bioinformatics 2007, 8:376 http://www.biomedcentral.com/1471-2105/8/376
NF-κB binding, RNA Pol II enters a competent transcrip-tional elongation mode and becomes able to transcribethe gene. In this manner, the inhibitory genes of the NF-κB feedback loop are poised to rapidly respond to thepresence of nuclear NF-κB.
In last five years several models of the NF-κB signaling reg-ulatory module have been developed, reviewed in [27].The first attempt was a one-feedback loop model that con-centrated on the interplay between the three IκB isoforms[28]. The next attempt was our two feedback loop model[23], incorporating effects of both the IκBα and A20inhibitors. In this model the representation of the NF-κB-IκB regulatory module was simplified by incorporation ofonly one IκB inhibitor, IκBα, that is responsible for themajority of cytoplasmic NF-κB binding and the only onewhich knockout is lethal, [29]. Incorporating the secondNF-κB-A20-IKK negative feedback loop, accurately pre-dicted the time dependent profile of IKK activity. A thirdmodel introduced the transduction pathway, from theTNFR1 receptor to activation of the IKKK and IKK kinasesand was used to analyze responses of HepG2 cells andHepG2.2.15 (HepG2 cells producing hepatitis B virus) toTNFα stimulation [30].
Recently, the NF-κB signaling in single cells was analyzedboth experimentally [31-34] and numerically by means ofstochastic modeling [35,36], or agent-based modeling[37]. Both analyses indicate that the NF-κB regulatorymodule demands single cell, stochastic analysis due tocellular heterogeneity and population asynchrony. In thepresent work we expand our two-feedback loop, single-cell stochastic model of NF-κB activation to incorporate asecond stochastic switch at the level of the TNFα-TNFR1interaction. We analyze response of the NF-κB regulatorymodule over a broad range of stimulation by its activatingligand. We will show, how, although this may seem coun-ter-intuitive, stochasticity and stochastic switches mayintroduce robustness into the gene regulatory response. Inshort, the stochastic robustness is due to amplificationcascades and progressive signal saturation. As a result, alow amplitude signal (small concentration of activatingligand or transcription factor) leads to an "almost" Yes orNo response, with the probability of Yes being a functionof the input signal amplitude. This type of regulation ena-bles cells to chose a well-defined fate such as signaling,apoptosis, or others, but in addition it allows individualcell responses to vary. In the range of stimulation ampli-tudes, for which most cells follow the same evolutionpath, the cell population-based experiments and mode-ling are well justified. However, in the case when popula-tion is a mixture of differently responding cells (forexample apoptotic and proliferating or TNFα respondingor not) the average trajectory does not represent any bio-
logical process and the model reproducing such trajectoryis likely to be incorrect.
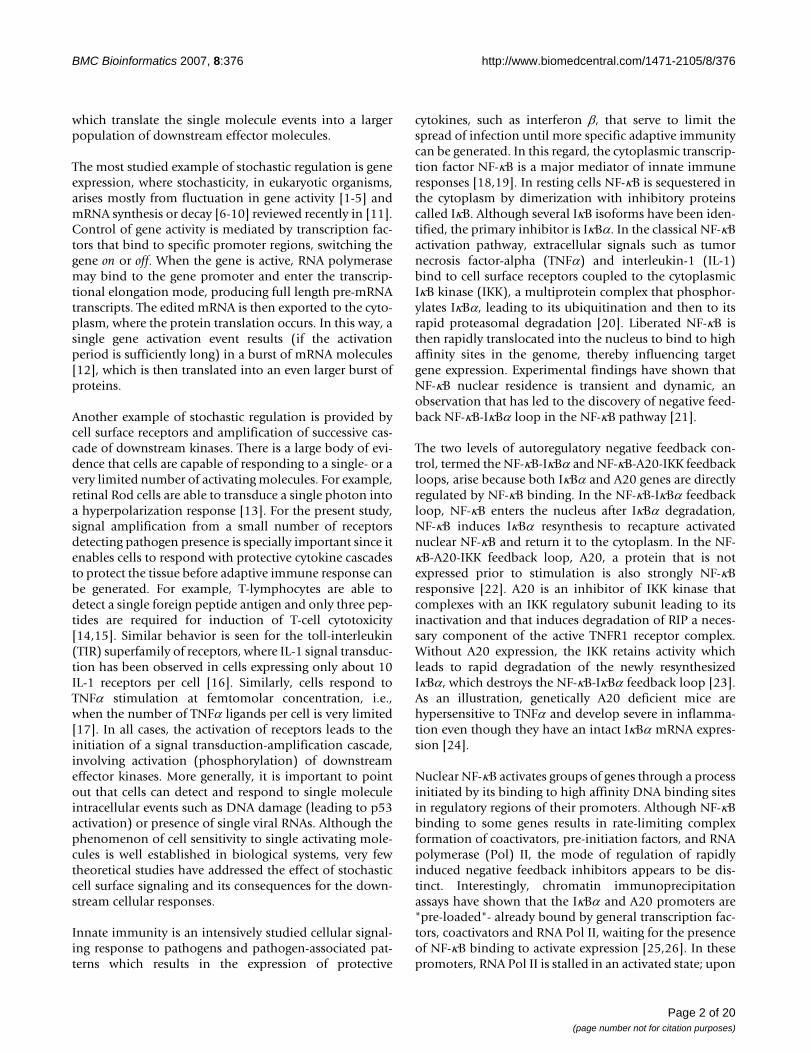
Results and discussionStochastic switches and amplification cascades in NF-κB regulationOur considerations are based on the two-feedback loopstochastic model of the NF-κB pathway, which combinesthe signal transduction cascade that connects cell surfacereceptors with the core regulatory module analyzed previ-ously [35]. Current model involves two-compartmentkinetics of transcription factor NF-κB, its activators, IKKK,IKK and inhibitors, A20 and IκBα, shown in Fig. 1. IKKKrepresents the IKK activating kinase, which itself is acti-vated at the TNFR1 receptor complex (see Materials andMethods for details).
In Additional file 3 (Figs S1, S2, S3 and S4) we demon-strate the model's ability to reproduce major NF-κB path-way experiments on cells exhibiting oscillations incytoplasmic to nuclear NF-κB localization that arise inresponse to persistent TNFα stimulation.
Two feedback-loop model of NF-κB regulatory pathwayFigure 1Two feedback-loop model of NF-κB regulatory pathway.
Page 3 of 20(page number not for citation purposes)
BMC Bioinformatics 2007, 8:376 http://www.biomedcentral.com/1471-2105/8/376
In the current paper we focus on TNFα signaling, a processinitiated by binding of TNFα to the ubiquitous receptorTNFR1. In short, the action of regulatory pathway may besummarized as follows: Binding of TNFα trimer initiatesreceptor TNFR1 trimerization and formation of an activereceptor complex in a multistep process involving bindingof RIP and TRAF2. The active receptor complex activatesthe IKKK kinase (transformation from IKKKn to IKKKa).Active kinase IKKKa phosphorylates and activates the IKKkinase (transformation from IKKn to IKKa). Active IKKakinase transiently binds to the cytoplasmic (NF-κB|IκBα)complex and phosphorylates IκBα initiating its degrada-tion. Released NF-κB enters the nucleus to induce tran-scription of inhibitors IκBα and A20 genes. The firstnegative feedback loop involves the IκBα protein, whichis rapidly resynthesized, enters the nucleus and recapturesNF-κB back into the cytoplasm. In the continued presenceof IKKa, however, the resynthesized IκBα would be con-tinuously degraded, which would result in continuednuclear NF-κB translocation. A second level of negativeautoregulation occurs with the resynthesis of A20, a ubiq-uitin ligase which controls IKK activity. A20 initiates deg-radation of RIP, the key component of TNFR1 receptorcomplex, what attenuates the activity of receptors anddirectly associates itself with IKKa, enhancing its conver-sion to catalytically inactive IKKi. Inactive kinase IKKispontaneously converts back to IKKn through the inter-mediate form IKKii. Similarly, active kinase IKKKa rapidlyconverts to the inactive form IKKKn.
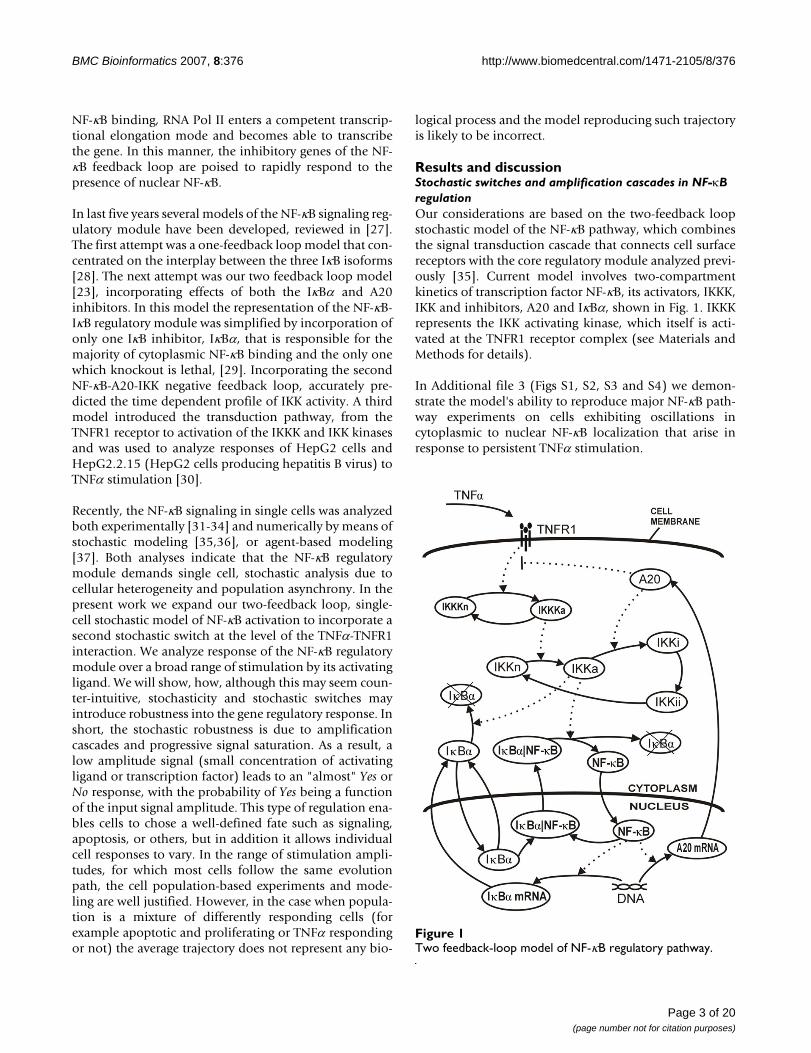
We identified two stochastic processes crucial to the func-tioning of the NF-κB regulatory pathway: (1) Activation ofA20 and IκBα genes via binding of NF-κB molecules tothe genes promoters and (2) activation of TNFR1 recep-tors via binding of TNFα trimers. These stochastic eventsmay influence the evolution and fate of the cell due totheir association with amplification cascades, as shown inFig. 2 (see [38-40] for discussion of signal and noise prop-agation in gene neworks and amplification cascades).
Gene expression cascade (Fig. 2A) starts from the activa-tion of a single gene copy, which may then serve as a tem-plate for the synthesis of tens or hundreds of mRNAmolecules. In turn, a single mRNA molecule is a templatefor synthesis of hundreds of protein molecules. In thisway the two IκBα gene copies are sufficient to replenishpool of IκBα proteins of about 100,000 molecules, withina half hour. As estimated experimentally by Yang [41] theendogenous level of IκBα molecules is 135,000, most ofthese molecules are degraded at in first 10 min. of highdose TNFα stimulation, and then IκBα level is approxi-mately restored between 30 and 75 min. of stimulation[28].
At the level of cell surface receptors, a single TNFα trimerbinding to the TNFR1 receptor leads to receptor trimeriza-tion and formation of a stable active receptor complex(Fig 2B). Grell [17] found that TNFα trimers dissociatefrom TNFR1 receptors with a half time of 33 min., whilethe internalization time is of order of 10 to 20 min. Dur-ing this time the single active receptor may activatenumerous IKKK kinase molecules. In turn, each activeIKKKa activates numerous IKK kinases, and each of IKKamay phosphorylate several IκBα molecules leading totheir degradation. The IKKK-IKK transduction cascaderesembles the MAPK cascade and provides signal ampli-fica-tion of several orders of magnitude [42]. This ampli-fication mechanisms enables cells to respond tofemtomolar concentrations of TNFα [17,43-45] and refer-ences therein.
Recently, in cell population studies, Cheong et al. [45]observed activation of the NF-κB regulatory module inresponse to TNFα concentrations of 0.01 ng/ml. Thisequals to 200 fM (assuming that TNFα consists of trimersof mass 51 kDa) and implies about 1 TNFα trimer per 8 ×10-12l or less than one TNFα trimer molecule per volumeof mammalian cell which is of the order 2 × 10-12l. Thisestimations suggests that cells may be activated by bind-ing of a single, or few, TNFα trimers, and that at femtomo-lar concentration some cells may become active and somenot, since TNFα binding is a stochastic process. It alsoindicates that when such small concentrations are consid-ered, the average number of TNFα trimers per cell may bea better parameter to describe the experiment than theTNFα concentration itself. For example Chan and Aggar-wal [44] observed two fold NF-κB induction at TNFα doseof 100 fM. For the EMSA assay they incubated 2 × 10⁶ cells
Two ways of signal amplification present in the modelFigure 2Two ways of signal amplification present in the model. Panel A: A20 (or IκBα) gene expression. Panel B: Transduction amplification pathway leading to IκBα degradation.
Page 4 of 20(page number not for citation purposes)
BMC Bioinformatics 2007, 8:376 http://www.biomedcentral.com/1471-2105/8/376
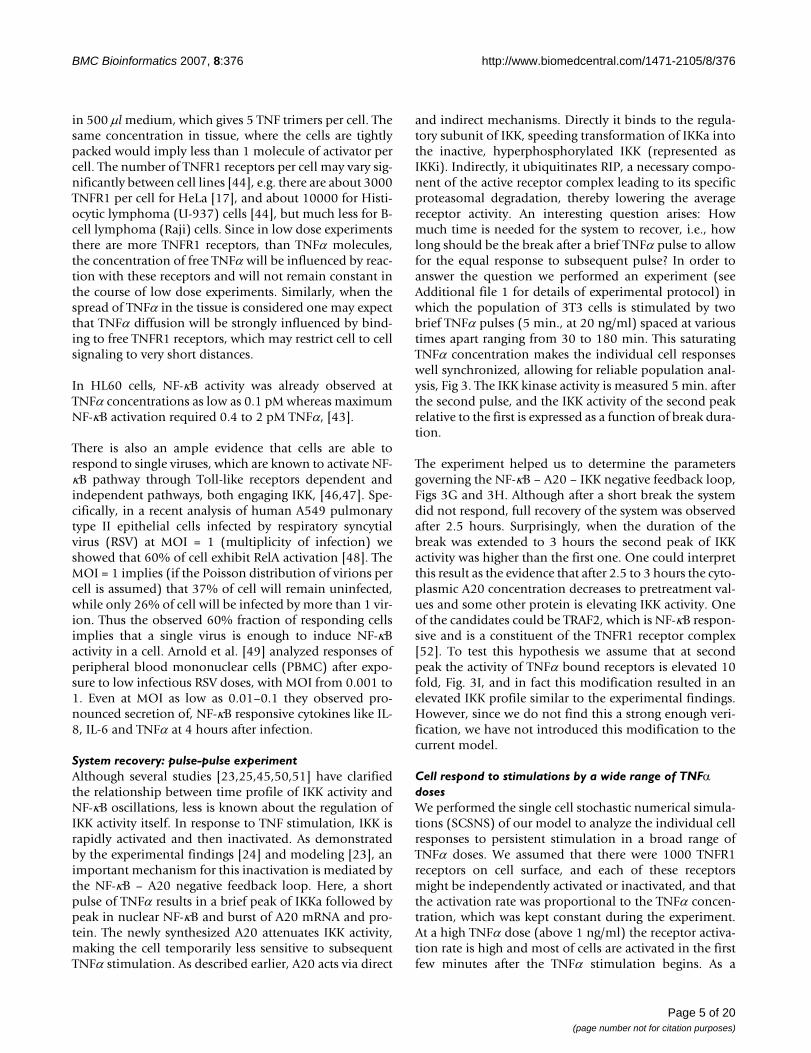
in 500 μl medium, which gives 5 TNF trimers per cell. Thesame concentration in tissue, where the cells are tightlypacked would imply less than 1 molecule of activator percell. The number of TNFR1 receptors per cell may vary sig-nificantly between cell lines [44], e.g. there are about 3000TNFR1 per cell for HeLa [17], and about 10000 for Histi-ocytic lymphoma (U-937) cells [44], but much less for B-cell lymphoma (Raji) cells. Since in low dose experimentsthere are more TNFR1 receptors, than TNFα molecules,the concentration of free TNFα will be influenced by reac-tion with these receptors and will not remain constant inthe course of low dose experiments. Similarly, when thespread of TNFα in the tissue is considered one may expectthat TNFα diffusion will be strongly influenced by bind-ing to free TNFR1 receptors, which may restrict cell to cellsignaling to very short distances.
In HL60 cells, NF-κB activity was already observed atTNFα concentrations as low as 0.1 pM whereas maximumNF-κB activation required 0.4 to 2 pM TNFα, [43].
There is also an ample evidence that cells are able torespond to single viruses, which are known to activate NF-κB pathway through Toll-like receptors dependent andindependent pathways, both engaging IKK, [46,47]. Spe-cifically, in a recent analysis of human A549 pulmonarytype II epithelial cells infected by respiratory syncytialvirus (RSV) at MOI = 1 (multiplicity of infection) weshowed that 60% of cell exhibit RelA activation [48]. TheMOI = 1 implies (if the Poisson distribution of virions percell is assumed) that 37% of cell will remain uninfected,while only 26% of cell will be infected by more than 1 vir-ion. Thus the observed 60% fraction of responding cellsimplies that a single virus is enough to induce NF-κBactivity in a cell. Arnold et al. [49] analyzed responses ofperipheral blood mononuclear cells (PBMC) after expo-sure to low infectious RSV doses, with MOI from 0.001 to1. Even at MOI as low as 0.01–0.1 they observed pro-nounced secretion of, NF-κB responsive cytokines like IL-8, IL-6 and TNFα at 4 hours after infection.
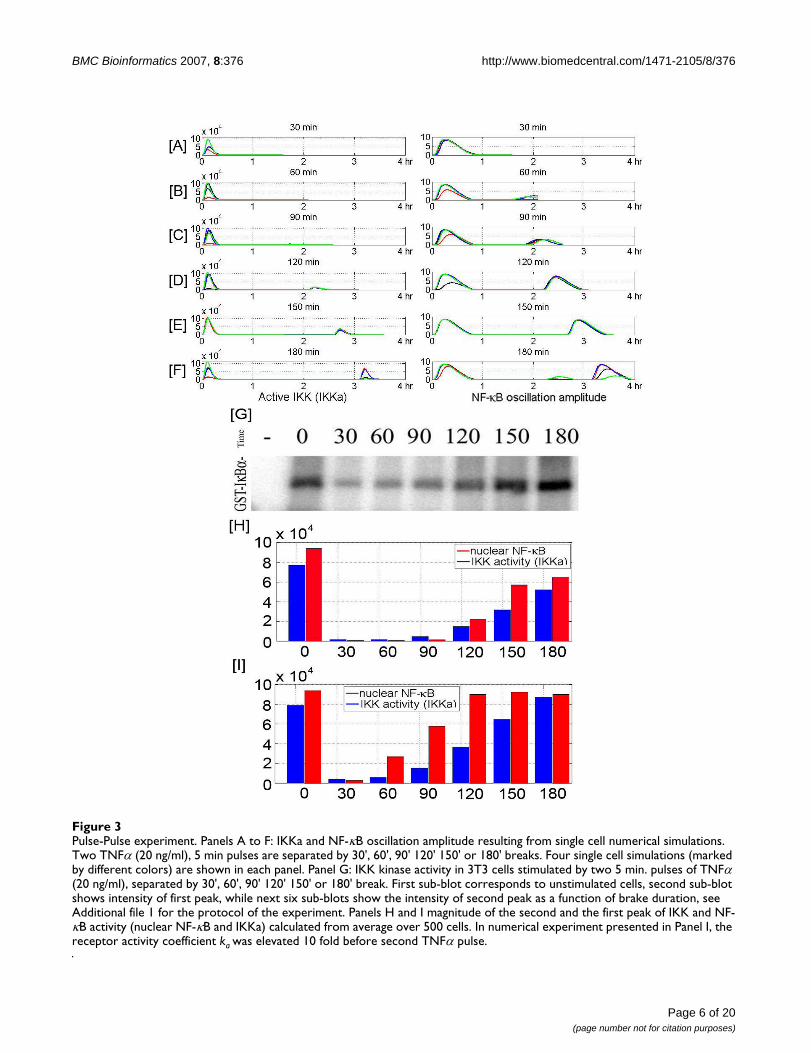
System recovery: pulse-pulse experimentAlthough several studies [23,25,45,50,51] have clarifiedthe relationship between time profile of IKK activity andNF-κB oscillations, less is known about the regulation ofIKK activity itself. In response to TNF stimulation, IKK israpidly activated and then inactivated. As demonstratedby the experimental findings [24] and modeling [23], animportant mechanism for this inactivation is mediated bythe NF-κB – A20 negative feedback loop. Here, a shortpulse of TNFα results in a brief peak of IKKa followed bypeak in nuclear NF-κB and burst of A20 mRNA and pro-tein. The newly synthesized A20 attenuates IKK activity,making the cell temporarily less sensitive to subsequentTNFα stimulation. As described earlier, A20 acts via direct
and indirect mechanisms. Directly it binds to the regula-tory subunit of IKK, speeding transformation of IKKa intothe inactive, hyperphosphorylated IKK (represented asIKKi). Indirectly, it ubiquitinates RIP, a necessary compo-nent of the active receptor complex leading to its specificproteasomal degradation, thereby lowering the averagereceptor activity. An interesting question arises: Howmuch time is needed for the system to recover, i.e., howlong should be the break after a brief TNFα pulse to allowfor the equal response to subsequent pulse? In order toanswer the question we performed an experiment (seeAdditional file 1 for details of experimental protocol) inwhich the population of 3T3 cells is stimulated by twobrief TNFα pulses (5 min., at 20 ng/ml) spaced at varioustimes apart ranging from 30 to 180 min. This saturatingTNFα concentration makes the individual cell responseswell synchronized, allowing for reliable population anal-ysis, Fig 3. The IKK kinase activity is measured 5 min. afterthe second pulse, and the IKK activity of the second peakrelative to the first is expressed as a function of break dura-tion.
The experiment helped us to determine the parametersgoverning the NF-κB – A20 – IKK negative feedback loop,Figs 3G and 3H. Although after a short break the systemdid not respond, full recovery of the system was observedafter 2.5 hours. Surprisingly, when the duration of thebreak was extended to 3 hours the second peak of IKKactivity was higher than the first one. One could interpretthis result as the evidence that after 2.5 to 3 hours the cyto-plasmic A20 concentration decreases to pretreatment val-ues and some other protein is elevating IKK activity. Oneof the candidates could be TRAF2, which is NF-κB respon-sive and is a constituent of the TNFR1 receptor complex[52]. To test this hypothesis we assume that at secondpeak the activity of TNFα bound receptors is elevated 10fold, Fig. 3I, and in fact this modification resulted in anelevated IKK profile similar to the experimental findings.However, since we do not find this a strong enough veri-fication, we have not introduced this modification to thecurrent model.
Cell respond to stimulations by a wide range of TNFα dosesWe performed the single cell stochastic numerical simula-tions (SCSNS) of our model to analyze the individual cellresponses to persistent stimulation in a broad range ofTNFα doses. We assumed that there were 1000 TNFR1receptors on cell surface, and each of these receptorsmight be independently activated or inactivated, and thatthe activation rate was proportional to the TNFα concen-tration, which was kept constant during the experiment.At a high TNFα dose (above 1 ng/ml) the receptor activa-tion rate is high and most of cells are activated in the firstfew minutes after the TNFα stimulation begins. As a
Page 5 of 20(page number not for citation purposes)
BMC Bioinformatics 2007, 8:376 http://www.biomedcentral.com/1471-2105/8/376
Page 6 of 20(page number not for citation purposes)
Pulse-Pulse experimentFigure 3Pulse-Pulse experiment. Panels A to F: IKKa and NF-κB oscillation amplitude resulting from single cell numerical simulations. Two TNFα (20 ng/ml), 5 min pulses are separated by 30', 60', 90' 120' 150' or 180' breaks. Four single cell simulations (marked by different colors) are shown in each panel. Panel G: IKK kinase activity in 3T3 cells stimulated by two 5 min. pulses of TNFα (20 ng/ml), separated by 30', 60', 90' 120' 150' or 180' break. First sub-blot corresponds to unstimulated cells, second sub-blot shows intensity of first peak, while next six sub-blots show the intensity of second peak as a function of brake duration, see Additional file 1 for the protocol of the experiment. Panels H and I magnitude of the second and the first peak of IKK and NF-κB activity (nuclear NF-κB and IKKa) calculated from average over 500 cells. In numerical experiment presented in Panel I, the receptor activity coefficient ka was elevated 10 fold before second TNFα pulse.
BMC Bioinformatics 2007, 8:376 http://www.biomedcentral.com/1471-2105/8/376
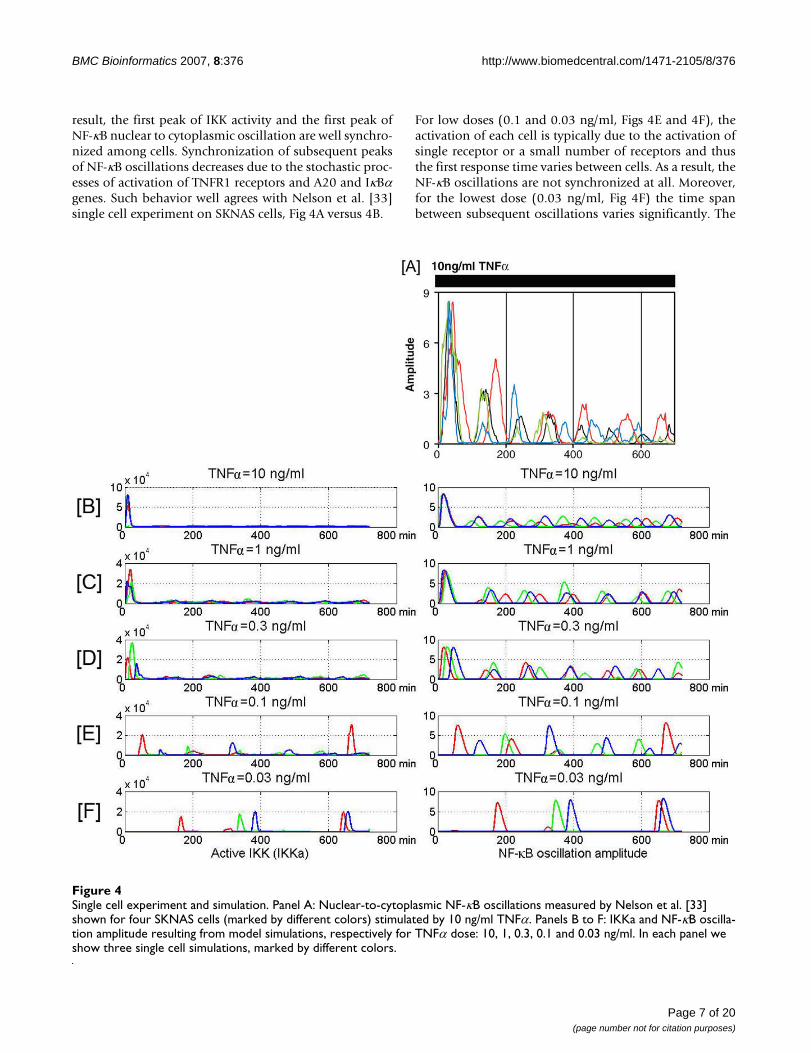
result, the first peak of IKK activity and the first peak ofNF-κB nuclear to cytoplasmic oscillation are well synchro-nized among cells. Synchronization of subsequent peaksof NF-κB oscillations decreases due to the stochastic proc-esses of activation of TNFR1 receptors and A20 and IκBαgenes. Such behavior well agrees with Nelson et al. [33]single cell experiment on SKNAS cells, Fig 4A versus 4B.
For low doses (0.1 and 0.03 ng/ml, Figs 4E and 4F), theactivation of each cell is typically due to the activation ofsingle receptor or a small number of receptors and thusthe first response time varies between cells. As a result, theNF-κB oscillations are not synchronized at all. Moreover,for the lowest dose (0.03 ng/ml, Fig 4F) the time spanbetween subsequent oscillations varies significantly. The
Single cell experiment and simulationFigure 4Single cell experiment and simulation. Panel A: Nuclear-to-cytoplasmic NF-κB oscillations measured by Nelson et al. [33] shown for four SKNAS cells (marked by different colors) stimulated by 10 ng/ml TNFα. Panels B to F: IKKa and NF-κB oscilla-tion amplitude resulting from model simulations, respectively for TNFα dose: 10, 1, 0.3, 0.1 and 0.03 ng/ml. In each panel we show three single cell simulations, marked by different colors.
Page 7 of 20(page number not for citation purposes)
BMC Bioinformatics 2007, 8:376 http://www.biomedcentral.com/1471-2105/8/376
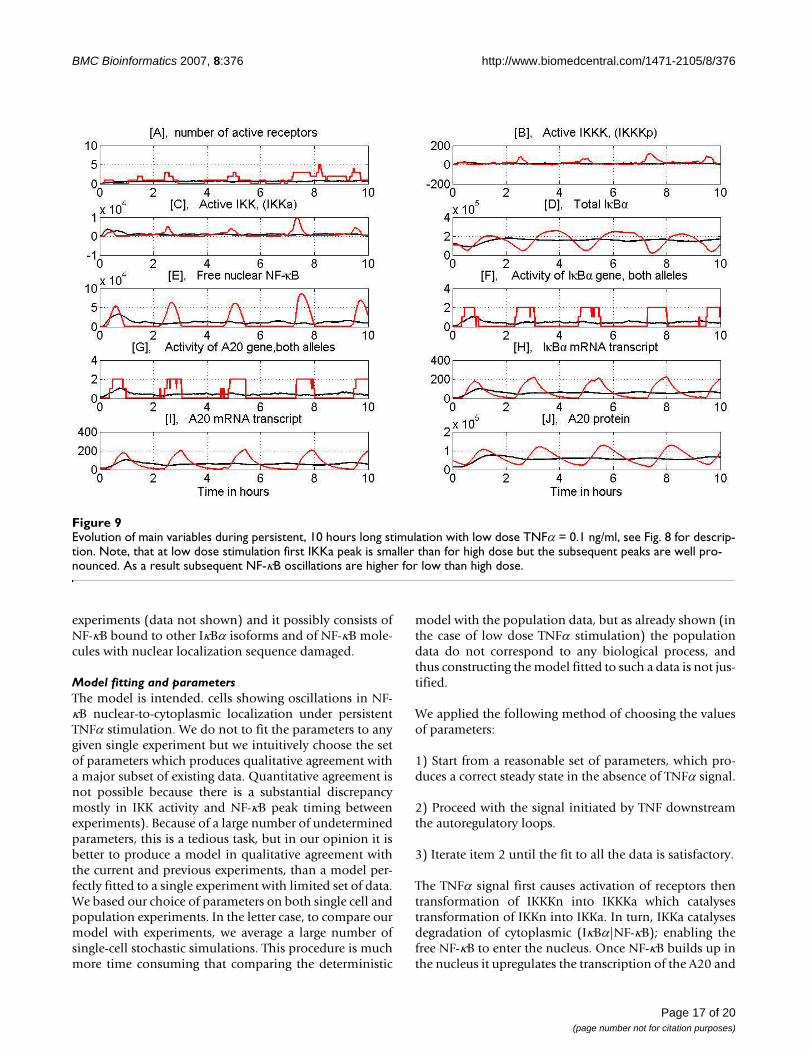
last is due to the fact that when TNFα molecules dissociatethe cell become unstimulated. It is however possible thatdissociated TNFα molecule is immediately captured byother TNFR1 receptors (or transiently by TNFR2 recep-tors) of the same cell. This effect would keep the oncestimulated cell in semi-periodic oscillatory mode for thelonger time. Interestingly, the amplitude of the secondand subsequent oscillations is higher for the low TNFαdose than for the high dose. This is due to the fact that ata low TNFα dose the IKK activation proceeds not as fast:the first peak of IKKa is smaller than for a high dose (Fig.5) and more IKKn remains to be activated. As a result thesystem at low dose stimulation exhibits subsequent IKKapulses followed by high NF-κB oscillations (Fig. 4).
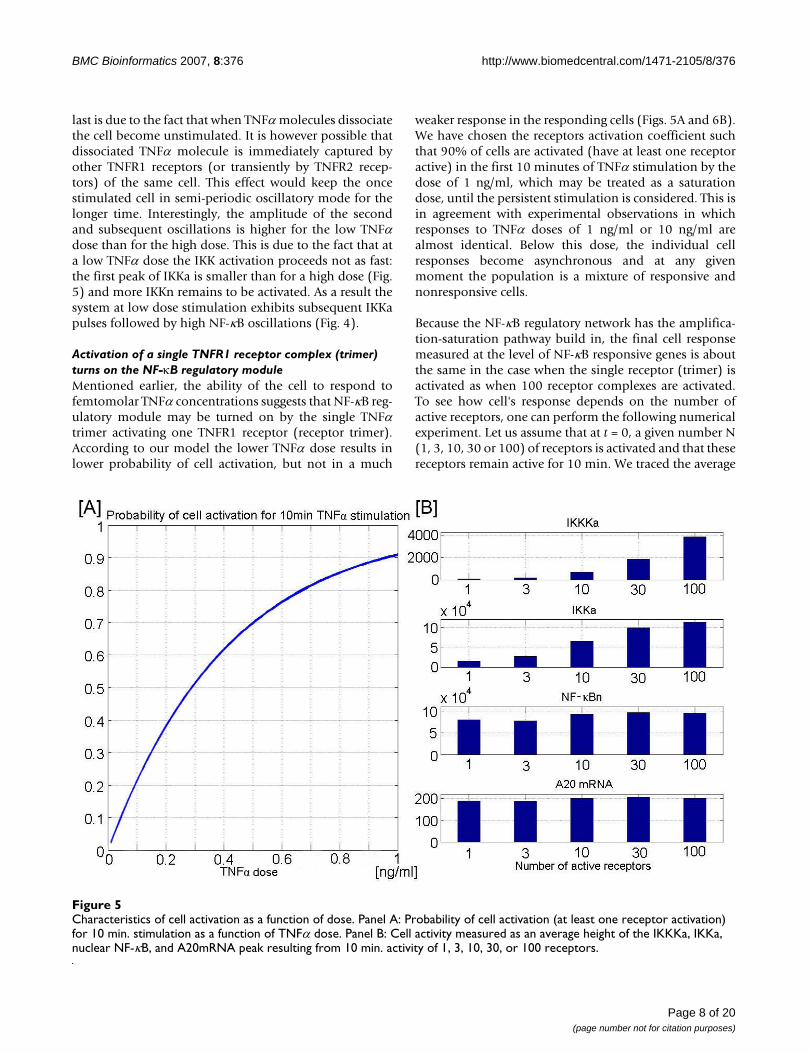
Activation of a single TNFR1 receptor complex (trimer) turns on the NF-κB regulatory moduleMentioned earlier, the ability of the cell to respond tofemtomolar TNFα concentrations suggests that NF-κB reg-ulatory module may be turned on by the single TNFαtrimer activating one TNFR1 receptor (receptor trimer).According to our model the lower TNFα dose results inlower probability of cell activation, but not in a much
weaker response in the responding cells (Figs. 5A and 6B).We have chosen the receptors activation coefficient suchthat 90% of cells are activated (have at least one receptoractive) in the first 10 minutes of TNFα stimulation by thedose of 1 ng/ml, which may be treated as a saturationdose, until the persistent stimulation is considered. This isin agreement with experimental observations in whichresponses to TNFα doses of 1 ng/ml or 10 ng/ml arealmost identical. Below this dose, the individual cellresponses become asynchronous and at any givenmoment the population is a mixture of responsive andnonresponsive cells.
Because the NF-κB regulatory network has the amplifica-tion-saturation pathway build in, the final cell responsemeasured at the level of NF-κB responsive genes is aboutthe same in the case when the single receptor (trimer) isactivated as when 100 receptor complexes are activated.To see how cell's response depends on the number ofactive receptors, one can perform the following numericalexperiment. Let us assume that at t = 0, a given number N(1, 3, 10, 30 or 100) of receptors is activated and that thesereceptors remain active for 10 min. We traced the average
Characteristics of cell activation as a function of doseFigure 5Characteristics of cell activation as a function of dose. Panel A: Probability of cell activation (at least one receptor activation) for 10 min. stimulation as a function of TNFα dose. Panel B: Cell activity measured as an average height of the IKKKa, IKKa, nuclear NF-κB, and A20mRNA peak resulting from 10 min. activity of 1, 3, 10, 30, or 100 receptors.
Page 8 of 20(page number not for citation purposes)
BMC Bioinformatics 2007, 8:376 http://www.biomedcentral.com/1471-2105/8/376
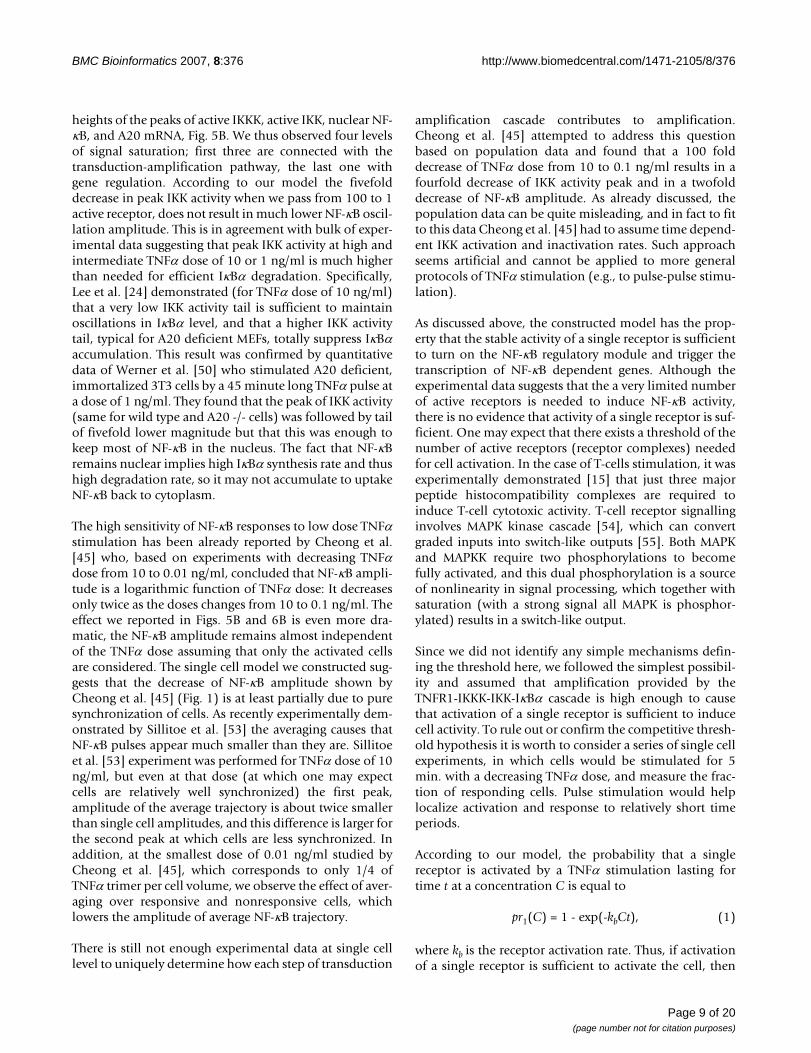
heights of the peaks of active IKKK, active IKK, nuclear NF-κB, and A20 mRNA, Fig. 5B. We thus observed four levelsof signal saturation; first three are connected with thetransduction-amplification pathway, the last one withgene regulation. According to our model the fivefolddecrease in peak IKK activity when we pass from 100 to 1active receptor, does not result in much lower NF-κB oscil-lation amplitude. This is in agreement with bulk of exper-imental data suggesting that peak IKK activity at high andintermediate TNFα dose of 10 or 1 ng/ml is much higherthan needed for efficient IκBα degradation. Specifically,Lee et al. [24] demonstrated (for TNFα dose of 10 ng/ml)that a very low IKK activity tail is sufficient to maintainoscillations in IκBα level, and that a higher IKK activitytail, typical for A20 deficient MEFs, totally suppress IκBαaccumulation. This result was confirmed by quantitativedata of Werner et al. [50] who stimulated A20 deficient,immortalized 3T3 cells by a 45 minute long TNFα pulse ata dose of 1 ng/ml. They found that the peak of IKK activity(same for wild type and A20 -/- cells) was followed by tailof fivefold lower magnitude but that this was enough tokeep most of NF-κB in the nucleus. The fact that NF-κBremains nuclear implies high IκBα synthesis rate and thushigh degradation rate, so it may not accumulate to uptakeNF-κB back to cytoplasm.
The high sensitivity of NF-κB responses to low dose TNFαstimulation has been already reported by Cheong et al.[45] who, based on experiments with decreasing TNFαdose from 10 to 0.01 ng/ml, concluded that NF-κB ampli-tude is a logarithmic function of TNFα dose: It decreasesonly twice as the doses changes from 10 to 0.1 ng/ml. Theeffect we reported in Figs. 5B and 6B is even more dra-matic, the NF-κB amplitude remains almost independentof the TNFα dose assuming that only the activated cellsare considered. The single cell model we constructed sug-gests that the decrease of NF-κB amplitude shown byCheong et al. [45] (Fig. 1) is at least partially due to puresynchronization of cells. As recently experimentally dem-onstrated by Sillitoe et al. [53] the averaging causes thatNF-κB pulses appear much smaller than they are. Sillitoeet al. [53] experiment was performed for TNFα dose of 10ng/ml, but even at that dose (at which one may expectcells are relatively well synchronized) the first peak,amplitude of the average trajectory is about twice smallerthan single cell amplitudes, and this difference is larger forthe second peak at which cells are less synchronized. Inaddition, at the smallest dose of 0.01 ng/ml studied byCheong et al. [45], which corresponds to only 1/4 ofTNFα trimer per cell volume, we observe the effect of aver-aging over responsive and nonresponsive cells, whichlowers the amplitude of average NF-κB trajectory.
There is still not enough experimental data at single celllevel to uniquely determine how each step of transduction
amplification cascade contributes to amplification.Cheong et al. [45] attempted to address this questionbased on population data and found that a 100 folddecrease of TNFα dose from 10 to 0.1 ng/ml results in afourfold decrease of IKK activity peak and in a twofolddecrease of NF-κB amplitude. As already discussed, thepopulation data can be quite misleading, and in fact to fitto this data Cheong et al. [45] had to assume time depend-ent IKK activation and inactivation rates. Such approachseems artificial and cannot be applied to more generalprotocols of TNFα stimulation (e.g., to pulse-pulse stimu-lation).
As discussed above, the constructed model has the prop-erty that the stable activity of a single receptor is sufficientto turn on the NF-κB regulatory module and trigger thetranscription of NF-κB dependent genes. Although theexperimental data suggests that the a very limited numberof active receptors is needed to induce NF-κB activity,there is no evidence that activity of a single receptor is suf-ficient. One may expect that there exists a threshold of thenumber of active receptors (receptor complexes) neededfor cell activation. In the case of T-cells stimulation, it wasexperimentally demonstrated [15] that just three majorpeptide histocompatibility complexes are required toinduce T-cell cytotoxic activity. T-cell receptor signallinginvolves MAPK kinase cascade [54], which can convertgraded inputs into switch-like outputs [55]. Both MAPKand MAPKK require two phosphorylations to becomefully activated, and this dual phosphorylation is a sourceof nonlinearity in signal processing, which together withsaturation (with a strong signal all MAPK is phosphor-ylated) results in a switch-like output.
Since we did not identify any simple mechanisms defin-ing the threshold here, we followed the simplest possibil-ity and assumed that amplification provided by theTNFR1-IKKK-IKK-IκBα cascade is high enough to causethat activation of a single receptor is sufficient to inducecell activity. To rule out or confirm the competitive thresh-old hypothesis it is worth to consider a series of single cellexperiments, in which cells would be stimulated for 5min. with a decreasing TNFα dose, and measure the frac-tion of responding cells. Pulse stimulation would helplocalize activation and response to relatively short timeperiods.
According to our model, the probability that a singlereceptor is activated by a TNFα stimulation lasting fortime t at a concentration C is equal to
pr1(C) = 1 - exp(-kbCt), (1)
where kb is the receptor activation rate. Thus, if activationof a single receptor is sufficient to activate the cell, then
Page 9 of 20(page number not for citation purposes)

BMC Bioinformatics 2007, 8:376 http://www.biomedcentral.com/1471-2105/8/376
the fraction of responding cells F would decrease approx-imately linearly with TNFα concentration C for low con-centrations C. If however, at least n receptors must beactivated in order to activate the cell then the probabilityof cell activation would be equal to prn
where N is total number of receptors and kbn is the newhypothetical TNFα binding constant. In such case the frac-tion of responding cells F would decrease faster, approxi-mately as Cn (for small C). In Fig. 6A we compare modelpredictions (n = 1, red line) against threshold hypothesis(n = 3, green line) and (n = 10, black line) for N = 1000.Activation probability functions pr3(C) and pr10(C) arenormalized by adjusting activation rates kb3 � 5.03 kb and
kb10 � 20.79 kb, what assures that all prn(C) functionsintersect at the same point at which prn(C) = 1/3.
The single pulse, low dose, experiment would also enableus to determine the "minimum cell response" as the aver-age (over subpopulation of responding cells) NF-κB oscil-lation amplitude for very small C. According to our model(Fig. 6B) such a minimum response exists and moreoverit is high enough to assure unequivocal expression of NF-κB responsive genes in majority of responding cells.
ConclusionStochastic gene activation (leading to the burst of pro-teins) and stochastic cell activation (leading to the mas-sive NF-κB nuclear translocation) leads to what might becalled "stochastic robustness" in cell regulation. If a givengene is activated, a large burst of proteins is produced, inorder to assure a sufficient level of activity of these pro-teins. Stochastic robustness assures the minimal responseto the signal. Decreasing magnitude of the signal mostlyreduces the probability of response, which leads to asmaller fraction of responding cells. This may be a usefulstrategy: If the TNFα signal is low, some cells respond bya massive NF-κB translocation, whereas some do notrespond at all. It helps to avoid ambiguity, such as whena small nuclear concentration of NF-κB leads to activationof an undefined fraction of NF-κB responsive genes. Suchan ambiguous response might do more harm than good.In fact the all-or-none responses arising due to ultrasensi-tivity and saturation or bistability (typically connectedwith positive feedbacks) have been reported for varioussignalling elements: TCR signaling [54], Xenopus p42MAPK cascade [55], transduction cascade JNK in oocytes[56], and Lac operon, e.g. [57]. The growing evidence ofbistability in various system may suggest that it is a goodstrategy for regulation at the tissue level.
Stochastic robustness allows cells to respond differently tothe same stimulation, but makes their individualresponses better defined. Both effects could be crucial inearly immune response: Diversity in cell responses causesthe tissue defense to be harder to overcome by relativelysimple programs coded in viruses and other pathogens.The more focused single cell responses help cells to decidetheir individual fates such as proliferation or apoptosis.
The stochastic model proposed by us explains the mecha-nisms of TNFα cell activation at nanomolar concentra-tions when the number of molecules of activation factorper cell is very limited. In the example of TNFα diffusionin the tissue, considered by Cheong et al. [45], concentra-tion of 0.01 ng/ml or 200 fM corresponds to less than oneTNFα trimer per cell. In such case population consists ofresponding and nonresponsive cells, and the outputobserved at the population level reflects averaging these
pr CN
ik Ct k Ctn
i
n
bni
bnN i( ) [ exp ] exp ,= −
⎛
⎝⎜
⎞
⎠⎟ × − −( ) −( )
=
− −∑1 10
1
(2)
Model predictions for pulse low dose TNFα stimulationFigure 6Model predictions for pulse low dose TNFα stimulation. Panel A: Probability of cell activation during 5 min. long TNFα stimulation as a function of dose, model prediction (red) versus threshold hypothesis: green (3 receptors), black (10 receptors). Panel B: Average height of nuclear NF-κB peak calculated for subpopulation of N = 500 of activated cells (at least with one receptor activated) after 5 min. long TNFα stimulation as a function of TNFα dose.
TNFα dose [ng/ml]
[A]
TNFα dose [ng/ml]
Page 10 of 20(page number not for citation purposes)
BMC Bioinformatics 2007, 8:376 http://www.biomedcentral.com/1471-2105/8/376
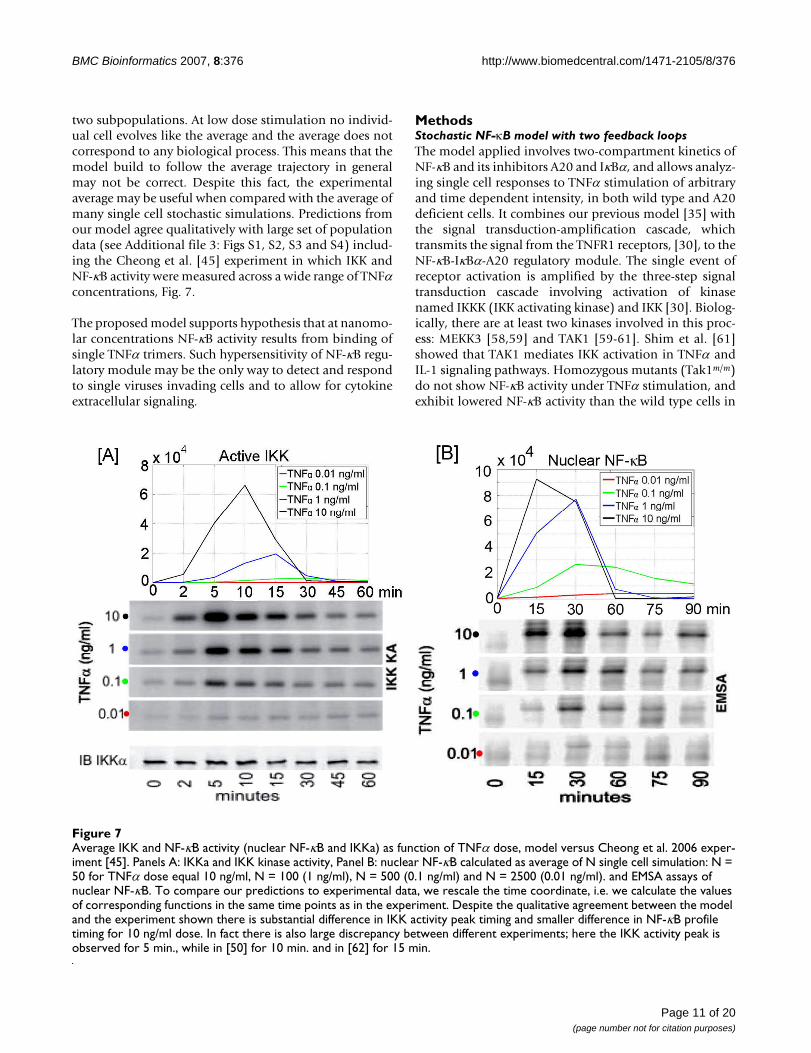
two subpopulations. At low dose stimulation no individ-ual cell evolves like the average and the average does notcorrespond to any biological process. This means that themodel build to follow the average trajectory in generalmay not be correct. Despite this fact, the experimentalaverage may be useful when compared with the average ofmany single cell stochastic simulations. Predictions fromour model agree qualitatively with large set of populationdata (see Additional file 3: Figs S1, S2, S3 and S4) includ-ing the Cheong et al. [45] experiment in which IKK andNF-κB activity were measured across a wide range of TNFαconcentrations, Fig. 7.
The proposed model supports hypothesis that at nanomo-lar concentrations NF-κB activity results from binding ofsingle TNFα trimers. Such hypersensitivity of NF-κB regu-latory module may be the only way to detect and respondto single viruses invading cells and to allow for cytokineextracellular signaling.
MethodsStochastic NF-κB model with two feedback loopsThe model applied involves two-compartment kinetics ofNF-κB and its inhibitors A20 and IκBα, and allows analyz-ing single cell responses to TNFα stimulation of arbitraryand time dependent intensity, in both wild type and A20deficient cells. It combines our previous model [35] withthe signal transduction-amplification cascade, whichtransmits the signal from the TNFR1 receptors, [30], to theNF-κB-IκBα-A20 regulatory module. The single event ofreceptor activation is amplified by the three-step signaltransduction cascade involving activation of kinasenamed IKKK (IKK activating kinase) and IKK [30]. Biolog-ically, there are at least two kinases involved in this proc-ess: MEKK3 [58,59] and TAK1 [59-61]. Shim et al. [61]showed that TAK1 mediates IKK activation in TNFα andIL-1 signaling pathways. Homozygous mutants (Tak1m/m)do not show NF-κB activity under TNFα stimulation, andexhibit lowered NF-κB activity than the wild type cells in
Average IKK and NF-κB activity (nuclear NF-κB and IKKa) as function of TNFα dose, model versus Cheong et al. 2006 exper-iment [45]Figure 7Average IKK and NF-κB activity (nuclear NF-κB and IKKa) as function of TNFα dose, model versus Cheong et al. 2006 exper-iment [45]. Panels A: IKKa and IKK kinase activity, Panel B: nuclear NF-κB calculated as average of N single cell simulation: N = 50 for TNFα dose equal 10 ng/ml, N = 100 (1 ng/ml), N = 500 (0.1 ng/ml) and N = 2500 (0.01 ng/ml). and EMSA assays of nuclear NF-κB. To compare our predictions to experimental data, we rescale the time coordinate, i.e. we calculate the values of corresponding functions in the same time points as in the experiment. Despite the qualitative agreement between the model and the experiment shown there is substantial difference in IKK activity peak timing and smaller difference in NF-κB profile timing for 10 ng/ml dose. In fact there is also large discrepancy between different experiments; here the IKK activity peak is observed for 5 min., while in [50] for 10 min. and in [62] for 15 min.
Page 11 of 20(page number not for citation purposes)
BMC Bioinformatics 2007, 8:376 http://www.biomedcentral.com/1471-2105/8/376
response to IL-1. Nho et al. [58] found that silencingMEKK3 by siRNA reduces IKK activity. These two findingsand the experiment by Blonska et al. [59] suggest thatTAK1 is recruited to the TNFR1 complex via RIP and likelycooperates with MEKK3 to activate NF-κB in TNFα signal-ing. In our model we mimic this possibly complex trans-duction mechanism by a single entity: IKKK. Toaccomplish the above, we assume that IKKK migratestoward the receptor and is activated at a receptor (transfor-mation from IKKKn to IKKKa). Active IKKKa moleculesactivate IKK molecules (transformation from IKKn toIKKa) which in turn phosphorylate IκBα molecules lead-ing to their ubiquitination and degradation. It is assumedthat the total number of IKKK and IKK molecules (as wellas of the NF-κB molecules) is constant; i.e., their degrada-tion is balanced by production, but both terms are omit-ted in the mathematical representation. The IKKKmolecules may exist in one of two states,
• native, neutral, IKKKn, specific to unstimulated restingcells without, and
• active IKKKa.
The activity of IKKK is very transient, i.e., it is activatedrapidly (with the maximum rate 1/s from single activereceptor) and inactivated with the half time of about 1min.
IKK complexes, consisting of catalytic subunits IKKα andIKKβ and regulatory subunits IKKγ, may exist in one offour states,
• native neutral (denoted by IKKn), specific to unstimu-lated resting cells.
• active (denoted by IKKa), arising from IKKn via phos-phorylation of serines 177 and 181 of IKKβ subunits [62]upon the IKKKa induced activation,
• inactive (denoted by IKKi), but different from the nativeneutral form, arising from IKKa possibly due to overphos-phorylation, and
• transient between IKKi and IKKn, also inactive, denotedby IKKii.
The activation pathway considered, which involveskinases IKKK and IKK, resembles the one introduced byPark et al. [30]. The main difference is that we take intoaccount the inactivation of IKKa is due to its transforma-tion to the state IKKi different from the native state IKKn.As a result, in contrast to Park et al. model [30], the tonicTNFα stimulation induces transient IKK activity in agree-ment with the experimental data, Figs 6 and S2.
In resting cells, the unphosphorylated IκBα binds to NF-κB and sequesters it in an inactive form in the cytoplasm.IKKa mediated phosphorylation of IκBα leads to it degra-dation and releases the main activator NF-κB, which thenenters the nucleus and triggers transcription of the twoinhibitors and numerous other genes. The newly synthe-sized IκBα leads NF-κB out of the nucleus and sequestersit in the cytoplasm.
IKK inactivation is controlled by the second inhibitorA20, which like IκBα; is strongly NF-κB responsive [22].The exact mechanism of A20's action is still not fullyresolved. Here we assume that A20 acts in two ways: (1) Itinitiates degradation of RIP, the key component of theTNFR1 receptor complex [63], which attenuates the activ-ity of receptors, and (2) it directly associates with IKKγ[64], enhancing IKKa conversion (this conversion takesplace also in A20 deficient cells but at a slower rate) to cat-alytically inactive form IKKi. The exact mechanism of IKKinactivation remains unresolved: According to Delhase etal. [62] IKK inactivates via autophosphorylation of serinesin IKKβ C-terminal region. However, recently Schomer-Miller et al. [65] found that this autophosphorylationdoes not diminish IKK activity and suggested that phos-phorylation of serines 740 and 750 in NBD/γBD domainof IKKβ may have a regulatory role and that their phos-phorylation may downregulate IKK activity. The formIKKi spontaneously converts into IKKn through inactiveintermediate forms collectively denoted by IKKii. Thenumber of these forms may be large since there are at least16 serine residues in IKKβ [65], which may be involved inregulation of IKK activity. This intermediate step is intro-duced in the model to account for the delay needed toprocess the inactivated form IKKi into native state IKKn.This effect is manifested in A20-/- cells (at persistent orlong lasting TNFα stimulation) as a downregulation ofIKK activity at about 30 min. followed by a higher plateau(Figs. S2 and S3, reproduced after [24] and [50] experi-ments). According to our model in the first minutes ofhigh dose TNFα stimulation most of IKKn is used up sothe IKK activation rate is low, only after some IKKn isrecovered via intermediated form IKKii, the activation rateand the level of IKKa may increase.
The inhibitor IκBα migrates between the nucleus andcytoplasm and forms complexes with NF-κB molecules.The nuclear IκBα|NF-κB complexes quickly migrate intothe cytoplasm. The second inhibitory protein A20 is con-sidered only in the cytoplasm where it triggers the inacti-vation of IKK. It is assumed that the transformation ratefrom IKKa into IKKi is the sum of the constant term and aterm proportional to the amount of A20.
The transcriptional regulation of A20 and IκBα genes isgoverned by the same rapid elongation regulatory mecha-
Page 12 of 20(page number not for citation purposes)
BMC Bioinformatics 2007, 8:376 http://www.biomedcentral.com/1471-2105/8/376
nism with a rapid coupling between NF-κB binding andtranscription. The mechanisms for NF-κB dependent reg-ulation of IκBα and A20 are based on the control of tran-scriptional elongation. In this situation, stalled RNApolymerase II is rapidly activated by NF-κB binding toenter a functional elongation mode, and requires contin-ued NF-κB binding for reinitiation. This is represented inour model by tight coupling of NF-κB binding to mRNAtranscription. We assume that all cells are diploid, andboth A20 and IκBα genes have two potentially activehomologous copies, each of which is independently acti-vated due to binding of NF-κB molecule to a specific reg-ulatory site in gene promoter. Following [1,3,8,35] andothers we made the simplifying assumption that eachgene copy may exist only in one of two states; active andinactive. When the copy is active the transcription is initi-ated at a high rate, when the copy is inactive transcriptionis inhibited. The gene copy becomes inactive when theNF-κB molecule is removed from its regulatory site due tothe action of IκBα molecules, which bind to DNA-associ-ated NF-κB, exporting it out of the nucleus.
In this work, as in our recent papers [35] we follow themethod proposed by Haseltine and Rawlings [66] andsplit the reaction channels into fast and slow. We considerall reactions involving mRNA and protein molecules asfast and the reactions of receptors and genes activationand inactivation as slow. Fast reactions are approximatedby the deterministic reaction-rate equations, whereas slowreactions are considered stochastic.
According to the above, the mathematical model consistsof 15 ordinary differential equations (ODEs) accountingfor
• formation of the (IκBα|NF-κB) complexes,
• IKKK and IKK kinase activation and inactivation
• IKKa driven IκBα phosphorylation,
• A20, IκBα and phospho-IκBα proteins degradation
• transport between nucleus and cytoplasm, and
• transcription and translation.
All the substrates are quantified by the numbers of mole-cules. The upper-case letters denote substrates or theircomplexes. Nuclear amount is represented by subscript n,while subscript c denoting amount of substrate in thecytoplasm is omitted, to simplify the notation. Amountsof the mRNA transcript of A20 and IκBα are denoted bysubscript t:
Notation guide• IKKn – neutral form of IKK kinase,
• IKKa – active form of IKK,
• IKKi – inactive form of IKK,
• IKKii – inactive intermediate form of IKK,
• KNN – total number of IKK = IKKn+IKKa+IKKi+IKKiimolecules (assumed to be constant in time)
• IKKKa – amount of active form of IKKK,
• IKKKn – amount of neutral form of IKKK,
• KN – total number of IKKK=IKKKn+IKKKa molecules(assumed to be constant in time)
• IκB – cytoplasmic amount of IκBα,
• IκBn – nuclear IκBα,
• IκBt – IκBα mRNA transcript,
• IκBp – phosphorylated cytoplasmic IκB
• NFκB|IκB – cytoplasmic (NF-κB|IκBα) complexes
• NFκB|IκBp – phosphorylated cytoplasmic IκBα com-plexed to NFκB
NFκB|IκBn – nuclear (NFκB|IκBα) complexes
• TNF – TNFα concentration,
• GIκB – discrete random variable, state of IκBα gene,
• GA20 – discrete random variable, state of A20 gene,
• kv = V/U – ratio of cytoplasmic to nuclear volume.
• B – number of active receptors, M – total number ofreceptors (assumed to be constant in time)
IKKK in active state (IKKKa)The first term describes IKKK kinase activation, i.e. trans-formation from IKKKn (amount of which is IKKKn = KN -IKKKa) due to action of active receptors B(t), whose activ-ity is attenuated by A20. The second term describes spon-taneous inactivation of the kinase
d
dtIKKKa t k k k A B t K IKKKa t k IKKKaa a a N i( ) /( ) ( ) ( ( ))= × + × × − − ×20 20 20 (( ).t
(3)
Page 13 of 20(page number not for citation purposes)
BMC Bioinformatics 2007, 8:376 http://www.biomedcentral.com/1471-2105/8/376
IKK in the natural state IKKnThe first term describes IKKn recovery from the intermedi-ate form IKKii (amount of which is IKKii = KNN - IKKn -IKKa - IKKi), whereas the second term describes depletionof IKKn due to its transformation into IKKa mediated byIKKKa
IKK in the active state IKKaThe first term represents transition from IKKi to IKKamediated by IKKKa, whereas the second term representsdepletion of IKKa due to its transformation into inactiveform IKKi mediated by A20
IKK in the inactive state IKKiThe first term corresponds to the formation of inactiveIKKi from IKKa by A20 mediated inactivation, whereasthe second term describes transformation into IKKii
Phospho-IκBα (IκBp)The first term describes IκBα phosphorylation due to cat-alytic action of IKKa, the second term catalytic degrada-tion of phosphorylated IκBα
Phospho-IκBα complexed to NF-κB (NFκB|IκBp)The first term describes IκBα phosphorylation (in com-plexes with NF-κB) due to the catalytic action of IKKa, thesecond term catalytic degradation of phosphorylated IκBα(NF-κB is recovered)
Free cytoplasmic NF-κBThe first two terms represents liberation of free NF-κB dueto degradation of IκBα in (IκBα|NF-κB) complexes and itsdepletion due to formation of these complexes. The thirdterm accounts for liberation of NF-κB due to degradationof phospho-IκBα. The last term describes transport of freecytoplasmic NF-κB to the nucleus,
Free nuclear NF-κBThe first term describes transport into the nucleus. Thesecond term represents depletion of free nuclear NF-κBdue to the association with nuclear IκBα and is adjusted,by multiplying the synthesis coefficient a1 by kv = V/U, tothe smaller nuclear volume resulting in a larger concentra-tion,
A20 proteinDescribed by its mRNA synthesis and constitutive degra-dation,
A20 transcriptThe first term stands for NF-κB inducible synthesis, whilethe second term describes degradation of the A20 tran-script,
Free cytoplasmic IκBα proteinThe first term accounts for IKKa induced phosphorylation,the second for NF-κB binding. The second line describesIκBα synthesis and the constitutive degradation of IκBα.The last two terms represent transport into and out of thenucleus,
Free nuclear IκBα proteinThe first term corresponds to IκBα association withnuclear NF-κB (adjusted, by multiplying the synthesiscoefficient a1 by kv, for the smaller nuclear volume result-ing in larger concentration), and the last two terms repre-sent the transport into and out of the nucleus,
d
dtIKKn t k K IKKn IKKa IKKi k IKKKa t IKKn tNN( ) ( ) ( ) ( ).= × − − − − × ×4 1
(4)
d
dtIKKa t k IKKKa t IKKn t k IKKa t k A t k( ) ( ) ( ) ( ) ( ( ))/= × × − × × +1 3 2 220
(5)
d
dtIKKi t k IKKa t k A t k k IKKi t( ) ( ) ( ( ))/ ( ).= × × + − ×3 2 2 420
(6)
d
dtI B t a IKKa t I B t t I B tp p pκ κ κ( ) ( ) ( ) ( ).= × × − ×2
(7)
d
dtNF B I B t a IKKa t NF B I B t t NF B I Bp p p( | )( ) ( ) ( | )( ) ( | )(κ κ κ κ κ κ= × × − ×3 tt).
(8)
d
dtNF B t c NF B I B t a NF B t I B t
t NF B I
a
p
κ κ κ κ κ α
κ
( ) ( | )( ) ( ) ( )
( |
= × − × ×
+ ×
6 1
κκ α κB t i NF B tp)( ) ( ).− ×1
(9)
d
dtNF B t i NF B t a k I B t NF B tn v n nκ κ κ κ( ) ( ) ( ) ( ).= × − × × ×1 1
(10)
d
dtA t c A t c A tt20 20 204 5( ) ( ) ( ).= × − × (11)
d
dtA t c G c A tt A t20 201 20 3( ) ( ).= × − × (12)
d
dtI B t a IKKa t I B t a I B t NF B t
c I B ta t
κ κ κ κ
κ
( ) ( ) ( ) ( ) ( )
( )
= − × × − × ×
+ ×
2 1
4 −− ×− × + ×
c I B t
i I B t e I B ta
a a n
5
1 1
κκ κ
( )
( ) ( ).
(13)
Page 14 of 20(page number not for citation purposes)
BMC Bioinformatics 2007, 8:376 http://www.biomedcentral.com/1471-2105/8/376
IκBα transcriptThe first term stands for NF-κB inducible synthesis,whereas the second term describes degradation of IκBαtranscript
Note that Eq. (15) (as well as 12) naturally produces sat-uration in transcription speed. When the nuclear amountof regulatory factor NF-κB is very large, then the bindingprobability is much larger than the dissociation probabil-ity, and the gene state would be Ga = 2 for most of thetime. In such case the transcription would proceed at amaximum rate, 2c1.
Cytoplasmic (IκBα|NF-κB) complexesThe first line describes formation of the complexes due toIκBα and NF-κB association and their degradation. Thefirst term in the second line represents phosphorylation ofthe (IκBα|NF-κB) complexes due to the catalytic activityof IKKa. The last term represents transport of the complexfrom the nucleus,
Nuclear (IκBα|NF-κB) complexesDescribed by their formation due to IκBα and NF-κB asso-ciation (adjusted, by multiplying the synthesis coefficienta1 by kv, to the smaller nuclear volume resulting in largerconcentration) and their transport out of the nucleus,
Propensities of receptors and genes activation and inactivation
The receptors activate and inactivate independently with
activation propensity proportional to the TNFα(t)
concentration (which may be time dependent) and inac-
tivation propensity constant
We assume that both A20 and IκBα genes have twohomologous copies independently activated due to NF-κB binding, and inactivated due IκBα mediated removal
of NF-κB molecules, and that binding and dissociationpropensities rb(t) and rd(t), respectively, are equal for eachcopy:
rb(t) = q1 × NFκBn(t), rd(t) = q2 × IκBαn(t). (19)
The state of gene copy Gi (i = 1, 2) is Gi = 1 whenever NF-κB is bound to the promoter regulatory site, and Gi = 0when the site is unoccupied. As a result the gene state G =G1 + G2 can be equal to 0, 1 or 2. In this approximation thestochasticity of single cell kinetics solely results from dis-crete regulation of receptors activity and transcription ofA20 and IκBα genes.
In model computations, the amounts of all the substratesare expressed as the numbers of molecules. Since we usethe ODE's to describe most of the model kinetics,amounts of molecules are not integer numbers, but sincethese numbers are in most cases much greater than 1, suchdescription is reasonable.
Numerical implementationThe numerical scheme implemented follows that of [35]:
(1) At simulation time t; for given states
of the A20
and IκBα genes, and number of active (bound) receptorsB (M is the total number of receptors) we calculate thetotal propensity function r(t) of occurrence of any of theactivation and inactivation reactions
(2) We select two random numbers p1 and p2 from the uni-form distribution on [0, 1].
(3) Using the fourth order MATLAB solver we evaluate thesystem of 15 ODEs accounting for fast reactions, untiltime t + τ such that
(4) There are 6 potentially possible different reactions:
• receptor may be activated or inactivated. Typically intime course there are many inactive receptors which mayactivated and active receptors which may be inactivated,but since the receptors are assumed to be identical it is notimportant which one of them changes its state.
• NF-κB may bind to or dissociate from any of two allelesof A20 and IκBα genes.
d
dtI B t a k I B t NF B t i I B t e I B tn v n n a a nκ κ κ κ κ( ) ( ) ( ) ( ) ( ).= − × × × + × − ×1 1 1
(14)
d
dtI B t c G c I B tt I B tκ κκ( ) ( ).= × − ×1 3 (15)
d
dtI B NF B t a NF B t I B t c NF B I B t
a IK
a( | )( ) ( ) ( ) ( | )( )κ κ κ κ κ κ= × × − ×
− ×
1 6
3 KKa t NF B I B t e NF B I B ta n( ) ( | )( ) ( | )( ).× + ×κ κ κ κ2
(16)
d
dtNF B I B t a k I B t NF B t e NF B I B tn v n n a n( | )( ) ( ) ( ) ( | )(κ κ κ κ κ κ= × × × − ×1 2 )).
(17)
r trb( )
rrd
r t k TNF t r krb
b rd
d( ) ( ), .= × = (18)
G G G G G GA A A I B I B I B20 201
202 1 2= + = + and κ κ κ
r t r M B r B r t G r t G rrb
rd
Ab
A I Bb
I B Ad( ) ( ) ( )( ) ( )( )= − + + − + − +20 20 202 2κ κ (( ) ( ) .t G r t GA I B
dI B20 + κ κ
(20)
log( ) ( ) .p r s dst
t1 0+ =
+∫
τ(21)
Page 15 of 20(page number not for citation purposes)
BMC Bioinformatics 2007, 8:376 http://www.biomedcentral.com/1471-2105/8/376
In this step we determine which one of 8 potentially pos-sible reactions occurs at time t+τ using the inequality
where ri(t + τ), i = 1,...,6 are individual reaction propensi-ties and k is the index of the reaction to occur.
(5) Finally time t + τ is replaced by t, and we go back toitem (1).
In all simulations before TNFα stimulation starts, we sim-ulate a resting cell for time t randomly chosen from theinterval of 15 to 25 hours in order to get equilibrated andrandomized initial conditions. As shown in [35] the rest-ing cells oscillate. Due to natural degradation of IκBα,some NF-κB molecules may occasionally enter thenucleus and activate the A20 or IκBα gene, which resultsin bursts of A20 and IκBα mRNAs and proteins. As a resultthe initial (at t = 0) level of A20 or IκBα mRNA and pro-
tein differs across the population, which influences futurecells evolution.
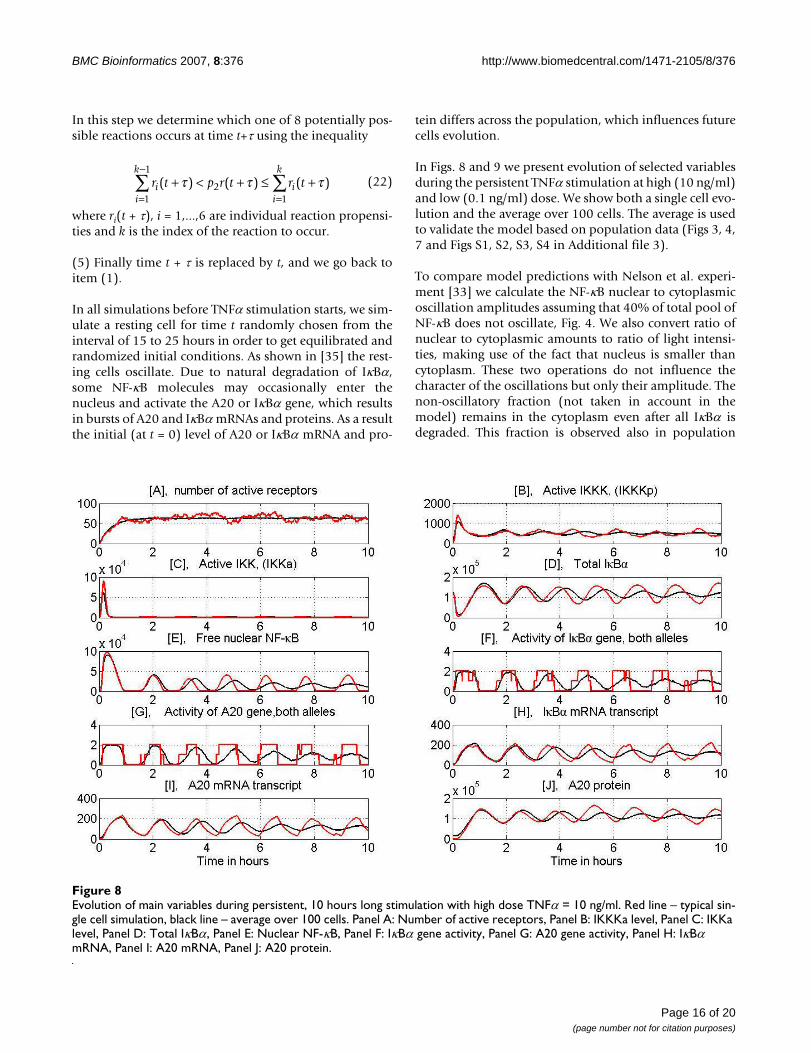
In Figs. 8 and 9 we present evolution of selected variablesduring the persistent TNFα stimulation at high (10 ng/ml)and low (0.1 ng/ml) dose. We show both a single cell evo-lution and the average over 100 cells. The average is usedto validate the model based on population data (Figs 3, 4,7 and Figs S1, S2, S3, S4 in Additional file 3).
To compare model predictions with Nelson et al. experi-ment [33] we calculate the NF-κB nuclear to cytoplasmicoscillation amplitudes assuming that 40% of total pool ofNF-κB does not oscillate, Fig. 4. We also convert ratio ofnuclear to cytoplasmic amounts to ratio of light intensi-ties, making use of the fact that nucleus is smaller thancytoplasm. These two operations do not influence thecharacter of the oscillations but only their amplitude. Thenon-oscillatory fraction (not taken in account in themodel) remains in the cytoplasm even after all IκBα isdegraded. This fraction is observed also in population
r t p r t r ti ii
k
i
k( ) ( ) ( )+ < + ≤ +
==
−∑∑ τ τ τ2
11
1(22)
Evolution of main variables during persistent, 10 hours long stimulation with high dose TNFα = 10 ng/mlFigure 8Evolution of main variables during persistent, 10 hours long stimulation with high dose TNFα = 10 ng/ml. Red line – typical sin-gle cell simulation, black line – average over 100 cells. Panel A: Number of active receptors, Panel B: IKKKa level, Panel C: IKKa level, Panel D: Total IκBα, Panel E: Nuclear NF-κB, Panel F: IκBα gene activity, Panel G: A20 gene activity, Panel H: IκBα mRNA, Panel I: A20 mRNA, Panel J: A20 protein.
Page 16 of 20(page number not for citation purposes)
BMC Bioinformatics 2007, 8:376 http://www.biomedcentral.com/1471-2105/8/376
experiments (data not shown) and it possibly consists ofNF-κB bound to other IκBα isoforms and of NF-κB mole-cules with nuclear localization sequence damaged.
Model fitting and parametersThe model is intended. cells showing oscillations in NF-κB nuclear-to-cytoplasmic localization under persistentTNFα stimulation. We do not to fit the parameters to anygiven single experiment but we intuitively choose the setof parameters which produces qualitative agreement witha major subset of existing data. Quantitative agreement isnot possible because there is a substantial discrepancymostly in IKK activity and NF-κB peak timing betweenexperiments). Because of a large number of undeterminedparameters, this is a tedious task, but in our opinion it isbetter to produce a model in qualitative agreement withthe current and previous experiments, than a model per-fectly fitted to a single experiment with limited set of data.We based our choice of parameters on both single cell andpopulation experiments. In the letter case, to compare ourmodel with experiments, we average a large number ofsingle-cell stochastic simulations. This procedure is muchmore time consuming that comparing the deterministic
model with the population data, but as already shown (inthe case of low dose TNFα stimulation) the populationdata do not correspond to any biological process, andthus constructing the model fitted to such a data is not jus-tified.
We applied the following method of choosing the valuesof parameters:
1) Start from a reasonable set of parameters, which pro-duces a correct steady state in the absence of TNFα signal.
2) Proceed with the signal initiated by TNF downstreamthe autoregulatory loops.
3) Iterate item 2 until the fit to all the data is satisfactory.
The TNFα signal first causes activation of receptors thentransformation of IKKKn into IKKKa which catalysestransformation of IKKn into IKKa. In turn, IKKa catalysesdegradation of cytoplasmic (IκBα|NF-κB); enabling thefree NF-κB to enter the nucleus. Once NF-κB builds up inthe nucleus it upregulates the transcription of the A20 and
Evolution of main variables during persistent, 10 hours long stimulation with low dose TNFα = 0.1 ng/ml, see Fig. 8 for descrip-tionFigure 9Evolution of main variables during persistent, 10 hours long stimulation with low dose TNFα = 0.1 ng/ml, see Fig. 8 for descrip-tion. Note, that at low dose stimulation first IKKa peak is smaller than for high dose but the subsequent peaks are well pro-nounced. As a result subsequent NF-κB oscillations are higher for low than high dose.
Page 17 of 20(page number not for citation purposes)
BMC Bioinformatics 2007, 8:376 http://www.biomedcentral.com/1471-2105/8/376
IκBα genes. After being translated, A20 facilitates transfor-mation of IKKa into IKKi and blocks the receptors, whileIκBα enters the nucleus, binds to NF-κB and leads it intocytoplasm. As stated in item 2, we first fit the coefficientsregulating IKK activation (using data on IKK activity),then the coefficients regulating degradation of the cyto-plasmic (IκBα|NF-κB) and IκBα degradation and so forth.If there were no feedback loops in the pathway, the pro-posed method would be quite efficient, but, since theyexist, it is necessary to iterate the signal tracing severaltimes, until the fit is satisfactory. Once a satisfactory set ofparameters is found, we observe that this set of parametersis not unique. This ambiguity is mainly caused by the lackof measurements of absolute values of protein or mRNAamounts. The action exerted by some components of thepathway onto the rest of the pathway is determined bytheir amounts multiplied by undetermined coupling coef-ficients. Hence, once we have a good set of parameters, wemay obtain another one using a smaller coupling coeffi-cient and by proportionately enlarging the absolute levelof the component. Since not all parameters may be deter-mined based on existing data we have assumed values ofpart of parameters mostly based on our intuition and fit-ted the remaining ones. By such approach we show howmuch information can be inferred from available experi-mental data. Ambiguity in parameter determination leadsto significant differences between parameters of ourmodel and the corresponding parameters chosen by oth-ers groups of researcher. Values of all model parametersare listed in discussed in detail in Additional file 2.
The validation of the proposed model, is based on ourdata (see Fig. 3) in addition to [33] (see Fig. 4), [45] (seeFig. 7), [28] (see Additional file 3: Fig. S1), [24] (see Addi-tional file 3: Fig. S2), [50] (see Additional file 3: Fig S3),[34] (see Additional file 3: Fig S4) and [62] experiments.Typical experimental data at our disposal consist of meas-urements made at time points that are not uniformly dis-tributed. Therefore, to compare our predictions toexperimental data, we rescale the time coordinate, i.e. wecalculate the values of corresponding functions in thesame time points as in the experiment, and then to guidethe eye we connect the resulting discrete points bystraight-line segments, thus obtaining a saw-like graph.
AbbreviationsA20 (TNFAIP3), TNF alpha inducible protein 3; IκBα,inhibitor of κB α subunit; IKK, IκB kinase; IKKK, IKKkinase; IRAK1 interleukin-1 receptor-associated kinase 1;MEKK3, mitogen-activated protein kinase kinase kinase 3;NF-κB, nuclear factor-κB; RIP, receptor interacting pro-tein; TAK1, transforming growth factor-β-activated kinase1; TNFα, tumor necrosis factor α; TNFR, TNF receptor;TRAF2, tumor necrosis factor receptor associated factor 2.
Competing interestsThe author(s) declares that there are no competing inter-ests.
Authors' contributionsTL, ARB and MK discussed the working hypothesis andwrote the paper. TL constructed and fitted the mathemat-ical model. PP and MK discussed the mathematicalmodel. PP wrote MATLAB programs. KP performed finalnumerical simulations and prepared the figures. ARB per-formed the IKK kinase activity experiment. All authorsread and approved the final manuscript.
Additional material
AcknowledgementsWe thank MRH White and members of his laboratory for discussion and critical reading of the manuscript. The MATLAB program written to per-form the simulations will be available at our website [67].
This work was supported by Polish Committee for Scientific Research Grants No. 4T07A 001 30, 3T11A 019 29 and PBZ-MNiI-2/1/2005 and by NHLBI contract N01-HV-28184, Proteomic technologies in airway in inflammation (A. Kurosky, P.I.).
References1. Ko MSH: Stochastic model for gene induction. J Theor Biol 1991,
53:181-194.2. Walters MC, Fiering S, Eidemiller J, Magis W, Groudine M, Martin
DIK: Enhancers increase the probability but not the level ofgene expression. Proc Natl Acad Sci USA 1995, 92:7125-7129.
3. Kepler TB, Elston TC: Stochasticity in transcriptional regula-tion: origins, consequences, and mathematical representa-tions. Biophys J 2001, 81:3116-3136.
4. Lipniacki T, Paszek P, Marciniak-Czochra A, Brasier AR, Kimmel M:Transcriptional stochasticity in gene expression. J Theor Biol2006, 238:348-367.
Additional file 3Supplementary figures S1, S2, S3 and S4. Validation of the proposed model based on experiments by Hoffmann et al. [28], Fig. S1; Lee et al. 2000 [24], Fig. S2; Werner et al. [50], Fig S3; and Nelson et al. [34], Fig S4.Click here for file[http://www.biomedcentral.com/content/supplementary/1471-2105-8-376-S3.pdf]
Additional file 1Protocol of IKK kinase activity measurements.Click here for file[http://www.biomedcentral.com/content/supplementary/1471-2105-8-376-S1.pdf]
Additional file 2Model parameters and their justification. Values and discussion of model parameters.Click here for file[http://www.biomedcentral.com/content/supplementary/1471-2105-8-376-S2.pdf]
Page 18 of 20(page number not for citation purposes)
http://www.ncbi.nlm.nih.gov/entrez/query.fcgi?cmd=Retrieve&db=PubMed&dopt=Abstract&list_uids=7624382
BMC Bioinformatics 2007, 8:376 http://www.biomedcentral.com/1471-2105/8/376
5. Paszek P, Lipniacki T, Brasier AR, Tian B, Novak DE, Kimmel M: Sto-chastic effects of multiple regulators on expression profilesin Eukaryotes. J Theor Biol 2005, 233:423-433.
6. McAdams HH, Arkin A: Stochastic mechanisms in gene expres-sion. Proc Natl Acad Sci USA 1997, 94:814-819.
7. Kierzek AM, Zaim J, Zielenkiewicz P: The effect of transcriptionand translation initiation frequencies on the stochastic fluc-tuations in prokaryotic gene expression. J Biol Chem 2001,276:8165-8172.
8. Thattai M, Oudenaarden A: Intrinsic noise in gene regulatorynetworks. Proc Natl Acad Sci USA 2001, 98:8614-8619.
9. Blake WJ, Kaern M, Cantor CR, Collins JJ: Noise in eucaryoticgene expression. Nature 2003, 422:633-637.
10. Raser JM, O'Shea EK: Control of stochasticity in eukaryoticgene expression. Science 2004, 304:1811-1814.
11. Kærn M, Elston TC, Blake WJ, Collins JJ: Stochasticity in geneexpression from theories to phenotypes. Nature Reviews 2005,6:451-464.
12. Raj A, Peskin CS, Tranchina D, Vargas DY, Tyagi S: StochasticmRNA synthesis in mammalian cells. PloS Biology 2006, 4:309.
13. Baylor D: How photons start vision. Proc Natl Acad Sci USA 1996,93:560-565.
14. Davis MM, Krogsgaard M, Huppa JB, Sumen C, Purbhoo MA, IrvineDJ, Wu LC, Ehrlich L: Dynamics of cell surface molecules duringT cell recognition. Annu Rev Biochem 2003, 72:717-742.
15. Purbhoo MA, Irvine DJ, Huppa JB, Davis MA: T cell killing does notrequire the formation of a stable mature immunological syn-apse. Nature Immunology 2004, 5:524-531.
16. Stylianou E, O'Neill LAJ, Rawlinson L, Edbrookell MR, Wool P, Sak-latvala J: Interleukin 1 induces NF-κB through its type I but notits type II receptor in lymphocytes. J Biol Chem 1992,267:15836-15641.
17. Grell M, Wajant H, Zimmermann G, Scheurich P: The type 1 recep-tor (CD120a) is the high-affinity receptor for soluble tumornecrosis factor. Proc Natl Acad Sci USA 1998, 95:570-575.
18. Tian B, Brasier AR: Identification of a nuclear factor kappabeta-dependent gene network. Recent Prog Horm Res 2003,58:95-130.
19. Hoffmann A, Baltimore D: Circuitry of nuclear κB factor signal-ing. Immunological Review 2006, 210:171-186.
20. Karin M: The beginning of the end: IκB kinase (IKK) and NF-κB activation. J Biol Chem 1999, 274:27339-27342.
21. Sun S-C, Ganchi PA, Ballard DW, Greene WC: NF-κB Controlsexpression of inhibitor IκBα : evidence for an inducibleautoregulatory pathway. Science 1993, 259:1912-1915.
22. Krikos A, Laherty CD, Dixit VM: Transcriptional activation ofthe tumor necrosis factor alpha-inducible zinc finger protein,A20, is mediated by kappa B elements. J Biol Chem 1992,267:17971-17976.
23. Lipniacki T, Paszek P, Brasier AR, Luxon B, Kimmel M: Mathemati-cal model of NF-κB regulatory module. J Theor Biol 2004,228:195-215.
24. Lee EG, Boone DL, Chai S, Libby SL, Chien M, Lodolce JP, Ma A: Fail-ure to regulate TNF-induced NF-κB and cell death responsesin A20-deficient mice. Science 2000, 289:2350-2354.
25. Ainbinder E, Revach M, Wolstein O, Moshonov S, Diamant N, Dik-stein R: Mechanism of rapid transcriptional induction oftumor necrosis factor alpha-responsive genes by NF-κB. MolCell Biol 2002, 22:6354-6362.
26. Ainbinder E, Amir-Zilberstein L, Yamaguchi Y, Handa H, Dikstein R:Elongation inhibition by DRB sensitivity-inducing factor isregulated by the A20 promoter via a novel negative elementand NF-κB. Mol Cell Biol 2004, 24:2444-2454.
27. Lipniacki T, Kimmel M: Deterministic and stochastic models ofNFκB pathway. Cardiovascular Toxicology, 2007, 7:215–234.2007, 7:215-34.
28. Hoffmann A, Levchenko A, Scott ML, Baltimore D: The IκB – NF-κB signaling module: Temporal control and selective geneactivation. Science 2002, 298:1241-1245.
29. Gerondakis S, Grossmann M, Nakamura Y, Pohl T, Grumont R:Genetic approaches in mice to understand Rel/NF-κB andIκB function: transgenics and knockouts. Oncogene 1999,18:6888-6895.
30. Park SG, Lee T, Kang HY, Park K, Cho K-H, Jung G: The influenceof the signal dynamics of activated form of IKK on NF-κB and
anti-apoptotic gene expression: A systems biology approach.FEBS Letters 2006, 580:822-830.
31. Nelson G, Paraoan L, Spiller DG, Wilde GJC, Browne AM, Djali PK,Unitt JF, Sullivan E, Floettmann E, White MRH: Multi-parameteranalysis of the kinetics of NF-κB signaling and transcriptionin single living cells. J Cell Science 2002, 115:1137-1148.
32. Schooley K, Zhu P, Dower SK, Qwarnström EE: Regulation ofnuclear translocation of nuclear factor-κB RelA: evidence forcomplex dynamics at the single-cell level. Biochem J 2003,369:331-339.
33. Nelson DE, Ihekwaba AEC, Elliot M, Johnson JR, Gibney CA, ForemanBE, Nelson G, See V, Horton CA, Spiller DG, Edwards SW, McDowellHP, Unitt JF, Sullivan E, Grimley R, Benson N, Broomhead D, Kell DB,White MRH: Oscillations in NF-κB signaling control thedynamics of gene expression. Science 2004, 306:704-708.
34. Nelson DE, Horton CA, See V, Johnson JR, Nelson G, Spiller DG, KellDB, White MRH: Response to comment on "Oscillations inNF-κB signaling control the dynamics of gene expression".Science 2005, 308:52b.
35. Lipniacki T, Paszek P, Brasier AR, Luxon B, Kimmel M: Stochasticregulation in early immune response. Biophys J 2006,90:725-742.
36. Hayot F, Jayaprakash C: NF-κB oscillations and cell-to-cell vari-ability. J Theor Biol 2006, 240:583-591.
37. Pogson M, Smallwood R, Qwarnström E, Holcombe M: Formalagent-based modelling of intracellular chemical interactions.Biosystems 2006, 85:37-45.
38. Thattai M, van Oudenaarden A: Attenuation of Noise in Ultra-sensitive Signaling Cascades. Biophys J 2002, 82:2943-2950.
39. Paulsson J, Berg OG, Ehrenberg M: Stochastic focusing: Fluctua-tion-enhanced sensitivity of intracellular regulation. Proc NatlAcad Sci USA 2000, 97:7148-7153.
40. Paulson J: Summing up the noise in gene networks. Nature2004, 427:415-418.
41. Yang L, Ross K, Qwarnstrom EE: RelA Control of IκB Phosphor-ylation. J Biol Chem 2003, 278:30881-30888.
42. Sauro HM, Kholodenko BN: Quantitative analysis of signalingnetworks. Progress in Biophysics & Molecular Biology 2004, 86:5-43.
43. Hohmann H-P, Remy R, Piischl B, van Loon APGM: Tumor necrosisfactors-α and β bind to the same two types of tumor necrosisfactor receptors and maximally activate the transcriptionfactor NF-κB at low receptor occupancy and within minutesafter receptor binding. J Biol Chem 1990, 265:15183-15188.
44. Chan H, Aggarwall BB: Role of tumor necrosis factor receptorsin the activation of nuclear factor κB in human histiocyticlymphoma U-937 cells. J Biol Chem 1994, 269:31424-31429.
45. Cheong R, Bergmann A, Werner SL, Regal J, Hoffmann A, LevchenkoA: Transient IκB kinase activity mediates temporal NF-κBdynamics in response to wide rage of tumor necrosis factor-α doses. J Biol Chem 2006, 281:2945-2950.
46. Liu P, Jamaluddin M, Li K, Garofalo RP, Casola A, Brasier AR: Retin-oic acid-inducible gene I mediates early antiviral responseand toll-like receptor 3 expression in respiratory syncytialvirus-infected airway epithelial cells. J Virology 2007,81:1401-11.
47. O'Donnell SM, Holm GH, Pierce JM, Tian B, Watson MJ, Chari RS,Ballard DW, Brasier AR, Dermody TS: Identification of an NF-κB-dependent gene network in cells infected by mammalianreovirus. J Virology 2006, 80(3):1077-1086.
48. Liu P, Choudhary S, Jamaluddin M, Li K, Garofalo R, Casola A, BrasierAR: Respiratory syncytial virus activates interferon regula-tory factor-3 in airway epithelial cells by upregulating a RIG-I-toll like receptor-3 pathway. J Virology 2007, 81:1401-1411.
49. Arnold R, Konig B, Galatti H, Werchau H, Konig W: Cytokine (IL-8, IL-6, TNF-ac) and soluble TNF receptor-I release fromhuman peripheral blood mononuclear cells after respiratorysyncytial virus infection. Immunology 1995, 85:364-372.
50. Werner SL, Barken D, Hoffmann A: Stimulus specificity of geneexpression programs determined by temporal control ofIKK activity. Science 2005, 309:1857-1861.
51. Covert MW, Leung TH, Gaston JE, Baltimore D: Achieving stabilityof Lipopolysaccharide-induced NF-κB activation. Science2005, 309:1854-1857.
52. Tian B, Nowak DE, Brasier AR: A TNF-induced gene expressionprogram under oscillatory NF-κB control. BMC Genomics 2005,6:137-154.
Page 19 of 20(page number not for citation purposes)
http://www.ncbi.nlm.nih.gov/entrez/query.fcgi?cmd=Retrieve&db=PubMed&dopt=Abstract&list_uids=9023339
http://www.ncbi.nlm.nih.gov/entrez/query.fcgi?cmd=Retrieve&db=PubMed&dopt=Abstract&list_uids=9023339
http://www.ncbi.nlm.nih.gov/entrez/query.fcgi?cmd=Retrieve&db=PubMed&dopt=Abstract&list_uids=8570595
http://www.ncbi.nlm.nih.gov/entrez/query.fcgi?cmd=Retrieve&db=PubMed&dopt=Abstract&list_uids=1386364
http://www.ncbi.nlm.nih.gov/entrez/query.fcgi?cmd=Retrieve&db=PubMed&dopt=Abstract&list_uids=1386364
http://www.ncbi.nlm.nih.gov/entrez/query.fcgi?cmd=Retrieve&db=PubMed&dopt=Abstract&list_uids=9435233
http://www.ncbi.nlm.nih.gov/entrez/query.fcgi?cmd=Retrieve&db=PubMed&dopt=Abstract&list_uids=9435233
http://www.ncbi.nlm.nih.gov/entrez/query.fcgi?cmd=Retrieve&db=PubMed&dopt=Abstract&list_uids=9435233
http://www.ncbi.nlm.nih.gov/entrez/query.fcgi?cmd=Retrieve&db=PubMed&dopt=Abstract&list_uids=8096091
http://www.ncbi.nlm.nih.gov/entrez/query.fcgi?cmd=Retrieve&db=PubMed&dopt=Abstract&list_uids=8096091
http://www.ncbi.nlm.nih.gov/entrez/query.fcgi?cmd=Retrieve&db=PubMed&dopt=Abstract&list_uids=1381359
http://www.ncbi.nlm.nih.gov/entrez/query.fcgi?cmd=Retrieve&db=PubMed&dopt=Abstract&list_uids=1381359
http://www.ncbi.nlm.nih.gov/entrez/query.fcgi?cmd=Retrieve&db=PubMed&dopt=Abstract&list_uids=1381359
http://www.ncbi.nlm.nih.gov/entrez/query.fcgi?cmd=Retrieve&db=PubMed&dopt=Abstract&list_uids=2168404
http://www.ncbi.nlm.nih.gov/entrez/query.fcgi?cmd=Retrieve&db=PubMed&dopt=Abstract&list_uids=2168404
http://www.ncbi.nlm.nih.gov/entrez/query.fcgi?cmd=Retrieve&db=PubMed&dopt=Abstract&list_uids=7989309
http://www.ncbi.nlm.nih.gov/entrez/query.fcgi?cmd=Retrieve&db=PubMed&dopt=Abstract&list_uids=7989309
http://www.ncbi.nlm.nih.gov/entrez/query.fcgi?cmd=Retrieve&db=PubMed&dopt=Abstract&list_uids=7558123
http://www.ncbi.nlm.nih.gov/entrez/query.fcgi?cmd=Retrieve&db=PubMed&dopt=Abstract&list_uids=7558123
BMC Bioinformatics 2007, 8:376 http://www.biomedcentral.com/1471-2105/8/376
Publish with BioMed Central and every scientist can read your work free of charge
"BioMed Central will be the most significant development for disseminating the results of biomedical research in our lifetime."
Sir Paul Nurse, Cancer Research UK
Your research papers will be:
available free of charge to the entire biomedical community
peer reviewed and published immediately upon acceptance
cited in PubMed and archived on PubMed Central
yours — you keep the copyright
Submit your manuscript here:http://www.biomedcentral.com/info/publishing_adv.asp
BioMedcentral
53. Sillitoe K, Horton C, Spiller DG, White MRH: Single-cell time-lapse imaging of the dynamic control of NF-κB signalling. Bio-chemical Society Transactions 2007, 35(2):263-266.
54. Altan-Bonnet G, Germain RN: Modeling T cell antigen discrimi-nation based on feedback control of digital ERK responses.PLoS Biology 2005, 3:1925-1938.
55. Ferrell JE: Tripping the switch fantastic: how a protein kinasecascade can convert graded inputs into switch-like outputs.Trends Biochem Sci 1996, 21:460-466.
56. Bagowski CP, Besser J, Frey CR, Ferrell JE: The JNK cascade as abiochemical switch in mammalian cells: Ultrasensitive andall-or-none responses. Current Biol 2003, 13:315-320.
57. Vilar JMG, Guet CC, Leibler S: Modeling network dynamics: thelac operon, a case study. J Cell Biol 2003, 161:471-476.
58. Nho CW, O'Dwyer PJ: NF-κB activation by the chemopreven-tive dithiolethione oltipraz is exerted through stimulation ofMEKK3 signaling. J Biol Chem 2004, 279:26019-26027.
59. Blonska M, Shambharkar PB, Kobayashi M, Zhang D, Sakurai H, Su B,Lin X: TAK1 is recruited to the tumor necrosis factor-α(TNF-α) receptor 1 complex in a receptor-interacting pro-tein (RIP)-dependent manner and cooperates with MEKK3leading to NF-κB activation. J Biol Chem 2005, 280:43056-43063.
60. Takaesu G, Surabhi RM, Park KJ, Ninomiya-Tsuji J, Matsumoto K,Gaynor RB: TAK1 is critical for IκB kinase-mediated activa-tion of the NF-κB Pathway. J Mol Biol 2003, 326:105-115.
61. Shim J-H, Xiao C, Paschal AE, Bailey ST, Rao P, Hayden MS, Lee K-Y,Bussey C, Steckel M, Tanaka N, Yamada G, Akira S, Matsumoto K,Ghosh S: TAK1, but not TAB1 or TAB2, plays an essentialrole in multiple signaling pathways in vivo. Genes and Develop-ment 2006, 19:2668-2681.
62. Delhase M, Hayakawa M, Chen Y, Karin M: Positive and negativeregulation of IκB kinase activity through IKKβ subunit phos-phorylation. Science 1999, 284:309-313.
63. Wertz IE, O'Rourke KM, Zhou H, Eby M, Aravind L, Seshagiri S, WuP, Wiesmann C, Baker R, Boone DL, Ma A, Koonin EV, Dixit VM: De-ubiquitination and ubiquitin ligase domains of A20 downreg-ulate NF-kB signaling. Nature 2004, 430:694-699.
64. Zhang SQ, Kovalenko A, Cantarella G, Wallach D: Recruitment ofthe IKK signalosome to the p55 TNF receptor: RIP and A20bind to Nemo (IKK3) upon receptor stimulation. Immunity2000, 12:301-311.
65. Schomer-Miller B, Higashimoto T, Lee Y-K, Zandi E: Regulation ofIκB kinase (IKK) complex by IKK-dependent phosphoryla-tion of the T-loop and C terminus of IKK. J Biol Chem 2006,281:15268-15276.
66. Haseltine EL, Rawlings JB: Approximate simulation of coupledfast and slow reactions for stochastic chemical kinetics. JChem Phys 2002, 117:6959-6969.
67. [http://www.ippt.gov.pl/~tlipnia/].
Page 20 of 20(page number not for citation purposes)
http://www.ncbi.nlm.nih.gov/entrez/query.fcgi?cmd=Retrieve&db=PubMed&dopt=Abstract&list_uids=9009826

![BMC Gastroenterology BioMed Central · 2017. 8. 28. · BMC Gastroenterology Research article ... MAP kinase [33], and AMP-activated protein kinase [34]. Further-more, several different](https://static.fdocument.org/doc/165x107/609f415b38f68d540772e0a3/bmc-gastroenterology-biomed-central-2017-8-28-bmc-gastroenterology-research.jpg)