Biostatistics Case Studies
34
Biostatistics Case Studies 2009 Peter D. Christenson Biostatistician http://gcrc.labiomed.org/biostat Session 3: Replicates and Clusters
-
Upload
medresearch -
Category
Technology
-
view
705 -
download
2
Transcript of Biostatistics Case Studies
Biostatistics Case Studies 2009
Peter D. Christenson
Biostatistician
http://gcrc.labiomed.org/biostat
Session 3:
Replicates and Clusters
Question #1
Does this paper use individual offspring outcomes or litter means to compare treatments?
Question #1
Question #1
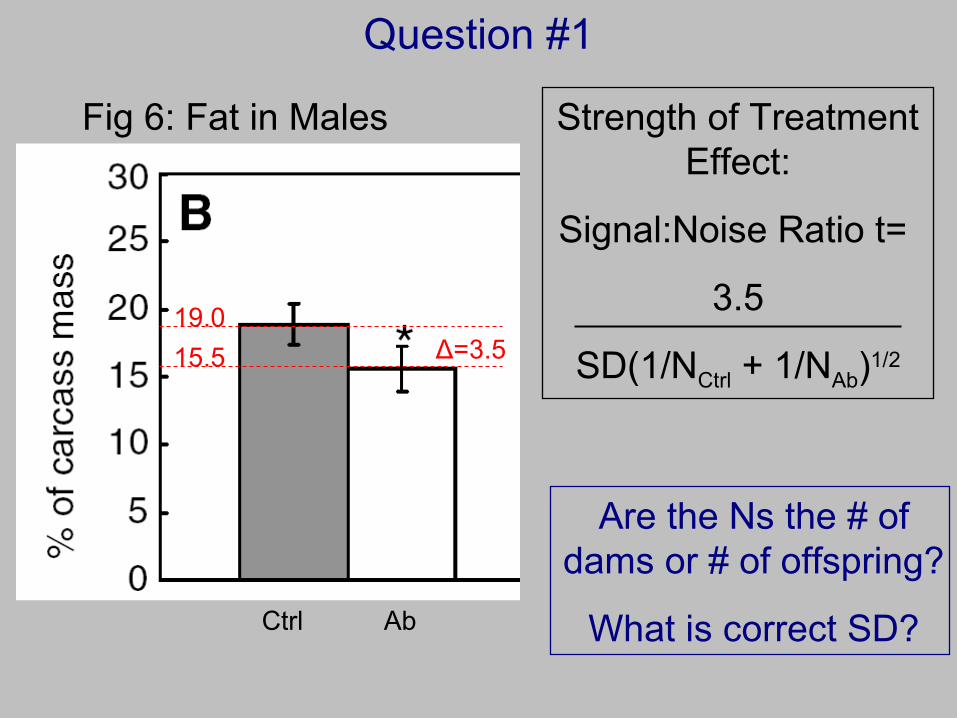
Fig 6: Fat in Males
19.0Δ=3.515.5
Strength of Treatment Effect:
Signal:Noise Ratio t=
3.5
SD(1/NCtrl + 1/NAb)1/2
Are the Ns the # of dams or # of offspring?
What is correct SD?Ctrl Ab
Question #1
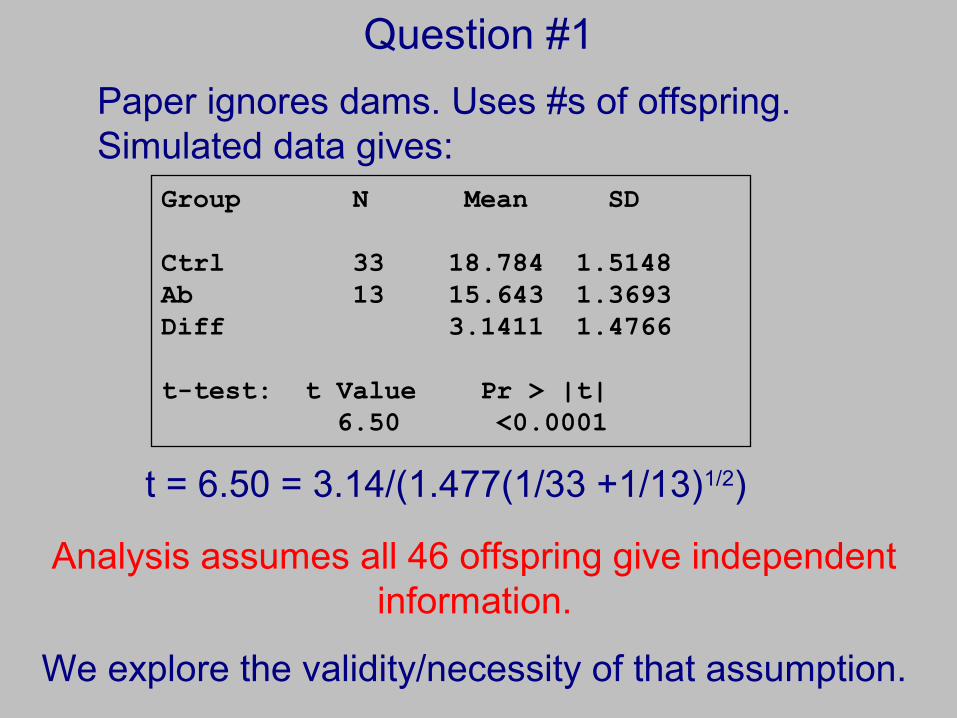
Group N Mean SD
Ctrl 33 18.784 1.5148 Ab 13 15.643 1.3693 Diff 3.1411 1.4766
t-test: t Value Pr > |t| 6.50 <0.0001
Paper ignores dams. Uses #s of offspring. Simulated data gives:
Analysis assumes all 46 offspring give independent information.
We explore the validity/necessity of that assumption.
t = 6.50 = 3.14/(1.477(1/33 +1/13)1/2)
Question #2
Does Fig 1 express biological differences or measurement error, or both?

Question #2
Question #3
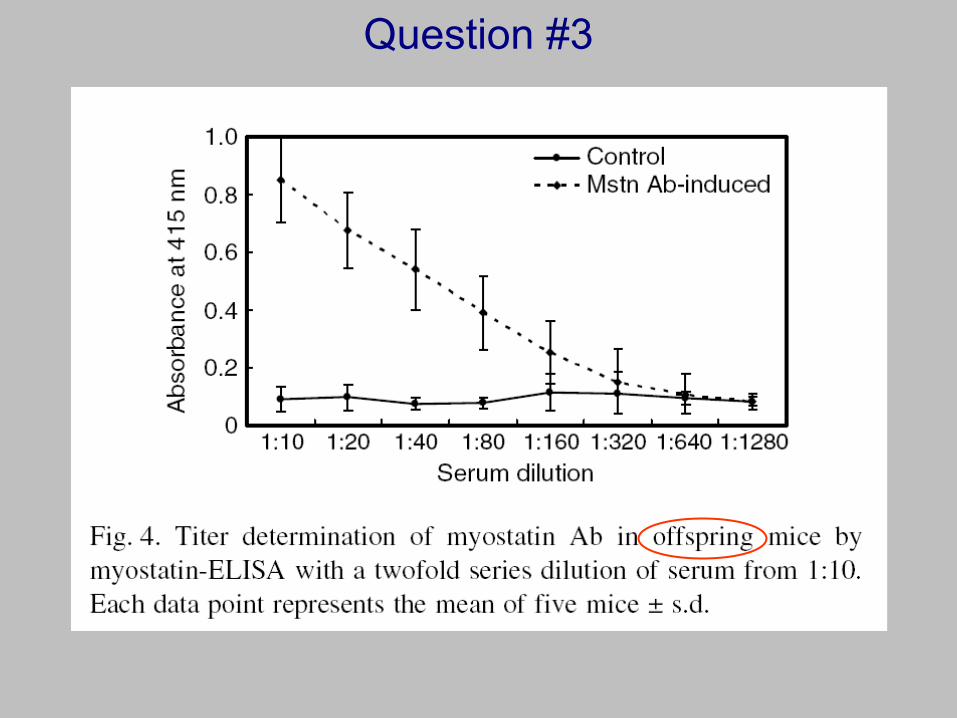
From Fig 1, is it possible (likely?) that litter-mates from a mother may respond more similarly than offspring from different mothers (who were treated the same)?
Question #3
Question #4
Suppose litter-mates do respond almost identically.
Would an analysis, say a t-test, using individual offspring that ignores the mothers give about the same treatment difference as an analysis (again, say a t-test) using the mothers means of their offspring?
Question #5
Would the answer to question #4 change if some litters had 3 offspring and others had up to 8?
Question #6
Continuing question #4, would the analysis using individual offspring overstate or understate the evidence about the treatment difference (i.e., p-value too low or too high)?
Question #7
Suppose now that outcomes from litter-mates differ about the same as offspring from different mothers. Would that justify using individual offspring, rather than mothers, in the analysis, and hence more power with the larger N?
Question #7
Suppose now that outcomes from litter-mates differ about the same as offspring from different mothers. Would that justify using individual offspring, rather than mothers, in the analysis, and hence more power with the larger N?
This requires the assumption of this equal variability, an expert opinion that may be valid, but the analysis could be faulty if that assumption is wrong. See the next question.
Question #8
Lastly, suppose that we don’t want to suppose as in questions #4-7.
Can we use the data itself to measure relative intra- and inter-litter differences, and incorporate that into the treatment comparison?
This is what hierarchical or mixed models accomplish.
They estimate the correlations among the offspring so we do not have to make assumptions as in question #7.
We now show how this is done.
Basic Issue for Using Offspring as Replicates
• Dams vary.
• Overall, offspring vary.
• Do offspring from a dam vary less than offspring from different dams (positive correlation)?
• Do offspring from a dam vary more than offspring from different dams (negative correlation)? What could cause this?
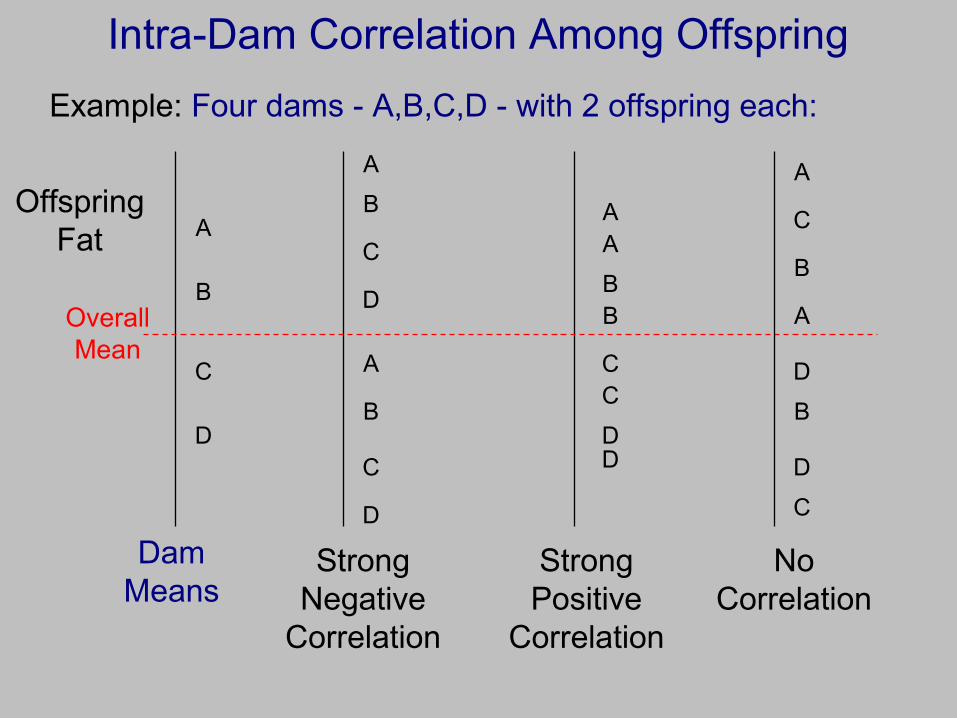
Intra-Dam Correlation Among Offspring
Example: Four dams - A,B,C,D - with 2 offspring each:
AA
BB
CC
DD
A
A
AB
B
B
C
C
C
D
D
D
Offspring Fat
Dam Means
Strong Negative
Correlation
Strong Positive
Correlation
Overall Mean
No Correlation
A
A
B
B
C
C
D
D
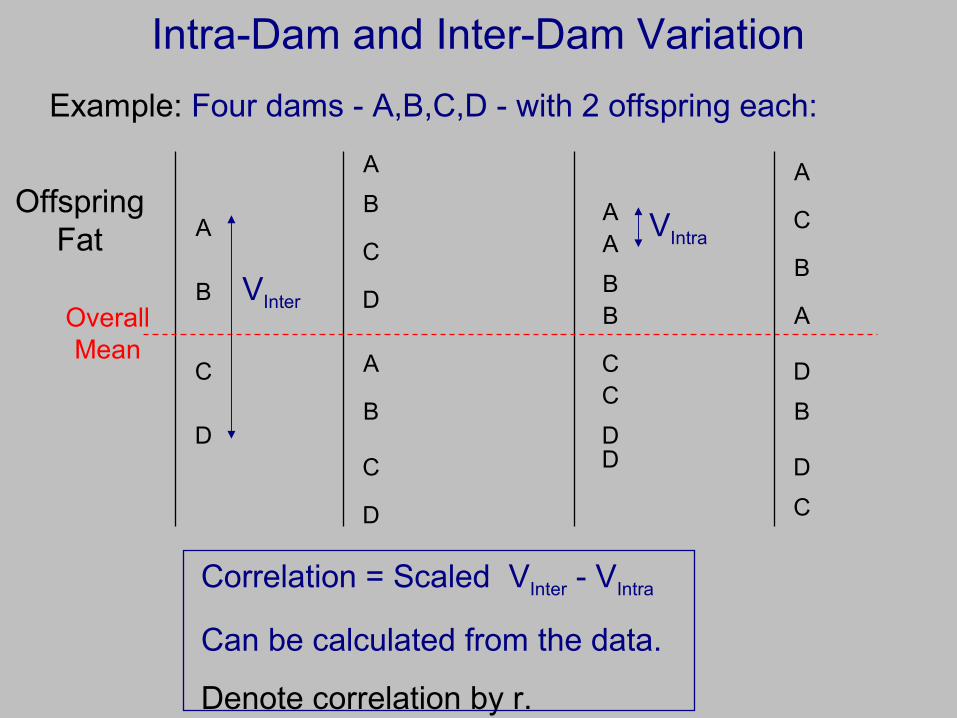
Intra-Dam and Inter-Dam Variation
Example: Four dams - A,B,C,D - with 2 offspring each:
AA
BB
CC
DD
A
A
AB
B
B
C
C
C
D
D
D
Offspring Fat
Overall Mean
Correlation = Scaled VInter - VIntra
Can be calculated from the data.
Denote correlation by r.
A
A
B
B
C
C
D
D
VInter
VIntra
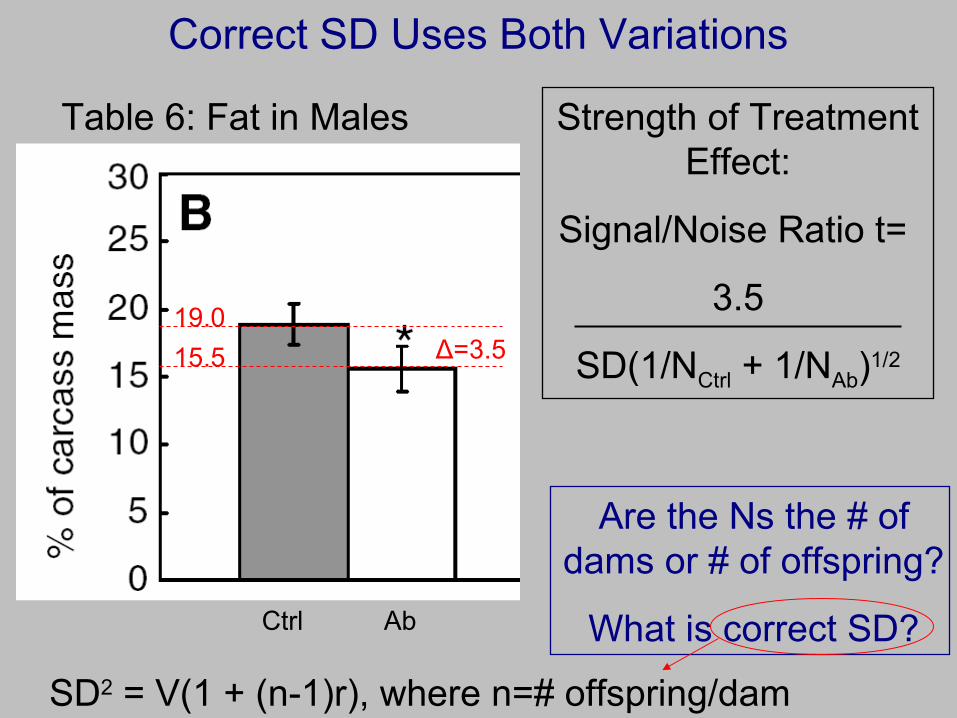
Correct SD Uses Both Variations
Table 6: Fat in Males
19.0Δ=3.515.5
Strength of Treatment Effect:
Signal/Noise Ratio t=
3.5
SD(1/NCtrl + 1/NAb)1/2
Are the Ns the # of dams or # of offspring?
What is correct SD?Ctrl Ab
SD2 = V(1 + (n-1)r), where n=# offspring/dam
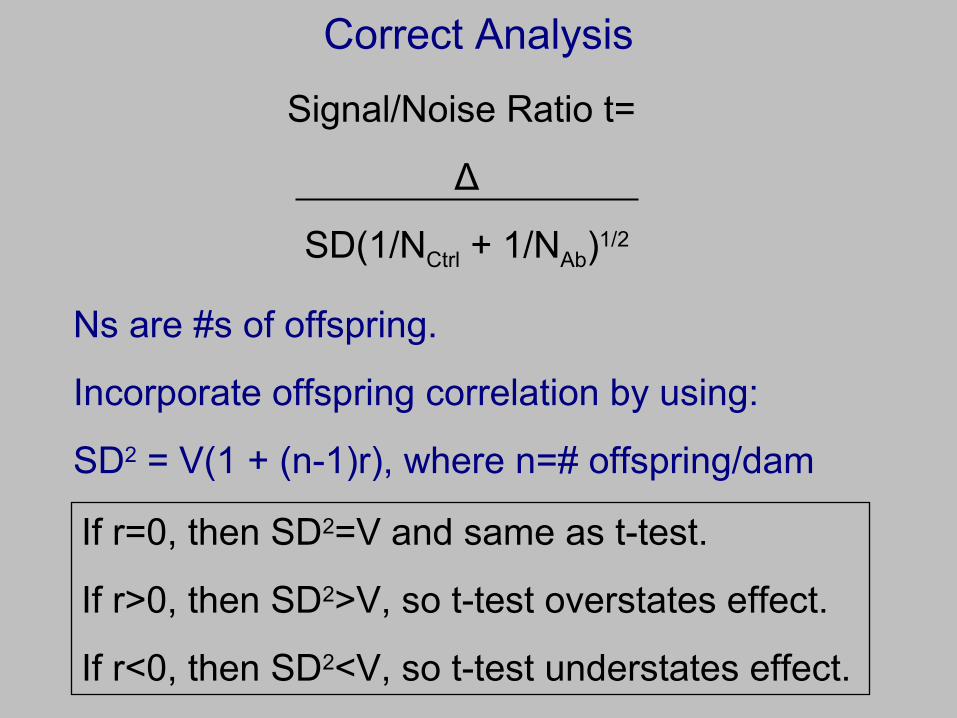
Correct Analysis
Ns are #s of offspring.
Incorporate offspring correlation by using:
SD2 = V(1 + (n-1)r), where n=# offspring/dam
Signal/Noise Ratio t=
Δ
SD(1/NCtrl + 1/NAb)1/2
If r=0, then SD2=V and same as t-test.
If r>0, then SD2>V, so t-test overstates effect.
If r<0, then SD2<V, so t-test understates effect.
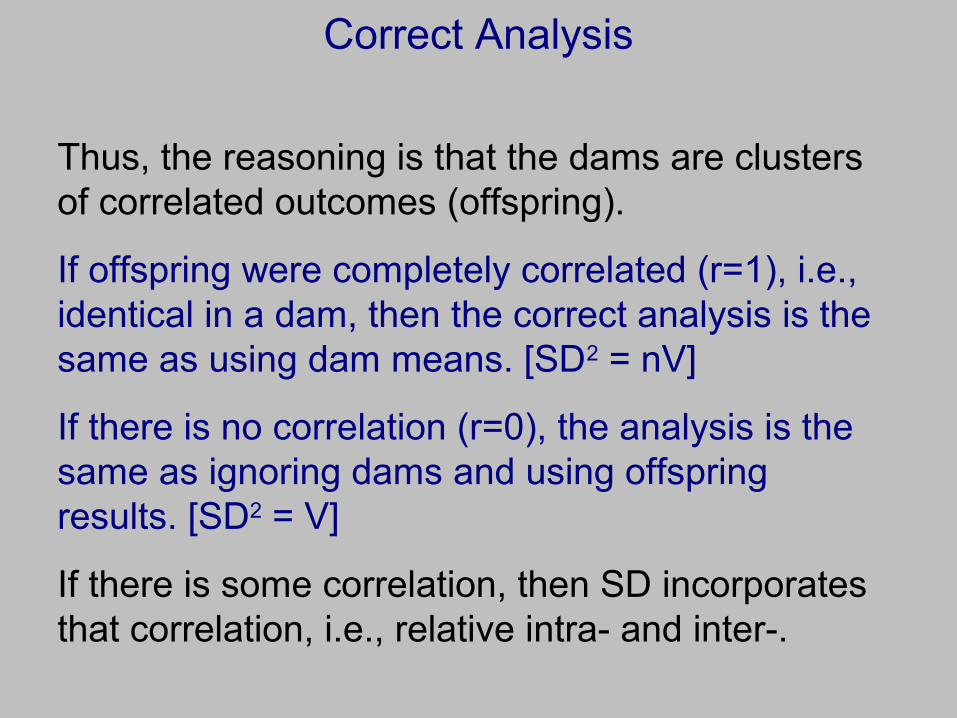
Correct Analysis
Thus, the reasoning is that the dams are clusters of correlated outcomes (offspring).
If offspring were completely correlated (r=1), i.e., identical in a dam, then the correct analysis is the same as using dam means. [SD2 = nV]
If there is no correlation (r=0), the analysis is the same as ignoring dams and using offspring results. [SD2 = V]
If there is some correlation, then SD incorporates that correlation, i.e., relative intra- and inter-.
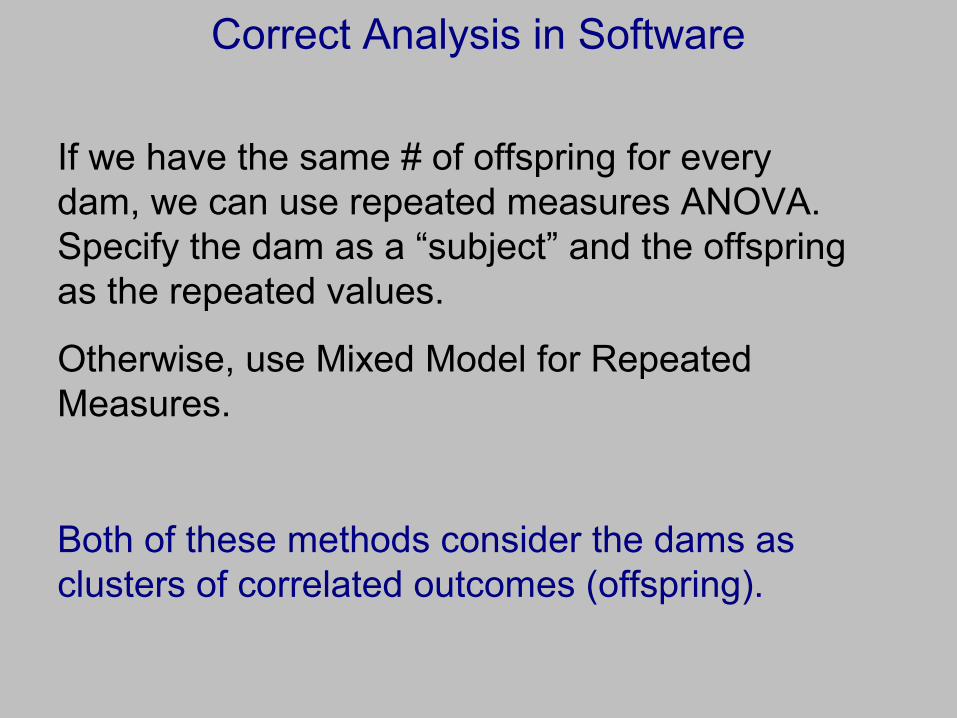
Correct Analysis in Software
If we have the same # of offspring for every dam, we can use repeated measures ANOVA. Specify the dam as a “subject” and the offspring as the repeated values.
Otherwise, use Mixed Model for Repeated Measures.
Both of these methods consider the dams as clusters of correlated outcomes (offspring).
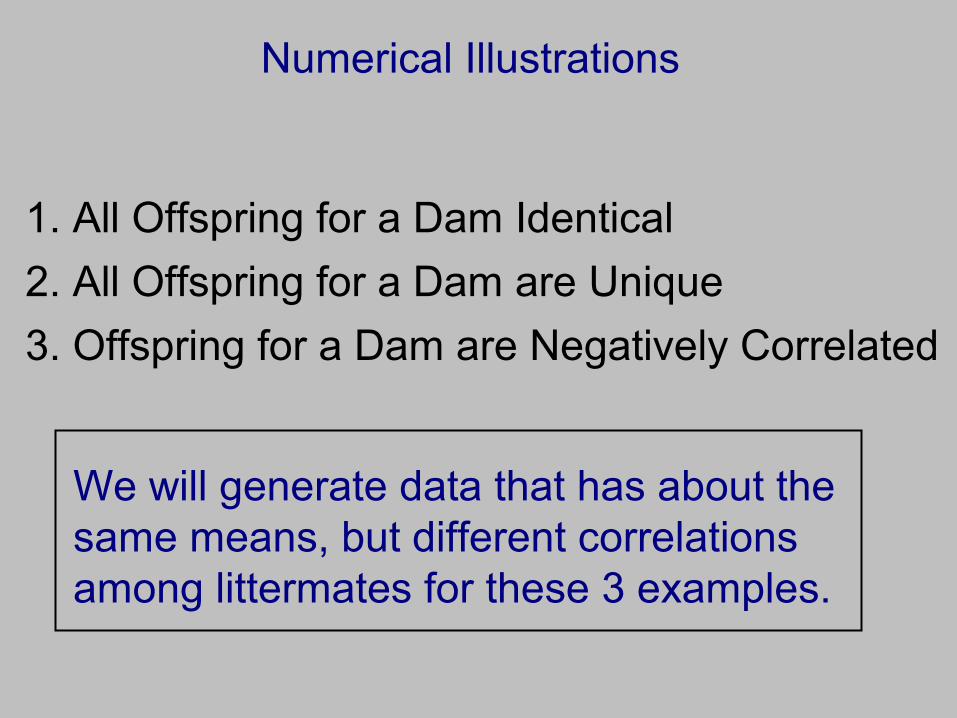
Numerical Illustrations
1. All Offspring for a Dam Identical
2. All Offspring for a Dam are Unique
3. Offspring for a Dam are Negatively Correlated
We will generate data that has about the same means, but different correlations among littermates for these 3 examples.

1. All Offspring for a Dam Identical
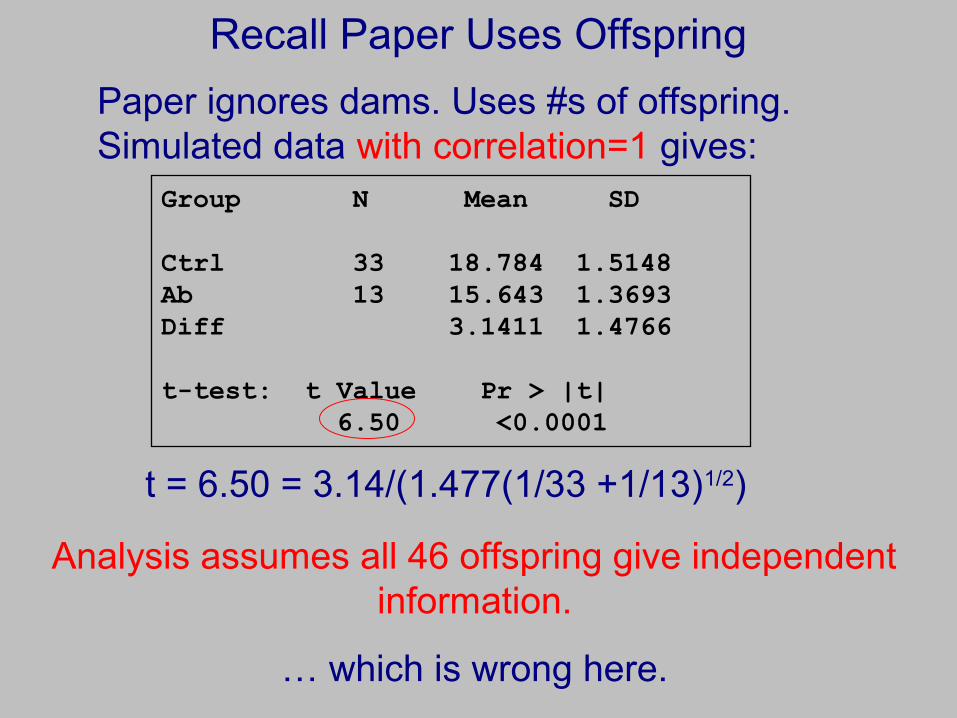
Recall Paper Uses Offspring
Group N Mean SD
Ctrl 33 18.784 1.5148 Ab 13 15.643 1.3693 Diff 3.1411 1.4766
t-test: t Value Pr > |t| 6.50 <0.0001
Paper ignores dams. Uses #s of offspring. Simulated data with correlation=1 gives:
Analysis assumes all 46 offspring give independent information.
… which is wrong here.
t = 6.50 = 3.14/(1.477(1/33 +1/13)1/2)
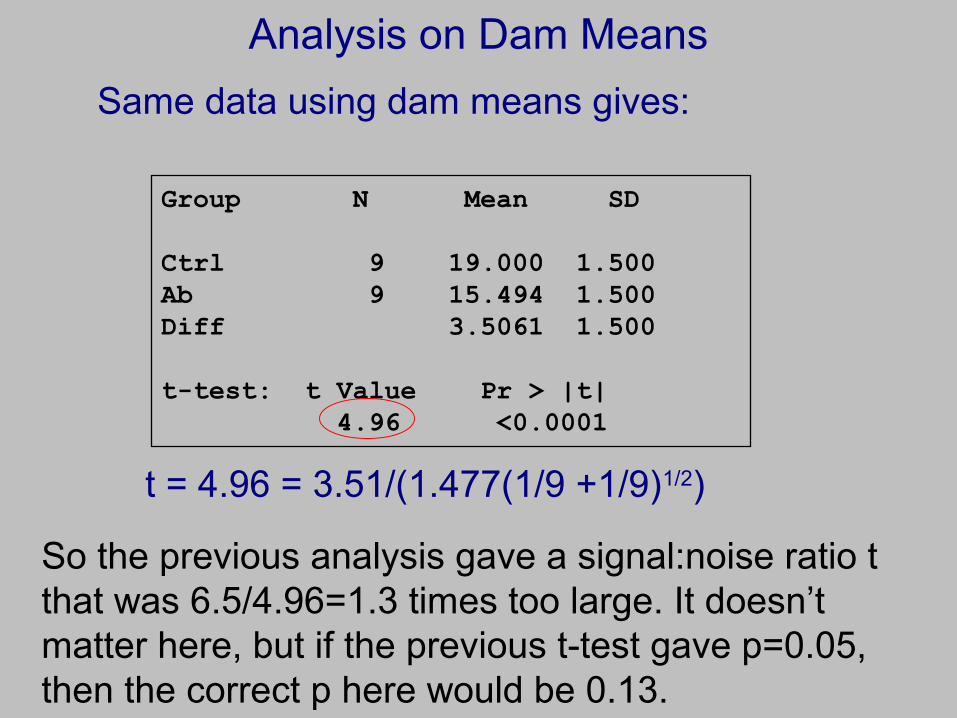
Analysis on Dam Means
Group N Mean SD
Ctrl 9 19.000 1.500Ab 9 15.494 1.500 Diff 3.5061 1.500
t-test: t Value Pr > |t| 4.96 <0.0001
Same data using dam means gives:
t = 4.96 = 3.51/(1.477(1/9 +1/9)1/2)
So the previous analysis gave a signal:noise ratio t that was 6.5/4.96=1.3 times too large. It doesn’t matter here, but if the previous t-test gave p=0.05, then the correct p here would be 0.13.
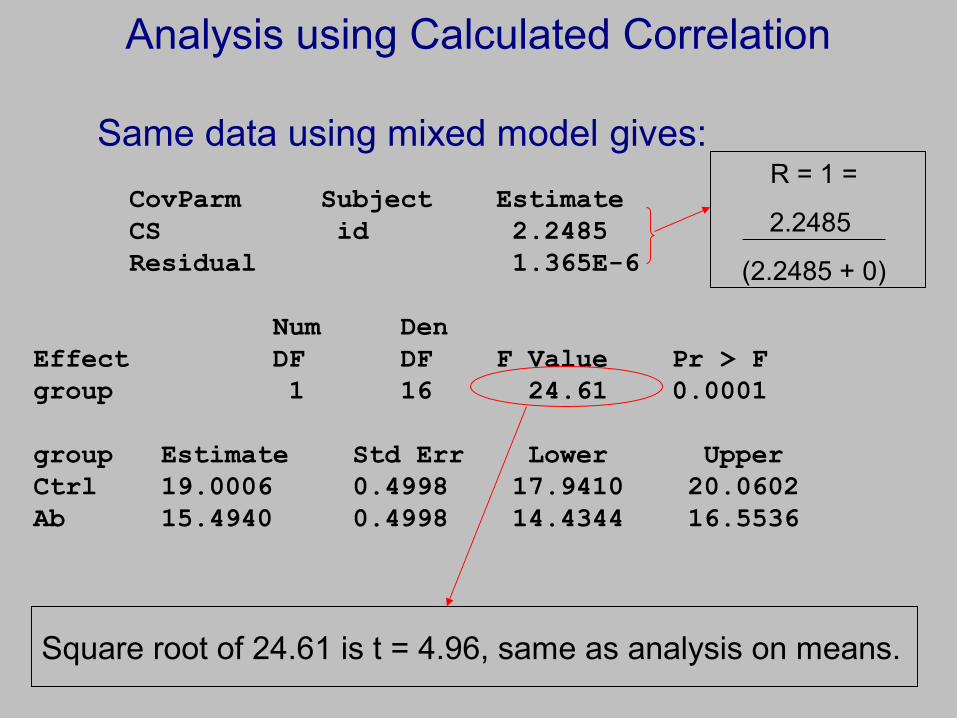
Analysis using Calculated Correlation
Same data using mixed model gives:
CovParm Subject Estimate CS id 2.2485 Residual 1.365E-6
Num DenEffect DF DF F Value Pr > Fgroup 1 16 24.61 0.0001 group Estimate Std Err Lower UpperCtrl 19.0006 0.4998 17.9410 20.0602Ab 15.4940 0.4998 14.4344 16.5536
Square root of 24.61 is t = 4.96, same as analysis on means.
R = 1 =
2.2485
(2.2485 + 0)

2. All Offspring for a Dam are Unique
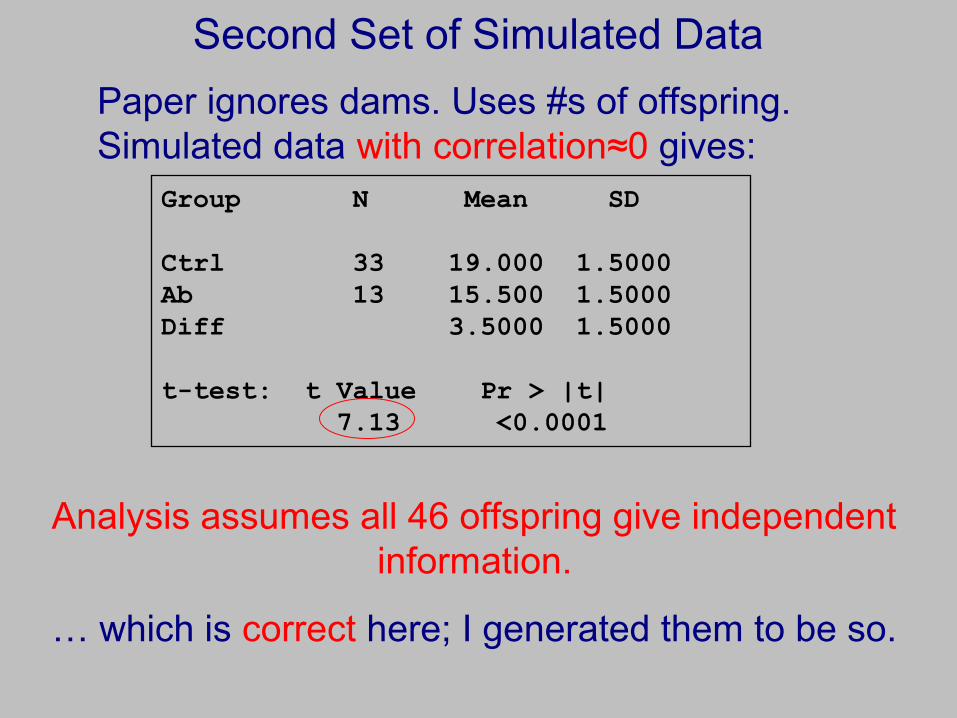
Second Set of Simulated Data
Group N Mean SD
Ctrl 33 19.000 1.5000 Ab 13 15.500 1.5000 Diff 3.5000 1.5000
t-test: t Value Pr > |t| 7.13 <0.0001
Paper ignores dams. Uses #s of offspring. Simulated data with correlation≈0 gives:
Analysis assumes all 46 offspring give independent information.
… which is correct here; I generated them to be so.
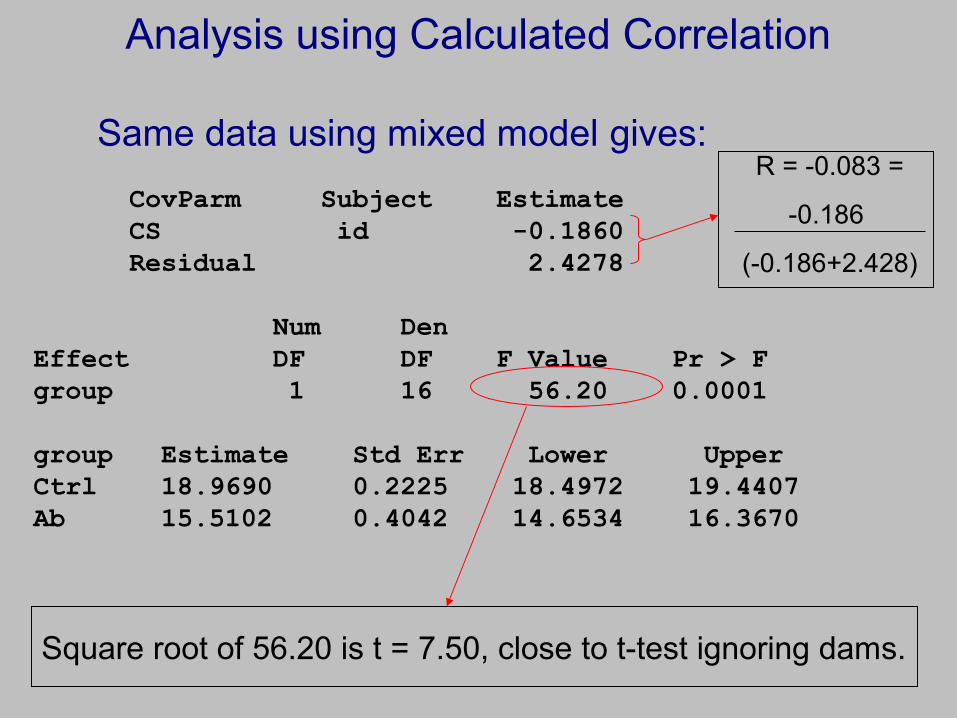
Analysis using Calculated Correlation
Same data using mixed model gives:
CovParm Subject Estimate CS id -0.1860 Residual 2.4278
Num DenEffect DF DF F Value Pr > Fgroup 1 16 56.20 0.0001 group Estimate Std Err Lower UpperCtrl 18.9690 0.2225 18.4972 19.4407Ab 15.5102 0.4042 14.6534 16.3670
R = -0.083 =
-0.186
(-0.186+2.428)
Square root of 56.20 is t = 7.50, close to t-test ignoring dams.
3. Offspring for a Dam are Negatively Correlated
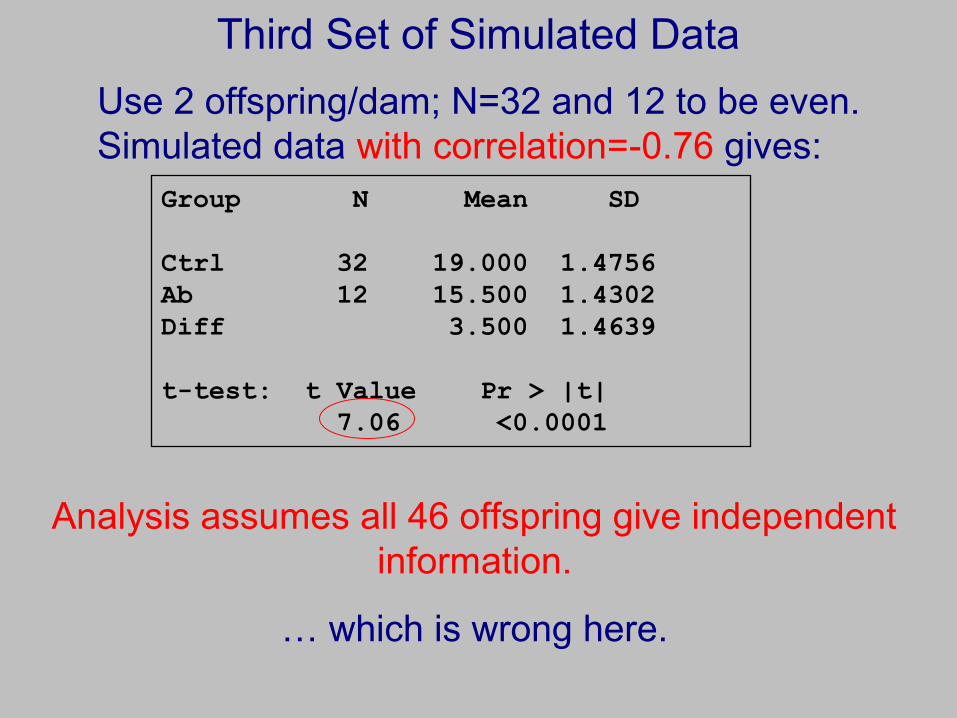
Third Set of Simulated Data
Group N Mean SD
Ctrl 32 19.000 1.4756 Ab 12 15.500 1.4302 Diff 3.500 1.4639
t-test: t Value Pr > |t| 7.06 <0.0001
Use 2 offspring/dam; N=32 and 12 to be even. Simulated data with correlation=-0.76 gives:
Analysis assumes all 46 offspring give independent information.
… which is wrong here.
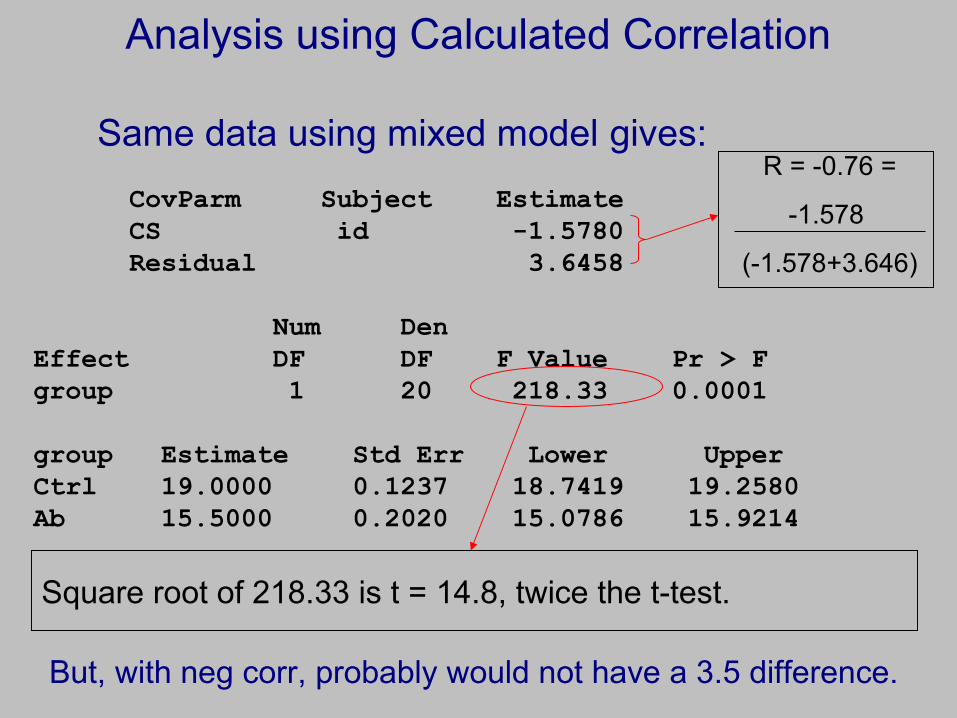
Analysis using Calculated Correlation
Same data using mixed model gives:
CovParm Subject Estimate CS id -1.5780 Residual 3.6458
Num DenEffect DF DF F Value Pr > Fgroup 1 20 218.33 0.0001 group Estimate Std Err Lower UpperCtrl 19.0000 0.1237 18.7419 19.2580Ab 15.5000 0.2020 15.0786 15.9214
R = -0.76 =
-1.578
(-1.578+3.646)
Square root of 218.33 is t = 14.8, twice the t-test.
But, with neg corr, probably would not have a 3.5 difference.