Biophysical and physicochemical methods for analyzing ... · Biophysical and physicochemical...
43
Biophysical and physicochemical methods for analyzing plants in vivo and in situ (II): UV/VIS-Spectroscopy from pigment analysis to quantification of mRNA
-
Upload
truongtram -
Category
Documents
-
view
229 -
download
0
Transcript of Biophysical and physicochemical methods for analyzing ... · Biophysical and physicochemical...
Biophysical and physicochemical methodsfor analyzing plants in vivo and in situ (II):
UV/VIS-Spectroscopyfrom pigment analysis
to quantification of mRNA
Chlorophyll
S0
S2
S1T1
h·ν
h·ν
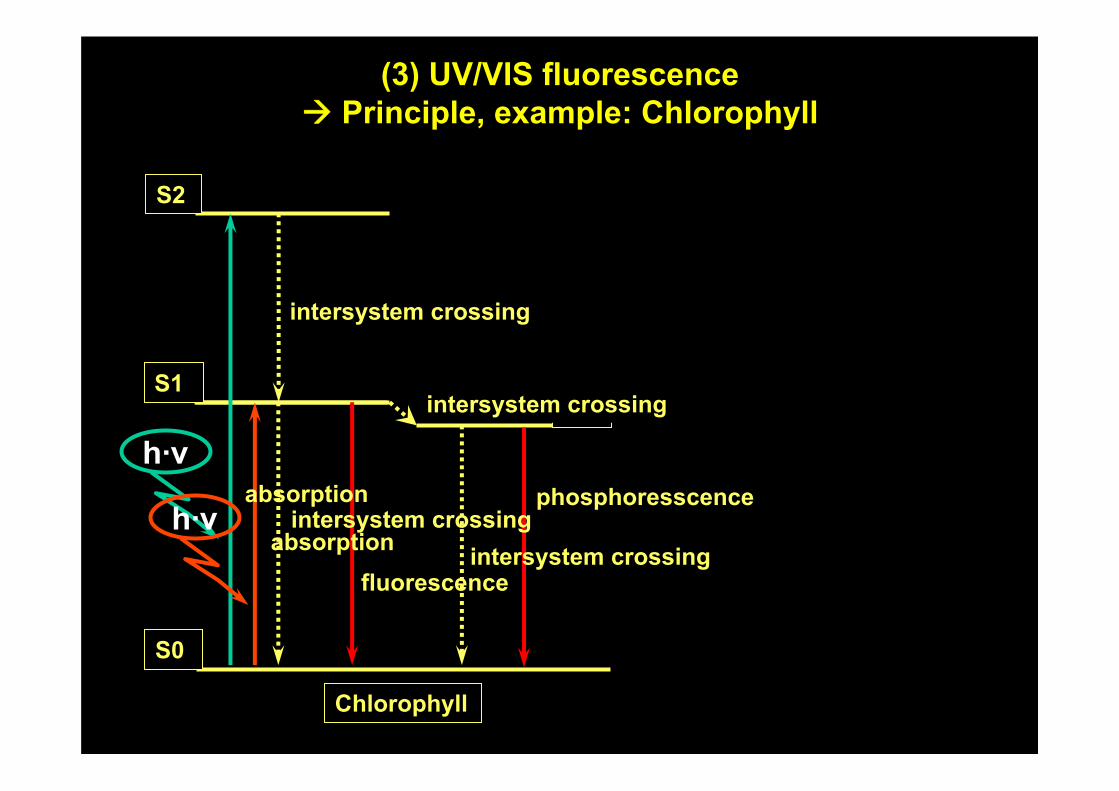
intersystem crossing
absorption
absorptionfluorescence
intersystem crossingintersystem crossing
phosphoresscence
intersystem crossing
(3) UV/VIS fluorescencePrinciple, example: Chlorophyll
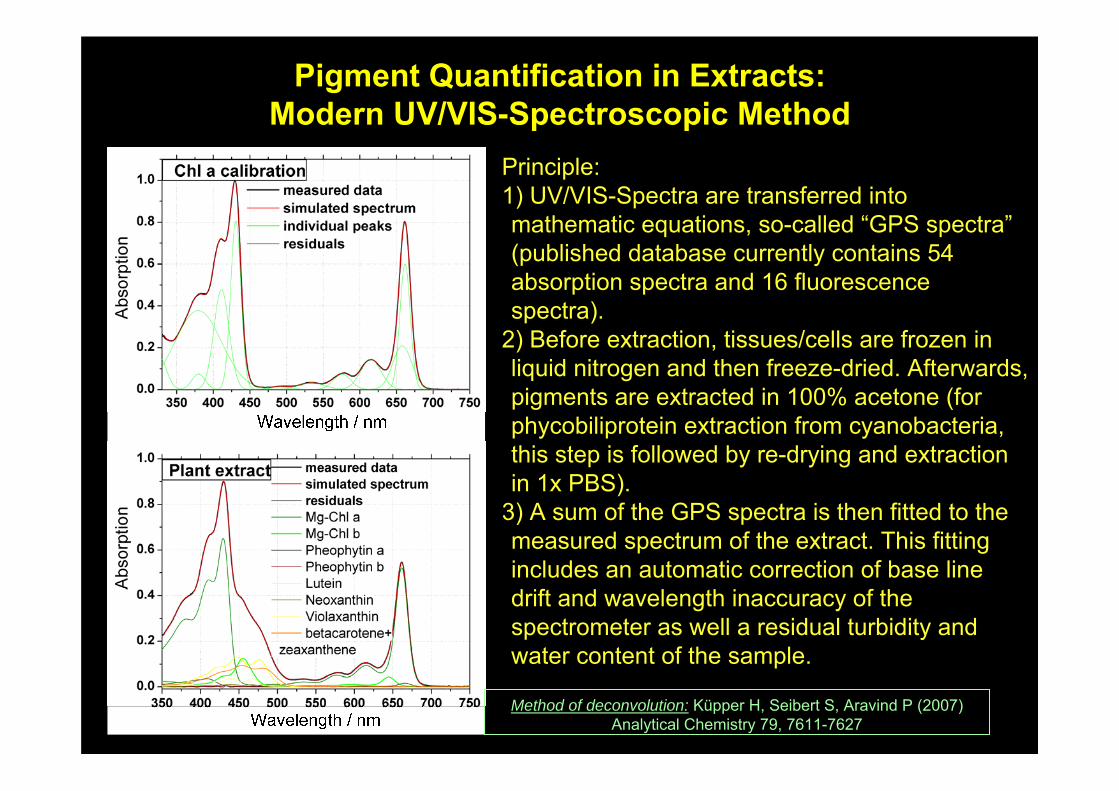
Pigment Quantification in Extracts:Modern UV/VIS-Spectroscopic Method
Principle: 1) UV/VIS-Spectra are transferred into mathematic equations, so-called “GPS spectra”(published database currently contains 54 absorption spectra and 16 fluorescence spectra).
2) Before extraction, tissues/cells are frozen in liquid nitrogen and then freeze-dried. Afterwards, pigments are extracted in 100% acetone (for phycobiliprotein extraction from cyanobacteria, this step is followed by re-drying and extraction in 1x PBS).
3) A sum of the GPS spectra is then fitted to the measured spectrum of the extract. This fitting includes an automatic correction of base line drift and wavelength inaccuracy of the spectrometer as well a residual turbidity and water content of the sample.
Method of deconvolution: Küpper H, Seibert S, Aravind P (2007) Analytical Chemistry 79, 7611-7627
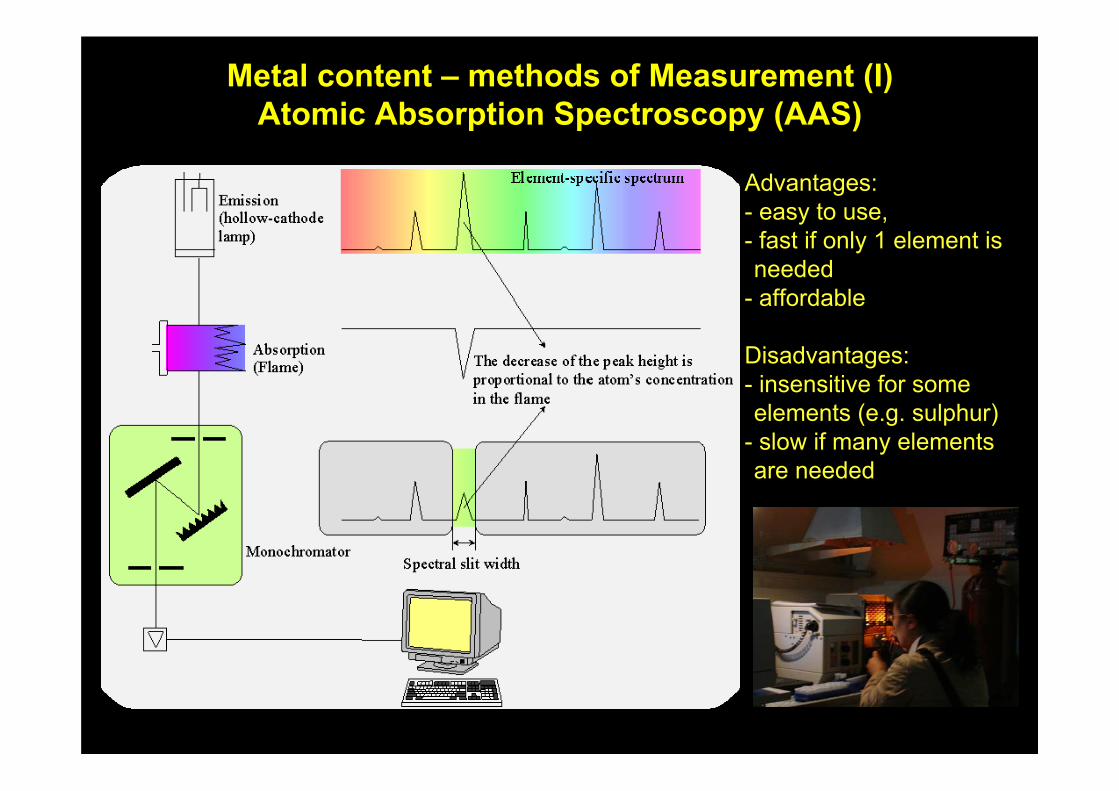
Metal content – methods of Measurement (I) Atomic Absorption Spectroscopy (AAS)
Advantages:- easy to use, - fast if only 1 element is needed
- affordable
Disadvantages:- insensitive for some elements (e.g. sulphur)
- slow if many elements are needed
Measurement of in vivo / in situ-UV/VIS-Spectra(non-imaging)
Why in vivo / in situ?--> direct correlation with physiological parameters possible--> no extraction artefacts--> measurement on single cells possible--> high time resolution when measuring kinetics
Disadvantages compared to measurements of extracts:--> many overlapping bands of the same pigment due to protein binding--> banden very broad--> extinctions coefficients in vivo usually unknown --> usually no absolute quantification
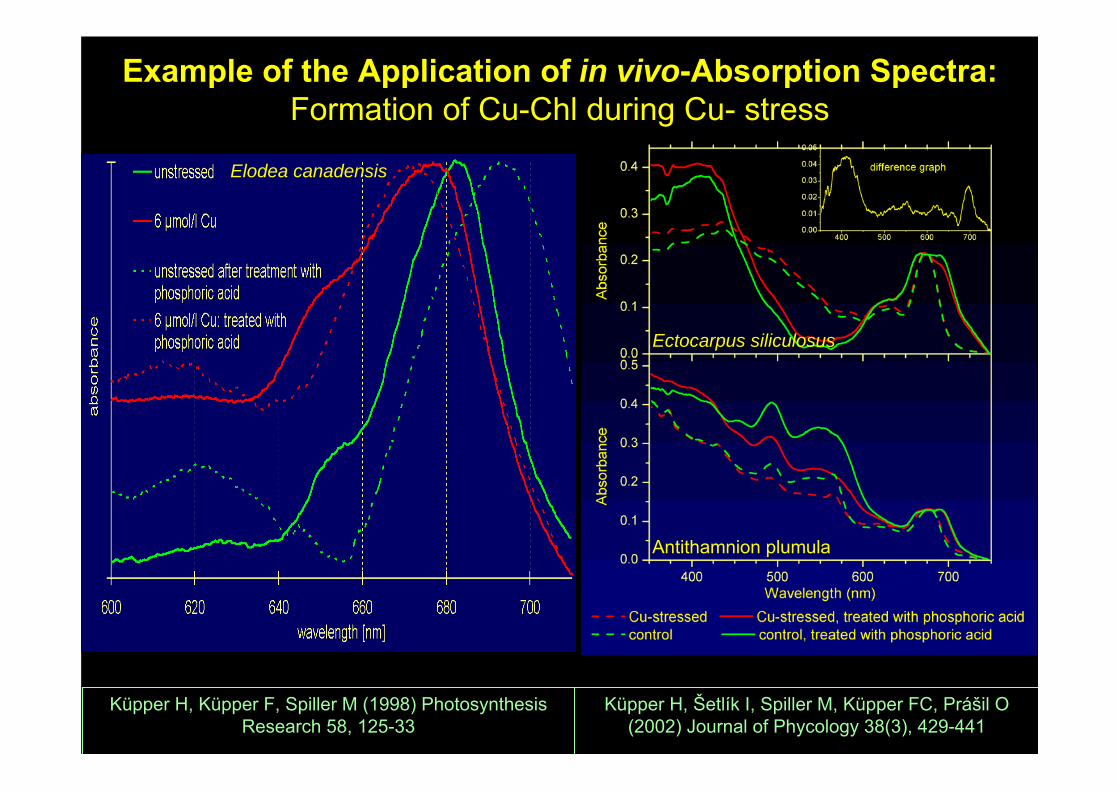
Example of the Application of in vivo-Absorption Spectra:Formation of Cu-Chl during Cu- stress
Küpper H, Küpper F, Spiller M (1998) Photosynthesis Research 58, 125-33
Elodea canadensis
Ectocarpus siliculosus
Antithamnion plumula
Küpper H, Šetlík I, Spiller M, Küpper FC, Prášil O (2002) Journal of Phycology 38(3), 429-441
Imaging in vivo-VIS-Spectroscopy:Modern Methods of Fluorescence Microscopy
Methods--> Separation of chromophores--> FRET--> measurement of physiological parameters with fluorescent dyes--> FRAP--> FCS--> QISH--> fluorescent proteins
Important prereqisites and factshow to keep your cells alive while being measured Aperture vs. light capture efficiencycorrect measurementoverlap / interference of signals
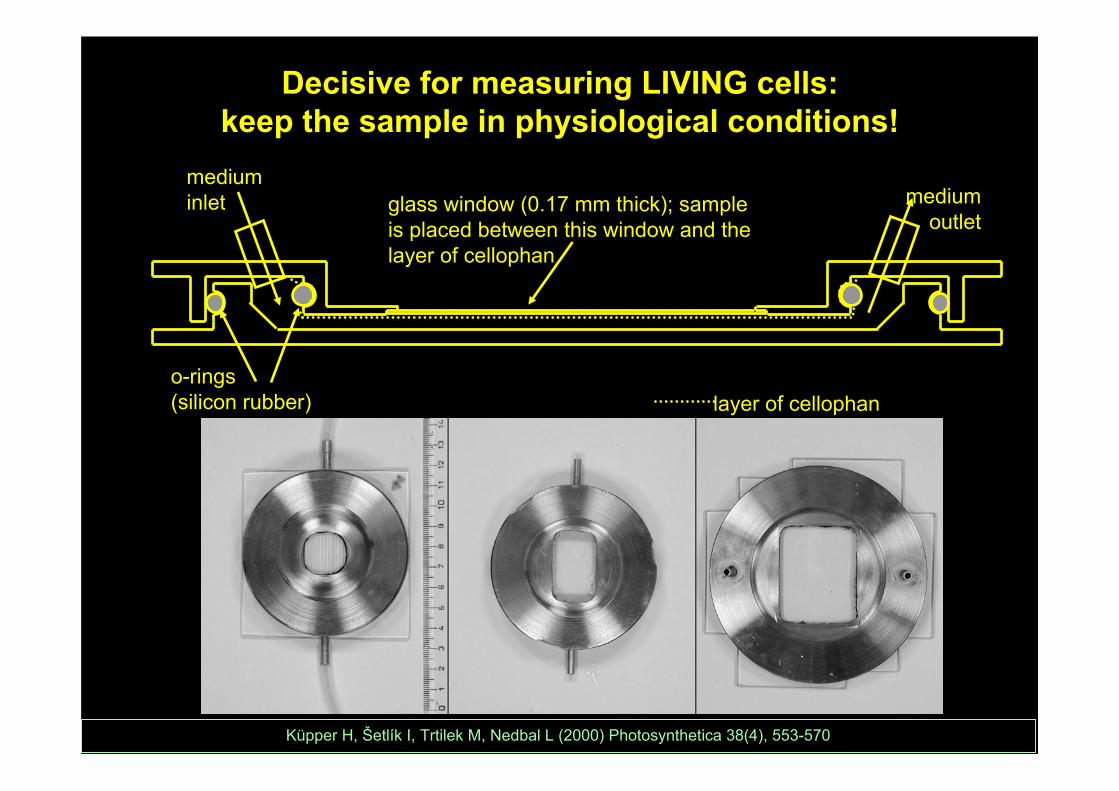
medium inlet medium
outletglass window (0.17 mm thick); sample is placed between this window and the layer of cellophan
o-rings (silicon rubber) layer of cellophan
Decisive for measuring LIVING cells:keep the sample in physiological conditions!
Küpper H, Šetlík I, Trtilek M, Nedbal L (2000) Photosynthetica 38(4), 553-570
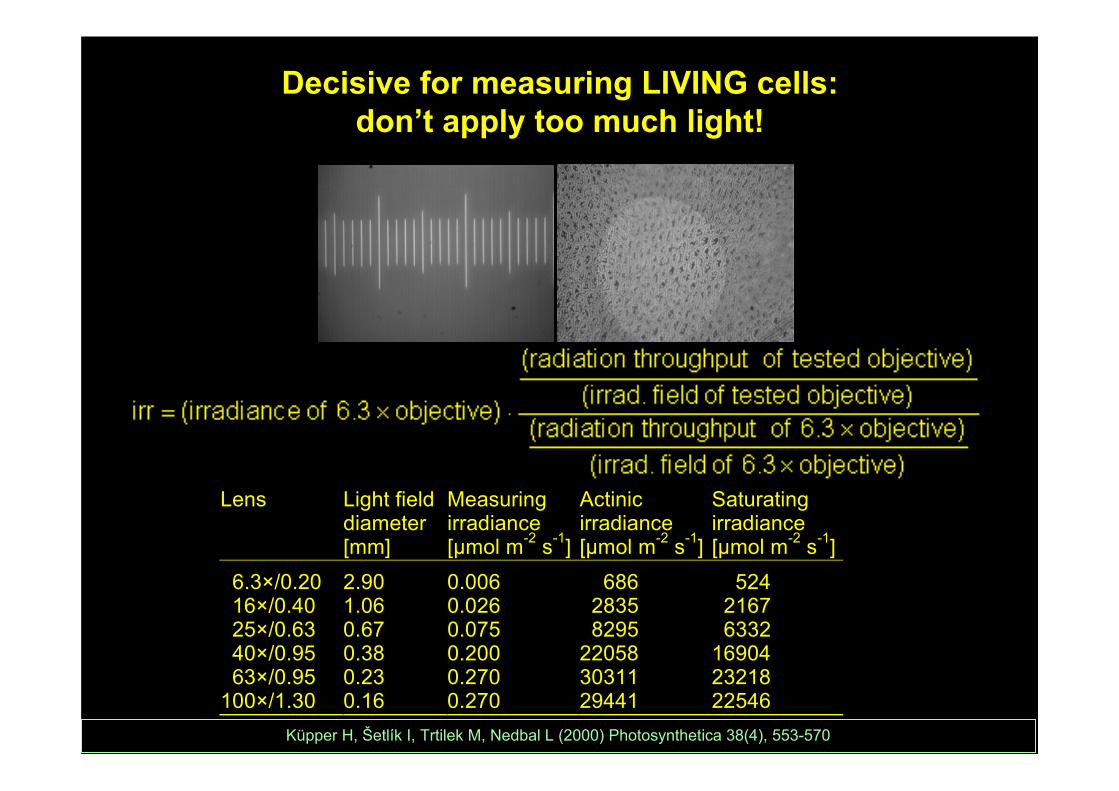
Lens Light fielddiameter
Measuringirradiance
Actinicirradiance
Saturatingirradiance
[mm] [µmol m-2 s-1] [µmol m-2 s-1] [µmol m-2 s-1]
6.3×/0.20 2.90 0.006 686 524 16×/0.40 1.06 0.026 2835 2167 25×/0.63 0.67 0.075 8295 6332 40×/0.95 0.38 0.200 22058 16904 63×/0.95 0.23 0.270 30311 23218100×/1.30 0.16 0.270 29441 22546
Küpper H, Šetlík I, Trtilek M, Nedbal L (2000) Photosynthetica 38(4), 553-570
Decisive for measuring LIVING cells:don’t apply too much light!
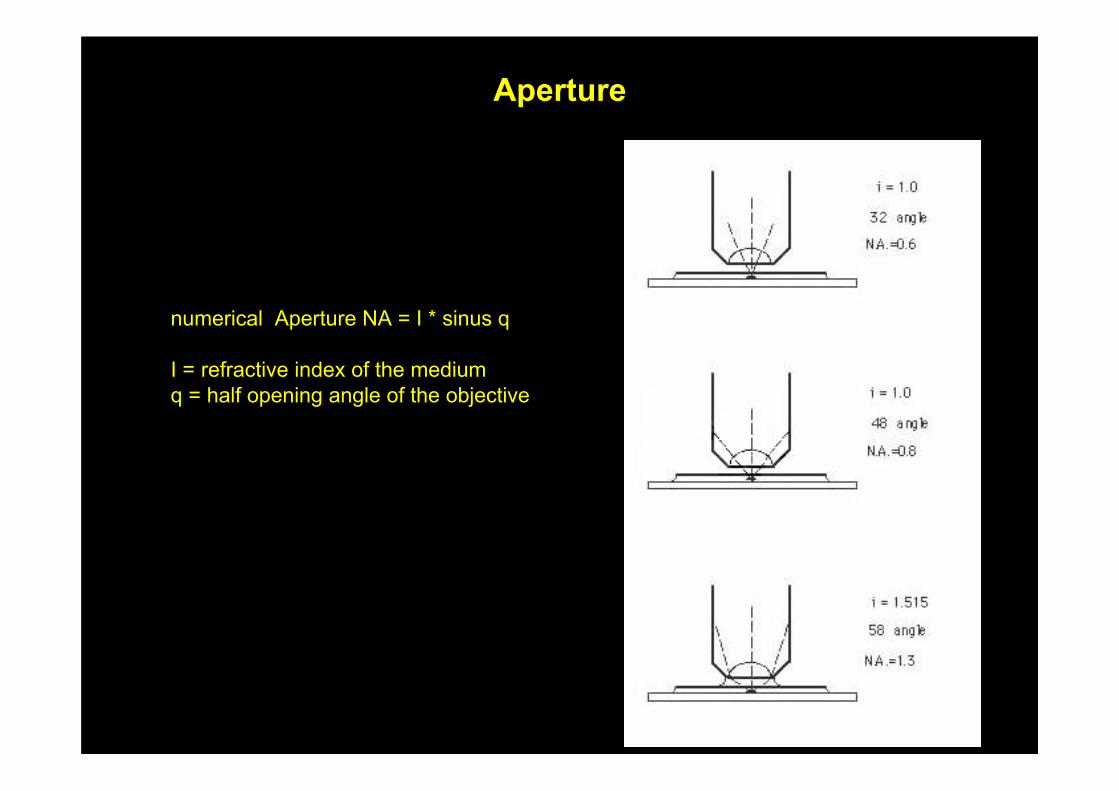
numerical Aperture NA = I * sinus q
I = refractive index of the mediumq = half opening angle of the objective
Aperture
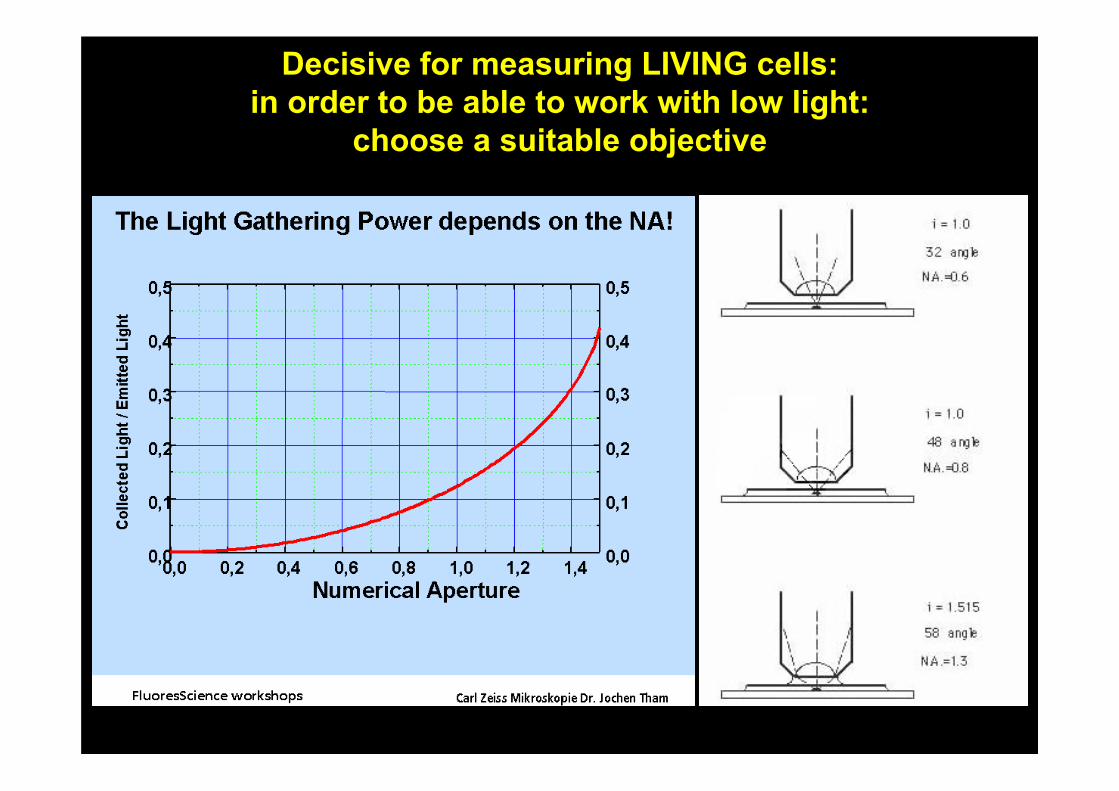
Decisive for measuring LIVING cells:in order to be able to work with low light:
choose a suitable objective
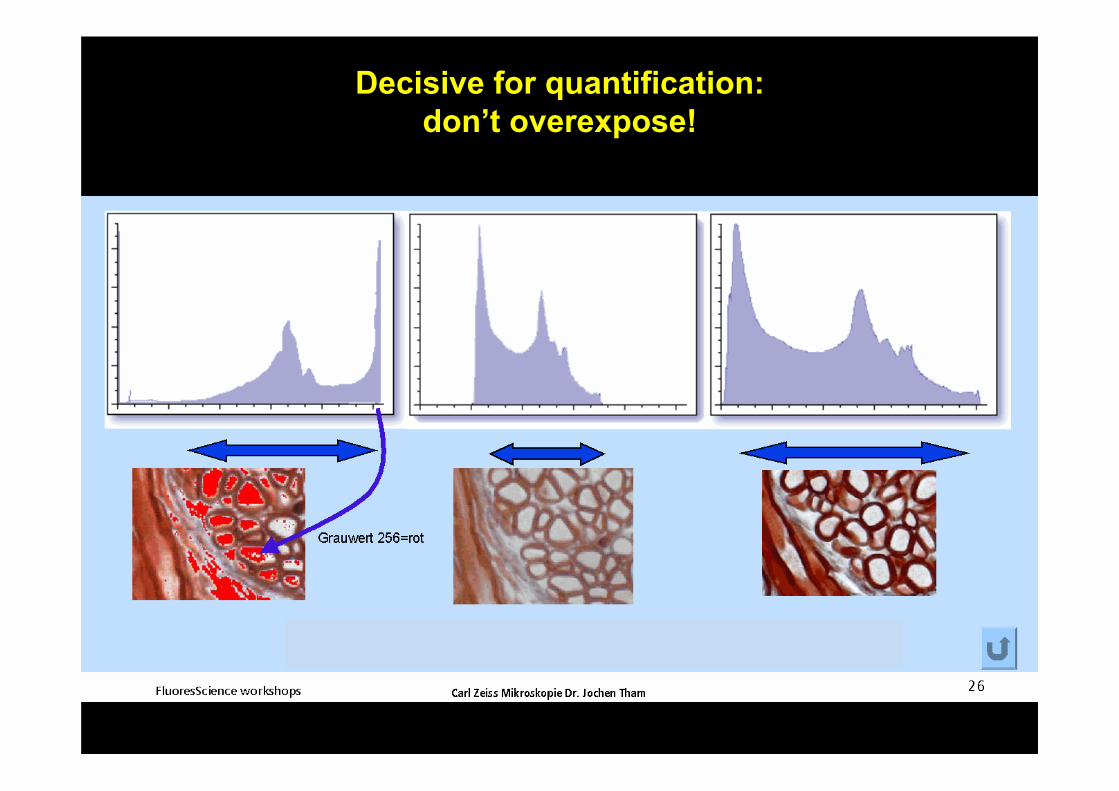
Decisive for quantification:don’t overexpose!
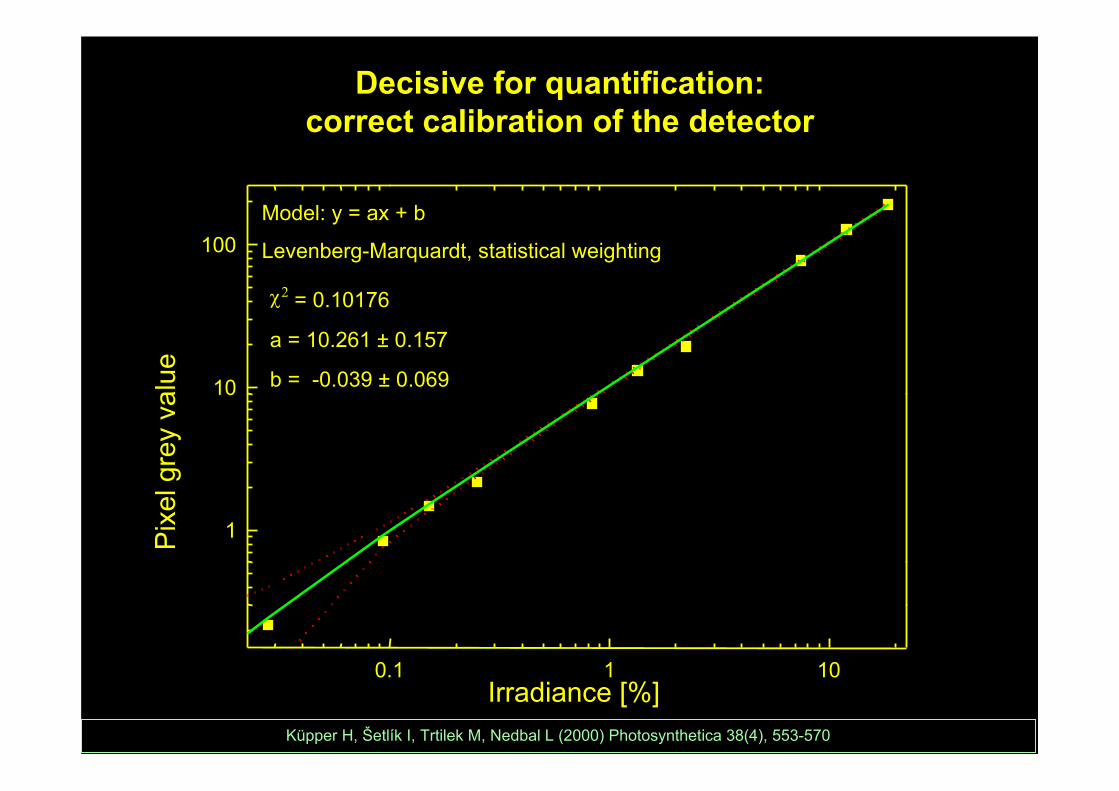
Decisive for quantification:correct calibration of the detector
Pix
el g
rey
valu
e
Irradiance [%]0.1 1 10
1
10
100Model: y = ax + b
Levenberg-Marquardt, statistical weighting
χ2 = 0.10176
a = 10.261 ± 0.157
b = -0.039 ± 0.069
Küpper H, Šetlík I, Trtilek M, Nedbal L (2000) Photosynthetica 38(4), 553-570
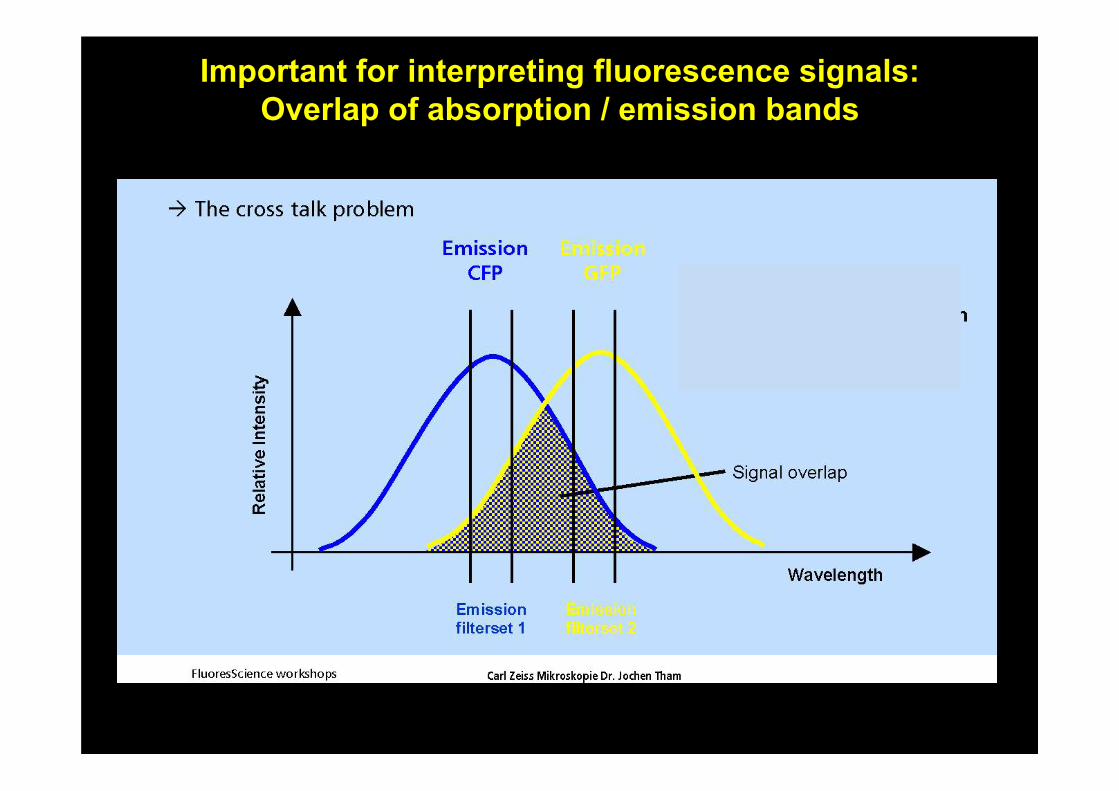
Important for interpreting fluorescence signals:Overlap of absorption / emission bands
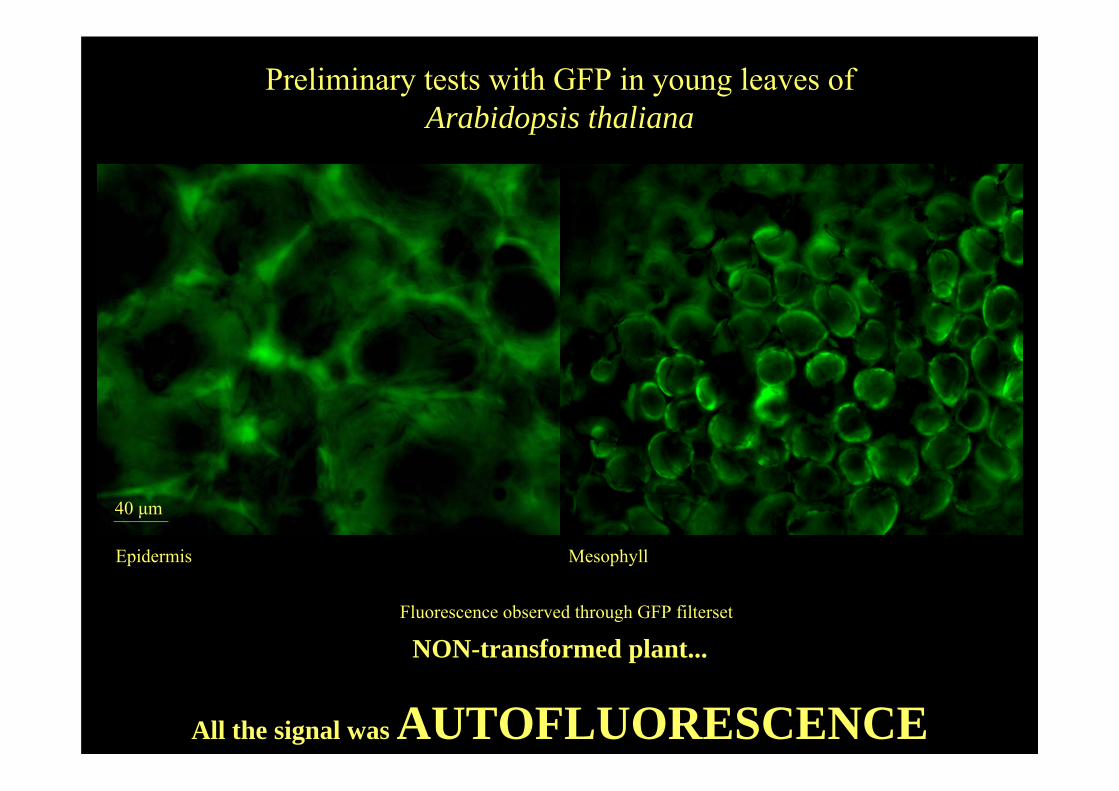
Preliminary tests with GFP in young leaves of Arabidopsis thaliana
Fluorescence observed through GFP filterset
NON-transformed plant...
All the signal was AUTOFLUORESCENCE
Epidermis
40 μm
Mesophyll
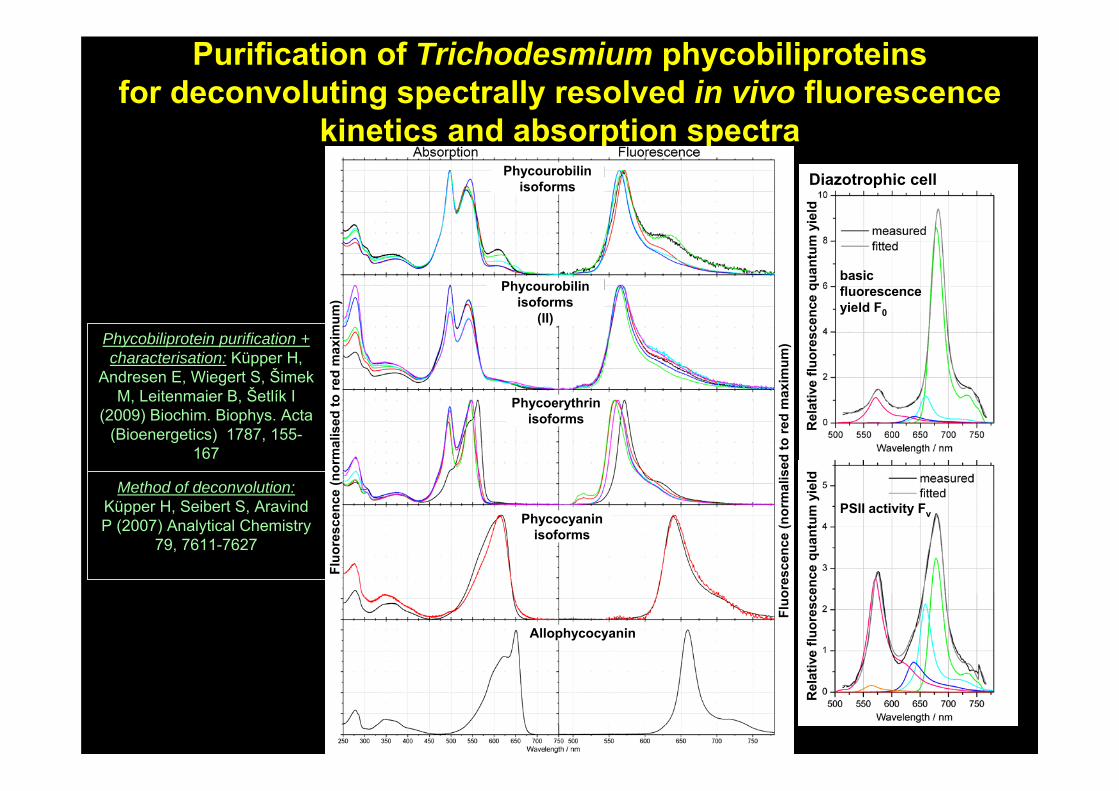
Purification of Trichodesmium phycobiliproteinsfor deconvoluting spectrally resolved in vivo fluorescence
kinetics and absorption spectra
Method of deconvolution:Küpper H, Seibert S, Aravind P (2007) Analytical Chemistry
79, 7611-7627
Phycobiliprotein purification + characterisation: Küpper H,
Andresen E, Wiegert S, Šimek M, Leitenmaier B, Šetlík I
(2009) Biochim. Biophys. Acta (Bioenergetics) 1787, 155-
167
Phycourobilin isoforms
Phycourobilin isoforms
(II)
Phycoerythrinisoforms
Phycocyaninisoforms
Allophycocyanin
Fluo
resc
ence
(nor
mal
ised
to re
d m
axim
um)
Fluo
resc
ence
(nor
mal
ised
to re
d m
axim
um)
Diazotrophic cell
basic fluorescence yield F0
PSII activity Fv
Rel
ativ
e flu
ores
cenc
e qu
antu
m y
ield
Rel
ativ
e flu
ores
cenc
e qu
antu
m y
ield
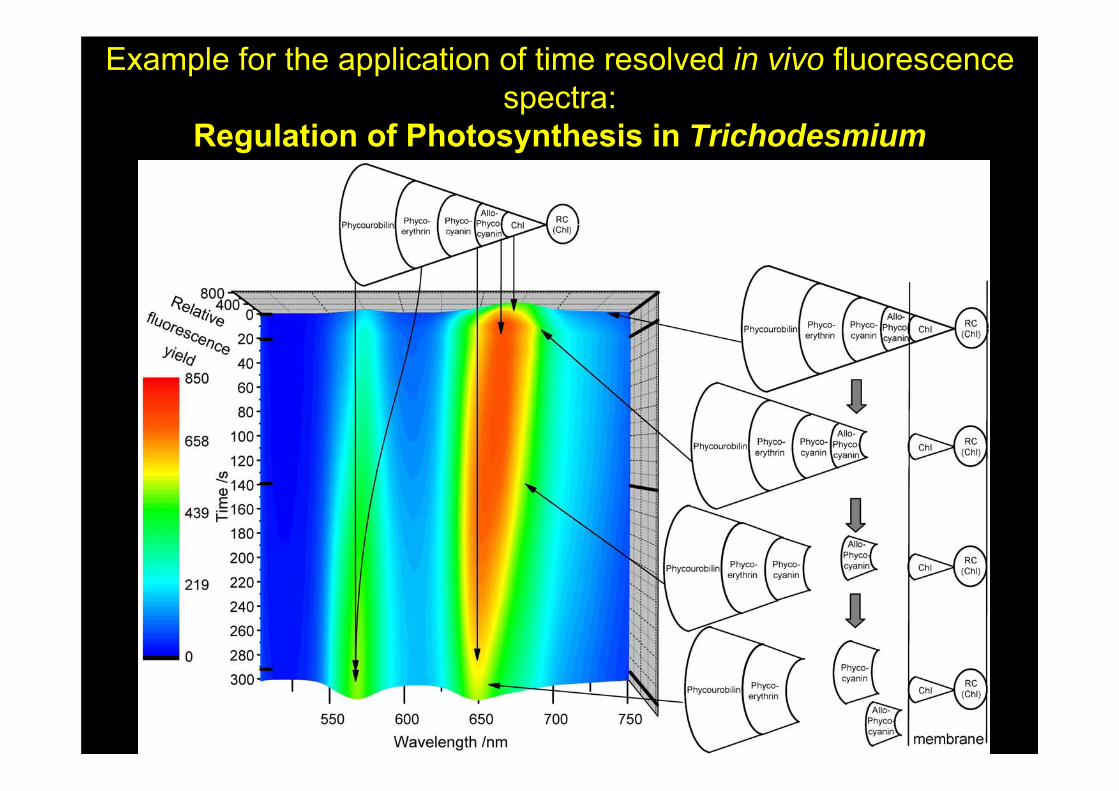
Example for the application of time resolved in vivo fluorescence spectra:
Regulation of Photosynthesis in Trichodesmium
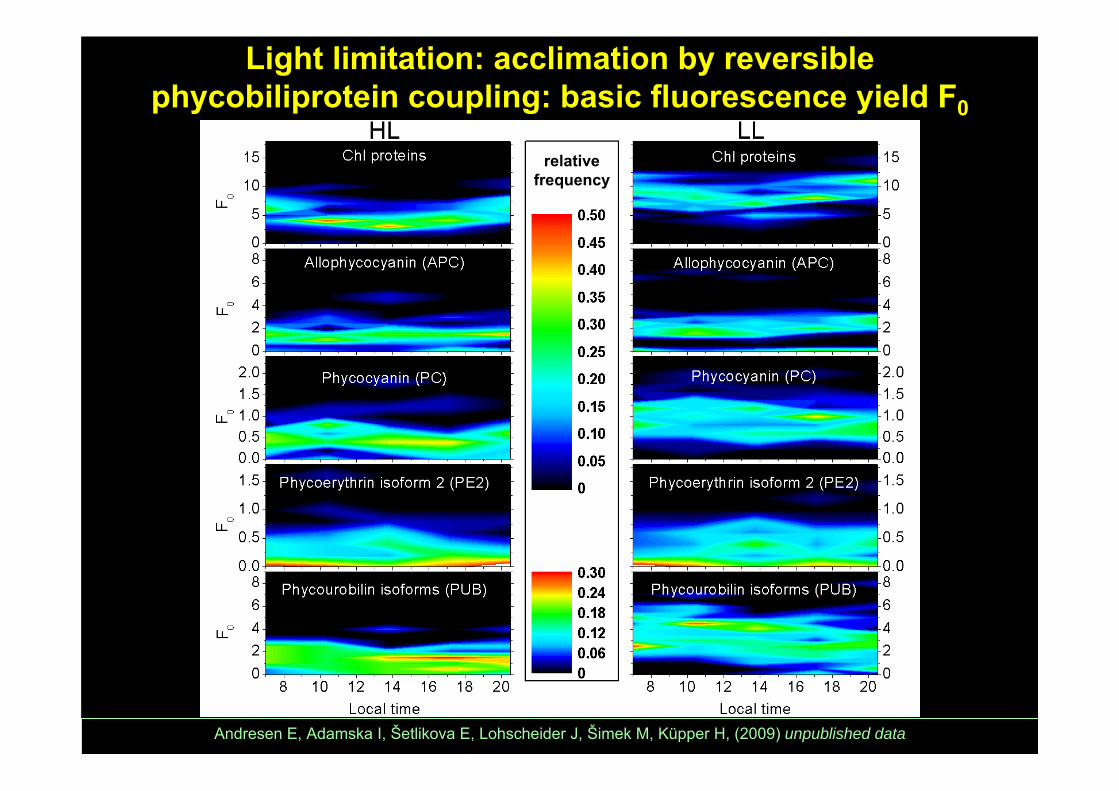
Andresen E, Adamska I, Šetlikova E, Lohscheider J, Šimek M, Küpper H, (2009) unpublished data
Light limitation: acclimation by reversible phycobiliprotein coupling: basic fluorescence yield F0
relative frequency
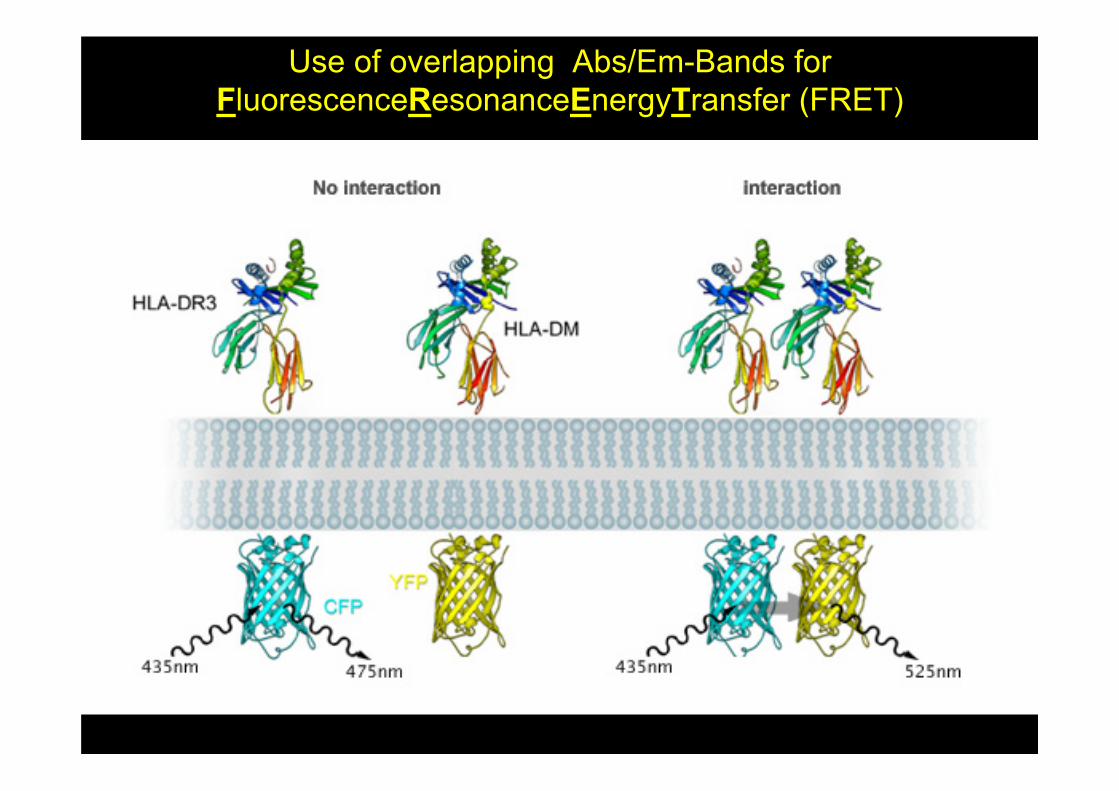
Use of overlapping Abs/Em-Bands forFluorescenceResonanceEnergyTransfer (FRET)
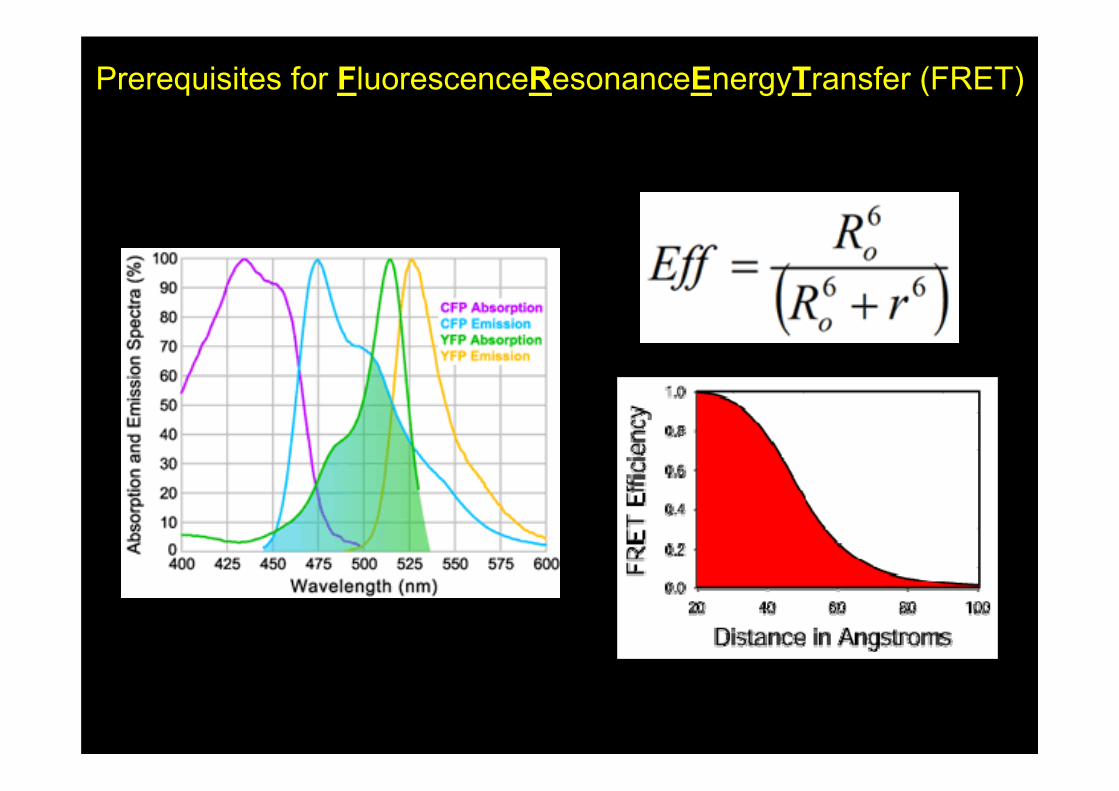
Prerequisites for FluorescenceResonanceEnergyTransfer (FRET)
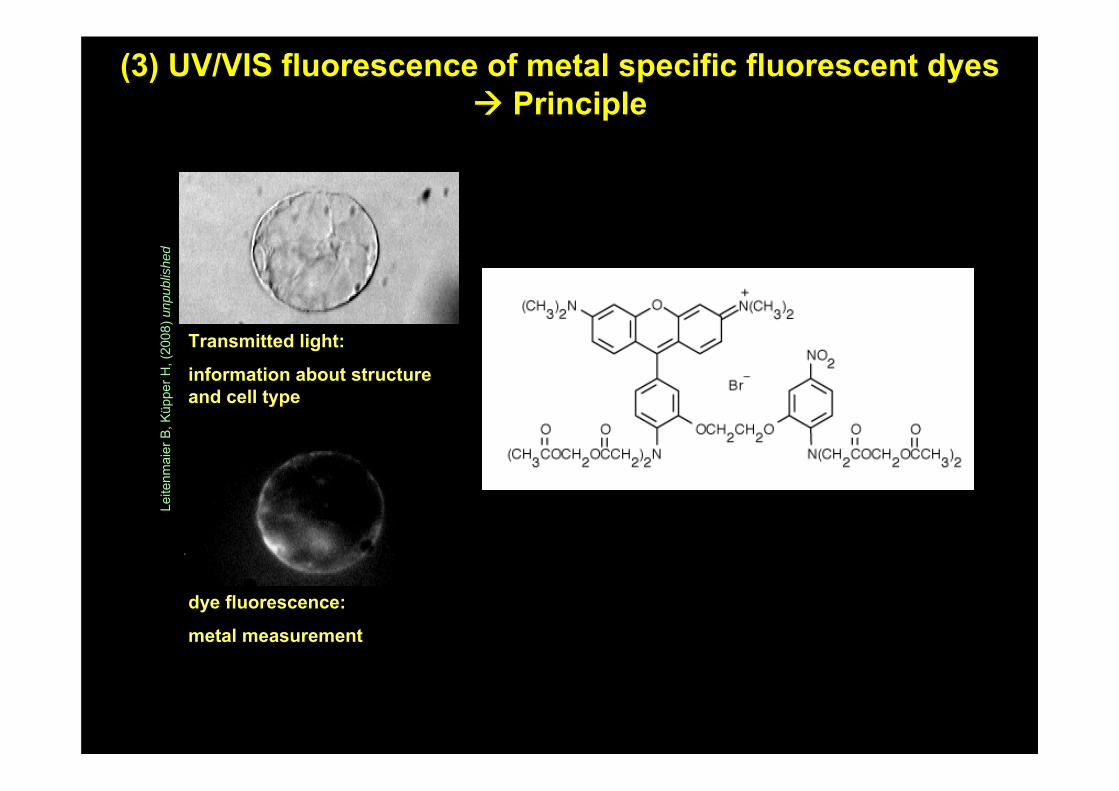
Transmitted light:
information about structureand cell type
dye fluorescence:
metal measurement
(3) UV/VIS fluorescence of metal specific fluorescent dyesPrinciple
Leite
nmai
erB,
Küp
perH
, (20
08)u
npub
lishe
d
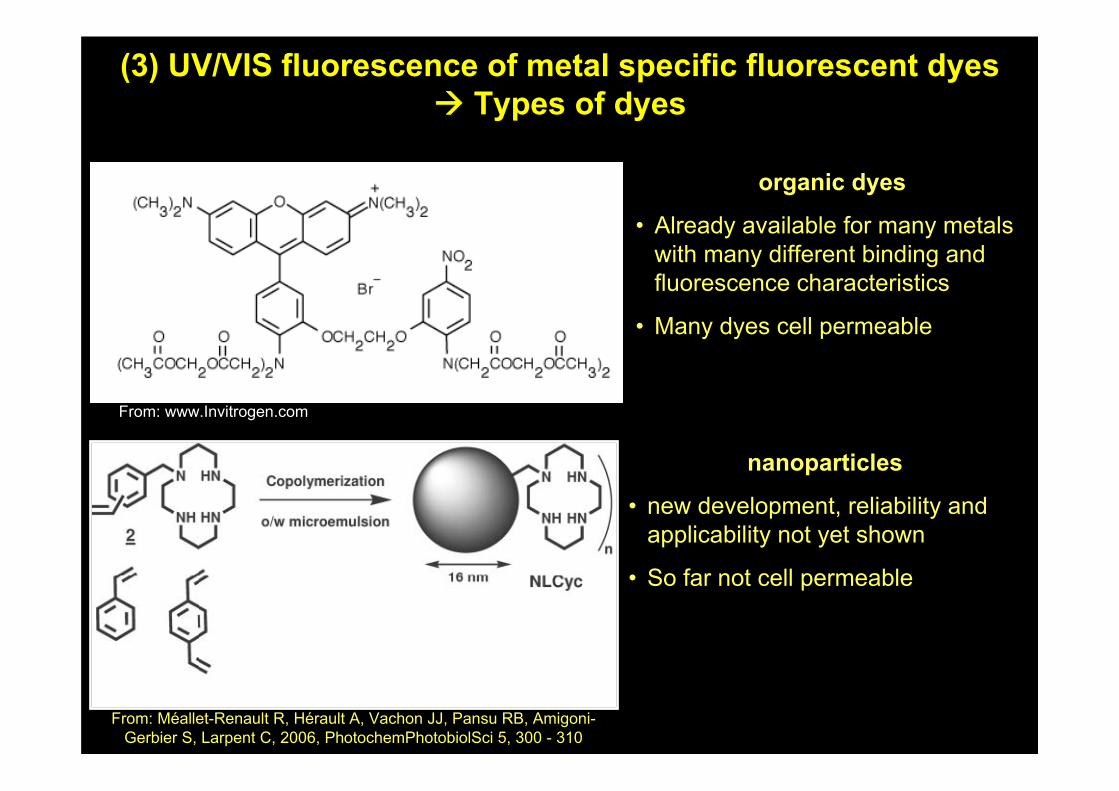
(3) UV/VIS fluorescence of metal specific fluorescent dyesTypes of dyes
From: www.Invitrogen.com
From: Méallet-Renault R, Hérault A, Vachon JJ, Pansu RB, Amigoni-Gerbier S, Larpent C, 2006, PhotochemPhotobiolSci 5, 300 - 310
organic dyes
• Already available for many metals with many different binding and fluorescence characteristics
• Many dyes cell permeable
nanoparticles
• new development, reliability and applicability not yet shown
• So far not cell permeable
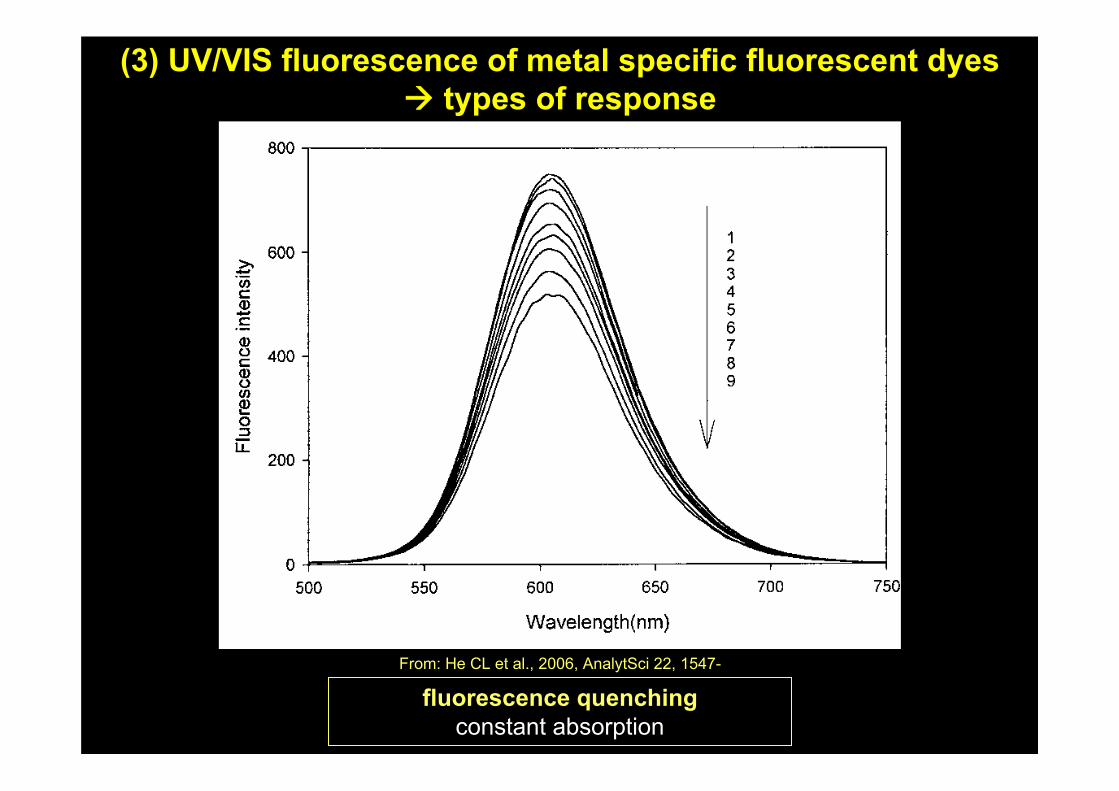
(3) UV/VIS fluorescence of metal specific fluorescent dyestypes of response
fluorescence quenchingconstant absorption
From: He CL et al., 2006, AnalytSci 22, 1547-
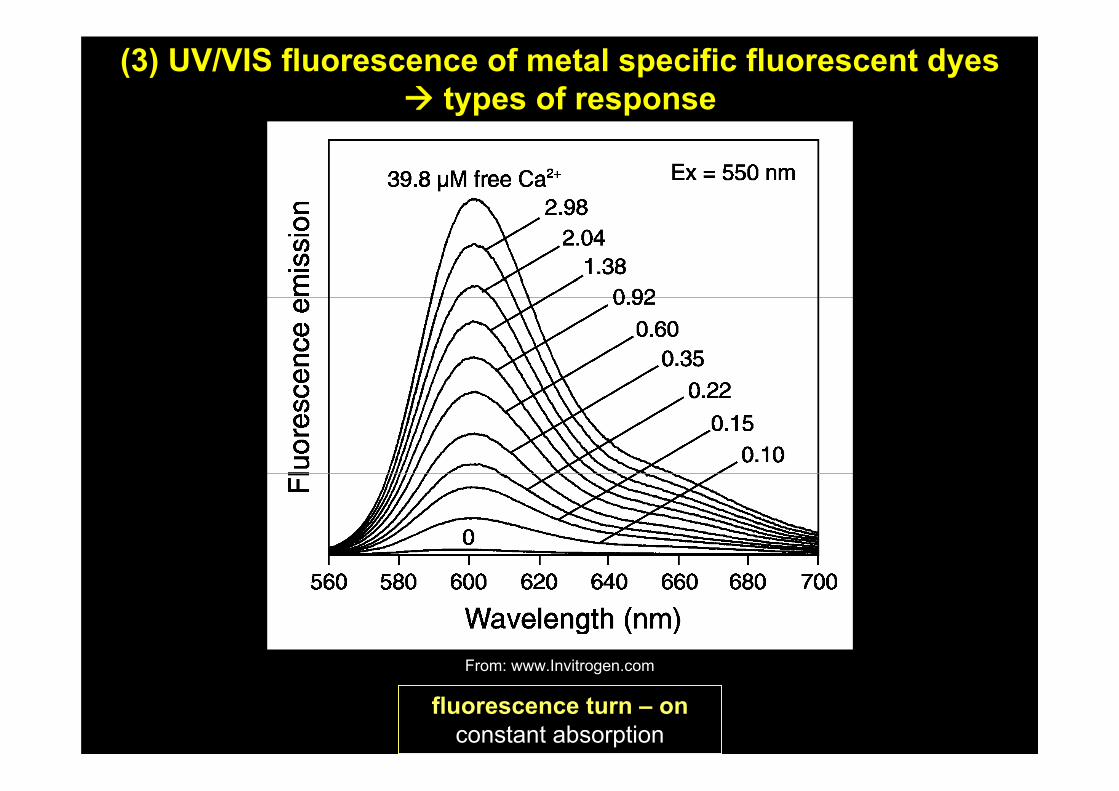
(3) UV/VIS fluorescence of metal specific fluorescent dyestypes of response
From: www.Invitrogen.com
fluorescence turn – onconstant absorption
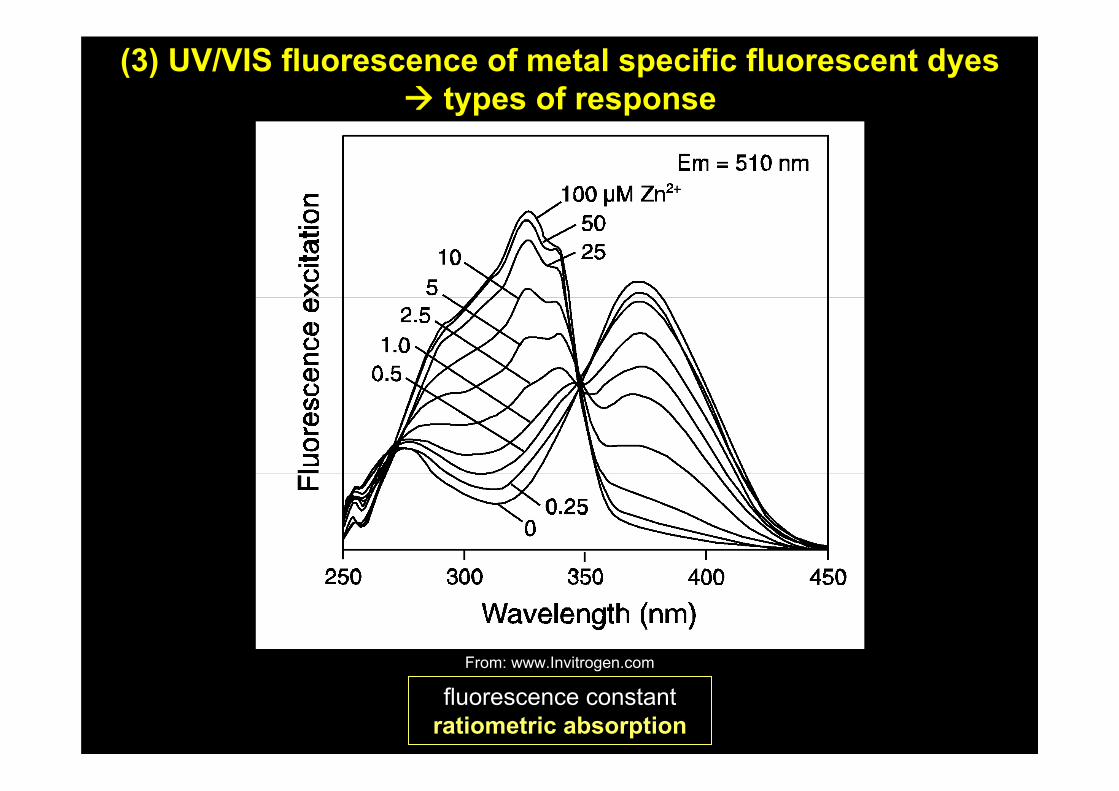
(3) UV/VIS fluorescence of metal specific fluorescent dyestypes of response
From: www.Invitrogen.com
fluorescence constantratiometric absorption
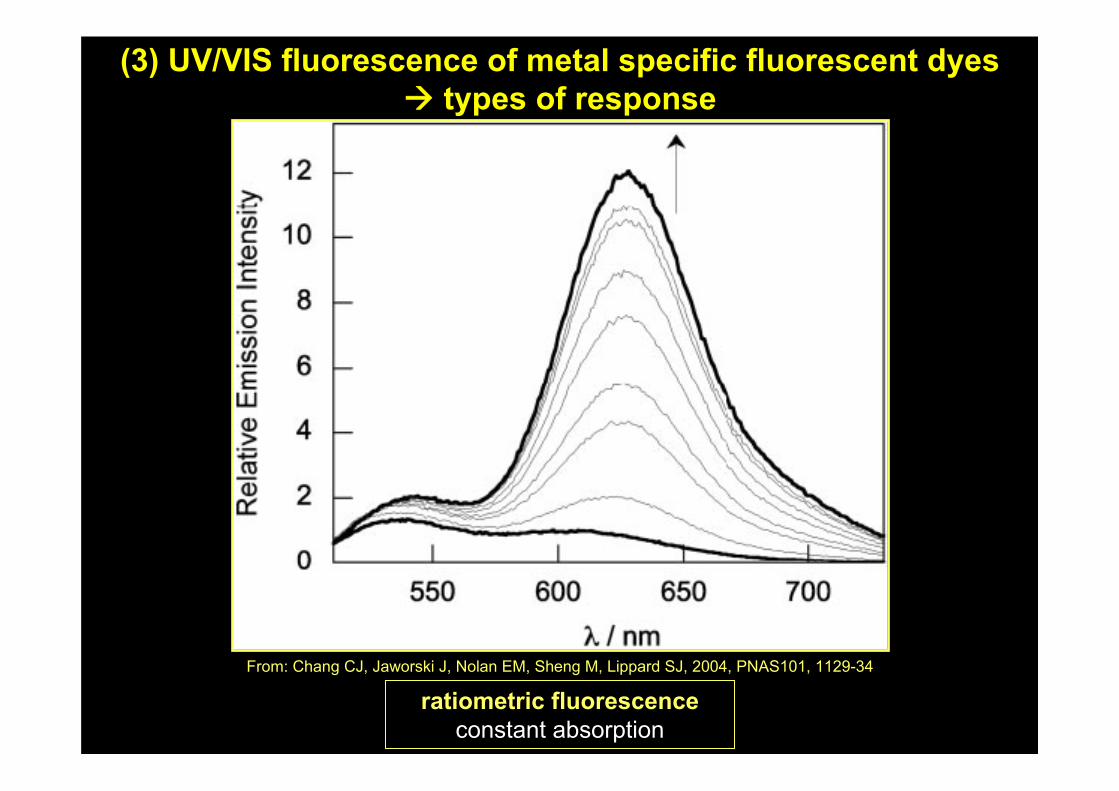
(3) UV/VIS fluorescence of metal specific fluorescent dyestypes of response
ratiometric fluorescenceconstant absorption
From: Chang CJ, Jaworski J, Nolan EM, Sheng M, Lippard SJ, 2004, PNAS101, 1129-34
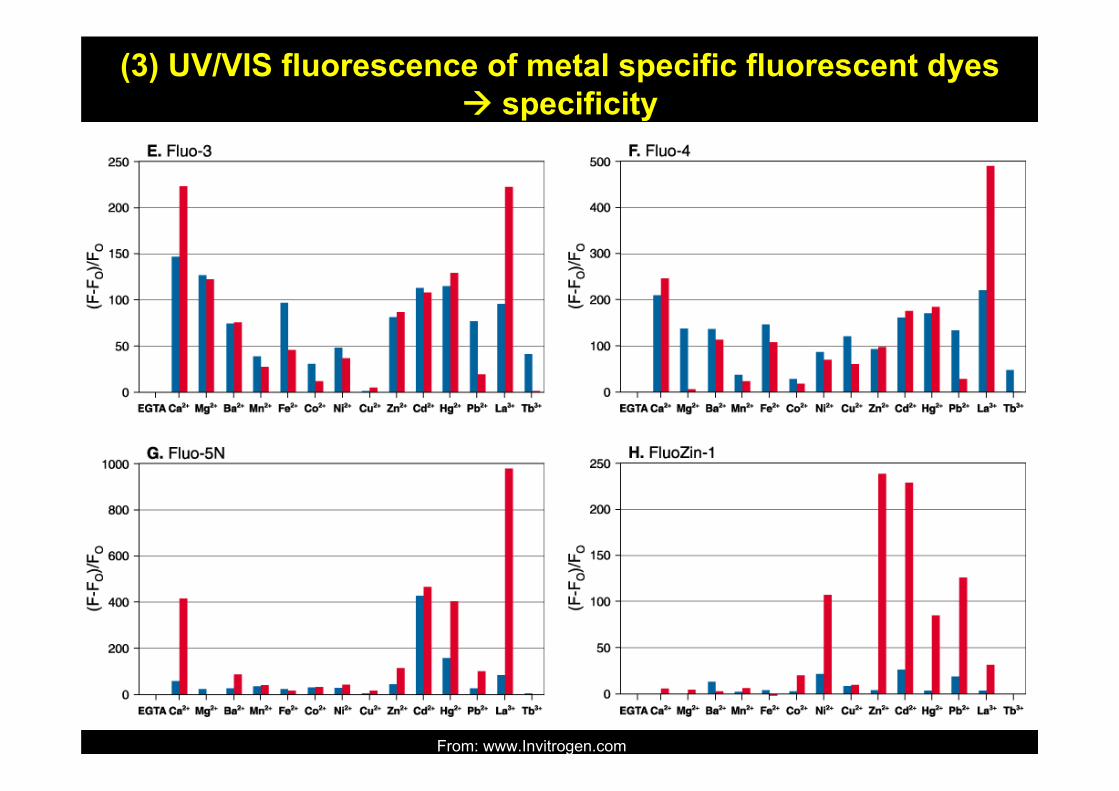
(3) UV/VIS fluorescence of metal specific fluorescent dyesspecificity
From: www.Invitrogen.com
From: Chang CJ, Jaworski J, Nolan EM, Sheng M, Lippard SJ, 2004, PNAS101, 1129-34
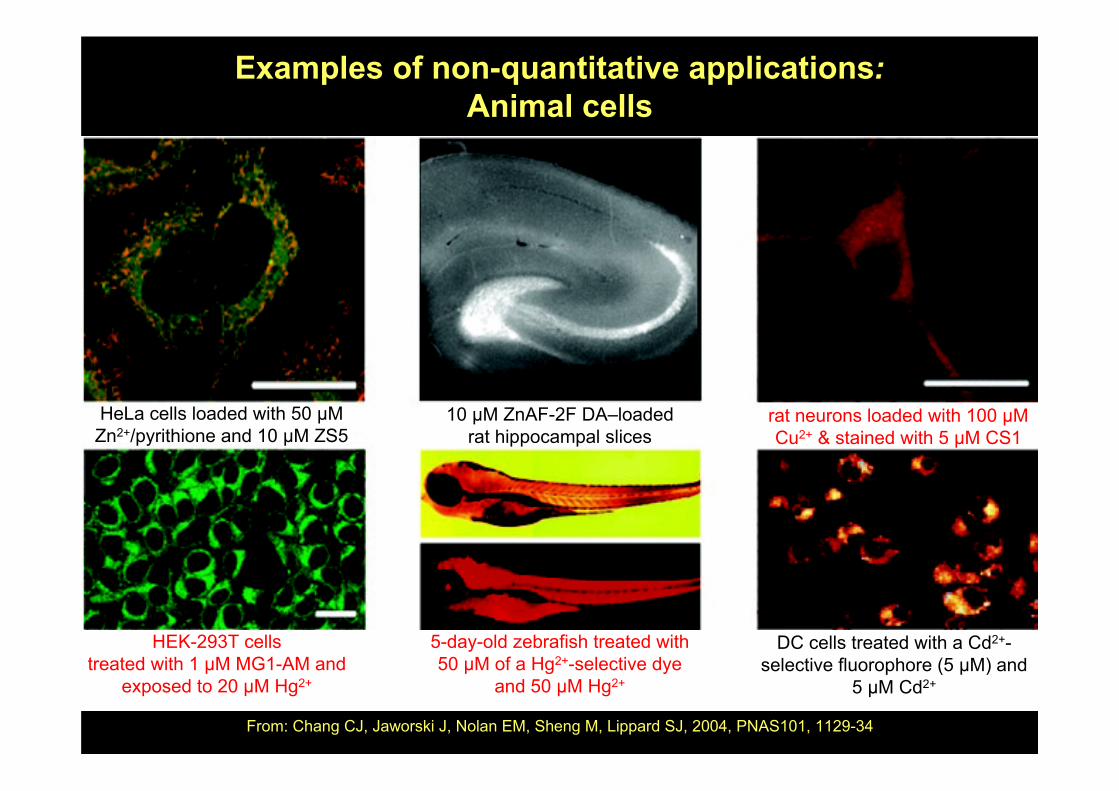
Examples of non-quantitative applications:Animal cells
10 µM ZnAF-2F DA–loaded rat hippocampal slices
HeLa cells loaded with 50 μM Zn2+/pyrithione and 10 μM ZS5
rat neurons loaded with 100 μM Cu2+ & stained with 5 μM CS1
HEK-293T cellstreated with 1 μM MG1-AM and
exposed to 20 µM Hg2+
5-day-old zebrafish treated with 50 μM of a Hg2+-selective dye
and 50 μM Hg2+
DC cells treated with a Cd2+-selective fluorophore (5 μM) and
5 μM Cd2+
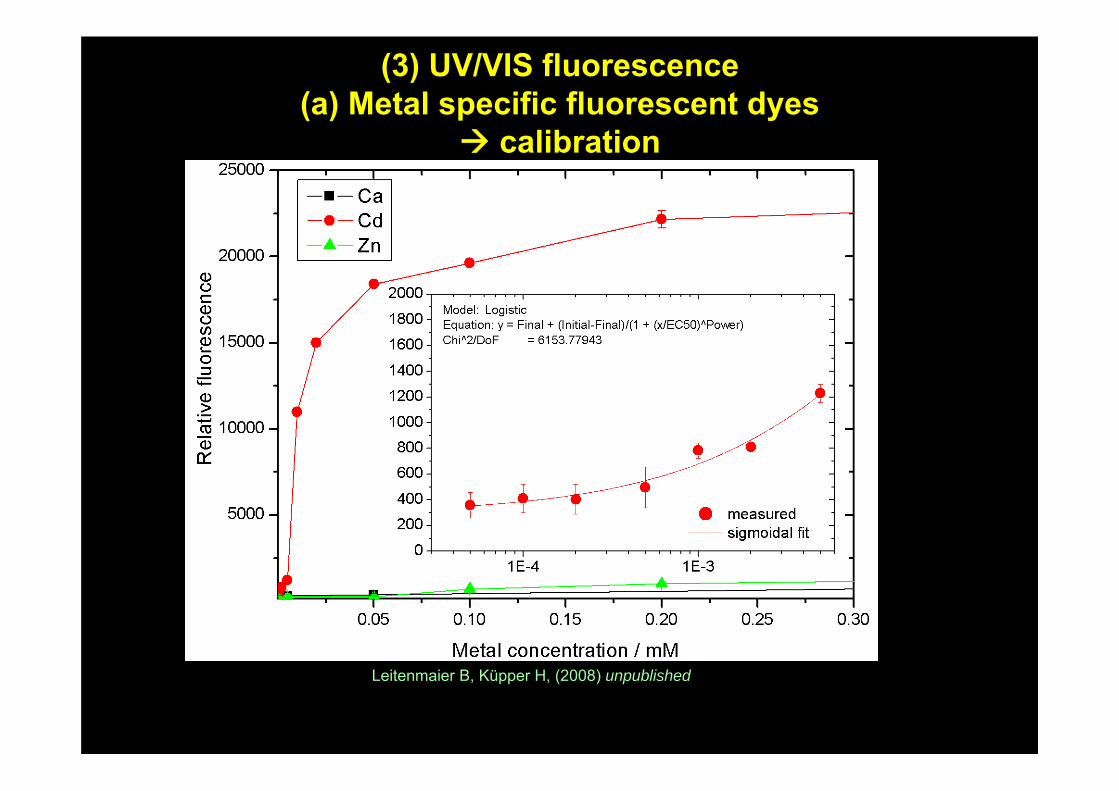
(3) UV/VIS fluorescence(a) Metal specific fluorescent dyes
calibration
Leitenmaier B, Küpper H, (2008) unpublished
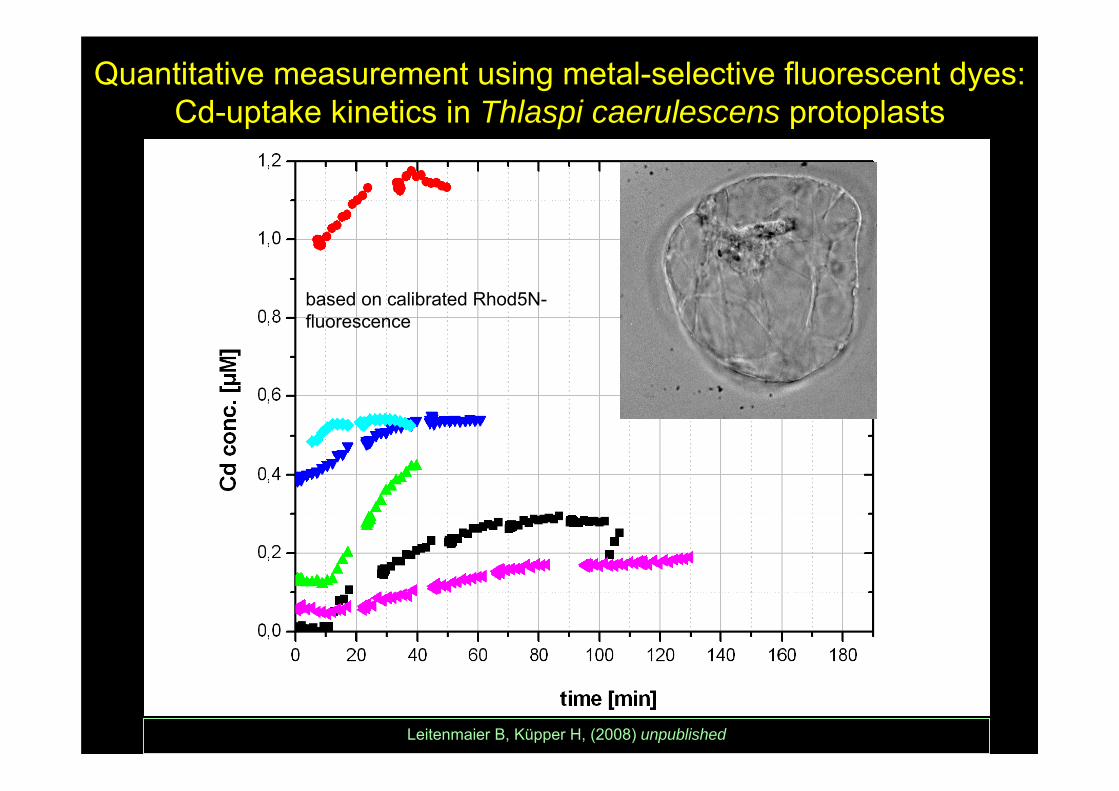
Quantitative measurement using metal-selective fluorescent dyes:Cd-uptake kinetics in Thlaspi caerulescens protoplasts
based on calibrated Rhod5N-fluorescence
Leitenmaier B, Küpper H, (2008) unpublished
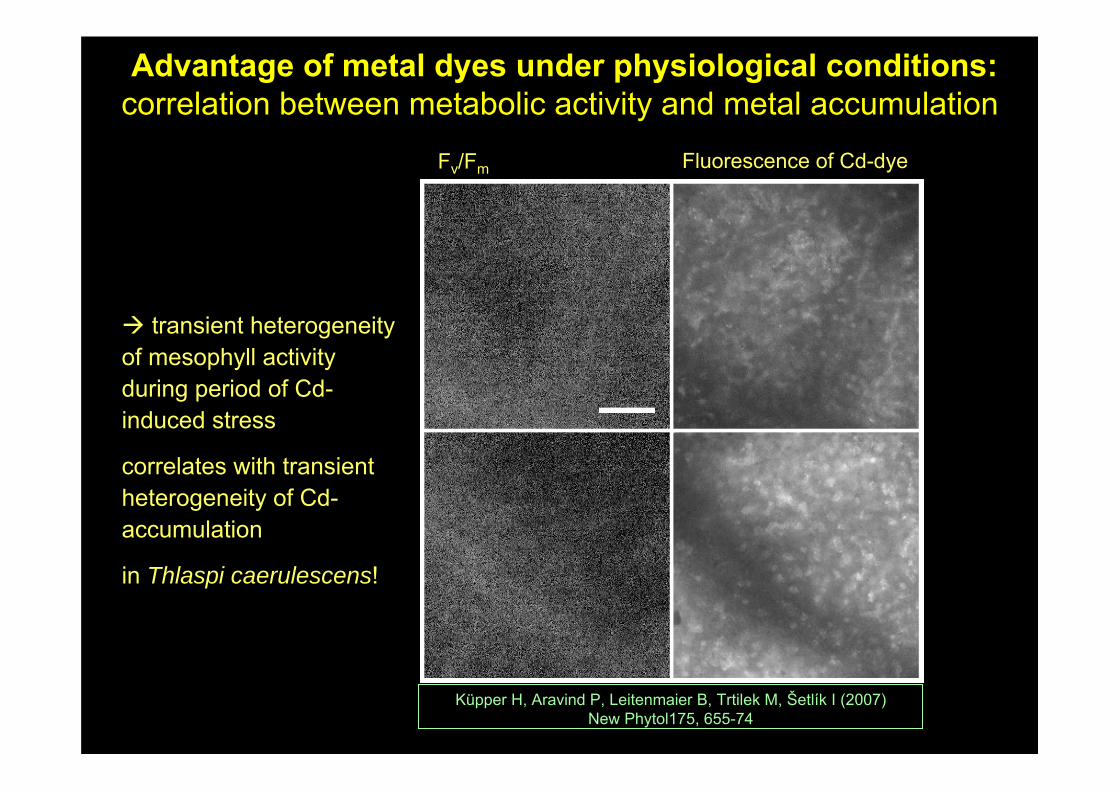
Advantage of metal dyes under physiological conditions:correlation between metabolic activity and metal accumulation
Küpper H, Aravind P, Leitenmaier B, Trtilek M, Šetlík I (2007) New Phytol175, 655-74
Fv/Fm Fluorescence of Cd-dye
transient heterogeneity of mesophyll activity during period of Cd-induced stress
correlates with transient heterogeneity of Cd-accumulation
in Thlaspi caerulescens!
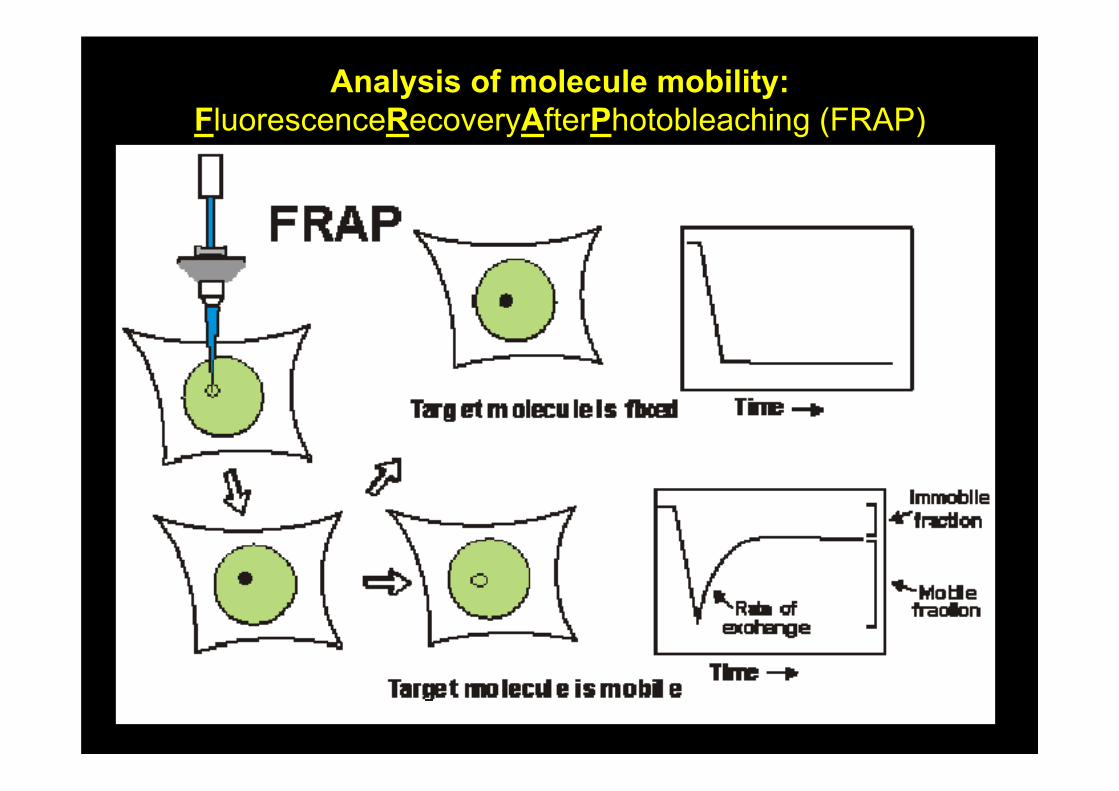
Analysis of molecule mobility:FluorescenceRecoveryAfterPhotobleaching (FRAP)
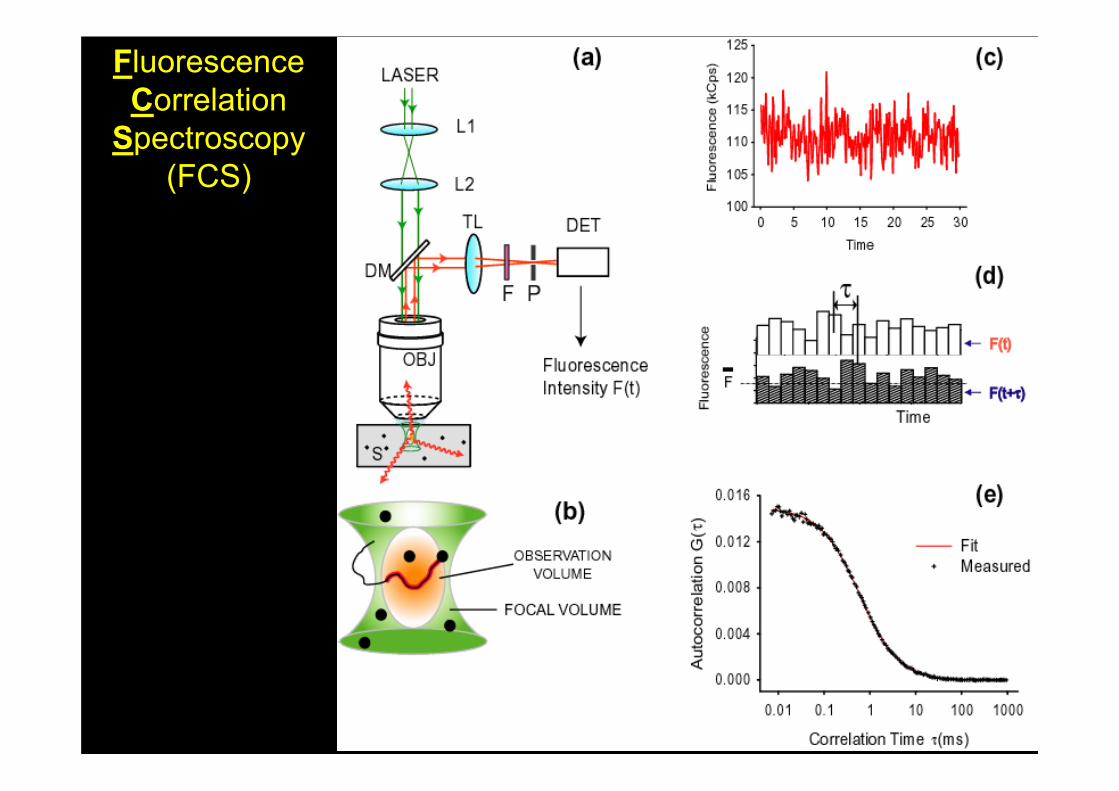
FluorescenceCorrelation
Spectroscopy(FCS)
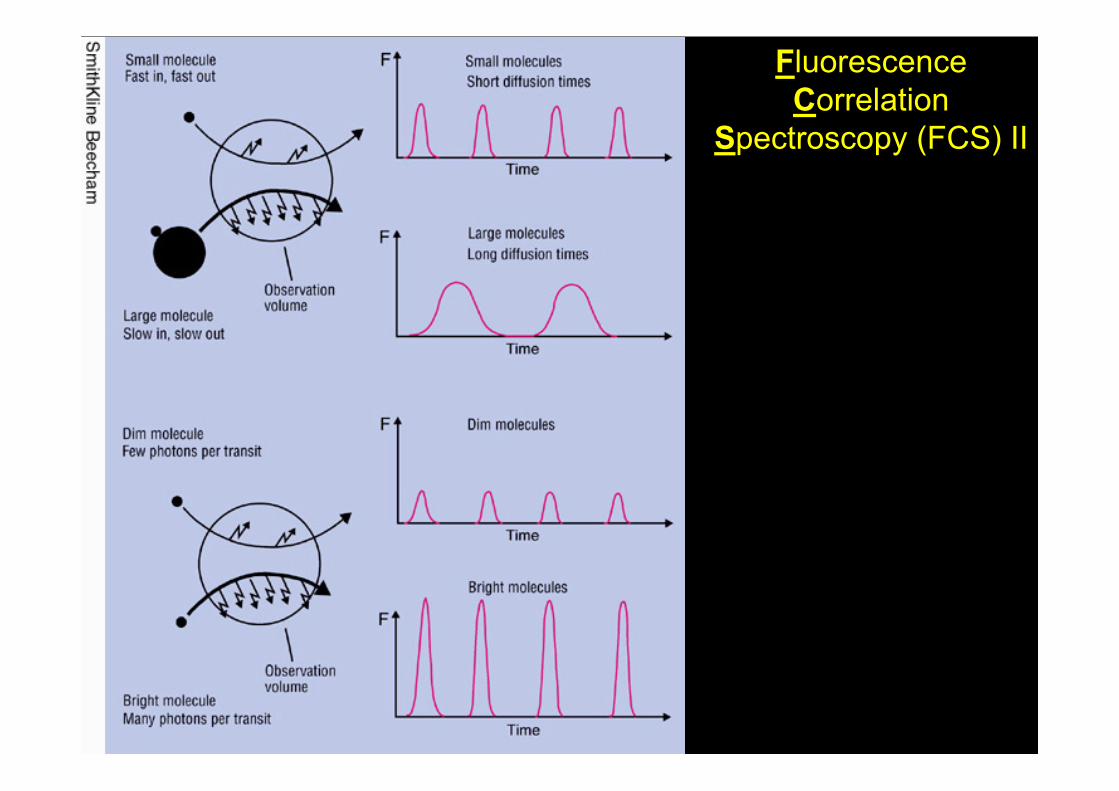
FluorescenceCorrelation
Spectroscopy (FCS) II
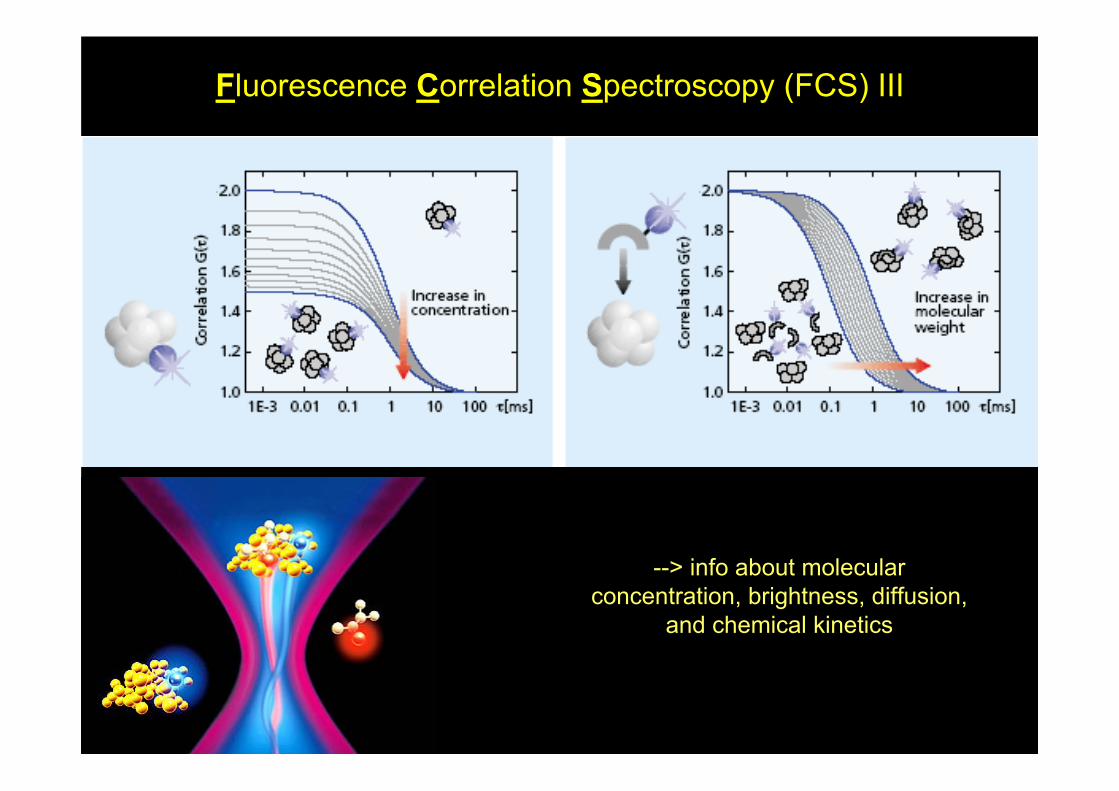
--> info about molecular concentration, brightness, diffusion,
and chemical kinetics
Fluorescence Correlation Spectroscopy (FCS) III
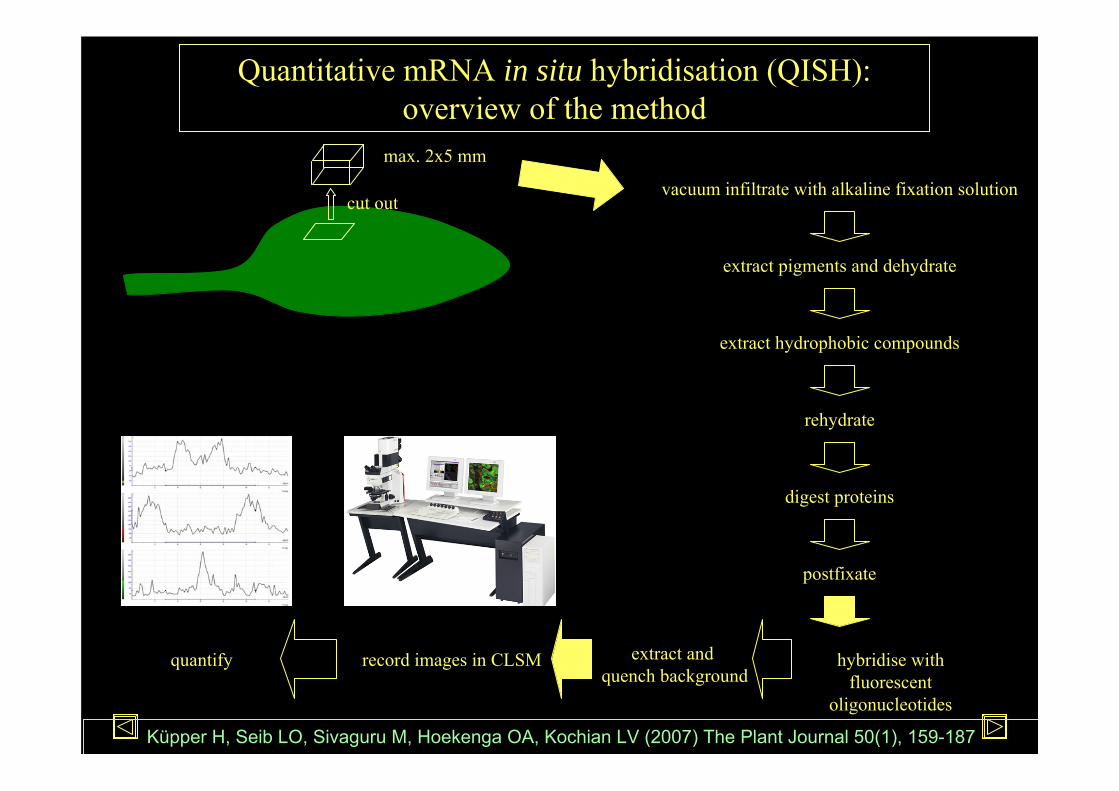
Quantitative mRNA in situ hybridisation (QISH):overview of the method
cut out
max. 2x5 mm
vacuum infiltrate with alkaline fixation solution
extract pigments and dehydrate
extract hydrophobic compounds
digest proteins
hybridise with fluorescent
oligonucleotides
rehydrate
postfixate
quantify record images in CLSM extract and quench background
Küpper H, Seib LO, Sivaguru M, Hoekenga OA, Kochian LV (2007) The Plant Journal 50(1), 159-187
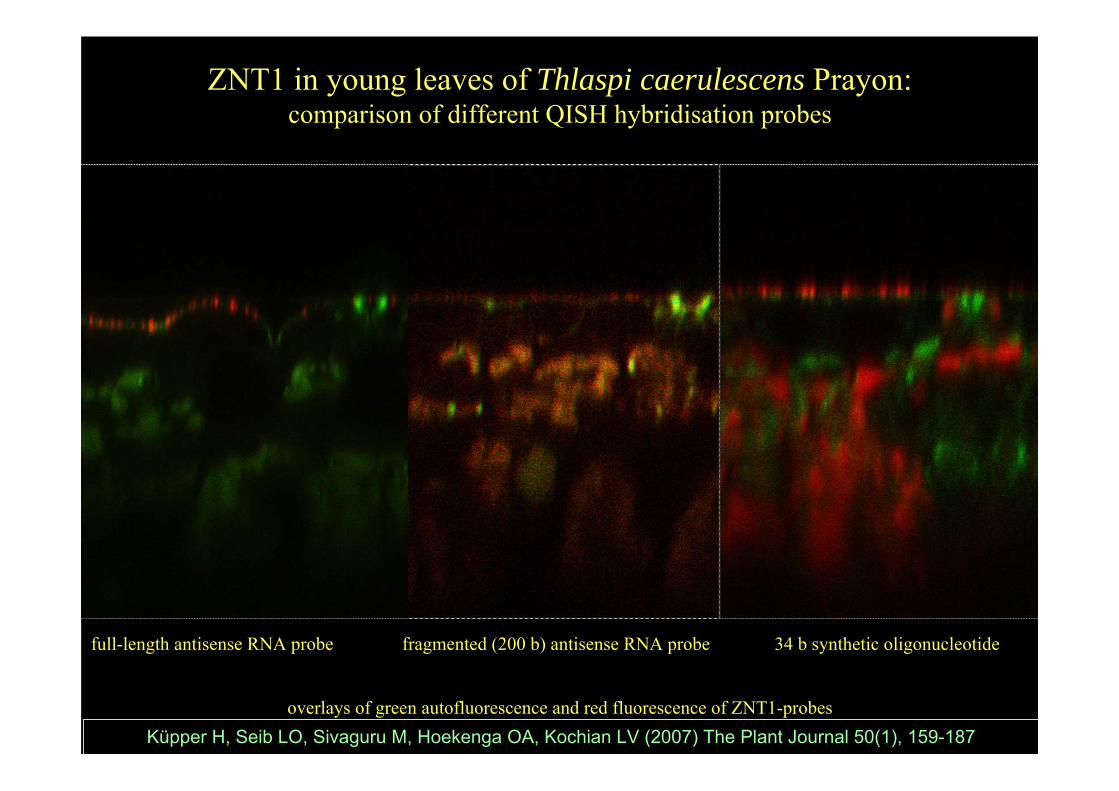
ZNT1 in young leaves of Thlaspi caerulescens Prayon:comparison of different QISH hybridisation probes
overlays of green autofluorescence and red fluorescence of ZNT1-probes
full-length antisense RNA probe fragmented (200 b) antisense RNA probe 34 b synthetic oligonucleotide
Küpper H, Seib LO, Sivaguru M, Hoekenga OA, Kochian LV (2007) The Plant Journal 50(1), 159-187
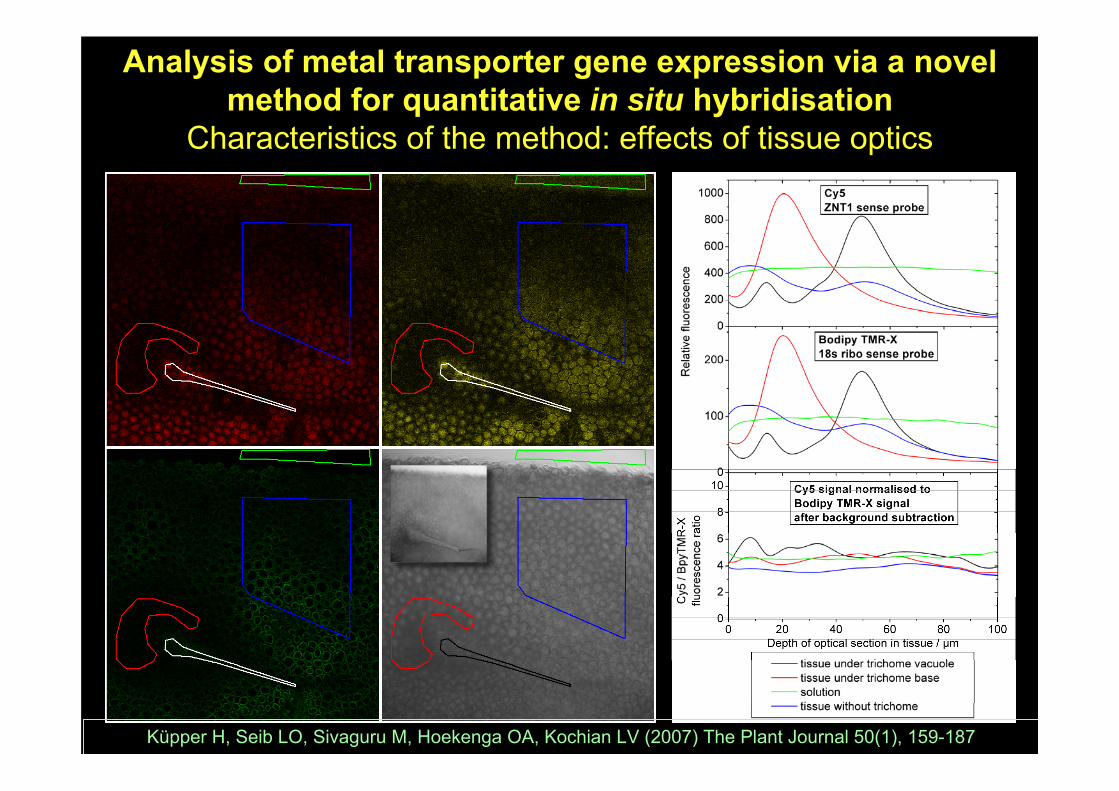
Analysis of metal transporter gene expression via a novel method for quantitative in situ hybridisation
Characteristics of the method: effects of tissue optics
Küpper H, Seib LO, Sivaguru M, Hoekenga OA, Kochian LV (2007) The Plant Journal 50(1), 159-187
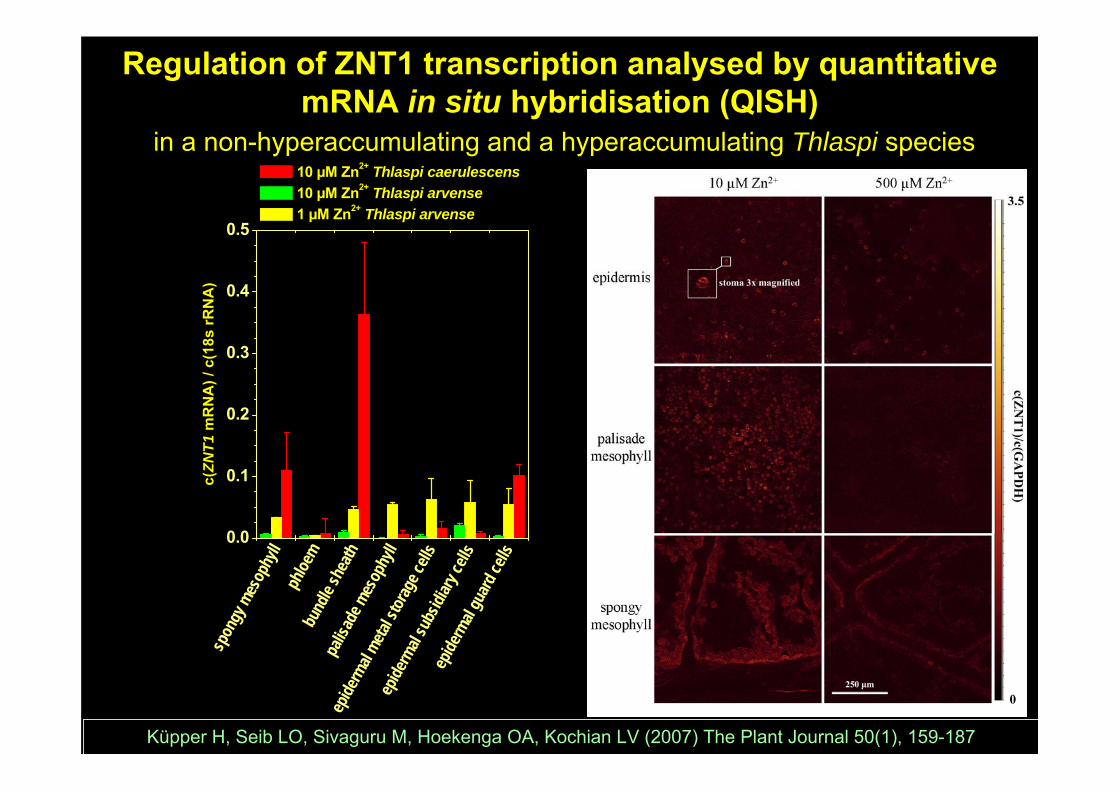
Regulation of ZNT1 transcription analysed by quantitative mRNA in situ hybridisation (QISH)
in a non-hyperaccumulating and a hyperaccumulating Thlaspi species
Küpper H, Seib LO, Sivaguru M, Hoekenga OA, Kochian LV (2007) The Plant Journal 50(1), 159-187
spon
gy m
esop
hyll
phloe
mbu
ndle
shea
thpa
lisad
e mes
ophy
ll
epide
rmal
metal s
torag
e cell
s
epide
rmal
subs
idiary
cells
epide
rmal
guard
cells
0.0
0.1
0.2
0.3
0.4
0.5
c(ZN
T1 m
RN
A) /
c(1
8s rR
NA
)
10 µM Zn2+ Thlaspi caerulescens 10 µM Zn2+ Thlaspi arvense 1 µM Zn2+ Thlaspi arvense
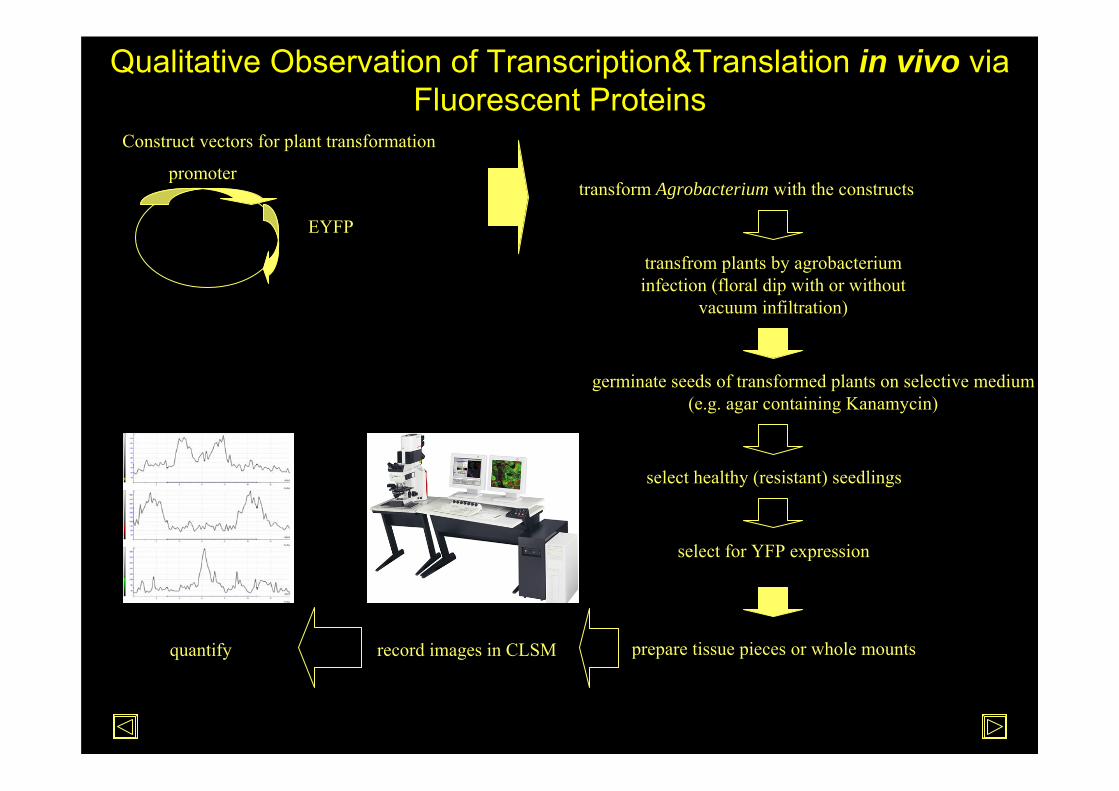
transform Agrobacterium with the constructs
transfrom plants by agrobacteriuminfection (floral dip with or without
vacuum infiltration)
select healthy (resistant) seedlings
prepare tissue pieces or whole mounts
germinate seeds of transformed plants on selective medium(e.g. agar containing Kanamycin)
select for YFP expression
quantify record images in CLSM
promoter
EYFP
Construct vectors for plant transformation
Qualitative Observation of Transcription&Translation in vivo viaFluorescent Proteins
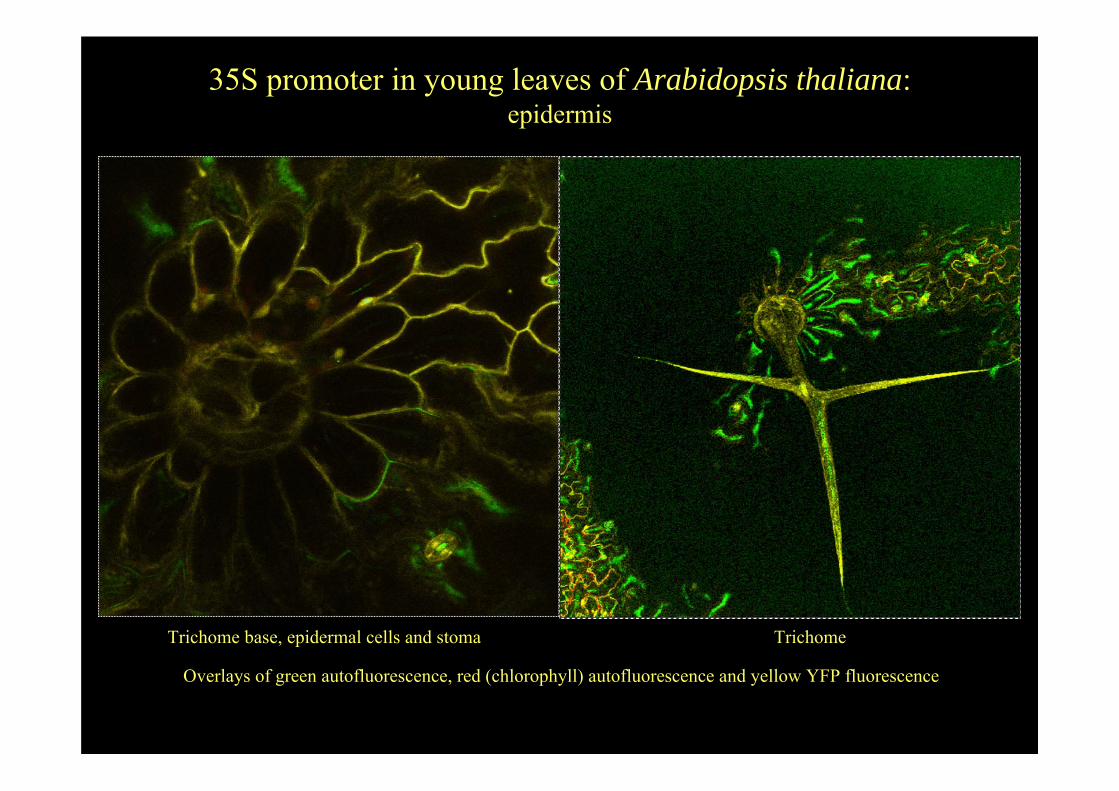
35S promoter in young leaves of Arabidopsis thaliana:epidermis
Overlays of green autofluorescence, red (chlorophyll) autofluorescence and yellow YFP fluorescence
Trichome base, epidermal cells and stoma Trichome
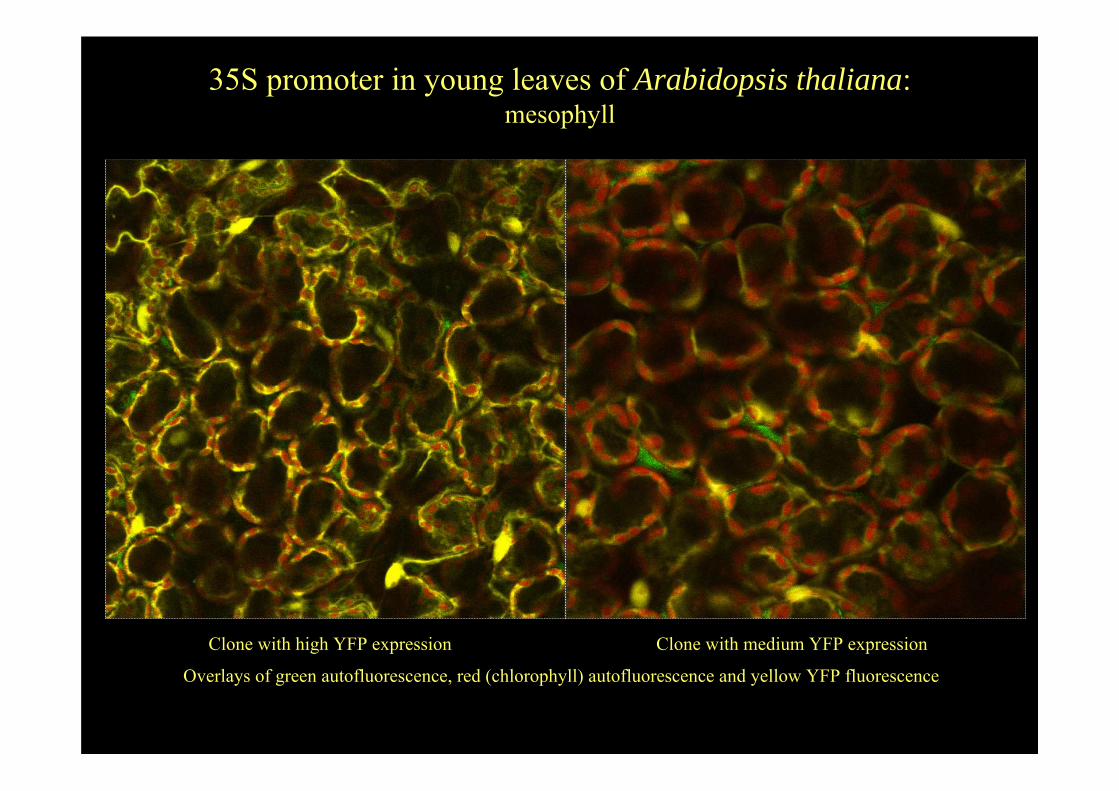
35S promoter in young leaves of Arabidopsis thaliana:mesophyll
Overlays of green autofluorescence, red (chlorophyll) autofluorescence and yellow YFP fluorescence
Clone with high YFP expression Clone with medium YFP expression
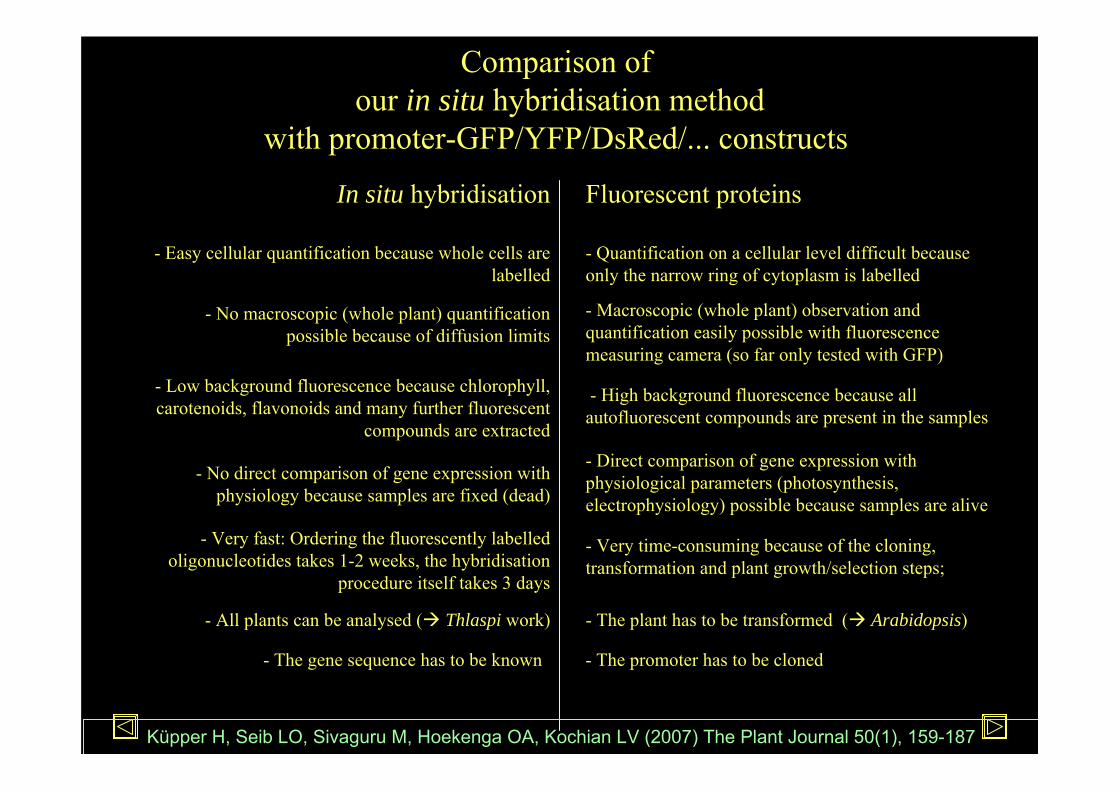
Comparison of our in situ hybridisation method
with promoter-GFP/YFP/DsRed/... constructs
In situ hybridisation
- Easy cellular quantification because whole cells are labelled
- No macroscopic (whole plant) quantification possible because of diffusion limits
- Low background fluorescence because chlorophyll, carotenoids, flavonoids and many further fluorescent
compounds are extracted
- No direct comparison of gene expression with physiology because samples are fixed (dead)
- Very fast: Ordering the fluorescently labelled oligonucleotides takes 1-2 weeks, the hybridisation
procedure itself takes 3 days
- All plants can be analysed ( Thlaspi work)
Fluorescent proteins
- Quantification on a cellular level difficult because only the narrow ring of cytoplasm is labelled
- Macroscopic (whole plant) observation and quantification easily possible with fluorescence measuring camera (so far only tested with GFP)
- High background fluorescence because all autofluorescent compounds are present in the samples
- Direct comparison of gene expression with physiological parameters (photosynthesis, electrophysiology) possible because samples are alive
- Very time-consuming because of the cloning, transformation and plant growth/selection steps;
- The plant has to be transformed ( Arabidopsis)
- The gene sequence has to be known - The promoter has to be cloned
Küpper H, Seib LO, Sivaguru M, Hoekenga OA, Kochian LV (2007) The Plant Journal 50(1), 159-187