
Begoña Sánchez Supplem information Proc Natl Acad Sci USA
5
Supporting Information Saavedra-Ávila et al. 10.1073/pnas.1323236111 40 50 * 6 20 25 * 10 20 30 2 - ΔΔ Ct 2 4 2 - ΔΔ Ct 5 10 15 2 - ΔΔ Ct N NS 0 N NS 0 N NS 0 1.5 1.5 2.0 1.0 2 - ΔΔ Ct 1.0 2 - ΔΔ Ct 1.0 1.5 2 - ΔΔ Ct S.S. T 0.0 0.5 2 S.S. T 0.0 0.5 2 S.S. T 0.0 0.5 * Fig. S1. Cyclin D3 is the only D-type cyclin exhibiting down-regulation upon in vivo infiltration of pancreatic islets. (Upper) Pancreatic islets cells from 11-wk- old nonobese diabetic (NOD) female mice (N, n = 4) and 11-wk-old NOD/SCID female mice (NS, n = 4) were isolated and the CD45 − cell subset (endocrine cells) was selected by magnetic sorting to perform quantitative real-time PCR (qRT-PCR) analysis to assess the mRNA expression levels of each of D-type cyclin (D1 in A, D2 in B, and D3 in C ). (Lower) Six-week-old NOD/SCID female mice were adoptively transferred i.v. with 10 7 total spleen cells (T; n = 6) or injected with saline solution (S.S.; n = 7); 2 wk later, mice were killed and the endocrine cells were sorted (CD45 − fraction) from the total pool of islet cells by magnetic separation. The mRNA expression levels for each D-type cyclin were addressed by qRT-PCR analysis (D1 in D, D2 in E, and D3 in F ). Data are represented as the mean ± SEM *P ≤ 0.05, **P ≤ 0.01. Saavedra-Ávila et al. www.pnas.org/cgi/content/short/1323236111 1 of 5
-
Upload
begona-sanchez-rey -
Category
Documents
-
view
217 -
download
0
description
Â
Transcript of Begoña Sánchez Supplem information Proc Natl Acad Sci USA
Supporting InformationSaavedra-Ávila et al. 10.1073/pnas.1323236111
40
50 *6
20
25
*
10
20
30
2-ΔΔCt
2
4
2-ΔΔCt
5
10
15
2-ΔΔCt
N NS0
N NS0
N NS0
1.5 1.52.0
1.0
2-ΔΔCt
1.0
2-ΔΔCt 1.0
1.52-ΔΔCt
S.S. T0.0
0.5
2
S.S. T0.0
0.5
2
S.S. T0.0
0.5
*
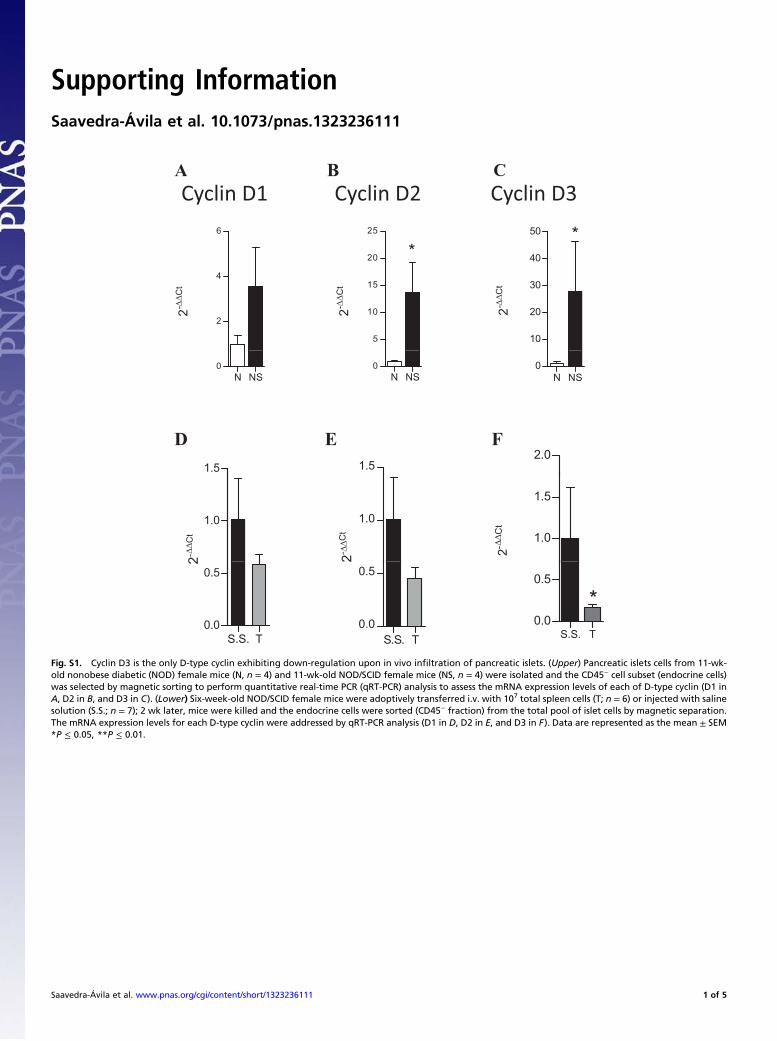
Fig. S1. Cyclin D3 is the only D-type cyclin exhibiting down-regulation upon in vivo infiltration of pancreatic islets. (Upper) Pancreatic islets cells from 11-wk-old nonobese diabetic (NOD) female mice (N, n = 4) and 11-wk-old NOD/SCID female mice (NS, n = 4) were isolated and the CD45− cell subset (endocrine cells)was selected by magnetic sorting to perform quantitative real-time PCR (qRT-PCR) analysis to assess the mRNA expression levels of each of D-type cyclin (D1 inA, D2 in B, and D3 in C). (Lower) Six-week-old NOD/SCID female mice were adoptively transferred i.v. with 107 total spleen cells (T; n = 6) or injected with salinesolution (S.S.; n = 7); 2 wk later, mice were killed and the endocrine cells were sorted (CD45− fraction) from the total pool of islet cells by magnetic separation.The mRNA expression levels for each D-type cyclin were addressed by qRT-PCR analysis (D1 in D, D2 in E, and D3 in F). Data are represented as the mean ± SEM*P ≤ 0.05, **P ≤ 0.01.
Saavedra-Ávila et al. www.pnas.org/cgi/content/short/1323236111 1 of 5
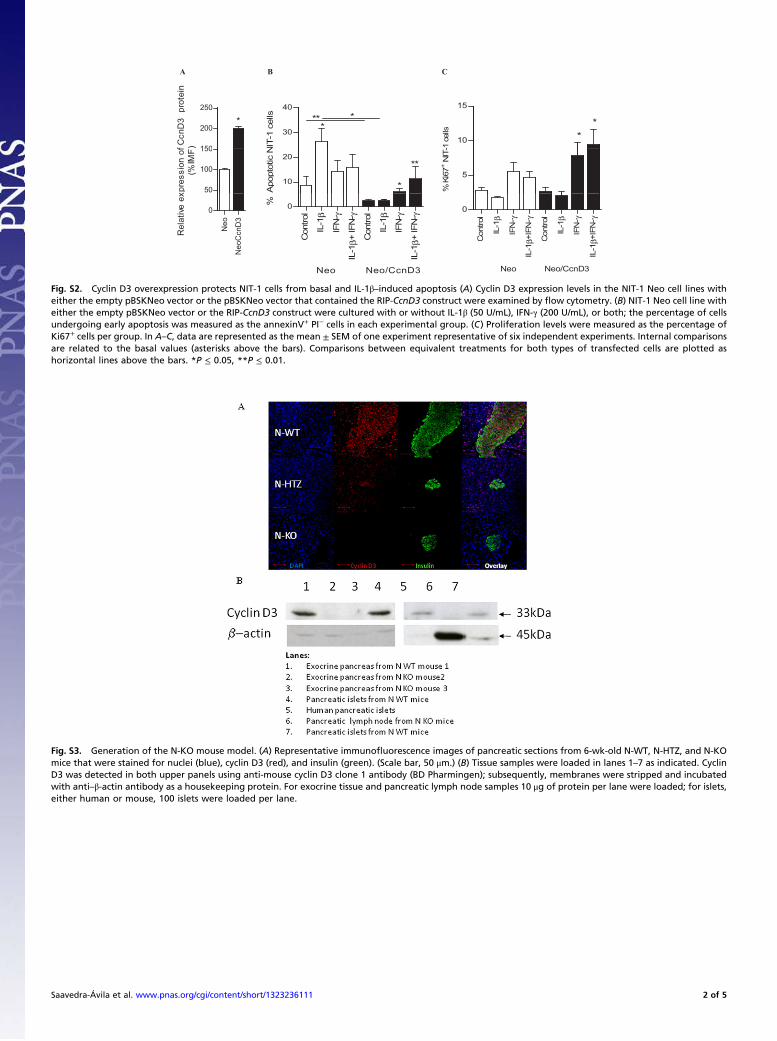
Fig. S2. Cyclin D3 overexpression protects NIT-1 cells from basal and IL-1β–induced apoptosis (A) Cyclin D3 expression levels in the NIT-1 Neo cell lines witheither the empty pBSKNeo vector or the pBSKNeo vector that contained the RIP-CcnD3 construct were examined by flow cytometry. (B) NIT-1 Neo cell line witheither the empty pBSKNeo vector or the RIP-CcnD3 construct were cultured with or without IL-1β (50 U/mL), IFN-γ (200 U/mL), or both; the percentage of cellsundergoing early apoptosis was measured as the annexinV+ PI− cells in each experimental group. (C) Proliferation levels were measured as the percentage ofKi67+ cells per group. In A–C, data are represented as the mean ± SEM of one experiment representative of six independent experiments. Internal comparisonsare related to the basal values (asterisks above the bars). Comparisons between equivalent treatments for both types of transfected cells are plotted ashorizontal lines above the bars. *P ≤ 0.05, **P ≤ 0.01.
Fig. S3. Generation of the N-KO mouse model. (A) Representative immunofluorescence images of pancreatic sections from 6-wk-old N-WT, N-HTZ, and N-KOmice that were stained for nuclei (blue), cyclin D3 (red), and insulin (green). (Scale bar, 50 μm.) (B) Tissue samples were loaded in lanes 1–7 as indicated. CyclinD3 was detected in both upper panels using anti-mouse cyclin D3 clone 1 antibody (BD Pharmingen); subsequently, membranes were stripped and incubatedwith anti–β-actin antibody as a housekeeping protein. For exocrine tissue and pancreatic lymph node samples 10 μg of protein per lane were loaded; for islets,either human or mouse, 100 islets were loaded per lane.
Saavedra-Ávila et al. www.pnas.org/cgi/content/short/1323236111 2 of 5
3*
2
1
2-ΔΔCt
0
NS-WT
NS-HTZ
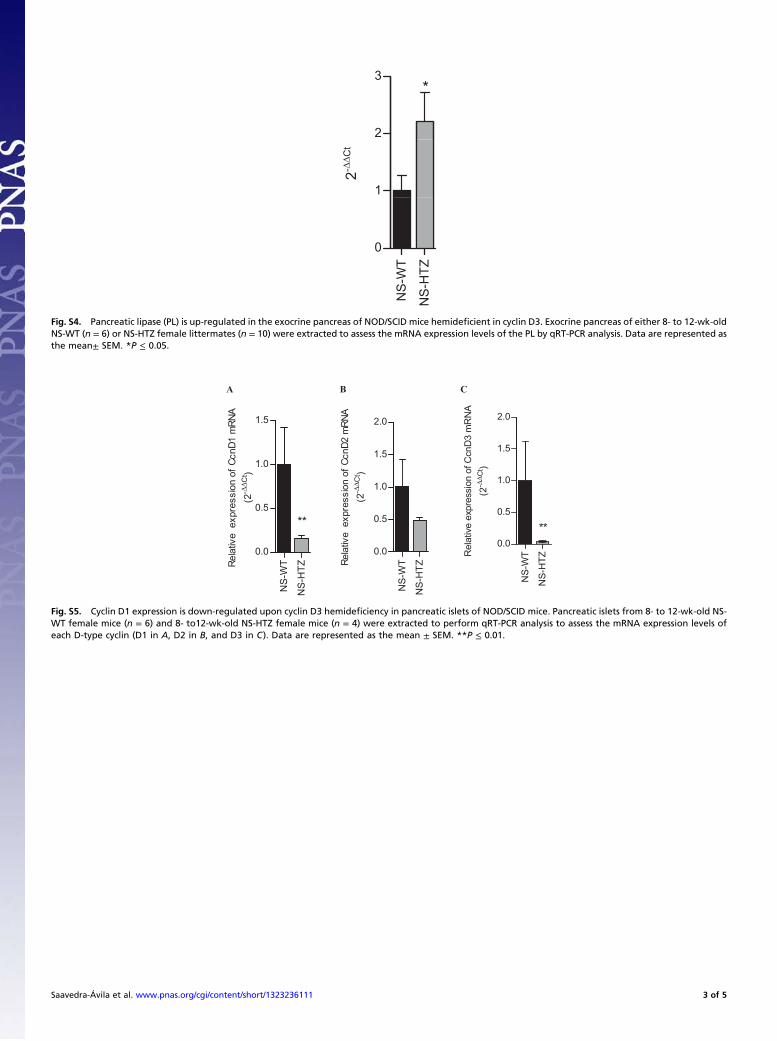
Fig. S4. Pancreatic lipase (PL) is up-regulated in the exocrine pancreas of NOD/SCID mice hemideficient in cyclin D3. Exocrine pancreas of either 8- to 12-wk-oldNS-WT (n = 6) or NS-HTZ female littermates (n = 10) were extracted to assess the mRNA expression levels of the PL by qRT-PCR analysis. Data are represented asthe mean± SEM. *P ≤ 0.05.
Fig. S5. Cyclin D1 expression is down-regulated upon cyclin D3 hemideficiency in pancreatic islets of NOD/SCID mice. Pancreatic islets from 8- to 12-wk-old NS-WT female mice (n = 6) and 8- to12-wk-old NS-HTZ female mice (n = 4) were extracted to perform qRT-PCR analysis to assess the mRNA expression levels ofeach D-type cyclin (D1 in A, D2 in B, and D3 in C). Data are represented as the mean ± SEM. **P ≤ 0.01.
Saavedra-Ávila et al. www.pnas.org/cgi/content/short/1323236111 3 of 5
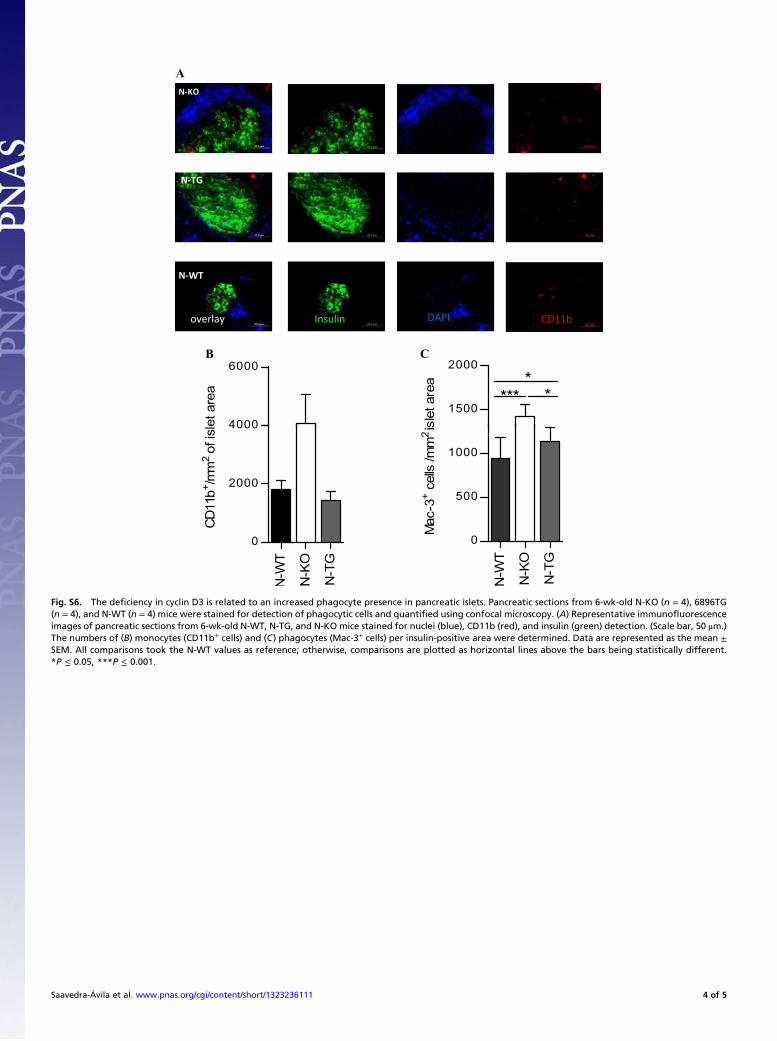
Fig. S6. The deficiency in cyclin D3 is related to an increased phagocyte presence in pancreatic islets. Pancreatic sections from 6-wk-old N-KO (n = 4), 6896TG(n = 4), and N-WT (n = 4) mice were stained for detection of phagocytic cells and quantified using confocal microscopy. (A) Representative immunofluorescenceimages of pancreatic sections from 6-wk-old N-WT, N-TG, and N-KO mice stained for nuclei (blue), CD11b (red), and insulin (green) detection. (Scale bar, 50 μm.)The numbers of (B) monocytes (CD11b+ cells) and (C) phagocytes (Mac-3+ cells) per insulin-positive area were determined. Data are represented as the mean ±SEM. All comparisons took the N-WT values as reference; otherwise, comparisons are plotted as horizontal lines above the bars being statistically different.*P ≤ 0.05, ***P ≤ 0.001.
Saavedra-Ávila et al. www.pnas.org/cgi/content/short/1323236111 4 of 5
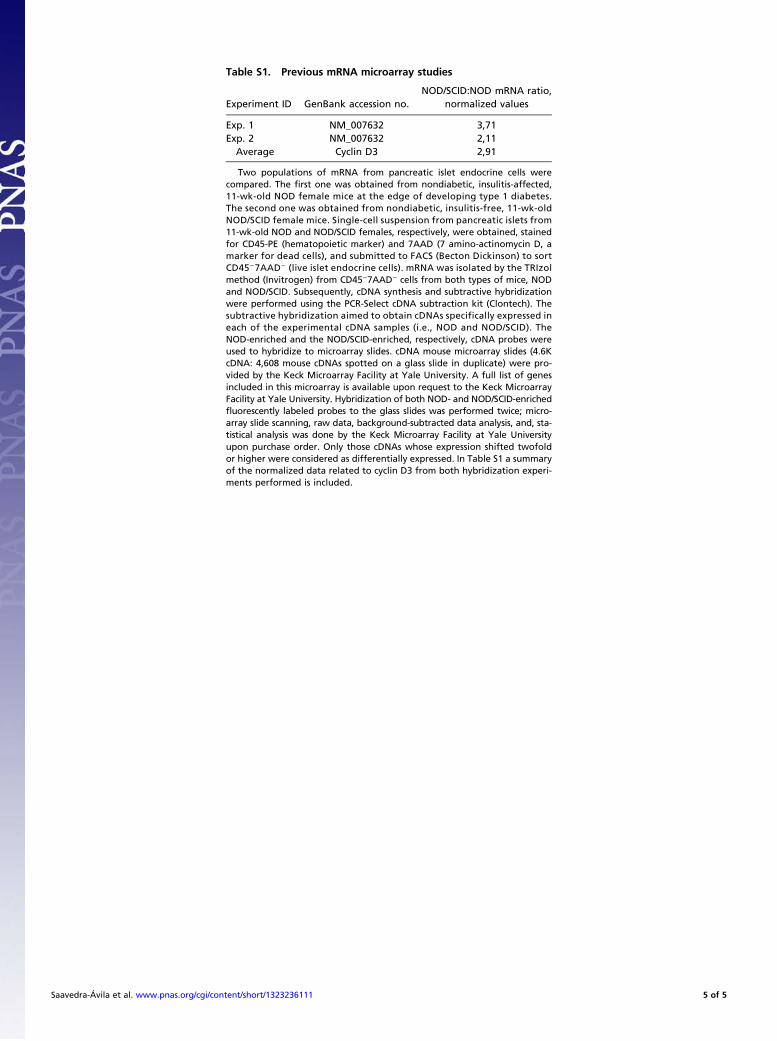
Table S1. Previous mRNA microarray studies
Experiment ID GenBank accession no.NOD/SCID:NOD mRNA ratio,
normalized values
Exp. 1 NM_007632 3,71Exp. 2 NM_007632 2,11
Average Cyclin D3 2,91
Two populations of mRNA from pancreatic islet endocrine cells werecompared. The first one was obtained from nondiabetic, insulitis-affected,11-wk-old NOD female mice at the edge of developing type 1 diabetes.The second one was obtained from nondiabetic, insulitis-free, 11-wk-oldNOD/SCID female mice. Single-cell suspension from pancreatic islets from11-wk-old NOD and NOD/SCID females, respectively, were obtained, stainedfor CD45-PE (hematopoietic marker) and 7AAD (7 amino-actinomycin D, amarker for dead cells), and submitted to FACS (Becton Dickinson) to sortCD45−7AAD− (live islet endocrine cells). mRNA was isolated by the TRIzolmethod (Invitrogen) from CD45−7AAD− cells from both types of mice, NODand NOD/SCID. Subsequently, cDNA synthesis and subtractive hybridizationwere performed using the PCR-Select cDNA subtraction kit (Clontech). Thesubtractive hybridization aimed to obtain cDNAs specifically expressed ineach of the experimental cDNA samples (i.e., NOD and NOD/SCID). TheNOD-enriched and the NOD/SCID-enriched, respectively, cDNA probes wereused to hybridize to microarray slides. cDNA mouse microarray slides (4.6KcDNA: 4,608 mouse cDNAs spotted on a glass slide in duplicate) were pro-vided by the Keck Microarray Facility at Yale University. A full list of genesincluded in this microarray is available upon request to the Keck MicroarrayFacility at Yale University. Hybridization of both NOD- and NOD/SCID-enrichedfluorescently labeled probes to the glass slides was performed twice; micro-array slide scanning, raw data, background-subtracted data analysis, and, sta-tistical analysis was done by the Keck Microarray Facility at Yale Universityupon purchase order. Only those cDNAs whose expression shifted twofoldor higher were considered as differentially expressed. In Table S1 a summaryof the normalized data related to cyclin D3 from both hybridization experi-ments performed is included.
Saavedra-Ávila et al. www.pnas.org/cgi/content/short/1323236111 5 of 5


![Index [link.springer.com]978-3-319-01008-3/1.pdf · Index β-Hydroxy acyl-CoA dehydrogenase (β-HAD), 117 Álvarez-Sánchez, B., 216, 217 13C labelling, 242, 245, 247 2-Hydroxyisobutyric](https://static.fdocument.org/doc/165x107/5a86029d7f8b9ac96a8cca96/index-link-978-3-319-01008-31pdfindex-hydroxy-acyl-coa-dehydrogenase-had.jpg)


![398-Prakt Sygk Acad.9 mitroa PTPE… · 2019. 1. 21. · Z µ h v ] À ] Ç v , µ u } o Z h v ] À ]](https://static.fdocument.org/doc/165x107/60bba068c489f90c366409f5/398-prakt-sygk-acad9-mitroa-ptpe-2019-1-21-z-h-v-v-u.jpg)