
BANK OF GREECE · The programme has been characterized by frequent revenue ... namely VAT revenues...
22
Transcript of BANK OF GREECE · The programme has been characterized by frequent revenue ... namely VAT revenues...
BANK OF GREECE
Economic Research Department – Special Studies Division
21, Ε. Venizelos Avenue
GR-102 50 Athens
Τel: +30210-320 3610
Fax: +30210-320 2432
www.bankofgreece.gr
Printed in Athens, Greece
at the Bank of Greece Printing Works.
All rights reserved. Reproduction for educational and non-commercial purposes is permitted
provided that the source is acknowledged.
ISSN 1109-6691

ASSESSING THE VARIABILITY OF INDIRECT TAX ELASTICITY
IN GREECE
Athanasios O. Tagkalakis
Bank of Greece
Abstract
This paper shows that the variability of indirect tax elasticity relative to GDP has
increased significantly in recent years in Greece. Based on this finding we show that the
budgetary sensitivity of indirect taxes following a 1% change in real GDP has increased
dramatically since 2010. This finding has substantial policy implications; failure to
account for these higher elasticities will lead to recurrent revenue shortfalls requiring new
policy measure to meet previously set fiscal targets. This could lead to a downward spiral
of continuously declining economic activity, new revenue shortfalls and additional fiscal
measures and so on.
JEL classification: C32; E32; H20; O52
Keywords: indirect taxes; elasticity; GDP; Greece
Acknowledgements: I would like to thank the John P. Conley, Heather Gibson and two
anonymous reviewers, as well as Fragiskos Archontakis, Panagiotis Konstantinou,
Dimitris Malliaropulos and Basileios Manesiotis for very helpful comments and
suggestions. The views expressed in the paper are mine and do not necessarily reflect
those of the Bank of Greece. All remaining errors are mine.
Correspondence:
Athanasios O. Tagkalakis
Bank of Greece,
21, El. Venizelos Ave.
10250 Athens, Greece
Tel.:0030-210-3202442
Fax: 0030-210-3232025
Email: [email protected]

5
1. Introduction
The success of the on-going fiscal consolidation effort is a prerequisite for the
recovery of the Greek economy. This implies that all possible interactions between fiscal
consolidation and economic activity have to be fully understood. Recently, and driven by
an IMF initiative, there has been a discussion on the size of fiscal multiplier, which is key
determinant of the short-term recessionary effects of fiscal consolidation. As a result, the
average fiscal multiplier in Greece was revised upwards to around 1 from 0.5.1 Despite
progress with pinpointing the impact on output of an exogenous change in fiscal policy
variables, there has been little discussion on the impact of changes in economic activity
on revenue and budget performance.
Yet analysis of this relationship is important for understanding issues surrounding
the implementation of the Economic Adjustment Programme (EAP) for Greece from May
2010 onwards. The programme has been characterized by frequent revenue shortfalls, in
particular as regards indirect taxes. Despite successive increases in VAT rates and excise
taxes since the start of the EAP, indirect tax revenues have been declining in line with the
declining path of private consumption and economic activity (IMF, 2012a; 2013).
According to recently released Ministry of Finance (MoF) data for the period
January-February 2013, indirect tax revenues show a quite significant shortfall from
target of about €496 million or about 0,25% of GDP.2 Substantial shortfalls were also
recorded in 2012. According to the March 2012 IMF report on Greece, indirect tax
revenues for 2012 were projected at €26.9 billion (IMF, 2012a). The most recent IMF
report (IMF, 2013, January) revised downward that figure by about €700 million, i.e., to
about €26.2 billion.3
What lies behind these recurrent revenue shortfalls and why are successive EAP
projections not updated so that the revenue shortfall is minimized? Two possible
explanations that have been put forward related to the continuous and dramatic decline in
1 See IMF (2012b), World Economic Outlook, Autumn; Blanchard and Leigh, 2013.
2 According to MoF data indirect tax receipts in January-February 2012 amounted to €3,966 million vis-à-
vis a target of €4,462 million. 3 Recently published MoF data revised the indirect tax receipts figure to €26,082 million, i.e., further below
the recent IMF estimates.
6
economic activity in Greece (from 2008 to 2012) and the inability of revenue
administration to fight tax evasion.4
In this study, driven by the findings of earlier IMF studies, like Poghosyan (2011),
Brondolo (2009), Sansak et al. (2010), we examine how the indirect tax elasticity varies
across time and economic activity. The results of the aforementioned studies have shown
that the variability of the elasticity of indirect taxes to economic activity tends to increase
in the course of the crisis. Hence, continuously declining economic activity (as in the case
of Greece) could be associated with a higher indirect tax elasticity, which in turn
translates into bigger revenue shortfalls.
On this point it should be mentioned the reference value for the indirect tax
elasticity in Greece is usually assumed to be 1 (constant through the cycle unitary
elasticity) based on the influential OECD study of Girouard and Andre (2005) and a
recent European Commission (2005) working document.
Our findings indicate that the elasticity of indirect taxes with respect to real GDP
has increased in the course of the crisis lying between 1.23-1.84 in recent years. This is
due both to increased variability of the tax base to GDP (composition effects) and
increased variability of indirect tax revenues to tax base. Based on these elasticities we
calculate budgetary sensitivity parameters of indirect taxes which range from 0.15-0.23
percentage point (pp) of GDP, i.e. substantially higher than what is implied by the unitary
elasticity assumption (0.11-0.12 pp of GDP). This implies that the constant along the
cycle unitary elasticity assumption has to be reconsidered, in order to better understand
the interaction between fiscal consolidation and economic activity and to improve the
design of economic policy making.
In the remainder of the paper we examine the following: Section 2 discusses data
issues, methodology and presents the main findings. Section 3 summarizes and
concludes.
4 The IMF (2013) has criticized the show progress in the area of revenue administration reforms. However,
there has been recent evidence pointing to the effectiveness of tax audits in Greece in lowering VAT tax
related offenses (Tagkalakis, 2013).
7
2. Data, methodology and findings
We use quarterly data on indirect taxes (VAT and other indirect taxes), private
consumption and GDP over the period 2000:Q1-2012:Q3. The GDP deflator is used to
transform the data into real terms.5 As noted above, Girouard and Andre (2005) have
estimated a unitary elasticity of indirect taxes with respect to economic activity through
the cycle. In line with Girouard and Andre (2005), we calculate the elasticity of indirect
taxes to GDP as the product of two elasticities6:
Elasticity of indirect
taxes to real GDP
=
Elasticity of indirect
taxes to real private
consumption
*
Elasticity of real
private consumption
to real GDP
(1)
Following earlier IMF studies like Poghosyan (2011), we split indirect taxes into
VAT and other indirect taxes. Using data over the period 2000:Q1 – 2012:Q3 we regress
by means of OLS (with robust standard errors) the following specification: 7
Δlog(VAT)t = α + β*Δlog(Private consumption)t + ΣN=4
i=1 γi*Δlog(Private consumption)t-i
+Electionst + EAPt +Changes in VAT ratest+time trendt + εt (2)
The variables of interest are the following: the year-on-year growth rate of VAT
revenuesi.e., Δlog(VAT)t =logVATt-logVATt-4.8 The “election” dummy captures election
periods, in line with anecdotal evidence that revenue collection and budgetary
performance deteriorates in election periods. The “EAP” dummy captures the period that
Greece is under joint EU-IMF surveillance (since May 2010). The sign of this variable is
5 Data are seasonally adjusted by means of the census X12 procedure.
6 Girouard and Andre (2005) examine the elasticity of indirect taxes with respect to the output gap.
However, we consider the elasticity of indirect taxes with respect to real GDP (and real private
consumption) because since 2008-2009 economic activity in Greeece has been continuously declining and
making it difficult to obtain reliable estimates of potential GDP and consequently the output gap. 7 We also considered OLS with Newey-West standard errors, i.e., the error structure is assumed to be
heteroskedastic and auto-correlated up to one lag. Additionally, we considered a generalized least-squares
method to estimate the parameters in a linear regression model in which the errors are assumed to follow a
first-order autoregressive process. 8 According to data reported by the General Secretariat of Information Systems (GSIS) of the Hellenic
Ministry of Finance there is exceptional seasonality in VAT revenues; namely VAT revenues pick in
January, April, July and October.
8
not clear. On the one hand, measures have been taken during the period of the adjustment
programme to improve revenue administration and fight tax evasion. On the other hand,
anecdotal evidence suggests that the strong deterioration in economic activity and credit
conditions during the EAP years have led to sharply increased tax evasion. The time trend
captures time related effects that affect the relationship between VAT and private
consumption (e.g. over the course of the recent years, efforts to fight tax evasion have
intensified). Finally, the variable “Changes in VAT rates” captures changes in VAT
rates9. εt is a well behaved error term. The coefficient β captures the elasticity of VAT to
private consumption. The empirical estimates are presented in Table A.1 (column 1) in
the Appendix.
Following Poghosyan (2011), we link other indirect taxes directly to real GDP.10
Hence, we estimate by means of OLS (with robust standard errors) the following
specification: 11
Δlog(Other indirect taxes)t = α1 + β1*Δlog(GDP)t + ΣN=4
i=1 γ1i*Δlog(GDP)t-i +Electionst
+ EAPt + time trendt +EAP* time trendt + EDPt+ εt (3)
Turning to the control variables, EDP captures the period that Greece was in
excessive deficit procedure, i.e. 2004:Q3-2007:Q2 and from 2009:Q1-2010:Q1, taking
into account tax policy changes that occurred in that period. Greece continues to be in
EDP in the post 2010:Q2 period, however, we differentiate between the pre- and post-
EAP period because in the period during which Greece has been receiving EU-IMF
funding, surveillance procedures are stricter and much more intense relative to the pre-
EAP EDP surveillance. Moreover, tougher consolidation measures were implemented in
the more recent period. The time trend captures time related effects that affect the
9 In Greece a series of VAT rate changes has been observed particularly in the period under EU-IMF
surveillance, e.g. in 2010 Q1 the VAT rates increased to 21%, 10%, 5% from 19%, 9% and 4.5% in effect
since 2005. In 2010 Q2 the rates were further increased to 21%, 11% and 5.5%. In 2010 Q3 the higher rate
was further increased to 23%. In 2011 Q1 the middle and lower rates were increased to 13% and 6.5%, and
from 2011 Q3 the higher rate of 23% was applied to a wider base of products, i.e. catering and restaurant
services (food and drinks that were previously taxed at 13%); see Bank of Greece (2009-2013). 10
In one of the alternative specifications of the model we do link other indirect taxes to real private
consumption. The findings are presented in Table A.1. 11
See footnote 7.
9
relationship between other indirect taxes and GDP. The interaction term “EAP*time
trend” captures the successive measures undertaken in more recent years, as well as
efforts to tackle tax evasion by improving tax revenue administration.12
The coefficient β1
reflects the elasticity of other indirect taxes with respect to real GDP. The empirical
estimates are presented in Table A.1 (column 2) in the Appendix.
Building on the abovementioned studies, we evaluate the relationship between the
tax base and (real private consumption) and real GDP. Hence, we estimate by means of
OLS (with robust standard errors) the following specification: 13
Δlog(Private consumption)t = α2 + β2*Δlog(GDP)t + ΣN=4
i=1 γ2i*Δlog(GDP)t-i + trendt + εt (4)
The coefficient β2 is the elasticity of private consumption to GDP.14
The empirical
estimates are presented in Table A.1 (column 3) in the Appendix.
We recursively estimate equations (2)-(4). We estimate specification (2) and (3)
over the period 2000:Q1-2008:Q1, and then we repeat the estimation adding one data
point at a time until the end of the sample (2012:Q3). This way we get recursive estimates
of “β” and “β1” over the period 2008:Q1-2012:Q3. The findings are depicted in Figures
1-2 and reveal that both VAT revenue and other indirect taxes have shown increased
variability in recent years. This conclusion is particularly pronounced for VAT revenue
(vis-à-vis changes in real private consumption). As regards specification (4) we repeat the
above exercise, though we start our estimations using the sample 2000:Q1-2009:Q1 in
order to get more reliable estimates of β2 and then we add one data point at a time till the
end of the sample. The results are shown in Figure 3.15
In all cases we try to start the
12
In this setting we do not consider each specific tax policy changes related to other indirect taxes; however
we believe that these are reflected in the EDP, EAP and EAP*time trend variables. Since the start of the
implementation of the Greek EAP (and just before that), there have been a series of excise tax increases on
tobacco, alcohol, fuel; see Bank of Greece (2009-2013). All these changes are reflected in the EDP, EAP
and EAP*time trend variables that are intended to capture tax policy changes in the period under
investigation. Tax policy changes were undertaken to abide by the requirements of the excessive deficit
procedure and the Economic Adjustment Programme for Greece. 13
See footnote 7. 14
We have also examined an alternative specification that includes the EAP dummy; the findings are
qualitatively similar. 15
As in Poghosyan (2011), we have also repeated the same exercise using rolling regression with fixed
windows of 32 (and/or 36) quarters. The results are qualitatively similar.
10
estimates of the recursive regressions either in early 2008 or in early 2009 in order to
capture the period prior to the deepening of the economic recession in the more recent
years. The findings reported in Figure 3 indicate that the variability of the tax base
(private consumption) vis-à-vis real GDP increased substantially in recent years,
highlighting the important role of composition effects in the decline of indirect tax
revenues.
Figure 4 depicts the recursive estimates of the elasticity of indirect taxes to real
GDP over the period 2009:Q1-2012:Q3, which is the outcome of the recursive estimates
obtained from specifications (2)-(4) and definition (1). In more detail we calculate the
recursive estimate of the elasticity of indirect taxes to real GDP as follows:
Elasticity of
indirect
taxes to real
GDP
=
(Elasticity of
VAT to real
private
consumption
*
Elasticity of
real private
consumption
to real GDP)
*
(VAT/indirect
taxes)
+
Elasticity of
other
indirect
taxes to
real GDP
*
(other
indirect
taxes/indir
ect taxes)
(5)
In Figure 4, we also present two alternative estimates of the elasticity of indirect
taxes to GDP.16
In the first, we calculate the elasticity of other indirect taxes to real GDP
in the same way as the elasticity of VAT to private consumption, i.e., as the product of
the estimated elasticity of other indirect taxes to real private consumption17
times the
estimated elasticity of real private consumption to real GDP. In the second case, we
consider only the aggregate indirect tax series, i.e., we do not differentiate between VAT
and other indirect taxes. In this case the elasticity of indirect taxes to real GDP is the
16
See also the supplementary material appendix for a more detailed presentation of the findings (including
95% confidence bands). 17
The elasticity of other indirect taxes to private consumption resembles specifications (3), see Table A.1
(column 4).
11
product of the estimated elasticity of indirect taxes to real private consumption18
and the
estimated elasticity of real private consumption to real GDP.
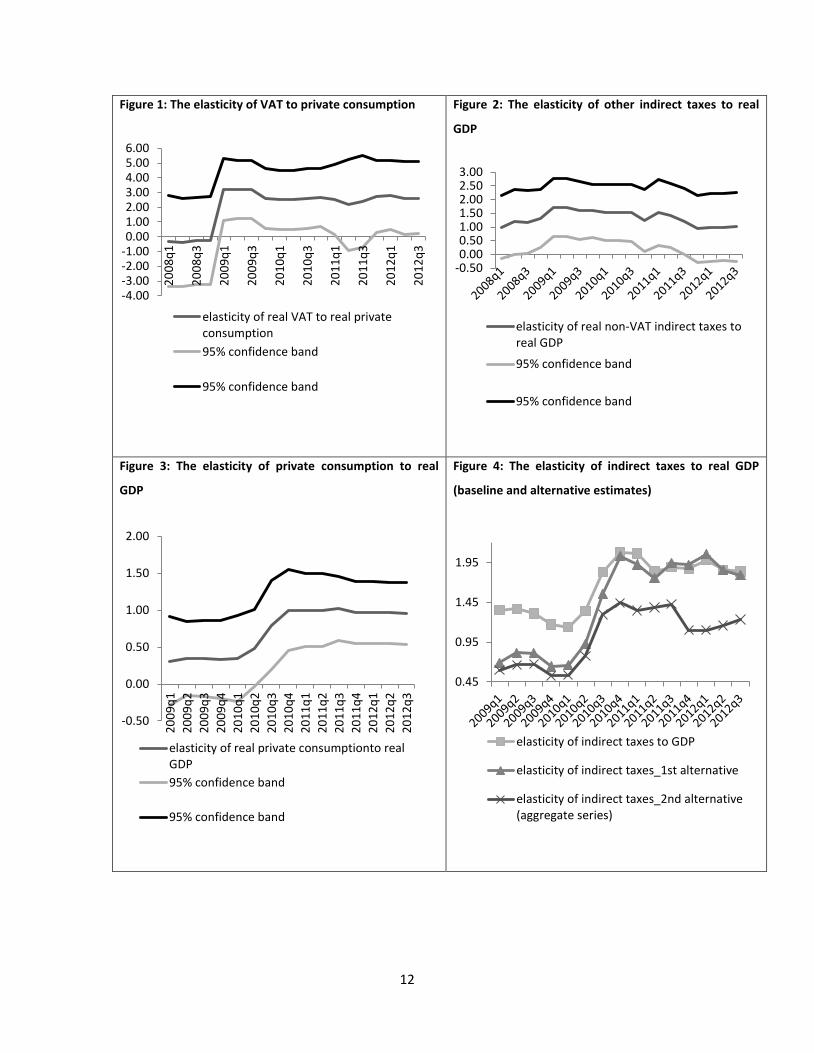
According to the findings displayed in Figure 4, the estimated elasticity of indirect
taxes with respect to GDP has shown great variability in recent years, a finding verified
by all three specifications considered (the elasticity increased above 1 after 2010:Q3).
According to the baseline and first alternative estimate, the elasticity of indirect taxes to
GDP (controlling for tax policy changes) reached as high as 2 at the end of 2010,
oscillating around that level before gradually returning to around 1.8 by the end of the
sample in 2012:Q3. The second alternative estimate based on the aggregate indirect tax
series indicates that the elasticity of indirect taxes to GDP reached 1.45 at the end of 2010
and remained close to that level until 2011:Q3 before falling to more normal levels of
around 1.10 at the end of 2011. Thereafter, it started rebounding reaching close to 1.25 at
the end of the sample.
Although estimates presented here vary, our findings indicate that the elasticity of
indirect taxes to GDP can be between 25% and 80% higher than the constant unitary
elasticity of Girouard and Andre (2005).
18
The elasticity of indirect taxes to private consumption blends features of both specifications (2) and (3),
i.e., it includes changes in VAT rate, the EDP dummy and the interaction dummy “EAP*time trend” that
reflect among other things changes in other indirect taxes (see Table A.1, column 5).
12
Figure 1: The elasticity of VAT to private consumption
Figure 2: The elasticity of other indirect taxes to real
GDP
Figure 3: The elasticity of private consumption to real
GDP
Figure 4: The elasticity of indirect taxes to real GDP
(baseline and alternative estimates)
-4.00-3.00-2.00-1.000.001.002.003.004.005.006.00
20
08
q1
20
08
q3
20
09
q1
20
09
q3
20
10
q1
20
10
q3
20
11
q1
20
11
q3
20
12
q1
20
12
q3
elasticity of real VAT to real privateconsumption
95% confidence band
95% confidence band
-0.500.000.501.001.502.002.503.00
elasticity of real non-VAT indirect taxes toreal GDP
95% confidence band
95% confidence band
-0.50
0.00
0.50
1.00
1.50
2.00
20
09
q1
20
09
q2
20
09
q3
20
09
q4
20
10
q1
20
10
q2
20
10
q3
20
10
q4
20
11
q1
20
11
q2
20
11
q3
20
11
q4
20
12
q1
20
12
q2
20
12
q3
elasticity of real private consumptionto realGDP
95% confidence band
95% confidence band
0.45
0.95
1.45
1.95
elasticity of indirect taxes to GDP
elasticity of indirect taxes_1st alternative
elasticity of indirect taxes_2nd alternative(aggregate series)
13
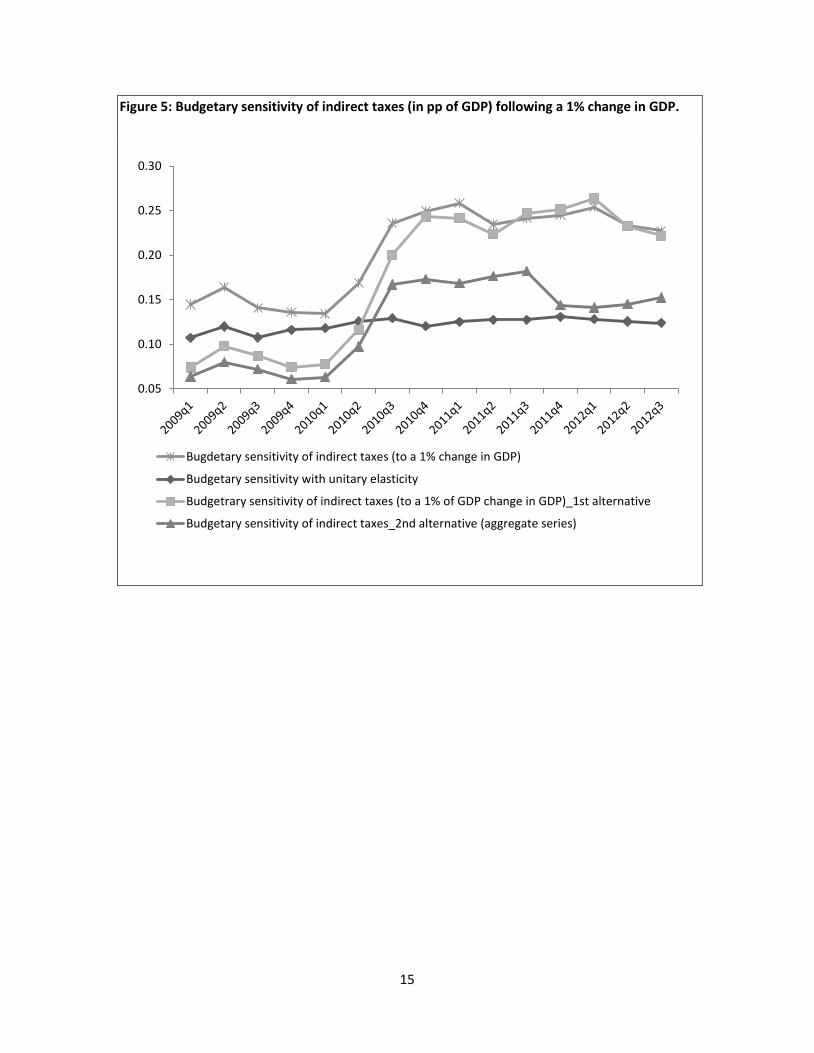
Next we transform the estimated elasticities of indirect taxes to GDP into measures
of the sensitivity of the budget to indirect taxes. Following Girouard and Andre (2005),
we multiply the estimated elasticities by the share of indirect taxes to GDP. The product
of these two gives us the estimated budgetary sensitivity of indirect taxes, i.e. the change
in the budget in percentage points (pp) of GDP (driven by indirect taxes) following a 1%
change in GDP (see Figure 5). In Figure 5, we also present budgetary sensitivities based
on the unitary elasticity assumption (which is merely the share of indirect taxes in GDP).
The baseline and first alternative estimate indicate that the budgetary sensitivity of
indirect taxes increased to as high as 0.24-0.26 pp of GDP at the end of 2010 and into
early 2011. This is almost twice as large as the sensitivity implied by the unitary elasticity
assumption. In the following quarters it marginally declined approaching 0.22-0.23 p.p.
of GDP at the end of the sample. The second alternative estimate based on the aggregate
indirect tax series points to a smaller maximum effect of about 0.17-0.18 p.p. of GDP
from 2010:Q3-2011:Q3, which then falls to 0.14 and increases up to 0.15 pp of GDP by
the end of the sample.
Based on a projected GDP of about €193.7 billion in 2012, the unitary elasticity
assumption implies that a 1% fall in GDP will reduce indirect taxes and increase the
budget deficit by about €239.9 million. The second alternative elasticity estimate would
worsen the deficit by €295.4 million, while the baseline and first alternative estimates
raise the deficit impact to as high as €429.8 to €440.6 million. Thus, the impact on the
deficit from a decline in GDP could be between €55.5 and €200.8 million higher than that
derived assuming a unitary elasticity.
This revenue shortfall that will not be anticipated will have to be covered by
additional measures to contain the impact on deficit.19
These additional consolidation
19
In order to put these numbers into perspective, they should be contrasted with some of the fiscal policy
interventions detailed in the Medium Term Fiscal Strategy (MTFS) for 2013-2016 unveiled by the Ministry
of Finance in early 2013 (MoF, 2013). More specifically, the 10% reduction in temporary public
employment contracts over the period 2013-2016 will yield expenditure saving of €49.1 million, the cuts in
the salaries of those employed in “special regimes” (judges, military personnel, university staff etc) will
yield €161.4 million in 2013, the new mobility scheme of public sector employees involving lay-offs is
expected to yield expenditure savings of €106.8 million in 2013-2016. The rationalization and cuts in social
benefits will yield €68.3 million in 2013-2016. Co-payment for hospital services will yield €115 million in
2014 and, finally, cuts in educational spending will yield €129.5 million in the period 2013-2016. Hence,
the underestimation of the budgetary impact of indirect taxes due to lower economic activity can have
14
measures further reduce output leading to additional unanticipated revenue shortfalls,
which require new measures and so on. A better assessment of the elasticity of indirect
taxes to GDP and of the sensitivity of the budget to changes in GDP can contribute to
improving policy making and the design of fiscal consolidation measures.
3. Summary and conclusions
The above analysis provides empirical evidence on the variability of the indirect tax
elasticity in Greece. This is explained both by increased variability of the tax base
(private consumption) to GDP (composition effects) and by an increased sensitivity of
indirect tax revenues to their tax base. Composition related changes, if they persist, could
be associated with structural rather than temporary reductions in indirect tax revenue.
This latter effect is consistent with tax compliance issues. As shown by Brondolo (2009),
in times of economic stress, the collection of VAT revenue declines because people have
more incentives to evade tax or face tougher credit and financial constraints that induce
them to evade taxes. Sancak et al. (2010) also find that the efficiency of VAT collections
tends to be lower in “bad” times (when the output gap is negative and the informal
economy is expanding).
In addition, our analysis shows that the dramatically contracting economic activity
in Greece since 2010 has had much larger adverse budgetary implications (through
declining indirect taxes) than anticipated based on the unitary elasticity assumption.
The variability of the indirect tax elasticity in recent years has important policy
implications. It implies that, if not taken into account in revenue projections, revenue
shortfalls will constantly materialize, impairing the achievement of policy targets. New
measures will then be required to meet the fiscal targets, which in turn impact negatively
on economic activity, further lower tax revenues, and so on (i.e. generating a downward
spiral).
substantial repercussions, requiring additional consolidation measures to fill the fiscal gap, something that
would be hard to find given the small expected yield of some of the MTFS measures mentioned above.
15
Figure 5: Budgetary sensitivity of indirect taxes (in pp of GDP) following a 1% change in GDP.
0.05
0.10
0.15
0.20
0.25
0.30
Bugdetary sensitivity of indirect taxes (to a 1% change in GDP)
Budgetary sensitivity with unitary elasticity
Budgetrary sensitivity of indirect taxes (to a 1% of GDP change in GDP)_1st alternative
Budgetary sensitivity of indirect taxes_2nd alternative (aggregate series)
16
References
Bank of Greece (2009) “Governor’s Annual Report for 2008”. Annex to Chapter VIII:
Tax policy changes April, Bank of Greece.
Bank of Greece (2010) “ Governor’s Annual Report for 2008”. Annex to Chapter VIII:
Tax policy changes, April, Bank of Greece.
Bank of Greece (2011) “Governor’s Annual Report for 2010”. Annex to Chapter IX: Tax
policy changes, April, Bank of Greece.
Bank of Greece (2012) “Governor’s Annual Report for 2011”. Annex to Chapter IX: Tax
policy changes, April, Bank of Greece.
Bank of Greece (2013) “Governor’s Annual Report for 2012”. Annex to Chapter IX: Tax
policy changes, February, Bank of Greece.
Blanchard, O and D. Leigh (2013) “Growth forecast errors and fiscal multipliers”, IMF
Working Papers Number 1.
Brondolo, J. (2009) “Collecting Taxes During an Economic Crisis: Challenges and Policy
Options”, IMF Staff Position Note 17.
European Commission (2005) “New and updated budgetary sensitivities for the EU
budgetary surveillance” European Commission, Economic and Financial Affairs.
General Secretariat of Information Systems (2013) “Tax Administration Monitor”, May.
Hellenic Ministry of
Finance.(http://www.gsis.gr/gsis/info/gsis_site/PublicIssue/TaxAdmin.html)
Girouard, N and C. André (2005) “Measuring Cyclically adjusted Budget Balances for
OECD Countries” OECD Economics Department Working Papers, Number 434.
IMF (2012a) “Greece: Request for Extended Arrangement Under the Extended Fund
Facility” IMF Country Report Number. 12/57.
IMF (2012b) “Copping with high debt and sluggish growth” World Economic Outlook,
October, IMF: Washington.
IMF (2013) “Greece: First and Second Reviews Under the Extended Arrangement Under
the Extended Fund Facility” IMF Country Report Number. 20.
Ministry of Finance (2013) “Update of the Medium Term Fiscal Strategy for 2013-2016”
February, Ministry of Finance.
Poghosyan, T. (2011) “Assessing the variability of tax elasticities in Lithuania”, IMF WP
11/270.
17
Sancak, C., Velloso, R and J. Xing (2010) “Tax Revenue Response to the Business
Cycle” IMF Working Paper Number 71.
Tagkalakis, A. (2013) “Audits and tax offenders: recent evidence from Greece”
Economic Letters 118, 519-522.
18
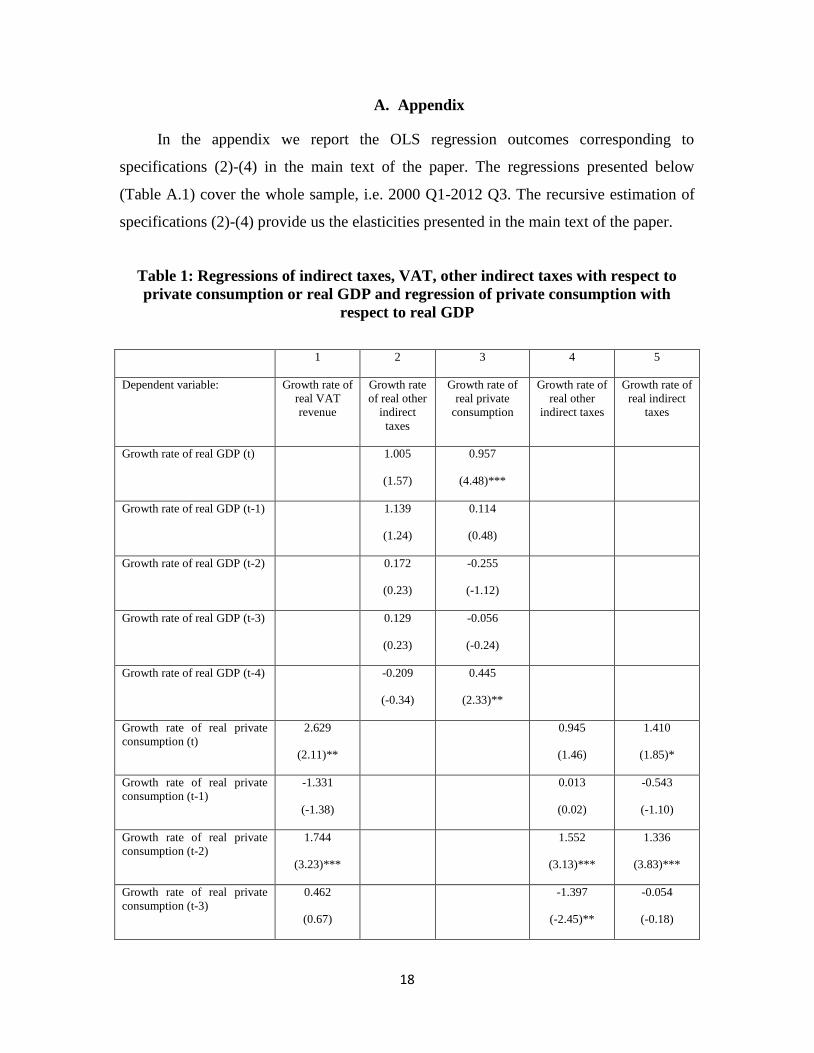
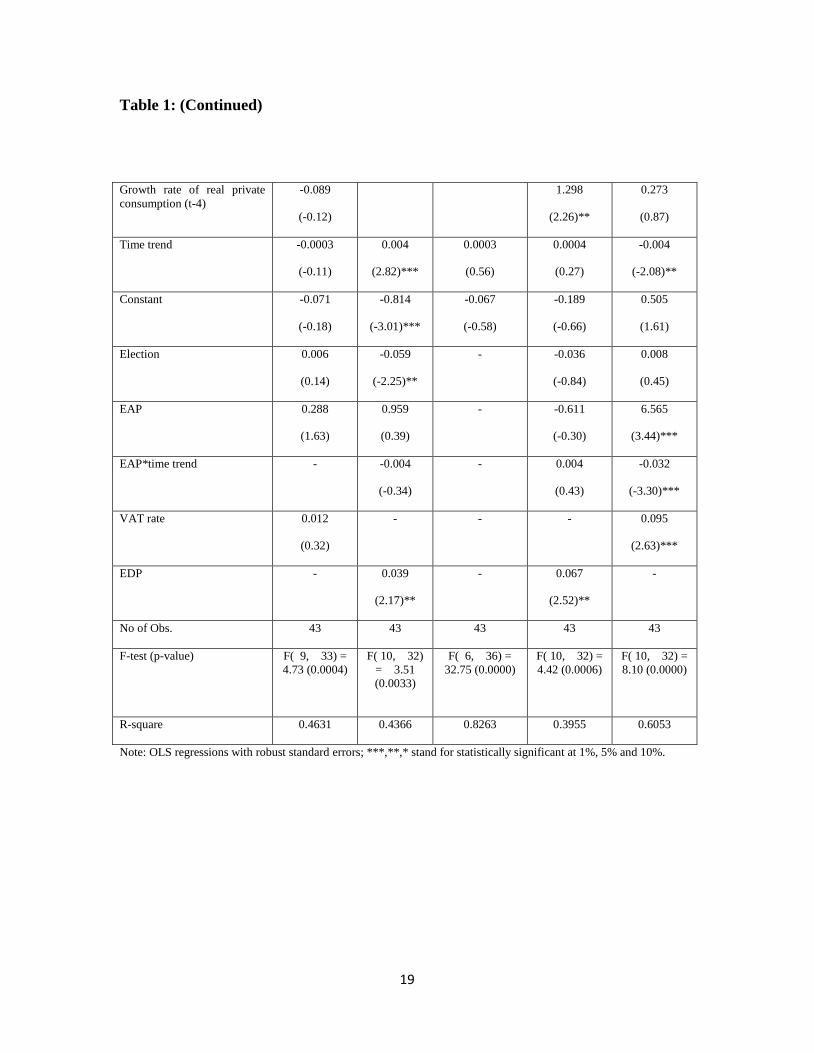
A. Appendix
In the appendix we report the OLS regression outcomes corresponding to
specifications (2)-(4) in the main text of the paper. The regressions presented below
(Table A.1) cover the whole sample, i.e. 2000 Q1-2012 Q3. The recursive estimation of
specifications (2)-(4) provide us the elasticities presented in the main text of the paper.
Table 1: Regressions of indirect taxes, VAT, other indirect taxes with respect to
private consumption or real GDP and regression of private consumption with
respect to real GDP
1 2 3 4 5
Dependent variable: Growth rate of
real VAT
revenue
Growth rate
of real other
indirect
taxes
Growth rate of
real private
consumption
Growth rate of
real other
indirect taxes
Growth rate of
real indirect
taxes
Growth rate of real GDP (t) 1.005
(1.57)
0.957
(4.48)***
Growth rate of real GDP (t-1) 1.139
(1.24)
0.114
(0.48)
Growth rate of real GDP (t-2) 0.172
(0.23)
-0.255
(-1.12)
Growth rate of real GDP (t-3) 0.129
(0.23)
-0.056
(-0.24)
Growth rate of real GDP (t-4) -0.209
(-0.34)
0.445
(2.33)**
Growth rate of real private
consumption (t)
2.629
(2.11)**
0.945
(1.46)
1.410
(1.85)*
Growth rate of real private
consumption (t-1)
-1.331
(-1.38)
0.013
(0.02)
-0.543
(-1.10)
Growth rate of real private
consumption (t-2)
1.744
(3.23)***
1.552
(3.13)***
1.336
(3.83)***
Growth rate of real private
consumption (t-3)
0.462
(0.67)
-1.397
(-2.45)**
-0.054
(-0.18)
19
Table 1: (Continued)
Note: OLS regressions with robust standard errors; ***,**,* stand for statistically significant at 1%, 5% and 10%.
Growth rate of real private
consumption (t-4)
-0.089
(-0.12)
1.298
(2.26)**
0.273
(0.87)
Time trend -0.0003
(-0.11)
0.004
(2.82)***
0.0003
(0.56)
0.0004
(0.27)
-0.004
(-2.08)**
Constant -0.071
(-0.18)
-0.814
(-3.01)***
-0.067
(-0.58)
-0.189
(-0.66)
0.505
(1.61)
Election 0.006
(0.14)
-0.059
(-2.25)**
- -0.036
(-0.84)
0.008
(0.45)
EAP 0.288
(1.63)
0.959
(0.39)
- -0.611
(-0.30)
6.565
(3.44)***
EAP*time trend - -0.004
(-0.34)
- 0.004
(0.43)
-0.032
(-3.30)***
VAT rate 0.012
(0.32)
- - - 0.095
(2.63)***
EDP - 0.039
(2.17)**
- 0.067
(2.52)**
-
No of Obs. 43 43 43 43 43
F-test (p-value) F( 9, 33) =
4.73 (0.0004)
F( 10, 32)
= 3.51
(0.0033)
F( 6, 36) =
32.75 (0.0000)
F( 10, 32) =
4.42 (0.0006)
F( 10, 32) =
8.10 (0.0000)
R-square 0.4631 0.4366 0.8263 0.3955 0.6053

20
21
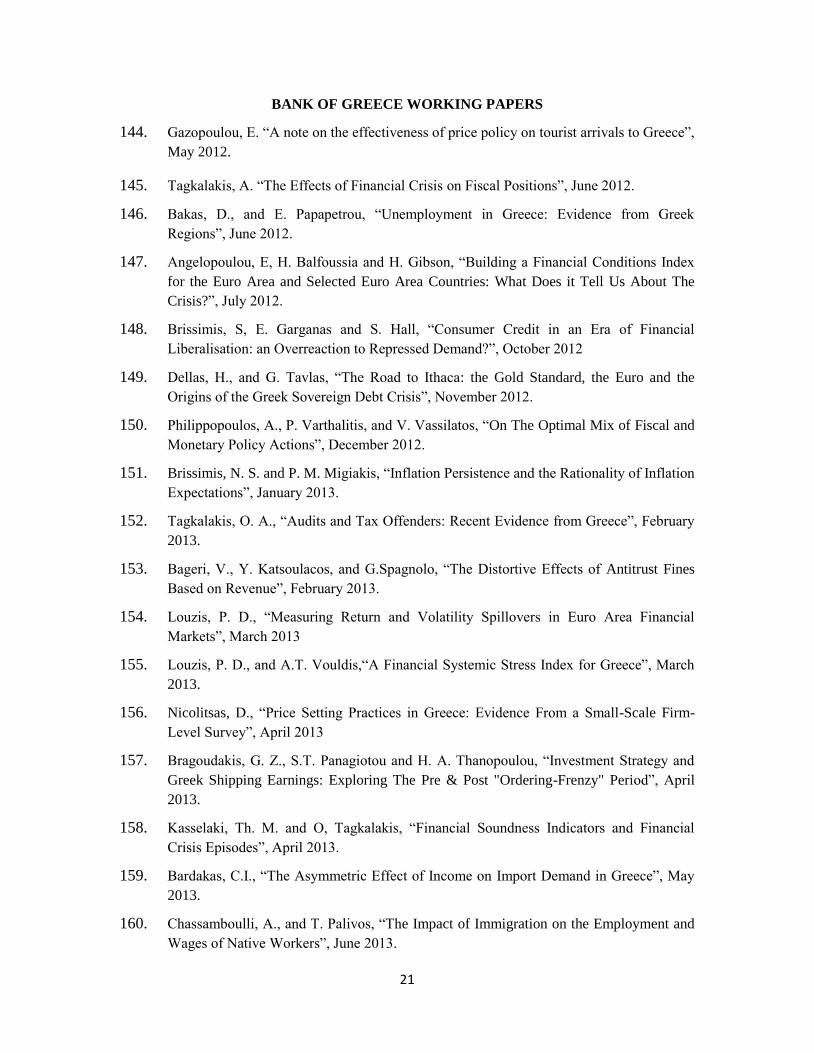
BANK OF GREECE WORKING PAPERS
144. Gazopoulou, E. “A note on the effectiveness of price policy on tourist arrivals to Greece”,
May 2012.
145. Tagkalakis, A. “The Effects of Financial Crisis on Fiscal Positions”, June 2012.
146. Bakas, D., and E. Papapetrou, “Unemployment in Greece: Evidence from Greek
Regions”, June 2012.
147. Angelopoulou, E, H. Balfoussia and H. Gibson, “Building a Financial Conditions Index
for the Euro Area and Selected Euro Area Countries: What Does it Tell Us About The
Crisis?”, July 2012.
148. Brissimis, S, E. Garganas and S. Hall, “Consumer Credit in an Era of Financial
Liberalisation: an Overreaction to Repressed Demand?”, October 2012
149. Dellas, H., and G. Tavlas, “The Road to Ithaca: the Gold Standard, the Euro and the
Origins of the Greek Sovereign Debt Crisis”, November 2012.
150. Philippopoulos, A., P. Varthalitis, and V. Vassilatos, “On The Optimal Mix of Fiscal and
Monetary Policy Actions”, December 2012.
151. Brissimis, N. S. and P. M. Migiakis, “Inflation Persistence and the Rationality of Inflation
Expectations”, January 2013.
152. Tagkalakis, O. A., “Audits and Tax Offenders: Recent Evidence from Greece”, February
2013.
153. Bageri, V., Y. Katsoulacos, and G.Spagnolo, “The Distortive Effects of Antitrust Fines
Based on Revenue”, February 2013.
154. Louzis, P. D., “Measuring Return and Volatility Spillovers in Euro Area Financial
Markets”, March 2013
155. Louzis, P. D., and A.T. Vouldis,“A Financial Systemic Stress Index for Greece”, March
2013.
156. Nicolitsas, D., “Price Setting Practices in Greece: Evidence From a Small-Scale Firm-
Level Survey”, April 2013
157. Bragoudakis, G. Z., S.T. Panagiotou and H. A. Thanopoulou, “Investment Strategy and
Greek Shipping Earnings: Exploring The Pre & Post "Ordering-Frenzy" Period”, April
2013.
158. Kasselaki, Th. M. and O, Tagkalakis, “Financial Soundness Indicators and Financial
Crisis Episodes”, April 2013.
159. Bardakas, C.I., “The Asymmetric Effect of Income on Import Demand in Greece”, May
2013.
160. Chassamboulli, A., and T. Palivos, “The Impact of Immigration on the Employment and
Wages of Native Workers”, June 2013.
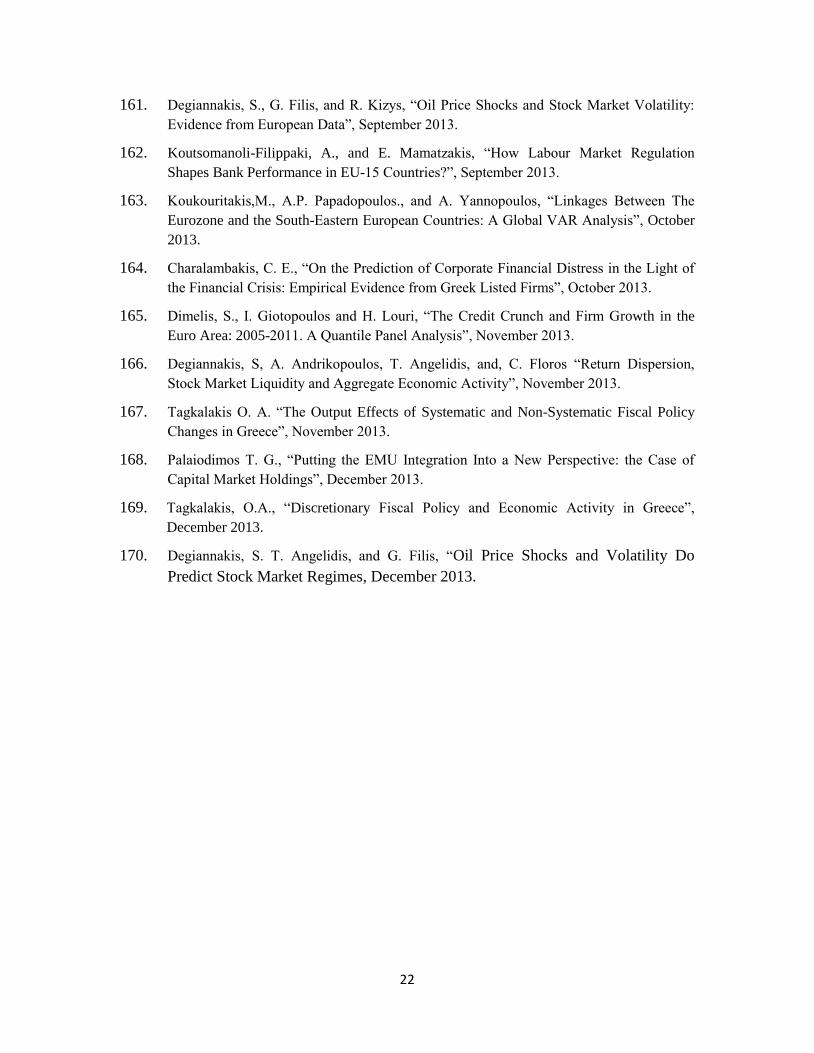
22
161. Degiannakis, S., G. Filis, and R. Kizys, “Oil Price Shocks and Stock Market Volatility:
Evidence from European Data”, September 2013.
162. Koutsomanoli-Filippaki, A., and E. Mamatzakis, “How Labour Market Regulation
Shapes Bank Performance in EU-15 Countries?”, September 2013.
163. Koukouritakis,M., A.P. Papadopoulos., and A. Yannopoulos, “Linkages Between The
Eurozone and the South-Eastern European Countries: A Global VAR Analysis”, October
2013.
164. Charalambakis, C. E., “On the Prediction of Corporate Financial Distress in the Light of
the Financial Crisis: Empirical Evidence from Greek Listed Firms”, October 2013.
165. Dimelis, S., I. Giotopoulos and H. Louri, “The Credit Crunch and Firm Growth in the
Euro Area: 2005-2011. A Quantile Panel Analysis”, November 2013.
166. Degiannakis, S, A. Andrikopoulos, T. Angelidis, and, C. Floros “Return Dispersion,
Stock Market Liquidity and Aggregate Economic Activity”, November 2013.
167. Tagkalakis O. A. “The Output Effects of Systematic and Non-Systematic Fiscal Policy
Changes in Greece”, November 2013.
168. Palaiodimos T. G., “Putting the EMU Integration Into a New Perspective: the Case of
Capital Market Holdings”, December 2013.
169. Tagkalakis, O.A., “Discretionary Fiscal Policy and Economic Activity in Greece”,
December 2013.
170. Degiannakis, S. T. Angelidis, and G. Filis, “Oil Price Shocks and Volatility Do
Predict Stock Market Regimes, December 2013.


![[123doc.vn] chuyen-de-boi-duong-hoc-sinh-gioi-vat-ly-phan-dien](https://static.fdocument.org/doc/165x107/55cb572cbb61eb390d8b45ff/123docvn-chuyen-de-boi-duong-hoc-sinh-gioi-vat-ly-phan-dien.jpg)