Background: a bit about… Important roles in: Glycoprotein biosynthesis, quality control &...
18
-
Upload
frank-rose -
Category
Documents
-
view
217 -
download
1
Transcript of Background: a bit about… Important roles in: Glycoprotein biosynthesis, quality control &...
Background: a bit about…Background: a bit about…
Important roles in:
•Glycoprotein biosynthesis, quality control & catabolism
•Multiple forms of α-mannosidases in mammalian cells, differing in specificity, function and cellular location
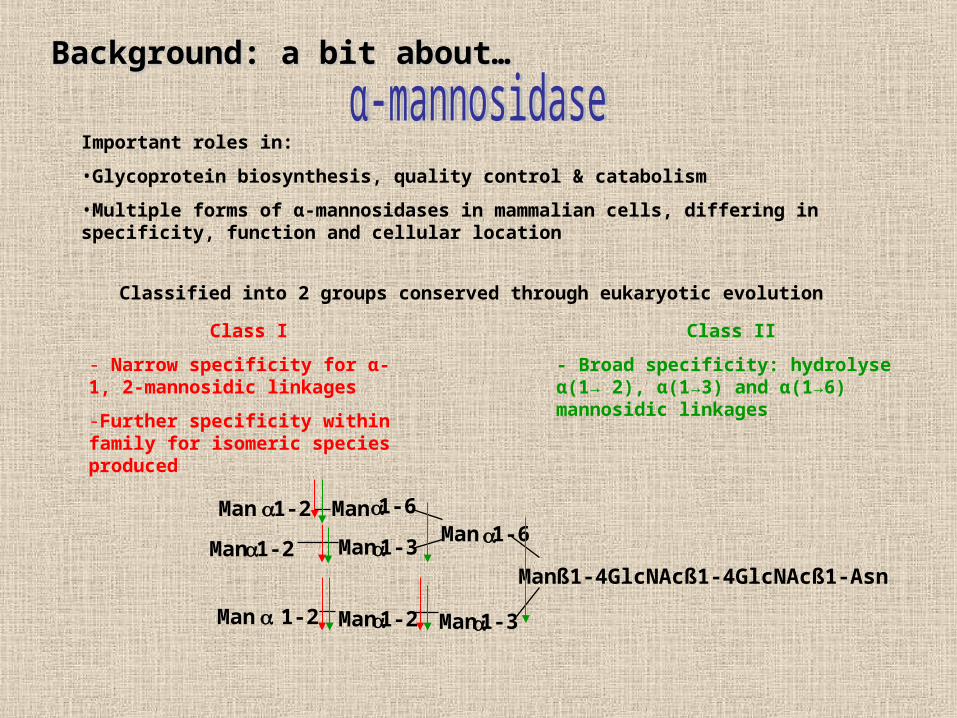
Classified into 2 groups conserved through eukaryotic evolution
Class I
- Narrow specificity for α-1, 2-mannosidic linkages
-Further specificity within family for isomeric species produced
Class II
- Broad specificity: hydrolyse α(1→ 2), α(1→3) and α(1→6) mannosidic linkages
Manß1-4GlcNAcß1-4GlcNAcß1-Asn
Man 1-6
Man1-3
Man1-6
Man1-3
Man1-2
Man1-2
Man1-2Man 1-2
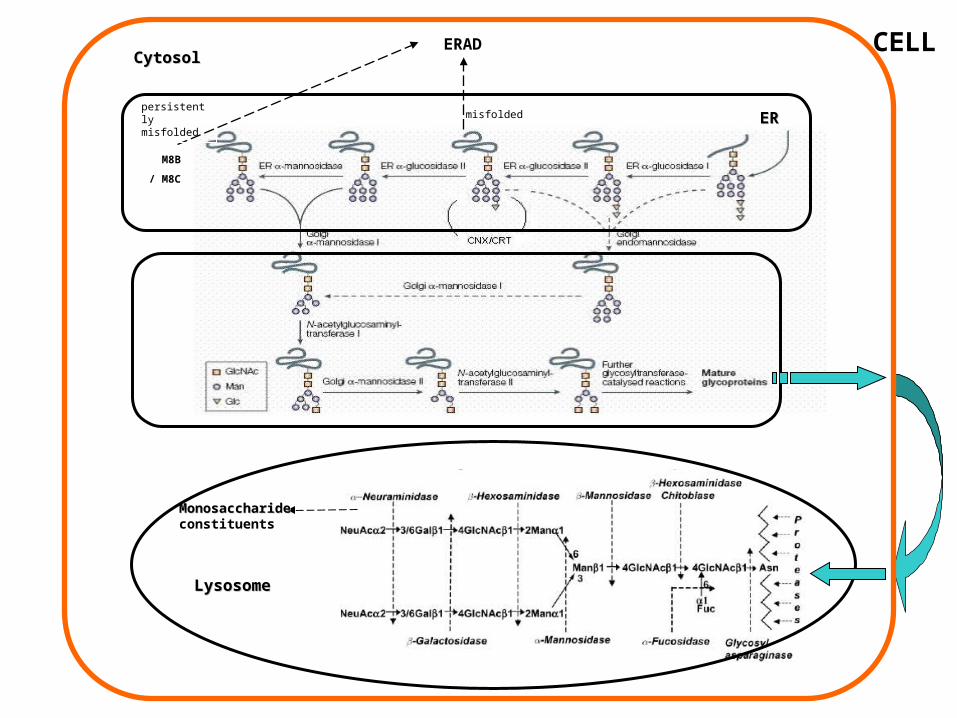
ERAD
misfolded
M8B
/ M8C
persistently misfolded
Monosaccharide Monosaccharide constituents
ERER
LysosomeLysosome
CytosolCytosolCELL
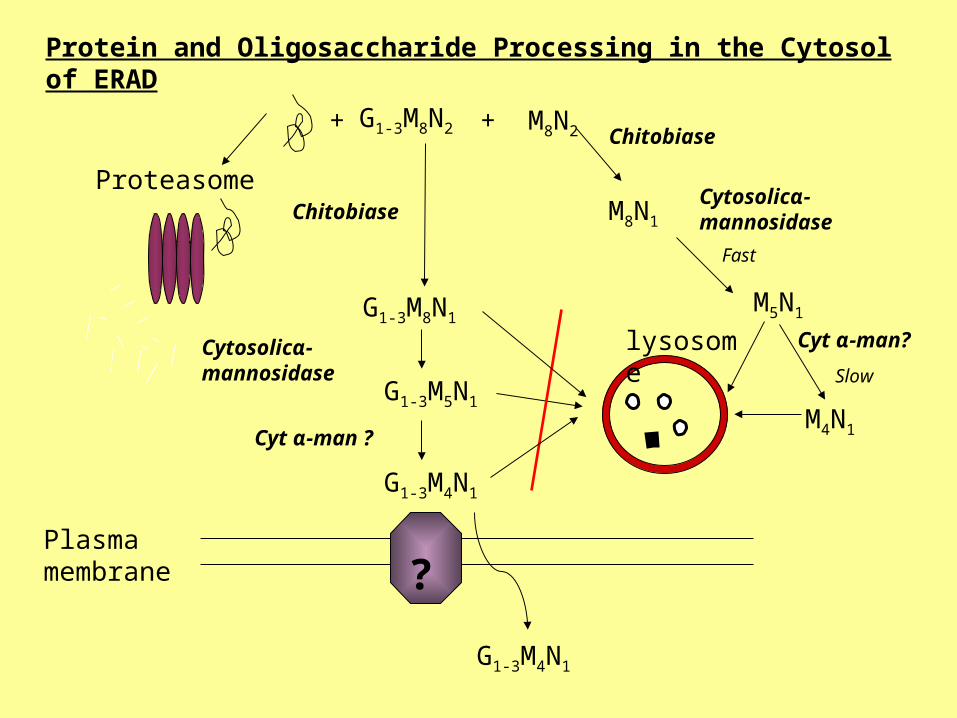
G1-3M8N1
G1-3M5N1
G1-3M4N1
?
G1-3M4N1
lysosome
Plasma membrane
Chitobiase
ProteasomeM8N1
M5N1
Chitobiase
Cytosolicα-mannosidase
Cytosolicα- mannosidase
Cyt α-man ?
Fast
Slow
Protein and Oligosaccharide Processing in the Cytosol of ERAD
G1-3M8N2 + M8N2+
M4N1
Cyt α-man?
HN
OHHOOH
HON OH
OHHHO
N
NH
HHO
HO
OH
HO
O
O HN
OHHO
H
HO
HO
148 266149 265
N
OHHO
OHHO
N
OHHO
OHHON
OHHO
OH
N
OHHO
OH
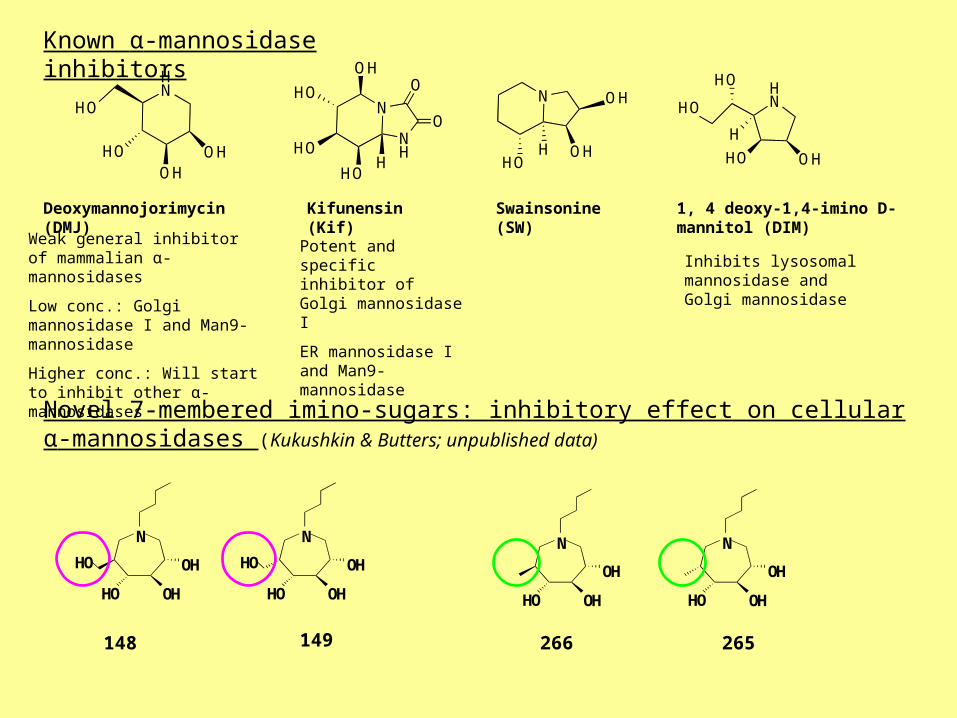
Deoxymannojorimycin (DMJ) Kifunensin (Kif) Swainsonine (SW)
1, 4 deoxy-1,4-imino D-mannitol (DIM)
Known α-mannosidase inhibitors
Novel 7-membered imino-sugars: inhibitory effect on cellular α-mannosidases (Kukushkin & Butters; unpublished data)
Weak general inhibitor of mammalian α-mannosidases
Low conc.: Golgi mannosidase I and Man9-mannosidase
Higher conc.: Will start to inhibit other α-mannosidases
Potent and specific inhibitor of Golgi mannosidase I
ER mannosidase I and Man9-mannosidase
Inhibits lysosomal mannosidase and Golgi mannosidase
Project Aims
The aims of my project were:
To define α-mannosidase targets of novel inhibitors in cells and compare these to known α-mannosidase inhibitors
This will be accomplished by:
1.Evaluation of cytosolic and lysosomal α-mannosidase inhibition by measuring free oligosaccharides (FOS) in HL60 and MDBK cell lines.
2.Increasing our knowledge of mannosidases within their cellular pathways in cell lines above.
3.Using glycoprotein precipitation, isolation and PNGase glycan release methods to observe effects of inhibitors on glycan species of total cellular glycoprotein.
4.Identification of lysosomal FOS species following cellular fractionation. Two cell lines will be used that have differing biosynthetic and catabolic pathways: HL60, a human promyelocytic leukaemia cell line and MDBK, a bovine kidney cell line.
5.Estimation of ER and Golgi α-mannosidase inhibition by using Fluorescence-activated cell sorting (FACS) to analysing glycoprotein derived oligosaccharides on the cell surfacee following treatment with α-mannosidase inhibitors.

Flu
ore
scen
ce
(arb
itra
ry u
nit
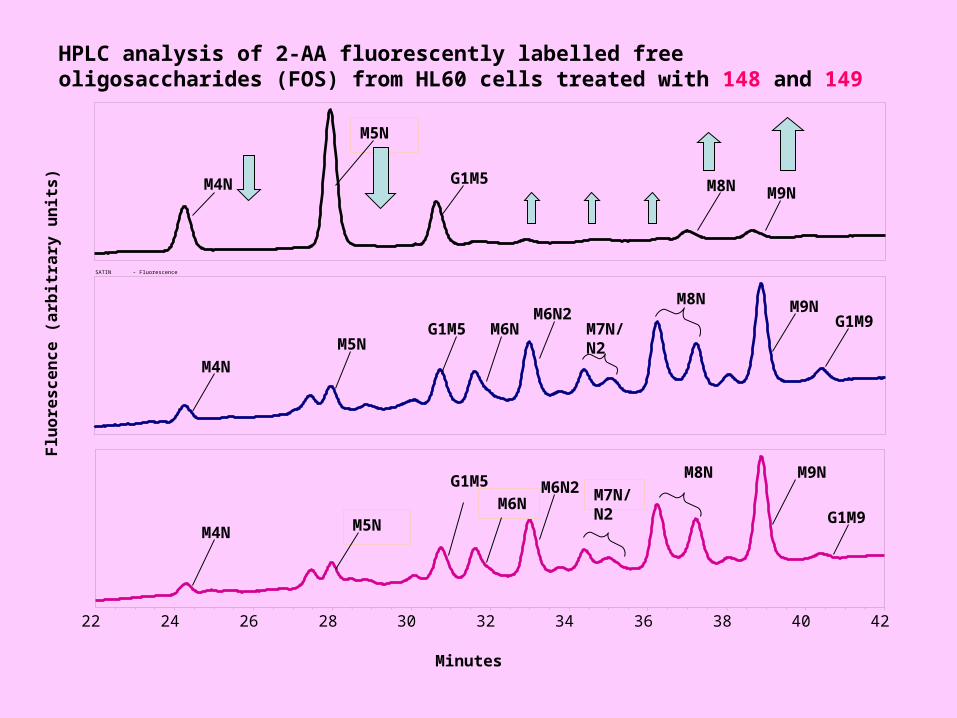
s) M4N
M5NG1M5 M9N
M7N
M4N
M5N
G1M5 M7N/N2 M8N/N2
M9N/N2
M7N/N2 M8N G1M9N?
M8N/N2M9N/N2
M7N/N2
Untreated HL60
DMJ treated(1mM)
DIM treated (100μM)
HPLC analysis of 2-AA fluorescently labelled free oligosaccharides (FOS) from HL60 cells treated with known α-mannosidase inhibitors
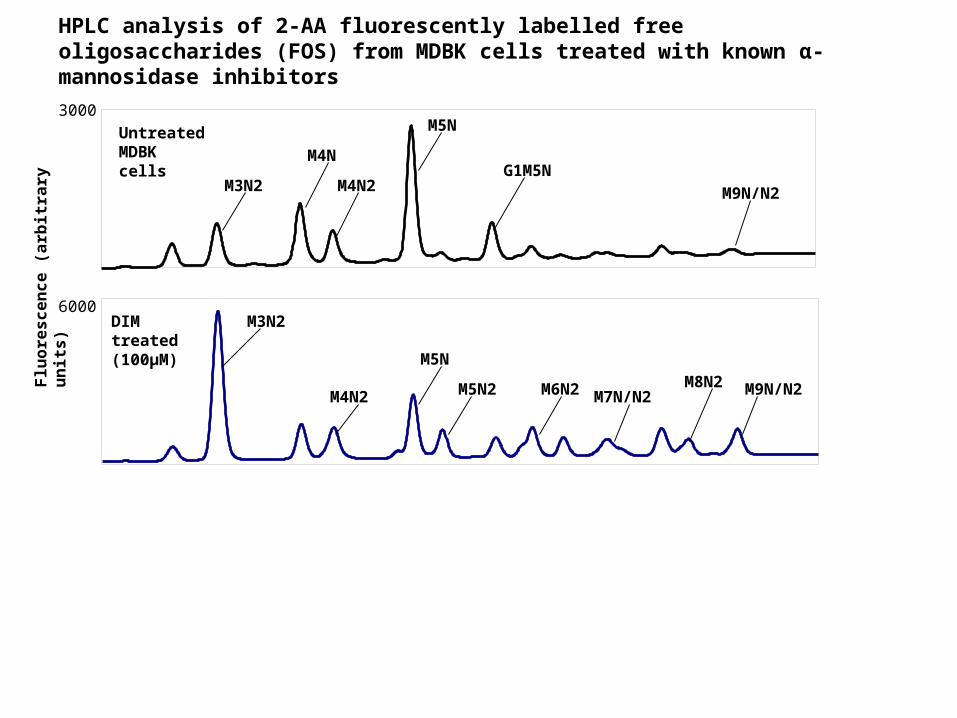
M5N
M3N2
M4N2M8N2
M5N
M3N2
M5N2 M9N/N2M6N2 M7N/N2
G1M5NM4N2
M4N
M9N/N2
Untreated MDBK cells
DIM treated (100μM)
HPLC analysis of 2-AA fluorescently labelled free oligosaccharides (FOS) from MDBK cells treated with known α-mannosidase inhibitors
3000
6000
Flu
ore
sc
en
ce
(a
rbit
rary
un
its
)
Minutes
-
-
22 23 24 25 26 27 28 29 30 31 32 33 34 35 36 37 38 39 40 41
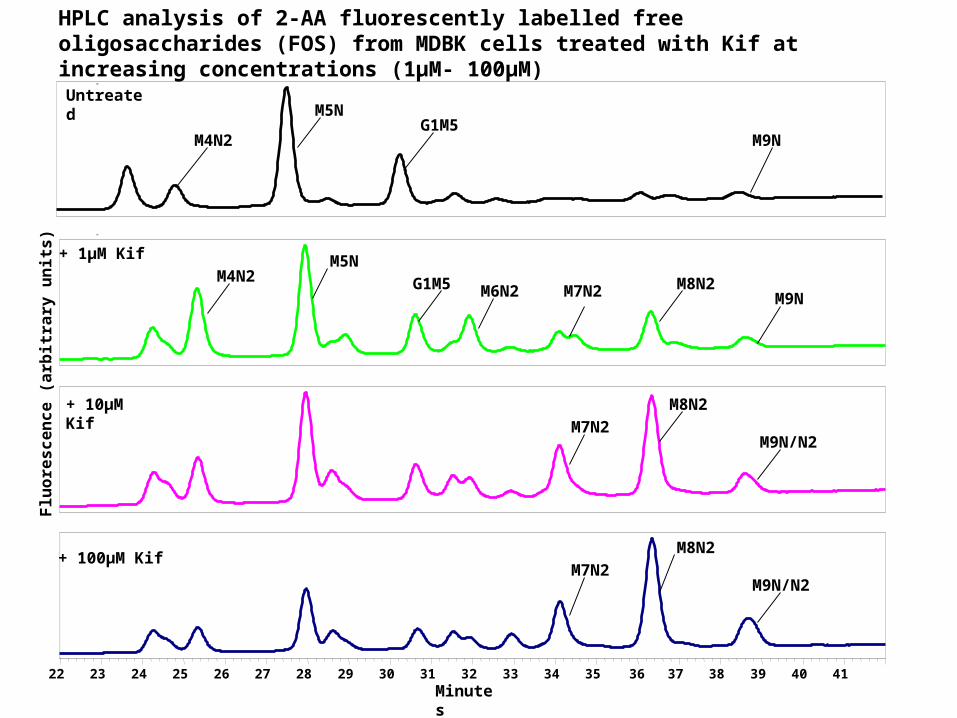
M8N2
M7N2
M4N2G1M5
M5N
M4N2M5N
G1M5
M8N2
M8N2
M7N2
M9N
M9N
M9N/N2
M9N/N2
M7N2M6N2
HPLC analysis of 2-AA fluorescently labelled free oligosaccharides (FOS) from MDBK cells treated with Kif at increasing concentrations (1μM- 100μM)
Untreated
+ 1μM Kif
+ 10μM Kif
+ 100μM Kif
Flu
ore
sc
en
ce
(a
rbit
rary
un
its
)
SATIN - Fluorescence
M9N
M5N
M4N
M6N M7N/N2
G1M5
22 24 26 28 30 32 34 36 38 40 42
Minutes
M5N
M5N
M9N
M7N/N2
G1M9
G1M9
G1M5
M6N
G1M5
M8N
M8N
M8N M9N
M4N
M4N
M6N2
M6N2
HPLC analysis of 2-AA fluorescently labelled free oligosaccharides (FOS) from HL60 cells treated with 148 and 149
Flu
ore
sc
en
ce
(a
rbit
rary
un
its
)
-
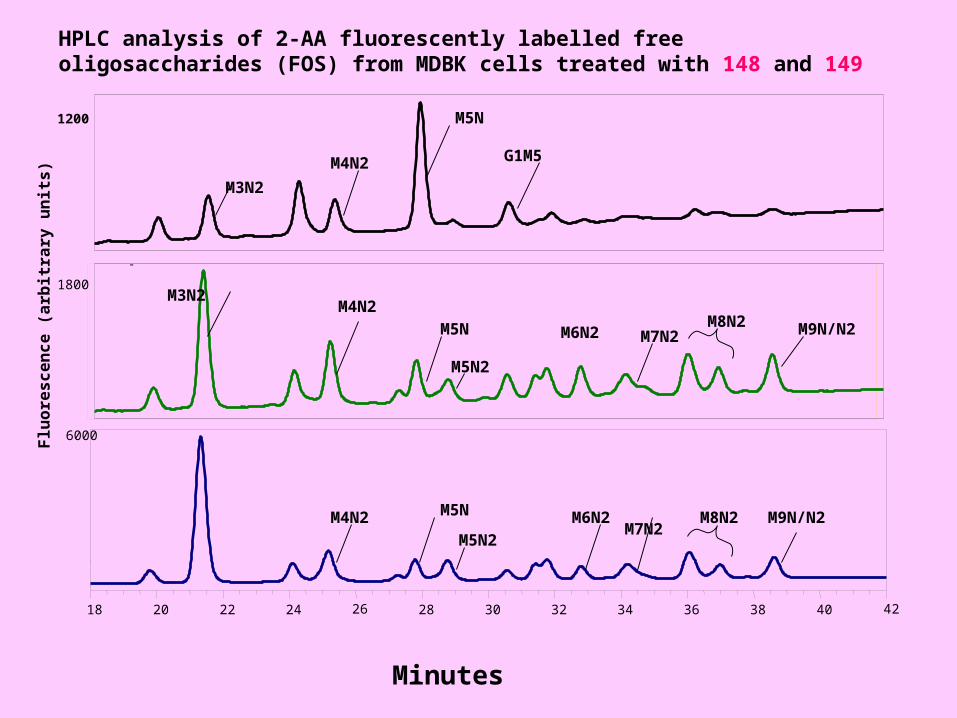
M3N2
M4N2
M5N
M7N2
18 20 22 24 26 28 30 32 34 36 38 40 42
M3N2 M4N2
M4N2
M5N
M5N
M6N2
M6N2 M7N2 M8N2
M8N2
6000
1800
1200
M9N/N2
G1M5
M9N/N2
M5N2
M5N2
HPLC analysis of 2-AA fluorescently labelled free oligosaccharides (FOS) from MDBK cells treated with 148 and 149
Flu
ore
sc
en
ce
(a
rbit
rary
un
its
)
Minutes
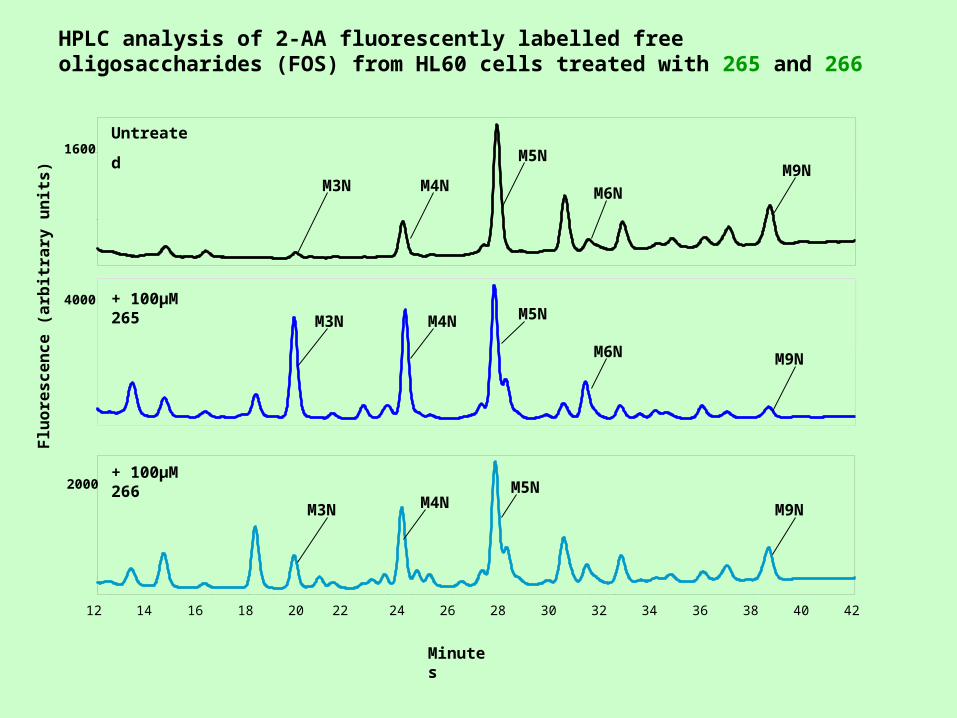
HPLC analysis of 2-AA fluorescently labelled free oligosaccharides (FOS) from HL60 cells treated with 265 and 266
2000
12 14 16 18 20 22 24 26 28 30 32 34 36 38 40 42
1600
4000
Minutes
M5N
M5N
M5N
M4N
M4N
M4N
M3N
M3N
M3NM9N
M9N
M9N
M6N
M6N
Untreated
+ 100μM 265
+ 100μM 266
Flu
ore
sc
en
ce
(a
rbit
rary
un
its
)
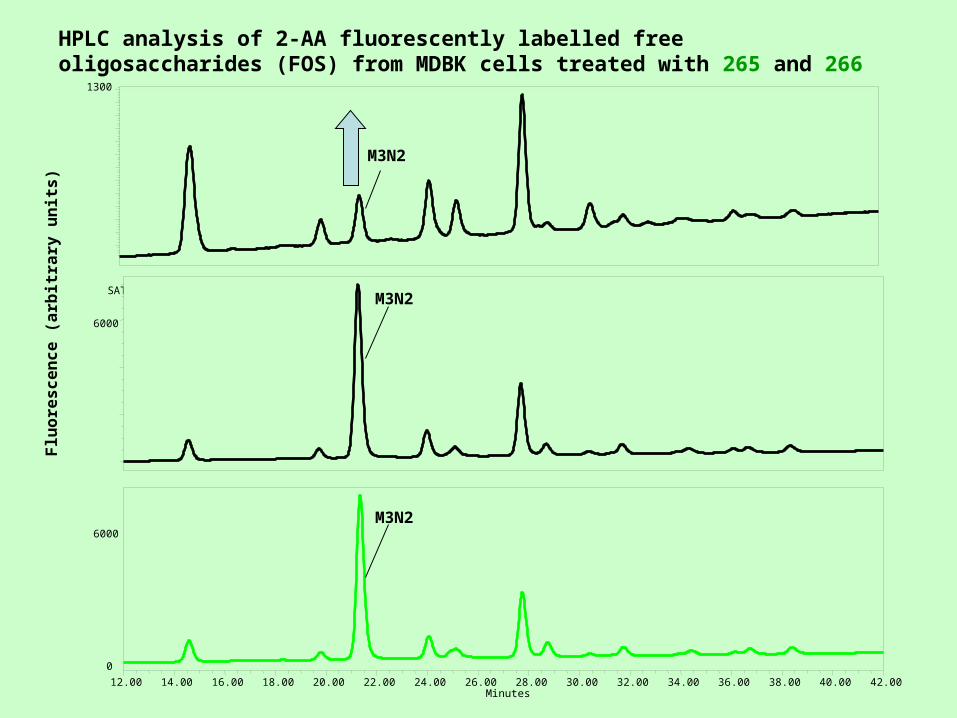
HPLC analysis of 2-AA fluorescently labelled free oligosaccharides (FOS) from MDBK cells treated with 265 and 266
SATIN - Fluorescence
6000
0
6000
Minutes12.00 14.00 16.00 18.00 20.00 22.00 24.00 26.00 28.00 30.00 32.00 34.00 36.00 38.00 40.00 42.00
1300
M3N2
M3N2
M3N2
Flu
ore
sc
en
ce
(a
rbit
rary
un
its
)
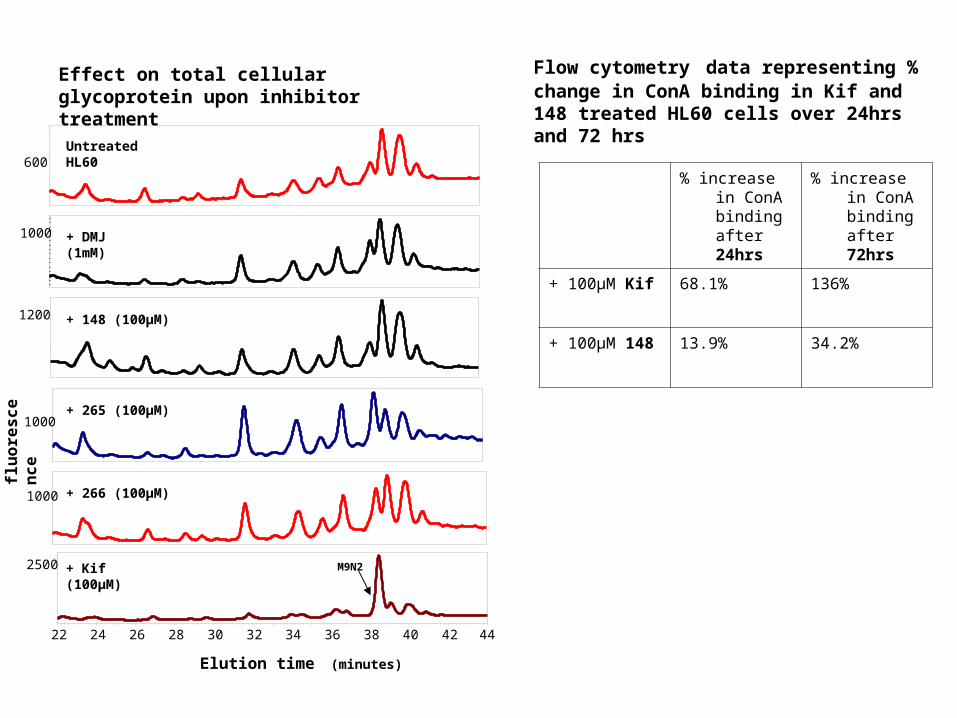
Effect on total cellular glycoprotein upon inhibitor treatment
Elution time (minutes)
600
1000
SATIN - Fluorescence
1200
1000
1000
SATIN - Fluorescence
2500
22 24 26 28 30 32 34 36 38 40 42 44
M9N2
flu
ore
sc
en
ce
% increase in ConA binding after 24hrs
% increase in ConA binding after 72hrs
+ 100μM Kif 68.1% 136%
+ 100μM 148 13.9% 34.2%
Flow cytometry data representing % change in ConA binding in Kif and 148 treated HL60 cells over 24hrs and 72 hrs
Untreated HL60
+ DMJ (1mM)
+ 148 (100μM)
+ 265 (100μM)
+ 266 (100μM)
+ Kif (100μM)
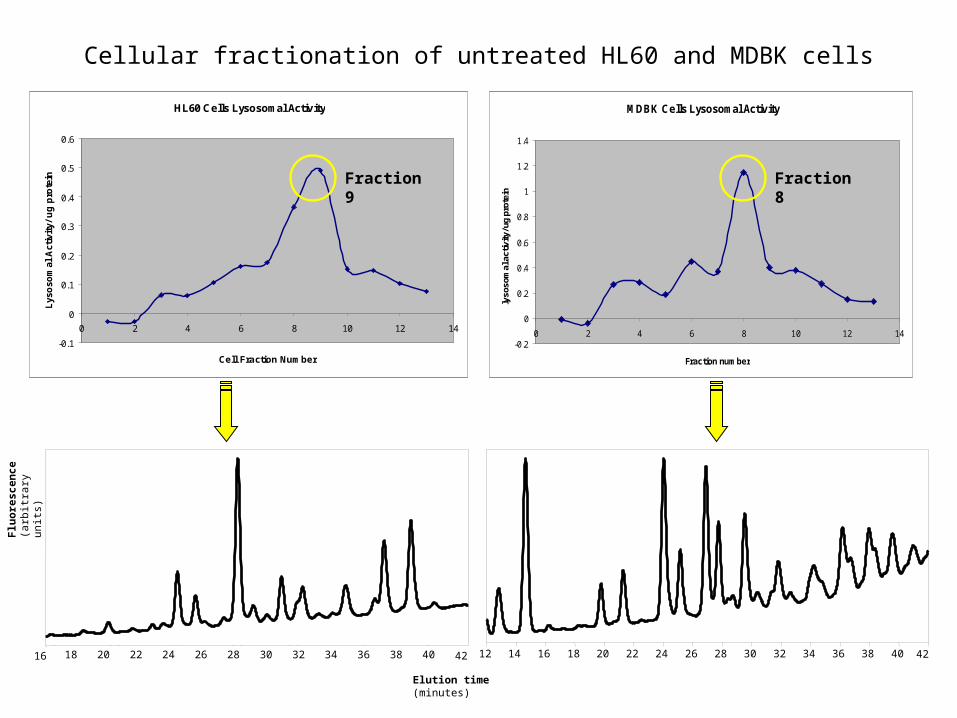
Cellular fractionation of untreated HL60 and MDBK cells
HL60 Cells Lysosomal Activity
-0.1
0
0.1
0.2
0.3
0.4
0.5
0.6
0 2 4 6 8 10 12 14
Cell Fraction Number
Lys
oso
mal
Act
ivit
y/ u
g p
rote
in Fraction 9
42
Flu
ore
scen
ce
(arb
itrar
y un
its)
16 18 20 22 24 26 28 30 32 34 36 38 40
Elution time (minutes)
MDBK Cells Lysosomal Activity
-0.2
0
0.2
0.4
0.6
0.8
1
1.2
1.4
0 2 4 6 8 10 12 14
Fraction number
lyso
som
al a
ctiv
ity/ u
g pr
otei
n
Fraction 8
12 14 16 18 20 22 24 26 28 30 32 34 36 38 40 42
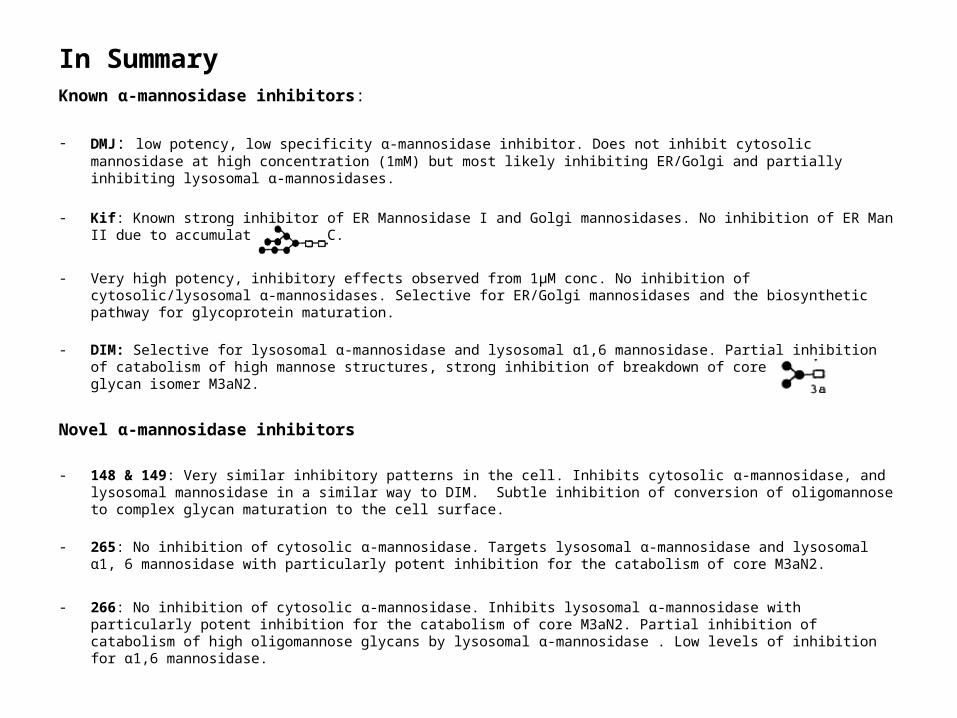
In SummaryKnown α-mannosidase inhibitors:
- DMJ: low potency, low specificity α-mannosidase inhibitor. Does not inhibit cytosolic mannosidase at high concentration (1mM) but most likely inhibiting ER/Golgi and partially inhibiting lysosomal α-mannosidases.
- Kif: Known strong inhibitor of ER Mannosidase I and Golgi mannosidases. No inhibition of ER Man II due to accumulation of M8C.
- Very high potency, inhibitory effects observed from 1μM conc. No inhibition of cytosolic/lysosomal α-mannosidases. Selective for ER/Golgi mannosidases and the biosynthetic pathway for glycoprotein maturation.
- DIM: Selective for lysosomal α-mannosidase and lysosomal α1,6 mannosidase. Partial inhibition of catabolism of high mannose structures, strong inhibition of breakdown of core N-linked glycan isomer M3aN2.
Novel α-mannosidase inhibitors
- 148 & 149: Very similar inhibitory patterns in the cell. Inhibits cytosolic α-mannosidase, and lysosomal mannosidase in a similar way to DIM. Subtle inhibition of conversion of oligomannose to complex glycan maturation to the cell surface.
- 265: No inhibition of cytosolic α-mannosidase. Targets lysosomal α-mannosidase and lysosomal α1, 6 mannosidase with particularly potent inhibition for the catabolism of core M3aN2.
- 266: No inhibition of cytosolic α-mannosidase. Inhibits lysosomal α-mannosidase with particularly potent inhibition for the catabolism of core M3aN2. Partial inhibition of catabolism of high oligomannose glycans by lysosomal α-mannosidase . Low levels of inhibition for α1,6 mannosidase.
Future work• Cellular fractionation with added inhibitor followed by FOS isolation and characterisation to
confirm and clarify target compartments of novel inhibitors within the cell and to specify enzymes inhibited.
• Carry out Flow Cytometry experiment with 266 and 265 to analyse effect on glycoprotein maturation at the cell surface
• To confirm the cytosolic inhibition of 148 and 149. Proposed experiment: Addition of 148/149 following treatment of cells with glucosidase inhibitor such as NB-DMJ to create more tri-glucosylated species. If 148/149 inhibit in the cytosol, will generate more glucosylated high-mannose structures from FOS analysis.
• May want to develop a more selective or & more potent inhibitor of the cytosolic α-mannosidase: drug screening with a range of 148,149-like structures.

Acknowledgements
Dr Terry Butters
Dr David Neville
Dr Dominic Alonzi
Stephanie Boomkamp
Professor Raymond Dwek


![Soluble αKlotho downregulates Orai1-mediated store ......Klotho is an aging-suppressor gene that encodes type 1 transmembrane glycoprotein called αKlotho [22, 23]. Klotho-deficient](https://static.fdocument.org/doc/165x107/613b4592f8f21c0c8268e811/soluble-klotho-downregulates-orai1-mediated-store-klotho-is-an-aging-suppressor.jpg)