κκκκB Protein within the NF-κκκB Signaling Module Fourth IκκκκB Protein within the...
16
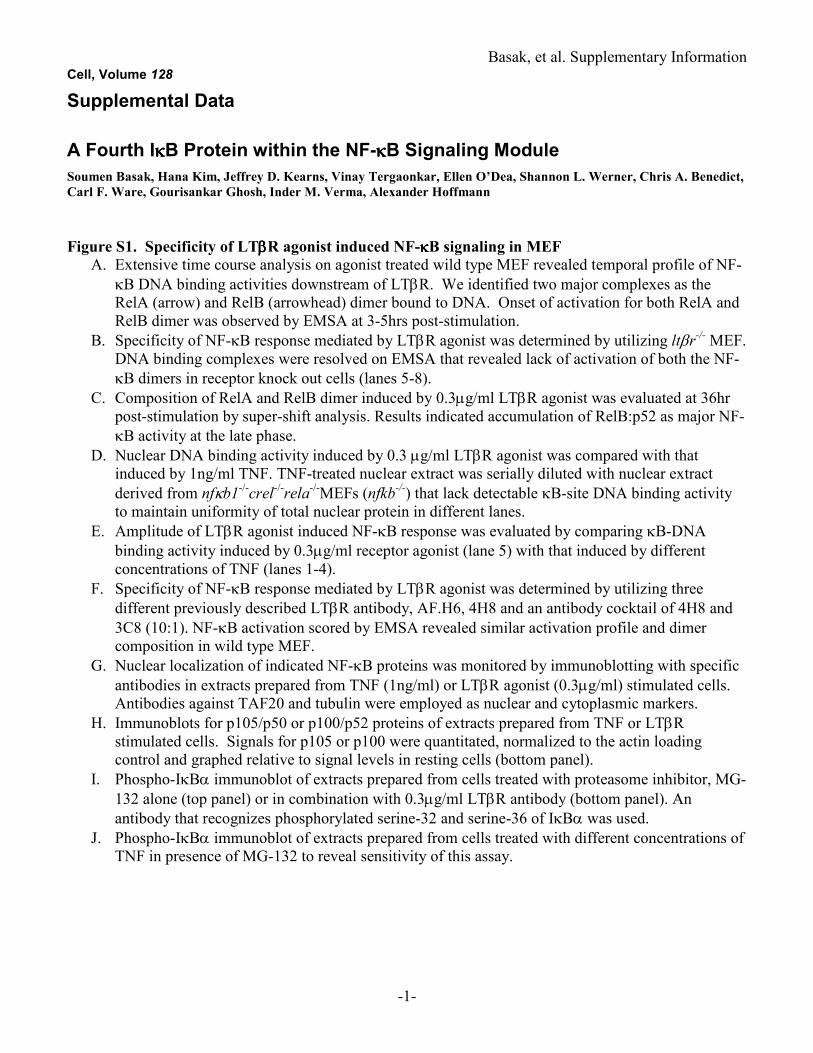
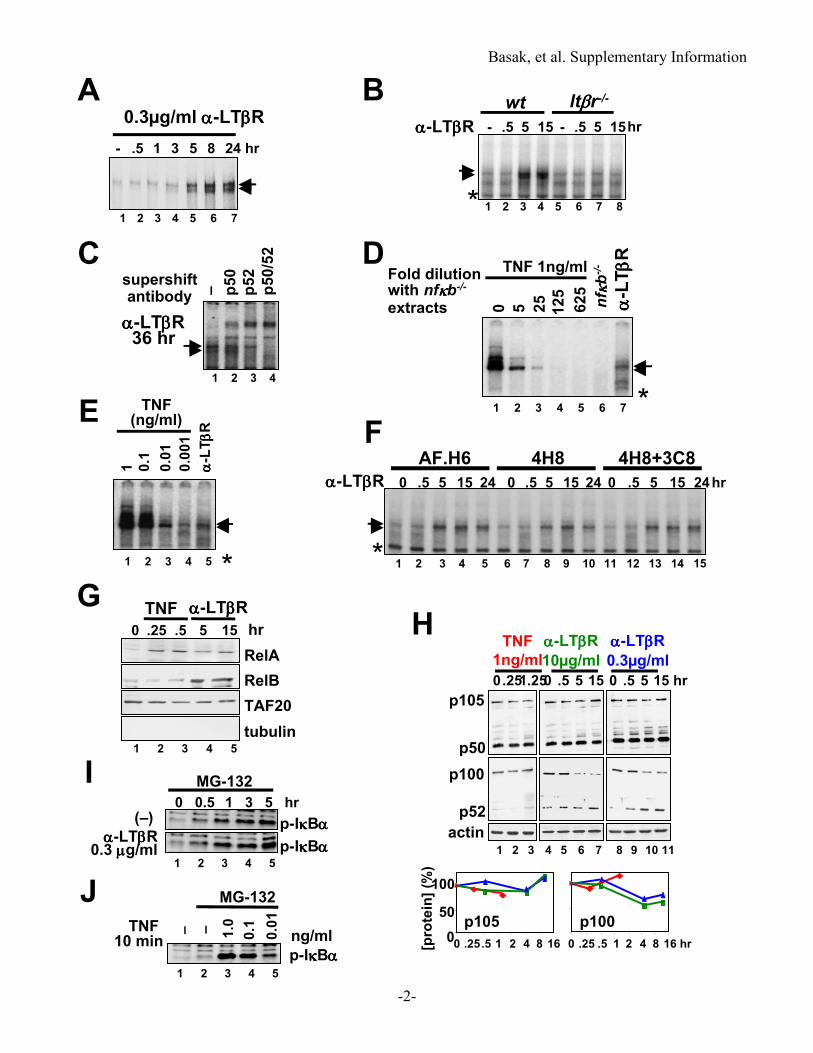
Basak, et al. Supplementary Information -1- Cell, Volume 128 Supplemental Data A Fourth IκB Protein within the NF-κB Signaling Module Soumen Basak, Hana Kim, Jeffrey D. Kearns, Vinay Tergaonkar, Ellen O’Dea, Shannon L. Werner, Chris A. Benedict, Carl F. Ware, Gourisankar Ghosh, Inder M. Verma, Alexander Hoffmann Figure S1. Specificity of LTβR agonist induced NF-κB signaling in MEF A. Extensive time course analysis on agonist treated wild type MEF revealed temporal profile of NF- κB DNA binding activities downstream of LTβR. We identified two major complexes as the RelA (arrow) and RelB (arrowhead) dimer bound to DNA. Onset of activation for both RelA and RelB dimer was observed by EMSA at 3-5hrs post-stimulation. B. Specificity of NF-κB response mediated by LTβR agonist was determined by utilizing ltβr -/- MEF. DNA binding complexes were resolved on EMSA that revealed lack of activation of both the NF- κB dimers in receptor knock out cells (lanes 5-8). C. Composition of RelA and RelB dimer induced by 0.3μg/ml LTβR agonist was evaluated at 36hr post-stimulation by super-shift analysis. Results indicated accumulation of RelB:p52 as major NF- κB activity at the late phase. D. Nuclear DNA binding activity induced by 0.3 μg/ml LTβR agonist was compared with that induced by 1ng/ml TNF. TNF-treated nuclear extract was serially diluted with nuclear extract derived from nfκb1 -/- crel -/- rela -/- MEFs (nfkb -/- ) that lack detectable κB-site DNA binding activity to maintain uniformity of total nuclear protein in different lanes. E. Amplitude of LTβR agonist induced NF-κB response was evaluated by comparing κB-DNA binding activity induced by 0.3μg/ml receptor agonist (lane 5) with that induced by different concentrations of TNF (lanes 1-4). F. Specificity of NF-κB response mediated by LTβR agonist was determined by utilizing three different previously described LTβR antibody, AF.H6, 4H8 and an antibody cocktail of 4H8 and 3C8 (10:1). NF-κB activation scored by EMSA revealed similar activation profile and dimer composition in wild type MEF. G. Nuclear localization of indicated NF-κB proteins was monitored by immunoblotting with specific antibodies in extracts prepared from TNF (1ng/ml) or LTβR agonist (0.3μg/ml) stimulated cells. Antibodies against TAF20 and tubulin were employed as nuclear and cytoplasmic markers. H. Immunoblots for p105/p50 or p100/p52 proteins of extracts prepared from TNF or LTβR stimulated cells. Signals for p105 or p100 were quantitated, normalized to the actin loading control and graphed relative to signal levels in resting cells (bottom panel). I. Phospho-IκBα immunoblot of extracts prepared from cells treated with proteasome inhibitor, MG- 132 alone (top panel) or in combination with 0.3μg/ml LTβR antibody (bottom panel). An antibody that recognizes phosphorylated serine-32 and serine-36 of IκBα was used. J. Phospho-IκBα immunoblot of extracts prepared from cells treated with different concentrations of TNF in presence of MG-132 to reveal sensitivity of this assay.
Transcript of κκκκB Protein within the NF-κκκB Signaling Module Fourth IκκκκB Protein within the...
Basak, et al. Supplementary Information
-1-
Cell, Volume 128
Supplemental Data
A Fourth IκκκκB Protein within the NF-κκκκB Signaling Module
Soumen Basak, Hana Kim, Jeffrey D. Kearns, Vinay Tergaonkar, Ellen O’Dea, Shannon L. Werner, Chris A. Benedict,
Carl F. Ware, Gourisankar Ghosh, Inder M. Verma, Alexander Hoffmann
Figure S1. Specificity of LTββββR agonist induced NF-κκκκB signaling in MEF A. Extensive time course analysis on agonist treated wild type MEF revealed temporal profile of NF-
κB DNA binding activities downstream of LTβR. We identified two major complexes as the
RelA (arrow) and RelB (arrowhead) dimer bound to DNA. Onset of activation for both RelA and
RelB dimer was observed by EMSA at 3-5hrs post-stimulation.
B. Specificity of NF-κB response mediated by LTβR agonist was determined by utilizing ltβr-/- MEF. DNA binding complexes were resolved on EMSA that revealed lack of activation of both the NF-
κB dimers in receptor knock out cells (lanes 5-8).
C. Composition of RelA and RelB dimer induced by 0.3µg/ml LTβR agonist was evaluated at 36hr
post-stimulation by super-shift analysis. Results indicated accumulation of RelB:p52 as major NF-
κB activity at the late phase.
D. Nuclear DNA binding activity induced by 0.3 µg/ml LTβR agonist was compared with that
induced by 1ng/ml TNF. TNF-treated nuclear extract was serially diluted with nuclear extract
derived from nfκb1-/-crel-/-rela-/-MEFs (nfkb-/-) that lack detectable κB-site DNA binding activity to maintain uniformity of total nuclear protein in different lanes.
E. Amplitude of LTβR agonist induced NF-κB response was evaluated by comparing κB-DNA
binding activity induced by 0.3µg/ml receptor agonist (lane 5) with that induced by different
concentrations of TNF (lanes 1-4).
F. Specificity of NF-κB response mediated by LTβR agonist was determined by utilizing three
different previously described LTβR antibody, AF.H6, 4H8 and an antibody cocktail of 4H8 and
3C8 (10:1). NF-κB activation scored by EMSA revealed similar activation profile and dimer
composition in wild type MEF.
G. Nuclear localization of indicated NF-κB proteins was monitored by immunoblotting with specific
antibodies in extracts prepared from TNF (1ng/ml) or LTβR agonist (0.3µg/ml) stimulated cells.
Antibodies against TAF20 and tubulin were employed as nuclear and cytoplasmic markers.
H. Immunoblots for p105/p50 or p100/p52 proteins of extracts prepared from TNF or LTβR
stimulated cells. Signals for p105 or p100 were quantitated, normalized to the actin loading
control and graphed relative to signal levels in resting cells (bottom panel).
I. Phospho-IκBα immunoblot of extracts prepared from cells treated with proteasome inhibitor, MG-
132 alone (top panel) or in combination with 0.3µg/ml LTβR antibody (bottom panel). An
antibody that recognizes phosphorylated serine-32 and serine-36 of IκBα was used.
J. Phospho-IκBα immunoblot of extracts prepared from cells treated with different concentrations of
TNF in presence of MG-132 to reveal sensitivity of this assay.
Basak, et al. Supplementary Information
-2-
A B
D
5 25
125
625
0
Fold dilutionwith nfκκκκb-/-
extracts
TNF 1ng/ml
nf κκ κκb-/-
αα αα-LTββ ββR
1 2 3 4 5 6 7 *
C
wt ltββββr-/-
15- .5 5αααα-LTββββR 15- .5 5 hr
* 1 2 3 4 5 6 7 8
0.3µg/ml αααα-LTββββR
3- .5 1 5 8 24 hr
1 2 3 4 5 6 7
αααα-LTββββR36 hr
1 2 3 4
supershiftantibody p
50
p52
p50/52
–
E
1 0.1
0.01
0.001
TNF (ng/ml)
αα αα-LTββ ββR
1 2 3 4 5 *
FAF.H6 4H8 4H8+3C8
αααα-LTββββR 0 .5 5 15 hr24 0 .5 5 15 24 0 .5 5 15 24
* 1 2 3 4 5 6 7 8 9 10 11 12 13 14 15
G
RelA
RelB
TAF20
.25 .5 5 150
TNF αααα-LTββββR
hr
tubulin1 2 3 4 5
H
p105 p100
0 1 16842.5.25 0 1 16 hr842.5.25[protein] (%
)
0
50
100
p105
p50
p100
p52
actin
TNF
1ng/ml
αααα-LTββββR
10µg/ml
αααα-LTββββR
0.3µg/ml
0 .5 5 15 0 .5 5 15 hr0.251.25
1 2 3 4 5 6 7 8 9 10 11
I
J
0.11.0
0.01
––
MG-132
TNF 10 min ng/ml
p-IκκκκBαααα1 2 3 4 5
(–)
αααα-LTββββR0.3 µµµµg/ml
0 0.5 1 3 5 hr
MG-132
p-IκκκκBαααα
1 2 3 4 5
p-IκκκκBαααα
Basak, et al. Supplementary Information
-3-
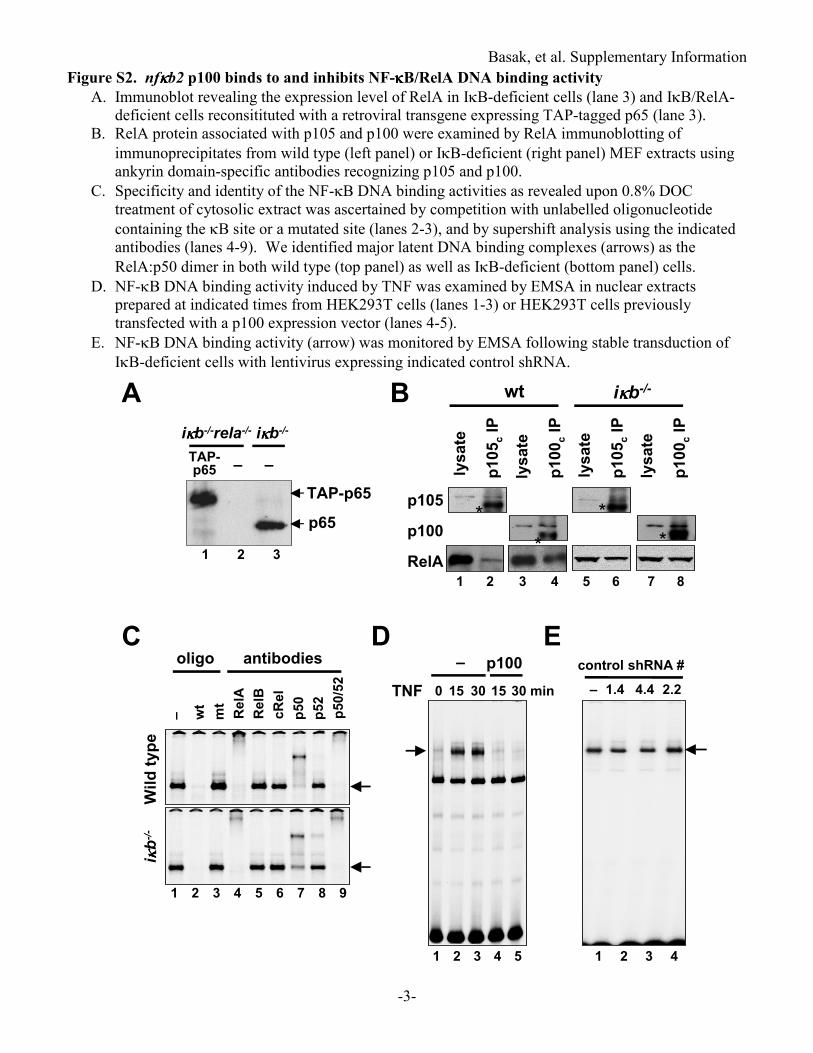
Figure S2. nfκκκκb2 p100 binds to and inhibits NF-κκκκB/RelA DNA binding activity
A. Immunoblot revealing the expression level of RelA in IκB-deficient cells (lane 3) and IκB/RelA-
deficient cells reconsitituted with a retroviral transgene expressing TAP-tagged p65 (lane 3).
B. RelA protein associated with p105 and p100 were examined by RelA immunoblotting of
immunoprecipitates from wild type (left panel) or IκB-deficient (right panel) MEF extracts using
ankyrin domain-specific antibodies recognizing p105 and p100.
C. Specificity and identity of the NF-κB DNA binding activities as revealed upon 0.8% DOC
treatment of cytosolic extract was ascertained by competition with unlabelled oligonucleotide
containing the κB site or a mutated site (lanes 2-3), and by supershift analysis using the indicated
antibodies (lanes 4-9). We identified major latent DNA binding complexes (arrows) as the
RelA:p50 dimer in both wild type (top panel) as well as IκB-deficient (bottom panel) cells.
D. NF-κB DNA binding activity induced by TNF was examined by EMSA in nuclear extracts
prepared at indicated times from HEK293T cells (lanes 1-3) or HEK293T cells previously
transfected with a p100 expression vector (lanes 4-5).
E. NF-κB DNA binding activity (arrow) was monitored by EMSA following stable transduction of
IκB-deficient cells with lentivirus expressing indicated control shRNA.
TAP-p65
p65
A
TAP-p65
iκκκκb-/-rela-/-
– –
iκκκκb-/-
1 2 3
B
p105c IP
p100c IP
p105
p100
RelA* *
lysate
lysate**
p105c IP
p100c IP
lysate
lysate
iκκκκb-/-wt
1 2 3 4 5 6 7 8
RelA
RelB
cRel
p50
p52
wt
mt
p50/52
–
Wild type
i κκ κκb-/-
antibodiesoligoC
1 2 3 4 5 6 7 8 9
D
0TNF 15 30 15 30 min
p100 –
1 2 3 4 5
1.4 4.4 2.2
control shRNA #
–
1 2 3 4
E
Basak, et al. Supplementary Information
-4-
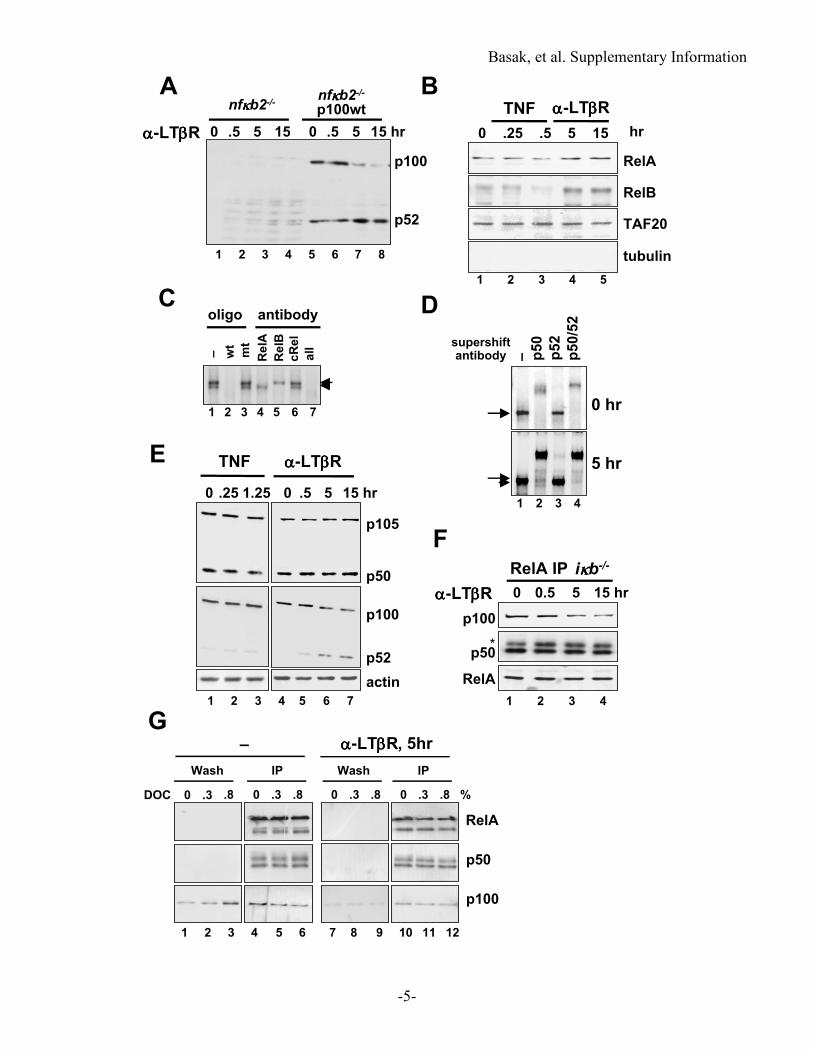
Figure S3. nfκκκκb2 p100 is required and sufficient for LTββββR activation of NF-κκκκB/RelA. A. Degradation of p100 and accumulation of p52 in nfkb2
-/- MEF reconstituted with a p100
expressing retrovirus (pBabe-p100) was monitored by immunoblotting using an N-terminal
p100/p52 antibody during a stimulation time course with α-LTβR antibody.
B. Nuclear localization of indicated NF-κB proteins was monitored by immunoblotting extracts
prepared from TNF (1ng/ml) or LTβR agonist (0.3µg/ml) stimulated IκB-deficient cells with
specific antibodies.
C. Specificity and composition of NF-κB DNA binding complexes induced by LTβR stimulation in
iκbα-/-β-/-ε-/- cells was determined by oligonucleotide competition (lanes 2-3) and supershift with the indicated antibodies (lanes 4-7). RelA- (arrow) and RelB- (arrowhead) containing complexes
are indicated.
D. Composition of RelA and RelB DNA binding dimer present in resting (top panel) or LTβR-
induced (bottom panel) IκB-deficient (iκbα-/-β-/-ε-/-) cells was examined by supershift analysis (lanes 2-4). At 5hr of stimulation both RelA:p50 (arrow) and RelB:p50 (arrowhead) dimer was
induced.
E. Immunoblots for p105 (top panels) and p100 (bottom panels) of lysates prepared from TNF (left
panels) and LTβR (right panels) stimulated IκB-deficient cells.
F. Association of p100 and RelA during LTβR signaling was monitored by p100 immunoblotting of
RelA co-immunoprecipitates performed with extracts prepared from IκB-deficient cells at the
indicated times.
G. Probing the nature of the p100-RelA interaction in canonical IκB-deficient cells (iκbα-/-β-/-ε-/-)
before and after LTβR stimulation, using the DOC sensitivity assay as shown in Figure 4a for wild
type cells. Results indicate that p100 forms DOC sensitive complexes in IκB-deficient cells with
the RelA:p50 dimer that respond to LTβR signaling.
Basak, et al. Supplementary Information
-5-
0 .3 .8DOC 0 .3 .8 0 .3 .8 0 .3 .8 %
p50
RelA
p100
αααα-LTββββR, 5hr–
IPWash IPWash
1 2 3 4 5 6 7 8 9 10 11 12
G
150 .5 5αααα-LTββββR 15 hr0 .5 5
p100
p52
nfκκκκb2-/-nfκκκκb2-/-
p100wt
1 2 3 4 5 6 7 8
A
RelA
RelB
TAF20
.25 .5 5 150
TNF αααα-LTββββR
hr
tubulin
1 2 3 4 5
B
C
p50
p52
p50/52
–
0 hr
5 hr
1 2 3 4
TNF αααα-LTββββR
0 .5 5 15 hr0 .25 1.25
p105
p50
p100
p52
actin
1 2 3 4 5 6 7
E
RelA
p100
p50*
αααα-LTββββR
1 2 3 4
0 0.5 5 15 hr
iκκκκb-/-RelA IP
F
supershiftantibody
Dall
RelA
RelB
cRel
oligo antibody
1 2 3 4 5 6 7
– wt
mt
Basak, et al. Supplementary Information
-6-
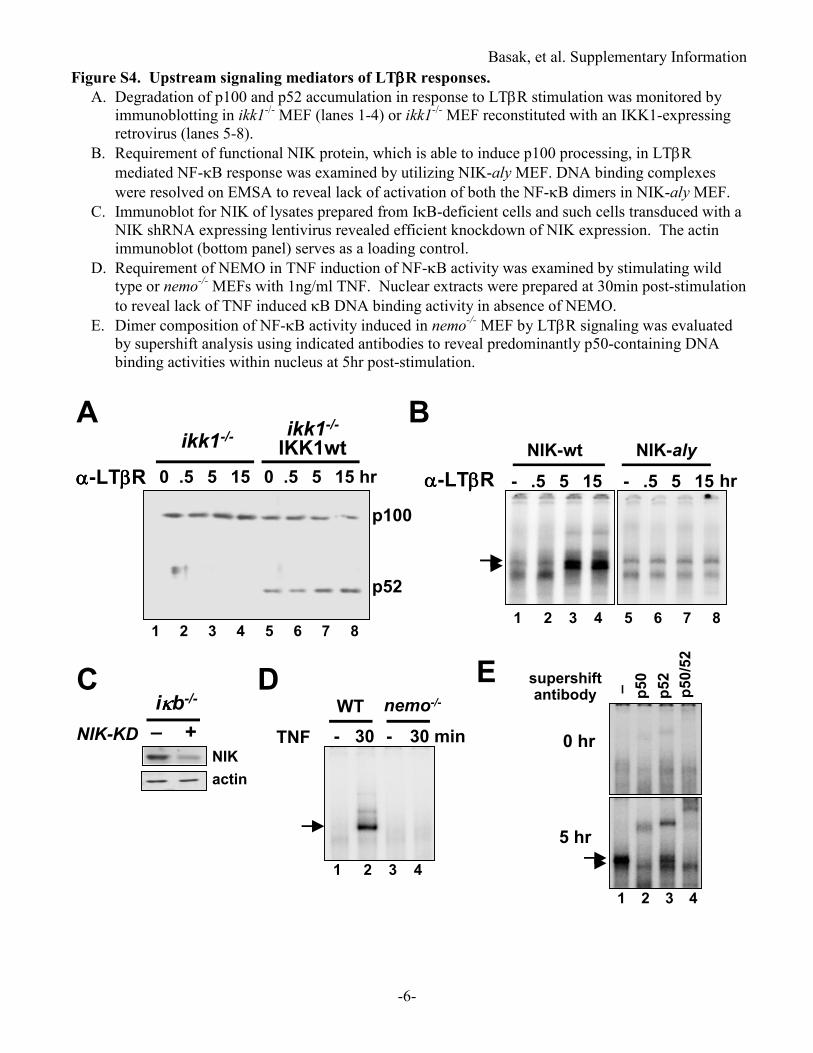
Figure S4. Upstream signaling mediators of LTββββR responses.
A. Degradation of p100 and p52 accumulation in response to LTβR stimulation was monitored by
immunoblotting in ikk1-/- MEF (lanes 1-4) or ikk1
-/- MEF reconstituted with an IKK1-expressing
retrovirus (lanes 5-8).
B. Requirement of functional NIK protein, which is able to induce p100 processing, in LTβR
mediated NF-κB response was examined by utilizing NIK-aly MEF. DNA binding complexes
were resolved on EMSA to reveal lack of activation of both the NF-κB dimers in NIK-aly MEF.
C. Immunoblot for NIK of lysates prepared from IκB-deficient cells and such cells transduced with a
NIK shRNA expressing lentivirus revealed efficient knockdown of NIK expression. The actin
immunoblot (bottom panel) serves as a loading control.
D. Requirement of NEMO in TNF induction of NF-κB activity was examined by stimulating wild
type or nemo-/- MEFs with 1ng/ml TNF. Nuclear extracts were prepared at 30min post-stimulation
to reveal lack of TNF induced κB DNA binding activity in absence of NEMO.
E. Dimer composition of NF-κB activity induced in nemo-/- MEF by LTβR signaling was evaluated
by supershift analysis using indicated antibodies to reveal predominantly p50-containing DNA
binding activities within nucleus at 5hr post-stimulation.
NIK
actin
NIK-KD – +
iκκκκb-/-C
B
D E
1 2 3 4 5 6 7 8
NIK-aly
15- .5 5αααα-LTββββR 15- .5 5 hr
NIK-wt
30 min- 30 -TNF
WT
1 2 3 4
nemo-/-
p50
p52
p50/52
–
supershiftantibody
5 hr
0 hr
1 2 3 4
A
150 .5 5αααα-LTββββR 15 hr0 .5 5
p100
ikk1-/-ikk1-/-
IKK1wt
p52
1 2 3 4 5 6 7 8
Basak, et al. Supplementary Information
-7-
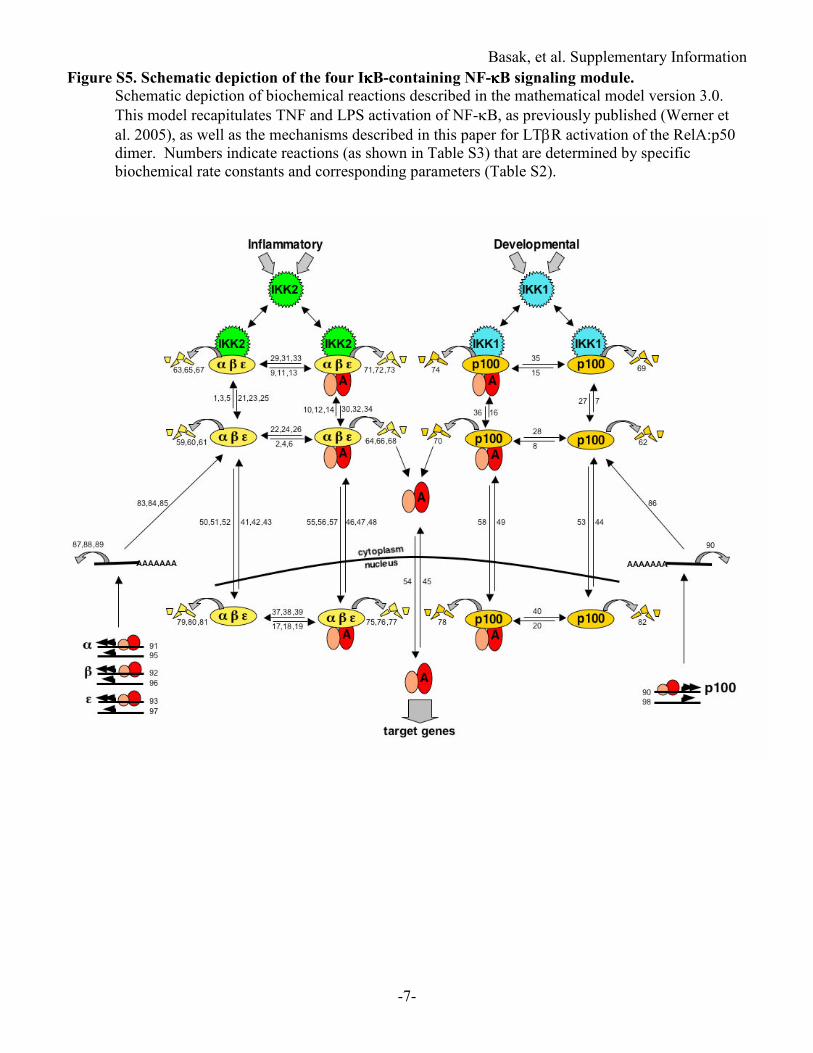
Figure S5. Schematic depiction of the four IκκκκB-containing NF-κκκκB signaling module. Schematic depiction of biochemical reactions described in the mathematical model version 3.0.
This model recapitulates TNF and LPS activation of NF-κB, as previously published (Werner et
al. 2005), as well as the mechanisms described in this paper for LTβR activation of the RelA:p50
dimer. Numbers indicate reactions (as shown in Table S3) that are determined by specific
biochemical rate constants and corresponding parameters (Table S2).
Basak, et al. Supplementary Information
-8-
II. Description of the Computational Model
Introduction
We previously constructed a computational model to describe NF-κB activation events in response to
IKK activation by TNFα (Hoffmann et al., 2002). This model comprised a singular NF-κB species, three
IκB isoforms IκBα/β/ε, and IKK. Synthesis and degradation of the IκBs and cellular localization and
interactions for all components are calculated using a system of ordinary differential equations. Recent
studies by our group expanded the model to include numerically defined IKK activity (Werner et al.,
2005) and inducible syntheses of IκBε and IκBβ (Kearns et al., 2006).
This version includes nfkb2 p100/IκBδ as a fourth IκB protein that is degraded in response to IKK1
activity to release NF-κB/RelA dimers. p100/IκBδ is transcriptionally regulated by NF-κB/RelA. The
scope of the model is shown schematically in Figure S6. Eight components, including free and bound
forms of p100/IκBδ and IKK1, were added to the model. Experimental data regarding the synthesis and
degradation of p100/IκBδ mRNA and protein that allowed for parameter fitting will be reported
elsewhere (V.Shih, J.D.K., S.B., A.H., unpublished observations). Three assumptions were made to fit
parameters with experimental observations: NF-κB-mediated p100/IκBδ transcription is delayed by 45
min akin to IκBε, and IκBβ (Kearns et al., 2006); p100/IκBδ synthesis is diminished in response to
activation of the non-canonical pathway by LTβ stimulation to account for p100 processing to p52; and
IκB-NF-κB association rates decrease in response to non-canonical activation.
This model is able to reproduce the general temporal profiles of p100, IκBα, IκBβ, and IκBε protein
levels and NF-κB/RelA nuclear activity as measured experimentally in response to transient TNF,
transient LPS, and persistent LTβR stimulations.
Simulation Regime
Simulations were performed in Matlab version 2006a (Mathworks) using the built-in ode15s solver at
default settings. Simulations comprised of two distinct and sequential phases. The first phase, Phase 1,
prior to the onset of stimulation (t = 0), was used to reach equilibrium; 2000 minutes was found to be
sufficient in all scenarios shown here. This represents the resting state prior to stimulation.
The second phase, Phase 2, occurs in positive time and begins with the application of a stimulatory input
to the system, represented by an increase in the active IKK component. This perturbs the equilibrium
attained in Phase 1 and allows for nuclear localization of NF-κB, subsequent induction of IκB and P100
syntheses, and the resulting negative feedbacks.
The results of simulations can be graphically plotted within MatLab or within a Microsoft Excel
spreadsheet. The model figures in the paper were plotted within Excel. A multidimensional array of
concentration values for each component of the model at 1 min intervals is constructed within the MatLab
model and then exported to a tab-delimited text file. This file is then imported into an Excel spreadsheet.
Basak, et al. Supplementary Information
-9-
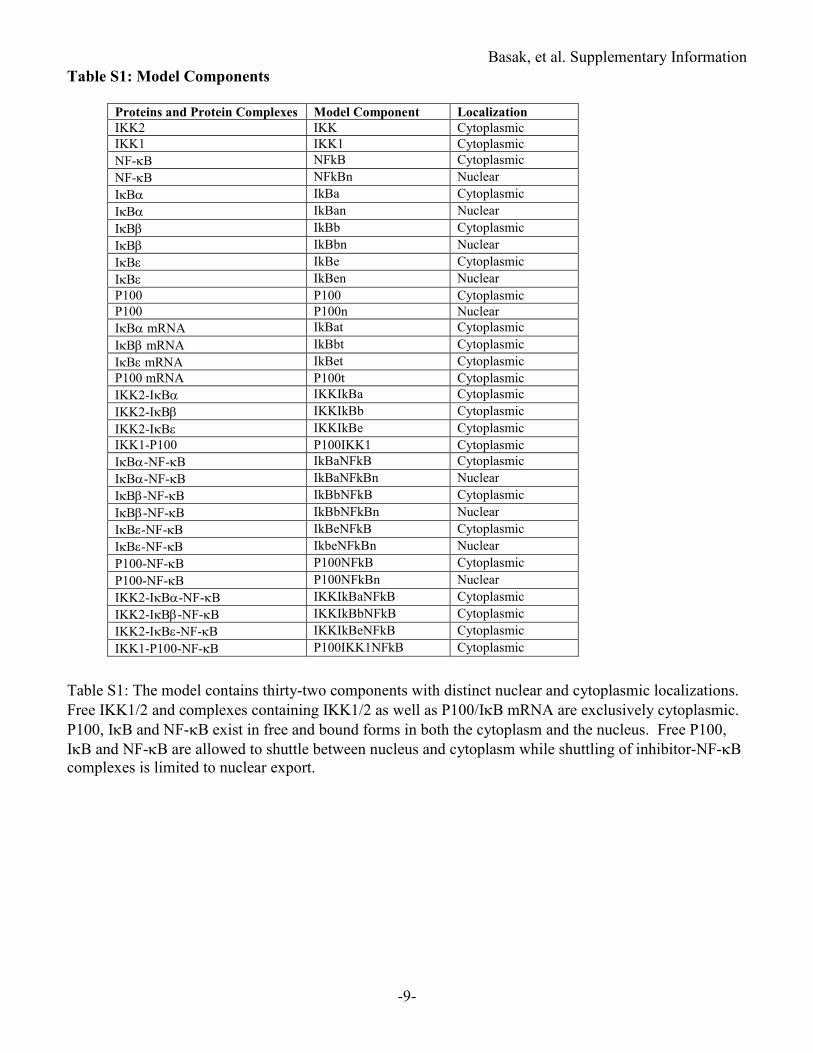
Table S1: Model Components
Proteins and Protein Complexes Model Component Localization
IKK2 IKK Cytoplasmic
IKK1 IKK1 Cytoplasmic
NF-κB NFkB Cytoplasmic
NF-κB NFkBn Nuclear
IκBα IkBa Cytoplasmic
IκBα IkBan Nuclear
IκBβ IkBb Cytoplasmic
IκBβ IkBbn Nuclear
IκBε IkBe Cytoplasmic
IκBε IkBen Nuclear
P100 P100 Cytoplasmic
P100 P100n Nuclear
IκBα mRNA IkBat Cytoplasmic
IκBβ mRNA IkBbt Cytoplasmic
IκBε mRNA IkBet Cytoplasmic
P100 mRNA P100t Cytoplasmic
IKK2-IκBα IKKIkBa Cytoplasmic
IKK2-IκBβ IKKIkBb Cytoplasmic
IKK2-IκBε IKKIkBe Cytoplasmic
IKK1-P100 P100IKK1 Cytoplasmic
IκBα-NF-κB IkBaNFkB Cytoplasmic
IκBα-NF-κB IkBaNFkBn Nuclear
IκBβ-NF-κB IkBbNFkB Cytoplasmic
IκBβ-NF-κB IkBbNFkBn Nuclear
IκBε-NF-κB IkBeNFkB Cytoplasmic
IκBε-NF-κB IkbeNFkBn Nuclear
P100-NF-κB P100NFkB Cytoplasmic
P100-NF-κB P100NFkBn Nuclear
IKK2-IκBα-NF-κB IKKIkBaNFkB Cytoplasmic
IKK2-IκBβ-NF-κB IKKIkBbNFkB Cytoplasmic
IKK2-IκBε-NF-κB IKKIkBeNFkB Cytoplasmic
IKK1-P100-NF-κB P100IKK1NFkB Cytoplasmic
Table S1: The model contains thirty-two components with distinct nuclear and cytoplasmic localizations.
Free IKK1/2 and complexes containing IKK1/2 as well as P100/IκB mRNA are exclusively cytoplasmic.
P100, IκB and NF-κB exist in free and bound forms in both the cytoplasm and the nucleus. Free P100,
IκB and NF-κB are allowed to shuttle between nucleus and cytoplasm while shuttling of inhibitor-NF-κB
complexes is limited to nuclear export.
Basak, et al. Supplementary Information
-10-
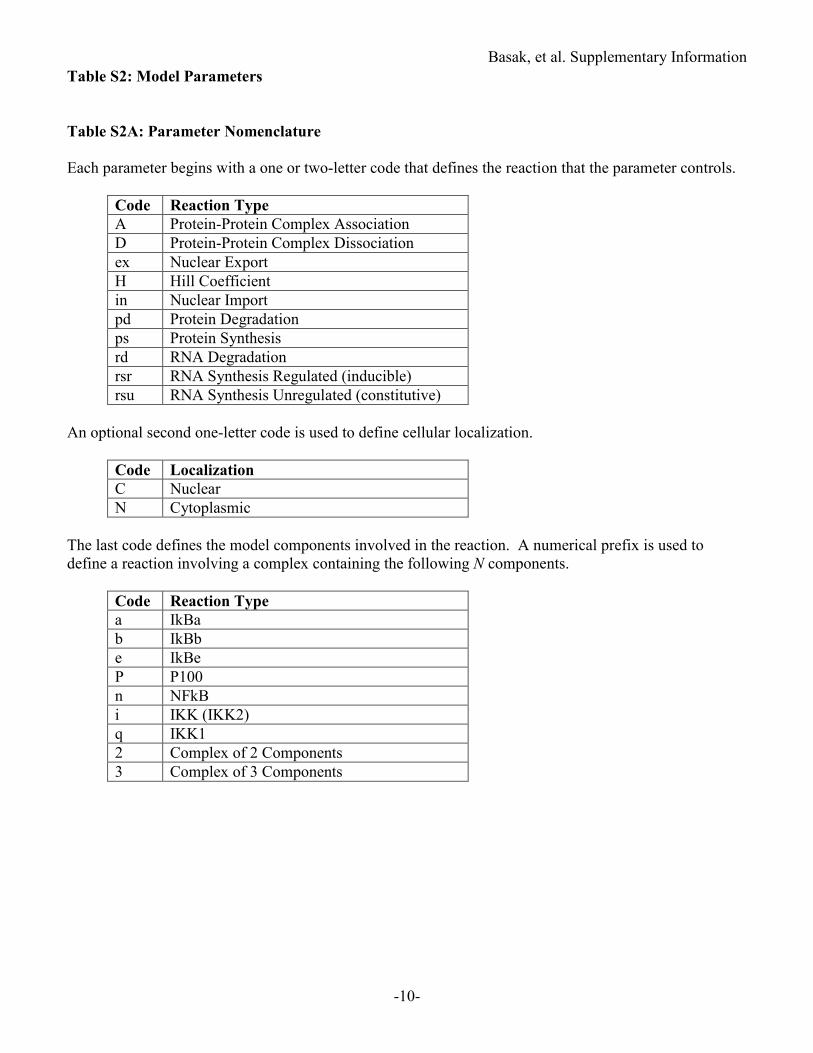
Table S2: Model Parameters
Table S2A: Parameter Nomenclature
Each parameter begins with a one or two-letter code that defines the reaction that the parameter controls.
Code Reaction Type
A Protein-Protein Complex Association
D Protein-Protein Complex Dissociation
ex Nuclear Export
H Hill Coefficient
in Nuclear Import
pd Protein Degradation
ps Protein Synthesis
rd RNA Degradation
rsr RNA Synthesis Regulated (inducible)
rsu RNA Synthesis Unregulated (constitutive)
An optional second one-letter code is used to define cellular localization.
Code Localization
C Nuclear
N Cytoplasmic
The last code defines the model components involved in the reaction. A numerical prefix is used to
define a reaction involving a complex containing the following N components.
Code Reaction Type
a IkBa
b IkBb
e IkBe
P P100
n NFkB
i IKK (IKK2)
q IKK1
2 Complex of 2 Components
3 Complex of 3 Components
Basak, et al. Supplementary Information
-11-
Table S2B: Complex Association Rates
Parameter ka (µµµµM
-1 min
-1)
a_c_an 30
a_n_an 30
a_c_bn 30
a_n_bn 30
a_c_en 30
a_n_en 30
a_c_pn 30
a_n_pn 30
a_c_ai 1.35
a_c_bi 0.36
a_c_ei 0.54
a_c_pq 0.54
a_c_2ani 11.1
a_c_2bni 2.88
a_c_2eni 4.2
a_c_2pnq 4.2
a_c_2ain 30
a_c_2bin 30
a_c_2ein 30
a_c_2pqn 30
Table S2C: Complex Dissociation Rates
Parameter kd (min
-1)
d_c_an 6 E-05
d_n_an 6 E-05
d_c_bn 6 E-05
d_n_bn 6 E-05
d_c_en 6 E-05
d_n_en 6 E-05
d_c_pn 6 E-05
d_n_pn 6 E-05
d_c_ai 0.075
d_c_bi 0.105
d_c_ei 0.105
d_c_pq 0.105
d_c_2ani 0.075
d_c_2bni 0.105
d_c_2eni 0.105
d_c_2pnq 6 E-05
d_c_2ain 6 E-05
d_c_2bin 6 E-05
d_c_2ein 6 E-05
d_c_2pqn 6 E-05
Table S2D: Nuclear Import and Export Translocation Rates
Parameter Rate (min
-1)
in_a 0.09
ex_a 0.012
in_b 0.009
ex_b 0.012
in_e 0.045
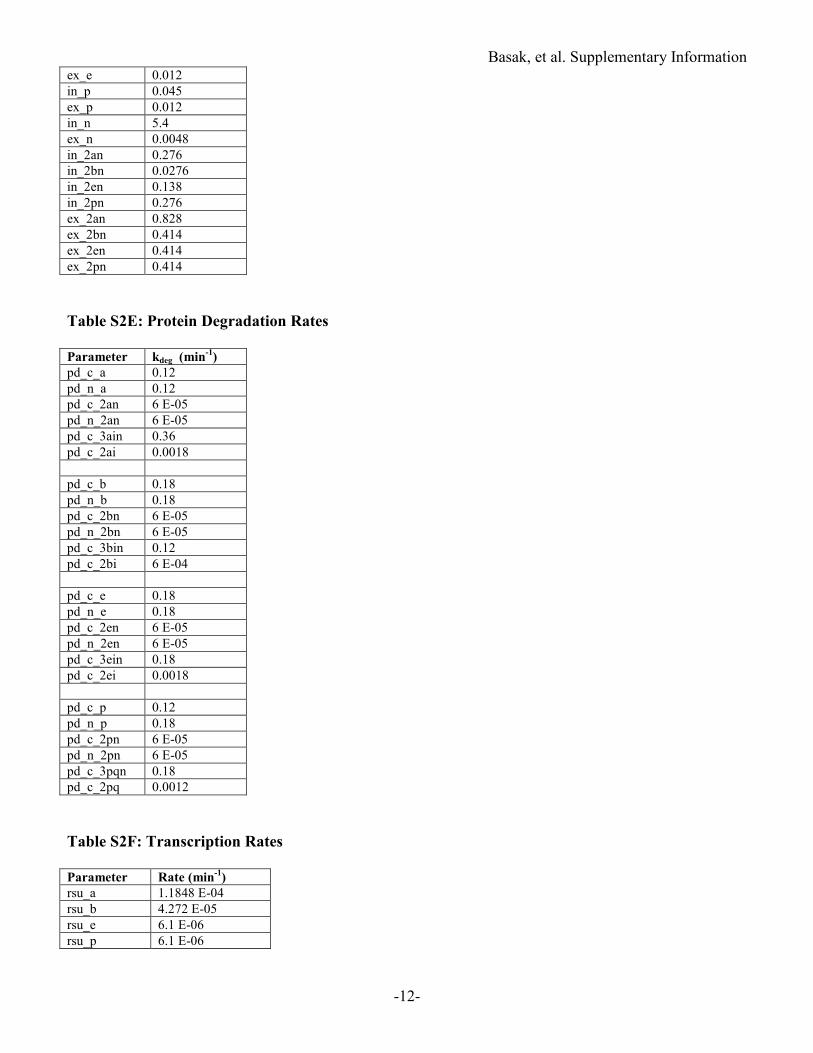
Basak, et al. Supplementary Information
-12-
ex_e 0.012
in_p 0.045
ex_p 0.012
in_n 5.4
ex_n 0.0048
in_2an 0.276
in_2bn 0.0276
in_2en 0.138
in_2pn 0.276
ex_2an 0.828
ex_2bn 0.414
ex_2en 0.414
ex_2pn 0.414
Table S2E: Protein Degradation Rates
Parameter kdeg (min
-1)
pd_c_a 0.12
pd_n_a 0.12
pd_c_2an 6 E-05
pd_n_2an 6 E-05
pd_c_3ain 0.36
pd_c_2ai 0.0018
pd_c_b 0.18
pd_n_b 0.18
pd_c_2bn 6 E-05
pd_n_2bn 6 E-05
pd_c_3bin 0.12
pd_c_2bi 6 E-04
pd_c_e 0.18
pd_n_e 0.18
pd_c_2en 6 E-05
pd_n_2en 6 E-05
pd_c_3ein 0.18
pd_c_2ei 0.0018
pd_c_p 0.12
pd_n_p 0.18
pd_c_2pn 6 E-05
pd_n_2pn 6 E-05
pd_c_3pqn 0.18
pd_c_2pq 0.0012
Table S2F: Transcription Rates
Parameter Rate (min
-1)
rsu_a 1.1848 E-04
rsu_b 4.272 E-05
rsu_e 6.1 E-06
rsu_p 6.1 E-06
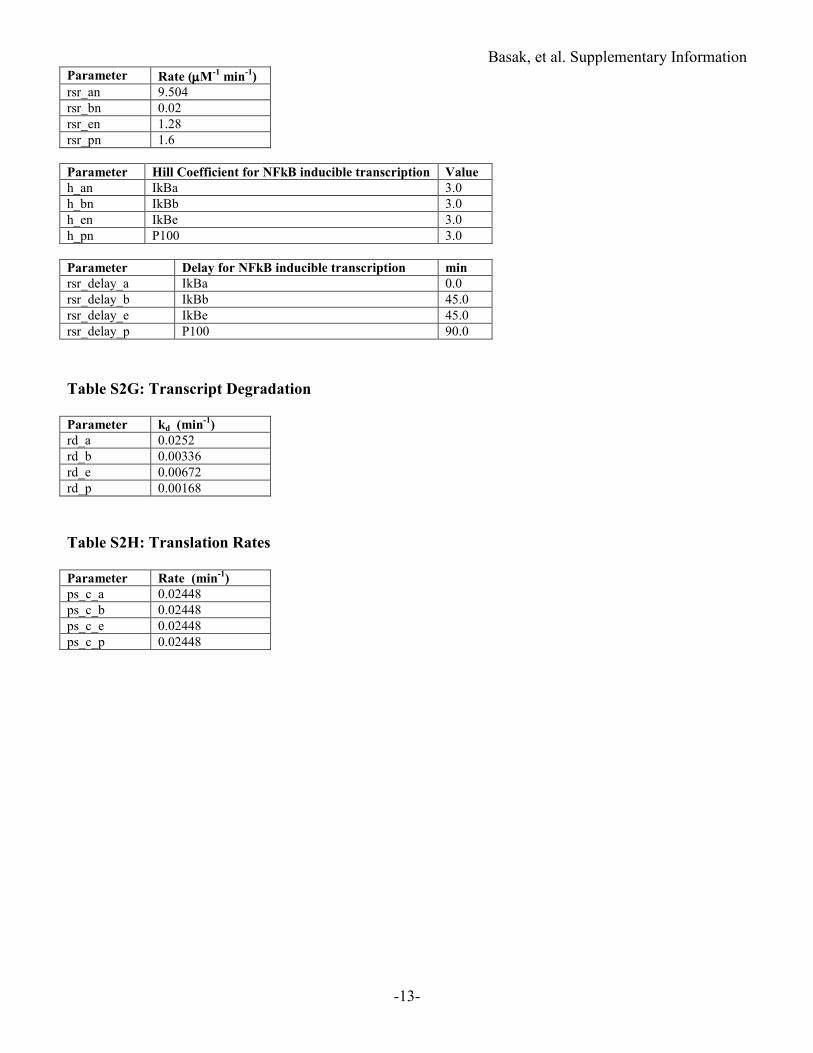
Basak, et al. Supplementary Information
-13-
Parameter Rate (µµµµM-1 min
-1)
rsr_an 9.504
rsr_bn 0.02
rsr_en 1.28
rsr_pn 1.6
Parameter Hill Coefficient for NFkB inducible transcription Value
h_an IkBa 3.0
h_bn IkBb 3.0
h_en IkBe 3.0
h_pn P100 3.0
Parameter Delay for NFkB inducible transcription min
rsr_delay_a IkBa 0.0
rsr_delay_b IkBb 45.0
rsr_delay_e IkBe 45.0
rsr_delay_p P100 90.0
Table S2G: Transcript Degradation
Parameter kd (min
-1)
rd_a 0.0252
rd_b 0.00336
rd_e 0.00672
rd_p 0.00168
Table S2H: Translation Rates
Parameter Rate (min
-1)
ps_c_a 0.02448
ps_c_b 0.02448
ps_c_e 0.02448
ps_c_p 0.02448
Basak, et al. Supplementary Information
-14-
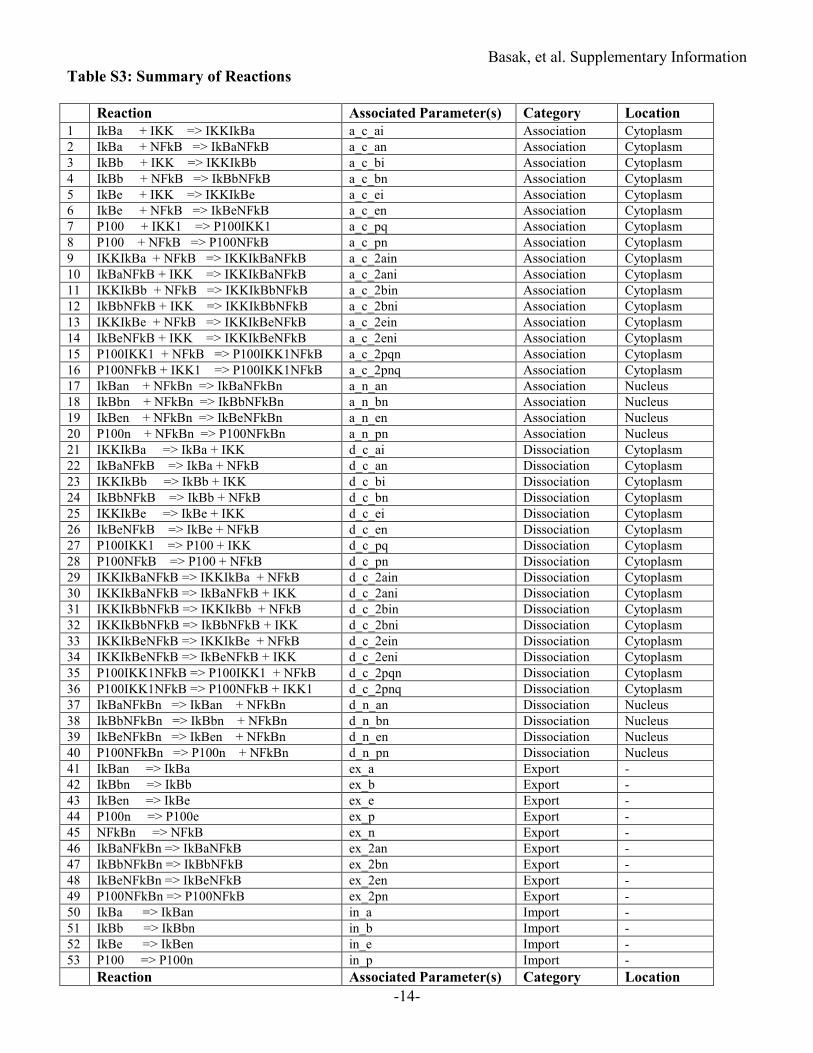
Table S3: Summary of Reactions
Reaction Associated Parameter(s) Category Location
1 IkBa + IKK => IKKIkBa a_c_ai Association Cytoplasm
2 IkBa + NFkB => IkBaNFkB a_c_an Association Cytoplasm
3 IkBb + IKK => IKKIkBb a_c_bi Association Cytoplasm
4 IkBb + NFkB => IkBbNFkB a_c_bn Association Cytoplasm
5 IkBe + IKK => IKKIkBe a_c_ei Association Cytoplasm
6 IkBe + NFkB => IkBeNFkB a_c_en Association Cytoplasm
7 P100 + IKK1 => P100IKK1 a_c_pq Association Cytoplasm
8 P100 + NFkB => P100NFkB a_c_pn Association Cytoplasm
9 IKKIkBa + NFkB => IKKIkBaNFkB a_c_2ain Association Cytoplasm
10 IkBaNFkB + IKK => IKKIkBaNFkB a_c_2ani Association Cytoplasm
11 IKKIkBb + NFkB => IKKIkBbNFkB a_c_2bin Association Cytoplasm
12 IkBbNFkB + IKK => IKKIkBbNFkB a_c_2bni Association Cytoplasm
13 IKKIkBe + NFkB => IKKIkBeNFkB a_c_2ein Association Cytoplasm
14 IkBeNFkB + IKK => IKKIkBeNFkB a_c_2eni Association Cytoplasm
15 P100IKK1 + NFkB => P100IKK1NFkB a_c_2pqn Association Cytoplasm
16 P100NFkB + IKK1 => P100IKK1NFkB a_c_2pnq Association Cytoplasm
17 IkBan + NFkBn => IkBaNFkBn a_n_an Association Nucleus
18 IkBbn + NFkBn => IkBbNFkBn a_n_bn Association Nucleus
19 IkBen + NFkBn => IkBeNFkBn a_n_en Association Nucleus
20 P100n + NFkBn => P100NFkBn a_n_pn Association Nucleus
21 IKKIkBa => IkBa + IKK d_c_ai Dissociation Cytoplasm
22 IkBaNFkB => IkBa + NFkB d_c_an Dissociation Cytoplasm
23 IKKIkBb => IkBb + IKK d_c_bi Dissociation Cytoplasm
24 IkBbNFkB => IkBb + NFkB d_c_bn Dissociation Cytoplasm
25 IKKIkBe => IkBe + IKK d_c_ei Dissociation Cytoplasm
26 IkBeNFkB => IkBe + NFkB d_c_en Dissociation Cytoplasm
27 P100IKK1 => P100 + IKK d_c_pq Dissociation Cytoplasm
28 P100NFkB => P100 + NFkB d_c_pn Dissociation Cytoplasm
29 IKKIkBaNFkB => IKKIkBa + NFkB d_c_2ain Dissociation Cytoplasm
30 IKKIkBaNFkB => IkBaNFkB + IKK d_c_2ani Dissociation Cytoplasm
31 IKKIkBbNFkB => IKKIkBb + NFkB d_c_2bin Dissociation Cytoplasm
32 IKKIkBbNFkB => IkBbNFkB + IKK d_c_2bni Dissociation Cytoplasm
33 IKKIkBeNFkB => IKKIkBe + NFkB d_c_2ein Dissociation Cytoplasm
34 IKKIkBeNFkB => IkBeNFkB + IKK d_c_2eni Dissociation Cytoplasm
35 P100IKK1NFkB => P100IKK1 + NFkB d_c_2pqn Dissociation Cytoplasm
36 P100IKK1NFkB => P100NFkB + IKK1 d_c_2pnq Dissociation Cytoplasm
37 IkBaNFkBn => IkBan + NFkBn d_n_an Dissociation Nucleus
38 IkBbNFkBn => IkBbn + NFkBn d_n_bn Dissociation Nucleus
39 IkBeNFkBn => IkBen + NFkBn d_n_en Dissociation Nucleus
40 P100NFkBn => P100n + NFkBn d_n_pn Dissociation Nucleus
41 IkBan => IkBa ex_a Export -
42 IkBbn => IkBb ex_b Export -
43 IkBen => IkBe ex_e Export -
44 P100n => P100e ex_p Export -
45 NFkBn => NFkB ex_n Export -
46 IkBaNFkBn => IkBaNFkB ex_2an Export -
47 IkBbNFkBn => IkBbNFkB ex_2bn Export -
48 IkBeNFkBn => IkBeNFkB ex_2en Export -
49 P100NFkBn => P100NFkB ex_2pn Export -
50 IkBa => IkBan in_a Import -
51 IkBb => IkBbn in_b Import -
52 IkBe => IkBen in_e Import -
53 P100 => P100n in_p Import -
Reaction Associated Parameter(s) Category Location
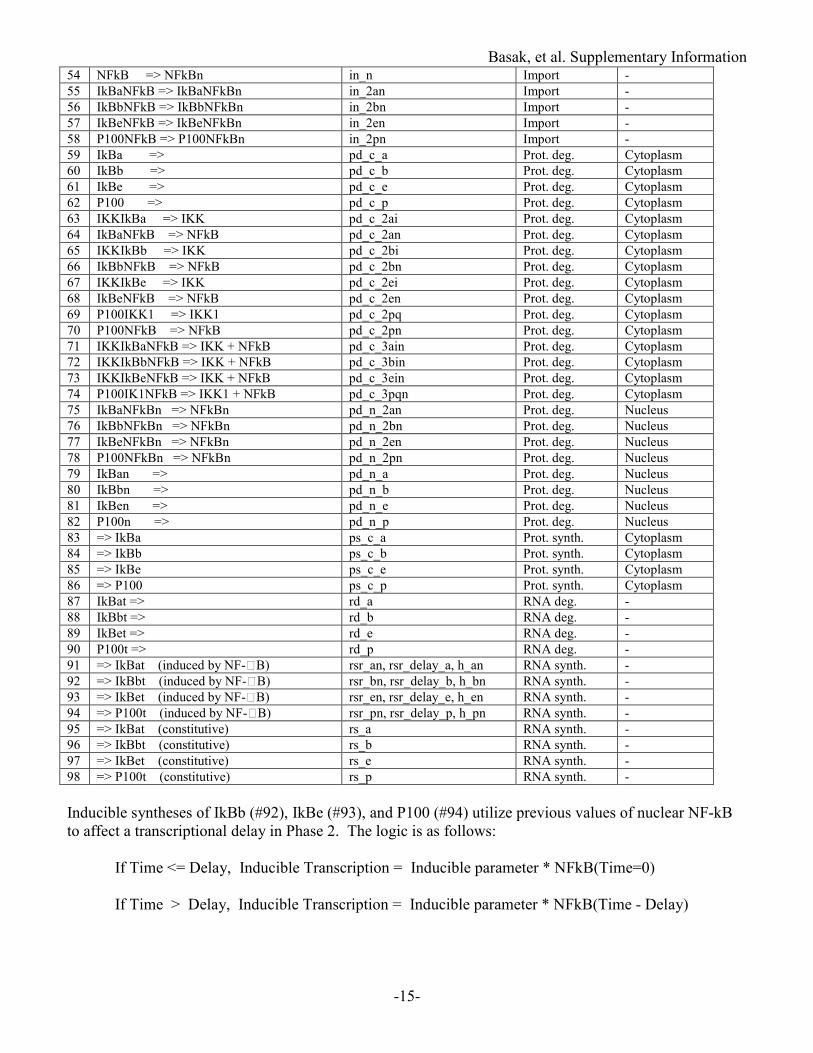
Basak, et al. Supplementary Information
-15-
54 NFkB => NFkBn in_n Import -
55 IkBaNFkB => IkBaNFkBn in_2an Import -
56 IkBbNFkB => IkBbNFkBn in_2bn Import -
57 IkBeNFkB => IkBeNFkBn in_2en Import -
58 P100NFkB => P100NFkBn in_2pn Import -
59 IkBa => pd_c_a Prot. deg. Cytoplasm
60 IkBb => pd_c_b Prot. deg. Cytoplasm
61 IkBe => pd_c_e Prot. deg. Cytoplasm
62 P100 => pd_c_p Prot. deg. Cytoplasm
63 IKKIkBa => IKK pd_c_2ai Prot. deg. Cytoplasm
64 IkBaNFkB => NFkB pd_c_2an Prot. deg. Cytoplasm
65 IKKIkBb => IKK pd_c_2bi Prot. deg. Cytoplasm
66 IkBbNFkB => NFkB pd_c_2bn Prot. deg. Cytoplasm
67 IKKIkBe => IKK pd_c_2ei Prot. deg. Cytoplasm
68 IkBeNFkB => NFkB pd_c_2en Prot. deg. Cytoplasm
69 P100IKK1 => IKK1 pd_c_2pq Prot. deg. Cytoplasm
70 P100NFkB => NFkB pd_c_2pn Prot. deg. Cytoplasm
71 IKKIkBaNFkB => IKK + NFkB pd_c_3ain Prot. deg. Cytoplasm
72 IKKIkBbNFkB => IKK + NFkB pd_c_3bin Prot. deg. Cytoplasm
73 IKKIkBeNFkB => IKK + NFkB pd_c_3ein Prot. deg. Cytoplasm
74 P100IK1NFkB => IKK1 + NFkB pd_c_3pqn Prot. deg. Cytoplasm
75 IkBaNFkBn => NFkBn pd_n_2an Prot. deg. Nucleus
76 IkBbNFkBn => NFkBn pd_n_2bn Prot. deg. Nucleus
77 IkBeNFkBn => NFkBn pd_n_2en Prot. deg. Nucleus
78 P100NFkBn => NFkBn pd_n_2pn Prot. deg. Nucleus
79 IkBan => pd_n_a Prot. deg. Nucleus
80 IkBbn => pd_n_b Prot. deg. Nucleus
81 IkBen => pd_n_e Prot. deg. Nucleus
82 P100n => pd_n_p Prot. deg. Nucleus
83 => IkBa ps_c_a Prot. synth. Cytoplasm
84 => IkBb ps_c_b Prot. synth. Cytoplasm
85 => IkBe ps_c_e Prot. synth. Cytoplasm
86 => P100 ps_c_p Prot. synth. Cytoplasm
87 IkBat => rd_a RNA deg. -
88 IkBbt => rd_b RNA deg. -
89 IkBet => rd_e RNA deg. -
90 P100t => rd_p RNA deg. -
91 => IkBat (induced by NF-IB) rsr_an, rsr_delay_a, h_an RNA synth. -
92 => IkBbt (induced by NF-IB) rsr_bn, rsr_delay_b, h_bn RNA synth. -
93 => IkBet (induced by NF-IB) rsr_en, rsr_delay_e, h_en RNA synth. -
94 => P100t (induced by NF-IB) rsr_pn, rsr_delay_p, h_pn RNA synth. -
95 => IkBat (constitutive) rs_a RNA synth. -
96 => IkBbt (constitutive) rs_b RNA synth. -
97 => IkBet (constitutive) rs_e RNA synth. -
98 => P100t (constitutive) rs_p RNA synth. -
Inducible syntheses of IkBb (#92), IkBe (#93), and P100 (#94) utilize previous values of nuclear NF-kB
to affect a transcriptional delay in Phase 2. The logic is as follows:
If Time <= Delay, Inducible Transcription = Inducible parameter * NFkB(Time=0)
If Time > Delay, Inducible Transcription = Inducible parameter * NFkB(Time - Delay)
Basak, et al. Supplementary Information
-16-
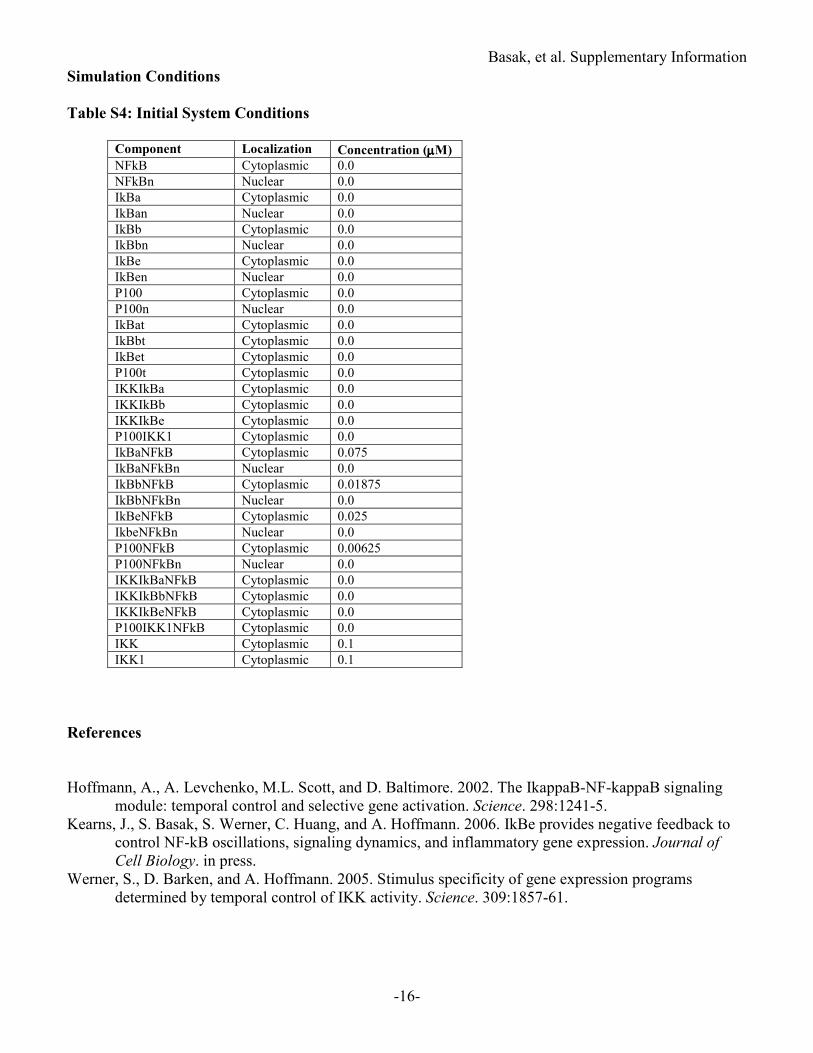
Simulation Conditions
Table S4: Initial System Conditions
Component Localization Concentration (µµµµM)
NFkB Cytoplasmic 0.0
NFkBn Nuclear 0.0
IkBa Cytoplasmic 0.0
IkBan Nuclear 0.0
IkBb Cytoplasmic 0.0
IkBbn Nuclear 0.0
IkBe Cytoplasmic 0.0
IkBen Nuclear 0.0
P100 Cytoplasmic 0.0
P100n Nuclear 0.0
IkBat Cytoplasmic 0.0
IkBbt Cytoplasmic 0.0
IkBet Cytoplasmic 0.0
P100t Cytoplasmic 0.0
IKKIkBa Cytoplasmic 0.0
IKKIkBb Cytoplasmic 0.0
IKKIkBe Cytoplasmic 0.0
P100IKK1 Cytoplasmic 0.0
IkBaNFkB Cytoplasmic 0.075
IkBaNFkBn Nuclear 0.0
IkBbNFkB Cytoplasmic 0.01875
IkBbNFkBn Nuclear 0.0
IkBeNFkB Cytoplasmic 0.025
IkbeNFkBn Nuclear 0.0
P100NFkB Cytoplasmic 0.00625
P100NFkBn Nuclear 0.0
IKKIkBaNFkB Cytoplasmic 0.0
IKKIkBbNFkB Cytoplasmic 0.0
IKKIkBeNFkB Cytoplasmic 0.0
P100IKK1NFkB Cytoplasmic 0.0
IKK Cytoplasmic 0.1
IKK1 Cytoplasmic 0.1
References
Hoffmann, A., A. Levchenko, M.L. Scott, and D. Baltimore. 2002. The IkappaB-NF-kappaB signaling
module: temporal control and selective gene activation. Science. 298:1241-5.
Kearns, J., S. Basak, S. Werner, C. Huang, and A. Hoffmann. 2006. IkBe provides negative feedback to
control NF-kB oscillations, signaling dynamics, and inflammatory gene expression. Journal of
Cell Biology. in press.
Werner, S., D. Barken, and A. Hoffmann. 2005. Stimulus specificity of gene expression programs
determined by temporal control of IKK activity. Science. 309:1857-61.