Automatic Test Packet Generation - SIGCOMM
12
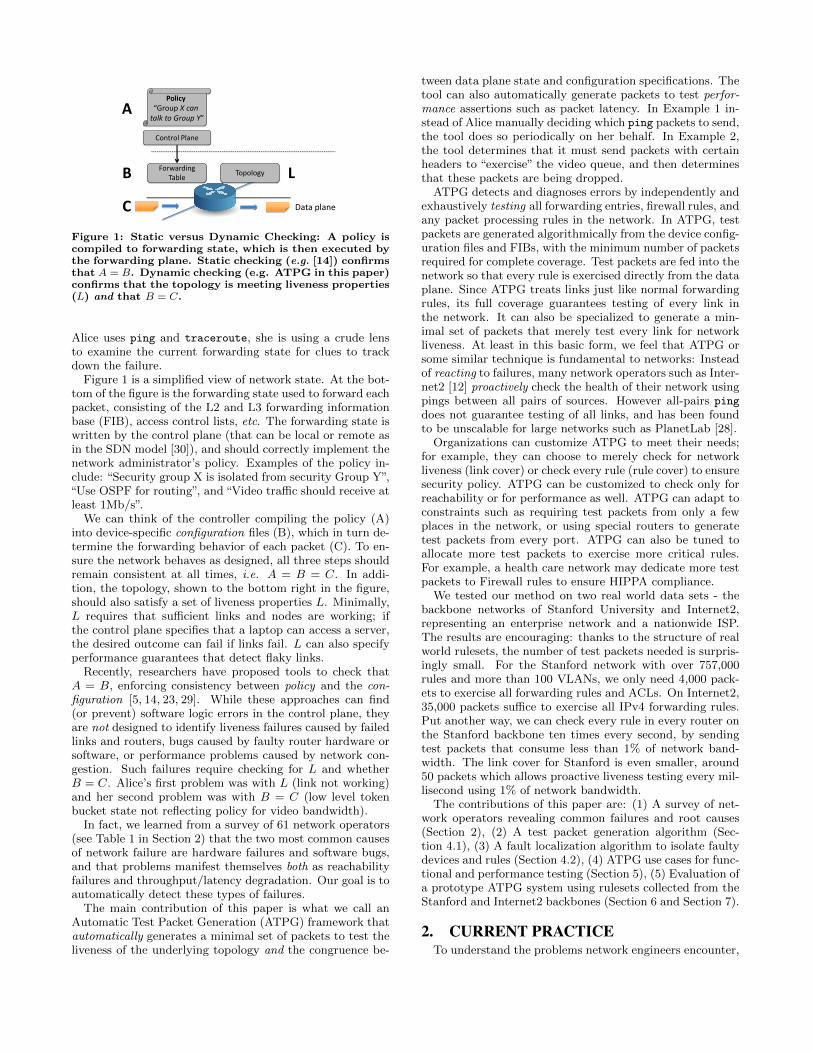
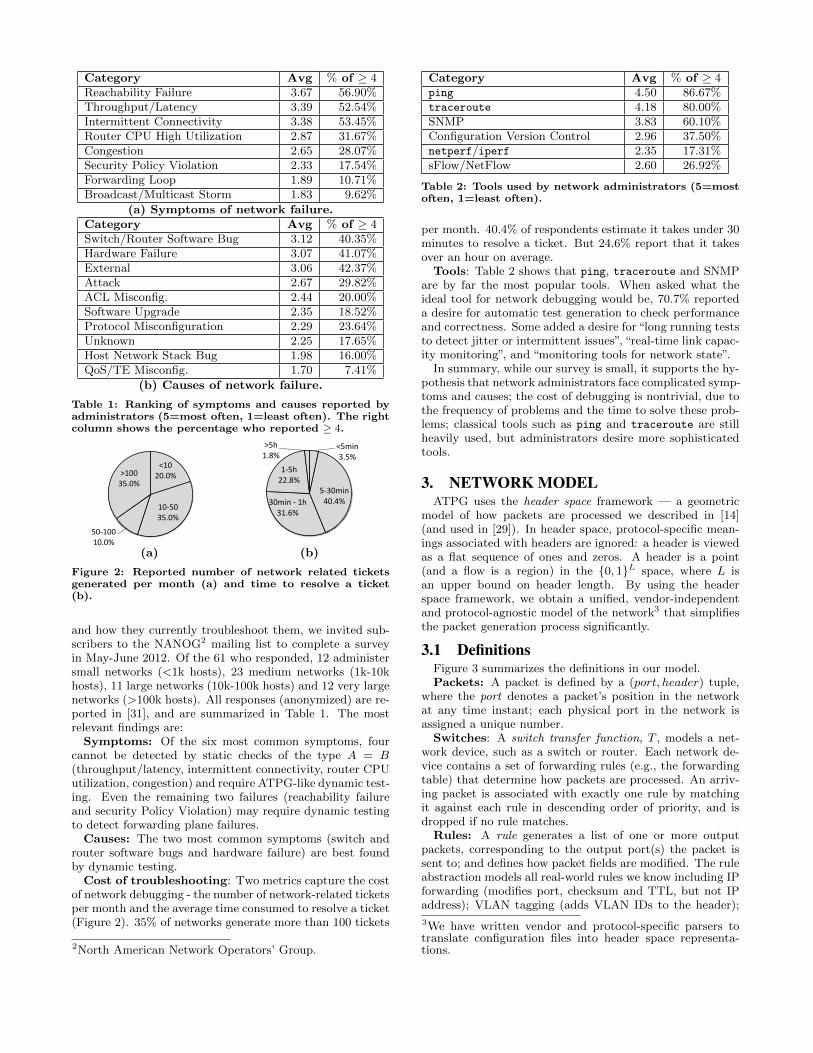
Automatic Test Packet Generation Hongyi Zeng †* , Peyman Kazemian †* , George Varghese § , Nick McKeown † † Stanford University, § UCSD & Microsoft Research {hyzeng,kazemian,nickm}@stanford.edu, [email protected] * These authors contributed equally to this work. ABSTRACT Networks are getting larger and more complex; yet adminis- trators rely on rudimentary tools such as ping and tracer- oute to debug problems. We propose an automated and sys- tematic approach for testing and debugging networks called “Automatic Test Packet Generation”(ATPG). ATPG reads router configurations and generates a device-independent model. The model is used to generate a minimum set of test packets to (minimally) exercise every link in the net- work or (maximally) exercise every rule in the network. Test packets are sent periodically, and detected failures trigger a separate mechanism to localize the fault. ATPG can de- tect both functional (e.g., incorrect firewall rule) and per- formance problems (e.g., congested queue). ATPG comple- ments but goes beyond earlier work in static checking (which cannot detect liveness or performance faults) or fault local- ization (which only localize faults given liveness results). We describe our prototype ATPG implementation and results on two real-world data sets: Stanford University’s backbone network and Internet2. We find that a small number of test packets suffices to test all rules in these net- works: For example 4000 packets can cover all rules in Stan- ford backbone network while 54 is enough to cover all links. Sending 4000 test packets 10 times per second consumes less than 1% of link capacity. ATPG code and the data sets are publicly available 1 [1]. Categories and Subject Descriptors C.2.3 [Computer-Communication Networks]: Network Operation—Network monitoring ; D.2.5 [Software Engi- neering]: Testing and Debugging—Testing tools General Terms Algorithm, Reliability 1 Each figure/table in Section 7 (electronic version) is click- able, linking to instructions on reproducing results. Permission to make digital or hard copies of all or part of this work for personal or classroom use is granted without fee provided that copies are not made or distributed for profit or commercial advantage and that copies bear this notice and the full citation on the first page. To copy otherwise, to republish, to post on servers or to redistribute to lists, requires prior specific permission and/or a fee. Co-NEXT’12, December 10-13, 2012, Nice, France. Copyright 2012 ACM 978-1-4503-1775-7/12/12 ...$15.00. Keywords Test Packet Generation, Data Plane Analysis, Network Trou- bleshooting 1. INTRODUCTION “Only strong trees stand the test of a storm.” — Chinese idiom It is notoriously hard to debug networks. Every day net- work engineers wrestle with router misconfigurations, fiber cuts, faulty interfaces, mis-labeled cables, software bugs, intermittent links and a myriad other reasons that cause networks to misbehave, or fail completely. Network engi- neers hunt down bugs using the most rudimentary tools (e.g. ping, traceroute, SNMP, and tcpdump), and track down root causes using a combination of accrued wisdom and in- tuition. Debugging networks is only becoming harder as networks are getting bigger (modern data centers may con- tain 10,000 switches, a campus network may serve 50,000 users, a 100Gb/s long haul link may carry 100,000 flows), and are getting more complicated (with over 6,000 RFCs, router software is based on millions of lines of source code, and network chips often contain billions of gates). Small wonder that network engineers have been labeled “masters of complexity” [30]. Consider two examples: Example 1. Suppose a router with a faulty line card starts dropping packets silently. Alice, who administers 100 routers, receives a ticket from several unhappy users com- plaining about connectivity. First, Alice examines each router to see if the configuration was changed recently, and con- cludes that the configuration was untouched. Next, Alice uses her knowledge of the topology to triangulate the faulty device with ping and traceroute. Finally, she calls a col- league to replace the line card. Example 2. Suppose that video traffic is mapped to a specific queue in a router, but packets are dropped because the token bucket rate is too low. It is not at all clear how Alice can track down such a performance fault using ping and traceroute. Troubleshooting a network is difficult for three reasons. First, the forwarding state is distributed across multiple routers and firewalls and is defined by their forwarding ta- bles, filter rules and other configuration parameters. Second, the forwarding state is hard to observe, because it typically requires manually logging into every box in the network. Third, there are many different programs, protocols and hu- mans updating the forwarding state simultaneously. When
Transcript of Automatic Test Packet Generation - SIGCOMM
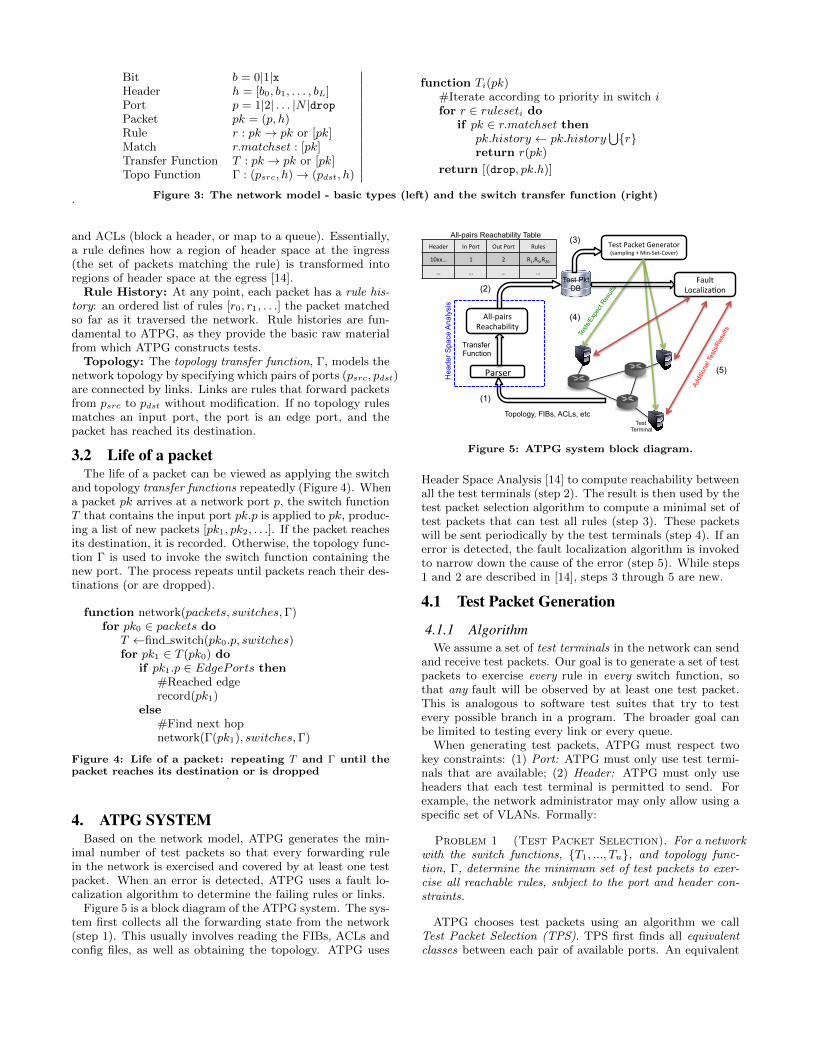
Bit b = 0|1|xHeader h = [b0, b1, . . . , bL]Port p = 1|2| . . . |N |dropPacket pk = (p, h)Rule r : pk → pk or [pk]Match r.matchset : [pk]Transfer Function T : pk → pk or [pk]Topo Function Γ : (psrc, h)→ (pdst, h)
function Ti(pk)#Iterate according to priority in switch ifor r ∈ ruleseti do
if pk ∈ r.matchset thenpk.history ← pk.history
⋃{r}
return r(pk)
return [(drop, pk.h)]
Figure 3: The network model - basic types (left) and the switch transfer function (right).
and ACLs (block a header, or map to a queue). Essentially,a rule defines how a region of header space at the ingress(the set of packets matching the rule) is transformed intoregions of header space at the egress [14].
Rule History: At any point, each packet has a rule his-tory: an ordered list of rules [r0, r1, . . .] the packet matchedso far as it traversed the network. Rule histories are fun-damental to ATPG, as they provide the basic raw materialfrom which ATPG constructs tests.
Topology: The topology transfer function, Γ, models thenetwork topology by specifying which pairs of ports (psrc, pdst)are connected by links. Links are rules that forward packetsfrom psrc to pdst without modification. If no topology rulesmatches an input port, the port is an edge port, and thepacket has reached its destination.
3.2 Life of a packetThe life of a packet can be viewed as applying the switch
and topology transfer functions repeatedly (Figure 4). Whena packet pk arrives at a network port p, the switch functionT that contains the input port pk.p is applied to pk, produc-ing a list of new packets [pk1, pk2, . . .]. If the packet reachesits destination, it is recorded. Otherwise, the topology func-tion Γ is used to invoke the switch function containing thenew port. The process repeats until packets reach their des-tinations (or are dropped).
function network(packets, switches,Γ)for pk0 ∈ packets do
T ←find switch(pk0.p, switches)for pk1 ∈ T (pk0) do
if pk1.p ∈ EdgePorts then#Reached edgerecord(pk1)
else#Find next hopnetwork(Γ(pk1), switches,Γ)
Figure 4: Life of a packet: repeating T and Γ until thepacket reaches its destination or is dropped.
4. ATPG SYSTEMBased on the network model, ATPG generates the min-
imal number of test packets so that every forwarding rulein the network is exercised and covered by at least one testpacket. When an error is detected, ATPG uses a fault lo-calization algorithm to determine the failing rules or links.
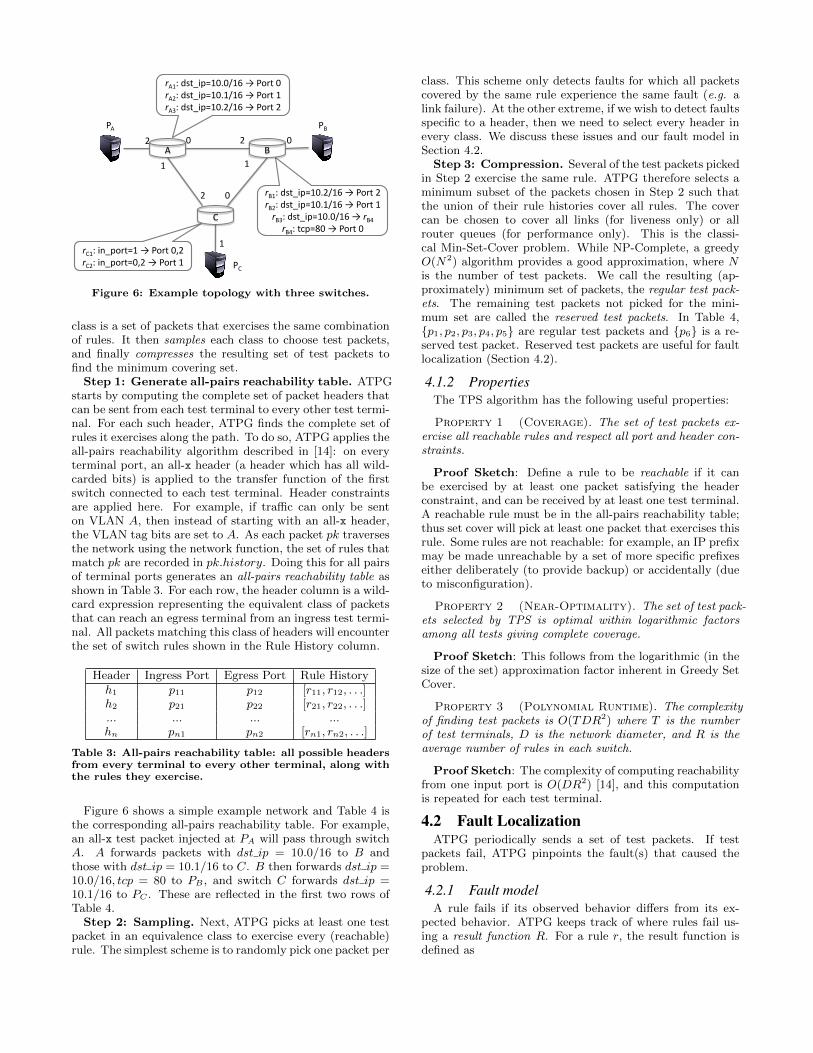
Figure 5 is a block diagram of the ATPG system. The sys-tem first collects all the forwarding state from the network(step 1). This usually involves reading the FIBs, ACLs andconfig files, as well as obtaining the topology. ATPG uses
Parser
Topology, FIBs, ACLs, etc
Transfer Function
All-‐pairs Reachability
Hea
der S
pace
Ana
lysi
s
Test Pkt DB
Header In Port Out Port Rules
10xx… 1 2 R1,R5,R20
… … … …
All-pairs Reachability Table Test Packet Generator (sampling + Min-‐Set-‐Cover)
Tests
/Exp
ect R
esult
s
Fault LocalizaOon
Addi
tiona
l Tes
ts/R
esul
ts
Test Terminal
(1)
(2)
(3)
(4)
(5)
Figure 5: ATPG system block diagram.
Header Space Analysis [14] to compute reachability betweenall the test terminals (step 2). The result is then used by thetest packet selection algorithm to compute a minimal set oftest packets that can test all rules (step 3). These packetswill be sent periodically by the test terminals (step 4). If anerror is detected, the fault localization algorithm is invokedto narrow down the cause of the error (step 5). While steps1 and 2 are described in [14], steps 3 through 5 are new.
4.1 Test Packet Generation
4.1.1 AlgorithmWe assume a set of test terminals in the network can send
and receive test packets. Our goal is to generate a set of testpackets to exercise every rule in every switch function, sothat any fault will be observed by at least one test packet.This is analogous to software test suites that try to testevery possible branch in a program. The broader goal canbe limited to testing every link or every queue.
When generating test packets, ATPG must respect twokey constraints: (1) Port: ATPG must only use test termi-nals that are available; (2) Header: ATPG must only useheaders that each test terminal is permitted to send. Forexample, the network administrator may only allow using aspecific set of VLANs. Formally:
Problem 1 (Test Packet Selection). For a networkwith the switch functions, {T1, ..., Tn}, and topology func-tion, Γ, determine the minimum set of test packets to exer-cise all reachable rules, subject to the port and header con-straints.
ATPG chooses test packets using an algorithm we callTest Packet Selection (TPS). TPS first finds all equivalentclasses between each pair of available ports. An equivalent
244
rA1: dst_ip=10.0/16 → Port 0 rA2: dst_ip=10.1/16 → Port 1 rA3: dst_ip=10.2/16 → Port 2
rB1: dst_ip=10.2/16 → Port 2 rB2: dst_ip=10.1/16 → Port 1 rB3: dst_ip=10.0/16 → rB4
rB4: tcp=80 → Port 0
PA
0
1
2
PB
PC
0
1
2
0
1
2
rC1: in_port=1 → Port 0,2 rC2: in_port=0,2 → Port 1
A B
C
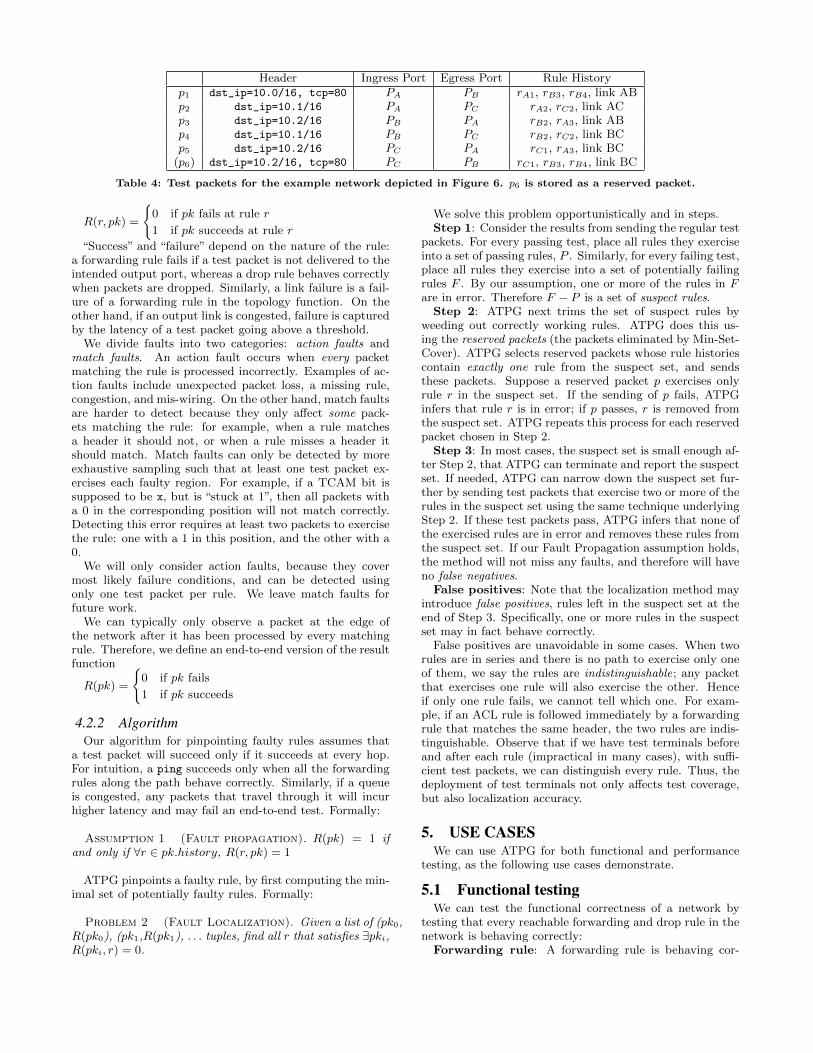
Figure 6: Example topology with three switches.
class is a set of packets that exercises the same combinationof rules. It then samples each class to choose test packets,and finally compresses the resulting set of test packets tofind the minimum covering set.
Step 1: Generate all-pairs reachability table. ATPGstarts by computing the complete set of packet headers thatcan be sent from each test terminal to every other test termi-nal. For each such header, ATPG finds the complete set ofrules it exercises along the path. To do so, ATPG applies theall-pairs reachability algorithm described in [14]: on everyterminal port, an all-x header (a header which has all wild-carded bits) is applied to the transfer function of the firstswitch connected to each test terminal. Header constraintsare applied here. For example, if traffic can only be senton VLAN A, then instead of starting with an all-x header,the VLAN tag bits are set to A. As each packet pk traversesthe network using the network function, the set of rules thatmatch pk are recorded in pk.history. Doing this for all pairsof terminal ports generates an all-pairs reachability table asshown in Table 3. For each row, the header column is a wild-card expression representing the equivalent class of packetsthat can reach an egress terminal from an ingress test termi-nal. All packets matching this class of headers will encounterthe set of switch rules shown in the Rule History column.
Header Ingress Port Egress Port Rule Historyh1 p11 p12 [r11, r12, . . .]h2 p21 p22 [r21, r22, . . .]... ... ... ...hn pn1 pn2 [rn1, rn2, . . .]
Table 3: All-pairs reachability table: all possible headersfrom every terminal to every other terminal, along withthe rules they exercise.
Figure 6 shows a simple example network and Table 4 isthe corresponding all-pairs reachability table. For example,an all-x test packet injected at PA will pass through switchA. A forwards packets with dst ip = 10.0/16 to B andthose with dst ip = 10.1/16 to C. B then forwards dst ip =10.0/16, tcp = 80 to PB , and switch C forwards dst ip =10.1/16 to PC . These are reflected in the first two rows ofTable 4.
Step 2: Sampling. Next, ATPG picks at least one testpacket in an equivalence class to exercise every (reachable)rule. The simplest scheme is to randomly pick one packet per
class. This scheme only detects faults for which all packetscovered by the same rule experience the same fault (e.g. alink failure). At the other extreme, if we wish to detect faultsspecific to a header, then we need to select every header inevery class. We discuss these issues and our fault model inSection 4.2.
Step 3: Compression. Several of the test packets pickedin Step 2 exercise the same rule. ATPG therefore selects aminimum subset of the packets chosen in Step 2 such thatthe union of their rule histories cover all rules. The covercan be chosen to cover all links (for liveness only) or allrouter queues (for performance only). This is the classi-cal Min-Set-Cover problem. While NP-Complete, a greedyO(N2) algorithm provides a good approximation, where Nis the number of test packets. We call the resulting (ap-proximately) minimum set of packets, the regular test pack-ets. The remaining test packets not picked for the mini-mum set are called the reserved test packets. In Table 4,{p1, p2, p3, p4, p5} are regular test packets and {p6} is a re-served test packet. Reserved test packets are useful for faultlocalization (Section 4.2).
4.1.2 PropertiesThe TPS algorithm has the following useful properties:
Property 1 (Coverage). The set of test packets ex-ercise all reachable rules and respect all port and header con-straints.
Proof Sketch: Define a rule to be reachable if it canbe exercised by at least one packet satisfying the headerconstraint, and can be received by at least one test terminal.A reachable rule must be in the all-pairs reachability table;thus set cover will pick at least one packet that exercises thisrule. Some rules are not reachable: for example, an IP prefixmay be made unreachable by a set of more specific prefixeseither deliberately (to provide backup) or accidentally (dueto misconfiguration).
Property 2 (Near-Optimality). The set of test pack-ets selected by TPS is optimal within logarithmic factorsamong all tests giving complete coverage.
Proof Sketch: This follows from the logarithmic (in thesize of the set) approximation factor inherent in Greedy SetCover.
Property 3 (Polynomial Runtime). The complexityof finding test packets is O(TDR2) where T is the numberof test terminals, D is the network diameter, and R is theaverage number of rules in each switch.
Proof Sketch: The complexity of computing reachabilityfrom one input port is O(DR2) [14], and this computationis repeated for each test terminal.
4.2 Fault LocalizationATPG periodically sends a set of test packets. If test
packets fail, ATPG pinpoints the fault(s) that caused theproblem.
4.2.1 Fault modelA rule fails if its observed behavior differs from its ex-
pected behavior. ATPG keeps track of where rules fail us-ing a result function R. For a rule r, the result function isdefined as
245
Header Ingress Port Egress Port Rule Historyp1 dst_ip=10.0/16, tcp=80 PA PB rA1, rB3, rB4, link ABp2 dst_ip=10.1/16 PA PC rA2, rC2, link ACp3 dst_ip=10.2/16 PB PA rB2, rA3, link ABp4 dst_ip=10.1/16 PB PC rB2, rC2, link BCp5 dst_ip=10.2/16 PC PA rC1, rA3, link BC
(p6) dst_ip=10.2/16, tcp=80 PC PB rC1, rB3, rB4, link BC
Table 4: Test packets for the example network depicted in Figure 6. p6 is stored as a reserved packet.
R(r, pk) =
{0 if pk fails at rule r
1 if pk succeeds at rule r
“Success” and “failure” depend on the nature of the rule:a forwarding rule fails if a test packet is not delivered to theintended output port, whereas a drop rule behaves correctlywhen packets are dropped. Similarly, a link failure is a fail-ure of a forwarding rule in the topology function. On theother hand, if an output link is congested, failure is capturedby the latency of a test packet going above a threshold.
We divide faults into two categories: action faults andmatch faults. An action fault occurs when every packetmatching the rule is processed incorrectly. Examples of ac-tion faults include unexpected packet loss, a missing rule,congestion, and mis-wiring. On the other hand, match faultsare harder to detect because they only affect some pack-ets matching the rule: for example, when a rule matchesa header it should not, or when a rule misses a header itshould match. Match faults can only be detected by moreexhaustive sampling such that at least one test packet ex-ercises each faulty region. For example, if a TCAM bit issupposed to be x, but is “stuck at 1”, then all packets witha 0 in the corresponding position will not match correctly.Detecting this error requires at least two packets to exercisethe rule: one with a 1 in this position, and the other with a0.
We will only consider action faults, because they covermost likely failure conditions, and can be detected usingonly one test packet per rule. We leave match faults forfuture work.
We can typically only observe a packet at the edge ofthe network after it has been processed by every matchingrule. Therefore, we define an end-to-end version of the resultfunction
R(pk) =
{0 if pk fails
1 if pk succeeds
4.2.2 AlgorithmOur algorithm for pinpointing faulty rules assumes that
a test packet will succeed only if it succeeds at every hop.For intuition, a ping succeeds only when all the forwardingrules along the path behave correctly. Similarly, if a queueis congested, any packets that travel through it will incurhigher latency and may fail an end-to-end test. Formally:
Assumption 1 (Fault propagation). R(pk) = 1 ifand only if ∀r ∈ pk.history, R(r, pk) = 1
ATPG pinpoints a faulty rule, by first computing the min-imal set of potentially faulty rules. Formally:
Problem 2 (Fault Localization). Given a list of (pk0,R(pk0), (pk1,R(pk1), . . . tuples, find all r that satisfies ∃pki,R(pki, r) = 0.
We solve this problem opportunistically and in steps.Step 1: Consider the results from sending the regular test
packets. For every passing test, place all rules they exerciseinto a set of passing rules, P . Similarly, for every failing test,place all rules they exercise into a set of potentially failingrules F . By our assumption, one or more of the rules in Fare in error. Therefore F − P is a set of suspect rules.Step 2: ATPG next trims the set of suspect rules by
weeding out correctly working rules. ATPG does this us-ing the reserved packets (the packets eliminated by Min-Set-Cover). ATPG selects reserved packets whose rule historiescontain exactly one rule from the suspect set, and sendsthese packets. Suppose a reserved packet p exercises onlyrule r in the suspect set. If the sending of p fails, ATPGinfers that rule r is in error; if p passes, r is removed fromthe suspect set. ATPG repeats this process for each reservedpacket chosen in Step 2.
Step 3: In most cases, the suspect set is small enough af-ter Step 2, that ATPG can terminate and report the suspectset. If needed, ATPG can narrow down the suspect set fur-ther by sending test packets that exercise two or more of therules in the suspect set using the same technique underlyingStep 2. If these test packets pass, ATPG infers that none ofthe exercised rules are in error and removes these rules fromthe suspect set. If our Fault Propagation assumption holds,the method will not miss any faults, and therefore will haveno false negatives.
False positives: Note that the localization method mayintroduce false positives, rules left in the suspect set at theend of Step 3. Specifically, one or more rules in the suspectset may in fact behave correctly.
False positives are unavoidable in some cases. When tworules are in series and there is no path to exercise only oneof them, we say the rules are indistinguishable; any packetthat exercises one rule will also exercise the other. Henceif only one rule fails, we cannot tell which one. For exam-ple, if an ACL rule is followed immediately by a forwardingrule that matches the same header, the two rules are indis-tinguishable. Observe that if we have test terminals beforeand after each rule (impractical in many cases), with suffi-cient test packets, we can distinguish every rule. Thus, thedeployment of test terminals not only affects test coverage,but also localization accuracy.
5. USE CASESWe can use ATPG for both functional and performance
testing, as the following use cases demonstrate.
5.1 Functional testingWe can test the functional correctness of a network by
testing that every reachable forwarding and drop rule in thenetwork is behaving correctly:
Forwarding rule: A forwarding rule is behaving cor-
246
R1
R4
R3
R2
header=A → Drop
Header: all-x Header: A
Header: A
Header: A
Header:
Header: A \ C
A \ Bheader=B → Fwd
header=C → Fwd
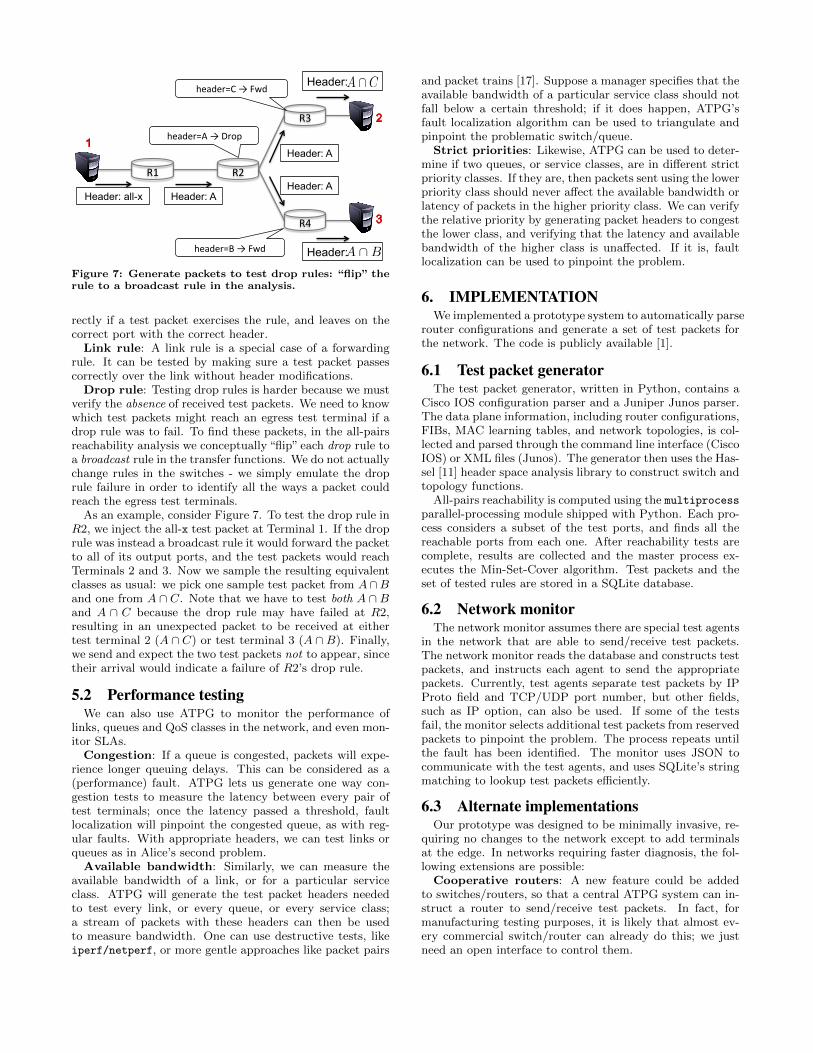
Figure 7: Generate packets to test drop rules: “flip” therule to a broadcast rule in the analysis.
rectly if a test packet exercises the rule, and leaves on thecorrect port with the correct header.
Link rule: A link rule is a special case of a forwardingrule. It can be tested by making sure a test packet passescorrectly over the link without header modifications.
Drop rule: Testing drop rules is harder because we mustverify the absence of received test packets. We need to knowwhich test packets might reach an egress test terminal if adrop rule was to fail. To find these packets, in the all-pairsreachability analysis we conceptually “flip” each drop rule toa broadcast rule in the transfer functions. We do not actuallychange rules in the switches - we simply emulate the droprule failure in order to identify all the ways a packet couldreach the egress test terminals.
As an example, consider Figure 7. To test the drop rule inR2, we inject the all-x test packet at Terminal 1. If the droprule was instead a broadcast rule it would forward the packetto all of its output ports, and the test packets would reachTerminals 2 and 3. Now we sample the resulting equivalentclasses as usual: we pick one sample test packet from A∩Band one from A ∩ C. Note that we have to test both A ∩ Band A ∩ C because the drop rule may have failed at R2,resulting in an unexpected packet to be received at eithertest terminal 2 (A ∩ C) or test terminal 3 (A ∩B). Finally,we send and expect the two test packets not to appear, sincetheir arrival would indicate a failure of R2’s drop rule.
5.2 Performance testingWe can also use ATPG to monitor the performance of
links, queues and QoS classes in the network, and even mon-itor SLAs.
Congestion: If a queue is congested, packets will expe-rience longer queuing delays. This can be considered as a(performance) fault. ATPG lets us generate one way con-gestion tests to measure the latency between every pair oftest terminals; once the latency passed a threshold, faultlocalization will pinpoint the congested queue, as with reg-ular faults. With appropriate headers, we can test links orqueues as in Alice’s second problem.
Available bandwidth: Similarly, we can measure theavailable bandwidth of a link, or for a particular serviceclass. ATPG will generate the test packet headers neededto test every link, or every queue, or every service class;a stream of packets with these headers can then be usedto measure bandwidth. One can use destructive tests, likeiperf/netperf, or more gentle approaches like packet pairs
and packet trains [17]. Suppose a manager specifies that theavailable bandwidth of a particular service class should notfall below a certain threshold; if it does happen, ATPG’sfault localization algorithm can be used to triangulate andpinpoint the problematic switch/queue.
Strict priorities: Likewise, ATPG can be used to deter-mine if two queues, or service classes, are in different strictpriority classes. If they are, then packets sent using the lowerpriority class should never affect the available bandwidth orlatency of packets in the higher priority class. We can verifythe relative priority by generating packet headers to congestthe lower class, and verifying that the latency and availablebandwidth of the higher class is unaffected. If it is, faultlocalization can be used to pinpoint the problem.
6. IMPLEMENTATIONWe implemented a prototype system to automatically parse
router configurations and generate a set of test packets forthe network. The code is publicly available [1].
6.1 Test packet generatorThe test packet generator, written in Python, contains a
Cisco IOS configuration parser and a Juniper Junos parser.The data plane information, including router configurations,FIBs, MAC learning tables, and network topologies, is col-lected and parsed through the command line interface (CiscoIOS) or XML files (Junos). The generator then uses the Has-sel [11] header space analysis library to construct switch andtopology functions.
All-pairs reachability is computed using the multiprocessparallel-processing module shipped with Python. Each pro-cess considers a subset of the test ports, and finds all thereachable ports from each one. After reachability tests arecomplete, results are collected and the master process ex-ecutes the Min-Set-Cover algorithm. Test packets and theset of tested rules are stored in a SQLite database.
6.2 Network monitorThe network monitor assumes there are special test agents
in the network that are able to send/receive test packets.The network monitor reads the database and constructs testpackets, and instructs each agent to send the appropriatepackets. Currently, test agents separate test packets by IPProto field and TCP/UDP port number, but other fields,such as IP option, can also be used. If some of the testsfail, the monitor selects additional test packets from reservedpackets to pinpoint the problem. The process repeats untilthe fault has been identified. The monitor uses JSON tocommunicate with the test agents, and uses SQLite’s stringmatching to lookup test packets efficiently.
6.3 Alternate implementationsOur prototype was designed to be minimally invasive, re-
quiring no changes to the network except to add terminalsat the edge. In networks requiring faster diagnosis, the fol-lowing extensions are possible:
Cooperative routers: A new feature could be addedto switches/routers, so that a central ATPG system can in-struct a router to send/receive test packets. In fact, formanufacturing testing purposes, it is likely that almost ev-ery commercial switch/router can already do this; we justneed an open interface to control them.
247
SDN-based testing: In a software defined network (SDN)such as OpenFlow [25], the controller could directly instructthe switch to send test packets, and to detect and forwardreceived test packets to the control plane. For performancetesting, test packets need to be time-stamped at the routers.
7. EVALUATION
7.1 Data Sets: Stanford and Internet2We evaluated our prototype system on two sets of net-
work configurations: the Stanford University backbone andthe Internet2 backbone, representing a mid-size enterprisenetwork and a nationwide backbone network respectively.
Stanford Backbone: With a population of over 15,000students, 2,000 faculty, and five /16 IPv4 subnets, Stanfordrepresents a large enterprise network. There are 14 opera-tional zone (OZ) Cisco routers connected via 10 Ethernetswitches to 2 backbone Cisco routers that in turn connectStanford to the outside world. Overall, the network hasmore than 757,000 forwarding entries and 1,500 ACL rules.Data plane configurations are collected through commandline interfaces. Stanford has made the entire configurationrule set public [1].
Internet2: Internet2 is a nationwide backbone networkwith 9 Juniper T1600 routers and 100 Gb/s interfaces, sup-porting over 66,000 institutions in United States. Thereare about 100,000 IPv4 forwarding rules. All Internet2 con-figurations and FIBs of the core routers are publicly avail-able [12], with the exception of ACL rules, which are re-moved for security concerns. Although IPv6 and MPLS en-tries are also available, we only use IPv4 rules in this paper.
7.2 Test Packet GenerationWe ran ATPG on a quad core Intel Core i7 CPU 3.2GHz
and 6GB memory using 8 threads. For a given number oftest terminals, we generated the minimum set of test pack-ets needed to test all the reachable rules in the Stanfordand Internet2 backbones. Table 5 shows the number of testpackets needed. For example, the first column tells us that ifwe attach test terminals to 10% of the ports, then all of thereachable Stanford rules (22.2% of the total) can be testedby sending 725 test packets. If every edge port can act as atest terminal, 100% of the Stanford rules can be tested bysending just 3,871 test packets. The “Time” row indicateshow long it took ATPG to run; the worst case took about anhour, the bulk of which was devoted to calculating all-pairsreachability.
To put these results into perspective, each test for theStanford backbone requires sending about 907 packets perport in the worst case. If these packets were sent over asingle 1 Gb/s link, the entire network could be tested in lessthan 1 ms, assuming each test packet is 100 bytes and notconsidering the propagation delay. Put another way, testingthe entire set of forwarding rules ten times every secondwould use less than 1% of the link bandwidth!
Similarly, all the forwarding rules in Internet2 can betested using 4,557 test packets per port in the worst case.Even if the test packets were sent over 10 Gb/s links, all theforwarding rules could be tested in less than 0.5 ms, or tentimes every second using less than 1% of the link bandwidth.
We also found that 100% link coverage (instead of rulecoverage) only needed 54 packets for Stanford and 20 for
Internet2. The table also shows the large benefit gained bycompressing the number of test packets — in most cases, thetotal number of test packets is reduced by a factor of 20-100using the minimum set cover algorithm. This compressionmay make proactive link testing (that was considered infea-sible earlier [28]) feasible for large networks.
Coverage is the ratio of the number of rules exercised tothe total number of reachable rules. Our results shows thatthe coverage grows linearly with the number of test terminalsavailable. While it is theoretically possible to optimize theplacement of test terminals to achieve higher coverage, wefind that the benefit is marginal for real data sets.
Rule structure: The reason we need so few test pack-ets is because of the structure of the rules and the routingpolicy. Most rules are part of an end-to-end route, and somultiple routers contain the same rule. Similarly, multipledevices contain the same ACL or QoS configuration becausethey are part of a network wide policy. Therefore, the num-ber of distinct regions of header space grow linearly, notexponentially, with the diameter of the network.
0.2 0.3 0.4 0.5 0.6 0.7 0.8 0.9
1
2 4 6 8 10 12 14 16
CD
F
Recurrence
Stanford
0 0.1 0.2 0.3 0.4 0.5 0.6 0.7 0.8 0.9
1
1 2 3 4 5 6 7 8 9
CD
F
Recurrence
Internet2
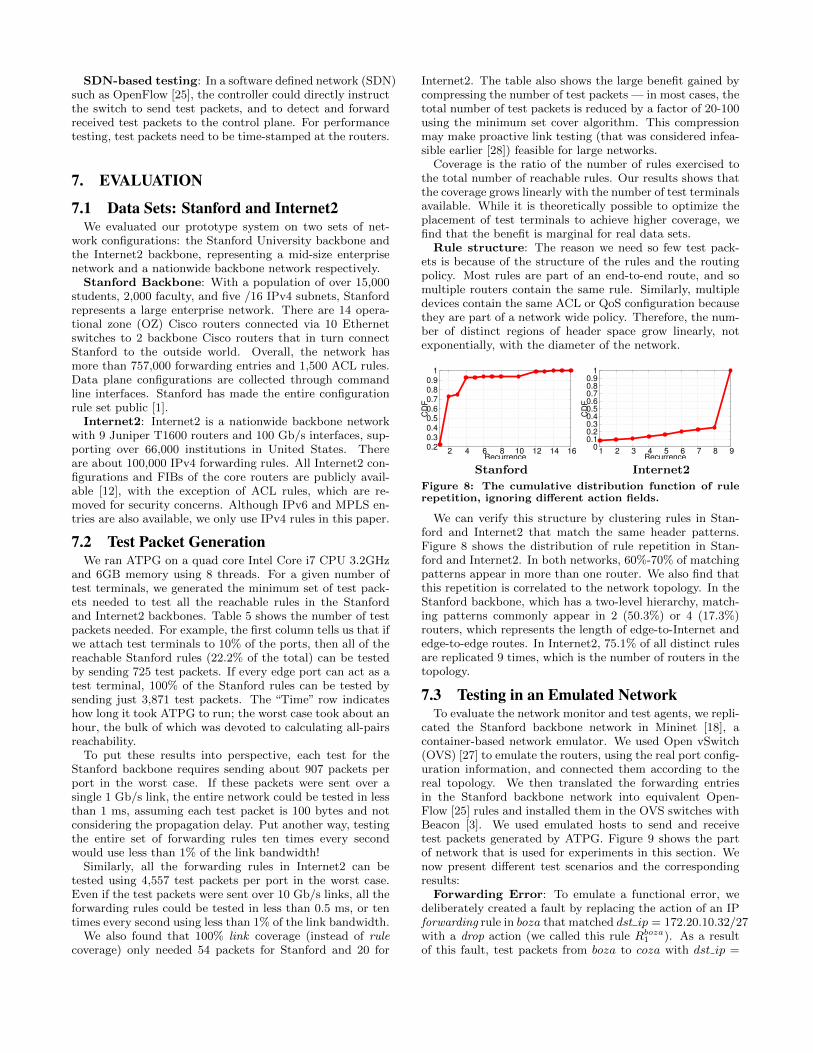
Figure 8: The cumulative distribution function of rulerepetition, ignoring different action fields.
We can verify this structure by clustering rules in Stan-ford and Internet2 that match the same header patterns.Figure 8 shows the distribution of rule repetition in Stan-ford and Internet2. In both networks, 60%-70% of matchingpatterns appear in more than one router. We also find thatthis repetition is correlated to the network topology. In theStanford backbone, which has a two-level hierarchy, match-ing patterns commonly appear in 2 (50.3%) or 4 (17.3%)routers, which represents the length of edge-to-Internet andedge-to-edge routes. In Internet2, 75.1% of all distinct rulesare replicated 9 times, which is the number of routers in thetopology.
7.3 Testing in an Emulated NetworkTo evaluate the network monitor and test agents, we repli-
cated the Stanford backbone network in Mininet [18], acontainer-based network emulator. We used Open vSwitch(OVS) [27] to emulate the routers, using the real port config-uration information, and connected them according to thereal topology. We then translated the forwarding entriesin the Stanford backbone network into equivalent Open-Flow [25] rules and installed them in the OVS switches withBeacon [3]. We used emulated hosts to send and receivetest packets generated by ATPG. Figure 9 shows the partof network that is used for experiments in this section. Wenow present different test scenarios and the correspondingresults:
Forwarding Error: To emulate a functional error, wedeliberately created a fault by replacing the action of an IPforwarding rule in boza that matched dst ip = 172.20.10.32/27with a drop action (we called this rule Rboza
1 ). As a resultof this fault, test packets from boza to coza with dst ip =
248
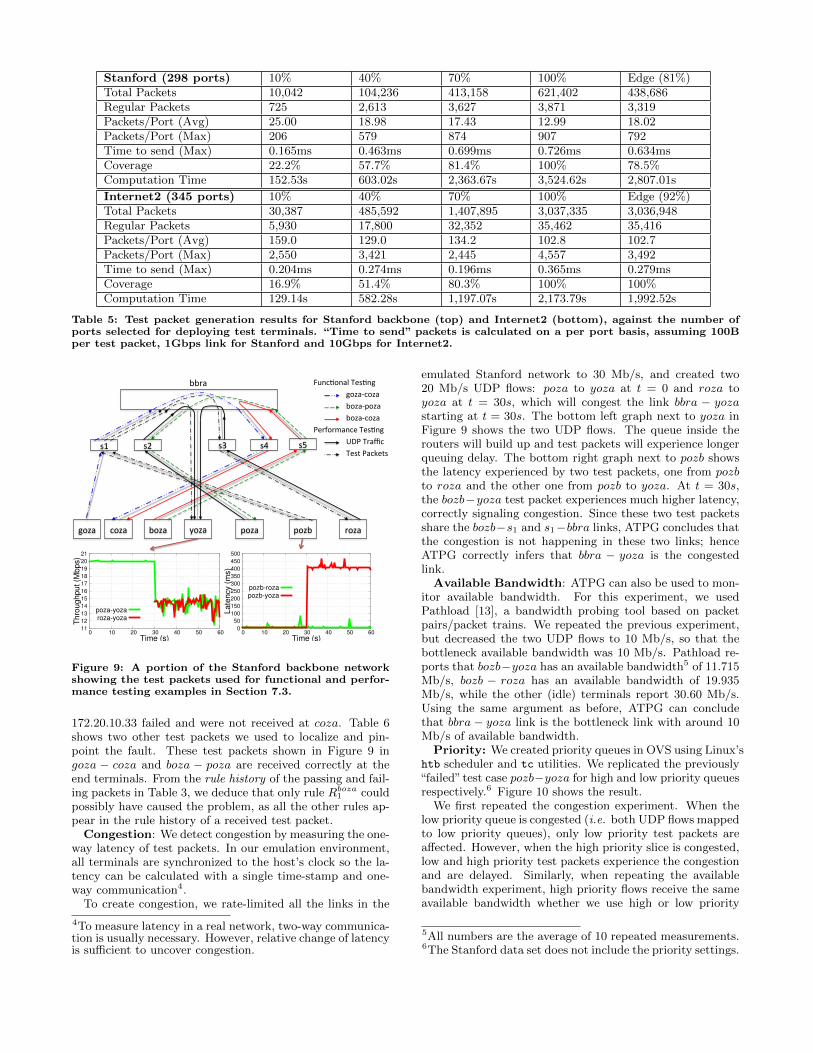
Stanford (298 ports) 10% 40% 70% 100% Edge (81%)Total Packets 10,042 104,236 413,158 621,402 438,686Regular Packets 725 2,613 3,627 3,871 3,319Packets/Port (Avg) 25.00 18.98 17.43 12.99 18.02Packets/Port (Max) 206 579 874 907 792Time to send (Max) 0.165ms 0.463ms 0.699ms 0.726ms 0.634msCoverage 22.2% 57.7% 81.4% 100% 78.5%Computation Time 152.53s 603.02s 2,363.67s 3,524.62s 2,807.01s
Internet2 (345 ports) 10% 40% 70% 100% Edge (92%)Total Packets 30,387 485,592 1,407,895 3,037,335 3,036,948Regular Packets 5,930 17,800 32,352 35,462 35,416Packets/Port (Avg) 159.0 129.0 134.2 102.8 102.7Packets/Port (Max) 2,550 3,421 2,445 4,557 3,492Time to send (Max) 0.204ms 0.274ms 0.196ms 0.365ms 0.279msCoverage 16.9% 51.4% 80.3% 100% 100%Computation Time 129.14s 582.28s 1,197.07s 2,173.79s 1,992.52s
Table 5: Test packet generation results for Stanford backbone (top) and Internet2 (bottom), against the number ofports selected for deploying test terminals. “Time to send” packets is calculated on a per port basis, assuming 100Bper test packet, 1Gbps link for Stanford and 10Gbps for Internet2.
s3 s5 s2
yoza
s4 s1
boza coza pozb poza roza goza
bbra goza-‐coza boza-‐poza boza-‐coza
Func5onal Tes5ng
Performance Tes5ng UDP Traffic Test Packets
11 12 13 14 15 16 17 18 19 20 21
0 10 20 30 40 50 60
Thro
ughp
ut (M
bps)
Time (s)
poza-yozaroza-yoza
0 50
100 150 200 250 300 350 400 450 500
0 10 20 30 40 50 60
Late
ncy
(ms)
Time (s)
pozb-rozapozb-yoza
Figure 9: A portion of the Stanford backbone networkshowing the test packets used for functional and perfor-mance testing examples in Section 7.3.
172.20.10.33 failed and were not received at coza. Table 6shows two other test packets we used to localize and pin-point the fault. These test packets shown in Figure 9 ingoza − coza and boza − poza are received correctly at theend terminals. From the rule history of the passing and fail-ing packets in Table 3, we deduce that only rule Rboza
1 couldpossibly have caused the problem, as all the other rules ap-pear in the rule history of a received test packet.
Congestion: We detect congestion by measuring the one-way latency of test packets. In our emulation environment,all terminals are synchronized to the host’s clock so the la-tency can be calculated with a single time-stamp and one-way communication4.
To create congestion, we rate-limited all the links in the
4To measure latency in a real network, two-way communica-tion is usually necessary. However, relative change of latencyis sufficient to uncover congestion.
emulated Stanford network to 30 Mb/s, and created two20 Mb/s UDP flows: poza to yoza at t = 0 and roza toyoza at t = 30s, which will congest the link bbra − yozastarting at t = 30s. The bottom left graph next to yoza inFigure 9 shows the two UDP flows. The queue inside therouters will build up and test packets will experience longerqueuing delay. The bottom right graph next to pozb showsthe latency experienced by two test packets, one from pozbto roza and the other one from pozb to yoza. At t = 30s,the bozb−yoza test packet experiences much higher latency,correctly signaling congestion. Since these two test packetsshare the bozb−s1 and s1−bbra links, ATPG concludes thatthe congestion is not happening in these two links; henceATPG correctly infers that bbra − yoza is the congestedlink.
Available Bandwidth: ATPG can also be used to mon-itor available bandwidth. For this experiment, we usedPathload [13], a bandwidth probing tool based on packetpairs/packet trains. We repeated the previous experiment,but decreased the two UDP flows to 10 Mb/s, so that thebottleneck available bandwidth was 10 Mb/s. Pathload re-ports that bozb−yoza has an available bandwidth5 of 11.715Mb/s, bozb − roza has an available bandwidth of 19.935Mb/s, while the other (idle) terminals report 30.60 Mb/s.Using the same argument as before, ATPG can concludethat bbra− yoza link is the bottleneck link with around 10Mb/s of available bandwidth.
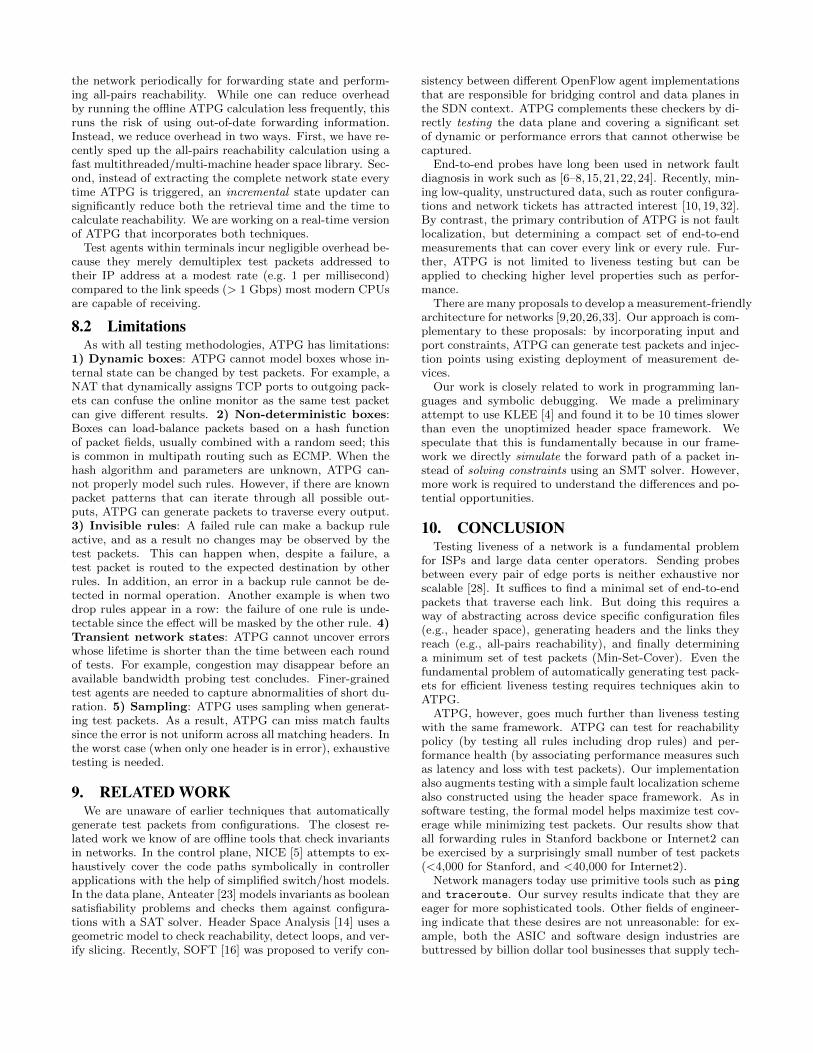
Priority: We created priority queues in OVS using Linux’shtb scheduler and tc utilities. We replicated the previously“failed”test case pozb−yoza for high and low priority queuesrespectively.6 Figure 10 shows the result.
We first repeated the congestion experiment. When thelow priority queue is congested (i.e. both UDP flows mappedto low priority queues), only low priority test packets areaffected. However, when the high priority slice is congested,low and high priority test packets experience the congestionand are delayed. Similarly, when repeating the availablebandwidth experiment, high priority flows receive the sameavailable bandwidth whether we use high or low priority
5All numbers are the average of 10 repeated measurements.6The Stanford data set does not include the priority settings.
249
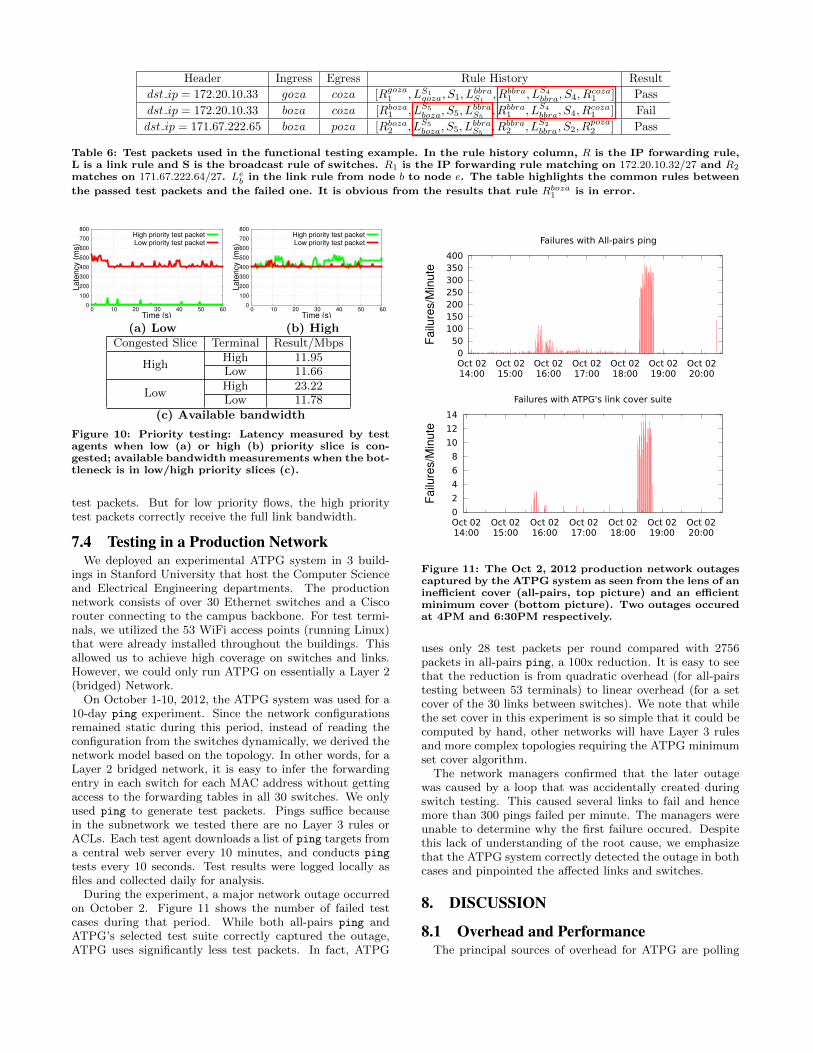
Table 6: Test packets used in the functional testing example. In the rule history column, R is the IP forwarding rule,L is a link rule and S is the broadcast rule of switches. R1 is the IP forwarding rule matching on 172.20.10.32/27 and R2
matches on 171.67.222.64/27. Leb in the link rule from node b to node e. The table highlights the common rules between
the passed test packets and the failed one. It is obvious from the results that rule Rboza1 is in error.
0
100
200
300
400
500
600
700
800
0 10 20 30 40 50 60
Late
ncy
(ms)
Time (s)
High priority test packetLow priority test packet
(a) Low
0
100
200
300
400
500
600
700
800
0 10 20 30 40 50 60
Late
ncy
(ms)
Time (s)
High priority test packetLow priority test packet
(b) HighCongested Slice Terminal Result/Mbps
HighHigh 11.95Low 11.66
LowHigh 23.22Low 11.78
(c) Available bandwidth
Figure 10: Priority testing: Latency measured by testagents when low (a) or high (b) priority slice is con-gested; available bandwidth measurements when the bot-tleneck is in low/high priority slices (c).
test packets. But for low priority flows, the high prioritytest packets correctly receive the full link bandwidth.
7.4 Testing in a Production NetworkWe deployed an experimental ATPG system in 3 build-
ings in Stanford University that host the Computer Scienceand Electrical Engineering departments. The productionnetwork consists of over 30 Ethernet switches and a Ciscorouter connecting to the campus backbone. For test termi-nals, we utilized the 53 WiFi access points (running Linux)that were already installed throughout the buildings. Thisallowed us to achieve high coverage on switches and links.However, we could only run ATPG on essentially a Layer 2(bridged) Network.
On October 1-10, 2012, the ATPG system was used for a10-day ping experiment. Since the network configurationsremained static during this period, instead of reading theconfiguration from the switches dynamically, we derived thenetwork model based on the topology. In other words, for aLayer 2 bridged network, it is easy to infer the forwardingentry in each switch for each MAC address without gettingaccess to the forwarding tables in all 30 switches. We onlyused ping to generate test packets. Pings suffice becausein the subnetwork we tested there are no Layer 3 rules orACLs. Each test agent downloads a list of ping targets froma central web server every 10 minutes, and conducts ping
tests every 10 seconds. Test results were logged locally asfiles and collected daily for analysis.
During the experiment, a major network outage occurredon October 2. Figure 11 shows the number of failed testcases during that period. While both all-pairs ping andATPG’s selected test suite correctly captured the outage,ATPG uses significantly less test packets. In fact, ATPG
0 50
100 150 200 250 300 350 400
Oct 0214:00
Oct 0215:00
Oct 0216:00
Oct 0217:00
Oct 0218:00
Oct 0219:00
Oct 0220:00
Failu
res/
Min
ute
0
2
4
6
8
10
12
14
Oct 0214:00
Oct 0215:00
Oct 0216:00
Oct 0217:00
Oct 0218:00
Oct 0219:00
Oct 0220:00
Failu
res/
Min
ute
Failures with ATPG's link cover suite
Failures with All-pairs ping
Figure 11: The Oct 2, 2012 production network outagescaptured by the ATPG system as seen from the lens of aninefficient cover (all-pairs, top picture) and an efficientminimum cover (bottom picture). Two outages occuredat 4PM and 6:30PM respectively.
uses only 28 test packets per round compared with 2756packets in all-pairs ping, a 100x reduction. It is easy to seethat the reduction is from quadratic overhead (for all-pairstesting between 53 terminals) to linear overhead (for a setcover of the 30 links between switches). We note that whilethe set cover in this experiment is so simple that it could becomputed by hand, other networks will have Layer 3 rulesand more complex topologies requiring the ATPG minimumset cover algorithm.
The network managers confirmed that the later outagewas caused by a loop that was accidentally created duringswitch testing. This caused several links to fail and hencemore than 300 pings failed per minute. The managers wereunable to determine why the first failure occured. Despitethis lack of understanding of the root cause, we emphasizethat the ATPG system correctly detected the outage in bothcases and pinpointed the affected links and switches.
8. DISCUSSION
8.1 Overhead and PerformanceThe principal sources of overhead for ATPG are polling
250
the network periodically for forwarding state and perform-ing all-pairs reachability. While one can reduce overheadby running the offline ATPG calculation less frequently, thisruns the risk of using out-of-date forwarding information.Instead, we reduce overhead in two ways. First, we have re-cently sped up the all-pairs reachability calculation using afast multithreaded/multi-machine header space library. Sec-ond, instead of extracting the complete network state everytime ATPG is triggered, an incremental state updater cansignificantly reduce both the retrieval time and the time tocalculate reachability. We are working on a real-time versionof ATPG that incorporates both techniques.
Test agents within terminals incur negligible overhead be-cause they merely demultiplex test packets addressed totheir IP address at a modest rate (e.g. 1 per millisecond)compared to the link speeds (> 1 Gbps) most modern CPUsare capable of receiving.
8.2 LimitationsAs with all testing methodologies, ATPG has limitations:
1) Dynamic boxes: ATPG cannot model boxes whose in-ternal state can be changed by test packets. For example, aNAT that dynamically assigns TCP ports to outgoing pack-ets can confuse the online monitor as the same test packetcan give different results. 2) Non-deterministic boxes:Boxes can load-balance packets based on a hash functionof packet fields, usually combined with a random seed; thisis common in multipath routing such as ECMP. When thehash algorithm and parameters are unknown, ATPG can-not properly model such rules. However, if there are knownpacket patterns that can iterate through all possible out-puts, ATPG can generate packets to traverse every output.3) Invisible rules: A failed rule can make a backup ruleactive, and as a result no changes may be observed by thetest packets. This can happen when, despite a failure, atest packet is routed to the expected destination by otherrules. In addition, an error in a backup rule cannot be de-tected in normal operation. Another example is when twodrop rules appear in a row: the failure of one rule is unde-tectable since the effect will be masked by the other rule. 4)Transient network states: ATPG cannot uncover errorswhose lifetime is shorter than the time between each roundof tests. For example, congestion may disappear before anavailable bandwidth probing test concludes. Finer-grainedtest agents are needed to capture abnormalities of short du-ration. 5) Sampling: ATPG uses sampling when generat-ing test packets. As a result, ATPG can miss match faultssince the error is not uniform across all matching headers. Inthe worst case (when only one header is in error), exhaustivetesting is needed.
9. RELATED WORKWe are unaware of earlier techniques that automatically
generate test packets from configurations. The closest re-lated work we know of are offline tools that check invariantsin networks. In the control plane, NICE [5] attempts to ex-haustively cover the code paths symbolically in controllerapplications with the help of simplified switch/host models.In the data plane, Anteater [23] models invariants as booleansatisfiability problems and checks them against configura-tions with a SAT solver. Header Space Analysis [14] uses ageometric model to check reachability, detect loops, and ver-ify slicing. Recently, SOFT [16] was proposed to verify con-
sistency between different OpenFlow agent implementationsthat are responsible for bridging control and data planes inthe SDN context. ATPG complements these checkers by di-rectly testing the data plane and covering a significant setof dynamic or performance errors that cannot otherwise becaptured.
End-to-end probes have long been used in network faultdiagnosis in work such as [6–8,15,21,22,24]. Recently, min-ing low-quality, unstructured data, such as router configura-tions and network tickets has attracted interest [10, 19, 32].By contrast, the primary contribution of ATPG is not faultlocalization, but determining a compact set of end-to-endmeasurements that can cover every link or every rule. Fur-ther, ATPG is not limited to liveness testing but can beapplied to checking higher level properties such as perfor-mance.
There are many proposals to develop a measurement-friendlyarchitecture for networks [9,20,26,33]. Our approach is com-plementary to these proposals: by incorporating input andport constraints, ATPG can generate test packets and injec-tion points using existing deployment of measurement de-vices.
Our work is closely related to work in programming lan-guages and symbolic debugging. We made a preliminaryattempt to use KLEE [4] and found it to be 10 times slowerthan even the unoptimized header space framework. Wespeculate that this is fundamentally because in our frame-work we directly simulate the forward path of a packet in-stead of solving constraints using an SMT solver. However,more work is required to understand the differences and po-tential opportunities.
10. CONCLUSIONTesting liveness of a network is a fundamental problem
for ISPs and large data center operators. Sending probesbetween every pair of edge ports is neither exhaustive norscalable [28]. It suffices to find a minimal set of end-to-endpackets that traverse each link. But doing this requires away of abstracting across device specific configuration files(e.g., header space), generating headers and the links theyreach (e.g., all-pairs reachability), and finally determininga minimum set of test packets (Min-Set-Cover). Even thefundamental problem of automatically generating test pack-ets for efficient liveness testing requires techniques akin toATPG.
ATPG, however, goes much further than liveness testingwith the same framework. ATPG can test for reachabilitypolicy (by testing all rules including drop rules) and per-formance health (by associating performance measures suchas latency and loss with test packets). Our implementationalso augments testing with a simple fault localization schemealso constructed using the header space framework. As insoftware testing, the formal model helps maximize test cov-erage while minimizing test packets. Our results show thatall forwarding rules in Stanford backbone or Internet2 canbe exercised by a surprisingly small number of test packets(<4,000 for Stanford, and <40,000 for Internet2).
Network managers today use primitive tools such as pingand traceroute. Our survey results indicate that they areeager for more sophisticated tools. Other fields of engineer-ing indicate that these desires are not unreasonable: for ex-ample, both the ASIC and software design industries arebuttressed by billion dollar tool businesses that supply tech-
251
niques for both static (e.g., design rule) and dynamic (e.g.,timing) verification. In fact, many months after we built andnamed our system, we discovered to our surprise that ATPGwas a well-known acronym in hardware chip testing, whereit stands for Automatic Test Pattern Generation [2]. Wehope network ATPG will be equally useful for automateddynamic testing of production networks.
11. ACKNOWLEDGEMENTWe would like to thank our shepherd, Dejan Kostic, and
the anonymous reviewers for their valuable comments. Wethank Johan van Reijendam, Charles M. Orgish, Joe Little(Stanford University) and Thomas C. Knoeller, MatthewP. Davy (Internet2) for providing router configuration setsand sharing their operation experience. This research wasfunded by NSF grants CNS-0832820, CNS-0855268, CNS-1040593, and Stanford Graduate Fellowship.
12. REFERENCES[1] ATPG code repository.
http://eastzone.github.com/atpg/.
[2] Automatic Test Pattern Generation. http://en.wikipedia.org/wiki/Automatic_test_pattern_generation.
[3] Beacon. http://www.beaconcontroller.net/.[4] C. Cadar, D. Dunbar, and D. Engler. Klee: unassisted and
automatic generation of high-coverage tests for complexsystems programs. In Proceedings of OSDI’08, pages209–224, Berkeley, CA, USA, 2008. USENIX Association.
[5] M. Canini, D. Venzano, P. Peresini, D. Kostic, andJ. Rexford. A NICE way to test openflow applications.Proceedings of NSDI’12, 2012.
[6] A. Dhamdhere, R. Teixeira, C. Dovrolis, and C. Diot.Netdiagnoser: troubleshooting network unreachabilitiesusing end-to-end probes and routing data. In Proceedings ofthe 2007 ACM CoNEXT conference, pages 18:1–18:12,New York, NY, USA, 2007. ACM.
[7] N. Duffield. Network tomography of binary networkperformance characteristics. IEEE Transactions onInformation Theory, 52(12):5373 –5388, dec. 2006.
[8] N. Duffield, F. Lo Presti, V. Paxson, and D. Towsley.Inferring link loss using striped unicast probes. InProceedings IEEE INFOCOM 2001, volume 2, pages 915–923 vol.2, 2001.
[9] N. G. Duffield and M. Grossglauser. Trajectory samplingfor direct traffic observation. IEEE/ACM Trans. Netw.,9(3):280–292, June 2001.
[10] P. Gill, N. Jain, and N. Nagappan. Understanding networkfailures in data centers: measurement, analysis, andimplications. In Proceedings of the ACM SIGCOMM 2011conference, pages 350–361, New York, NY, USA, 2011.ACM.
[11] Hassel, the header space library.https://bitbucket.org/peymank/hassel-public/.
[12] The Internet2 Observatory Data Collections.http://www.internet2.edu/observatory/archive/data-collections.html.
[13] M. Jain and C. Dovrolis. End-to-end available bandwidth:measurement methodology, dynamics, and relation with tcpthroughput. IEEE/ACM Trans. Netw., 11(4):537–549,Aug. 2003.
[14] P. Kazemian, G. Varghese, and N. McKeown. Header SpaceAnalysis: static checking for networks. Proceedings ofNSDI’12, 2012.
[15] R. R. Kompella, J. Yates, A. Greenberg, and A. C.Snoeren. Ip fault localization via risk modeling. InProceedings of NSDI’05 - Volume 2, pages 57–70, Berkeley,CA, USA, 2005. USENIX Association.
[16] M. Kuzniar, P. Peresini, M. Canini, D. Venzano, andD. Kostic. A SOFT way for openflow switch
interoperability testing. In Proceedings of the 2012 ACMCoNEXT Conference, 2012.
[17] K. Lai and M. Baker. Nettimer: a tool for measuringbottleneck link, bandwidth. In Proceedings of USITS’01 -Volume 3, pages 11–11, Berkeley, CA, USA, 2001. USENIXAssociation.
[18] B. Lantz, B. Heller, and N. McKeown. A network in alaptop: rapid prototyping for software-defined networks. InProceedings of Hotnets ’10, pages 19:1–19:6, New York,NY, USA, 2010. ACM.
[19] F. Le, S. Lee, T. Wong, H. S. Kim, and D. Newcomb.Detecting network-wide and router-specificmisconfigurations through data mining. IEEE/ACM Trans.Netw., 17(1):66–79, Feb. 2009.
[20] H. V. Madhyastha, T. Isdal, M. Piatek, C. Dixon,T. Anderson, A. Krishnamurthy, and A. Venkataramani.iplane: an information plane for distributed services. InProceedings of OSDI’06, pages 367–380, Berkeley, CA,USA, 2006. USENIX Association.
[21] A. Mahimkar, Z. Ge, J. Wang, J. Yates, Y. Zhang,J. Emmons, B. Huntley, and M. Stockert. Rapid detectionof maintenance induced changes in service performance. InProceedings of the 2011 ACM CoNEXT Conference, pages13:1–13:12, New York, NY, USA, 2011. ACM.
[22] A. Mahimkar, J. Yates, Y. Zhang, A. Shaikh, J. Wang,Z. Ge, and C. T. Ee. Troubleshooting chronic conditions inlarge ip networks. In Proceedings of the 2008 ACMCoNEXT Conference, pages 2:1–2:12, New York, NY, USA,2008. ACM.
[23] H. Mai, A. Khurshid, R. Agarwal, M. Caesar, P. B.Godfrey, and S. T. King. Debugging the data plane withanteater. SIGCOMM Comput. Commun. Rev.,41(4):290–301, Aug. 2011.
[24] A. Markopoulou, G. Iannaccone, S. Bhattacharyya, C.-N.Chuah, Y. Ganjali, and C. Diot. Characterization offailures in an operational ip backbone network. IEEE/ACMTrans. Netw., 16(4):749–762, Aug. 2008.
[25] N. McKeown, T. Anderson, H. Balakrishnan, G. Parulkar,L. Peterson, J. Rexford, S. Shenker, and J. Turner.OpenFlow: enabling innovation in campus networks.SIGCOMM Comput. Commun. Rev., 38:69–74, March2008.
[26] OnTimeMeasure. http://ontime.oar.net/.
[27] Open vSwitch. http://openvswitch.org/.[28] All-pairs ping service for PlanetLab ceased.
http://lists.planet-lab.org/pipermail/users/2005-July/001518.html.
[29] M. Reitblatt, N. Foster, J. Rexford, C. Schlesinger, andD. Walker. Abstractions for network update. In Proceedingsof the ACM SIGCOMM 2012 conference. ACM, 2012.
[30] S. Shenker. The future of networking, and the past ofprotocols.http://opennetsummit.org/talks/shenker-tue.pdf.
[31] Troubleshooting the Network Survey. http://eastzone.github.com/atpg/docs/NetDebugSurvey.pdf.
[32] D. Turner, K. Levchenko, A. C. Snoeren, and S. Savage.California fault lines: understanding the causes and impactof network failures. SIGCOMM Comput. Commun. Rev.,41(4):–, Aug. 2010.
[33] P. Yalagandula, P. Sharma, S. Banerjee, S. Basu, and S.-J.Lee. S3: a scalable sensing service for monitoring largenetworked systems. In Proceedings of INM ’06, pages71–76, New York, NY, USA, 2006. ACM.
252