Automated Micro Solid Phase Extraction for Samples ... · Automated Micro Solid Phase Extraction...
77
FACULDADE DE FARMÁCIA DA UNIVERSIDADE DO PORTO CHARLES UNIVERSITY IN PRAGUE, FACULTY OF PHARMACY 2012/2013 Automated Micro Solid Phase Extraction for Samples Pretreatment for Direct Determination of β-Blockers in Human Serum Erasmus Program; 5th Year; February - April Tiago Filipe Assunção de Sousa nº 200802233 I NTEGRATED M ASTERS IN P HARMACEUTICAL S CIENCES
Transcript of Automated Micro Solid Phase Extraction for Samples ... · Automated Micro Solid Phase Extraction...
Automated Micro Solid Phase Extraction for Samples Pretreatment for Direct Determination of β-Blockers in Human Serum
2012/2013
i
FACULDADE DE FARMÁCIA DA UNIVERSIDADE DO PORTO
CHARLES UNIVERSITY IN PRAGUE, FACULTY OF PHARMACY
2012/2013
Automated Micro Solid Phase
Extraction for Samples
Pretreatment for Direct
Determination of β-Blockers in
Human Serum Erasmus Program; 5th Year; February - April
Tiago Filipe Assunção de Sousa nº 200802233
I N T E G R A T E D M A S T E R S I N P H A R M A C E U T I C A L S C I E N C E S
Automated Micro Solid Phase Extraction for Samples Pretreatment for Direct Determination of β-Blockers in Human Serum 2012/2013
0
Declaration of integrity
I, Tiago Filipe Assunção de Sousa, student no. 200802233 of the Integrated Masters in
Pharmaceutical Sciences of Faculty of Pharmacy of University of Porto declare that I
acted with full integrity in the accomplishment of this report. To the best of my
knowledge and belief, this report is my own work, all sources have been properly
acknowledged, and it contains no plagiarism.
Hradec Králové, 2nd May 2013
Automated Micro Solid Phase Extraction for Samples Pretreatment for Direct Determination of β-Blockers in Human Serum
2012/2013
i
Signatures
Erasmus supervisor:
(Prof. Dr.a Hana Sklenárová)
Professor responsibility for the mobility:
(Prof. Dr.a Maria da Conceição Branco da Silva)
Automated Micro Solid Phase Extraction for Samples Pretreatment for Direct Determination of β-Blockers in Human Serum
2012/2013
ii
Acknowledgments
It is a great pleasure for me to acknowledge the assistance and contributions of
many individuals in making my Erasmus program to stay at Charles University a
success.
I would like to express my very great appreciation to Prof. Dr.a Hana
Sklenarova, for her good competencies, support, valuable and constructive
suggestions during the planning and development of this research work. Her
willingness to give her time so generously has been very much appreciated. Without
her guidance and support, this project cannot be completed.
I am particularly indebted to Dr.a Warunya Boonjob for her advices, for her
constant faith in my lab work and feedbacks during the process in doing this project. I
deeply appreciate her helpfulness and willingness in providing the useful knowledge
and information for this study that enabled me to do this work.
It is a pleasure to express my thanks to thank my enthusiastic supervisor, Prof.
Dr.a Maria da Conceição Branco da Silva, for her assistance, advices, comments, and
spared her time to support me.
To Prof. Dr. Manuel Miró, who, with his assistance and commitment, spared his
time to help me.
To Prof. Dr.a Célia Amorim, who, with her assistance and commitment, spared
her time to help me.
To Prof. Dr. Fernando Remião for the encouragement and opportunity to fulfill
project Erasmus.
To Prof. Dr. Petr Solich, for the encouragement and opportunity to fulfill project
Erasmus.
To all colleagues of the Analytical Chemistry Laboratory, who, in any way,
helped me.
Special mention goes to ANICT (Associação
Nacional de Investigadores em Ciências e Tecnologia)
for allowing me the scholarship between November 2012
and April 2013.
I would like to thank Alexandra Felix, for English support.
I would also like to express my deep gratitude to Mariana Barbosa for her
friendship and smart recommendations.
Finally, I wish to express my sincere gratitude to my family for their
encouragement, moral and economic support.
Automated Micro Solid Phase Extraction for Samples Pretreatment for Direct Determination of β-Blockers in Human Serum
2012/2013
iii
Abstract
This work reports the development of a new fast, simple and sensitive off-line analytical
method for the simultaneous identification and quantification of β-blockers (namely,
acebutolol, labetalol, metoprolol, pindolol and propranolol) in human serum. It involves
µSPE extraction procedures prior to high-performance liquid chromatography coupled
to UV detection with a fixed wavelength at 220 nm for quantification. β-Blockers were
separated on a Chromolith high resolution, RP-18 (Merck) endcapped column (100-4.6
mm i.d.) using a gradient of acetonitrile-phosphate buffer pH 3.8 at a flow rate of 1 mL
min-1. The HPLC analysis time was 10 min per sample. A SI-BI-LOV process was used
for sample preparation. It was used SupelMIPTM β-blockers sorbent as bead and the
extraction recovery ranged between 90% and 106% for the five β-blockers in water.
The µSPE and HPLC-UV methods developed demonstrate good linearity (R2 = 0.999),
precision, selectivity and sensitivity. Calibration curves showed linearity in the ranged
from 10 µg L-1 to 1000 µg L-1 for acebutolol, labetatol and metoprolol, and from 5 µg L-1
to 500 µg L-1 for pindolol and propranolol. The limit of detection ranged from 22 to 83
µg L-1 and the limit of quantification ranged from 73 to 276 µg L-1, depending on the β-
blockers. The RSD values for intra- and interday variations studies were also good
(RSD ≤ 14.89%, except acebutolol that showed a RSD ≤ 25.91%). The application of
this method for screening of acebutolol and propranolol in human serum showed
recovery between 38 and 51 %. The proposed methodology showed limitations when it
was apply in human serum, demonstrating the need of improvements for a good
application in these samples. However, this method showed features that will allow its
application in on-line methods (direct coupling of SI-BI-LOV with HPLC).
Automated Micro Solid Phase Extraction for Samples Pretreatment for Direct Determination of β-Blockers in Human Serum
2012/2013
iv
Contents
Signatures ..................................................................................................................... i
Acknowledgments ......................................................................................................... ii
Abstract ........................................................................................................................ iii
List of Figures .............................................................................................................. vi
List of Tables ............................................................................................................... vii
List of Abbreviations ................................................................................................... viii
1. Introduction ............................................................................................................ 1
1.1. β-Blockers and its mechanism of action .......................................................... 2
1.1.1. Clinical importance .................................................................................. 4
1.1.2. Pharmacokinetics .................................................................................... 4
1.1.3. Adverse effects and precautions .............................................................. 4
1.2. Analytical methods for determination of β-blockers in biological samples ....... 5
1.3. Sample preparation techniques ...................................................................... 6
1.3.1. Solid phase extraction (SPE) ................................................................... 7
1.4. Automated and off-line SPE .......................................................................... 11
1.4.1. Sequential injection analysis .................................................................. 12
1.4.2. Sequential injection-bead injection (SI-BI) ............................................. 13
1.4.3. Sequential injection-bead injection-Lab-on-Valve (SI-BI-LOV) ............... 14
1.5. High performance liquid chromatography (HPLC) ......................................... 15
2. Aims of work ........................................................................................................ 17
3. Experimental part………………………………………………………………………..18
3.1. Chemicals and reagents ............................................................................... 18
3.2. Equipment and material ................................................................................ 19
3.3. Flow analysis set up ..................................................................................... 19
3.4. Sample pretreatment .................................................................................... 20
3.4.1. Manual SPE protocol ............................................................................. 20
3.4.2. Automatic µSPE .................................................................................... 22
3.5. HPLC analysis .............................................................................................. 25
3.6. Calibration curves ......................................................................................... 28
3.7. Analytical performance ................................................................................. 29
3.7.1. Linearity range ....................................................................................... 29
3.7.2. Limit of detection (LOD) ......................................................................... 29
3.7.3. Limit of quantification (LOQ) .................................................................. 29
3.7.4. Precision ................................................................................................ 29
Automated Micro Solid Phase Extraction for Samples Pretreatment for Direct Determination of β-Blockers in Human Serum 2012/2013
v
3.8. Serum samples preparation .......................................................................... 30
4. Results and Discussion…………………………………………………………………31
4.1. HPLC performance ....................................................................................... 31
4.2. Extraction procedure optimization ................................................................. 37
4.2.1. Selection of BI-SPE sorbent for LOV analysis ........................................ 37
4.2.2. Bead package ........................................................................................ 40
4.2.3. Effect of eluent flow rate and eluent volume .......................................... 40
4.2.4. Effect of loading sample flow rate and sample volume ........................... 44
4.3. Analytical performance ................................................................................. 47
4.3.1. Comparison between the manual SPE and SI-LOV-µSPE ..................... 47
4.3.2. Off-line method performance ................................................................. 49
4.4. Samples analyzes......................................................................................... 50
5. Conclusion ........................................................................................................... 52
6. References .......................................................................................................... 54
7. Annex .................................................................................................................. 61
Automated Micro Solid Phase Extraction for Samples Pretreatment for Direct Determination of β-Blockers in Human Serum 2012/2013
vi
List of Figures
Figure 1 – Beijing Olympic Games. ............................................................................... 1
Figure 2 - β-Blockers tested. ......................................................................................... 2
Figure 3 - Sites of action for β-blockers. ........................................................................ 3
Figure 4 - Structures that regulate the heart rate. .......................................................... 4
Figure 5 – Typical SPE cartridge format........................................................................ 7
Figure 6 - Solid Phase Extraction steps. ....................................................................... 8
Figure 7 - Schematic representation of the molecular imprinting process. ................... 10
Figure 8 – Schematic comparison of off-line and on-line SPE coupled to HPLC. ........ 12
Figure 9 – Typical manifold arrangement of sequential injection analysis system. ...... 12
Figure 10 - Schematic of a SIA system and its potential in analytical processes. ........ 13
Figure 11 – Bead injection procedure. ........................................................................ 14
Figure 12 - 8 port LOV fabricated from ULTEM. .......................................................... 15
Figure 13 – Schematic diagram of sequential injection-bead injection-Lab-on-Vale
system. ....................................................................................................................... 15
Figure 14 - High-Performance Liquid Chromatography System .................................. 16
Figure 15 – Real experimental set up of automated SI-LOV-µSPE sample preparation
unit. ............................................................................................................................. 20
Figure 16 - Schematic diagram of automated SI-LOV-µSPE sample preparation unit,
MIP. ............................................................................................................................ 22
Figure 17 - Schematic diagram of automated SI-LOV-µSPE sample preparation unit,
Oasis HLB. ................................................................................................................. 23
Figure 18 – HPLC equipment used in this work, Water 1525. ..................................... 26
Figure 19 – Chromatogram obtained to injection volume of 10 µL. HPLC conditions
were: 15% A and 85% B (0 min), 35% A and 65% B (10 min) with a constant flow rate
(1 mL min-1). ............................................................................................................... 31
Figure 20 – Comparison of the different dilutions ratio. The red line represents the best
dilution ratio (1:4). ....................................................................................................... 32
Figure 21 – 10% Acetic acid chromatogram. ............................................................... 33
Figure 22 – Bar graph with comparison of the intra and interday results. .................... 34
Figure 23 – Comparison of Oasis HLB extraction processes. ..................................... 47
Figure 24 – Comparison of SupelMIPTM extraction processes. .................................... 48
Figure 25 – Comparison of SI-LOV-µSPE processes. ................................................. 48
Figure 26 – β-Blockers calibration curves. .................................................................. 49
Automated Micro Solid Phase Extraction for Samples Pretreatment for Direct Determination of β-Blockers in Human Serum 2012/2013
vii
List of Tables
Table 1 – MISPE protocols involving extraction from biological samples. .................... 11
Table 2 – Percentages of constituents of MP for a 20 µL loop (MP 1). ........................ 26
Table 3 – Percentages of constituents of MP for a 20 µL loop (MP 2). ........................ 27
Table 4 – Percentages of constituents of MP for a 200 µL loop (MP 3). ...................... 27
Table 5 – Evaluation of the normalized area repeatability of intraday injections. ......... 35
Table 6 – Values of normalized area repeatability obtained in 7 different days. .......... 35
Table 7 – Evaluation of the repeatability of RT in intraday injections. .......................... 36
Table 8 – Evaluation of the repeatability of RT in interday injections. .......................... 36
Table 9 – Recovery values of the manual SPE protocols. ........................................... 39
Table 10 – Recovery values of the manual SPE protocols, continuation. .................... 39
Table 11 – Recovery values of the effect of the eluent volume in SI-LOV-Oasis HLB. 42
Table 12 – Recovery values of the effect of the eluent flow rate in SI-LOV-Oasis HLB.
................................................................................................................................... 42
Table 13 – Recovery values of the effect of the eluent volume in SI-LOV-SupelMIPTM.
................................................................................................................................... 43
Table 14 – Recovery values of the effect of the eluent flow rate in SI-LOV-SupelMIPTM.
................................................................................................................................... 43
Table 15 – Recovery values of the effect of the loading sample volume in SI-LOV-
Oasis HLB. ................................................................................................................. 45
Table 16 – Recovery values of the effect of the loading flow rate in SI-LOV-
SupelMIPTM. ................................................................................................................ 45
Table 17 – Recovery values of the effect of the loading sample volume in the SI-LOV-
SupelMIPTM. ................................................................................................................ 46
Table 18 – Values of intra- and interday precision for β-blockers. ............................... 50
Table 19 – Recovery values in human serum for acebutolol. ...................................... 51
Table 20 – Recovery values in human serum for propranolol. ..................................... 51
Automated Micro Solid Phase Extraction for Samples Pretreatment for Direct Determination of β-Blockers in Human Serum 2012/2013
viii
List of Abbreviations
ACE – acetylcholine;
AcN – acetonitrile;
AV – atrioventricular;
BI – bead injection;
CNS – central nervous system;
CPAC – Centre for Process Analytical Chemistry;
CVDs – cardiovascular disease;
FIA – flow injection analysis;
Epi – epinephrine;
GC – gas chromatography;
GC-MS – gas chromatography-mass spectrometry;
HAc – acetic acid;
HC – holding coil;
HDL – high-density lipoprotein;
HF-LPME – hollow-fibre liquid-phase microextraction;
HPLC – high performance liquid chromatography;
HPLC-UV – high performance liquid chromatography-ultraviolet;
HPLC-PDA – high performance liquid chromatography-photodiode array;
LC-MS – liquid chromatography-mass spectrometry;
LC-MS/MS – liquid chromatography-mass spectrometry/mass spectrometry;
LC-QTOF-MS – liquid chromatography–hybrid quadrupole time-of-flight mass
spectrometry;
LC-UV – liquid chromatography-ultraviolet;
LLE – liquid/liquid extraction;
LOD – limit of detection;
LOQ – limit of quantification;
LOV – laboratory-on-valve or lab-on-valve;
MeOH – methanol;
MIP – molecular imprinted polymer;
MISPE – molecular imprinted polymers in SPE;
MP – mobile phase;
MPV – multi-position selection valve;
NE – norepinephrine;
NSAIDs – non-steroids anti-inflammatory drugs;
Automated Micro Solid Phase Extraction for Samples Pretreatment for Direct Determination of β-Blockers in Human Serum 2012/2013
ix
PEEK – polyetheretherketone;
PNS – peripheral nervous system;
PVC – polyvinylchloride;
RAAS – renin-angiotensin-aldosterone system;
RC – reaction coil;
RSD – relative standard deviation;
RT – retention time;
RPLC-GC-UV – reverse phase liquid chromatography-gas chromatography-ultraviolet;
SI – sequential injection;
SIA – sequential injection analysis;
SI-BI – sequential injection-bead injection;
SI-BI-LOV – sequential injection-bead injection-Lab-on-Valve;
SLE – solid/liquid extraction;
SP – syringe pump;
SPE – solid phase extraction;
ULTEM – polyetherimide;
UHPLC-DAD – ultra- performance liquid chromatography
UHPLC-MS – ultra-performance liquid chromatography-mass spectrometry;
UHPLC-UV – ultra-performance liquid chromatography-ultraviolet;
WHO – World Health Organization.
Automated Micro Solid Phase Extraction for Samples Pretreatment for Direct Determination of β-Blockers in Human Serum
2012/2013
1
1. Introduction
According to WHO cardiovascular disease (CVDs) are the leading causes of
death and disability in the world. Although a large proportion of CVDs is preventable,
they continue to rise mainly because of inadequate preventive measures. It is
estimated that 17.3 million people died from CVDs in 2008, representing 30% of all
global deaths [1]. Of these deaths, an estimated 7.3 million were due to coronary heart
disease and 6.2 million were due to stroke [1]. By 2030, almost 25 million people will
die from CVDs, mainly from heart disease and stroke [1]. CVDs are projected to remain
the single leading cause of death. It is known that 7.5 million deaths reported each year
are associated with CVDs, being 13% attributed to high blood pressure [1].
To prevent these diseases, several measures should be taken such as to quit
smoking, have a healthy diet, practice some kind of exercise, and the use of specific
pharmaceutical products.
There are several categories of drugs that are used against these diseases,
however the β-blockers assume a huge relevance, as they can be used on several
cardiovascular diseases. These drugs can also be used by athletes to improve their
performance. Although they have no recognizable benefit in most sports, it is widely
acknowledged that they are beneficial to sports such as archery and shooting, because
they lower the heart rate, minimize anxiety and reduce muscle tremors.
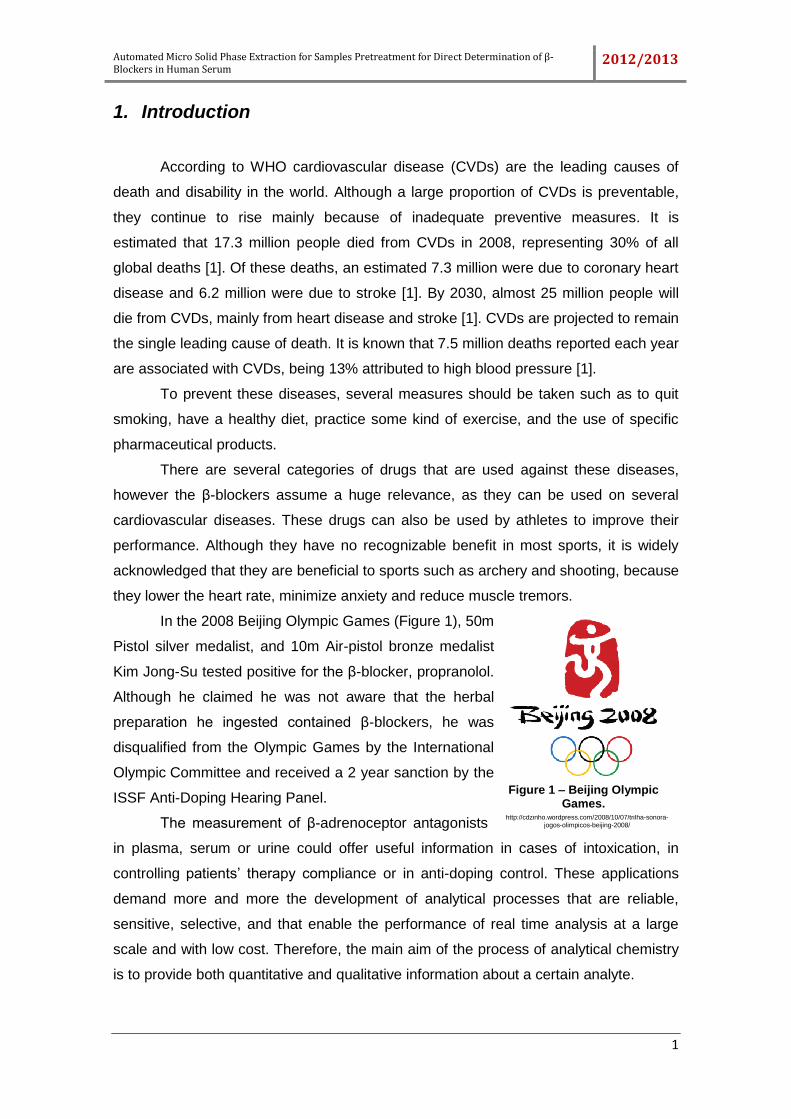
In the 2008 Beijing Olympic Games (Figure 1), 50m
Pistol silver medalist, and 10m Air-pistol bronze medalist
Kim Jong-Su tested positive for the β-blocker, propranolol.
Although he claimed he was not aware that the herbal
preparation he ingested contained β-blockers, he was
disqualified from the Olympic Games by the International
Olympic Committee and received a 2 year sanction by the
ISSF Anti-Doping Hearing Panel.
The measurement of β-adrenoceptor antagonists
in plasma, serum or urine could offer useful information in cases of intoxication, in
controlling patients’ therapy compliance or in anti-doping control. These applications
demand more and more the development of analytical processes that are reliable,
sensitive, selective, and that enable the performance of real time analysis at a large
scale and with low cost. Therefore, the main aim of the process of analytical chemistry
is to provide both quantitative and qualitative information about a certain analyte.
http://cdzinho.wordpress.com/2008/10/07/trilha-sonora-jogos-olimpicos-beijing-2008/
Figure 1 – Beijing Olympic Games.
Automated Micro Solid Phase Extraction for Samples Pretreatment for Direct Determination of β-Blockers in Human Serum 2012/2013
2
Nowadays, the automation of processes has become very important and
therefore, the flow injection analysis (FIA) and sequential injection analysis (SIA) are
techniques which are well suited for automation of traditional wet chemical methods,
growing very important for the determination of different substances in biological
samples and on getting systems that will satisfy the needs of the modern population.
In the concept of process analytical chemistry, five different ways of coupling
the analytical process with the analyzer should be distinguished. These are off-line, at-
line, on-line, in-line and non-invasive methods [2].
Therefore, this work consisted in the automation of micro solid phase extraction
for sample pretreatment for direct determination of β-blockers in human serum, based
on an off-line process. This process of pretreatment of the samples predated to HPLC
separation and quantification of β-blockers present in human serum.
1.1. β-Blockers and its mechanism of action
The antagonists of the β-adrenergic receptors are a big group of substances.
They were found in 1958, 10 years after Ahlquist had documented the existence of the
β-adrenergic receptors [3]. The first compound, the dichloroisoprenaline, had a low
potency and acted as a partial agonist [3]. The developments in science led to the
discovery of propranolol, which is an antagonist much stronger and more pure, and
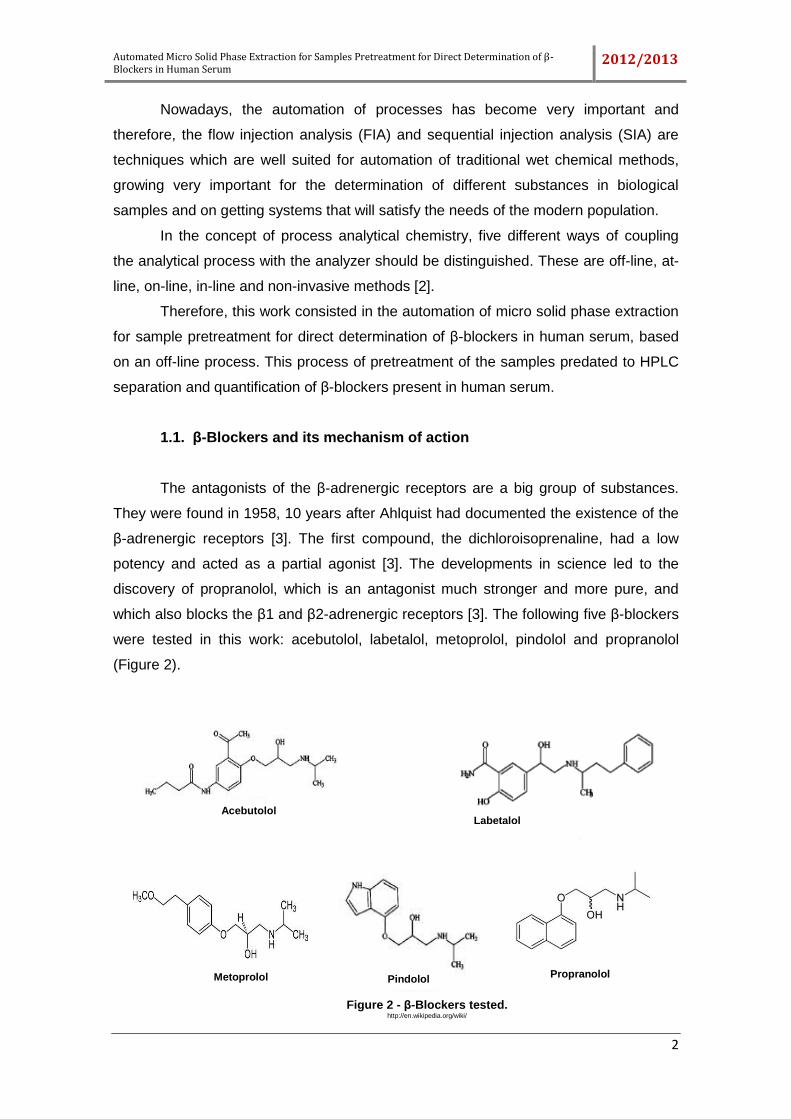
which also blocks the β1 and β2-adrenergic receptors [3]. The following five β-blockers
were tested in this work: acebutolol, labetalol, metoprolol, pindolol and propranolol
(Figure 2).
Propranolol Pindolol Metoprolol
Figure 2 - β-Blockers tested. http://en.wikipedia.org/wiki/
Labetalol Acebutolol
Automated Micro Solid Phase Extraction for Samples Pretreatment for Direct Determination of β-Blockers in Human Serum 2012/2013
3
The mechanism of action of β-blockers is heterogeneous, incompletely
understood and different for all available agents [4].
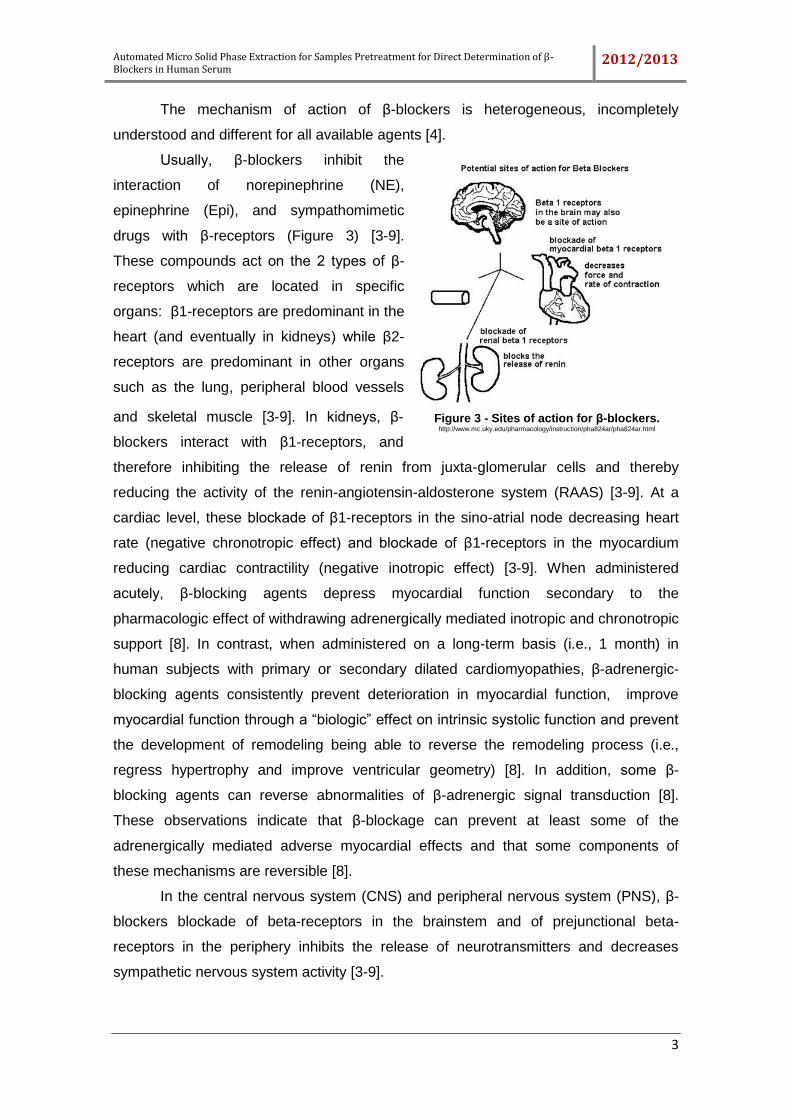
Usually, β-blockers inhibit the
interaction of norepinephrine (NE),
epinephrine (Epi), and sympathomimetic
drugs with β-receptors (Figure 3) [3-9].
These compounds act on the 2 types of β-
receptors which are located in specific
organs: β1-receptors are predominant in the
heart (and eventually in kidneys) while β2-
receptors are predominant in other organs
such as the lung, peripheral blood vessels
and skeletal muscle [3-9]. In kidneys, β-
blockers interact with β1-receptors, and
therefore inhibiting the release of renin from juxta-glomerular cells and thereby
reducing the activity of the renin-angiotensin-aldosterone system (RAAS) [3-9]. At a
cardiac level, these blockade of β1-receptors in the sino-atrial node decreasing heart
rate (negative chronotropic effect) and blockade of β1-receptors in the myocardium
reducing cardiac contractility (negative inotropic effect) [3-9]. When administered
acutely, β-blocking agents depress myocardial function secondary to the
pharmacologic effect of withdrawing adrenergically mediated inotropic and chronotropic
support [8]. In contrast, when administered on a long-term basis (i.e., 1 month) in
human subjects with primary or secondary dilated cardiomyopathies, β-adrenergic-
blocking agents consistently prevent deterioration in myocardial function, improve
myocardial function through a “biologic” effect on intrinsic systolic function and prevent
the development of remodeling being able to reverse the remodeling process (i.e.,
regress hypertrophy and improve ventricular geometry) [8]. In addition, some β-
blocking agents can reverse abnormalities of β-adrenergic signal transduction [8].
These observations indicate that β-blockage can prevent at least some of the
adrenergically mediated adverse myocardial effects and that some components of
these mechanisms are reversible [8].
In the central nervous system (CNS) and peripheral nervous system (PNS), β-
blockers blockade of beta-receptors in the brainstem and of prejunctional beta-
receptors in the periphery inhibits the release of neurotransmitters and decreases
sympathetic nervous system activity [3-9].
Figure 3 - Sites of action for β-blockers. http://www.mc.uky.edu/pharmacology/instruction/pha824ar/pha824ar.html
Automated Micro Solid Phase Extraction for Samples Pretreatment for Direct Determination of β-Blockers in Human Serum 2012/2013
4
Nowadays, β-blockers are distinguished through their physical and chemical
characteristics, as well as their biological properties [3, 5-7]. Thus, these compounds
are classified based on the following criteria: relative specificity for β1 over β2-
receptors, intrinsic sympathomimetic activity, capacity to block β-receptors, differences
in lipid solubility, capacity to induce vasodilation, and pharmacokinetic properties. β-
Adrenergic antagonists may be classified as Non-Subtype Selective (First Generation),
β1-Selective (Second Generation), and Antagonists with Additional Cardiovascular
Actions (Third Generation) [5].
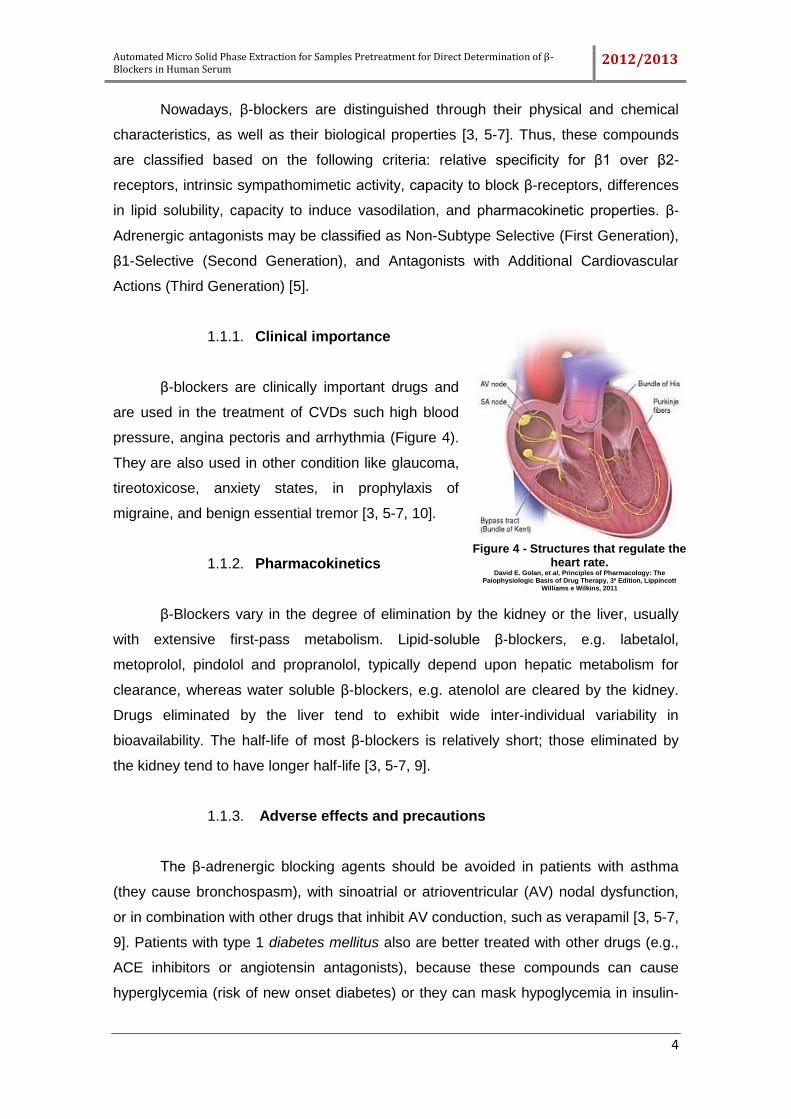
1.1.1. Clinical importance
β-blockers are clinically important drugs and
are used in the treatment of CVDs such high blood
pressure, angina pectoris and arrhythmia (Figure 4).
They are also used in other condition like glaucoma,
tireotoxicose, anxiety states, in prophylaxis of
migraine, and benign essential tremor [3, 5-7, 10].
1.1.2. Pharmacokinetics
β-Blockers vary in the degree of elimination by the kidney or the liver, usually
with extensive first-pass metabolism. Lipid-soluble β-blockers, e.g. labetalol,
metoprolol, pindolol and propranolol, typically depend upon hepatic metabolism for
clearance, whereas water soluble β-blockers, e.g. atenolol are cleared by the kidney.
Drugs eliminated by the liver tend to exhibit wide inter-individual variability in
bioavailability. The half-life of most β-blockers is relatively short; those eliminated by
the kidney tend to have longer half-life [3, 5-7, 9].
1.1.3. Adverse effects and precautions
The β-adrenergic blocking agents should be avoided in patients with asthma
(they cause bronchospasm), with sinoatrial or atrioventricular (AV) nodal dysfunction,
or in combination with other drugs that inhibit AV conduction, such as verapamil [3, 5-7,
9]. Patients with type 1 diabetes mellitus also are better treated with other drugs (e.g.,
ACE inhibitors or angiotensin antagonists), because these compounds can cause
hyperglycemia (risk of new onset diabetes) or they can mask hypoglycemia in insulin-
Figure 4 - Structures that regulate the heart rate.
David E. Golan, et al, Principles of Pharmacology: The Paiophysiologic Basis of Drug Therapy, 3ª Edition, Lippincott
Williams e Wilkins, 2011
Automated Micro Solid Phase Extraction for Samples Pretreatment for Direct Determination of β-Blockers in Human Serum 2012/2013
5
dependent diabetes because of blunting of sympathetic nervous activation [3, 5-7, 9].
These compounds increase triglycerides concentration in plasma and lower that of
high-density lipoprotein (HDL) cholesterol [5]. The long-term consequences of these
effects are unknown.
In the CNS, these compounds reduce sympathetic outflow, e.g. malaise, vivid
dreams, nightmares and, rarely, hallucinations with highly lipid soluble β-blockers which
have greater penetration into the CNS [9].
At cardiovascular level, it can occur bradycardia, impairment of myocardial
contractility, peripheral vasoconstriction due to reduced cardiac output and possibly
blockade of β2-receptors which sub serve vasodilatation in blood vessels supplying
skeletal muscle beds typically resulting in cold hands and feet, and possibly
exacerbation of Raynaud’s phenomenon [3, 5-7, 9].
Sudden discontinuation of β-blockers can produce a withdrawal syndrome that
is likely due to up-regulation of β-receptors during blockade, causing enhanced tissue
sensitivity to endogenous catecholamines; this can exacerbate the symptoms of
coronary artery disease. The result, especially in active patients, can be rebound
hypertension. Thus, β-blockers should be tapered over 10–14 days [5].
Non-steroid anti-inflammatory drugs (NSAIDs) such as indomethacin can blunt
the antihypertensive effect of propranolol and probably other β-receptor antagonists [5].
This effect may relate to inhibition of vascular synthesis of prostacyclin, as well as to
Na+ retention [5].
1.2. Analytical methods for determination of β-blockers in biological
samples
The determination of β-blockers and other drugs in biological samples has
become more and more important over the years. Therefore, there are several
investigation teams dedicated to the development and improvement of analytical
techniques that intend to identify and quantify these substances in different matrices.
Many methods used in the determination of β-blockers, show up with issues at
different levels, such as sensitivity, selectivity, robustness, speed of analysis and
suitability to real samples.
Thus, the interest in developing alternative methods that overtake the above
mentioned problems rises. In literature we find several methods applied to the dosing of
β-blockers in matrices like blood [11-13], plasma [10, 11, 14-16], urine [11, 13, 15, 17-
20] and hair [21]. The majority of the methods described are based in separation
Automated Micro Solid Phase Extraction for Samples Pretreatment for Direct Determination of β-Blockers in Human Serum 2012/2013
6
techniques, as they are developed with the purpose of simultaneously to identify and
quantify a wide range of β-blockers. As examples of these techniques, there are the
capillary electrophoresis [20, 22], LC-MS [23], LC-MS/MS [12], LC-UV [14] or LC-
QTOF-MS [21], HPLC-UV [10] or HLPC-PDA-fluorescence [16], UPLC-MS [12], UPLC-
DAD [24] or UPLC-UV [18], GC-MS [13, 17, 24] and RPLC-GC-UV [19].
Electroanalytical methods, such as potentiometry, show up [22].
The complexity of biological fluids adds a challenge for direct determination of
drugs by chromatographic analysis, therefore demanding a sample preparation step
that is often time consuming, tedious, and frequently overlooked. Techniques such as
solid phase extraction (SPE) [13, 14, 16, 18, 20, 25], solid/liquid extraction (SLE) [23],
hollow-fibre liquid-phase microextraction (HF-LPME) [17], liquid/liquid extraction (LLE)
[10, 12, 19], can be employed in this step.
Several of the presented methods need qualified operators; they involve high
costs and originate slow and boring analysis.
In this context, the present work wishes to fill in some of the presented
limitations.
1.3. Sample preparation techniques
The analytical process is comprised of several steps: field sampling, field
sample handling, laboratory sample preparation, separation and quantitation, and
statistical evaluation [26, 27]. Each one of these steps is important for obtaining
accurate results, but sample preparation is a key component of the analytical process
[26].
This stage plays an extremely important role when the analyte is present in
samples in low concentration levels or when it finds itself in very complex matrices, with
a high number of interfering agents. This is the case of most of the biological and
environmental matrices [2]. It is in this context that the main aims of sample preparation
show up: remove of potential interferents; analyte pre-concentration; converting (if
needed) the analyte into a more suitable form for detection or separation, and providing
a robust and reproducible method independent of variations in the sample matrix [28].
More recently, new aims have been set such as using smaller initial sample sizes,
improvement of selectivity in extraction, to facilitate the automation, and to minimize the
amount of glassware and organic solvents to be used [28].
The ideal method for sample preparation should involve a minimum number of
working steps, be easy to learn, be fast, more efficient, be environmentally friendly
Automated Micro Solid Phase Extraction for Samples Pretreatment for Direct Determination of β-Blockers in Human Serum 2012/2013
7
according to green chemical principles, without appreciable loss of the analytes and be
economical [2, 29, 30]. Further, as the number of samples grows high-throughput and
fully automated analytical techniques becomes required [2].
Sample preparation has been the step in the analytical procedure evaluated
most since it is considered the most difficult to implement [30].
Several extraction techniques, ranging from classic conventional liquid-liquid
extraction (LLE) and liquid-solid (Soxhlet) extraction, to more contemporary methods
based on microextraction approaches are available, however, since the end of the
twentieth century, certainly the most popular analytical extraction technique has been
solid phase extraction (SPE) [31].
1.3.1. Solid phase extraction (SPE)
The versatility of SPE allows the use of this technique for many purposes, such
as purification, trace enrichment, desalting, derivatization and class fractionation [32].
The solid phase extraction is a separation process, in which the compounds,
dissolved or hung in a liquid blend, are separated from other compounds present in the
blend according to their physical and chemical characteristics [2, 32, 33]. Several
analytical laboratories use the SPE not only to purify samples that will be analysed, but
also to pre-concentrate. The SPE can be used to isolate the important analytes from a
wide variety of complex matrices, including urine [20, 34], blood [16, 35], water [25, 36-
40], foods [40, 41], drinks [39, 42], ground [40, 43], pharmaceutical formulations [25,
36] and animal tissue [44, 45].
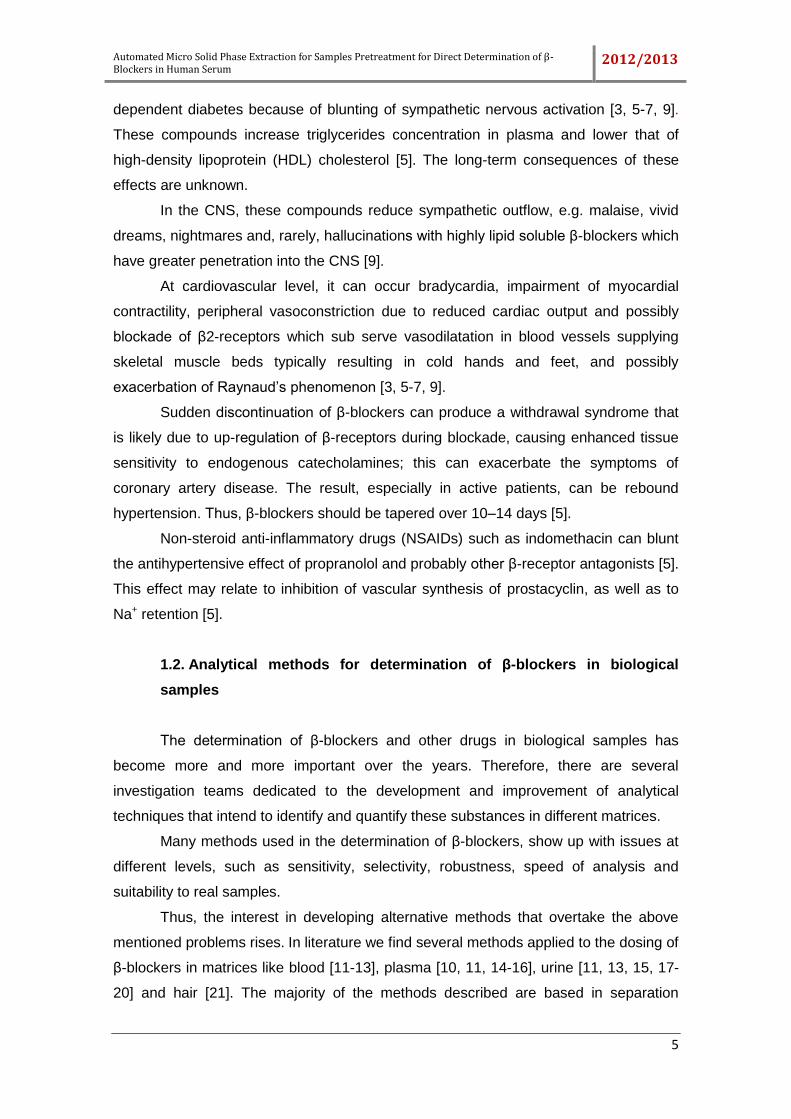
From a practical point of view, SPE in its
simplest form, can be described as a liquid
chromatography, where it is used a small open
column, called extraction cartridge, in which the
solid phase is present (correspondent of the
stationary phase in chromatography) [33]. Figure 5
shows an example of a typical extraction cartridge
in SPE. However, there are other commercialized
forms of SPE sorbents, in columns fashioned
like syringe barrels, in well plates, or in disks [2,
32, 33].
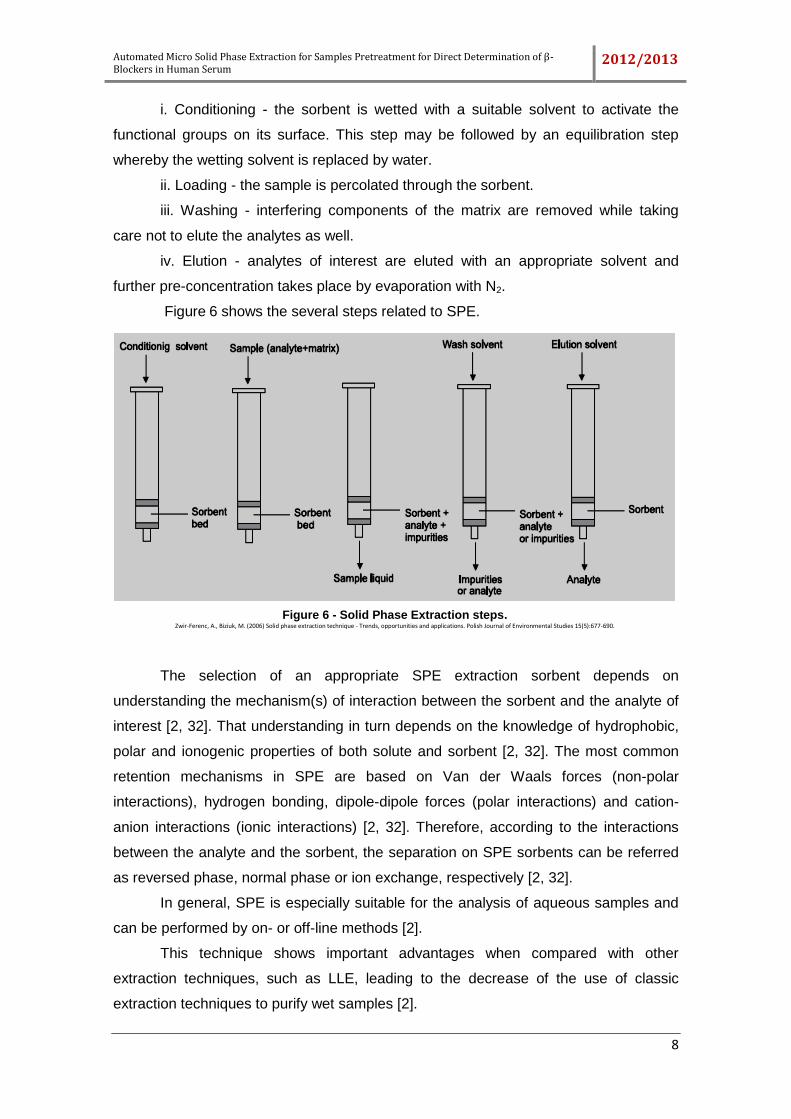
A typical SPE protocol involves four steps: conditioning, loading, washing, and
elution. These steps are defined as [2]:
Figure 5 – Typical SPE cartridge format. http://www.biotage.com/dynpage.aspx?id=35833
Automated Micro Solid Phase Extraction for Samples Pretreatment for Direct Determination of β-Blockers in Human Serum 2012/2013
8
i. Conditioning - the sorbent is wetted with a suitable solvent to activate the
functional groups on its surface. This step may be followed by an equilibration step
whereby the wetting solvent is replaced by water.
ii. Loading - the sample is percolated through the sorbent.
iii. Washing - interfering components of the matrix are removed while taking
care not to elute the analytes as well.
iv. Elution - analytes of interest are eluted with an appropriate solvent and
further pre-concentration takes place by evaporation with N2.
Figure 6 shows the several steps related to SPE.
The selection of an appropriate SPE extraction sorbent depends on
understanding the mechanism(s) of interaction between the sorbent and the analyte of
interest [2, 32]. That understanding in turn depends on the knowledge of hydrophobic,
polar and ionogenic properties of both solute and sorbent [2, 32]. The most common
retention mechanisms in SPE are based on Van der Waals forces (non-polar
interactions), hydrogen bonding, dipole-dipole forces (polar interactions) and cation-
anion interactions (ionic interactions) [2, 32]. Therefore, according to the interactions
between the analyte and the sorbent, the separation on SPE sorbents can be referred
as reversed phase, normal phase or ion exchange, respectively [2, 32].
In general, SPE is especially suitable for the analysis of aqueous samples and
can be performed by on- or off-line methods [2].
This technique shows important advantages when compared with other
extraction techniques, such as LLE, leading to the decrease of the use of classic
extraction techniques to purify wet samples [2].
Figure 6 - Solid Phase Extraction steps. Zwir-Ferenc, A., Biziuk, M. (2006) Solid phase extraction technique - Trends, opportunities and applications. Polish Journal of Environmental Studies 15(5):677-690.
Automated Micro Solid Phase Extraction for Samples Pretreatment for Direct Determination of β-Blockers in Human Serum 2012/2013
9
There are several types of sorbents present in the SPE cartridge and they can
be divided in three groups: inorganic oxides, low-specific, compound-specific and
class-specific sorbents [31, 32]. The window for new developments in the first class –
adsorptive inorganic oxides [e.g., silica, alumina and Florisil (magnesium silicate)] – is
obviously limited by the nature of such materials and the analyte-adsorbent interactions
[31]. Non-specific sorbents (individually most employed as SPE media) embrace
surface-modified silicas and porous polymers (e.g., polystyrene-divinyl-benzene resins
and carbon-based materials) [31].
A type of sorbent that is becoming increasingly important in the last few years is
called molecular imprinted polymers, which is being used to determine a wide range of
substances.
1.3.1.1. Molecular imprinted polymers in SPE (MISPE)
The concept of molecular impression was introduced by Pauling in 1940 as a
possible explanation for the generation of antibodies in living systems triggered by
antigens [31, 46].
Molecular imprinting is a rapidly developing technique for the preparation of
polymers having specific molecular recognition properties [47].
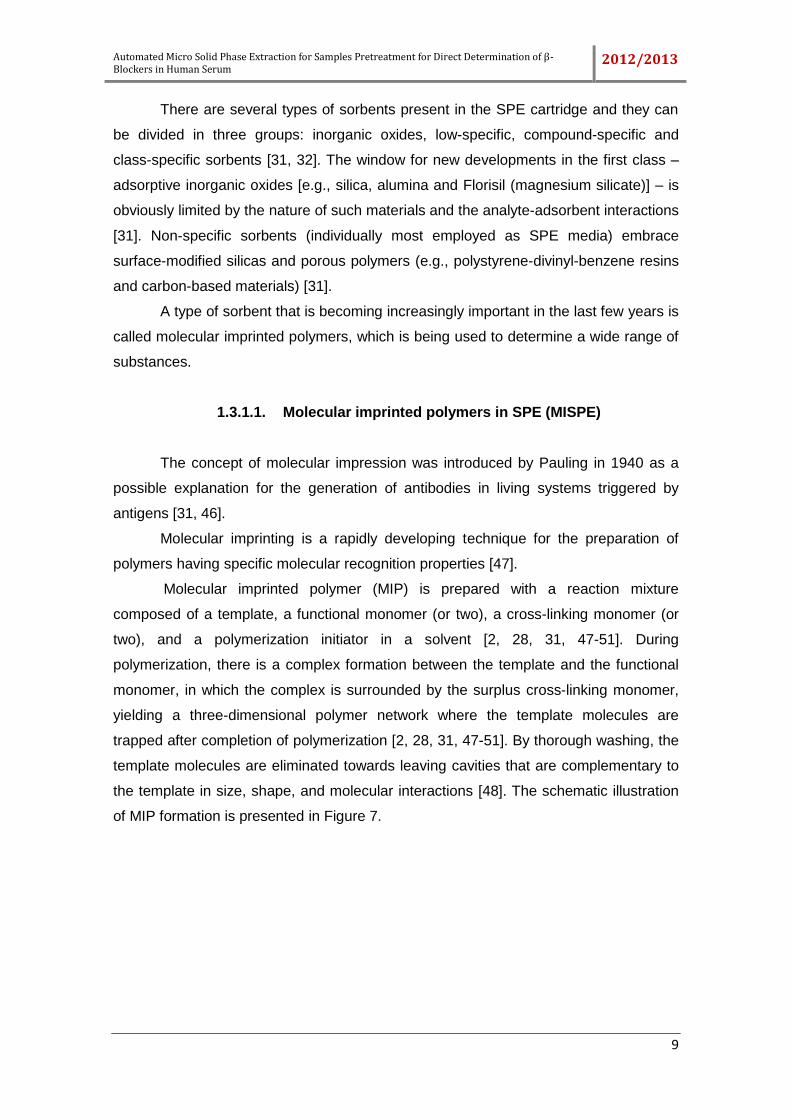
Molecular imprinted polymer (MIP) is prepared with a reaction mixture
composed of a template, a functional monomer (or two), a cross-linking monomer (or
two), and a polymerization initiator in a solvent [2, 28, 31, 47-51]. During
polymerization, there is a complex formation between the template and the functional
monomer, in which the complex is surrounded by the surplus cross-linking monomer,
yielding a three-dimensional polymer network where the template molecules are
trapped after completion of polymerization [2, 28, 31, 47-51]. By thorough washing, the
template molecules are eliminated towards leaving cavities that are complementary to
the template in size, shape, and molecular interactions [48]. The schematic illustration
of MIP formation is presented in Figure 7.
Automated Micro Solid Phase Extraction for Samples Pretreatment for Direct Determination of β-Blockers in Human Serum 2012/2013
10
Figure 7 - Schematic representation of the molecular imprinting process. Turiel, E., Martín-Esteban, A. (2010) Molecularly imprinted polymers for sample preparation: A review. Analytica Chimica Acta 668(2):87-99.
The MIPs offer the advantages of an easy, low cost, and rapid preparation, as
well as high thermal and chemical stability. However, early analytes breakthrough
might be an issue [52].
During the last few years, MIPs have appeared as new selective sorbents for
SPE of organic compounds in complex materials. The potential value of MIP–SPE lies
in the ability of selectively isolating specific compounds or their structural analogs from
a complex matrix. The application of these synthetic polymers as sorbents allows not
only pre-concentration and cleaning of the sample but also selective extraction of the
target analyte, which is important, particularly when the sample is complex and
impurities can interfere with quantification. As in conventional SPE procedures, a small
amount of imprinted polymer is packed into a cartridge [47].
SPE-MIP techniques have been extensively employed in either on-line or off-
line modes, in the formats of mini-columns, membranes, disks, knotted reactors,
renewable beads or cartridges [49]. Today there are already SPE-MIP cartridges
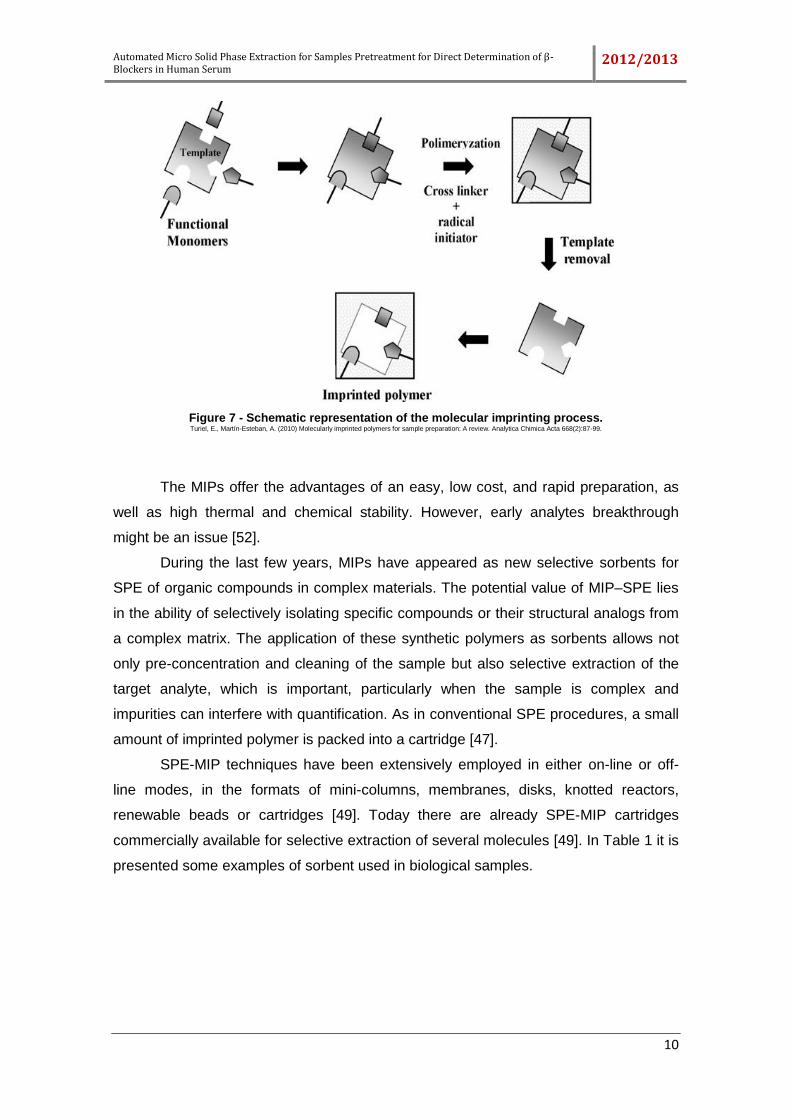
commercially available for selective extraction of several molecules [49]. In Table 1 it is
presented some examples of sorbent used in biological samples.
Automated Micro Solid Phase Extraction for Samples Pretreatment for Direct Determination of β-Blockers in Human Serum 2012/2013
11
Table 1 – MISPE protocols involving extraction from biological samples.
Beltran, A., Borrull, F., Marcé, R. M., Cormack, P. A. G. (2010) Molecularly-imprinted polymers: Useful sorbents for selective extractions. TrAC - Trends in Analytical Chemistry 29(11):1363-1375.
This combination shows as main disadvantage, the difficulty in choosing the
elution solvent, due to the high affinity observed between compounds and the sorbent,
being hardly desorptioned [2]. Regarding the above, the pH assumes extreme
importance, both in the preparation of the sample, and in the elution solvent. This last
one is essential to the interaction of the compounds with the sorbent.
1.4. Automated and off-line SPE
Nowadays, the automation of processes represents a huge progress at an
analytical level.
The off-line techniques are time consuming, because they involve preliminary
steps that precede the injection of eluate in the detection systems. However, these
techniques are flexible and can be combined with several detection systems, for
instance, gas chromatography (GC), can be used for the final analysis. On the other
hand, an important feature and advantage of on-line SPE, compared with off-line SPE,
is the direct elution of the analyte from the extraction cartridge into the detection
instrument. The time consuming off-line steps of evaporation, reconstitution, and
preparation for injection into HPLC or GC are eliminated, making on-line SPE more
efficient and fully automated (Figure 8). Since the whole volume of eluate is analyzed,
maximum sensitivity for detection is obtained [2].
Automated Micro Solid Phase Extraction for Samples Pretreatment for Direct Determination of β-Blockers in Human Serum 2012/2013
12
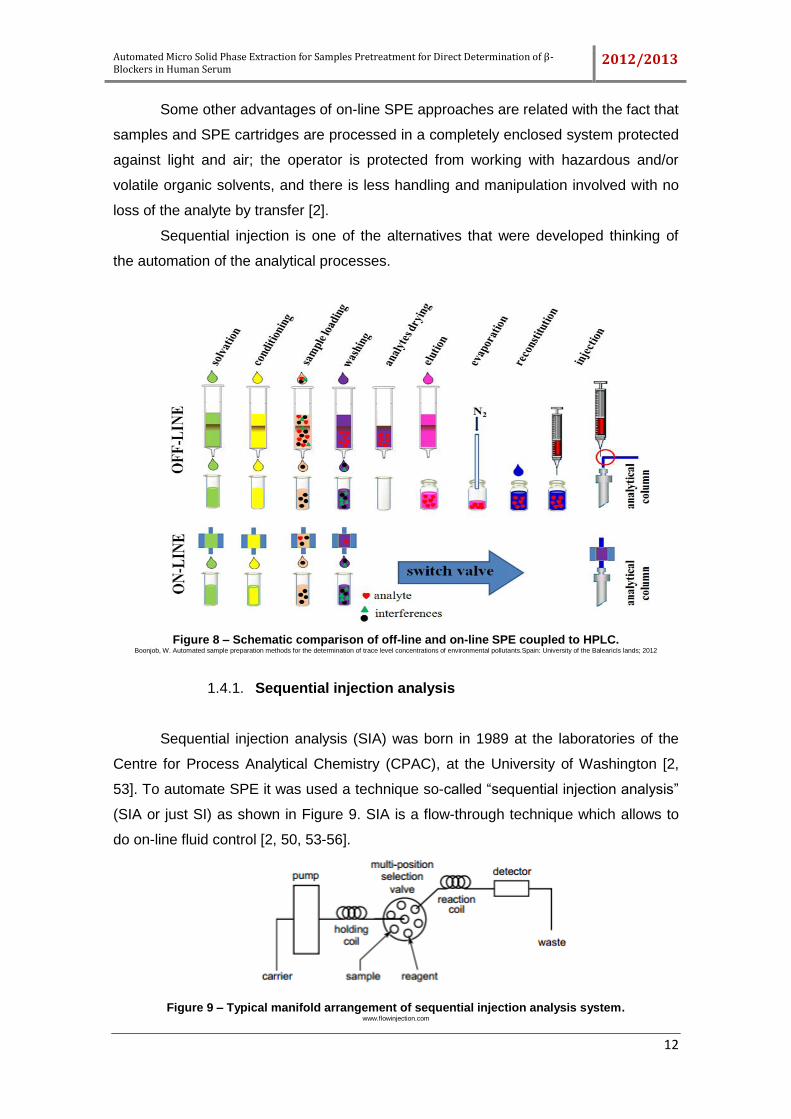
Some other advantages of on-line SPE approaches are related with the fact that
samples and SPE cartridges are processed in a completely enclosed system protected
against light and air; the operator is protected from working with hazardous and/or
volatile organic solvents, and there is less handling and manipulation involved with no
loss of the analyte by transfer [2].
Sequential injection is one of the alternatives that were developed thinking of
the automation of the analytical processes.
Figure 8 – Schematic comparison of off-line and on-line SPE coupled to HPLC. Boonjob, W. Automated sample preparation methods for the determination of trace level concentrations of environmental pollutants.Spain: University of the BalearicIs lands; 2012
1.4.1. Sequential injection analysis
Sequential injection analysis (SIA) was born in 1989 at the laboratories of the
Centre for Process Analytical Chemistry (CPAC), at the University of Washington [2,
53]. To automate SPE it was used a technique so-called “sequential injection analysis”
(SIA or just SI) as shown in Figure 9. SIA is a flow-through technique which allows to
do on-line fluid control [2, 50, 53-56].
Figure 9 – Typical manifold arrangement of sequential injection analysis system. www.flowinjection.com
Automated Micro Solid Phase Extraction for Samples Pretreatment for Direct Determination of β-Blockers in Human Serum 2012/2013
13
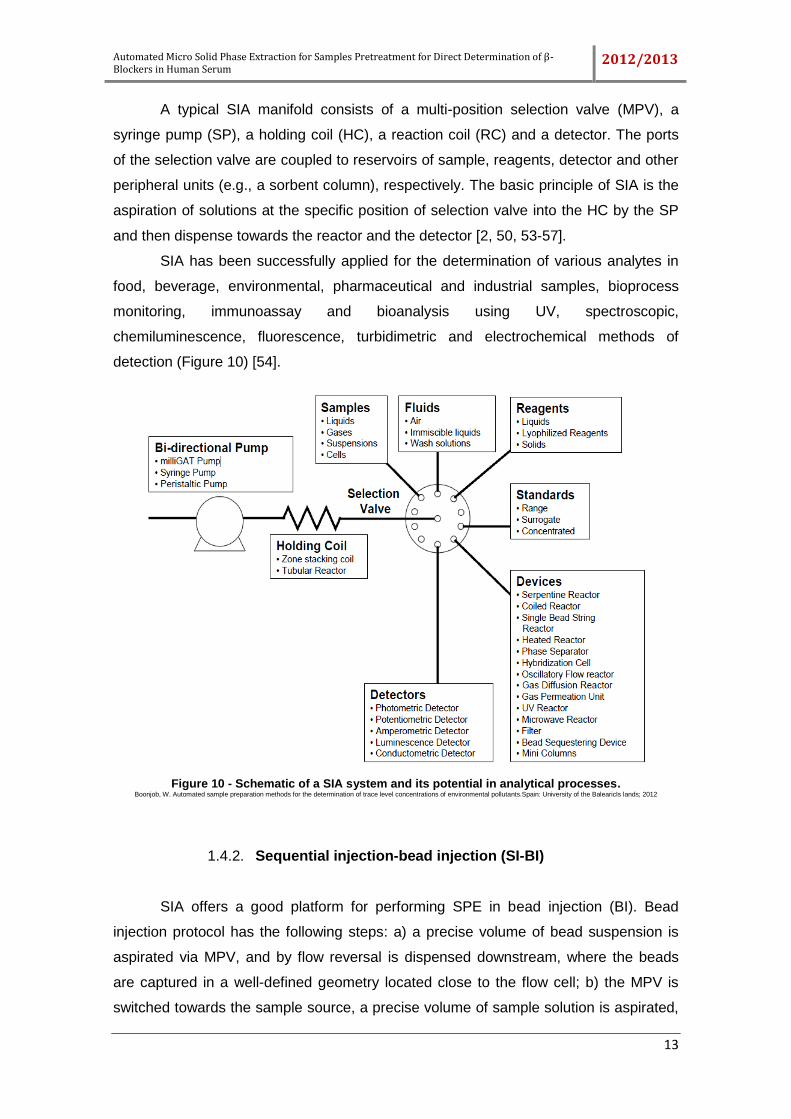
A typical SIA manifold consists of a multi-position selection valve (MPV), a
syringe pump (SP), a holding coil (HC), a reaction coil (RC) and a detector. The ports
of the selection valve are coupled to reservoirs of sample, reagents, detector and other
peripheral units (e.g., a sorbent column), respectively. The basic principle of SIA is the
aspiration of solutions at the specific position of selection valve into the HC by the SP
and then dispense towards the reactor and the detector [2, 50, 53-57].
SIA has been successfully applied for the determination of various analytes in
food, beverage, environmental, pharmaceutical and industrial samples, bioprocess
monitoring, immunoassay and bioanalysis using UV, spectroscopic,
chemiluminescence, fluorescence, turbidimetric and electrochemical methods of
detection (Figure 10) [54].
1.4.2. Sequential injection-bead injection (SI-BI)
SIA offers a good platform for performing SPE in bead injection (BI). Bead
injection protocol has the following steps: a) a precise volume of bead suspension is
aspirated via MPV, and by flow reversal is dispensed downstream, where the beads
are captured in a well-defined geometry located close to the flow cell; b) the MPV is
switched towards the sample source, a precise volume of sample solution is aspirated,
Figure 10 - Schematic of a SIA system and its potential in analytical processes. Boonjob, W. Automated sample preparation methods for the determination of trace level concentrations of environmental pollutants.Spain: University of the BalearicIs lands; 2012
Automated Micro Solid Phase Extraction for Samples Pretreatment for Direct Determination of β-Blockers in Human Serum 2012/2013
14
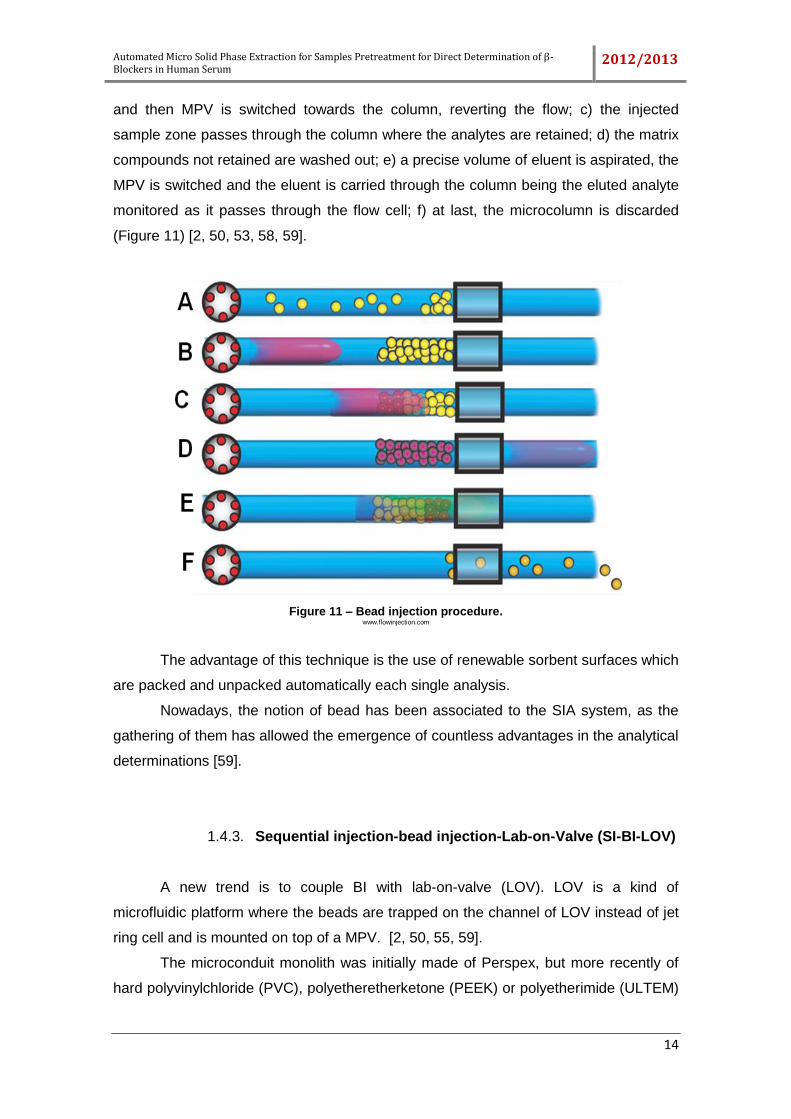
and then MPV is switched towards the column, reverting the flow; c) the injected
sample zone passes through the column where the analytes are retained; d) the matrix
compounds not retained are washed out; e) a precise volume of eluent is aspirated, the
MPV is switched and the eluent is carried through the column being the eluted analyte
monitored as it passes through the flow cell; f) at last, the microcolumn is discarded
(Figure 11) [2, 50, 53, 58, 59].
Figure 11 – Bead injection procedure. www.flowinjection.com
The advantage of this technique is the use of renewable sorbent surfaces which
are packed and unpacked automatically each single analysis.
Nowadays, the notion of bead has been associated to the SIA system, as the
gathering of them has allowed the emergence of countless advantages in the analytical
determinations [59].
1.4.3. Sequential injection-bead injection-Lab-on-Valve (SI-BI-LOV)
A new trend is to couple BI with lab-on-valve (LOV). LOV is a kind of
microfluidic platform where the beads are trapped on the channel of LOV instead of jet
ring cell and is mounted on top of a MPV. [2, 50, 55, 59].
The microconduit monolith was initially made of Perspex, but more recently of
hard polyvinylchloride (PVC), polyetheretherketone (PEEK) or polyetherimide (ULTEM)

Automated Micro Solid Phase Extraction for Samples Pretreatment for Direct Determination of β-Blockers in Human Serum 2012/2013
15
for improved chemical resistance to a wide range of organic solvents. This system is
composed by six- or ten-port selection valve (Figure 12) [50].
All analytical steps might be performed on LOV including the detection step.
On-line analysis can be performed by coupling other analytical techniques (for example
HPLC, GC), as can be seen in Figure 13 [50, 55, 59].
Figure 13 – Schematic diagram of sequential injection-bead injection-Lab-on-Vale system. M. Miró; E.H. Hansen, 2006, Solid reactors in sequential injection analysis: Recent trends in the environmental field. Trends in Analytical Chemistry 25, 267-281.
The open architecture and simple design, associated with the flexibility provided
by programmable flow operation, converted LOV in the preferential way to develop new
BI protocols [59].
1.5. High performance liquid chromatography (HPLC)
HPLC is a chromatographic technique used to separate a mixture of
compounds with the aims of identifying, quantifying and purifying the individual
components of the mixture. Generally, this technique is used in biochemistry and other
HPLC
Figure 12 - 8 port LOV fabricated from ULTEM. http://www.flowinjection.com/21.%20SI%20%20Lab%20on%20Valve.html
Automated Micro Solid Phase Extraction for Samples Pretreatment for Direct Determination of β-Blockers in Human Serum 2012/2013
16
analyses because it is an easy to operate, repeatable, exact, fast, versatile and
efficient technique [60-66].
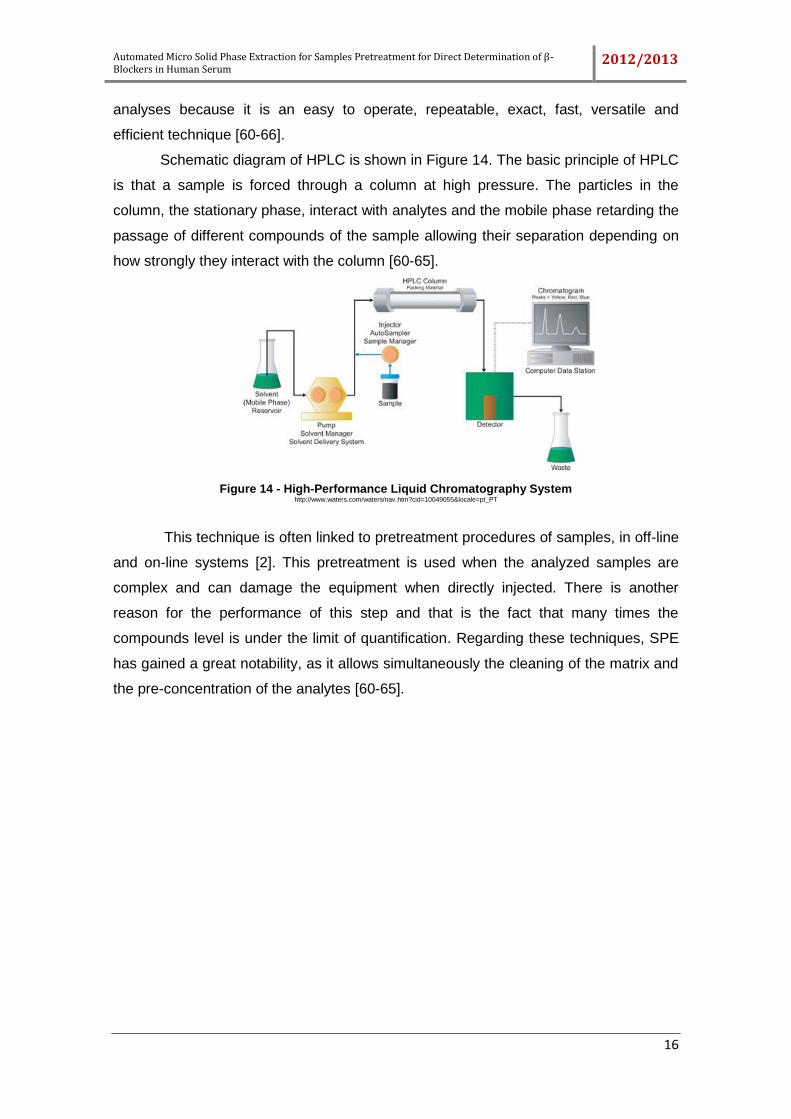
Schematic diagram of HPLC is shown in Figure 14. The basic principle of HPLC
is that a sample is forced through a column at high pressure. The particles in the
column, the stationary phase, interact with analytes and the mobile phase retarding the
passage of different compounds of the sample allowing their separation depending on
how strongly they interact with the column [60-65].
Figure 14 - High-Performance Liquid Chromatography System http://www.waters.com/waters/nav.htm?cid=10049055&locale=pt_PT
This technique is often linked to pretreatment procedures of samples, in off-line
and on-line systems [2]. This pretreatment is used when the analyzed samples are
complex and can damage the equipment when directly injected. There is another
reason for the performance of this step and that is the fact that many times the
compounds level is under the limit of quantification. Regarding these techniques, SPE
has gained a great notability, as it allows simultaneously the cleaning of the matrix and
the pre-concentration of the analytes [60-65].
Automated Micro Solid Phase Extraction for Samples Pretreatment for Direct Determination of β-Blockers in Human Serum
2012/2013
17
2. Aims of work
The aim of this work was the development of a simple, selective, precise,
accurate, fast and economic automated methodology for simultaneous determination of
acebutolol, labetalol, metoprolol, pindolol and propranolol using automated µSPE-LOV
system for the pre-concentration and extraction of target compounds from human
serum samples and HPLC for quantification.
Automated Micro Solid Phase Extraction for Samples Pretreatment for Direct Determination of β-Blockers in Human Serum
2012/2013
18
In this work, extraction of β-blockers using classical SPE in off-line mode is
going to be reported. The development of an automated µSPE-LOV using various
types of solid sorbents, namely, Oasis HLB, Bond Elute Plexa, Bond Elute Plexa-PCX,
Bond Elute Plexa-PAX and β-blockers MIP cartridges were investigated for sample
pretreatment and one of the sorbents was applied for pre-concentration of the five β-
blockers (acebutolol, labetalol, metoprolol, pindolol, propranolol) present in human
serum. The quantification of these compounds was performed by HPLC.
Next, it is described the general practical procedures used in the
accomplishment of this project, as well as the methodologies involved and some
theoretical aspects that are deemed important for the interpretation of some results
presented later.
3.1. Chemicals and reagents
Analytical-grade (purity ≥ 98%) standards of atenolol, pindolol, acebutolol,
metoprolol, labetalol, and propranolol were supplied from Sigma (St. Louis, MO, USA).
The HPLC-grade methanol (MeOH) and acetonitrile (AcN) were obtained from
Merck (Darmstadt, Germany). Ultrapure water was obtained from a Milli-Q water
purification system from Millipore (Bedford, MA, USA). For SPE procedure was used
dichloromethane (CH2Cl2), acetic acid (HAc) and formic acid that were supplied by
Fluka (St. Louis, MO, USA); toluene was obtained from Sigma-Aldrich (St. Louis, MO,
USA) and ammonium (NH3) was purchased from Penta (Prague, Czech Republic).
Internal standards (IS) tested had high purity grade (≥ 95%). Sorbic acid,
clotrimazole, calcein, bumetanide and triamcinolone were obtained from Sigma (St.
Louis, MO, USA); rosmarinic acid, dichlorophen and (S)-(+)-ketoprofen were obtained
from Aldrich (St. Louis, MO, USA).
The phosphate buffer (pH 3.8) was prepared by dissolving 2.7689 g of
NaH2PO4 obtained from Fluka (Buchs, Switzerland) and diluting to a final volume of 1
L. The pH was adjusted with 10% orthophosphoric acid obtained from Panreac
(Bacelona, Spain). It was filtered through a 0.45 µm cellulose filter (Millipore, Bedford,
MA, USA) prior to use.
Individual stock standard solutions of the analytes and IS solutions were
prepared at a final concentration of 1000 mg L-1 in MeOH. Mixtures of metoprolol,
acebutolol and labetalol of 10 mg L-1 each, and pindolol and propranolol 5 mg L-1 each
were prepared by diluting stock solutions in MeOH to evaluate the intensity at 220 nm.
Automated Micro Solid Phase Extraction for Samples Pretreatment for Direct Determination of β-Blockers in Human Serum 2012/2013
19
Triamcinolone was used as IS for all analyses. These solutions were kept at 4ºC and
used to prepare standard working solutions in ultrapure water.
Commercial cartridges packed with Oasis HLB (6mL, 150 mg) and Oasis HLB
(3 mL, 60 mg) were purchased from Waters (Milford, MA, USA). SupelMIPTM β-blocker
cartridges (10mL, 25 mg) were obtained from Supelco (Bellefonte, PA, USA). Bond
Elute Plexa (3 mL, 60 mg), Bond Elute Plexa-PCX (3 mL, 60 mg) and Bond Elute
Plexa-PAX (3mL, 60 mg) were supplied from Agilent Technologies (Santa Clara, CA,
USA).
Artificial human serum used for analysis was obtained from Biotest (Brno,
Czech Republic).
3.2. Equipment and material
All weighing of reagents or samples were performed using an analytical scale,
from Sartorius (Göttingen, Germany), model A200S with a precision of 0.0001 g. The
glass material used in all experiments belonged to class A. The measurement of
volumes below 5.00 mL was performed with the assistance of automatic pipettes Brand
(Wertheim, Germany), model Transferpette® P20, P200, P1000 e P5000. The volumes
above 5.00 mL were measured with glass volumetric pipettes class A.
For the pH adjustment of the phosphate buffer it was used a pH meter
Microprocessor pH, model 212 from Hanna (Prague, Czech Republic). For solutions
homogenization it was used a magnetic stirrer from IKA (Staufen, Germany), model
Colorsquid.
In the manual SPE it was used a Supelco Visiprep 24TM DL (St. Louis, MO,
USA) coupled to a vacuum pump Vacc-space 50-chs. The samples eluates were dried
with nitrogen gas from Linde (Munich, Germany).
All serum samples were centrifuged with EBA 21 centrifuge of Hettich
zentrifugen (Tuttlingen, Germany).
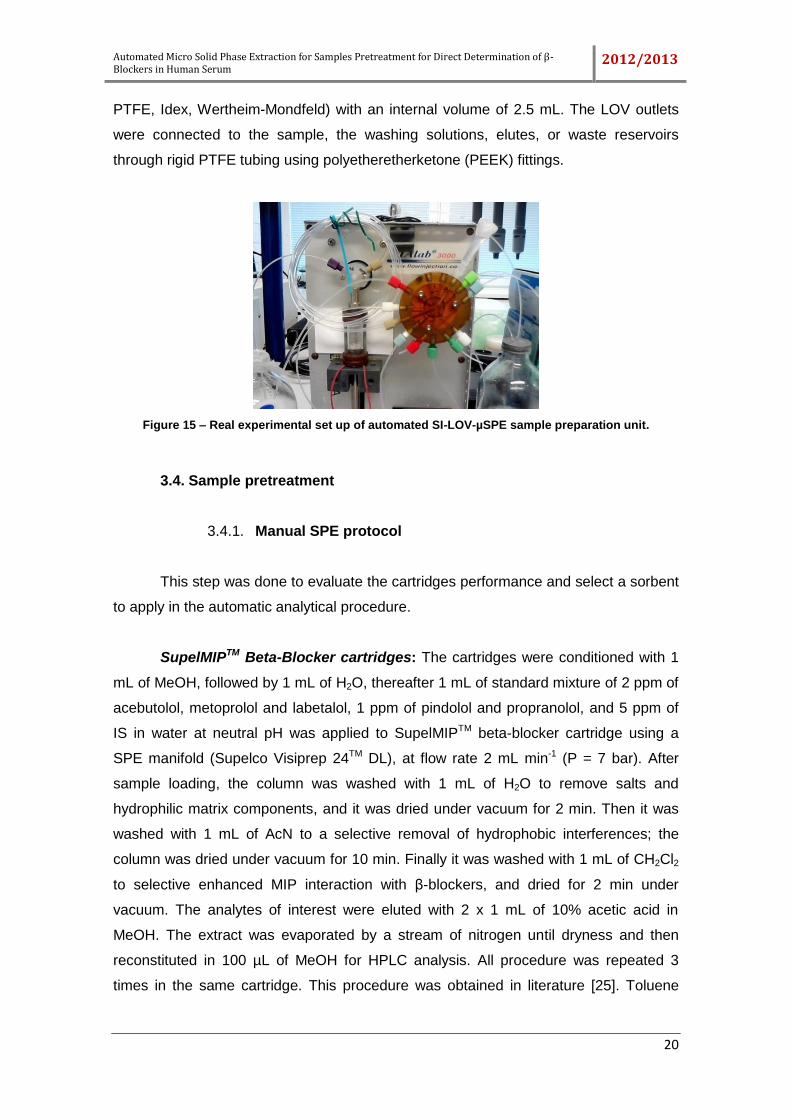
3.3. Flow analysis set up
A FIAlab-3000 sequential injection system equipped with a LOV with 8 ports
was used for µSPE. A 30000-step syringe pump (Cavro, Sunnyvale, USA) with a
capacity of 5 mL was used for automatic handling of reagents and the delivery of well-
defined volumes of elutes to the bead. Milli-Q water was used as a carrier solution
(Figure 15). The central port (CC) was connected to the LOV positions via a HC (tube
Automated Micro Solid Phase Extraction for Samples Pretreatment for Direct Determination of β-Blockers in Human Serum 2012/2013
20
PTFE, Idex, Wertheim-Mondfeld) with an internal volume of 2.5 mL. The LOV outlets
were connected to the sample, the washing solutions, elutes, or waste reservoirs
through rigid PTFE tubing using polyetheretherketone (PEEK) fittings.
Figure 15 – Real experimental set up of automated SI-LOV-µSPE sample preparation unit.
3.4. Sample pretreatment
3.4.1. Manual SPE protocol
This step was done to evaluate the cartridges performance and select a sorbent
to apply in the automatic analytical procedure.
SupelMIPTM Beta-Blocker cartridges: The cartridges were conditioned with 1
mL of MeOH, followed by 1 mL of H2O, thereafter 1 mL of standard mixture of 2 ppm of
acebutolol, metoprolol and labetalol, 1 ppm of pindolol and propranolol, and 5 ppm of
IS in water at neutral pH was applied to SupelMIPTM beta-blocker cartridge using a
SPE manifold (Supelco Visiprep 24TM DL), at flow rate 2 mL min-1 (P = 7 bar). After
sample loading, the column was washed with 1 mL of H2O to remove salts and
hydrophilic matrix components, and it was dried under vacuum for 2 min. Then it was
washed with 1 mL of AcN to a selective removal of hydrophobic interferences; the
column was dried under vacuum for 10 min. Finally it was washed with 1 mL of CH2Cl2
to selective enhanced MIP interaction with β-blockers, and dried for 2 min under
vacuum. The analytes of interest were eluted with 2 x 1 mL of 10% acetic acid in
MeOH. The extract was evaporated by a stream of nitrogen until dryness and then
reconstituted in 100 µL of MeOH for HPLC analysis. All procedure was repeated 3
times in the same cartridge. This procedure was obtained in literature [25]. Toluene
Automated Micro Solid Phase Extraction for Samples Pretreatment for Direct Determination of β-Blockers in Human Serum 2012/2013
21
was used as an optional organic solvent for promoting the specific interaction of β-
blockers sorbent. The results will be showed in Chapter 4.
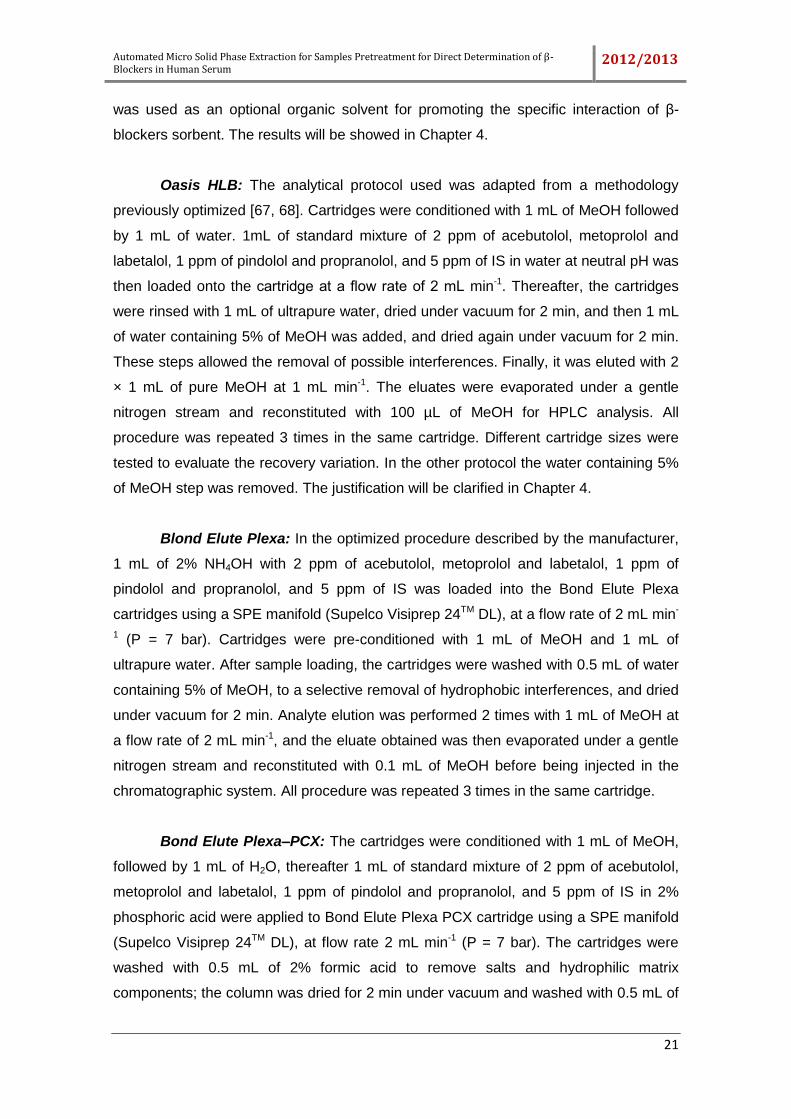
Oasis HLB: The analytical protocol used was adapted from a methodology
previously optimized [67, 68]. Cartridges were conditioned with 1 mL of MeOH followed
by 1 mL of water. 1mL of standard mixture of 2 ppm of acebutolol, metoprolol and
labetalol, 1 ppm of pindolol and propranolol, and 5 ppm of IS in water at neutral pH was
then loaded onto the cartridge at a flow rate of 2 mL min-1. Thereafter, the cartridges
were rinsed with 1 mL of ultrapure water, dried under vacuum for 2 min, and then 1 mL
of water containing 5% of MeOH was added, and dried again under vacuum for 2 min.
These steps allowed the removal of possible interferences. Finally, it was eluted with 2
× 1 mL of pure MeOH at 1 mL min-1. The eluates were evaporated under a gentle
nitrogen stream and reconstituted with 100 µL of MeOH for HPLC analysis. All
procedure was repeated 3 times in the same cartridge. Different cartridge sizes were
tested to evaluate the recovery variation. In the other protocol the water containing 5%
of MeOH step was removed. The justification will be clarified in Chapter 4.
Blond Elute Plexa: In the optimized procedure described by the manufacturer,
1 mL of 2% NH4OH with 2 ppm of acebutolol, metoprolol and labetalol, 1 ppm of
pindolol and propranolol, and 5 ppm of IS was loaded into the Bond Elute Plexa
cartridges using a SPE manifold (Supelco Visiprep 24TM DL), at a flow rate of 2 mL min-
1 (P = 7 bar). Cartridges were pre-conditioned with 1 mL of MeOH and 1 mL of
ultrapure water. After sample loading, the cartridges were washed with 0.5 mL of water
containing 5% of MeOH, to a selective removal of hydrophobic interferences, and dried
under vacuum for 2 min. Analyte elution was performed 2 times with 1 mL of MeOH at
a flow rate of 2 mL min-1, and the eluate obtained was then evaporated under a gentle
nitrogen stream and reconstituted with 0.1 mL of MeOH before being injected in the
chromatographic system. All procedure was repeated 3 times in the same cartridge.
Bond Elute Plexa–PCX: The cartridges were conditioned with 1 mL of MeOH,
followed by 1 mL of H2O, thereafter 1 mL of standard mixture of 2 ppm of acebutolol,
metoprolol and labetalol, 1 ppm of pindolol and propranolol, and 5 ppm of IS in 2%
phosphoric acid were applied to Bond Elute Plexa PCX cartridge using a SPE manifold
(Supelco Visiprep 24TM DL), at flow rate 2 mL min-1 (P = 7 bar). The cartridges were
washed with 0.5 mL of 2% formic acid to remove salts and hydrophilic matrix
components; the column was dried for 2 min under vacuum and washed with 0.5 mL of
Automated Micro Solid Phase Extraction for Samples Pretreatment for Direct Determination of β-Blockers in Human Serum 2012/2013
22
MeOH:AcN (1:1 v/v) to a selective removal of hydrophobic interferences and dried for 2
min under vacuum. Analyte elution was performed by 2 x 1 mL 5% NH3 in MeOH:AcN
(1:1 v/v) at a flow rate of 2 mL min-1, and the eluate obtained was then evaporated
under a gentle nitrogen stream and reconstituted with 100 µL of MeOH for HPLC
analysis. All procedure was repeated 3 times in the same cartridge.
Bond Elute Plexa-PAX: In the optimized procedure described by the
manufacturer, 1 mL of 2% NH3 with 2 ppm of acebutolol, metoprolol and labetalol, 1
ppm of pindolol and propranolol, and 5 ppm of IS was loaded into the Bond Elute
Plexa-PAX cartridges using a SPE manifold (Supelco Visiprep 24TM DL) at a flow rate
of 2 mL min-1 (P = 7 bar). Cartridges were pre-conditioned with 1 mL of MeOH and 1
mL of ultrapure water. After sample loading, the cartridges were washed with 0.5 mL of
water containing 5% of MeOH, to a selective removal of hydrophobic interferences, and
dried under vacuum for 2 min. Analyte elution was performed 2 times with 1 mL of
MeOH at a flow rate of 0.2 mL min-1, and the eluate obtained was then evaporated
under a gentle nitrogen stream and reconstituted with 0.1 mL of MeOH before the
injection in the chromatographic system. In the other protocol it was switched the water
containing 5% of MeOH step by 2% formic acid for washing. All procedure was
repeated 3 times in the same cartridge. The justification will be clarified in Chapter 4.
3.4.2. Automatic µSPE
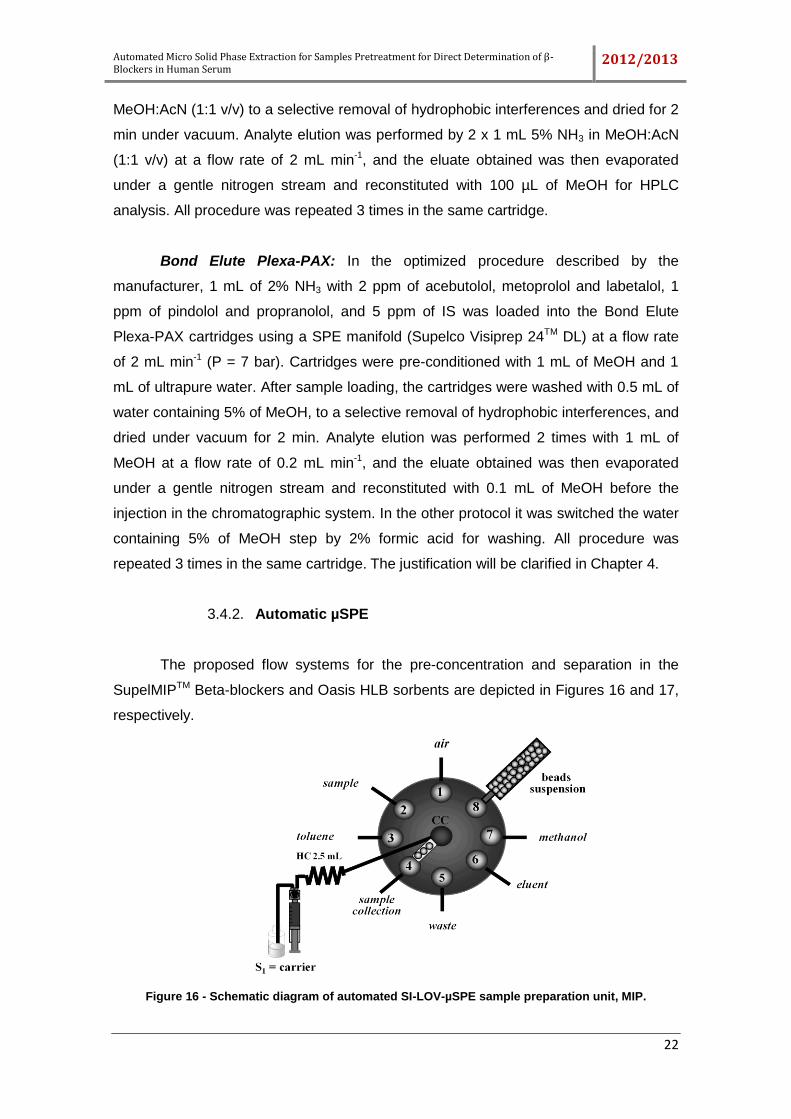
The proposed flow systems for the pre-concentration and separation in the
SupelMIPTM Beta-blockers and Oasis HLB sorbents are depicted in Figures 16 and 17,
respectively.
Figure 16 - Schematic diagram of automated SI-LOV-µSPE sample preparation unit, MIP.
Automated Micro Solid Phase Extraction for Samples Pretreatment for Direct Determination of β-Blockers in Human Serum 2012/2013
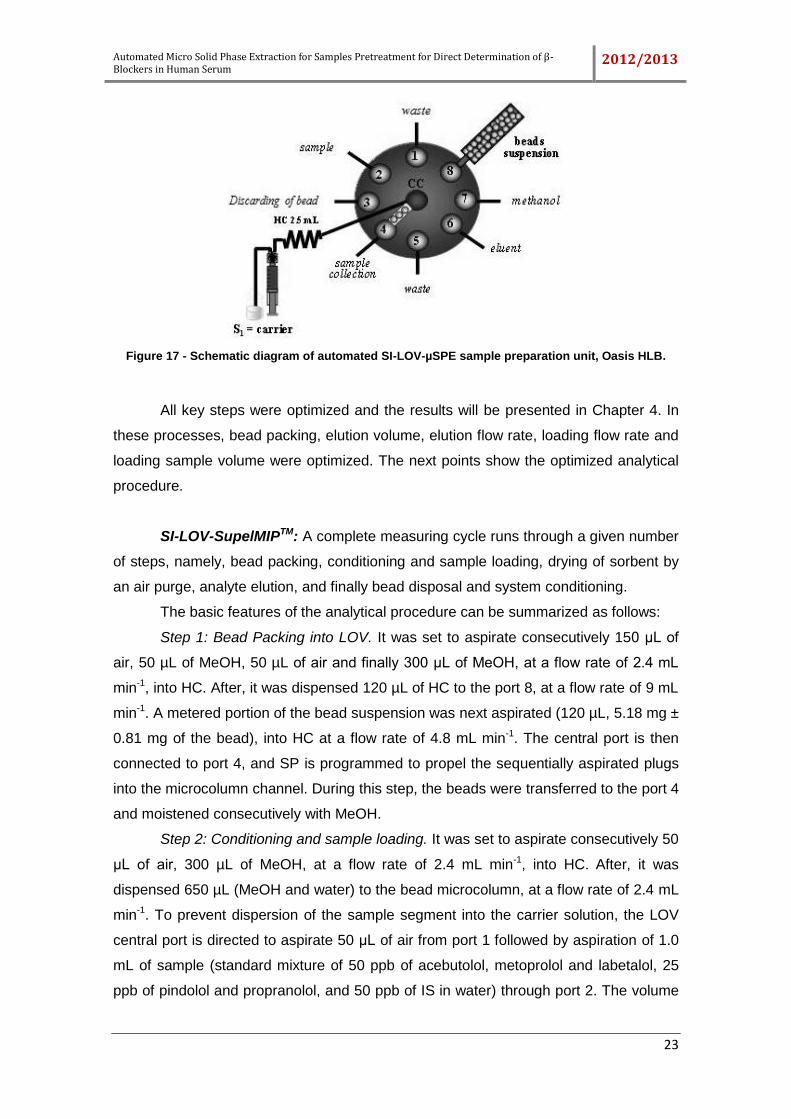
23
Figure 17 - Schematic diagram of automated SI-LOV-µSPE sample preparation unit, Oasis HLB.
All key steps were optimized and the results will be presented in Chapter 4. In
these processes, bead packing, elution volume, elution flow rate, loading flow rate and
loading sample volume were optimized. The next points show the optimized analytical
procedure.
SI-LOV-SupelMIPTM: A complete measuring cycle runs through a given number
of steps, namely, bead packing, conditioning and sample loading, drying of sorbent by
an air purge, analyte elution, and finally bead disposal and system conditioning.
The basic features of the analytical procedure can be summarized as follows:
Step 1: Bead Packing into LOV. It was set to aspirate consecutively 150 μL of
air, 50 µL of MeOH, 50 µL of air and finally 300 μL of MeOH, at a flow rate of 2.4 mL
min-1, into HC. After, it was dispensed 120 µL of HC to the port 8, at a flow rate of 9 mL
min-1. A metered portion of the bead suspension was next aspirated (120 µL, 5.18 mg ±
0.81 mg of the bead), into HC at a flow rate of 4.8 mL min-1. The central port is then
connected to port 4, and SP is programmed to propel the sequentially aspirated plugs
into the microcolumn channel. During this step, the beads were transferred to the port 4
and moistened consecutively with MeOH.
Step 2: Conditioning and sample loading. It was set to aspirate consecutively 50
μL of air, 300 µL of MeOH, at a flow rate of 2.4 mL min-1, into HC. After, it was
dispensed 650 µL (MeOH and water) to the bead microcolumn, at a flow rate of 2.4 mL
min-1. To prevent dispersion of the sample segment into the carrier solution, the LOV
central port is directed to aspirate 50 μL of air from port 1 followed by aspiration of 1.0
mL of sample (standard mixture of 50 ppb of acebutolol, metoprolol and labetalol, 25
ppb of pindolol and propranolol, and 50 ppb of IS in water) through port 2. The volume
Automated Micro Solid Phase Extraction for Samples Pretreatment for Direct Determination of β-Blockers in Human Serum 2012/2013
24
was stored into HC, prior being pumped by flow reversal to the packed microcolumn at
2.0 mL min-1. This procedure was repeated fivefold, whereby a total amount of 5 mL of
sample was loaded. After, it was dispensed 350 µL of H2O to the port 4, at 2.4 mL min-
1. The air plug was finally delivered to the column for drying of the beads (2.0 mL at 1
mL min-1) prior to wash toluene step. It was aspirated 350 µL of AcN, into HC. After,
this volume was dispensed to the port 4, at 2.4 mL min-1. The air plug was then
delivered to the column for drying of the beads (6.0 mL at 1 mL min-1) prior to initiate
the elution step. One additional step was made, corresponding to the aspiration of 15
µL of 10% HAc which was then dispensed to the port 4.
Step 3: Analyte elution. In order to prevent the introduction of aqueous
segments into the eluate, an amount of 300 μL of air (2.4 mL min-1) was first aspirated
into HC, and then 80 μL of 10% HAc was aspirated, at 1.2 mL min-1. This volume was
dispensed to the port 4, at flow rate of 0.5 mL min-1. The eluate was collected in
eppendorf.
Step 4: Bead Discarding and System Conditioning. Since the polymeric beads
are extremely easy to handle within the integrated microconduits, the packed column
reactor was also easily removed after being moistened with MeOH and delivered to
waste (port 5) with carrier solution. For this, it was set to aspirate consecutively 50 μL
of air, 250 µL of MeOH, 50 µl of air and finally 450 μL of MeOH, at a flow rate of 2.4 mL
min-1, into HC. After, it was dispensed 400 µL of HC to the port 4, at a flow rate of 2.4
mL min-1. The bead suspension was next aspirated (400 µL), into HC at a flow rate of
3.6 mL min-1. Hence, the flow system was ready to initiate a new analysis cycle with a
fresh portion of beads, thus eliminating any possibility of cross-contamination between
consecutive runs.
SI-LOV-Oasis HLB: This analytical procedure presented the same analytical
steps:
Step 1: Bead Packing into LOV. It was set to aspirate consecutively 150 μL of
air, 50 µL of MeOH, 50 uL of air and finally 300 μL of MeOH, at a flow rate of 2.4 mL
min-1, into HC. After, it was dispensed 110 µL of HC to the port 8, at a flow rate of 6 mL
min-1. A metered portion of the bead suspension was next aspirated (110 µL, 8.4 mg ±
1.4 mg of the bead), into HC at a flow rate of 2.4 mL min-1. The central port was then
connected to port 4, and SP was programmed to propel the sequentially aspirated
plugs into the microcolumn channel. During this step, the beads were transferred to the
port 4 and moistened consecutively with MeOH.
Automated Micro Solid Phase Extraction for Samples Pretreatment for Direct Determination of β-Blockers in Human Serum 2012/2013
25
Step 2: Conditioning and sample loading. It was set to aspirate consecutively 50
μL of air, 300 µL of MeOH, at a flow rate of 2.4 mL min-1, into HC. After, it was
dispensed 650 µL (MeOH and water) to the bead microcolumn, at a flow rate of 2.4 mL
min-1. To prevent dispersion of the sample segment into the carrier solution, the LOV
central port was directed to aspirate 50 μL of air from port 6 followed by aspiration of
1.0 mL of sample (standard mixture of 20 ppb of acebutolol, metoprolol and labetalol,
10 ppb of pindolol and propranolol, and 20 ppb of IS in water) through port 2. The
volume was stored into HC, prior being pumped by flow reversal to the packed
microcolumn at 0.5 mL min-1. This procedure was repeated fivefold, whereby a total
amount of 5 mL of sample was loaded. After, it was dispensed 350 µL of H2O to the
port 4, at 2.4 mL min-1. The air plug is finally delivered to the column for drying of the
beads (2.0 mL at 1 mL min-1) prior to initiate the elution step. One additional step was
performed corresponding to the aspiration of 15 µL of MeOH which was then
dispensed to the port 4.
Step 3: Analyte elution. In order to prevent the introduction of aqueous
segments into the eluate, an amount of 300 μL of air (2.4 mL min-1) was first aspirated
into HC, and then 150 μL of MeOH was aspirated, at 1.2 mL min-1. This volume was
dispensed to the port 4, at flow rate of 0.5 mL min-1. The eluate was then collected in
eppendorf.
Step 4: Bead Discarding and System Conditioning. Since the polymeric beads
are extremely easy to handle within the integrated microconduits, the packed column
reactor was also easily removed after being moistened with MeOH and delivered to
waste (port 5) with carrier solution. For this, it was set to aspirate consecutively 50 μL
of air, 250 µL of MeOH, 50 µl of air and finally 450 μL of MeOH, at a flow rate of 2.4 mL
min-1, into HC. After, it was dispensed 400 µL of HC to the port 4, at a flow rate of 2.4
mL min-1. The bead suspension was next aspirated (400 µL), into HC at a flow rate of
3.6 mL min-1. Hence, the flow system was ready to initiate a new analysis cycle with a
fresh portion of beads, thus eliminating any possibility of cross-contamination between
consecutive runs.
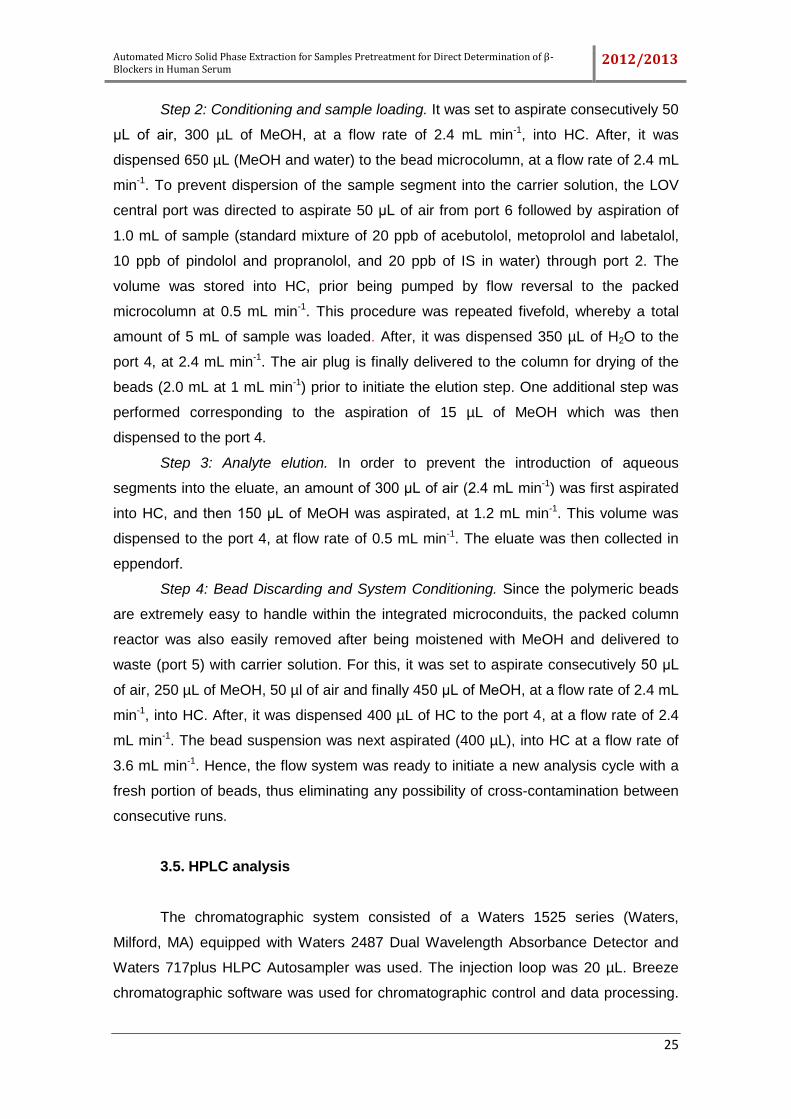
3.5. HPLC analysis
The chromatographic system consisted of a Waters 1525 series (Waters,
Milford, MA) equipped with Waters 2487 Dual Wavelength Absorbance Detector and
Waters 717plus HLPC Autosampler was used. The injection loop was 20 µL. Breeze
chromatographic software was used for chromatographic control and data processing.
Automated Micro Solid Phase Extraction for Samples Pretreatment for Direct Determination of β-Blockers in Human Serum 2012/2013
26
Chromatographic separations were performed using the Chromolith high resolution,
RP-18 endcapped column (100-4.6mm i.d., Merck, Darmstadt, Germany).
Figure 18 – HPLC equipment used in this work, Water 1525.
The mobile phase (MP) has eluent A – AcN and eluent B – phosphate buffer
(pH 3.8). This MP was obtained in literature [10].
In this work, two different loops were tested (20 µL and 200 µL) and the
injection volume was optimized. The percentages of MP constituents were different for
these loops. For the first loop (MP 1), the AcN content of the mobile phase was
increased linearly from 15 to 35% during 10 min (Table 2), and hold for 1 min. The
injection volume was 10 µL. The equilibration time between two consecutive samples
was set at 5 min. The MP was used at a constant flow rate of 1.0 mL min-1.
Table 2 – Percentages of constituents of MP for a 20 µL loop (MP 1).
Time Flow (mL min-1) A% B%
0 1.00 15 85
10 1.00 35 65
12 1.00 15 85
Automated Micro Solid Phase Extraction for Samples Pretreatment for Direct Determination of β-Blockers in Human Serum 2012/2013
27
For this loop other percentages of MP constituents (MP 2) were tested. The flow
rate was 0.9 mL min-1 until 3 minutes and 1.0 mL min-1 until 13 minutes. The gradient
program was fixed as follows: 10% A and 90% B (0 min), 15% A and 85% C (3 min),
35% A and 65% B (13 min) (Table 3). The injection volume was 10 µL. The total run
time was 13 min. The equilibration time between two consecutive samples was set at 5
min.
Table 3 – Percentages of constituents of MP for a 20 µL loop (MP 2).
Time Flow (mL min-1) A% B%
0 0.90 10 90
3 1.00 15 85
13 1.00 35 65
15 0.90 10 90
In the second loop, the MP consisted of the AcN and phosphate buffer (MP 3).
The flow rate was 1.0 mL min-1 and the gradient program was fixed as follows: 15% A
and 85% B (0 min), 40% A and 60% B (6 min), 50% A and 50% B (10 min) (Table 4).
The injection volume was 200 µL. The total run time was 10 min. The equilibration time
between two consecutive samples was set at 5 min. In this loop different sample
dilutions (1:1; 1:2; 1:4 and 1:5) were tested.
Table 4 – Percentages of constituents of MP for a 200 µL loop (MP 3).
Time Flow (mL min-1) A% B%
0 1.00 15 85
6 1.00 40 60
10 1.00 50 50
12 1.00 15 85
Pindolol, acebutolol, metoprolol, labetalol and propranolol peaks were
integrated at 220 nm for quantification.
Different compounds which can be used as internal standard, the sorbic acid,
rosmarinic acid, dichlorophen, ketoprofen, bumetamide and triamcinolone were tested.
Automated Micro Solid Phase Extraction for Samples Pretreatment for Direct Determination of β-Blockers in Human Serum 2012/2013
28
In all determinations triamcinolone was used as IS. All solvents used in the SPE
procedure were directly injected in HPLC system.
To optimize the injection volume, solutions of 2 mL of STD in MeOH with
concentrations of 10 ppm (for acebutolol, metoprolol and labetalol), and 5 ppm (for
pindolol, propranolol and IS) were prepared for direct and mix injection in HPLC
system.
At the end of the day, the column was washed primarily with AcN (10 min) and
then with water (10 min).
3.6. Calibration curves
Most parameters of analytical interest are evaluated and determined through
the calibration curve method. This is a general method to determine the concentration
of a substance of unknown concentration in a sample, comparing the analytical signal
with the analytical signal of a set of standard solutions. The parameters that can be
acquired from the calibration curve are the following: slope of the linear range, limit of
detection (LOD) and limit of quantification (LOQ).
Different STD concentrations were tested: 2 ppb (for acebutolol, metoprolol and
labetalol), 1 ppb (for pindolol, propranolol) and 1000 ppb (for IS); 10 ppb (for
acebutolol, metoprolol and labetalol), 5 ppb (for pindolol, propranolol) and 1000 ppb
(for IS); 20 ppb (for acebutolol, metoprolol and labetalol), 10 ppb (for pindolol,
propranolol) and 1000 ppb (for IS); 50 ppb (for acebutolol, metoprolol and labetalol), 25
ppb (for pindolol, propranolol) and 1000 ppb (for IS) and 200 ppb (for acebutolol,
metoprolol and labetalol), 100 ppb (for pindolol, propranolol) and 1000 ppb (for IS).
In order to obtain the calibration curve, it was prepared 50 mL of the STD in
water for all STD solutions. All solutions presented the same concentration of the IS,
which allowed to obtain the normalized area to acquire the calibration curve.
Before injection, all solutions were pretreated using the optimized automatic
SupelMIPTM Beta-blockers method. After, the eluate was directly injected in the HPLC
system.
Automated Micro Solid Phase Extraction for Samples Pretreatment for Direct Determination of β-Blockers in Human Serum 2012/2013
29
3.7. Analytical performance
3.7.1. Linearity range
Method linearity was determined by evaluation of the regression curve (ratio of
analyte peak area/IS area versus analyte concentration) and expressed by the
correlation coefficient [69]. The linearity range of the method was analyzed by
performing calibration curves using at least five different concentration levels of the
analytes, according to the range of concentrations present in the samples. This
parameter was obtained in calibration curve.
3.7.2. Limit of detection (LOD)
The LOD defined as the lowest concentration can be measured at a S/N ≥ 3,
thus indicating the S/N of the least intense wavelength selected for the detection of
each target compound [20]. This parameter was calculated using the following formula:
( )
Where SD is the residual standard deviation of the linear regression, and b is
the slope of the regression line.
3.7.3. Limit of quantification (LOQ)
The LOQ of an analytical method is the lowest measured concentration level
that can be determined in a reproducible way [20]. This parameter was calculated
using the following formula:
( )
Where SD is the residual standard deviation of the linear regression, and b is
the slope of the regression line.
3.7.4. Precision
Precision can be divided in repeatability and reproducibility. Precision is
calculated from the determination of a number (n a 6) of analyses of an identical
sample.
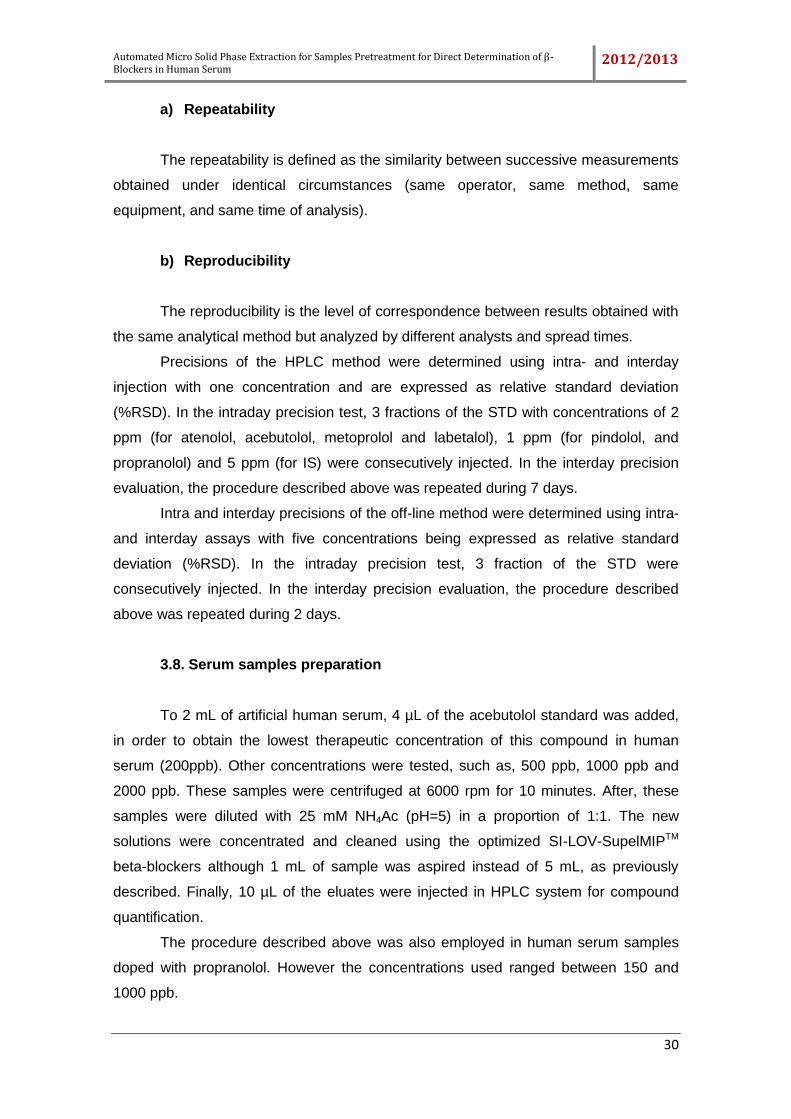
Automated Micro Solid Phase Extraction for Samples Pretreatment for Direct Determination of β-Blockers in Human Serum 2012/2013
30
a) Repeatability
The repeatability is defined as the similarity between successive measurements
obtained under identical circumstances (same operator, same method, same
equipment, and same time of analysis).
b) Reproducibility
The reproducibility is the level of correspondence between results obtained with
the same analytical method but analyzed by different analysts and spread times.
Precisions of the HPLC method were determined using intra- and interday
injection with one concentration and are expressed as relative standard deviation
(%RSD). In the intraday precision test, 3 fractions of the STD with concentrations of 2
ppm (for atenolol, acebutolol, metoprolol and labetalol), 1 ppm (for pindolol, and
propranolol) and 5 ppm (for IS) were consecutively injected. In the interday precision
evaluation, the procedure described above was repeated during 7 days.
Intra and interday precisions of the off-line method were determined using intra-
and interday assays with five concentrations being expressed as relative standard
deviation (%RSD). In the intraday precision test, 3 fraction of the STD were
consecutively injected. In the interday precision evaluation, the procedure described
above was repeated during 2 days.
3.8. Serum samples preparation
To 2 mL of artificial human serum, 4 µL of the acebutolol standard was added,
in order to obtain the lowest therapeutic concentration of this compound in human
serum (200ppb). Other concentrations were tested, such as, 500 ppb, 1000 ppb and
2000 ppb. These samples were centrifuged at 6000 rpm for 10 minutes. After, these
samples were diluted with 25 mM NH4Ac (pH=5) in a proportion of 1:1. The new
solutions were concentrated and cleaned using the optimized SI-LOV-SupelMIPTM
beta-blockers although 1 mL of sample was aspired instead of 5 mL, as previously
described. Finally, 10 µL of the eluates were injected in HPLC system for compound
quantification.
The procedure described above was also employed in human serum samples
doped with propranolol. However the concentrations used ranged between 150 and
1000 ppb.
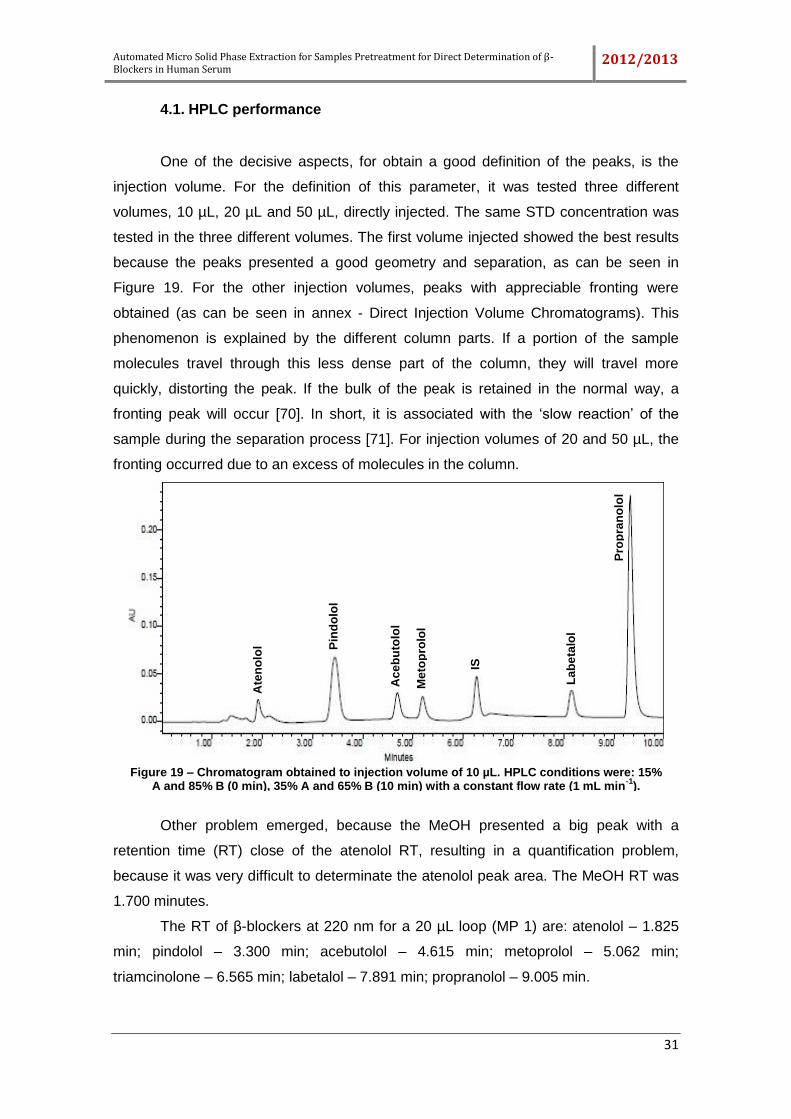
Automated Micro Solid Phase Extraction for Samples Pretreatment for Direct Determination of β-Blockers in Human Serum 2012/2013
31
4.1. HPLC performance
One of the decisive aspects, for obtain a good definition of the peaks, is the
injection volume. For the definition of this parameter, it was tested three different
volumes, 10 µL, 20 µL and 50 µL, directly injected. The same STD concentration was
tested in the three different volumes. The first volume injected showed the best results
because the peaks presented a good geometry and separation, as can be seen in
Figure 19. For the other injection volumes, peaks with appreciable fronting were
obtained (as can be seen in annex - Direct Injection Volume Chromatograms). This
phenomenon is explained by the different column parts. If a portion of the sample
molecules travel through this less dense part of the column, they will travel more
quickly, distorting the peak. If the bulk of the peak is retained in the normal way, a
fronting peak will occur [70]. In short, it is associated with the ‘slow reaction’ of the
sample during the separation process [71]. For injection volumes of 20 and 50 µL, the
fronting occurred due to an excess of molecules in the column.
Other problem emerged, because the MeOH presented a big peak with a
retention time (RT) close of the atenolol RT, resulting in a quantification problem,
because it was very difficult to determinate the atenolol peak area. The MeOH RT was
1.700 minutes.
The RT of β-blockers at 220 nm for a 20 µL loop (MP 1) are: atenolol – 1.825
min; pindolol – 3.300 min; acebutolol – 4.615 min; metoprolol – 5.062 min;
triamcinolone – 6.565 min; labetalol – 7.891 min; propranolol – 9.005 min.
Ate
no
lol P
ind
olo
l
Ace
bu
tolo
l
Me
top
rolo
l
IS
La
be
talo
l
Pro
pra
no
lol
Figure 19 – Chromatogram obtained to injection volume of 10 µL. HPLC conditions were: 15% A and 85% B (0 min), 35% A and 65% B (10 min) with a constant flow rate (1 mL min
-1).
Automated Micro Solid Phase Extraction for Samples Pretreatment for Direct Determination of β-Blockers in Human Serum 2012/2013
32
In an attempt to remove the MeOH interference, it was changed the HPLC loop
for 200 µL and the injection volume was increased, however, the samples were diluted.
This was done because in the on-line procedure is necessary to inject a big amount of
volume in the column, and in future this method can be used in on-line processes. It
was used water for dilution, because the use of the original composition of MP (15%
AcN with 85% phosphate buffer) caused the disappearing of the atenolol peak. The
dilution ratio was optimized and the best results were obtained for the 1:4 dilution, as
can be seen in Figure 20 (red line). The limiting sample volume to inject in HPLC was
40 µL. In 1:4 dilution, the peaks presented a good geometry and separation. For the
other dilutions, the peaks showed fronting. For the off-line process this parameter is not
important, so in all determinations it was used the 20 µL loop.
Figure 20 – Comparison of the different dilutions ratio. The red line represents the best dilution ratio (1:4).
However, it was necessary to adjust the percentages of constituents of MP, as
can be seen in Table 4 in Chapter 3. With this new condition all peaks appeared before
7 minutes, and all presented good separation and geometry. This new condition was
necessary because with the previous one the propranolol peak did not appear.
New RT were: atenolol – 2.094 min; pindolol – 3.283 min; acebutolol – 4.116
min; metoprolol – 4.468 min; sorbic acid – 5.144 min; labetalol – 5.962 min; propranolol
– 6.672 min.
Different IS were tested, because the initial IS (sorbic acid) was not retained in
the SupelMIPTM Beta-blockers. Seven compounds were tested (the chromatograms are
in annex – Internal Standard Chromatograms). The rosmarinic acid presented 1 peak
Ate
no
lol
Pin
do
lol
Aceb
uto
lol
Me
top
rolo
l
IS
La
beta
lol
Pro
pra
no
lol
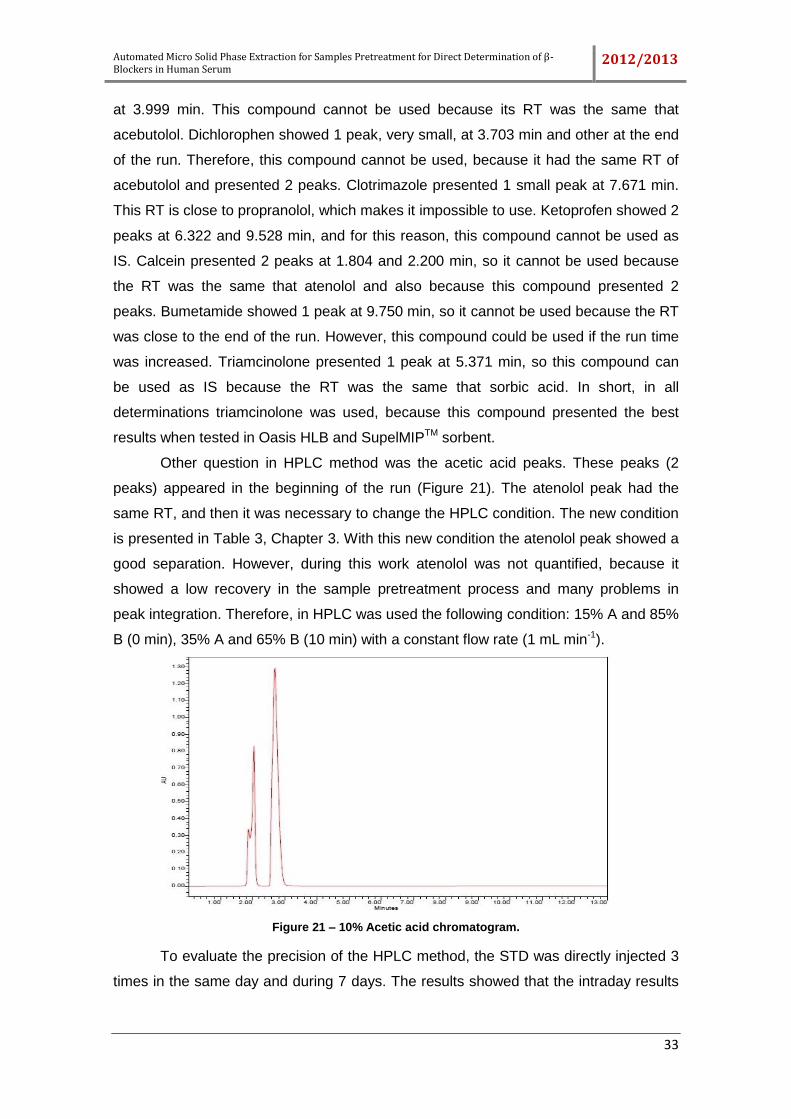
Automated Micro Solid Phase Extraction for Samples Pretreatment for Direct Determination of β-Blockers in Human Serum 2012/2013
33
at 3.999 min. This compound cannot be used because its RT was the same that
acebutolol. Dichlorophen showed 1 peak, very small, at 3.703 min and other at the end
of the run. Therefore, this compound cannot be used, because it had the same RT of
acebutolol and presented 2 peaks. Clotrimazole presented 1 small peak at 7.671 min.
This RT is close to propranolol, which makes it impossible to use. Ketoprofen showed 2
peaks at 6.322 and 9.528 min, and for this reason, this compound cannot be used as
IS. Calcein presented 2 peaks at 1.804 and 2.200 min, so it cannot be used because
the RT was the same that atenolol and also because this compound presented 2
peaks. Bumetamide showed 1 peak at 9.750 min, so it cannot be used because the RT
was close to the end of the run. However, this compound could be used if the run time
was increased. Triamcinolone presented 1 peak at 5.371 min, so this compound can
be used as IS because the RT was the same that sorbic acid. In short, in all
determinations triamcinolone was used, because this compound presented the best
results when tested in Oasis HLB and SupelMIPTM sorbent.
Other question in HPLC method was the acetic acid peaks. These peaks (2
peaks) appeared in the beginning of the run (Figure 21). The atenolol peak had the
same RT, and then it was necessary to change the HPLC condition. The new condition
is presented in Table 3, Chapter 3. With this new condition the atenolol peak showed a
good separation. However, during this work atenolol was not quantified, because it
showed a low recovery in the sample pretreatment process and many problems in
peak integration. Therefore, in HPLC was used the following condition: 15% A and 85%
B (0 min), 35% A and 65% B (10 min) with a constant flow rate (1 mL min-1).
Figure 21 – 10% Acetic acid chromatogram.
To evaluate the precision of the HPLC method, the STD was directly injected 3
times in the same day and during 7 days. The results showed that the intraday results
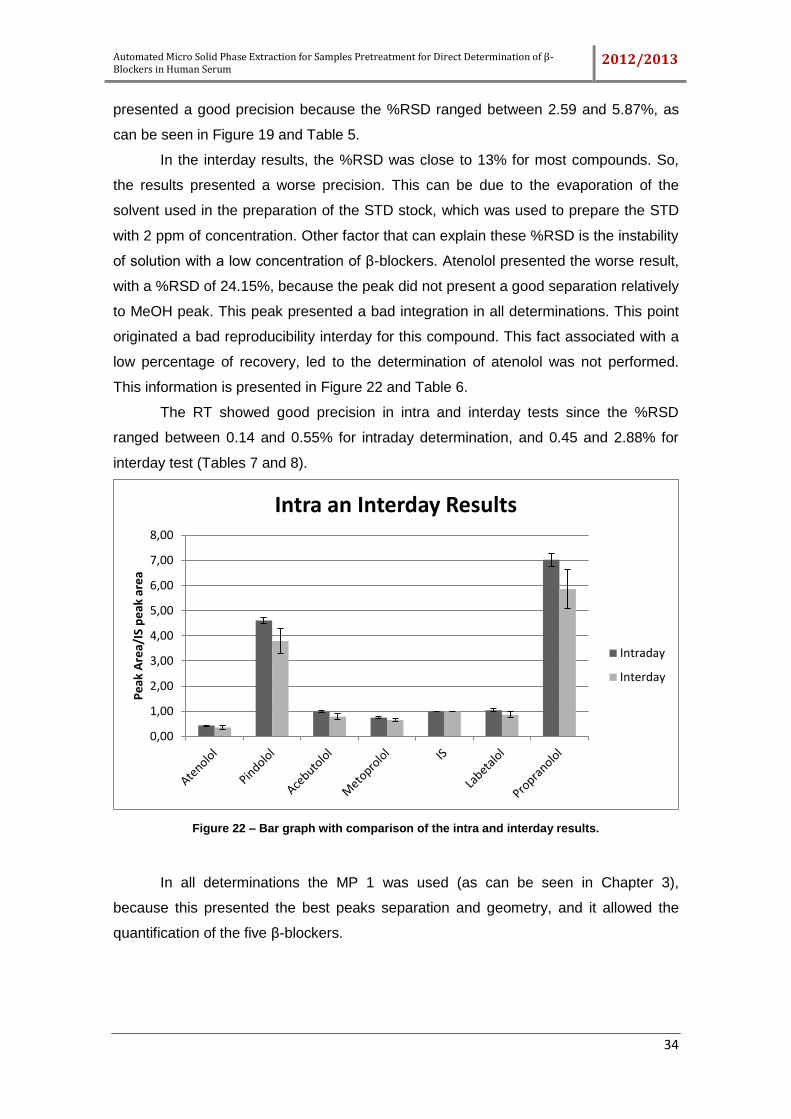
Automated Micro Solid Phase Extraction for Samples Pretreatment for Direct Determination of β-Blockers in Human Serum 2012/2013
34
presented a good precision because the %RSD ranged between 2.59 and 5.87%, as
can be seen in Figure 19 and Table 5.
In the interday results, the %RSD was close to 13% for most compounds. So,
the results presented a worse precision. This can be due to the evaporation of the
solvent used in the preparation of the STD stock, which was used to prepare the STD
with 2 ppm of concentration. Other factor that can explain these %RSD is the instability
of solution with a low concentration of β-blockers. Atenolol presented the worse result,
with a %RSD of 24.15%, because the peak did not present a good separation relatively
to MeOH peak. This peak presented a bad integration in all determinations. This point
originated a bad reproducibility interday for this compound. This fact associated with a
low percentage of recovery, led to the determination of atenolol was not performed.
This information is presented in Figure 22 and Table 6.
The RT showed good precision in intra and interday tests since the %RSD
ranged between 0.14 and 0.55% for intraday determination, and 0.45 and 2.88% for
interday test (Tables 7 and 8).
Figure 22 – Bar graph with comparison of the intra and interday results.
In all determinations the MP 1 was used (as can be seen in Chapter 3),
because this presented the best peaks separation and geometry, and it allowed the
quantification of the five β-blockers.
0,00
1,00
2,00
3,00
4,00
5,00
6,00
7,00
8,00
Pe
ak A
rea/
IS p
eak
are
a
Intra an Interday Results
Intraday
Interday
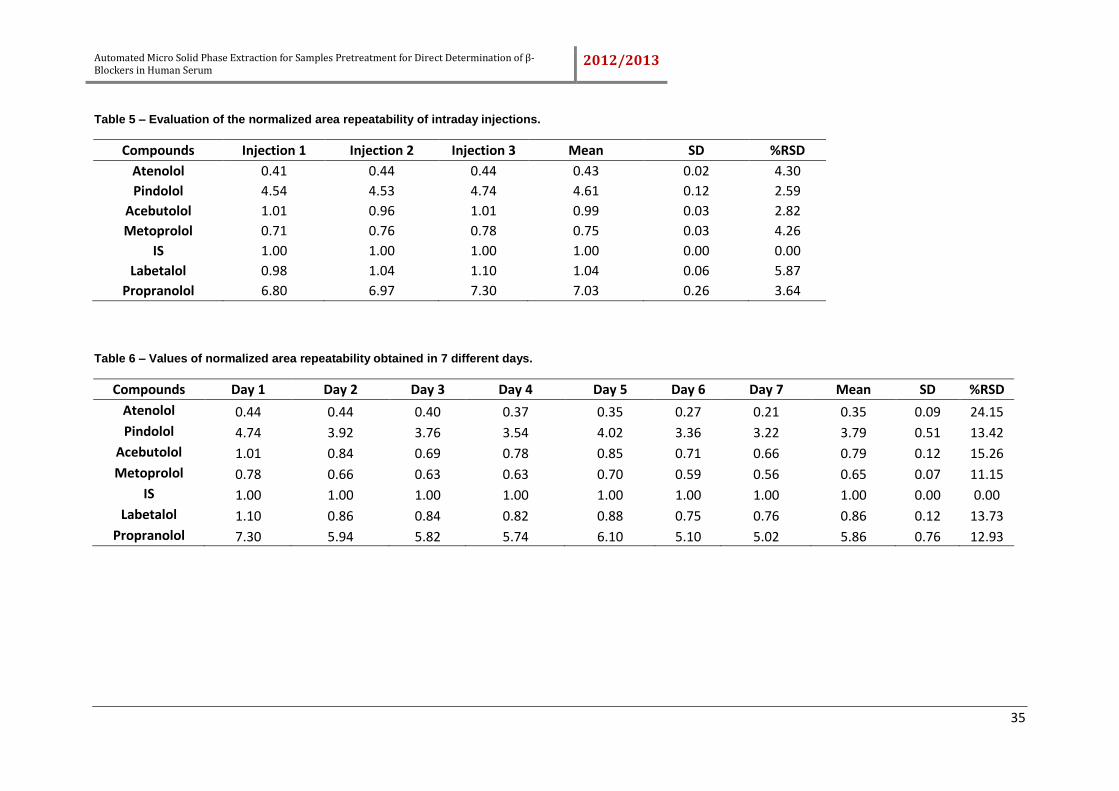
Automated Micro Solid Phase Extraction for Samples Pretreatment for Direct Determination of β-Blockers in Human Serum
2012/2013
35
Table 5 – Evaluation of the normalized area repeatability of intraday injections.
Compounds Injection 1 Injection 2 Injection 3 Mean SD %RSD
Atenolol 0.41 0.44 0.44 0.43 0.02 4.30
Pindolol 4.54 4.53 4.74 4.61 0.12 2.59
Acebutolol 1.01 0.96 1.01 0.99 0.03 2.82
Metoprolol 0.71 0.76 0.78 0.75 0.03 4.26
IS 1.00 1.00 1.00 1.00 0.00 0.00
Labetalol 0.98 1.04 1.10 1.04 0.06 5.87
Propranolol 6.80 6.97 7.30 7.03 0.26 3.64
Table 6 – Values of normalized area repeatability obtained in 7 different days.
Compounds Day 1 Day 2 Day 3 Day 4 Day 5 Day 6 Day 7 Mean SD %RSD
Atenolol 0.44 0.44 0.40 0.37 0.35 0.27 0.21 0.35 0.09 24.15
Pindolol 4.74 3.92 3.76 3.54 4.02 3.36 3.22 3.79 0.51 13.42
Acebutolol 1.01 0.84 0.69 0.78 0.85 0.71 0.66 0.79 0.12 15.26
Metoprolol 0.78 0.66 0.63 0.63 0.70 0.59 0.56 0.65 0.07 11.15
IS 1.00 1.00 1.00 1.00 1.00 1.00 1.00 1.00 0.00 0.00
Labetalol 1.10 0.86 0.84 0.82 0.88 0.75 0.76 0.86 0.12 13.73
Propranolol 7.30 5.94 5.82 5.74 6.10 5.10 5.02 5.86 0.76 12.93
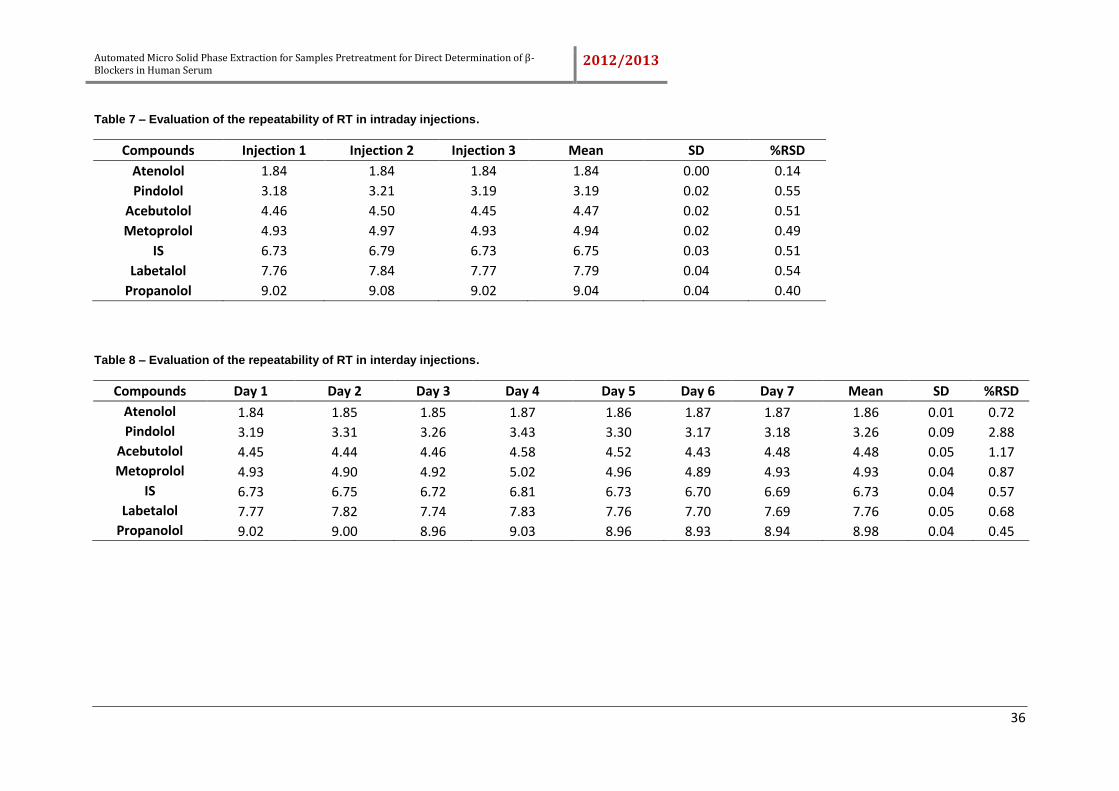
Automated Micro Solid Phase Extraction for Samples Pretreatment for Direct Determination of β-Blockers in Human Serum 2012/2013
36
Table 7 – Evaluation of the repeatability of RT in intraday injections.
Compounds Injection 1 Injection 2 Injection 3 Mean SD %RSD
Atenolol 1.84 1.84 1.84 1.84 0.00 0.14
Pindolol 3.18 3.21 3.19 3.19 0.02 0.55
Acebutolol 4.46 4.50 4.45 4.47 0.02 0.51
Metoprolol 4.93 4.97 4.93 4.94 0.02 0.49
IS 6.73 6.79 6.73 6.75 0.03 0.51
Labetalol 7.76 7.84 7.77 7.79 0.04 0.54
Propanolol 9.02 9.08 9.02 9.04 0.04 0.40
Table 8 – Evaluation of the repeatability of RT in interday injections.
Compounds Day 1 Day 2 Day 3 Day 4 Day 5 Day 6 Day 7 Mean SD %RSD
Atenolol 1.84 1.85 1.85 1.87 1.86 1.87 1.87 1.86 0.01 0.72
Pindolol 3.19 3.31 3.26 3.43 3.30 3.17 3.18 3.26 0.09 2.88
Acebutolol 4.45 4.44 4.46 4.58 4.52 4.43 4.48 4.48 0.05 1.17
Metoprolol 4.93 4.90 4.92 5.02 4.96 4.89 4.93 4.93 0.04 0.87
IS 6.73 6.75 6.72 6.81 6.73 6.70 6.69 6.73 0.04 0.57
Labetalol 7.77 7.82 7.74 7.83 7.76 7.70 7.69 7.76 0.05 0.68
Propanolol 9.02 9.00 8.96 9.03 8.96 8.93 8.94 8.98 0.04 0.45
Automated Micro Solid Phase Extraction for Samples Pretreatment for Direct Determination of β-Blockers in Human Serum
2012/2013
37
4.2. Extraction procedure optimization
The implementation of microscale SPE based on the bead injection concept
using the LOV format requires a precise control of volume delivered and flow rates
applied, in order to accomplish an excellent performance in all steps of sample
preparation, especially for bead trapping, sample handling and elution of analytes [59].
For this reason, a lot of steps were optimized.
4.2.1. Selection of BI-SPE sorbent for LOV analysis
Preliminary tests were conducted to ascertain the sorptive pre-concentration
capabilities of a series of sorbent materials. These tests were performed with the
manual procedure described in the Chapter 3. Five different reversed-phase sorbent
materials were investigated. These preliminary tests allowed selecting the sorbent to
apply in the automated system. The recovery was the parameter evaluated for this
selection.
For the big cartridge of the Oasis HLB, the recovery was about 0%, when it was
used the technique described in the literature. This occurred because in the washing
step, they used water containing 5% of MeOH which caused the elution of the
compounds. This was verified with the injection of the washing fraction. The
compounds appeared in this fraction, so it was essential to remove this step.
Consequently, it was just used water for washing, and the recovery of the compounds
increased. The new recovery ranged between 10% and 47%. However the results
showed a high %RSD, this demonstrates a lack of repeatability between the
determinations. This can be explained by the errors that occur in manual procedure.
However, in the future, it will be necessary to test other pH conditions and other elution
solvents, because these parameters are essential for the extraction of the compounds.
In the small cartridge, the recovery ranged between 60% and 96%. The exception was
atenolol, since it showed 9% of recovery.
The SupelMIPTM Beta-blockers (washed with AcN) presented a recovery
between 86% and 127% for β-blockers however it did not retain the sorbic acid. This
fact originated the necessity of choosing a new IS, as can be seen in Chapter 4.1.
However, the new IS only presented 7% of the recovery. The SupelMIPTM Beta-
blockers (washed with toluene) presented a recovery between 68% and 102% for β-
blockers however it did not retain the triamcinolone. The dichloromethane is essential
Automated Micro Solid Phase Extraction for Samples Pretreatment for Direct Determination of β-Blockers in Human Serum 2012/2013
38
for selectivity of MIP however the LOV did not had resistance for this solvent. In the
literature was said that toluene can be used to promote the selectivity of MIP, and the
results demonstrated that toluene can be an alternative to dichloromethane [72, 73].
However the recovery was smaller when compared to the recovery obtained with
dichloromethane.
The Blond Elute Plexa showed a recovery between 91% and 150% for β-
blockers, but it only showed 17% for triamcinolone (IS).
The Blond Elute Plexa – PCX showed a recovery between 27% and 149% for
β-blockers, but it only showed 4% for triamcinolone (IS). The results showed a lower
retention of pindolol, because the recovery was 27%.
The Blond Elute Plexa – PAX, with 5% of MeOH in washing step, presented a
recovery between 51% and 107% for β-blockers, but it only showed 7% for IS. These
results are better when compared with the results obtained for PAX with formic acid in
the washing step. This process showed a recovery between 0.17% and 43.65% for β-
blockers. These results are due to the fact that β-blockers presented basic
characteristics and this material is used for pretreatment of the samples with acid
analytes.
All results are presented in Tables 9 and 10.
For this reason the sorbent selected for serum analyses was the MIP, because
it showed the best recovery and this material have higher selectivity for β-blockers
existing in serum samples [72, 73]. However, in the first optimization of the LOV
system, it was used Oasis HLB, because this sorbent have more material and is less
expensive than other sorbents. For these reasons it was used for operate training.
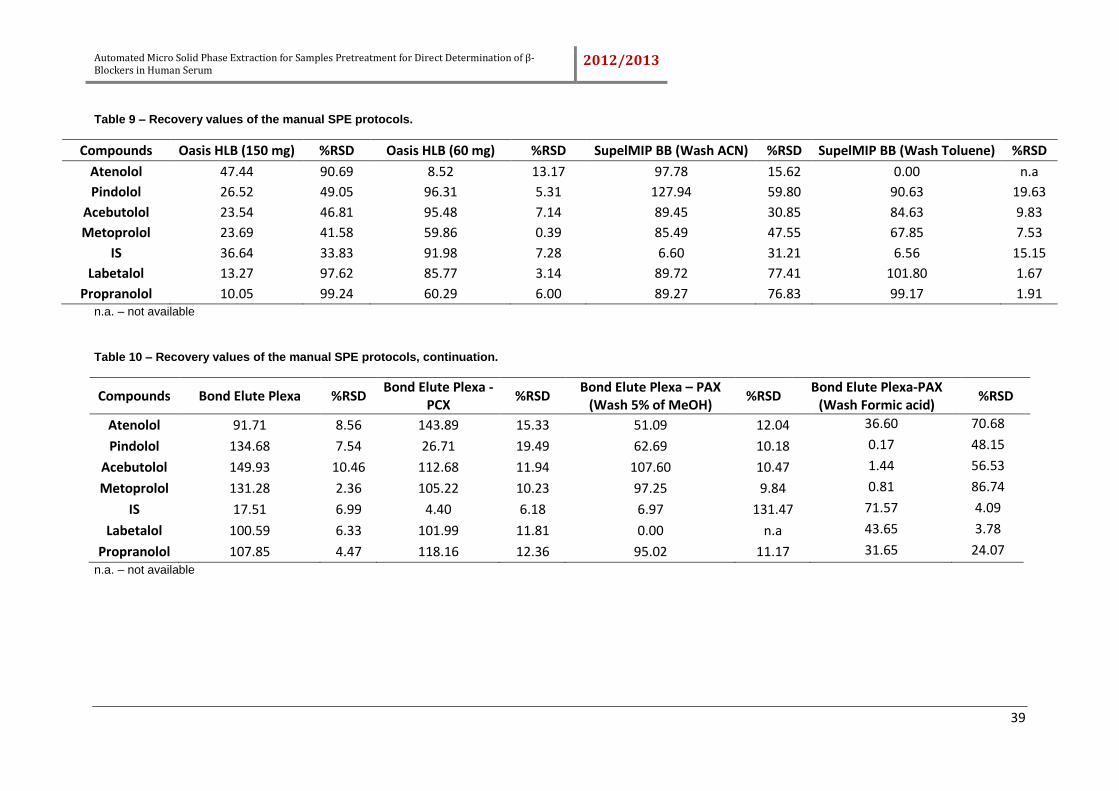
Automated Micro Solid Phase Extraction for Samples Pretreatment for Direct Determination of β-Blockers in Human Serum
2012/2013
39
Table 9 – Recovery values of the manual SPE protocols.
Compounds Oasis HLB (150 mg) %RSD Oasis HLB (60 mg) %RSD SupelMIP BB (Wash ACN) %RSD SupelMIP BB (Wash Toluene) %RSD
Atenolol 47.44 90.69 8.52 13.17 97.78 15.62 0.00 n.a
Pindolol 26.52 49.05 96.31 5.31 127.94 59.80 90.63 19.63
Acebutolol 23.54 46.81 95.48 7.14 89.45 30.85 84.63 9.83
Metoprolol 23.69 41.58 59.86 0.39 85.49 47.55 67.85 7.53
IS 36.64 33.83 91.98 7.28 6.60 31.21 6.56 15.15
Labetalol 13.27 97.62 85.77 3.14 89.72 77.41 101.80 1.67
Propranolol 10.05 99.24 60.29 6.00 89.27 76.83 99.17 1.91 n.a. – not available
Table 10 – Recovery values of the manual SPE protocols, continuation.
Compounds Bond Elute Plexa %RSD Bond Elute Plexa -
PCX %RSD
Bond Elute Plexa – PAX (Wash 5% of MeOH)
%RSD Bond Elute Plexa-PAX
(Wash Formic acid) %RSD
Atenolol 91.71 8.56 143.89 15.33 51.09 12.04 36.60 70.68
Pindolol 134.68 7.54 26.71 19.49 62.69 10.18 0.17 48.15
Acebutolol 149.93 10.46 112.68 11.94 107.60 10.47 1.44 56.53
Metoprolol 131.28 2.36 105.22 10.23 97.25 9.84 0.81 86.74
IS 17.51 6.99 4.40 6.18 6.97 131.47 71.57 4.09
Labetalol 100.59 6.33 101.99 11.81 0.00 n.a 43.65 3.78
Propranolol 107.85 4.47 118.16 12.36 95.02 11.17 31.65 24.07
n.a. – not available
Automated Micro Solid Phase Extraction for Samples Pretreatment for Direct Determination of β-Blockers in Human Serum
2012/2013
40
4.2.2. Bead package
For the application of the SPE in SIA is necessary to define the bead package
conditions. The package depends on the flow rate and volume of the bead suspension,
as well as the pressure, particle sizes and the suspensor solvent. In BI, the solid-phase
suspended in a given solvent is a dynamic part of the system that is treated as a
homogeneous solution [58]. However, it is necessary a step before aspiration of the
bead for HC, in order to dispense the bead in the LOV port. In this work it was used air
or MeOH to suspend the bead. The direct aspiration of the bead suspension was
impossible because it remained compacted in LOV port originating a breaking flow and
an increase of pressure. For the air, the bead packing was not uniform, because a
breaking flow occurred. This procedure originated %RSD of 24%. The best results
appeared with MeOH which was used for suspending the bead. In Oasis HLB, the
conditions shown in section 3.5.2 present a %RSD of 17% and the mass of the bead
was 8.4 mg ± 1.4 mg. The SupelMIPTM Beta-blockers showed the best %RSD (16%)
and the mass of the bead inside of the LOV port was 5.18 mg ± 0.81 mg. For some
experiments, the bead microcolumn presented an accentuated mass variation,
demonstrating that the packing column method was not robust. This factor originates a
high %RSD. In these cases the bead was removed to the waste, allowing a
homogeneous bead packed in all samples pretreatment.
4.2.3. Effect of eluent flow rate and eluent volume
These two parameters are essential for a complete extraction of the compounds
present in the bead microcolumn. For their optimization, it was performed a recovery
evaluation.
In the case of Oasis HLB, the best results were associated with the elution
volume of 150 µL at a flow rate of 0.5 mL min-1, as can be seen in Tables 11 and 12.
The β-blockers recovery ranged between 75% and 94%, and the results showed to be
repeatable, since the %RSD was less than 5% for the majority of the compounds.
However, the %RSD of atenolol and metoprolol showed a high value, because it was
observed accentuated baseline interference. For the selection of the elution volume, it
was not considered the atenolol recovery, because its integration was very difficult, as
already explained in section 4.1. However, for the other volumes, the recoveries were
very similar, ranging between 1% and 19%. For the flow rates 0.15 and 0.20 mL min-1,
Automated Micro Solid Phase Extraction for Samples Pretreatment for Direct Determination of β-Blockers in Human Serum 2012/2013
41
the recovery was inferior, because these flow rates were too slow to remove and to
break the interaction between β-blockers and sorbent. In the case of the flow rates
superior to 0.5 mL min-1 the recovery was inferior, because these flow rates were too
fast and did not allowed the best time for contact between sorbent and elution solvent.
This contact time is essential for a complete elution of the compounds.
The SupelMIPTM showed the best results for elution volume of 80 µL at a flow
rate of 0.5 mL min-1, as can be seen in Tables 13 and 14. The β-blockers recovery
ranged between 85% and 112%, and the results showed to be reproducible, since the
%RSD was less than 5% for the majority of the compounds. The exception was
atenolol, since it presented 36% of recovery and a %RSD of 7%. The selected
conditions did not showed the best total recovery, but showed the best results in the
first extraction. These were selected because a process of samples pretreatment
requires maximum recovery in the first fraction. This point is very important for
employing this method in on-line procedures. For other conditions, the recovery
showed to be smaller because the flow rate and the extraction volume did not allowed
the perfect contact between sorbent and extraction solvent, as already explained in the
previous paragraph.
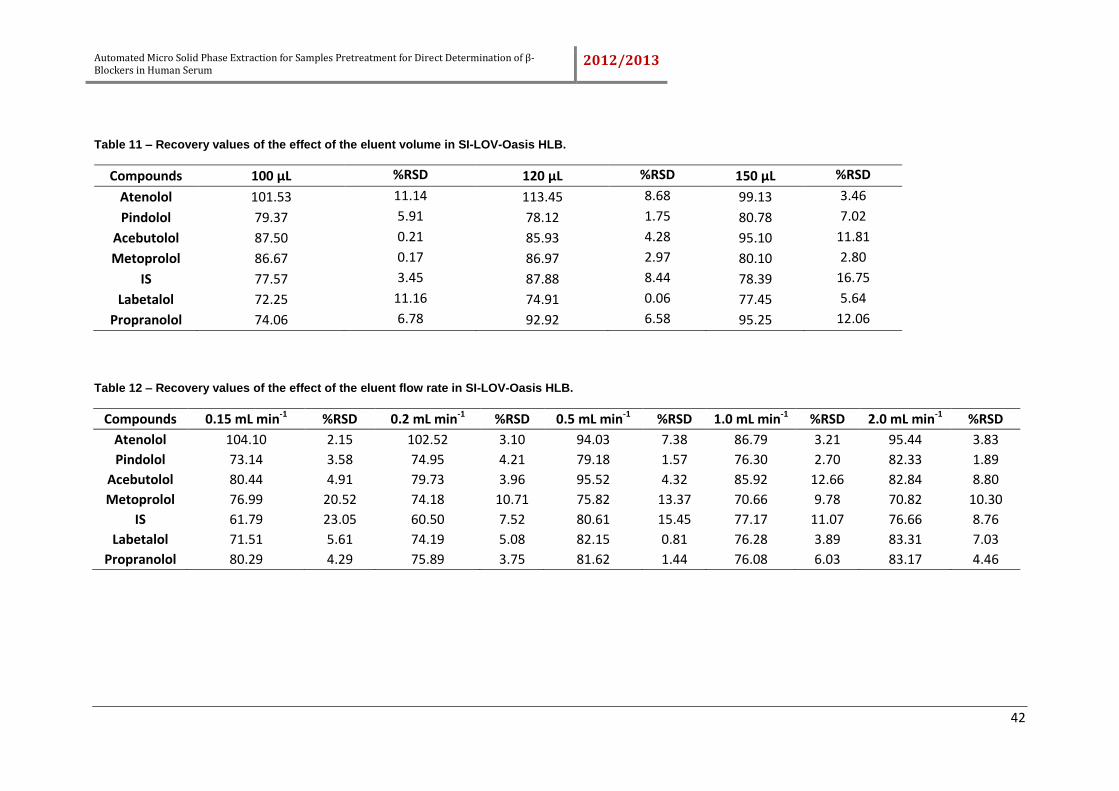
Automated Micro Solid Phase Extraction for Samples Pretreatment for Direct Determination of β-Blockers in Human Serum
2012/2013
42
Table 11 – Recovery values of the effect of the eluent volume in SI-LOV-Oasis HLB.
Compounds 100 µL %RSD 120 µL %RSD 150 µL %RSD
Atenolol 101.53 11.14 113.45 8.68 99.13 3.46
Pindolol 79.37 5.91 78.12 1.75 80.78 7.02
Acebutolol 87.50 0.21 85.93 4.28 95.10 11.81
Metoprolol 86.67 0.17 86.97 2.97 80.10 2.80
IS 77.57 3.45 87.88 8.44 78.39 16.75
Labetalol 72.25 11.16 74.91 0.06 77.45 5.64
Propranolol 74.06 6.78 92.92 6.58 95.25 12.06
Table 12 – Recovery values of the effect of the eluent flow rate in SI-LOV-Oasis HLB.
Compounds 0.15 mL min-1 %RSD 0.2 mL min-1 %RSD 0.5 mL min-1 %RSD 1.0 mL min-1 %RSD 2.0 mL min-1 %RSD
Atenolol 104.10 2.15 102.52 3.10 94.03 7.38 86.79 3.21 95.44 3.83
Pindolol 73.14 3.58 74.95 4.21 79.18 1.57 76.30 2.70 82.33 1.89
Acebutolol 80.44 4.91 79.73 3.96 95.52 4.32 85.92 12.66 82.84 8.80
Metoprolol 76.99 20.52 74.18 10.71 75.82 13.37 70.66 9.78 70.82 10.30
IS 61.79 23.05 60.50 7.52 80.61 15.45 77.17 11.07 76.66 8.76
Labetalol 71.51 5.61 74.19 5.08 82.15 0.81 76.28 3.89 83.31 7.03
Propranolol 80.29 4.29 75.89 3.75 81.62 1.44 76.08 6.03 83.17 4.46
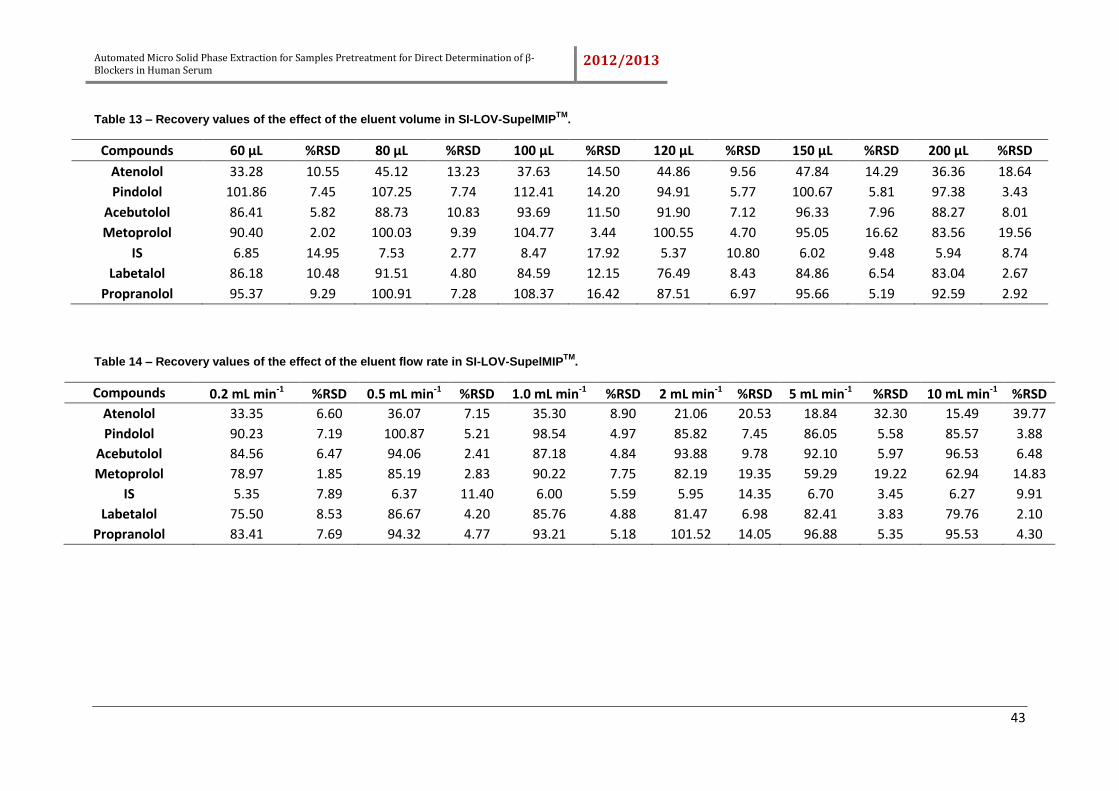
Automated Micro Solid Phase Extraction for Samples Pretreatment for Direct Determination of β-Blockers in Human Serum
2012/2013
43
Table 13 – Recovery values of the effect of the eluent volume in SI-LOV-SupelMIPTM
.
Compounds 60 µL %RSD 80 µL %RSD 100 µL %RSD 120 µL %RSD 150 µL %RSD 200 µL %RSD
Atenolol 33.28 10.55 45.12 13.23 37.63 14.50 44.86 9.56 47.84 14.29 36.36 18.64
Pindolol 101.86 7.45 107.25 7.74 112.41 14.20 94.91 5.77 100.67 5.81 97.38 3.43
Acebutolol 86.41 5.82 88.73 10.83 93.69 11.50 91.90 7.12 96.33 7.96 88.27 8.01
Metoprolol 90.40 2.02 100.03 9.39 104.77 3.44 100.55 4.70 95.05 16.62 83.56 19.56
IS 6.85 14.95 7.53 2.77 8.47 17.92 5.37 10.80 6.02 9.48 5.94 8.74
Labetalol 86.18 10.48 91.51 4.80 84.59 12.15 76.49 8.43 84.86 6.54 83.04 2.67
Propranolol 95.37 9.29 100.91 7.28 108.37 16.42 87.51 6.97 95.66 5.19 92.59 2.92
Table 14 – Recovery values of the effect of the eluent flow rate in SI-LOV-SupelMIPTM
.
Compounds 0.2 mL min-1 %RSD 0.5 mL min-1 %RSD 1.0 mL min-1 %RSD 2 mL min-1 %RSD 5 mL min-1 %RSD 10 mL min-1 %RSD
Atenolol 33.35 6.60 36.07 7.15 35.30 8.90 21.06 20.53 18.84 32.30 15.49 39.77
Pindolol 90.23 7.19 100.87 5.21 98.54 4.97 85.82 7.45 86.05 5.58 85.57 3.88
Acebutolol 84.56 6.47 94.06 2.41 87.18 4.84 93.88 9.78 92.10 5.97 96.53 6.48
Metoprolol 78.97 1.85 85.19 2.83 90.22 7.75 82.19 19.35 59.29 19.22 62.94 14.83
IS 5.35 7.89 6.37 11.40 6.00 5.59 5.95 14.35 6.70 3.45 6.27 9.91
Labetalol 75.50 8.53 86.67 4.20 85.76 4.88 81.47 6.98 82.41 3.83 79.76 2.10
Propranolol 83.41 7.69 94.32 4.77 93.21 5.18 101.52 14.05 96.88 5.35 95.53 4.30
Automated Micro Solid Phase Extraction for Samples Pretreatment for Direct Determination of β-Blockers in Human Serum
2012/2013
44
4.2.4. Effect of loading sample flow rate and sample volume
In the case of the Oasis HLB, the best results were associated with sample
volume of 5 mL at a flow rate of 0.5 mL min-1, as can be seen in Table 15. The β-
blockers recovery ranged between 87% and 107%, and the results showed to be
reproducible, since the %RSD was less than 5% for all compounds. However, for other
volumes, the recoveries were very similar ranging between 0.1% and 10%.
For the SupelMIPTM, the best results were obtained for sample volume of 5 mL
at a flow rate of 2 mL min-1, as can be seen in Tables 16 and 17. The flow rate of 1 mL
min-1 presented good results and, in the future, this flow rate should be tested in real
samples. The same occurred for loading sample volume, because the results obtained
for 1 mL was very similar to those obtained for 5 mL. The β-blockers recovery ranged
between 81% and 101%, and the results showed to be reproducible, since the %RSD
was less than 5% for all compounds. However, for the other volumes, the recoveries
were very similar, ranging between 1% and 12%. But other volumes showed lower
repeatability, because they presented %RSD superior to 5%. Then, for calibration
curve and samples analyses SupelMIPTM was used; for samples pretreatment
procedure a loading sample volume of 5 mL was used at a flow rate of 2 mL min-1, and
for elution, it was used 80 µl of 10% HAc at a flow rate of 0.5 mL min-1.
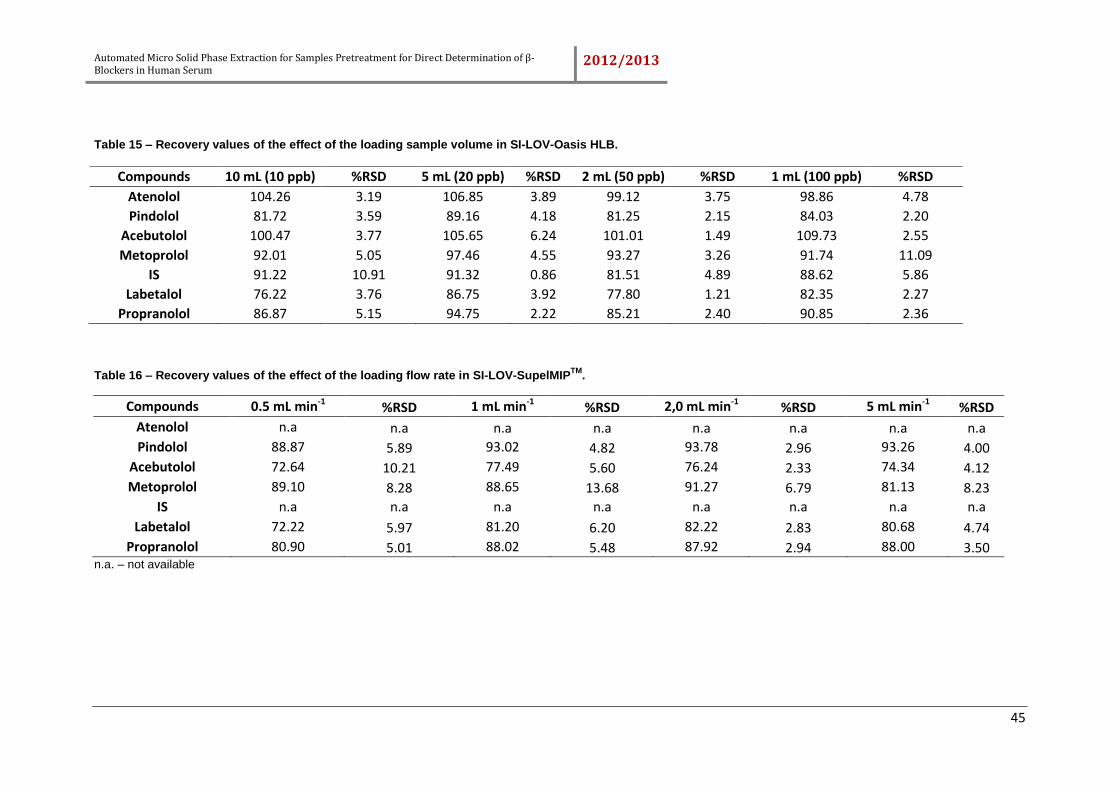
Automated Micro Solid Phase Extraction for Samples Pretreatment for Direct Determination of β-Blockers in Human Serum
2012/2013
45
Table 15 – Recovery values of the effect of the loading sample volume in SI-LOV-Oasis HLB.
Table 16 – Recovery values of the effect of the loading flow rate in SI-LOV-SupelMIPTM
.
Compounds 0.5 mL min-1 %RSD 1 mL min-1 %RSD 2,0 mL min-1 %RSD 5 mL min-1 %RSD
Atenolol n.a n.a n.a n.a n.a n.a n.a n.a
Pindolol 88.87 5.89 93.02 4.82 93.78 2.96 93.26 4.00
Acebutolol 72.64 10.21 77.49 5.60 76.24 2.33 74.34 4.12
Metoprolol 89.10 8.28 88.65 13.68 91.27 6.79 81.13 8.23
IS n.a n.a n.a n.a n.a n.a n.a n.a
Labetalol 72.22 5.97 81.20 6.20 82.22 2.83 80.68 4.74
Propranolol 80.90 5.01 88.02 5.48 87.92 2.94 88.00 3.50 n.a. – not available
Compounds 10 mL (10 ppb) %RSD 5 mL (20 ppb) %RSD 2 mL (50 ppb) %RSD 1 mL (100 ppb) %RSD
Atenolol 104.26 3.19 106.85 3.89 99.12 3.75 98.86 4.78
Pindolol 81.72 3.59 89.16 4.18 81.25 2.15 84.03 2.20
Acebutolol 100.47 3.77 105.65 6.24 101.01 1.49 109.73 2.55
Metoprolol 92.01 5.05 97.46 4.55 93.27 3.26 91.74 11.09
IS 91.22 10.91 91.32 0.86 81.51 4.89 88.62 5.86
Labetalol 76.22 3.76 86.75 3.92 77.80 1.21 82.35 2.27
Propranolol 86.87 5.15 94.75 2.22 85.21 2.40 90.85 2.36
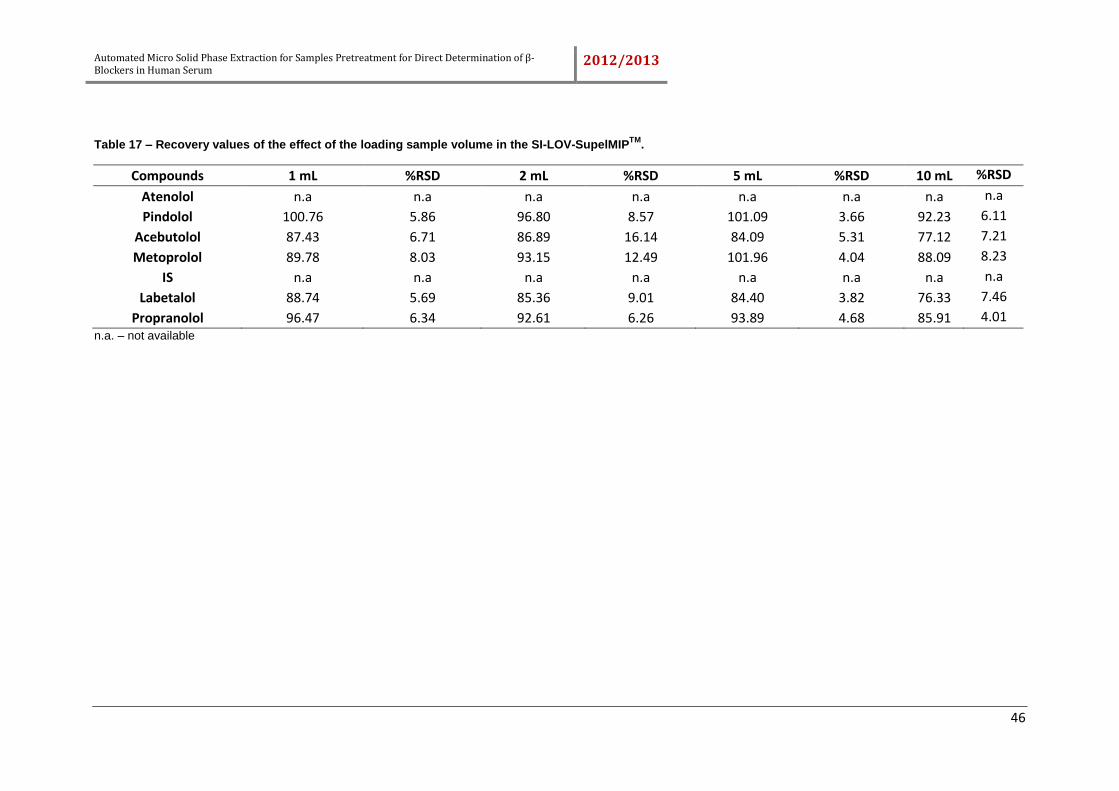
Automated Micro Solid Phase Extraction for Samples Pretreatment for Direct Determination of β-Blockers in Human Serum
2012/2013
46
Table 17 – Recovery values of the effect of the loading sample volume in the SI-LOV-SupelMIPTM
.
Compounds 1 mL %RSD 2 mL %RSD 5 mL %RSD 10 mL %RSD
Atenolol n.a n.a n.a n.a n.a n.a n.a n.a
Pindolol 100.76 5.86 96.80 8.57 101.09 3.66 92.23 6.11
Acebutolol 87.43 6.71 86.89 16.14 84.09 5.31 77.12 7.21
Metoprolol 89.78 8.03 93.15 12.49 101.96 4.04 88.09 8.23
IS n.a n.a n.a n.a n.a n.a n.a n.a
Labetalol 88.74 5.69 85.36 9.01 84.40 3.82 76.33 7.46
Propranolol 96.47 6.34 92.61 6.26 93.89 4.68 85.91 4.01
n.a. – not available
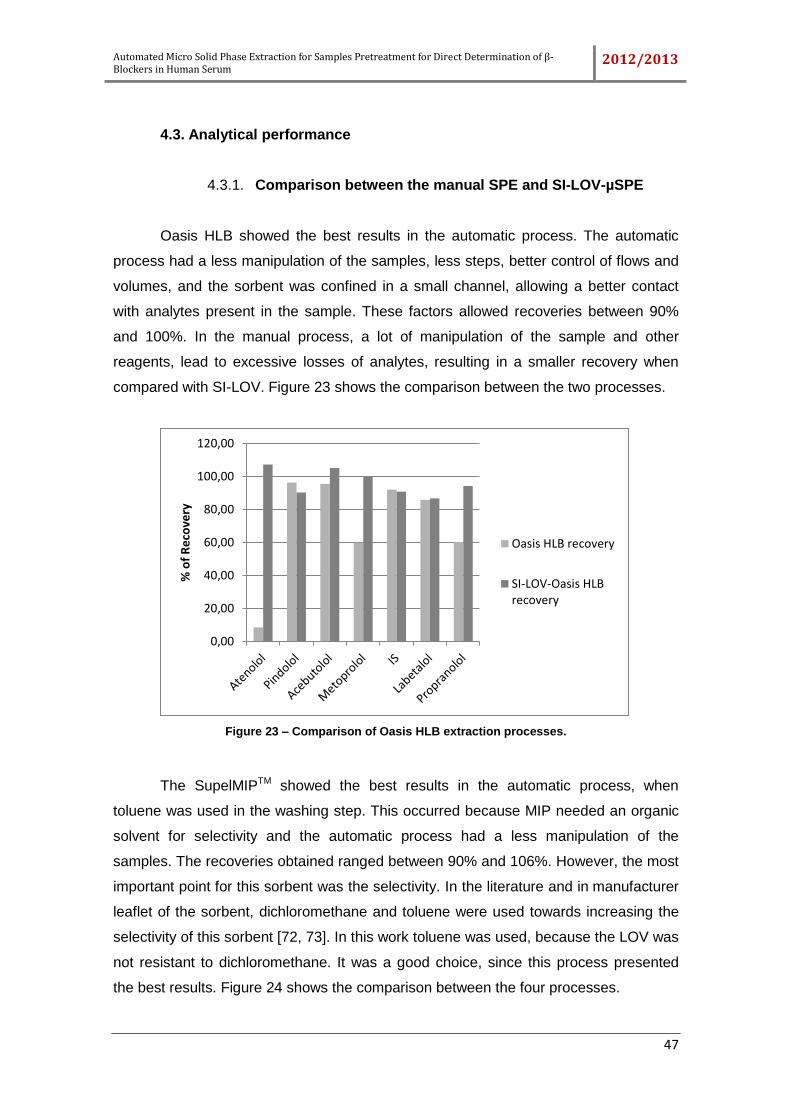
Automated Micro Solid Phase Extraction for Samples Pretreatment for Direct Determination of β-Blockers in Human Serum
2012/2013
47
4.3. Analytical performance
4.3.1. Comparison between the manual SPE and SI-LOV-µSPE
Oasis HLB showed the best results in the automatic process. The automatic
process had a less manipulation of the samples, less steps, better control of flows and
volumes, and the sorbent was confined in a small channel, allowing a better contact
with analytes present in the sample. These factors allowed recoveries between 90%
and 100%. In the manual process, a lot of manipulation of the sample and other
reagents, lead to excessive losses of analytes, resulting in a smaller recovery when
compared with SI-LOV. Figure 23 shows the comparison between the two processes.
Figure 23 – Comparison of Oasis HLB extraction processes.
The SupelMIPTM showed the best results in the automatic process, when
toluene was used in the washing step. This occurred because MIP needed an organic
solvent for selectivity and the automatic process had a less manipulation of the
samples. The recoveries obtained ranged between 90% and 106%. However, the most
important point for this sorbent was the selectivity. In the literature and in manufacturer
leaflet of the sorbent, dichloromethane and toluene were used towards increasing the
selectivity of this sorbent [72, 73]. In this work toluene was used, because the LOV was
not resistant to dichloromethane. It was a good choice, since this process presented
the best results. Figure 24 shows the comparison between the four processes.
0,00
20,00
40,00
60,00
80,00
100,00
120,00
% o
f R
eco
very
Oasis HLB recovery
SI-LOV-Oasis HLBrecovery
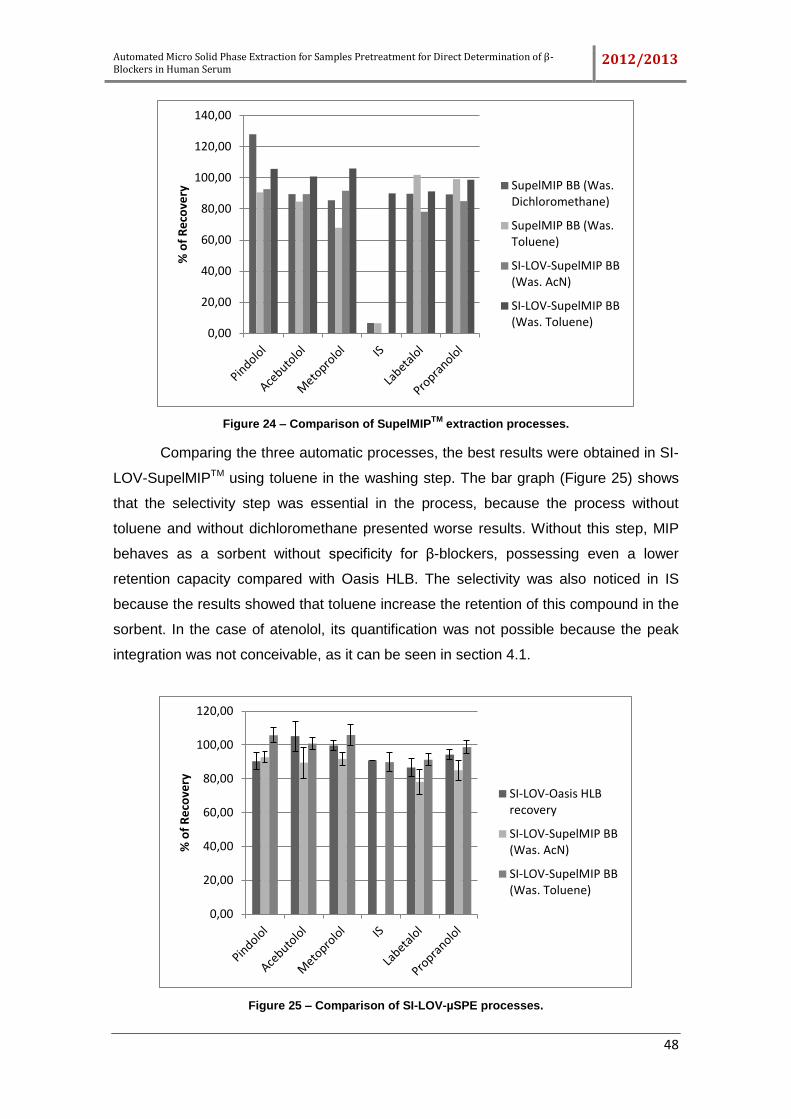
Automated Micro Solid Phase Extraction for Samples Pretreatment for Direct Determination of β-Blockers in Human Serum 2012/2013
48
Figure 24 – Comparison of SupelMIPTM
extraction processes.
Comparing the three automatic processes, the best results were obtained in SI-
LOV-SupelMIPTM using toluene in the washing step. The bar graph (Figure 25) shows
that the selectivity step was essential in the process, because the process without
toluene and without dichloromethane presented worse results. Without this step, MIP
behaves as a sorbent without specificity for β-blockers, possessing even a lower
retention capacity compared with Oasis HLB. The selectivity was also noticed in IS
because the results showed that toluene increase the retention of this compound in the
sorbent. In the case of atenolol, its quantification was not possible because the peak
integration was not conceivable, as it can be seen in section 4.1.
Figure 25 – Comparison of SI-LOV-µSPE processes.
0,00
20,00
40,00
60,00
80,00
100,00
120,00
140,00
% o
f R
eco
very
SupelMIP BB (Was.Dichloromethane)
SupelMIP BB (Was.Toluene)
SI-LOV-SupelMIP BB(Was. AcN)
SI-LOV-SupelMIP BB(Was. Toluene)
0,00
20,00
40,00
60,00
80,00
100,00
120,00
% o
f R
eco
very
SI-LOV-Oasis HLBrecovery
SI-LOV-SupelMIP BB(Was. AcN)
SI-LOV-SupelMIP BB(Was. Toluene)
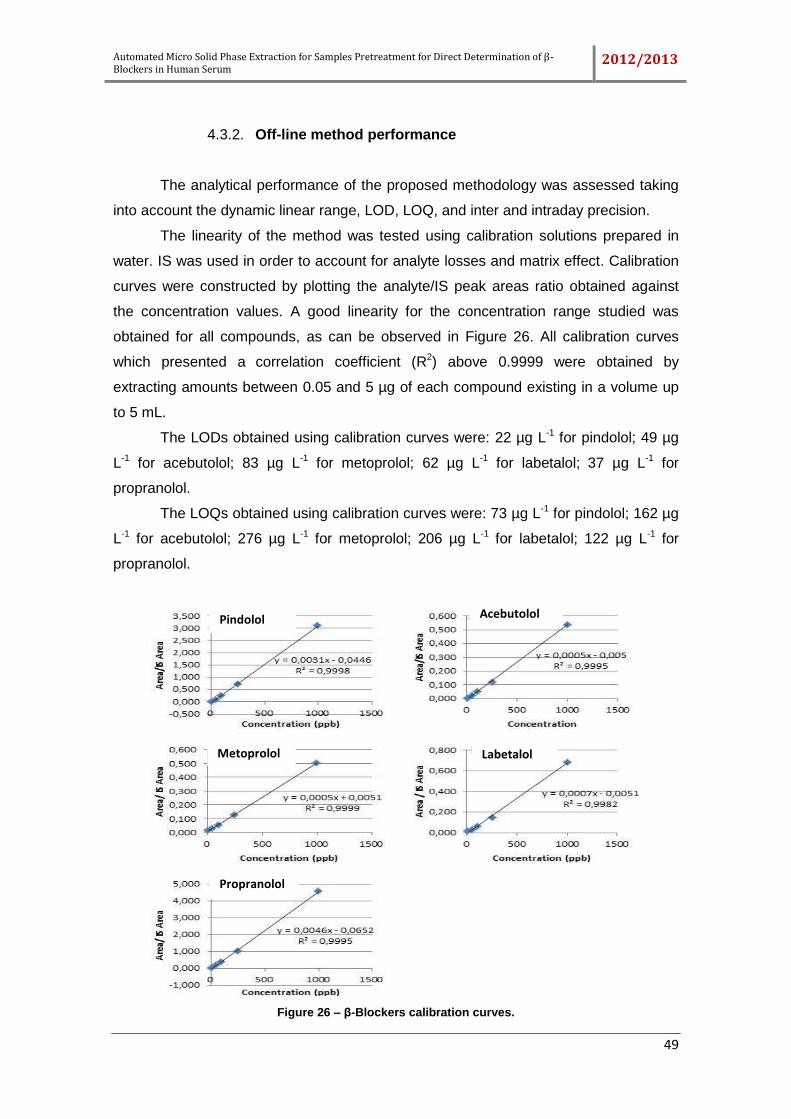
Automated Micro Solid Phase Extraction for Samples Pretreatment for Direct Determination of β-Blockers in Human Serum 2012/2013
49
4.3.2. Off-line method performance
The analytical performance of the proposed methodology was assessed taking
into account the dynamic linear range, LOD, LOQ, and inter and intraday precision.
The linearity of the method was tested using calibration solutions prepared in
water. IS was used in order to account for analyte losses and matrix effect. Calibration
curves were constructed by plotting the analyte/IS peak areas ratio obtained against
the concentration values. A good linearity for the concentration range studied was
obtained for all compounds, as can be observed in Figure 26. All calibration curves
which presented a correlation coefficient (R2) above 0.9999 were obtained by
extracting amounts between 0.05 and 5 µg of each compound existing in a volume up
to 5 mL.
The LODs obtained using calibration curves were: 22 µg L-1 for pindolol; 49 µg
L-1 for acebutolol; 83 µg L-1 for metoprolol; 62 µg L-1 for labetalol; 37 µg L-1 for
propranolol.
The LOQs obtained using calibration curves were: 73 µg L-1 for pindolol; 162 µg
L-1 for acebutolol; 276 µg L-1 for metoprolol; 206 µg L-1 for labetalol; 122 µg L-1 for
propranolol.
Figure 26 – β-Blockers calibration curves.
Propranolol
Labetalol Metoprolol
Acebutolol Pindolol
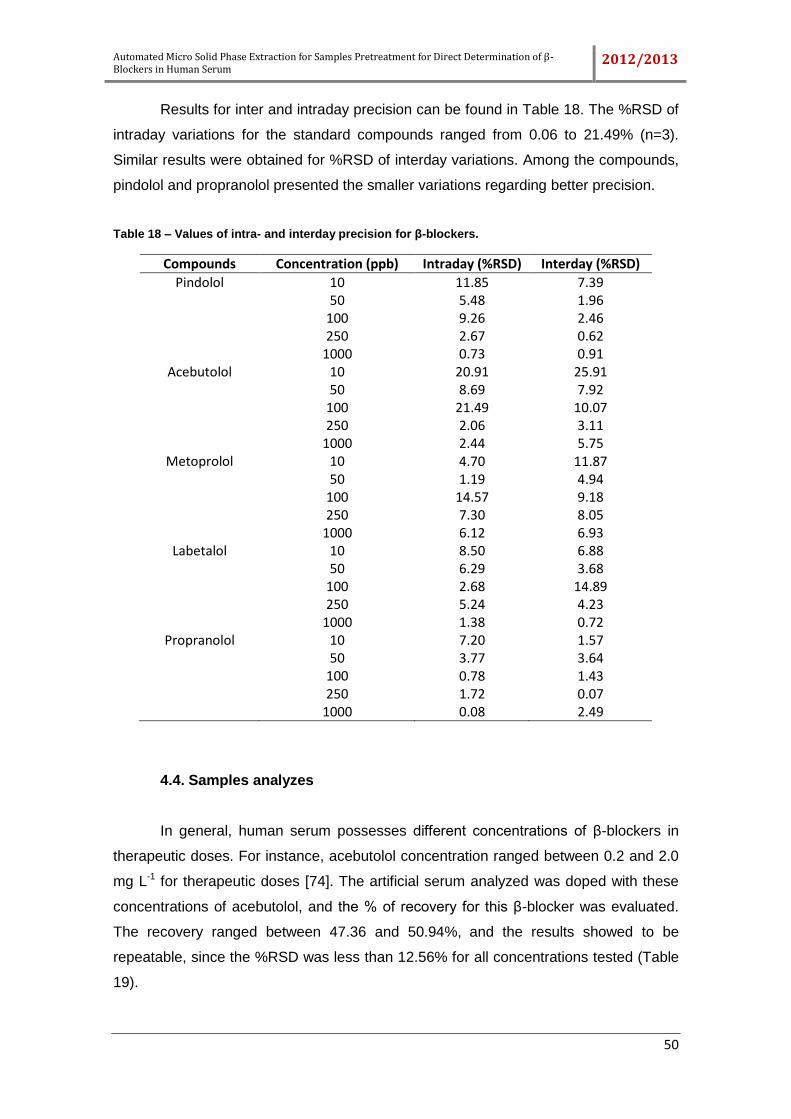
Automated Micro Solid Phase Extraction for Samples Pretreatment for Direct Determination of β-Blockers in Human Serum 2012/2013
50
Results for inter and intraday precision can be found in Table 18. The %RSD of
intraday variations for the standard compounds ranged from 0.06 to 21.49% (n=3).
Similar results were obtained for %RSD of interday variations. Among the compounds,
pindolol and propranolol presented the smaller variations regarding better precision.
Table 18 – Values of intra- and interday precision for β-blockers.
Compounds Concentration (ppb) Intraday (%RSD) Interday (%RSD)
Pindolol 10 11.85 7.39
50 5.48 1.96
100 9.26 2.46
250 2.67 0.62
1000 0.73 0.91
Acebutolol 10 20.91 25.91
50 8.69 7.92
100 21.49 10.07
250 2.06 3.11
1000 2.44 5.75
Metoprolol 10 4.70 11.87
50 1.19 4.94
100 14.57 9.18
250 7.30 8.05
1000 6.12 6.93
Labetalol 10 8.50 6.88
50 6.29 3.68
100 2.68 14.89
250 5.24 4.23
1000 1.38 0.72
Propranolol 10 7.20 1.57
50 3.77 3.64
100 0.78 1.43
250 1.72 0.07
1000 0.08 2.49
4.4. Samples analyzes
In general, human serum possesses different concentrations of β-blockers in
therapeutic doses. For instance, acebutolol concentration ranged between 0.2 and 2.0
mg L-1 for therapeutic doses [74]. The artificial serum analyzed was doped with these
concentrations of acebutolol, and the % of recovery for this β-blocker was evaluated.
The recovery ranged between 47.36 and 50.94%, and the results showed to be
repeatable, since the %RSD was less than 12.56% for all concentrations tested (Table
19).
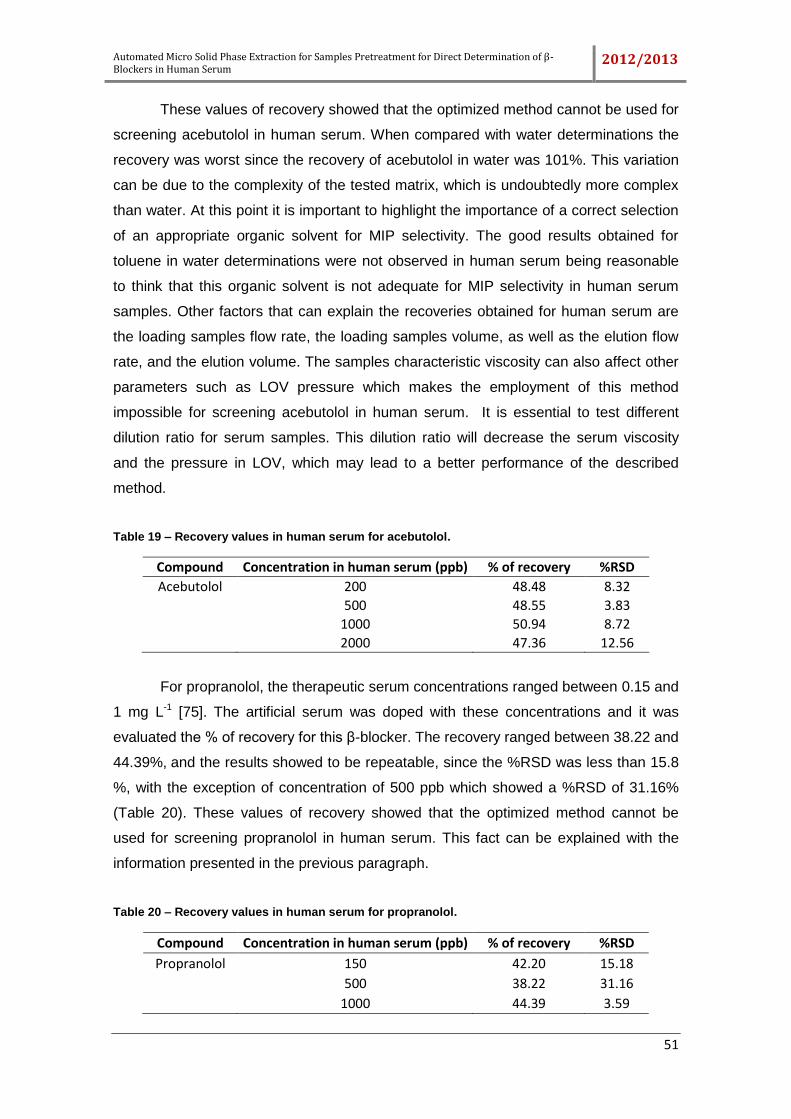
Automated Micro Solid Phase Extraction for Samples Pretreatment for Direct Determination of β-Blockers in Human Serum 2012/2013
51
These values of recovery showed that the optimized method cannot be used for
screening acebutolol in human serum. When compared with water determinations the
recovery was worst since the recovery of acebutolol in water was 101%. This variation
can be due to the complexity of the tested matrix, which is undoubtedly more complex
than water. At this point it is important to highlight the importance of a correct selection
of an appropriate organic solvent for MIP selectivity. The good results obtained for
toluene in water determinations were not observed in human serum being reasonable
to think that this organic solvent is not adequate for MIP selectivity in human serum
samples. Other factors that can explain the recoveries obtained for human serum are
the loading samples flow rate, the loading samples volume, as well as the elution flow
rate, and the elution volume. The samples characteristic viscosity can also affect other
parameters such as LOV pressure which makes the employment of this method
impossible for screening acebutolol in human serum. It is essential to test different
dilution ratio for serum samples. This dilution ratio will decrease the serum viscosity
and the pressure in LOV, which may lead to a better performance of the described
method.
Table 19 – Recovery values in human serum for acebutolol.
Compound Concentration in human serum (ppb) % of recovery %RSD
Acebutolol 200 48.48 8.32
500 48.55 3.83
1000 50.94 8.72
2000 47.36 12.56
For propranolol, the therapeutic serum concentrations ranged between 0.15 and
1 mg L-1 [75]. The artificial serum was doped with these concentrations and it was
evaluated the % of recovery for this β-blocker. The recovery ranged between 38.22 and
44.39%, and the results showed to be repeatable, since the %RSD was less than 15.8
%, with the exception of concentration of 500 ppb which showed a %RSD of 31.16%
(Table 20). These values of recovery showed that the optimized method cannot be
used for screening propranolol in human serum. This fact can be explained with the
information presented in the previous paragraph.
Table 20 – Recovery values in human serum for propranolol.
Compound Concentration in human serum (ppb) % of recovery %RSD
Propranolol 150 42.20 15.18
500 38.22 31.16
1000 44.39 3.59
Automated Micro Solid Phase Extraction for Samples Pretreatment for Direct Determination of β-Blockers in Human Serum 2012/2013
52
5. Conclusion
SPE can be a powerful method for sample preparation and today a laboratory is
not able do analyses for real samples without it. Solid phase extraction is a widely used
sample-preparation technique for isolation, concentration, clean-up and medium
exchange. The development of a more selective and easy-to-use sorbents has resulted
in simplified procedures and a decrease of possible errors.
SPE has many advantages in comparison with more traditional sample
preparation techniques (e.g. liquid-liquid extraction), such as: high recoveries of the
analyte, the achievement of highly purified extracts, the ability to simultaneously extract
analytes of a wide polarity range, as well as easiness of automation, compatibility with
instrumental analysis and reduction of organic solvent. Nowadays, it is very common to
use this process in analytical off- and on-line procedures.
For these reasons, the off-line combination of SI-LOV-µSPE with HPLC has
been demonstrated in this report. This novel methodology capitalizes the combination
between flexibility, miniaturization and simplification in sample preparation integrated
within the LOV mesofluidic platform and the high throughput of the chromatographic
assays supported on the use of a monolithic column. This leads to cost-effective
analytical procedures in terms of labor and reagent expenses, contributing to the
development of miniaturized robust methods with “Green Chemistry” credentials.
The SI-LOV-SupelMIPTM using toluene in the washing step showed the best
results in the sample pretreatment process however its employment in human serum
showed that this methodology was not successfully applied to screening both
acebutolol and propranolol, showing lower values of recovery in this matrix. In the
future, it will be essential to apply this methodology to screening labetalol, metoprolol,
pindolol and propranolol, since this method showed LODs and LOQs compatible with
the therapeutic serum levels for these compounds, being conceivable to use in therapy
compliance or anti-doping controls. Therefore, it is necessary to try to improve the step
related with samples pretreatment adjusting the procedure developed in this work.
Finally, considering the results obtained in manual procedure and µSPE, it
would be interesting, in the future, to focus on the study of other sorbents in SI-BI-LOV,
as well as in Bond Elute Plexa and in Bond Elute Plexa-PCX. These sorbents showed
a good performance in manual procedure and its application in µSPE can originate fast
analyzes and good recoveries. They also have less automatic steps than SupelMIPTM
beta-blockers which is a great advantage compared with MIP. Other important point is
the HPLC separation. The HPLC method used did not allow atenolol quantification,
Automated Micro Solid Phase Extraction for Samples Pretreatment for Direct Determination of β-Blockers in Human Serum 2012/2013
53
because it was not possible to achieve good separation between elution solvent and
atenolol. Therefore, it is important to test other flow rates or mobile phase proportions.
The next step of this work will be crucial to test this method in on-line procedures,
because this methodology will allow faster analyzes, a reduced manipulation of the
samples, and to perform the analysis in the same place and with the same external
conditions.
In the future, it could also be important to apply this method for β-blockers
determination in urine. The human body presents an extensive metabolism for these
compounds and, in general, they are excreted in urine which is a biological fluid easier
to collect and to work.
Automated Micro Solid Phase Extraction for Samples Pretreatment for Direct Determination of β-Blockers in Human Serum 2012/2013
54
6. References
[1] WHO. Global atlas on cardiovascular disease prevention and control. Available
from: http://whqlibdoc.who.int/publications/2011/9789241564373_eng.pdf Accessed on
23-02-2013.
[2] Boonjob, W. Automated sample preparation methods for the determination of trace
level concentrations of environmental pollutants. Spain: University of the Balearic
Islands; 2012.
[3] Rang, H. P., Dale, M. M., Ritter, J. M., Flower, R. J., Henderson, G. Rang y Dale.
Farmacología: Elsevier Health Sciences Spain; 2012.
[4] Gorre, F., Vandekerckhove, H. (2010) Beta-blockers: focus on mechanism of action.
Which beta-blocker, when and why? Acta Cardiol 65(5):565-570.
[5] Brunton, L., Lazo, J., Parker, K. Goodman & Gilman's The Pharmacological Basis of
Therapeutics: McGraw-Hill Education; 2005.
[6] Katzung, B. G. Farmacologia Básica e Clínica: McGraw Hill Brasil; 2006.
[7] Golan, D. E., Tashjian, A. H. Principios de farmacología clínica: bases
fisiopatológicas del tratamiento farmacológico: Walters Kluwer; 2011.
[8] Bristow Md, P. M. R. (1997) Mechanism of Action of Beta-Blocking Agents in Heart
Failure. The American Journal of Cardiology 80(11, Supplement 1):26L-40L.
[9] BHS. Beta-adrenoceptor antagonists (beta-blockers). Available from:
http://www.bhsoc.org/pdfs/therapeutics/Beta-adrenoceptor%20Antagonists%20(Beta-
Blockers).pdf Accessed on 23-02-2013.
[10] Delamoye, M., Duverneuil, C., Paraire, F., Mazancourt, P. d., Alvarez, J.-C. (2004)
Simultaneous determination of thirteen β-blockers and one metabolite by gradient high-
performance liquid chromatography with photodiode-array UV detection. Forensic
Science International 141(1):23-31.
[11] Dupuis, C., Gaulier, J. M., Pélissier-Alicot, A. L., Marquet, P., Lachâtre, G. (2004)
Determination of three β-blockers in biofluids and solid tissues by liquid
chromatography-electrospray-mass spectrometry. Journal of Analytical Toxicology
28(8):674-679.
[12] Amundsen, I., Øiestad, A. M. L., Ekeberg, D., Kristoffersen, L. (2013) Quantitative
determination of fifteen basic pharmaceuticals in ante- and post-mortem whole blood
by high pH mobile phase reversed phase ultra high performance liquid
chromatography-tandem mass spectrometry. Journal of Chromatography B: Analytical
Technologies in the Biomedical and Life Sciences 927(0):112-123.
Automated Micro Solid Phase Extraction for Samples Pretreatment for Direct Determination of β-Blockers in Human Serum 2012/2013
55
[13] Azzouz, A., Ballesteros, E. (2012) Gas chromatography-mass spectrometry
determination of pharmacologically active substances in urine and blood samples by
use of a continuous solid-phase extraction system and microwave-assisted
derivatization. Journal of Chromatography B: Analytical Technologies in the Biomedical
and Life Sciences 891-892:12-19.
[14] Iriarte, G., Gonzalez, O., Ferreirós, N., Maguregui, M. I., Alonso, R. M., Jiménez,
R. M. (2009) Validation of a fast liquid chromatography–UV method for the analysis of
drugs used in combined cardiovascular therapy in human plasma. Journal of
Chromatography B 877(27):3045-3053.
[15] Shrivastav, P. S., Buha, S. M., Sanyal, M. (2010) Detection and quantitation of β-
blockers in plasma and urine. Bioanalysis 2(2):263-276.
[16] Gonzalez, O., Iriarte, G., Ferreirós, N., Maguregui, M. I., Alonso, R. M., Jiménez,
R. M. (2009) Optimization and validation of a SPE-HPLC-PDA-fluorescence method for
the simultaneous determination of drugs used in combined cardiovascular therapy in
human plasma. Journal of Pharmaceutical and Biomedical Analysis 50(4):630-639.
[17] Liu, W., Zhang, L., Wei, Z., Chen, S., Chen, G. (2009) Analysis of β-agonists and
β-blockers in urine using hollow fibre-protected liquid-phase microextraction with in situ
derivatization followed by gas chromatography/mass spectrometry. Journal of
Chromatography A 1216(28):5340-5346.
[18] Baranowska, I., Magiera, S., Baranowski, J. (2011) UHPLC method for the
simultaneous determination of β-blockers, isoflavones, and flavonoids in human urine.
Journal of Chromatographic Science 49(10):764-773.
[19] Hyötyläinen, T., Pilviö, R., Riekkola, M. L. (1996) Screening of Four Beta-Blockers
and Codeine in Urine by On-Line Coupled RPLC-GC with On-Line Derivatization. HRC
Journal of High Resolution Chromatography 19(8):439-443.
[20] Mazzarino, M., De La Torre, X., Mazzei, F., Botrè, F. (2009) Rapid screening of
beta-adrenergic agents and related compounds in human urine for anti-doping purpose
using capillary electrophoresis with dynamic coating. Journal of Separation Science
32(20):3562-3570.
[21] Broecker, S., Herre, S., Pragst, F. (2012) General unknown screening in hair by
liquid chromatography-hybrid quadrupole time-of-flight mass spectrometry (LC-QTOF-
MS). Forensic Science International 218(1-3):68-81.
[22] Bazylak, G., Monge, M. E., Everaert, J., Negels, L. J. (2009) Hydrophobicity-aided
potentiometric detection of catecholamines, beta-agonists, and beta-blockers in a
mixed-solvent capillary electrophoresis system. Journal of Separation Science
32(1):135-146.
Automated Micro Solid Phase Extraction for Samples Pretreatment for Direct Determination of β-Blockers in Human Serum 2012/2013
56
[23] Broecker, S., Herre, S., Pragst, F. (2012) General unknown screening in hair by
liquid chromatography–hybrid quadrupole time-of-flight mass spectrometry (LC–QTOF-
MS). Forensic Science International 218(1–3):68-81.
[24] Grassin Delyle, S., Duverneuil-Mayer, C., Abe, E., Mathieu, B., Lorin De La
Grandmaison, G., Charlier, P., Alvarez, J. C. (2008) Fatal intoxication with labetalol
(Trandate®). Forensic Science International 178(2–3):e19-e21.
[25] Morante-Zarcero, S., Sierra, I. (2012) Simultaneous enantiomeric determination of
propranolol, metoprolol, pindolol, and atenolol in natural waters by HPLC on new
polysaccharide-based stationary phase using a highly selective molecularly imprinted
polymer extraction. Chirality 24(10):860-866.
[26] Wardencki, W., Curyło, J., Namieśnik, J. (2007) Trends in solventless sample
preparation techniques for environmental analysis. Journal of Biochemical and
Biophysical Methods 70(2):275-288.
[27] Ramos, L. (2012) Critical overview of selected contemporary sample preparation
techniques. Journal of Chromatography A 1221(0):84-98.
[28] Turiel, E., Martín-Esteban, A. (2010) Molecularly imprinted polymers for sample
preparation: A review. Analytica Chimica Acta 668(2):87-99.
[29] Urbanowicz, M., Zabiegała, B., Namieśnik, J. (2011) Solventless sample
preparation techniques based on solid- and vapour-phase extraction. Analytical and
Bioanalytical Chemistry 399(1):277-300.
[30] Herrero, M., Castro-Puyana, M., Mendiola, J. A., Ibañez, E. (2013) Compressed
fluids for the extraction of bioactive compounds. TrAC - Trends in Analytical Chemistry
43:67-83.
[31] Augusto, F., Hantao, L. W., Mogollón, N. G. S., Braga, S. C. G. N. (2013) New
materials and trends in sorbents for solid-phase extraction. TrAC - Trends in Analytical
Chemistry 43:14-23.
[32] Zwir-Ferenc, A., Biziuk, M. (2006) Solid phase extraction technique - Trends,
opportunities and applications. Polish Journal of Environmental Studies 15(5):677-690.
[33] Hennion, M. C. (1999) Solid-phase extraction: Method development, sorbents, and
coupling with liquid chromatography. Journal of Chromatography A 856(1-2):3-54.
[34] Jacobs, D. M., Spiesser, L., Garnier, M., De Roo, N., Van Dorsten, F.,
Hollebrands, B., Van Velzen, E., Draijer, R., Van Duynhoven, J. (2012) SPE-NMR
metabolite sub-profiling of urine. Analytical and Bioanalytical Chemistry 404(8):2349-
2361.
[35] Navarrete, A., Martínez-Alcázar, M. P., Durán, I., Calvo, E., Valenzuela, B.,
Barbas, C., García, A. (2013) Simultaneous online SPE-HPLC-MS/MS analysis of
Automated Micro Solid Phase Extraction for Samples Pretreatment for Direct Determination of β-Blockers in Human Serum 2012/2013
57
docetaxel, Temsirolimus and sirolimus in whole blood and human plasma. Journal of
Chromatography B: Analytical Technologies in the Biomedical and Life Sciences 921-
922:35-42.
[36] Sousa, T. F. A., Amorim, C. G., Montenegro, M. C. B. S. M., Araújo, A. N. (2013)
Cyclodextrin based potentiometric sensor for determination of ibuprofen in
pharmaceuticals and waters. Sensors and Actuators B: Chemical 176(0):660-666.
[37] Paíga, P., Santos, L. M. L. M., Amorim, C., Araújo, A., Montenegro, M. C. S. M.,
Pena, A., Delerue-Matos, C. (2012) Pilot monitoring study of ibuprofen in surface
waters of north of Portugal. Environ Sci Pollut Res 120(4):2410-2420.
[38] Sousa, M. A., Gonçalves, C., Cunha, E., Hajšlová, J., Alpendurada, M. F. (2011)
Cleanup strategies and advantages in the determination of several therapeutic classes
of pharmaceuticals in wastewater samples by SPE-LC-MS/MS. Analytical and
Bioanalytical Chemistry 399(2):807-822.
[39] Kaur, M., Malik, A. K., Singh, B. (2012) Determination of phenylurea herbicides in
tap water and soft drink samples by HPLC-UV and solid-phase extraction. LC-GC
Europe 25(3):15-20.
[40] Qu, J. R., Zhang, J. J., Gao, Y. F., Yang, H. (2012) Synthesis and utilisation of
molecular imprinting polymer for clean-up of propachlor in food and environmental
media. Food Chemistry 135(3):1148-1156.
[41] Huang, M. C., Chen, H. C., Fu, S. C., Ding, W. H. (2013) Determination of volatile
N-nitrosamines in meat products by microwave-assisted extraction coupled with
dispersive micro solid-phase extraction and gas chromatography-Chemical ionisation
mass spectrometry. Food Chemistry 138(1):227-233.
[42] Chen, G., Wang, Y., Song, W., Zhao, B., Dou, Y. (2012) Rapid and selective
quantification of l-theanine in ready-to-drink teas from Chinese market using SPE and
UPLC-UV. Food Chemistry 135(2):402-407.
[43] Liu, X., Yang, T., Hu, J. (2013) Determination of benazolin-ethyl residues in soil
and rape seed by SPE clean-up and gc with electron capture detection. Journal of
Chromatographic Science 51(1):87-91.
[44] Wang, G., Zhao, J., Peng, T., Chen, D., Xi, C., Wang, X., Zhang, J. (2013) Matrix
effects in the determination of β-receptor agonists in animal-derived foodstuffs by ultra-
performance liquid chromatography tandem mass spectrometry with immunoaffinity
solid-phase extraction. Journal of Separation Science 36(4):796-802.
[45] Flieger, J., Pizoń, M., Plech, T., Łuszczki, J. J. (2012) Analysis of new potential
anticonvulsant compounds in mice brain tissue by SPE/HPLC/DAD. Journal of
Automated Micro Solid Phase Extraction for Samples Pretreatment for Direct Determination of β-Blockers in Human Serum 2012/2013
58
Chromatography B: Analytical Technologies in the Biomedical and Life Sciences
909:26-33.
[46] Pauling, L. (1974) Molecular basis of biological specificity. Nature 248(5451):769-
771.
[47] Qiao, F., Sun, H., Yan, H., Row, K. H. (2006) Molecularly imprinted polymers for
solid phase extraction. Chromatographia 64(11-12):625-634.
[48] Cheong, W. J., Yang, S. H., Ali, F. (2013) Molecular imprinted polymers for
separation science: A review of reviews. Journal of Separation Science 36(3):609-628.
[49] Cheong, W. J., Ali, F., Choi, J. H., Lee, J. O., Yune Sung, K. (2013) Recent
applications of molecular imprinted polymers for enantio-selective recognition. Talanta
106:45-59.
[50] Miró, M., Hartwell, S. K., Jakmunee, J., Grudpan, K., Hansen, E. H. (2008) Recent
developments in automatic solid-phase extraction with renewable surfaces exploiting
flow-based approaches. TrAC Trends in Analytical Chemistry 27(9):749-761.
[51] Beltran, A., Borrull, F., Marcé, R. M., Cormack, P. A. G. (2010) Molecularly-
imprinted polymers: Useful sorbents for selective extractions. TrAC - Trends in
Analytical Chemistry 29(11):1363-1375.
[52] Boonjob, W., Yu, Y., Miró, M., Segundo, M. A., Wang, J., Cerdà, V. (2010) Online
hyphenation of multimodal microsolid phase extraction involving renewable molecularly
imprinted and reversed-phase sorbents to liquid Chromatography for Automatic
multiresidue assays. Analytical Chemistry 82(7):3052-3060.
[53] Vidigal, S. S. M. P., Tóth, I. V., Rangel, A. O. S. S. (2013) Sequential injection lab-
on-valve platform as a miniaturisation tool for solid phase extraction. Analytical
Methods 5(3):585-597.
[54] Lenehan, C. E., Barnett, N. W., Lewis, S. W. (2002) Sequential injection analysis.
Analyst 127(8):997-1020.
[55] Ruzicka, J. (2000) Lab-on valve: Universal microflow analyzer based on sequential
and bead injection. Analyst 125(6):1053-1060.
[56] Wang, J., Hansen, E. H. (2003) Sequential injection lab-on-valve: The third
generation of flow injection analysis. TrAC - Trends in Analytical Chemistry 22(4):225-
231.
[57] Amorim, C. G., Souza, R. C., Araújo, A. N., Montenegro, M. C. B. S. M., Silva, V.
L. (2010) SI lab-on-valve analysis of histamine using potentiometric detection for food
quality control. Food Chemistry 122(3):871-876.
Automated Micro Solid Phase Extraction for Samples Pretreatment for Direct Determination of β-Blockers in Human Serum 2012/2013
59
[58] Oliveira, H. M., Miró, M., Segundo, M. A., Lima, J. L. F. C. (2011) Universal
approach for mesofluidic handling of bead suspensions in lab-on-valve format. Talanta
84(3):846-852.
[59] Oliveira, H. M., Segundo, M. A., Lima, J. L. F. C., Miró, M., Cerdà, V. (2010) On-
line renewable solid-phase extraction hyphenated to liquid chromatography for the
determination of UV filters using bead injection and multisyringe-lab-on-valve
approach. Journal of Chromatography A 1217(22):3575-3582.
[60] Sherathia, B., Prajapati, G., Singh, R., Jat, R. (2012) Ultra performance liquid
chromatography: Comparative study over HPLC. International Journal of
Pharmaceutical Sciences Review and Research 15(1):54-57.
[61] Malviya, R., Bansal, V., Pal, O. P., Sharma, P. K. (2010) High performance liquid
chromatography: A short review. Journal of Global Pharma Technology 2(5):22-26.
[62] Tistaert, C., Dejaegher, B., Heyden, Y. V. (2011) Chromatographic separation
techniques and data handling methods for herbal fingerprints: A review. Analytica
Chimica Acta 690(2):148-161.
[63] Vogeser, M., Seger, C. (2008) A decade of HPLC-MS/MS in the routine clinical
laboratory - Goals for further developments. Clinical Biochemistry 41(9):649-662.
[64] Nakashima, K. (2005) High-performance liquid chromatographic analysis of drugs
of abuse in biologic samples. Journal of Health Science 51(3):272-277.
[65] Skoog, D. A., Holler, F. J., Crouch, S. R. Principles of Instrumental Analysis:
Brooks/Cole; 2007.
[66] Miyabe, K., Guiochon, G. (2004) Characterization of monolithic columns for HPLC.
Journal of Separation Science 27(10-11):853-873.
[67] Gros, M., Pizzolato, T.-M., Petrović, M., de Alda, M. J. L., Barceló, D. (2008) Trace
level determination of β-blockers in waste waters by highly selective molecularly
imprinted polymers extraction followed by liquid chromatography–quadrupole-linear ion
trap mass spectrometry. Journal of Chromatography A 1189(1–2):374-384.
[68] Petrovic, M., Gros, M., Barcelo, D. (2006) Multi-residue analysis of
pharmaceuticals in wastewater by ultra-performance liquid chromatography–
quadrupole–time-of-flight mass spectrometry. Journal of Chromatography A 1124(1–
2):68-81.
[69] Pereira, D. M., Vinholes, J., De Pinho, P. G., Valentão, P., Mouga, T., Teixeira, N.,
Andrade, P. B. (2012) A gas chromatography-mass spectrometry multi-target method
for the simultaneous analysis of three classes of metabolites in marine organisms.
Talanta 100:391-400.
Automated Micro Solid Phase Extraction for Samples Pretreatment for Direct Determination of β-Blockers in Human Serum 2012/2013
60
[70] Papadoyannis, A. Z. a. I. N. Encyclopedia of Chromatography, Second
Edition2005.
[71] Broglé, K., Ornaf, R. M., Wu, D., Palermo, P. J. (1999) Peak fronting in reversed-
phase high-performance liquid chromatography: A study of the chromatographic
behavior of oxycodone hydrochloride. Journal of Pharmaceutical and Biomedical
Analysis 19(5):669-678.
[72] Martin, P., Wilson, I. D., Jones, G. R. (2000) Application and elution conditions for
the selective elution of analytes from molecular imprinted polymers after extraction
from aqueous samples: Application to β-blockers. Chromatographia 52(1):S19-S23.
[73] Martin, P., Wilson, I. D., Jones, G. R. (2000) Optimisation of procedures for the
extraction of structural analogues of propranolol with molecular imprinted polymers for
sample preparation. Journal of Chromatography A 889(1-2):143-147.
[74] Love, J. N. (2000) Acebutolol overdose resulting in fatalities. Journal of Emergency
Medicine 18(3):341-344.
[75] Duff, H. J., Mitchell, L. B., Wyse, G. (1986) Antiarrhythmic efficacy of propranolol:
Comparison of low and high serum concentrations. Journal of the American College of
Cardiology 8(4):959-965.
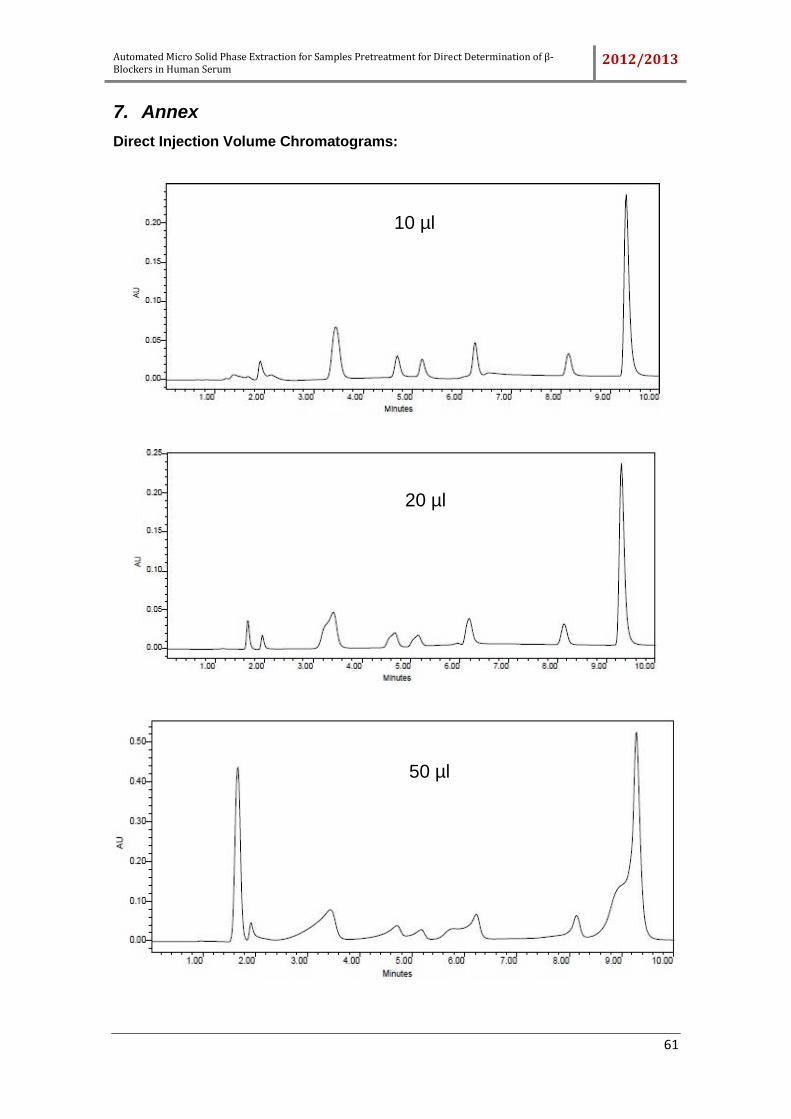
Automated Micro Solid Phase Extraction for Samples Pretreatment for Direct Determination of β-Blockers in Human Serum
2012/2013
61
7. Annex
Direct Injection Volume Chromatograms:
10 µl
20 µl
50 µl
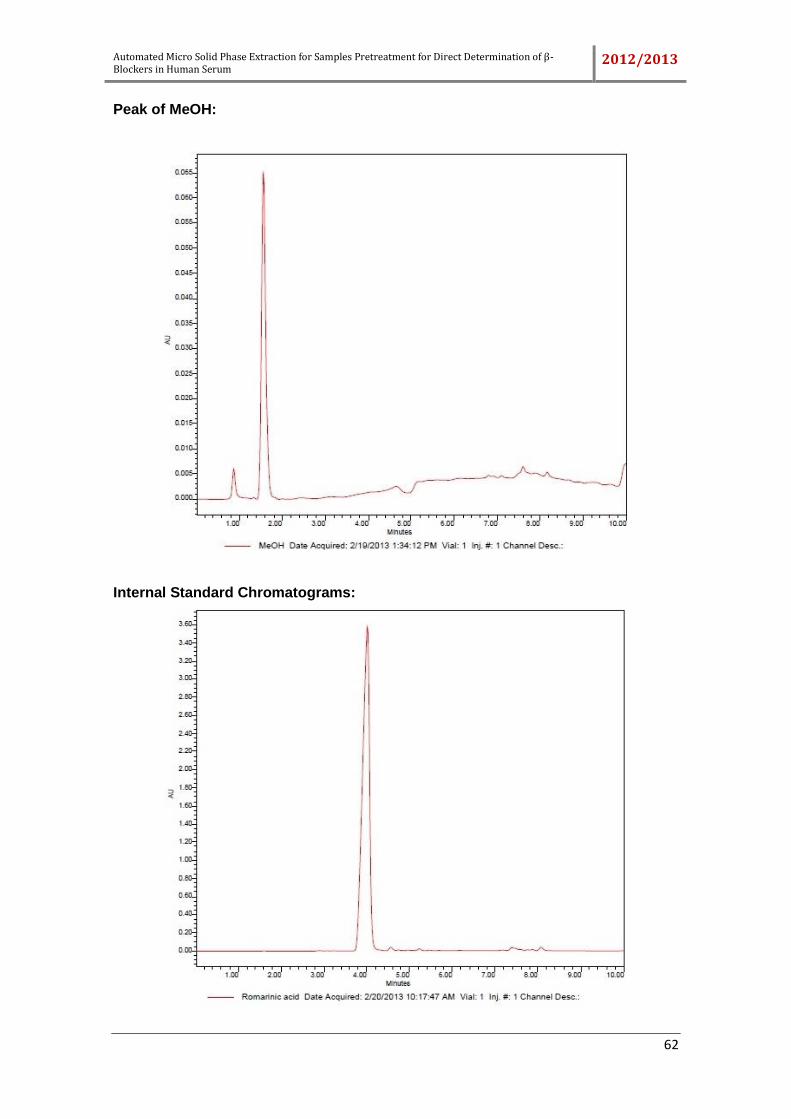
Automated Micro Solid Phase Extraction for Samples Pretreatment for Direct Determination of β-Blockers in Human Serum 2012/2013
62
Peak of MeOH:
Internal Standard Chromatograms:
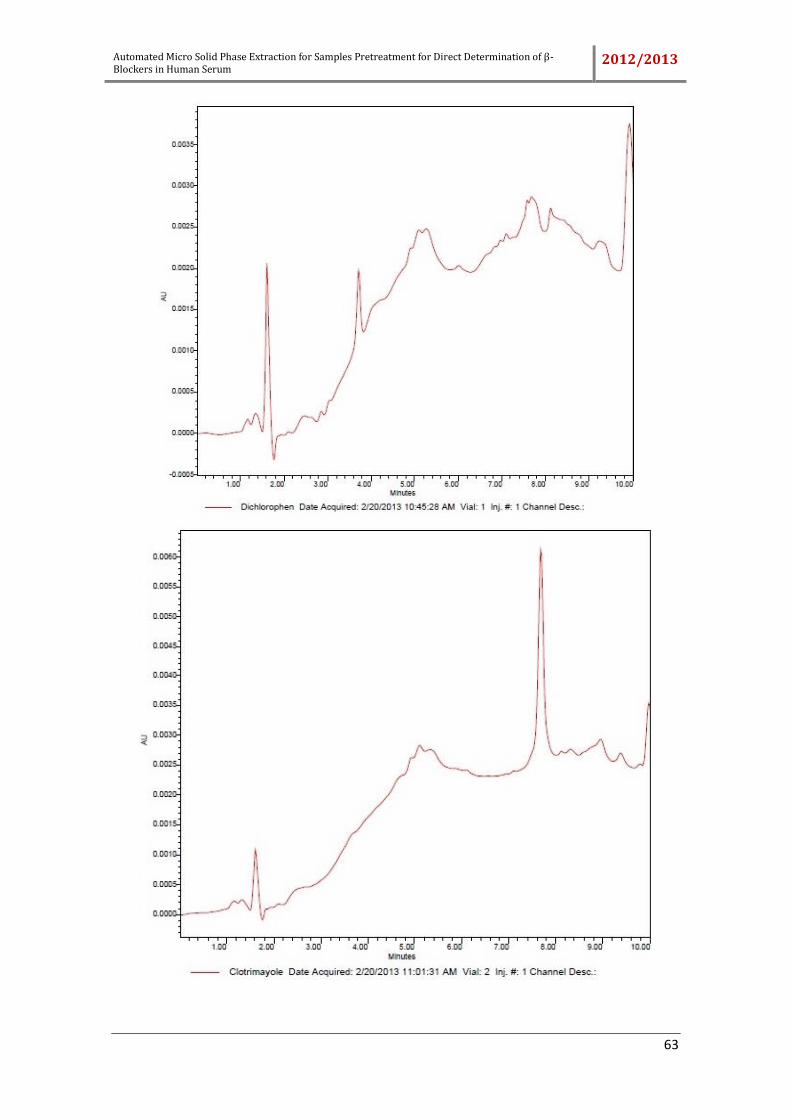
Automated Micro Solid Phase Extraction for Samples Pretreatment for Direct Determination of β-Blockers in Human Serum 2012/2013
63
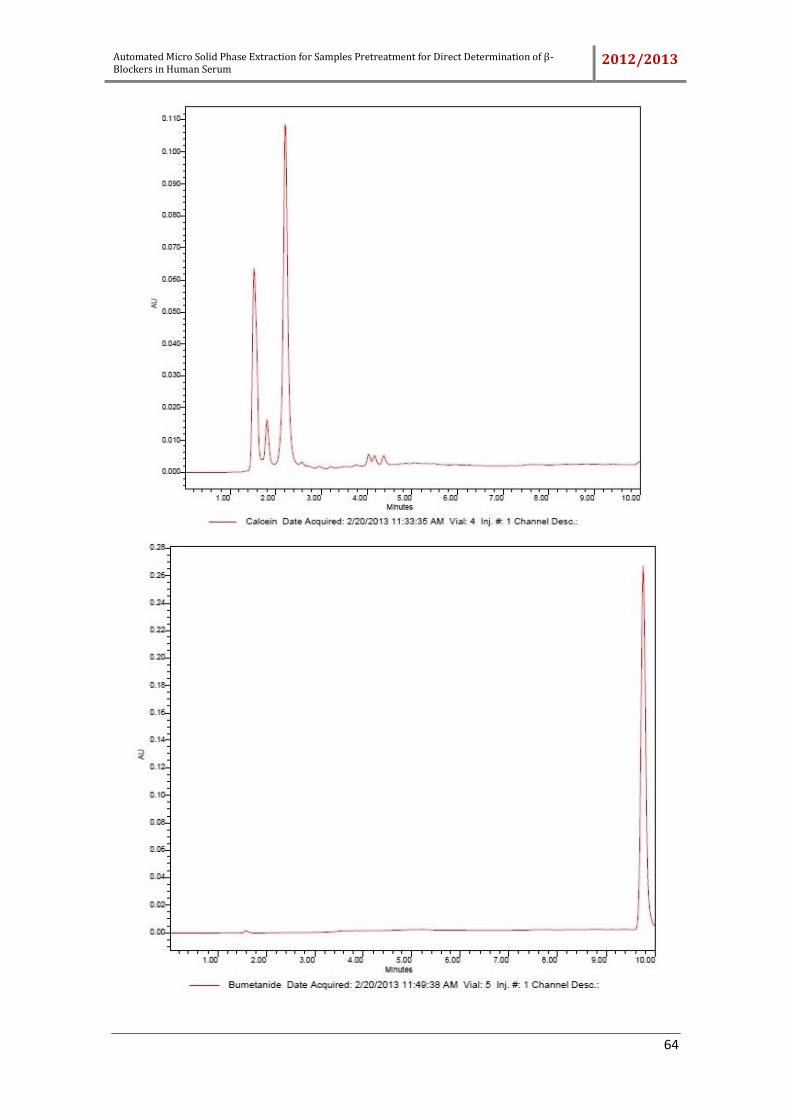
Automated Micro Solid Phase Extraction for Samples Pretreatment for Direct Determination of β-Blockers in Human Serum 2012/2013
64
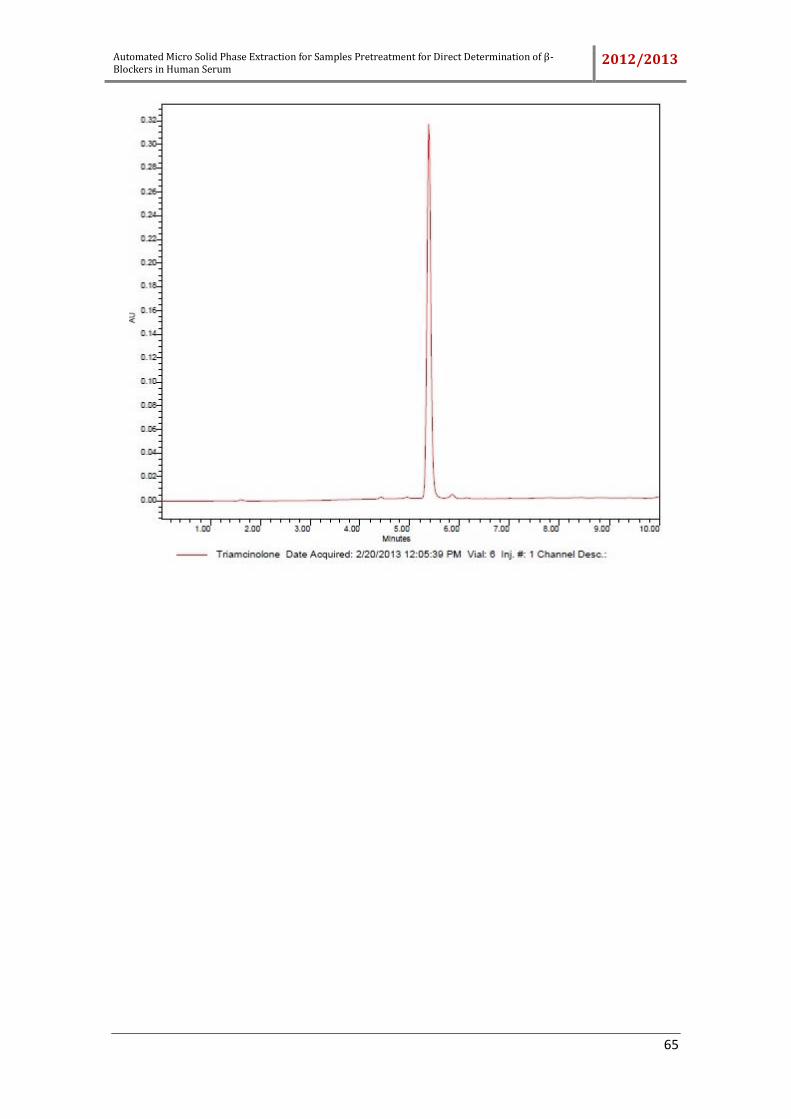
Automated Micro Solid Phase Extraction for Samples Pretreatment for Direct Determination of β-Blockers in Human Serum 2012/2013
65

Automated Micro Solid Phase Extraction for Samples Pretreatment for Direct Determination of β-Blockers in Human Serum
2012/2013
66