ASTR 452: Chapter 7 Slides -...
12
ASTR 452: Chapter 7 Slides The Thermal Universe
Transcript of ASTR 452: Chapter 7 Slides -...
ASTR 452: Chapter 7 Slides�The Thermal Universe
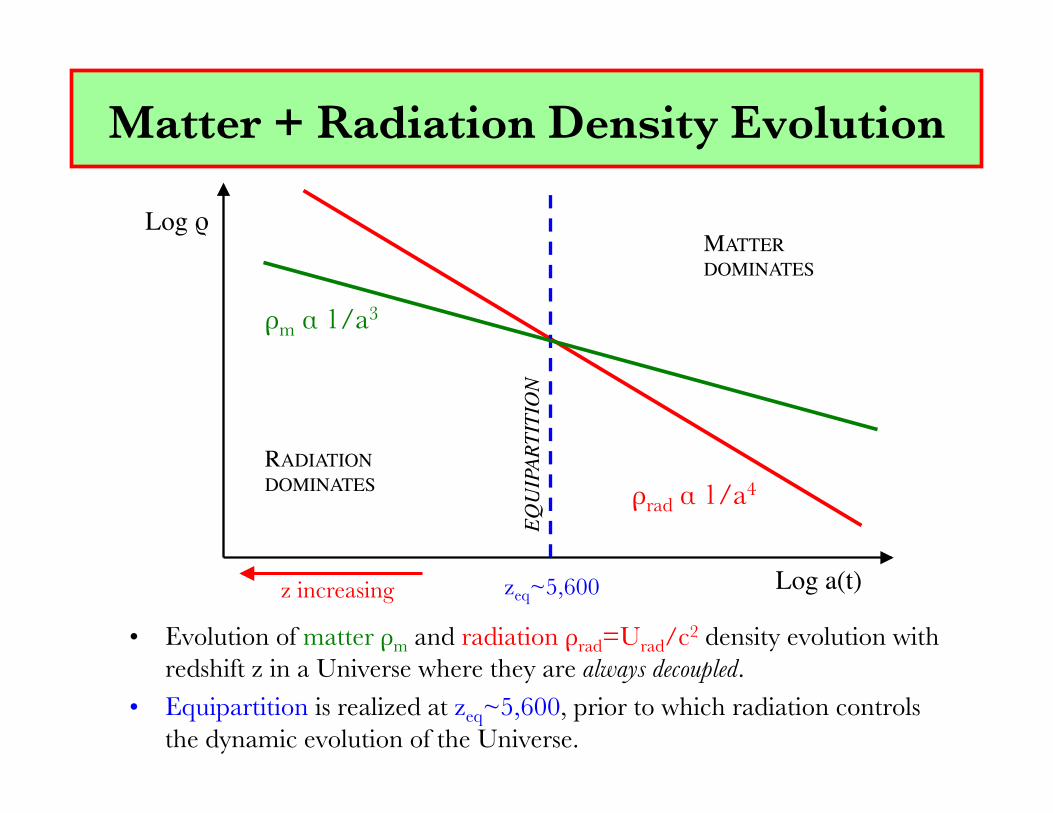
Matter + Radiation Density Evolution
• Evolution of matter ρm and radiation ρrad=Urad/c2 density evolution with redshift z in a Universe where they are always decoupled.
• Equipartition is realized at zeq~5,600, prior to which radiation controls the dynamic evolution of the Universe.
Log a(t)
Log ρ
ρrad α 1/a4
ρm α 1/a3
MATTER DOMINATES
RADIATION DOMINATES
EQU
IPAR
TITI
ON
zeq~5,600 z increasing
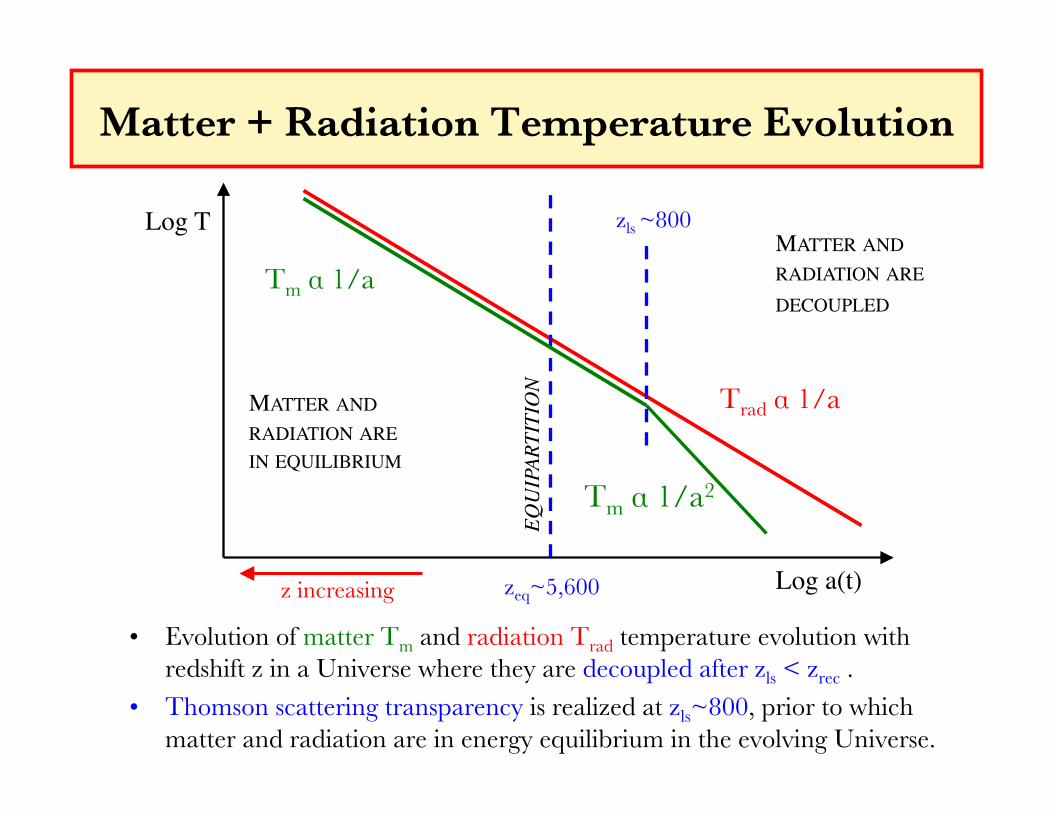
Matter + Radiation Temperature Evolution
• Evolution of matter Tm and radiation Trad temperature evolution with redshift z in a Universe where they are decoupled after zls < zrec .
• Thomson scattering transparency is realized at zls~800, prior to which matter and radiation are in energy equilibrium in the evolving Universe.
Log a(t)
Log T
Trad α 1/a
Tm α 1/a MATTER AND RADIATION ARE DECOUPLED
MATTER AND RADIATION ARE IN EQUILIBRIUM
EQU
IPAR
TITI
ON
zeq~5,600 z increasing
Tm α 1/a2
zls ~800
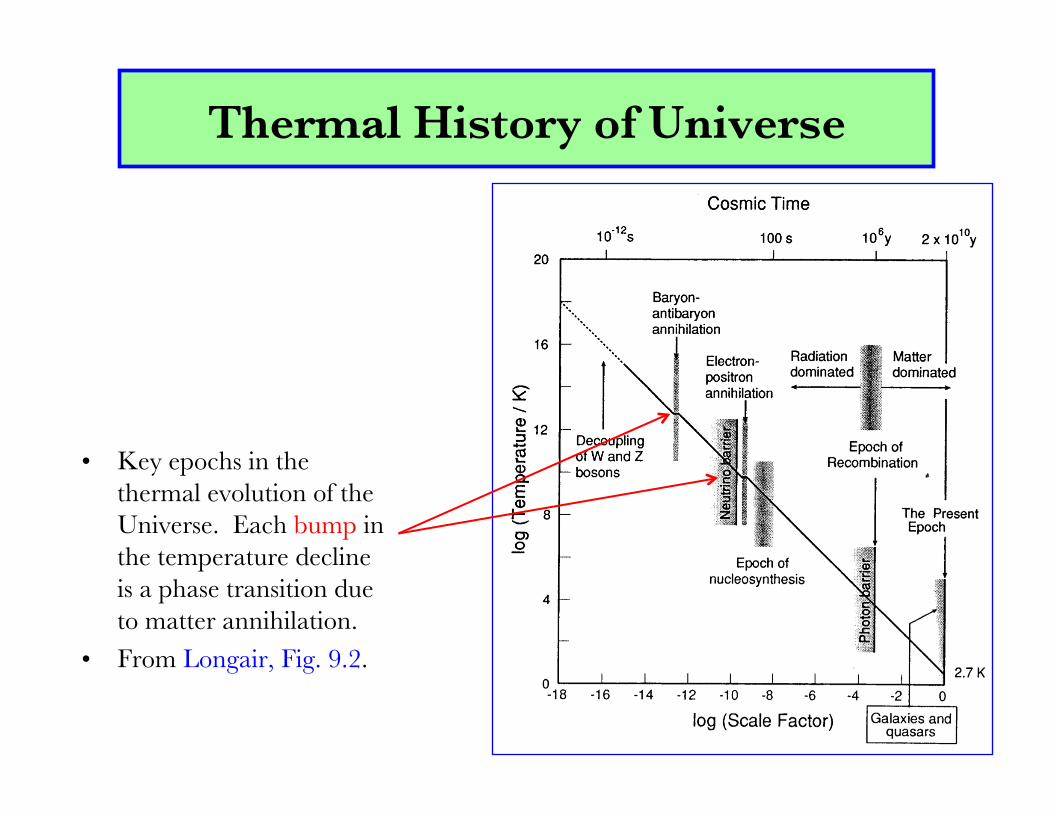
Thermal History of Universe
• Key epochs in the thermal evolution of the Universe. Each bump in the temperature decline is a phase transition due to matter annihilation.
• From Longair, Fig. 9.2.
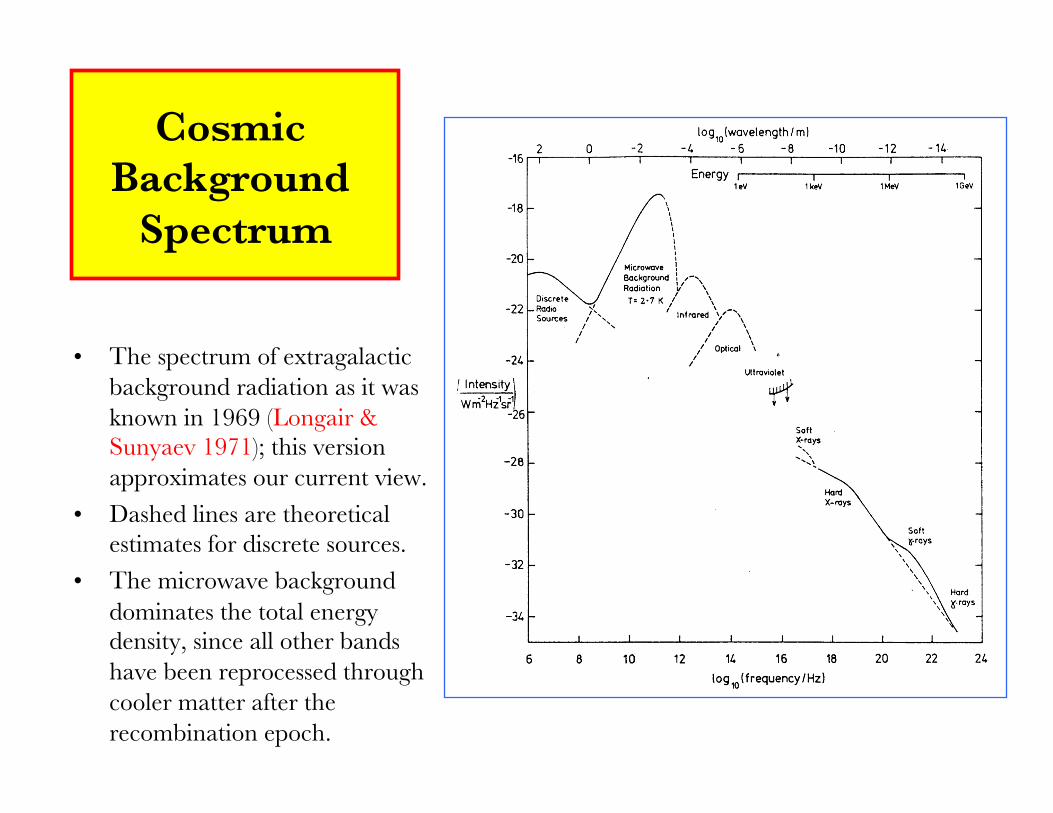
Cosmic Background
Spectrum
• The spectrum of extragalactic background radiation as it was known in 1969 (Longair & Sunyaev 1971); this version approximates our current view.
• Dashed lines are theoretical estimates for discrete sources.
• The microwave background dominates the total energy density, since all other bands have been reprocessed through cooler matter after the recombination epoch.
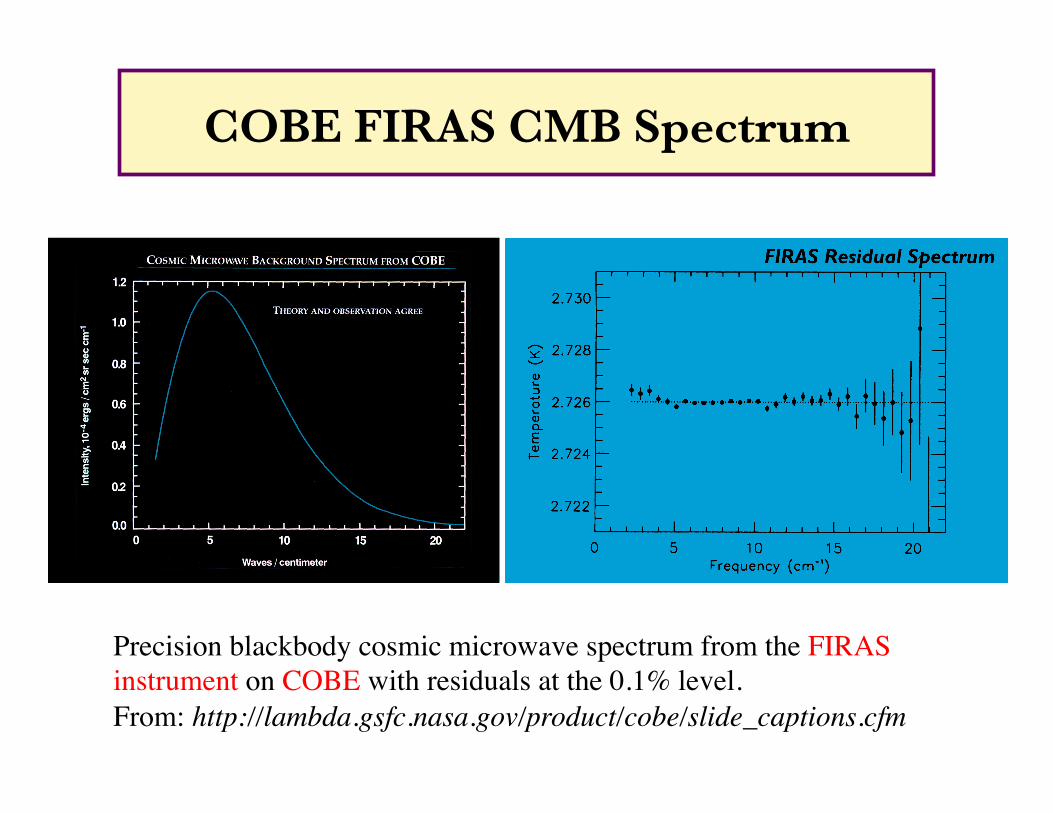
COBE FIRAS CMB Spectrum
Precision blackbody cosmic microwave spectrum from the FIRAS instrument on COBE with residuals at the 0.1% level. From: http://lambda.gsfc.nasa.gov/product/cobe/slide_captions.cfm
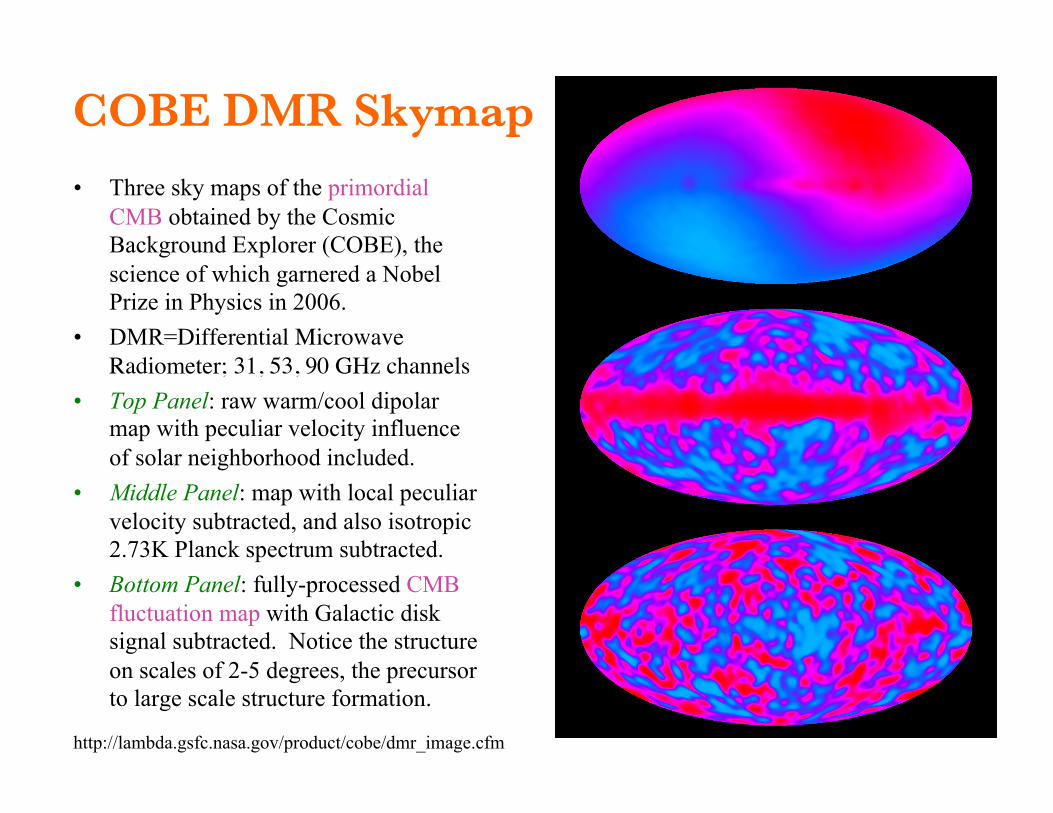
COBE DMR Skymap
• Three sky maps of the primordial CMB obtained by the Cosmic Background Explorer (COBE), the science of which garnered a Nobel Prize in Physics in 2006.
• DMR=Differential Microwave Radiometer; 31, 53, 90 GHz channels
• Top Panel: raw warm/cool dipolar map with peculiar velocity influence of solar neighborhood included.
• Middle Panel: map with local peculiar velocity subtracted, and also isotropic 2.73K Planck spectrum subtracted.
• Bottom Panel: fully-processed CMB fluctuation map with Galactic disk signal subtracted. Notice the structure on scales of 2-5 degrees, the precursor to large scale structure formation.
http://lambda.gsfc.nasa.gov/product/cobe/dmr_image.cfm
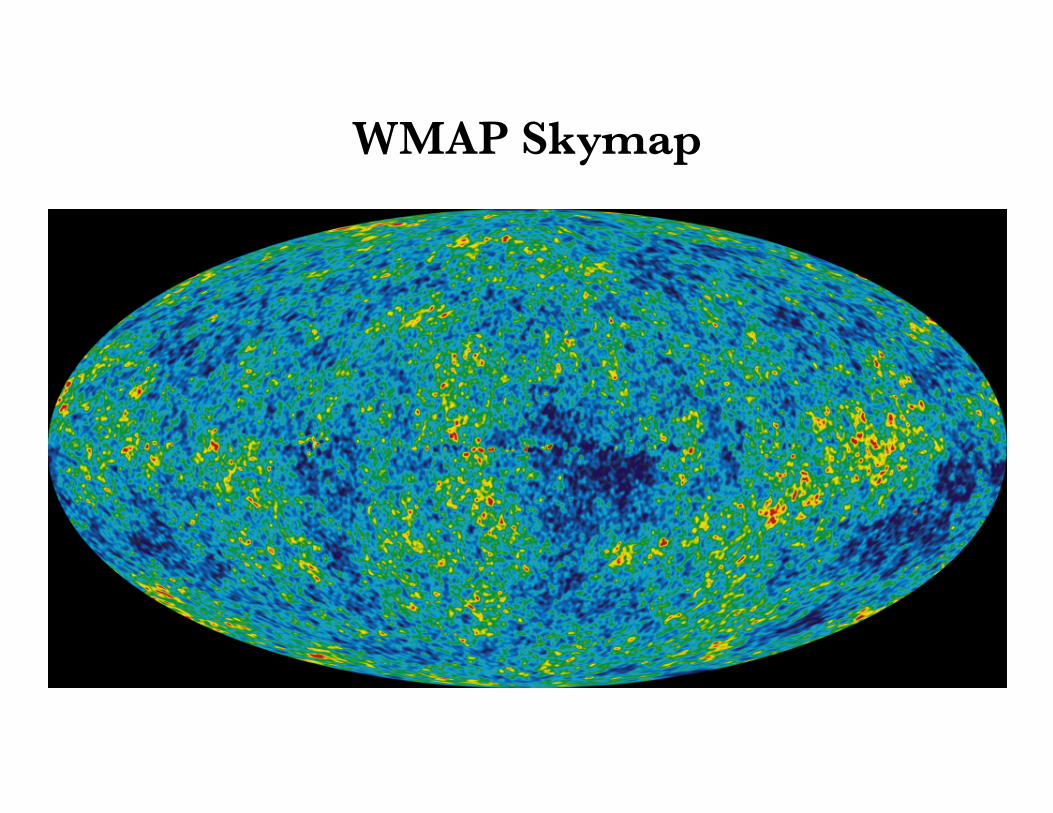
WMAP Skymap
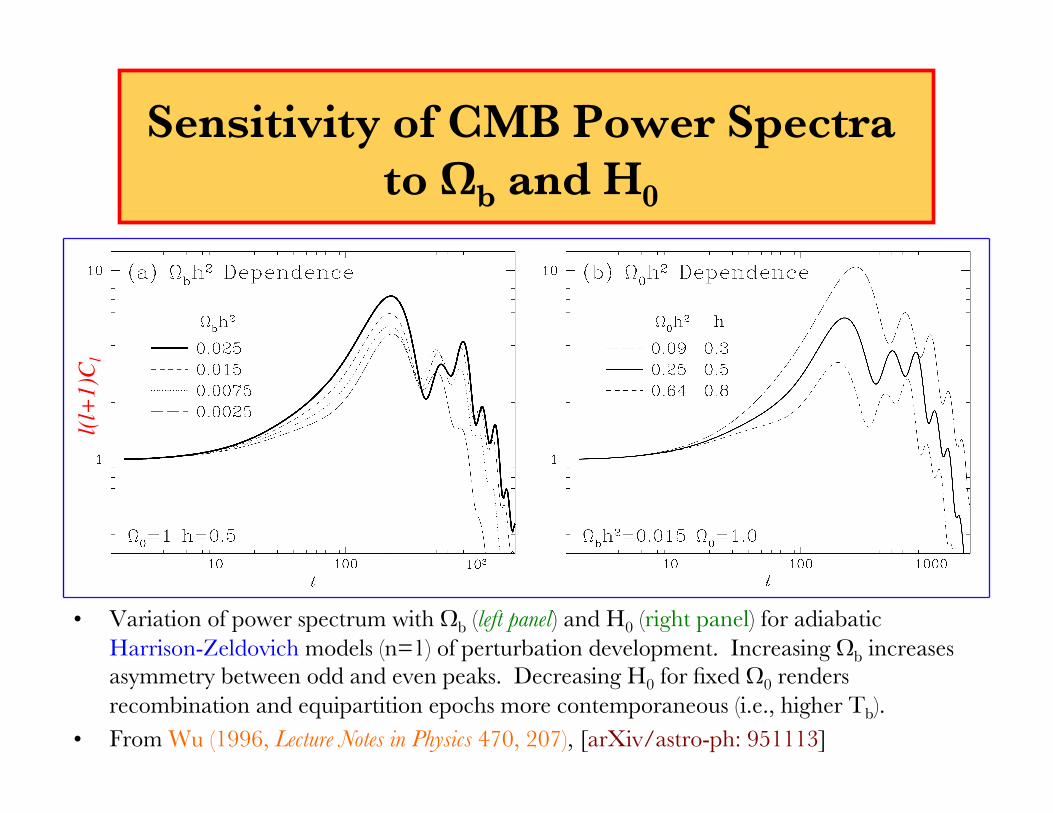
Sensitivity of CMB Power Spectra to Ωb and H0
• Variation of power spectrum with Ωb (left panel) and H0 (right panel) for adiabatic Harrison-Zeldovich models (n=1) of perturbation development. Increasing Ωb increases asymmetry between odd and even peaks. Decreasing H0 for fixed Ω0 renders recombination and equipartition epochs more contemporaneous (i.e., higher Tb).
• From Wu (1996, Lecture Notes in Physics 470, 207), [arXiv/astro-ph: 951113]
l(l+
1)C
l
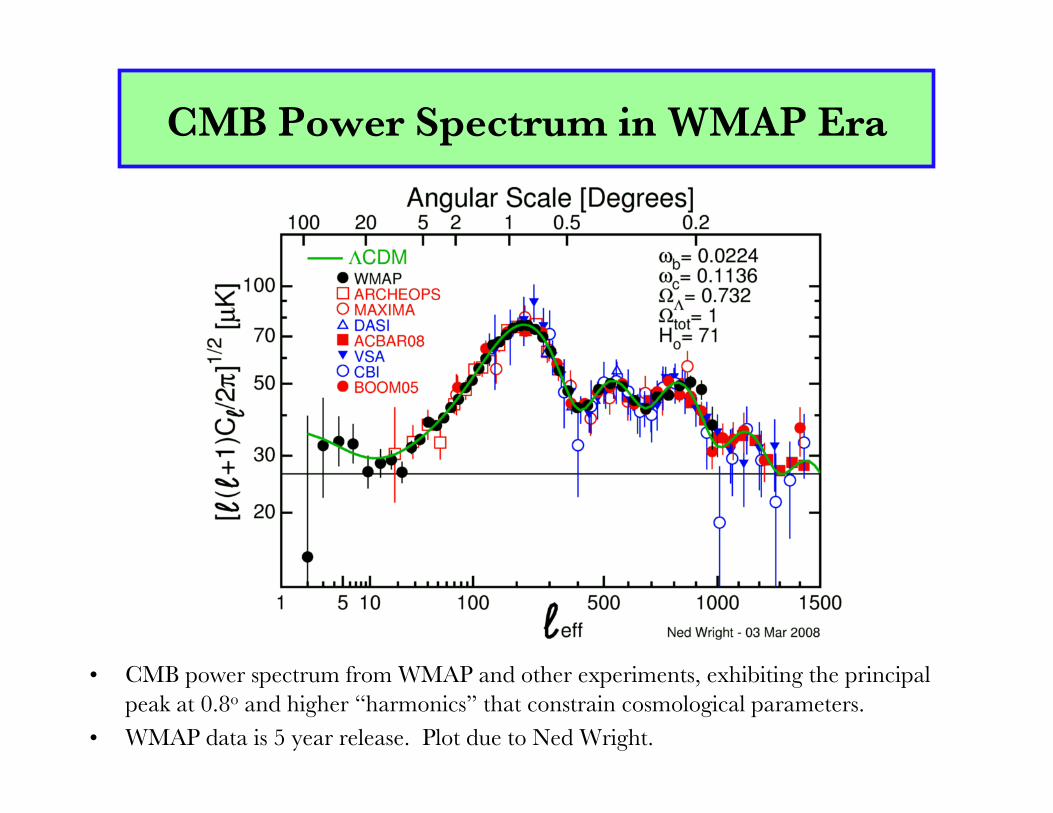
CMB Power Spectrum in WMAP Era
• CMB power spectrum from WMAP and other experiments, exhibiting the principal peak at 0.8o and higher “harmonics” that constrain cosmological parameters.
• WMAP data is 5 year release. Plot due to Ned Wright.
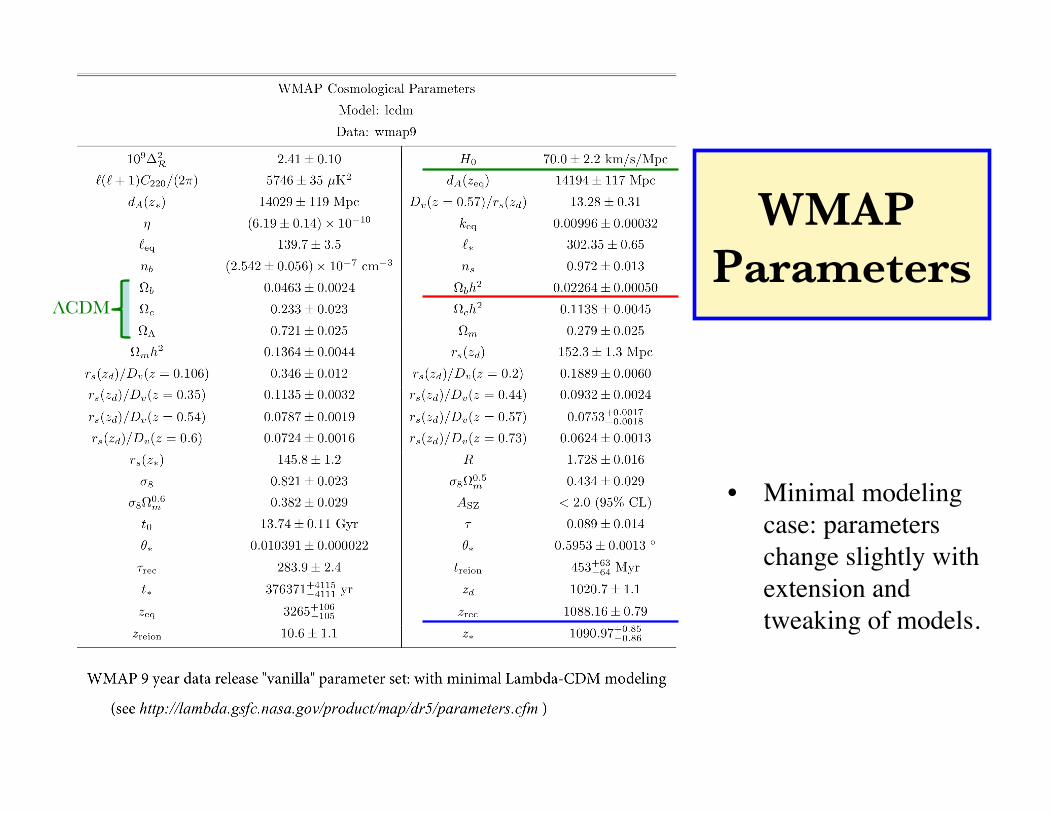
WMAP Parameters
• Minimal modeling case: parameters change slightly with extension and tweaking of models.
ΛCDM
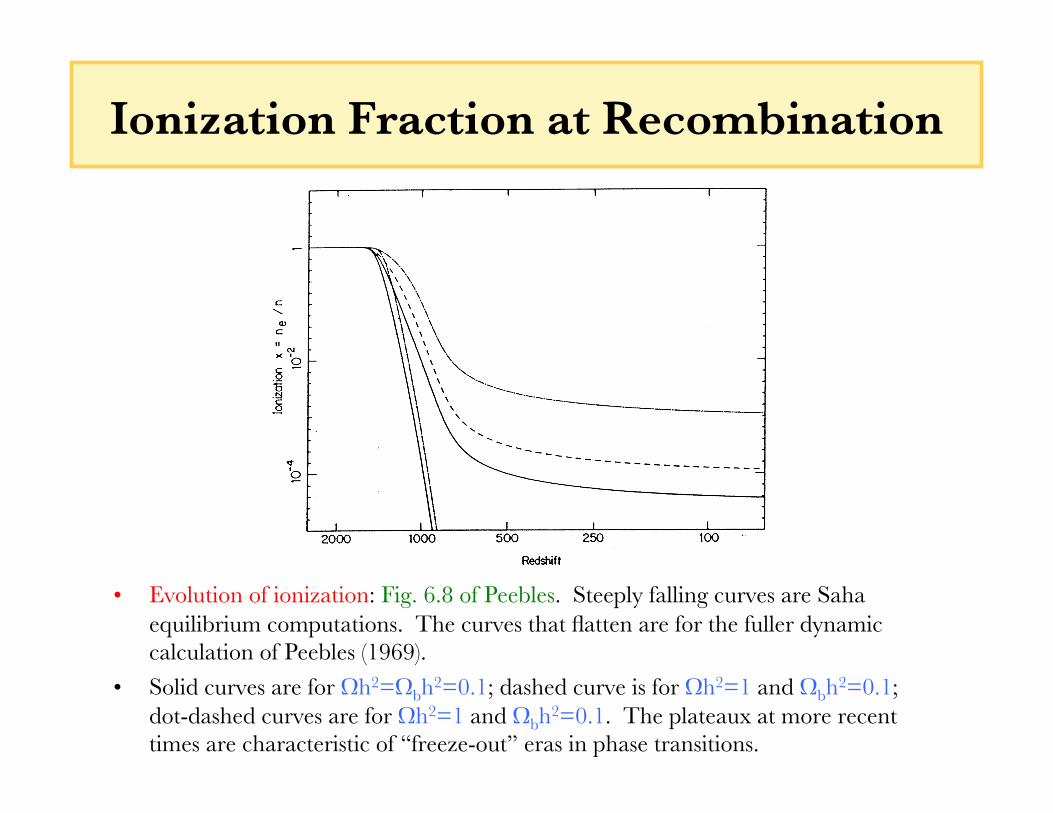
Ionization Fraction at Recombination
• Evolution of ionization: Fig. 6.8 of Peebles. Steeply falling curves are Saha equilibrium computations. The curves that flatten are for the fuller dynamic calculation of Peebles (1969).
• Solid curves are for Ωh2=Ωbh2=0.1; dashed curve is for Ωh2=1 and Ωbh2=0.1; dot-dashed curves are for Ωh2=1 and Ωbh2=0.1. The plateaux at more recent times are characteristic of “freeze-out” eras in phase transitions.