arXiv:hep-ex/9910052v1 25 Oct 1999 · arXiv:hep-ex/9910052v1 25 Oct 1999. ... Youc, Zhao Wenhengg,...
42
arXiv:hep-ex/9910052v1 25 Oct 1999 . Total Cross Section Measurements with π − , Σ − and Protons on Nuclei and Nucleons around 600 GeV/c The SELEX Collaboration U. Dersch i , N. Akchurin p , V.A. Andreev k , A.G. Atamantchouk k , M. Aykac p , M.Y. Balatz h , N.F. Bondar k , A. Bravar t , P.S. Cooper e , L.J. Dauwe q , G.V. Davidenko h , G. Dirkes i A.G. Dolgolenko h , D. Dreossi t , G.B. Dzyubenko h , R. Edelstein c , L. Emediato s , A.M.F. Endler d , J. Engelfried e,m , I. Eschrich i,1 , C.O. Escobar s,2 , A.V. Evdokimov h , I.S. Filimonov j,3 , F.G. Garcia s , M. Gaspero r , S. Gerzon ℓ , I. Giller ℓ , V.L. Golovtsov k , Y.M. Goncharenko f , E. Gottschalk c,e , P. Gouffon s , O.A. Grachov f ,4 , E. G¨ ulmez b , He Kangling g , M. Iori r , S.Y. Jun c , A.D. Kamenskii h , M. Kaya p , J. Kilmer e , V.T. Kim k , L.M. Kochenda k , K. K¨ onigsmann i,5 , I. Konorov i,6 , A.P. Kozhevnikov f , A.G. Krivshich k , H. Kr¨ uger i , M.A. Kubantsev h , V.P. Kubarovsky f , A.I. Kulyavtsev f ,c , N.P. Kuropatkin k , V.F. Kurshetsov f , A. Kushnirenko c , S. Kwan e , J. Lach e , A. Lamberto t , L.G. Landsberg f , I. Larin h , E.M. Leikin j , Li Yunshan g , Li Zhigang g , M. Luksys n , T. Lungov s,7 , D. Magarrel p , V.P. Maleev k , D. Mao c,8 , Mao Chensheng g , Mao Zhenlin g , S. Masciocchi i,9 , P. Mathew c,10 , M. Mattson c , V. Matveev h , E. McCliment p , S.L. McKenna o , M.A. Moinester ℓ , V.V. Molchanov f , A. Morelos m , V.A. Mukhin f , K.D. Nelson p , A.V. Nemitkin j , P.V. Neoustroev k , C. Newsom p , A.P. Nilov h , S.B. Nurushev f , A. Ocherashvili ℓ , G. Oleynik e,8 , Y. Onel p , E. Ozel p , S. Ozkorucuklu p , S. Patrichev k , A. Penzo t , S.I. Petrenko f , P. Pogodin p , B. Povh i , M. Procario c , V.A. Prutskoi h , E. Ramberg e , G.F. Rapazzo t , B.V. Razmyslovich k , V.I. Rud j , J. Russ c , Y. Scheglov i P. Schiavon t , V.K. Semyatchkin h , Preprint submitted to Elsevier Preprint 12 April 2018
-
Upload
nguyencong -
Category
Documents
-
view
216 -
download
0
Transcript of arXiv:hep-ex/9910052v1 25 Oct 1999 · arXiv:hep-ex/9910052v1 25 Oct 1999. ... Youc, Zhao Wenhengg,...
arX
iv:h
ep-e
x/99
1005
2v1
25
Oct
199
9
.
Total Cross Section Measurements
with π−, Σ− and Protons
on Nuclei and Nucleons around 600GeV/c
The SELEX Collaboration
U. Dersch i, N. Akchurin p, V.A. Andreev k,A.G. Atamantchouk k, M. Aykac p, M.Y. Balatz h,
N.F. Bondar k, A. Bravar t, P.S. Cooper e, L.J. Dauwe q,G.V. Davidenko h, G. Dirkes i A.G. Dolgolenko h, D. Dreossi t,
G.B. Dzyubenko h, R. Edelstein c, L. Emediato s,
A.M.F. Endler d, J. Engelfried e,m, I. Eschrich i,1,C.O. Escobar s,2, A.V. Evdokimov h, I.S. Filimonov j,3,
F.G. Garcia s, M. Gaspero r, S. Gerzon ℓ, I. Giller ℓ,V.L. Golovtsov k, Y.M. Goncharenko f, E. Gottschalk c,e,
P. Gouffon s, O.A. Grachov f,4, E. Gulmez b, He Kangling g,M. Iori r, S.Y. Jun c, A.D. Kamenskii h, M. Kaya p, J. Kilmer e,
V.T. Kim k, L.M. Kochenda k, K. Konigsmann i,5, I. Konorov i,6,A.P. Kozhevnikov f, A.G. Krivshich k, H. Kruger i,
M.A. Kubantsev h, V.P. Kubarovsky f, A.I. Kulyavtsev f,c,
N.P. Kuropatkin k, V.F. Kurshetsov f, A. Kushnirenko c,S. Kwan e, J. Lach e, A. Lamberto t, L.G. Landsberg f, I. Larin h,
E.M. Leikin j, Li Yunshan g, Li Zhigang g, M. Luksys n,T. Lungov s,7, D. Magarrel p, V.P. Maleev k, D. Mao c,8,
Mao Chensheng g, Mao Zhenlin g, S. Masciocchi i,9,P. Mathew c,10, M. Mattson c, V. Matveev h, E. McCliment p,
S.L. McKenna o, M.A. Moinester ℓ, V.V. Molchanov f,
A. Morelosm, V.A. Mukhin f, K.D. Nelson p, A.V. Nemitkin j,P.V. Neoustroev k, C. Newsom p, A.P. Nilov h, S.B. Nurushev f,
A. Ocherashvili ℓ, G. Oleynik e,8, Y. Onel p, E. Ozel p,S. Ozkorucuklu p, S. Patrichev k, A. Penzo t, S.I. Petrenko f,
P. Pogodin p, B. Povh i, M. Procario c, V.A. Prutskoi h,E. Ramberg e, G.F. Rapazzo t, B.V. Razmyslovich k, V.I. Rud j,
J. Russ c, Y. Scheglov i P. Schiavon t, V.K. Semyatchkin h,
Preprint submitted to Elsevier Preprint 12 April 2018
J. Simon i, A.I. Sitnikov h, D. Skow e, V.J. Smith o,M. Srivastava s, V. Steiner ℓ, V. Stepanov k, L. Stutte e,
M. Svoiski k, N.K. Terentyev k,c, G.P. Thomas a, L.N. Uvarov k,A.N. Vasiliev f, D.V. Vavilov f, V.S. Verebryusov h,
V.A. Victorov f, V.E. Vishnyakov h, A.A. Vorobyov k,K. Vorwalter i,11, J. You c, Zhao Wenheng g, Zheng Shuchen g,
R. Zukanovich-Funchal s
aBall State University, Muncie, IN 47306, U.S.A.
bBogazici University, Bebek 80815 Istanbul, Turkey
cCarnegie-Mellon University, Pittsburgh, PA 15213, U.S.A.
dCentro Brasiliero de Pesquisas Fısicas, Rio de Janeiro, Brazil
eFermilab, Batavia, IL 60510, U.S.A.
fInstitute for High Energy Physics, Protvino, Russia
gInstitute of High Energy Physics, Beijing, P.R. China
hInstitute of Theoretical and Experimental Physics, Moscow, Russia
iMax-Planck-Institut fur Kernphysik, 69117 Heidelberg, Germany
jMoscow State University, Moscow, Russia
kPetersburg Nuclear Physics Institute, St. Petersburg, Russia
ℓTel Aviv University, 69978 Ramat Aviv, Israel
mUniversidad Autonoma de San Luis Potosı, San Luis Potosı, Mexico
nUniversidade Federal da Paraıba, Paraıba, Brazil
oUniversity of Bristol, Bristol BS8 1TL, United Kingdom
pUniversity of Iowa, Iowa City, IA 52242, U.S.A.
qUniversity of Michigan-Flint, Flint, MI 48502, U.S.A.
rUniversity of Rome “La Sapienza” and INFN, Rome, Italy
sUniversity of Sao Paulo, Sao Paulo, Brazil
tUniversity of Trieste and INFN, Trieste, Italy
Abstract
Total cross sections for Σ− and π− on beryllium, carbon, polyethylene and copperas well as total cross sections for protons on beryllium and carbon have been mea-sured in a broad momentum range around 600GeV/c. These measurements wereperformed with a transmission technique adapted to the SELEX hyperon-beamexperiment at Fermilab. We report on results obtained for hadron-nucleus crosssections and on results for σtot(Σ
−N) and σtot(π−N), which were deduced from
nuclear cross sections.
2
1 Introduction
Hadronic total cross sections provide one measure of the strength of thehadronic interaction. They have been measured for a variety of reactions overa broad range of center of mass energies. These studies revealed that withincreasing center of mass (CM) energy, hadron-hadron cross sections (gener-ally) decrease to a minimum and then start rising again. An important currentphysics question is whether the rise of a specific hadron-hadron cross sectionis described by a power law in the CM energy. Addressing this question re-quires total cross-section experiments performed with a variety of hadronicprojectiles, targets and energies covering the maximum possible range. How-ever, for almost 20 years, there have been few new experiments in this field.Thus, important hadron-hadron cross sections as σtot(πp) and σtot(Kp) aremeasured only up to 380GeV/c and the total cross section σtot(Σ
−p) is onlymeasured up to 137GeV/c. At these maximum laboratory momenta only afirst indication of the rise of these total cross sections is observed.SELEX (Fermilab E781) is a fixed-target experiment at the Fermi National
Accelerator Laboratory using a hyperon beam of about 600GeV/c. The SE-LEX spectrometer, designed for spectroscopy of charm baryons, is well-suitedto measure total cross sections with a transmission technique. It has excellentscattering-angle resolution, achieved by a system of silicon microstrip detec-tors.SELEX does not have a liquid hydrogen target. Therefore, we measured
the total hadron-nucleus cross sections σtot(π−Be), σtot(π
−C), σtot(π−CH2),
σtot(Σ−Be), σtot(Σ
−C), σtot(Σ−CH2), σtot(pBe) and σtot(pC) with high preci-
sion. We then deduced the total cross sections σtot(Σ−p) and σtot(π
−p) usingboth a CH2 – C subtraction technique and a method based on the Glaubermodel to derive hadron-nucleon cross sections from hadron-nucleus cross sec-tions.Further, as data on hadron-nucleus cross sections are extremely scarce for
1 Now at Imperial College, London SW7 2BZ, U.K.2 Current Address: Instituto de Fısica da Universidade Estadual de Campinas,
UNICAMP, SP, Brazil3 deceased4 Present address: Dept. of Physics, Wayne State University, Detroit, MI 482015 Now at Universitat Freiburg, 79104 Freiburg, Germany6 Now at Physik-Department, Technische Universitat Munchen, 85748 Garching,
Germany7 Current Address: Instituto de Fısica Teorica da Universidade Estadual Paulista,
Sao Paulo, Brazil8 Present address: Lucent Technologies, Naperville, IL9 Now at Max-Planck-Institut fur Physik, Munchen, Germany10 Present address: Motorola Inc., Schaumburg, IL11 Present address: Deutsche Bank AG, 65760 Eschborn, Germany
3
charged projectiles, we also measured σtot(π−Cu) and σtot(Σ
−Cu). All mea-surements were done during dedicated run periods in July 1997. Laboratorymomenta range from 455GeV/c to 635GeV/c, the highest energy yet used forthese studies.
2 Experimental setup
2.1 The hyperon beam
The hyperon beam is generated by selecting positively or negatively chargedsecondaries around 600GeV/c that emerge from interactions of an 800GeV/cprimary proton beam with a beryllium production target. Its composition hasnot been completely measured. However, we have measured the main parti-cle components of the event samples, which we selected to determine totalcross sections (see section 5.2.1). This analysis shows that at the position ofthe total cross-section target the negative beam samples consist in average of(52.5 ± 1.6)% mesons and (47.5 ± 1.6)% baryons. Further, we measured a Ξ−
fraction of (1.18 ± 0.06)% in these samples. Other baryonic fractions (p,Ω−)were not measured, but empirical formulae (see [1]) predict they are less than0.1%. Likewise, the K− fraction of the negative beam is estimated with [1] tobe (1.6 ± 1.0)%. Thus, we expect that the π− fraction of the event samples is(50.9 ± 1.9)%.In the event samples for positive beam we measured a meson fraction of
(8.1 ± 1.4)% and a baryon fraction of (91.9 ± 1.4)%. Furthermore, we mea-sured a Σ+ fraction of (2.7 ± 0.7)%. Using the empirical formula given in [1],we expect that the tiny meson fraction consists of 70% π+ and 30% K+.From these compositions, one sees that as long as one can distinguish mesons
from baryons (see section 2.2), the SELEX hyperon beam offers a uniquepossibility to measure total cross sections for protons, π−, and Σ− in a lowcontaminant environment.
2.2 The section of the SELEX spectrometer used for total cross-section mea-
surements
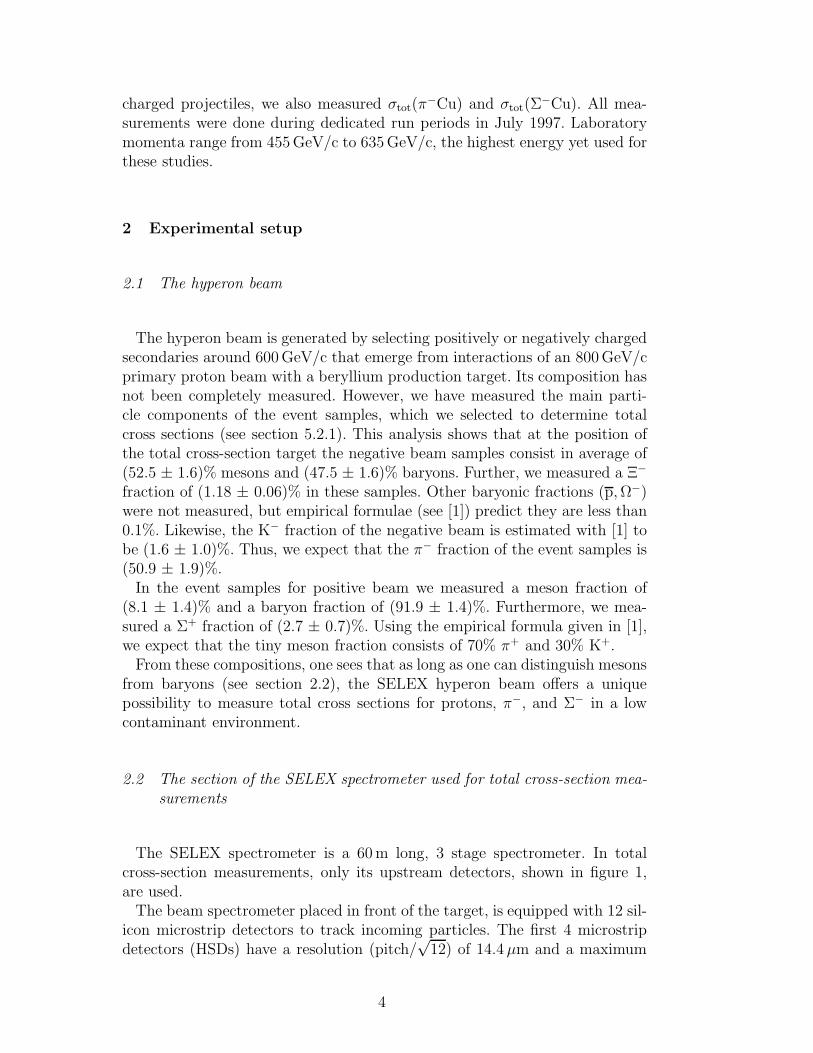
The SELEX spectrometer is a 60m long, 3 stage spectrometer. In totalcross-section measurements, only its upstream detectors, shown in figure 1,are used.The beam spectrometer placed in front of the target, is equipped with 12 sil-
icon microstrip detectors to track incoming particles. The first 4 microstripdetectors (HSDs) have a resolution (pitch/
√12) of 14.4µm and a maximum
4
LA
SD2
M1
PW
C 1
M1
PW
C 2
M1
PW
C 3
S3
V3
polished granite block
concrete block
HSD
1
BTRD
S1 V1S2
V2
HSD
2 RF - cage
HSD
3
IC
V5
S4
target321 1 2 3 4 5
BSSD detectors VSSD detectors
hype
ron
mag
net
S3
V3
polished granite block
concrete block
HSD
1
BTRD
S1 V1S2
V2
HSD
2 RF - cage
HSD
3
IC
V5
S4
target321 1 2 3 4 5
BSSD detectors VSSD detectors
beam spectrometer
-138
.4
+30.
9
+21.
9
+13.
0
-316
.0
-74.
4
+39.
9
+4.0 z [cm]
-151
.4
-18.
4 0.0
+53.
8vertex spectrometer
z
x
y
SELEX coordinatesystem
hype
ron
mag
net
magnet M1
LA
SD1
magnet M2
z [cm]
+323
+345
+414
+486
+625
+862
+907
LA
SD3
M2
PW
C 1
+745
+191
M2 spectrometerM1 spectrometer
+114
1M
2 P
WC
7
M2
PW
C 5
M2
PW
C 6
+108
3
+106
6
M2
PW
C 4
+100
7
+946
+927
M2
PW
C 3
M2
PW
C 2
Fig. 1. Sections of the SELEX spectrometer involved in the measurement of totalcross sections.
signal integration time of 100 ns. As this is the shortest integration time, butpoorest spatial resolution, of all SELEX silicon microstrip detectors, the HSDsserve chiefly to reject stale tracks. Always, two HSDs are housed in a singlestation. The average efficiency of the HSDs is 92%.The remaining 8 silicon microstrip detectors of the beam spectrometer are
grouped into 3 stations (BSSDs) mounted on a granite block inside a noiseshielded cage (RF-cage). These detectors have a resolution of 5.8µm and anaverage efficiency of 99.6%.Incoming particles are identified by a transition radiation detector (BTRD)
with 10 separate transition radiation detector modules (TRMs). Each moduleis build of a radiator in succession with 3 proportional chambers (PCs) whoseoperating gas is a 70% Xe, 30% CO2 mixture to optimize signal responsetime and to maximize absorption of transition-radiation photons. Each cham-ber has a single anode readout amplifier. A radiator consists of a stack of200 polypropylene foils, each 17µm thick and spaced at 500µm.
5
0
2
4
6
8
10
12
14
16
18
0 5 10 15 20
BTRD signal
sum of signals (fit)
baryon signal (fit)
meson signal (fit)
region for baryonselection
region for mesonselection
TRD plane count k
sign
al p
roba
bilit
y [%
]
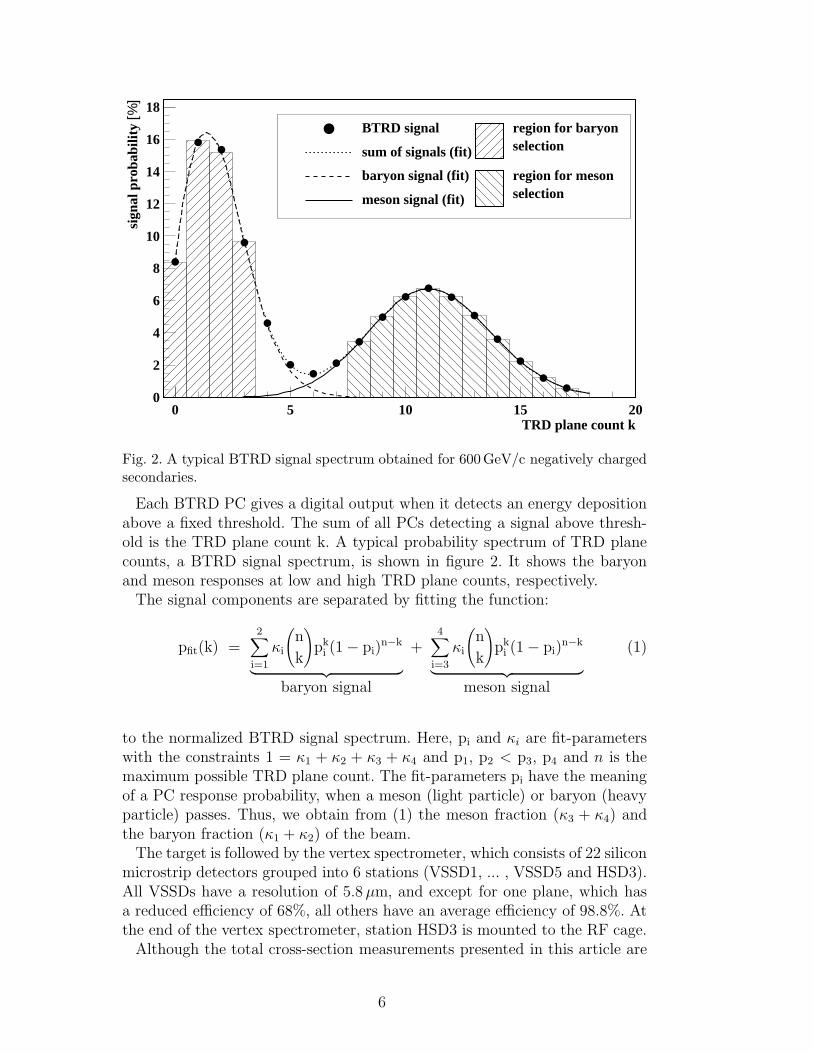
Fig. 2. A typical BTRD signal spectrum obtained for 600GeV/c negatively chargedsecondaries.
Each BTRD PC gives a digital output when it detects an energy depositionabove a fixed threshold. The sum of all PCs detecting a signal above thresh-old is the TRD plane count k. A typical probability spectrum of TRD planecounts, a BTRD signal spectrum, is shown in figure 2. It shows the baryonand meson responses at low and high TRD plane counts, respectively.The signal components are separated by fitting the function:
pfit(k) =2∑
i=1
κi
(
n
k
)
pki (1− pi)
n−k
︸ ︷︷ ︸
baryon signal
+4∑
i=3
κi
(
n
k
)
pki (1− pi)
n−k
︸ ︷︷ ︸
meson signal
(1)
to the normalized BTRD signal spectrum. Here, pi and κi are fit-parameterswith the constraints 1 = κ1 + κ2 + κ3 + κ4 and p1, p2 < p3, p4 and n is themaximum possible TRD plane count. The fit-parameters pi have the meaningof a PC response probability, when a meson (light particle) or baryon (heavyparticle) passes. Thus, we obtain from (1) the meson fraction (κ3 + κ4) andthe baryon fraction (κ1 + κ2) of the beam.The target is followed by the vertex spectrometer, which consists of 22 silicon
microstrip detectors grouped into 6 stations (VSSD1, ... , VSSD5 and HSD3).All VSSDs have a resolution of 5.8µm, and except for one plane, which hasa reduced efficiency of 68%, all others have an average efficiency of 98.8%. Atthe end of the vertex spectrometer, station HSD3 is mounted to the RF cage.Although the total cross-section measurements presented in this article are
6
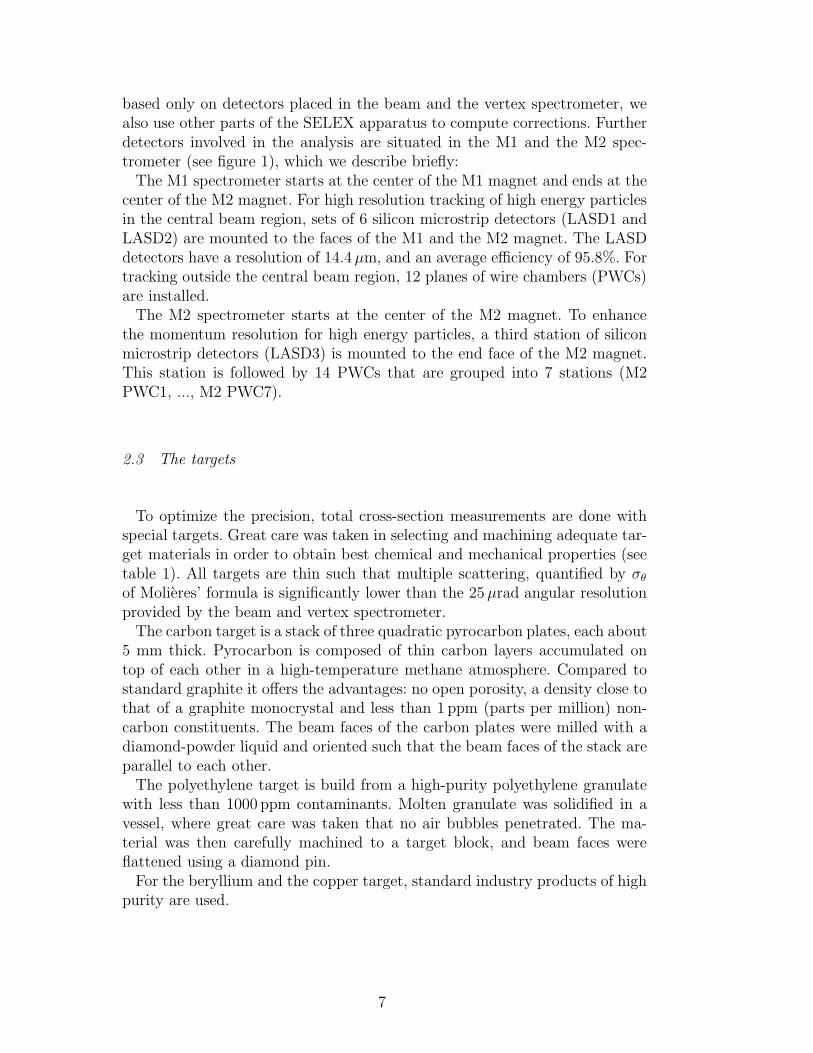
based only on detectors placed in the beam and the vertex spectrometer, wealso use other parts of the SELEX apparatus to compute corrections. Furtherdetectors involved in the analysis are situated in the M1 and the M2 spec-trometer (see figure 1), which we describe briefly:The M1 spectrometer starts at the center of the M1 magnet and ends at the
center of the M2 magnet. For high resolution tracking of high energy particlesin the central beam region, sets of 6 silicon microstrip detectors (LASD1 andLASD2) are mounted to the faces of the M1 and the M2 magnet. The LASDdetectors have a resolution of 14.4µm, and an average efficiency of 95.8%. Fortracking outside the central beam region, 12 planes of wire chambers (PWCs)are installed.The M2 spectrometer starts at the center of the M2 magnet. To enhance
the momentum resolution for high energy particles, a third station of siliconmicrostrip detectors (LASD3) is mounted to the end face of the M2 magnet.This station is followed by 14 PWCs that are grouped into 7 stations (M2PWC1, ..., M2 PWC7).
2.3 The targets
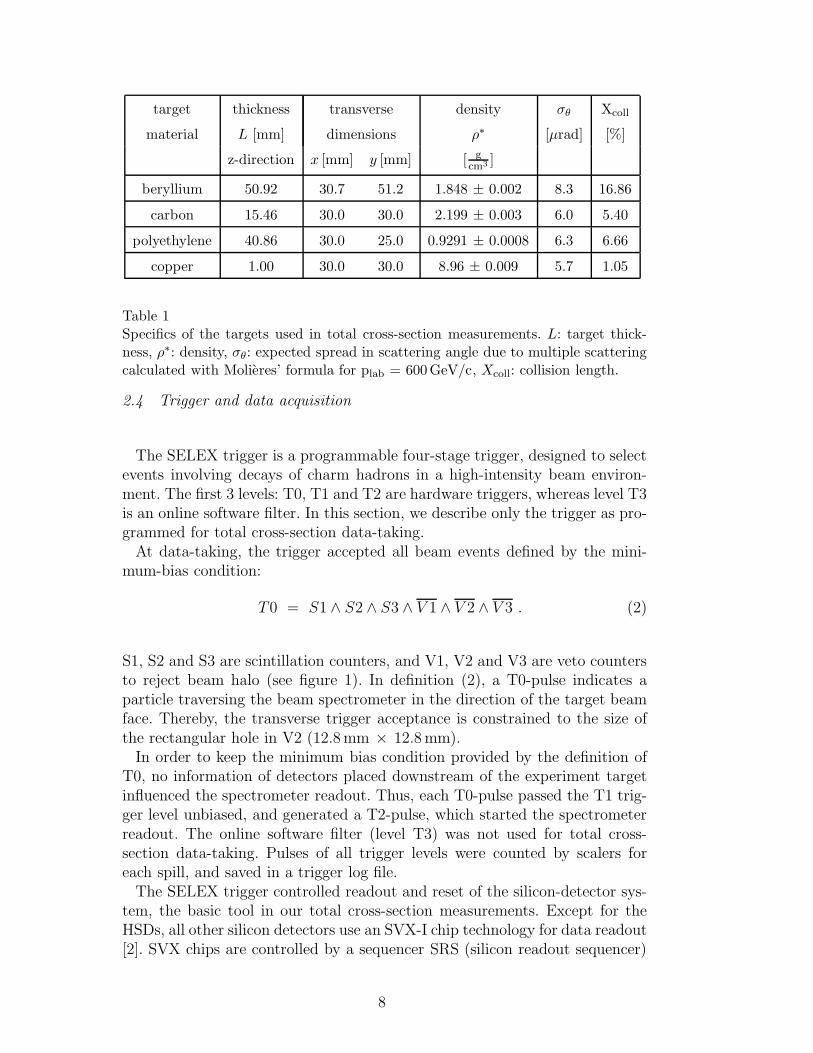
To optimize the precision, total cross-section measurements are done withspecial targets. Great care was taken in selecting and machining adequate tar-get materials in order to obtain best chemical and mechanical properties (seetable 1). All targets are thin such that multiple scattering, quantified by σθ
of Molieres’ formula is significantly lower than the 25µrad angular resolutionprovided by the beam and vertex spectrometer.The carbon target is a stack of three quadratic pyrocarbon plates, each about
5 mm thick. Pyrocarbon is composed of thin carbon layers accumulated ontop of each other in a high-temperature methane atmosphere. Compared tostandard graphite it offers the advantages: no open porosity, a density close tothat of a graphite monocrystal and less than 1 ppm (parts per million) non-carbon constituents. The beam faces of the carbon plates were milled with adiamond-powder liquid and oriented such that the beam faces of the stack areparallel to each other.The polyethylene target is build from a high-purity polyethylene granulate
with less than 1000 ppm contaminants. Molten granulate was solidified in avessel, where great care was taken that no air bubbles penetrated. The ma-terial was then carefully machined to a target block, and beam faces wereflattened using a diamond pin.For the beryllium and the copper target, standard industry products of high
purity are used.
7
target thickness transverse density σθ Xcoll
material L [mm] dimensions ρ∗ [µrad] [%]
z-direction x [mm] y [mm] [ gcm3 ]
beryllium 50.92 30.7 51.2 1.848 ± 0.002 8.3 16.86
carbon 15.46 30.0 30.0 2.199 ± 0.003 6.0 5.40
polyethylene 40.86 30.0 25.0 0.9291 ± 0.0008 6.3 6.66
copper 1.00 30.0 30.0 8.96 ± 0.009 5.7 1.05
Table 1Specifics of the targets used in total cross-section measurements. L: target thick-ness, ρ∗: density, σθ: expected spread in scattering angle due to multiple scatteringcalculated with Molieres’ formula for plab = 600GeV/c, Xcoll: collision length.
2.4 Trigger and data acquisition
The SELEX trigger is a programmable four-stage trigger, designed to selectevents involving decays of charm hadrons in a high-intensity beam environ-ment. The first 3 levels: T0, T1 and T2 are hardware triggers, whereas level T3is an online software filter. In this section, we describe only the trigger as pro-grammed for total cross-section data-taking.At data-taking, the trigger accepted all beam events defined by the mini-
mum-bias condition:
T0 = S1 ∧ S2 ∧ S3 ∧ V 1 ∧ V 2 ∧ V 3 . (2)
S1, S2 and S3 are scintillation counters, and V1, V2 and V3 are veto countersto reject beam halo (see figure 1). In definition (2), a T0-pulse indicates aparticle traversing the beam spectrometer in the direction of the target beamface. Thereby, the transverse trigger acceptance is constrained to the size ofthe rectangular hole in V2 (12.8mm × 12.8mm).In order to keep the minimum bias condition provided by the definition of
T0, no information of detectors placed downstream of the experiment targetinfluenced the spectrometer readout. Thus, each T0-pulse passed the T1 trig-ger level unbiased, and generated a T2-pulse, which started the spectrometerreadout. The online software filter (level T3) was not used for total cross-section data-taking. Pulses of all trigger levels were counted by scalers foreach spill, and saved in a trigger log file.The SELEX trigger controlled readout and reset of the silicon-detector sys-
tem, the basic tool in our total cross-section measurements. Except for theHSDs, all other silicon detectors use an SVX-I chip technology for data readout[2]. SVX chips are controlled by a sequencer SRS (silicon readout sequencer)
8
that interacts very closely with the trigger. First, it keeps the silicon detectorssensitive (for about 5µs effective integration time) and starts the chip read-out when receiving a T2-pulse. Second, the SRS resets the SVX-chips, whena silicon-clear signal arrives. Thereby, the silicon-clear signal is generated inthe trigger logic through:
Silicon clear = V 5mult ∨ Cpulser ∨ (T1 ∧ T2) . (3)
Here, Cpulser are pulses from a gate generator running at a frequency of 20 kHzand V 5mult represents pulses generated, when the V5 veto counter (see figure 1)detects a high multiplicity event. The condition (T1 ∧ T2) was irrelevant fortotal cross-section data.
2.5 Experimental conditions and recorded data
During the fixed-target run 1996/97, the TEVATRON was operated in 60 scycles with a spill time of 20 s. Data for total cross sections were taken duringdedicated periods, with optimized experimental conditions for this measure-ment.By adjusting the flux of the 800GeV/c proton beam, the T0-rate was op-
timized to run the SELEX DAQ near, but safely below its capacity limit of5·104 particles per spill. The low hyperon-beam flux allowed a high silicon-clear rate, which resulted in a very low-noise condition for the silicon-detectorsystem and a low probability for stale tracks.During data-taking, the M1 magnet was switched off to obtain a 2.5m field-
and material-free section, serving as fiducial region for precise reconstructionof hyperon decays. Magnet M2 was operated with a transverse momentumkick of pM2
T = 0.84GeV/c.At data-taking start, after mounting an experiment target in the RF-cage,
an alignment RUN was taken to account for eventual detector displacementscaused during the target installation. Then, the position of the experiment tar-get was alternated every 30min between its out and in-beam position. Thus,almost equal amounts of data were taken with full and empty target. A RUN,started after each target-position change, comprised typically 106 events. Atotal of 9.8·107 minimum-bias events were recorded with negative beam forthe targets Be, C, Cu and CH2. With positive beam, 3.0·107 minimum-biasevents were written using the targets Be and C.
9
3 The principle of the transmission method
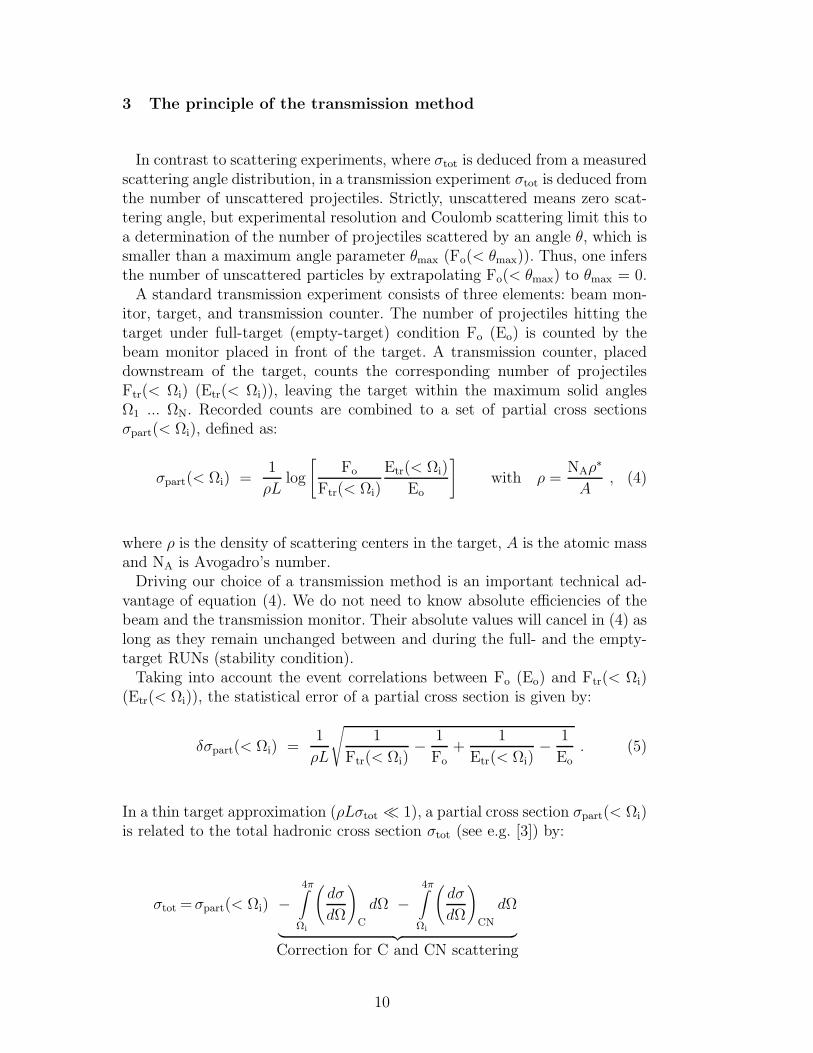
In contrast to scattering experiments, where σtot is deduced from a measuredscattering angle distribution, in a transmission experiment σtot is deduced fromthe number of unscattered projectiles. Strictly, unscattered means zero scat-tering angle, but experimental resolution and Coulomb scattering limit this toa determination of the number of projectiles scattered by an angle θ, which issmaller than a maximum angle parameter θmax (Fo(< θmax)). Thus, one infersthe number of unscattered particles by extrapolating Fo(< θmax) to θmax = 0.A standard transmission experiment consists of three elements: beam mon-
itor, target, and transmission counter. The number of projectiles hitting thetarget under full-target (empty-target) condition Fo (Eo) is counted by thebeam monitor placed in front of the target. A transmission counter, placeddownstream of the target, counts the corresponding number of projectilesFtr(< Ωi) (Etr(< Ωi)), leaving the target within the maximum solid anglesΩ1 ... ΩN. Recorded counts are combined to a set of partial cross sectionsσpart(< Ωi), defined as:
σpart(< Ωi) =1
ρLlog
[
Fo
Ftr(< Ωi)
Etr(< Ωi)
Eo
]
with ρ =NAρ
∗
A, (4)
where ρ is the density of scattering centers in the target, A is the atomic massand NA is Avogadro’s number.Driving our choice of a transmission method is an important technical ad-
vantage of equation (4). We do not need to know absolute efficiencies of thebeam and the transmission monitor. Their absolute values will cancel in (4) aslong as they remain unchanged between and during the full- and the empty-target RUNs (stability condition).Taking into account the event correlations between Fo (Eo) and Ftr(< Ωi)
(Etr(< Ωi)), the statistical error of a partial cross section is given by:
δσpart(< Ωi) =1
ρL
√
1
Ftr(< Ωi)− 1
Fo+
1
Etr(< Ωi)− 1
Eo. (5)
In a thin target approximation (ρLσtot ≪ 1), a partial cross section σpart(< Ωi)is related to the total hadronic cross section σtot (see e.g. [3]) by:
σtot =σpart(< Ωi) −4π∫
Ωi
(
dσ
dΩ
)
C
dΩ −4π∫
Ωi
(
dσ
dΩ
)
CN
dΩ
︸ ︷︷ ︸
Correction for C and CN scattering
10
+
Ωi∫
0
(
dσ
dΩ
)hadr
el
dΩ
︸ ︷︷ ︸
elastic term
+
Ωi∫
0
(
dσ
dΩ
)hadr
inel
dΩ
︸ ︷︷ ︸
inelastic term
. (6)
In equation (6), σtot is infered by first correcting partial cross sections forCoulomb scattering (C) and the Coulomb hadronic interference (CN) andthen extrapolating to zero solid angle.
4 Data analysis
4.1 Data selection
In general, total cross-section data taken for a specific target were subjectto varying experimental conditions: thresholds on silicon microstrip detec-tors, high voltages for trigger scintillators, and the inclination angle betweenprimary proton beam and production target. Therefore, data belonging to across-section measurement with a specific target were divided into as manydata sets as differing conditions had to be taken into account. This offered thepossibility to calculate corrections and errors specifically for each experimentalcondition in a later stage of the analysis. To preserve the stability conditionmentioned in chapter 3, a spill by spill data pre-selection was performed. Dataof a spill or a whole run were rejected:
(1) When the experimental conditions concerning the functionality of thespectrometer (detector efficiencies, trigger performance and track recon-struction efficiencies) suddenly changed.
(2) When it was not possible to synchronize raw data with information inthe trigger log file.
(3) When the BTRD showed instabilities or when the beam phase space layoutside the BTRD fiducial region.
4.2 Event selection for normalization
The total cross-section determination is made by counting how many goodbeam tracks are removed from the beam by interactions in the target. The nor-malization therefore depends only on the number of good beam tracks, whichare identified by a software decision routine. This routine reconstructs tracks inthe beam spectrometer using the HSD and BSSD hit information. It preservesthe minimum-bias condition for the selected data by strictly avoiding event-selection rules that require information from detectors placed downstream of
11

the target. An event is accepted when it is possible to reconstruct a trackcalled a “norm track”, provided that the following properties are satisfied:
(1) Not more than a total of 150 hits in all BSSDs.(2) At least 6 hits from BSSD planes along the track.(3) At least one hit from an HSD plane along the track (HSD-tagging).(4) A reduced track-fit χ2 below 3.(5) An extrapolated origin of the track at the known transverse position of
the primary production target.(6) Track intercept and slope parameters within the beam phase space ac-
cepted by magnetic collimation.(7) A transverse track position at the longitudinal position of the experi-
mental target, which is inside the trigger acceptance window and insideBTRD acceptance.
(8) A beam momentum assigned to the track, which is ± 100GeV/c aroundthe center of gravity value of the momentum spectrum.
Condition 3 rejects stale tracks. The selection rules 4 – 6 remove events inwhich hyperons decay before reaching the experiment target or react withdetector material in the beam spectrometer. Constraint 7 assures also thatselected tracks point to the mid-part of the experiment target face, where thebest mechanical accuracy is obtained.All listed conditions were true for about 50% of the selected events. From the
resulting set of norm tracks for full- and empty-target conditions, we establishclasses of BTRD-tagged norm tracks. This is done by introducing cuts on theBTRD information as indicated in figure 2 to separate baryonic and mesonicnorm tracks. We then determine the corresponding normalization counts Fo
and Eo by summing the norm tracks over the appropriate signal region.
4.3 Transmission counting
When a norm track is found in the event, we reconstruct a single track inthe vertex spectrometer, which is leaving the interaction target at small anglewith respect to the norm track.The single-track algorithm was efficient and fast. It used hits of HSD3 to
remove stale tracks. With loose cuts on the track parameters 98% of the normtracks got assigned a track in the vertex spectrometer. Such vertex tracks werefinally accepted as “transmitted tracks”, when:
(1) There are at least 15 hits from VSSDs found within a track search corri-dor.
(2) The reduced track-fit χ2 is below 3.
12
For each transmitted track, the scattering angle θ between norm and trans-mitted track is calculated. Following the idea of [4], a four-momentum transfert is assigned to the event using the small angle approximation t ≈ −p2
beamθ2,
where pbeam is the momentum of the incoming particle. Transmitted tracks areassigned to t bins of width 5.0 ·10−4GeV2/c2. Note that we count transmittedtracks in t-bins, rather than in bins of solid angle Ω as discussed in chapter 3.Summing the events in the t-bins from zero up to a maximum ti leads to setsof transmission counts Ftr(< |ti|) and Etr(< |ti|).
4.4 Spectra of uncorrected partial cross sections
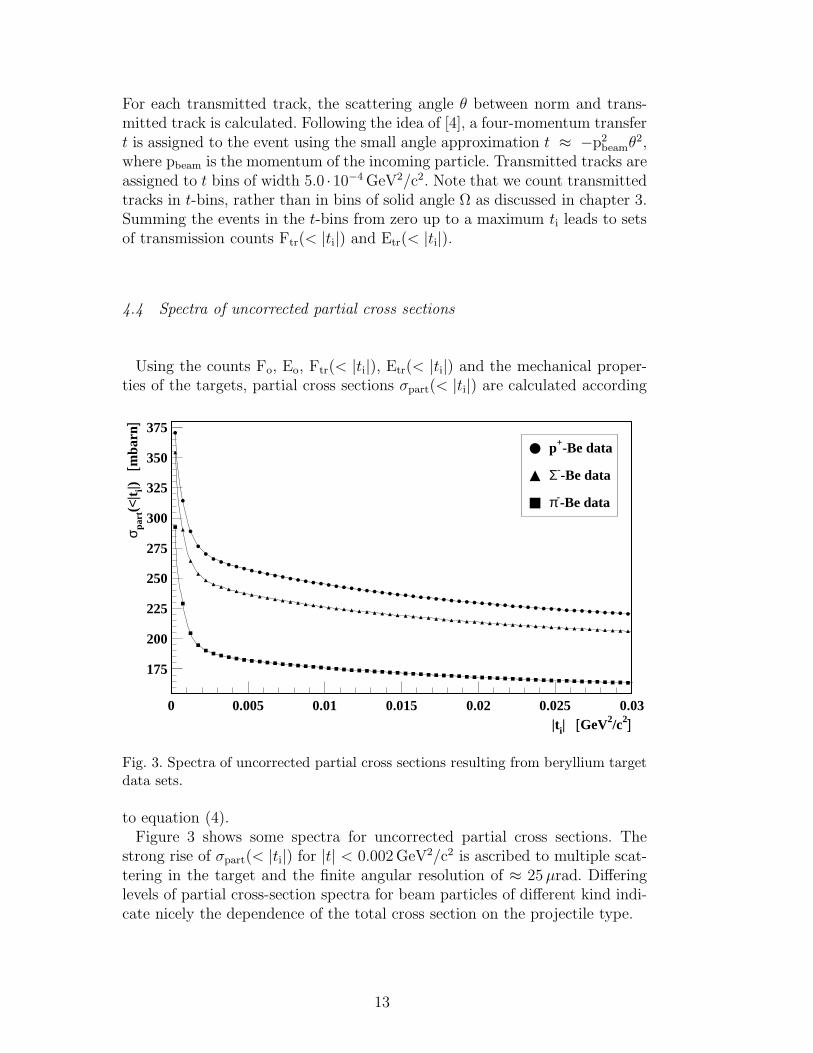
Using the counts Fo, Eo, Ftr(< |ti|), Etr(< |ti|) and the mechanical proper-ties of the targets, partial cross sections σpart(< |ti|) are calculated according
175
200
225
250
275
300
325
350
375
0 0.005 0.01 0.015 0.02 0.025 0.03
p+-Be data
Σ--Be data
π--Be data
|ti| [GeV2/c2]
σ part
(<|t i|)
[m
barn
]
Fig. 3. Spectra of uncorrected partial cross sections resulting from beryllium targetdata sets.
to equation (4).Figure 3 shows some spectra for uncorrected partial cross sections. The
strong rise of σpart(< |ti|) for |t| < 0.002GeV2/c2 is ascribed to multiple scat-tering in the target and the finite angular resolution of ≈ 25µrad. Differinglevels of partial cross-section spectra for beam particles of different kind indi-cate nicely the dependence of the total cross section on the projectile type.
13
4.5 Corrections for non-hadronic effects
Partial cross sections were corrected for single Coulomb scattering (C) andfor the Coulomb-Nuclear interference effect (CN) evaluating the expression:
σcorrpart(< |ti|) = σpart(< |ti|) −
ti∫
−∞
(
dσ
dt′
)
C
dt′
︸ ︷︷ ︸
C correction
−ti∫
−∞
(
dσ
dt′
)
CN
dt′
︸ ︷︷ ︸
CN correction
. (7)
Applying the Coulomb correction, a change in the extrapolated cross sectionof not more than 0.5% is observed for the light targets Be, C and CH2. For theCu target a change of up to 11% is noticed. The CN correction is roughly oneorder of magnitude smaller than the Coulomb correction and has negligibleeffect on the extrapolated cross section.
4.6 The extrapolation method
As |t| approaches zero, the growth behavior of partial cross sections is gov-erned ideally by the elastic term in equation (6). At small |t|, hadronic coherentelastic scattering off nuclei dominates. Thus, we obtain for the elastic term inequation (6), the expression:
t∫
0
(
dσ
dt′
)hadr
el
dt′ =σ2tot
16πBnuc(1 + ρ2)
[
1 − eBnuct]
, (8)
where Bnuc is the exponential slope observed in hadronic coherent elastic scat-tering off nuclei. Therefore, we choose the functional form
f(α1, α2, t) = α1
[
1 − eα2t]
(9)
to describe the variation of partial cross sections with respect to |ti|.The parameters α1 and α2 are determined in fitting function (9) to differ-
ences in corrected partial cross sections of adjacent t-bins. Thereby, only thosecorrected partial cross sections where ti is in the range of tmin = -0.007GeV2/c2
to tmax = -0.03GeV2/c2 enter the fit procedure. The limits tmax and tmin ac-count for experimental sensitivity to hadronic coherent elastic scattering offnuclei. Their derivation is described in section 4.6.1.Starting from the partial cross section σpart(< |tmin|), the extrapolation to
14
the total cross section σtot is determined by accounting for the expected growthin partial cross sections from tmin to t = 0 using the expression:
σtot = σpart(< |tmin|) + α1
[
1 − eα2tmin
]
. (10)
4.6.1 The limits tmin and tmax and the sensitivity of the SELEX experiment
to coherent hadronic elastic scattering off nuclei
In measurements of hadron-nucleus cross sections, it is essential that the ex-periment is sensitive to hadronic coherent elastic scattering off nuclei. Further,one must be able to distinguish coherent from incoherent scattering processesoff nucleons. In scattering off nuclei, the nucleus can break up when the energytransfer exceeds the binding energy of its nucleons. This leads to a contribu-tion of incoherent scattering off nucleons for |t| > 0.015 GeV2/c2. In thatcase, the hadronic differential elastic cross section, entering the elastic termof equation (6), contains two parts:
(
dσ
dt
)hadr
el
=σ2tot(hA)
16π(1 + ρ′2)eBnuct
︸ ︷︷ ︸
coherent scattering
+ N(A)σ2tot(hN)
16πeBNt
︸ ︷︷ ︸
incoherent scattering
. (11)
There is a term for coherent elastic scattering off the nucleus, in which σtot(hA)is the total nuclear cross section, and a term for incoherent scattering off nu-cleons, in which σtot(hN) is the corresponding hadron-nucleon cross section.BN is the slope parameter for scattering off nucleons, and N(A) is a factor de-scribing the effective number of nucleons taking part in the incoherent processfor target nuclei of mass A (see [5]).The contribution of the incoherent term decreases the growth behavior of
the elastic term in (6) because BN is typically one or more orders of magnitudesmaller than Bnuc. An extrapolation based on partial cross sections, selectedin a |t|-range far above 0.015GeV2/c2 would lead to a systematically loweredcross-section result as a fraction of the elastic processes is not discriminated.Consequently, we looked for a t-interval [tmin; tmax] to select partial cross sec-tions where their growth is dominated by Bnuc.The sensitivity of the SELEX spectrometer to hadronic coherent elastic
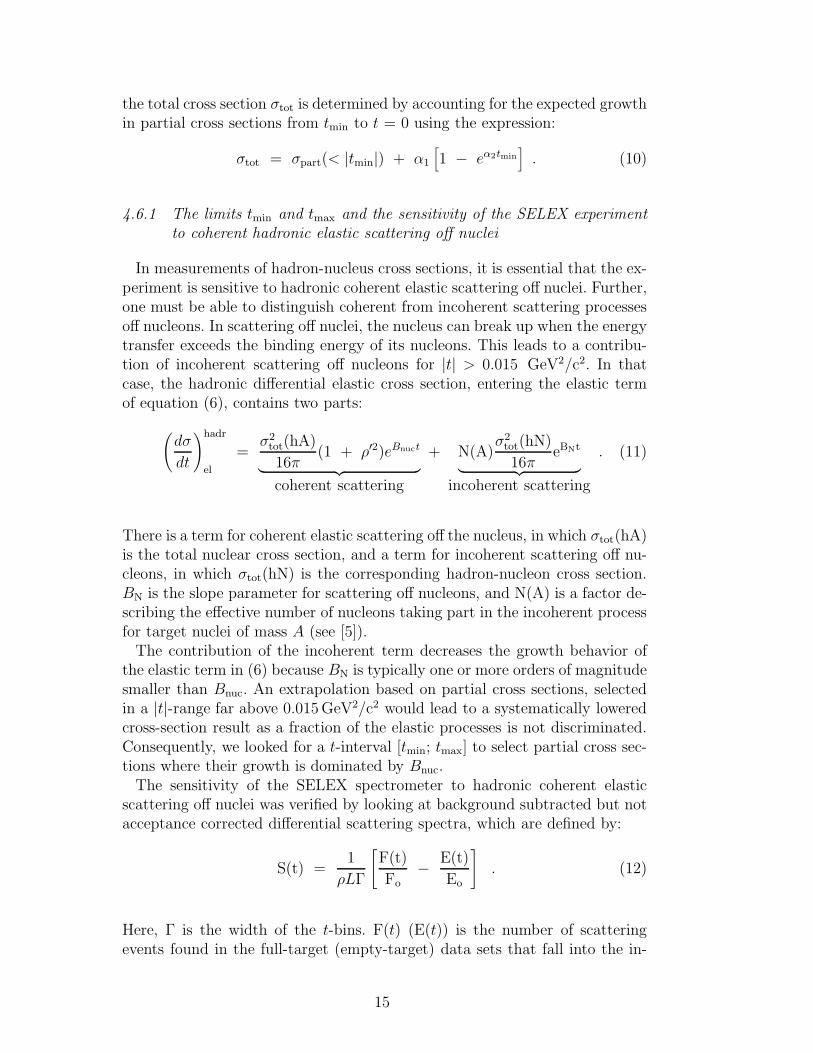
scattering off nuclei was verified by looking at background subtracted but notacceptance corrected differential scattering spectra, which are defined by:
S(t) =1
ρLΓ
[
F(t)
Fo− E(t)
Eo
]
. (12)
Here, Γ is the width of the t-bins. F(t) (E(t)) is the number of scatteringevents found in the full-target (empty-target) data sets that fall into the in-
15
terval [|t| − Γ/2 ; |t|+ Γ/2].Figure 4 shows a typical example of an S(t) spectrum obtained for Σ− scat-
tering off carbon nuclei. The spectrum shows three regions governed by ap-parently different exponential slopes, which can be explained by contributions
10-2
10-1
1
10
0 0.05 0.1 0.15 0.2 0.25 0.3 0.35
data
sum of terms
Coulomb term
coherent term
incoh. term
~ e62t
~ e4.7t
Cou
lom
b re
gion
coherentregion
incoherentregion
-t [GeV2/c2]
S(t)
[b
arn/
GeV
2 /c2 ]
10-1
1
10
0 0.02 0.04
tmin
tmax
Cou
lom
b re
gion
coherent region
-t [GeV2/c2]
S(t)
[b
arn/
GeV
2 /c2 ]
Fig. 4. Differential scattering spectrum obtained for Σ− carbon reactions, showingthe Coulomb, the coherent and the incoherent region.
of Coulomb scattering, coherent elastic scattering and incoherent elastic scat-tering comparable to measurements described in [5].Determinations of the slope parameters Bnuc and BN in S(t) spectra showed
the expected order of magnitude for all targets, and Bnuc agreed quite well withdata presented in [6]. Furthermore, the magnitude of Bnuc is also reflected bythe size of parameter α2 in equation (10), when applying the extrapolation.From such studies, we choose tmax = -0.03GeV2/c2 fixed, as this value is
well inside the region dominated by coherent hadronic elastic scattering offnuclei for all targets. The contribution of the integrated incoherent term atthis tmax is much lower than the integrated coherent term.Further, to avoid large multiple-scattering corrections, we choose a tmin of
−0.007 GeV2/c2, such that the angular resolution has negligible effect on theextrapolated total cross section.
16
5 Corrections
5.1 Trigger-rate corrections
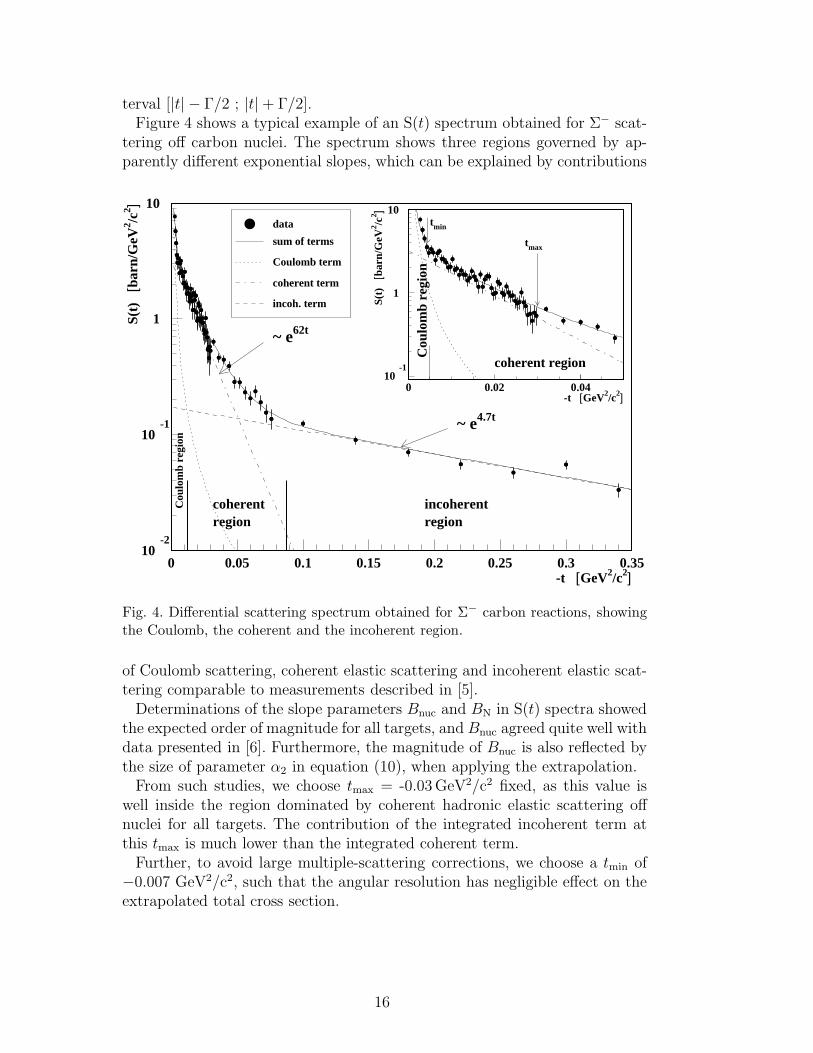
The trigger rate influences the reconstruction efficiency for tracks and thusalters the transmission ratios Tfull and Tempty per spill. Figure 5 shows aninstructive example of this effect.Due to the rate effect, our extrapolated total cross-section experiences a
shift ∆T0 when the average T0-counts, calculated for all empty and all full-target spills separately, differ.
84
85
86
87
88
89
90
0 20000 40000 60000 80000
89.84 - 8.27 10-10 T02
88.88 - 9.06 10-15 T03
88.35 - 1.05 10-19 T04
T0/Spill
Tfu
ll [%
]
Fig. 5. Dependency of full-target transmission ratios on the T0-count.
To determine the shift ∆T0 we calculate full and empty-target transmissionratios per spill for |t| < 0.01GeV2/c2 and describe their rate dependency byfitting to the expression
Tfit(T0) = β1,k + β2,kT0k . (13)
We have studied the effect of different powers (k = 2, 3, 4) to estimate sys-tematic errors.We choose the average T0-rate T0, comprising all full and all empty-target
spills as reference rate for the rate correction. Thus, transmission ratios perspill are corrected by evaluating:
TT0j,k
︸ ︷︷ ︸
corrected
= Tj(|t| < 0.01GeV2/c2)︸ ︷︷ ︸
uncorrected
+ β2,k(T0k − T0kj )
︸ ︷︷ ︸
correction
, (14)
17
which results in a set of corrected transmission ratios TT0j,k . Fit-function de-
pendent offsets ∆T0,k are deduced by:
∆T0,k = σT0,kpart (< 0.01GeV2/c2) − σpart(< 0.01GeV2/c2) (15)
and averaged to a mean offset ∆T0. Total cross sections are then corrected by:
σT0tot = σtot + ∆T0 . (16)
Averaged sizes of the rate correction are presented in table 2. We want tomention that the copper data were taken at higher rate, where the slope offunction (13) is steeper. This, together with the small thickness of the coppertarget, causes large corrections.
5.2 Corrections for beam contaminants
A transition radiation detector does not make an exact particle identifica-tion because of statistical fluctuations in X-ray generation and backgroundfrom various processes. Therefore, when selecting the baryon or the mesoncomponent of the hyperon beam by applying cuts on the BTRD plane count,we need to account for:
(1) The amount of meson (baryon) contaminants in the baryon (meson) sam-ple and the effect on the total cross section.
(2) The amount of baryon (meson) contaminants in a specific sample for ameasurement with protons or Σ− (π−) and the effect on the total crosssection.
Once the contaminant fraction ǫ is determined, the experimental cross sectionσexptot can be corrected by the term ∆cont using:
σ(1)tot = σexp
tot +1
ρLlog
[
1 + ǫ(2)(e−ρL(σ(2)tot − σ
(1)tot) − 1)
]
︸ ︷︷ ︸
Correction ∆cont
. (17)
This formula was derived in [7] for a two component beam having a contami-nation fraction ǫ(2).
5.2.1 Beam contaminant determination
In a first step, total cross sections resulting from data sets are correctedfor the fraction of mesons (baryons) in a baryon sample (meson sample) us-
18
ing (17). Therefore, we fit function (1) to normalized BTRD signal spectra,which are recorded for norm tracks. For negative beam these fits yield anaverage baryon fraction (κ1 + κ2) of (47.5 ± 1.6)% and an average mesonfraction (κ3 + κ4) of (52.5 ± 1.6)%. For positive beam, we measure a baryonfraction of (91.9 ± 1.4)% and a meson fraction of (8.1 ± 1.4)%. To deducethe meson (baryon) contaminant fraction ǫ, we sum the meson (baryon) com-ponent of (1) over the TRD plane count region shown in figure 2. Further,
the difference σ(2)tot − σ
(1)tot is calculated in taking rate corrected extrapolated
cross-section results obtained for the meson and the baryon beam component.In a second step, we account for the main contaminant disturbing a specific
measurement for protons, Σ− and π−. According to the expected hyperon-beam composition we correct:
(1) For the effect of Ξ− particles in the baryon sample, when measuring Σ−Across sections.
(2) For the effect of Σ+ particles in the baryon sample, when measuring pAcross sections.
(3) For the effect of K− particles in the meson sample, when measuring π−Across sections.
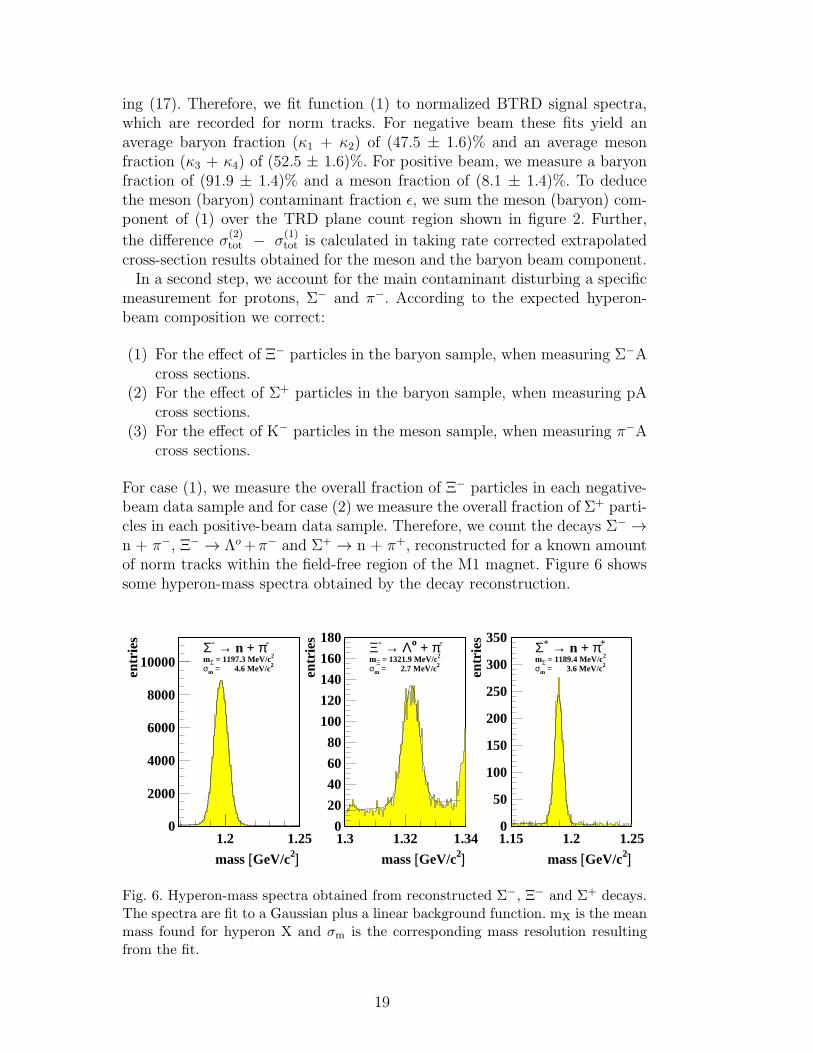
For case (1), we measure the overall fraction of Ξ− particles in each negative-beam data sample and for case (2) we measure the overall fraction of Σ+ parti-cles in each positive-beam data sample. Therefore, we count the decays Σ− →n + π−, Ξ− → Λo+π− and Σ+ → n + π+, reconstructed for a known amountof norm tracks within the field-free region of the M1 magnet. Figure 6 showssome hyperon-mass spectra obtained by the decay reconstruction.
0
2000
4000
6000
8000
10000
1.2 1.25
Σ- → n + π-
mΣ = 1197.3 MeV/c2
σm = 4.6 MeV/c2
mass [GeV/c2]
entr
ies
0
20
40
60
80
100
120
140
160
180
1.3 1.32 1.34
Ξ- → Λo + π-
mΞ = 1321.9 MeV/c2
σm = 2.7 MeV/c2
mass [GeV/c2]
entr
ies
0
50
100
150
200
250
300
350
1.15 1.2 1.25
Σ+ → n + π+
mΣ = 1189.4 MeV/c2
σm = 3.6 MeV/c2
mass [GeV/c2]
entr
ies
Fig. 6. Hyperon-mass spectra obtained from reconstructed Σ−, Ξ− and Σ+ decays.The spectra are fit to a Gaussian plus a linear background function. mX is the meanmass found for hyperon X and σm is the corresponding mass resolution resultingfrom the fit.
19
Particle decay counts are corrected for geometrical acceptance, branching ratioand decay losses after the target, to yield the overall hyperon contaminantfractions. Here, we find an overall Ξ− fraction of (1.18 ± 0.06)%, and anoverall Σ+ fraction of (2.7 ± 0.7)%. These fractions are then divided by thebaryon fraction (κ1 + κ2), known from the first step procedure to yield thehyperon contaminant fraction ǫ of the baryon component.Case (3) requires knowledge of the number of K− particles in the meson
sample. As the SELEX spectrometer does not provide a tool to discriminate600GeV/c π− against K− particles, we estimate the overall fraction of K−
particles in the sample using particle-flux parameterizations of [1]. This resultsin an overall K− fraction of (1.6 ± 1.0)%, which divided by the meson fraction(κ3 + κ4) yields the K− contaminant fraction of the meson component.Calculating the contaminant correction using equation (17) requires know-
ledge of the total cross sections σtot(Ξ−A), σtot(Σ
+A) and σtot(K−A). As data
on these cross sections are either scarce or do not exist, we estimate themusing approximations like:
σtot(Ξ−A) ≈ σtot(Ξ
−p)σtot(pA)
σtot(pp), (18)
and neglect weak but existing energy dependencies. Necessary data for hadron-nucleon cross sections are taken from [4,8] and data for pA-cross sections aretaken from [9].Averaged sizes of the contaminant correction including both correction steps
are shown in table 2.
6 Results for hadron-nucleus cross sections
Total cross sections as well as their statistical and systematic errors weredetermined for each dataset separately. In order to calculate average total crosssections and average systematic errors, we use weighted means. We presentthe error contributions, the data averaging method and the final results.
6.1 Measurement errors
6.1.1 The statistical error
The dominant error contribution is the statistical error, which is governedby the statistical uncertainty of the partial cross section σpart(< |tmin|), used inthe extrapolation. Further statistical error contributions, originating in other
20
terms of the error propagated formula (10), are negligible. The statistical errorsfor each measurement are presented in table 3.
6.1.2 Systematic errors
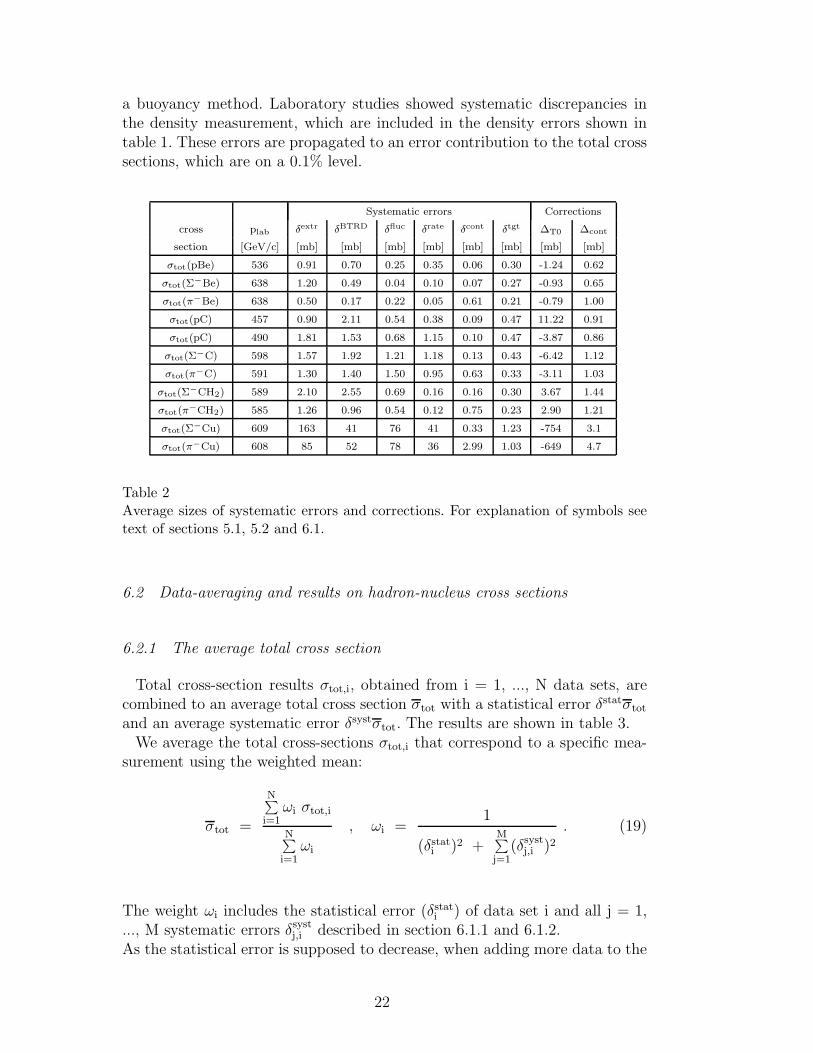
In this section we briefly describe the systematic errors found during thedata analysis. Table 2 gives an overview of the average sizes of these errors aswell as the rate correction and the contaminant correction.
Systematic error of the extrapolation δextr
A significant error contribution is the systematic error in the extrapolationof partial cross sections. This error takes into account the RMS-spread (rootmean square) in the extrapolated total cross sections with respect to the ex-trapolated total cross section at tmin = −0.007GeV2/c2, when tmin is variedfrom −0.004GeV2/c2 to −0.01GeV2/c2.
Cut on the BTRD signal spectrum δBTRD
Although contaminant and rate corrections are applied for each specific cuton the BTRD signal spectrum, we still observe a variation of the cross sectionwhen varying the cut on the TRD plane count by ± 1 unit around its nomi-nal value. Therefore, we calculate a systematic error, which is the maximumspread in the cross sections found in the cut variation.
Spill to spill fluctuations δfluc
Here, we compare the statistical error in σpart(< 0.01GeV2/c2), which wecalculate by (5) with the error in σpart(< 0.01GeV2/c2) calculated from theexperimentally observed RMS-spread of rate corrected transmission ratios perspill. The difference in these errors accounts for remaining non statistical spillto spill fluctuations.
Systematic error of the rate correction δrate
This error takes into account the error arising from different functional at-tempts to describe the rate effect presented in section 5.1. Its value is givenby the maximum spread of the ∆T0,k with respect to their average value ∆T0.
Systematic error of the contaminant correction δcont
This systematic error accounts for the uncertainty in the fit parameters ofthe four-fold binomial distribution (1) and for the uncertainty in the contam-inant fractions for Σ+, Ξ− and K−.
Uncertainty of the target density δtgt
The target densities were measured several times, using a pycnometer and
21
a buoyancy method. Laboratory studies showed systematic discrepancies inthe density measurement, which are included in the density errors shown intable 1. These errors are propagated to an error contribution to the total crosssections, which are on a 0.1% level.
Systematic errors Corrections
cross plab δextr δBTRD δfluc δrate δcont δtgt ∆T0 ∆cont
section [GeV/c] [mb] [mb] [mb] [mb] [mb] [mb] [mb] [mb]
σtot(pBe) 536 0.91 0.70 0.25 0.35 0.06 0.30 -1.24 0.62
σtot(Σ−Be) 638 1.20 0.49 0.04 0.10 0.07 0.27 -0.93 0.65
σtot(π−Be) 638 0.50 0.17 0.22 0.05 0.61 0.21 -0.79 1.00
σtot(pC) 457 0.90 2.11 0.54 0.38 0.09 0.47 11.22 0.91
σtot(pC) 490 1.81 1.53 0.68 1.15 0.10 0.47 -3.87 0.86
σtot(Σ−C) 598 1.57 1.92 1.21 1.18 0.13 0.43 -6.42 1.12
σtot(π−C) 591 1.30 1.40 1.50 0.95 0.63 0.33 -3.11 1.03
σtot(Σ−CH2) 589 2.10 2.55 0.69 0.16 0.16 0.30 3.67 1.44
σtot(π−CH2) 585 1.26 0.96 0.54 0.12 0.75 0.23 2.90 1.21
σtot(Σ−Cu) 609 163 41 76 41 0.33 1.23 -754 3.1
σtot(π−Cu) 608 85 52 78 36 2.99 1.03 -649 4.7
Table 2Average sizes of systematic errors and corrections. For explanation of symbols seetext of sections 5.1, 5.2 and 6.1.
6.2 Data-averaging and results on hadron-nucleus cross sections
6.2.1 The average total cross section
Total cross-section results σtot,i, obtained from i = 1, ..., N data sets, arecombined to an average total cross section σtot with a statistical error δstatσtot
and an average systematic error δsystσtot. The results are shown in table 3.We average the total cross-sections σtot,i that correspond to a specific mea-
surement using the weighted mean:
σtot =
N∑
i=1ωi σtot,i
N∑
i=1ωi
, ωi =1
(δstati )2 +M∑
j=1(δsystj,i )2
. (19)
The weight ωi includes the statistical error (δstati ) of data set i and all j = 1,..., M systematic errors δsystj,i described in section 6.1.1 and 6.1.2.As the statistical error is supposed to decrease, when adding more data to the
22

evaluation, we calculate the statistical error in the averaged total cross sectionby:
δstatσtot =
√√√√1/
N∑
i=1
1
(δstati )2. (20)
In assigning a systematic error to an average total cross section σtot we assumethat the systematic errors of the single measurements can be just averaged.Therefore, we quote as average systematic error:
δsystσtot =
√√√√√√√√√
N∑
i=1ωi
[M∑
j=1(δsystj,i )2
]
N∑
i=1ωi
, (21)
which accounts for the weights ωi used in (19).Further, we quote a total error δtotσtot of the average total cross section,
which is calculated from:
δtotσtot =√
(δstatσtot)2 + (δsystσtot)
2 . (22)
cross plab σtot δstatσtot δsystσtot δtotσtot
section [GeV/c] [mb] [mb] [mb] [mb]
σtot(pBe) 536 268.6 ± 0.7 ± 1.3 ± 1.5
σtot(Σ−Be) 638 249.1 ± 0.9 ± 1.3 ± 1.6
σtot(π−Be) 638 188.7 ± 0.8 ± 0.9 ± 1.2
σtot(pC) 457 333.6 ± 3.1 ± 2.4 ± 3.9
σtot(pC) 490 335.4 ± 3.6 ± 2.9 ± 4.6
σtot(Σ−C) 598 308.9 ± 2.1 ± 3.8 ± 4.3
σtot(π−C) 591 234.1 ± 1.5 ± 3.1 ± 3.5
σtot(Σ−CH2) 589 376.4 ± 2.0 ± 4.1 ± 4.5
σtot(π−CH2) 585 286.1 ± 1.3 ± 2.0 ± 2.4
σtot(Σ−Cu) 609 1232 ± 133 ± 192 ± 233
σtot(π−Cu) 608 1032 ± 77 ± 162 ± 179
Table 3Results for nuclear total cross sections. For explanation of symbols see text of sec-tion 6.2.
23
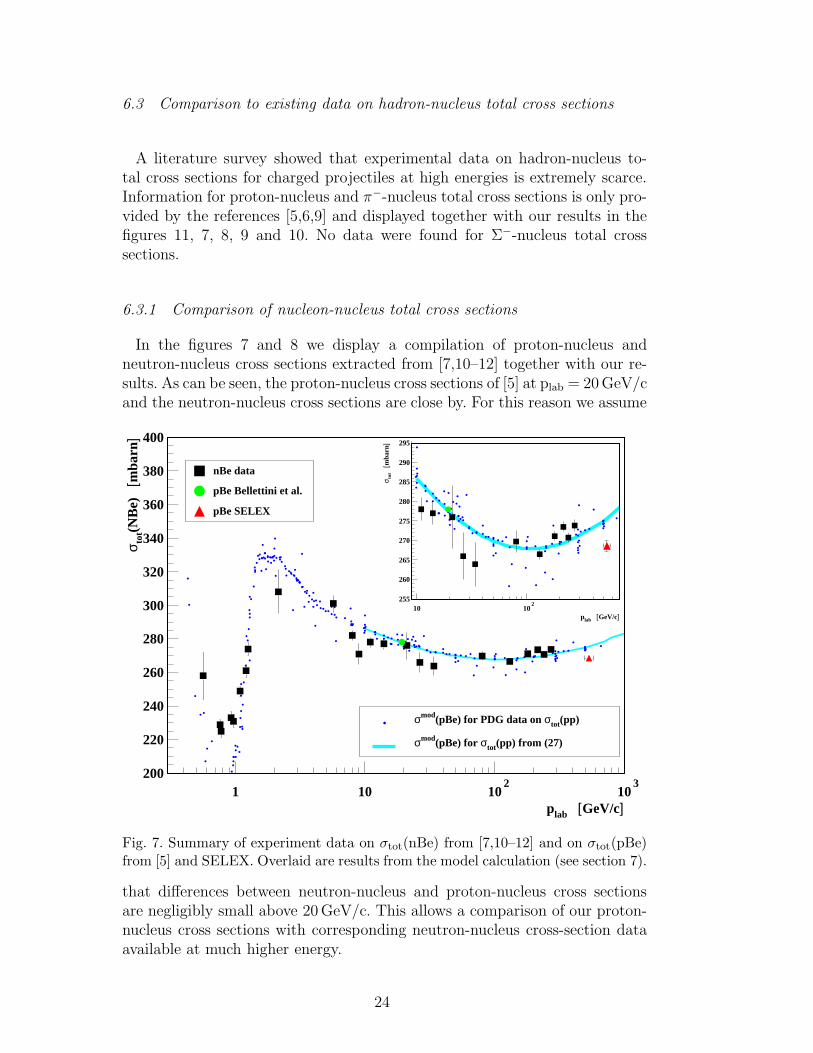
6.3 Comparison to existing data on hadron-nucleus total cross sections
A literature survey showed that experimental data on hadron-nucleus to-tal cross sections for charged projectiles at high energies is extremely scarce.Information for proton-nucleus and π−-nucleus total cross sections is only pro-vided by the references [5,6,9] and displayed together with our results in thefigures 11, 7, 8, 9 and 10. No data were found for Σ−-nucleus total crosssections.
6.3.1 Comparison of nucleon-nucleus total cross sections
In the figures 7 and 8 we display a compilation of proton-nucleus andneutron-nucleus cross sections extracted from [7,10–12] together with our re-sults. As can be seen, the proton-nucleus cross sections of [5] at plab = 20GeV/cand the neutron-nucleus cross sections are close by. For this reason we assume
200
220
240
260
280
300
320
340
360
380
400
1 10 102
103
nBe data
pBe Bellettini et al.
pBe SELEX
σmod(pBe) for σtot(pp) from (27)
σmod(pBe) for PDG data on σtot(pp)
plab [GeV/c]
σ tot(N
Be)
[m
barn
]
255
260
265
270
275
280
285
290
295
10 102
plab [GeV/c]
σ tot
[mba
rn]
Fig. 7. Summary of experiment data on σtot(nBe) from [7,10–12] and on σtot(pBe)from [5] and SELEX. Overlaid are results from the model calculation (see section 7).
that differences between neutron-nucleus and proton-nucleus cross sectionsare negligibly small above 20GeV/c. This allows a comparison of our proton-nucleus cross sections with corresponding neutron-nucleus cross-section dataavailable at much higher energy.
24
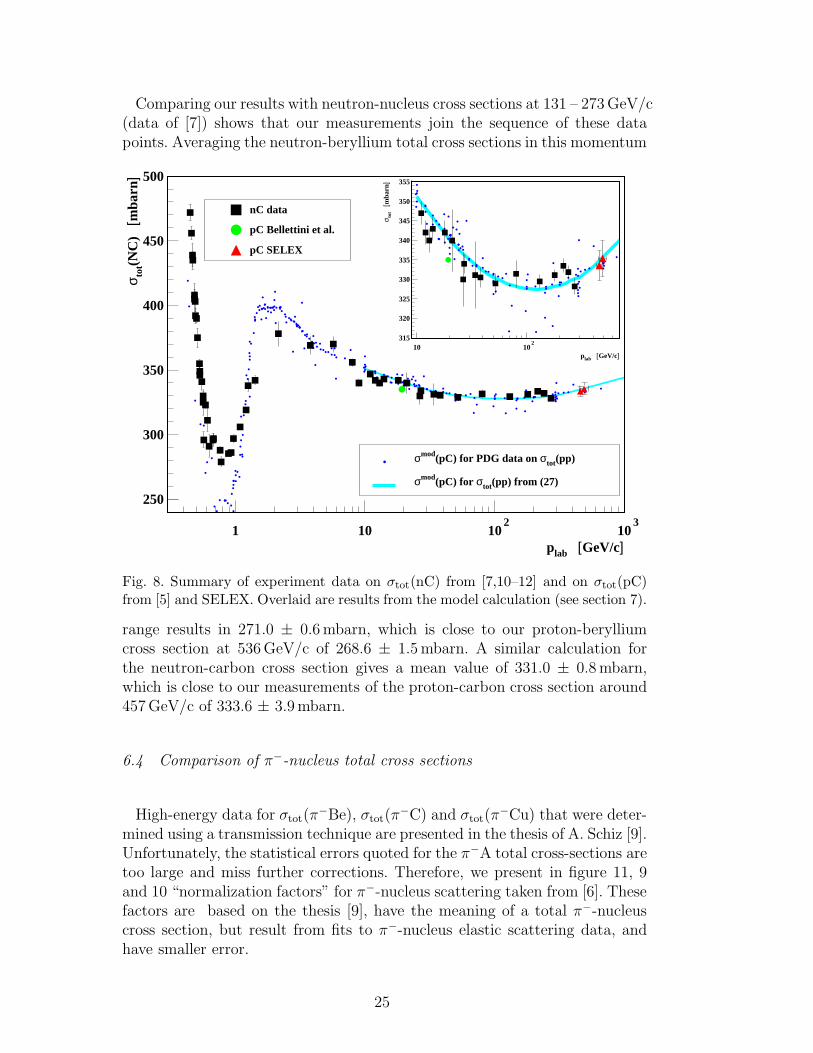
Comparing our results with neutron-nucleus cross sections at 131 – 273GeV/c(data of [7]) shows that our measurements join the sequence of these datapoints. Averaging the neutron-beryllium total cross sections in this momentum
250
300
350
400
450
500
1 10 102
103
nC data
pC Bellettini et al.
pC SELEX
σmod(pC) for σtot(pp) from (27)
σmod(pC) for PDG data on σtot(pp)
plab [GeV/c]
σ tot(N
C)
[m
barn
]
315
320
325
330
335
340
345
350
355
10 102
plab [GeV/c]
σ tot
[mba
rn]
Fig. 8. Summary of experiment data on σtot(nC) from [7,10–12] and on σtot(pC)from [5] and SELEX. Overlaid are results from the model calculation (see section 7).
range results in 271.0 ± 0.6mbarn, which is close to our proton-berylliumcross section at 536GeV/c of 268.6 ± 1.5mbarn. A similar calculation forthe neutron-carbon cross section gives a mean value of 331.0 ± 0.8mbarn,which is close to our measurements of the proton-carbon cross section around457GeV/c of 333.6 ± 3.9mbarn.
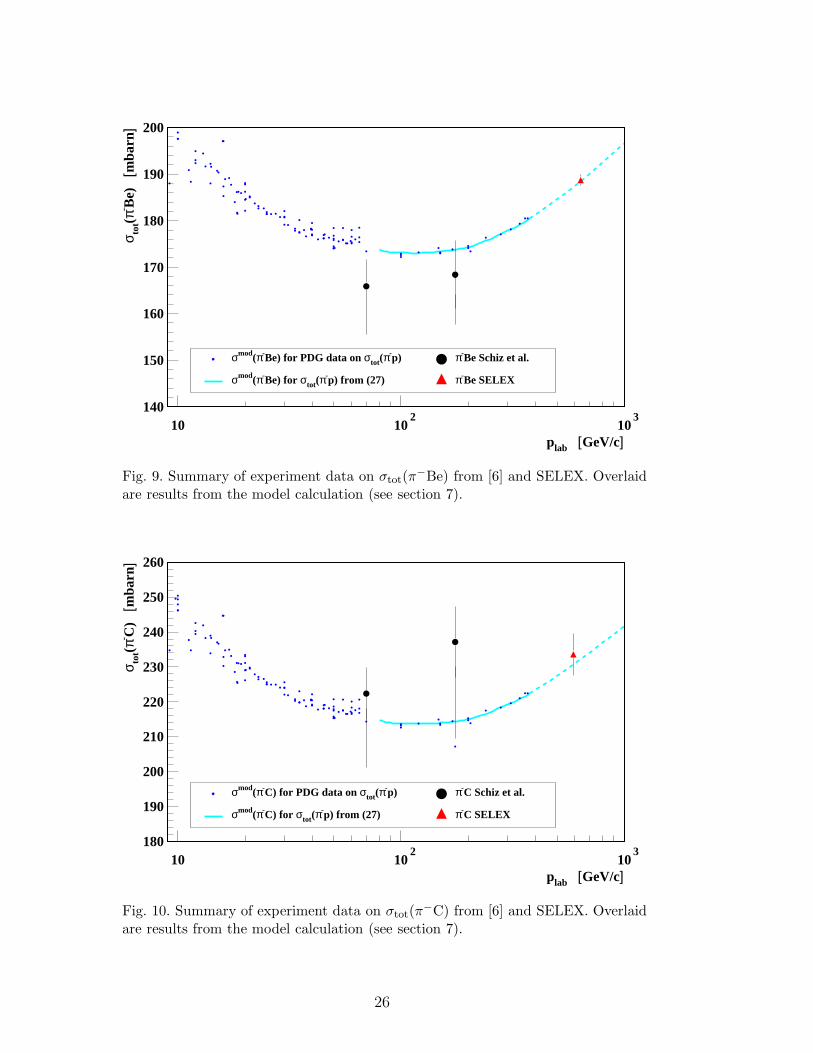
6.4 Comparison of π−-nucleus total cross sections
High-energy data for σtot(π−Be), σtot(π
−C) and σtot(π−Cu) that were deter-
mined using a transmission technique are presented in the thesis of A. Schiz [9].Unfortunately, the statistical errors quoted for the π−A total cross-sections aretoo large and miss further corrections. Therefore, we present in figure 11, 9and 10 “normalization factors” for π−-nucleus scattering taken from [6]. Thesefactors are based on the thesis [9], have the meaning of a total π−-nucleuscross section, but result from fits to π−-nucleus elastic scattering data, andhave smaller error.
25
140
150
160
170
180
190
200
10 102
103
σmod(π-Be) for σtot(π-p) from (27)
σmod(π-Be) for PDG data on σtot(π-p) π-Be Schiz et al.
π-Be SELEX
plab [GeV/c]
σ tot(π
- Be)
[m
barn
]
Fig. 9. Summary of experiment data on σtot(π−Be) from [6] and SELEX. Overlaid
are results from the model calculation (see section 7).
180
190
200
210
220
230
240
250
260
10 102
103
σmod(π-C) for σtot(π-p) from (27)
σmod(π-C) for PDG data on σtot(π-p) π-C Schiz et al.
π-C SELEX
plab [GeV/c]
σ tot(π
- C)
[m
barn
]
Fig. 10. Summary of experiment data on σtot(π−C) from [6] and SELEX. Overlaid
are results from the model calculation (see section 7).
26
800
900
1000
1100
1200
1300
10 102
103
π-Cu SELEX
π-Cu Schiz et al.
plab [GeV/c]
σ tot(π
- Cu)
[m
barn
]
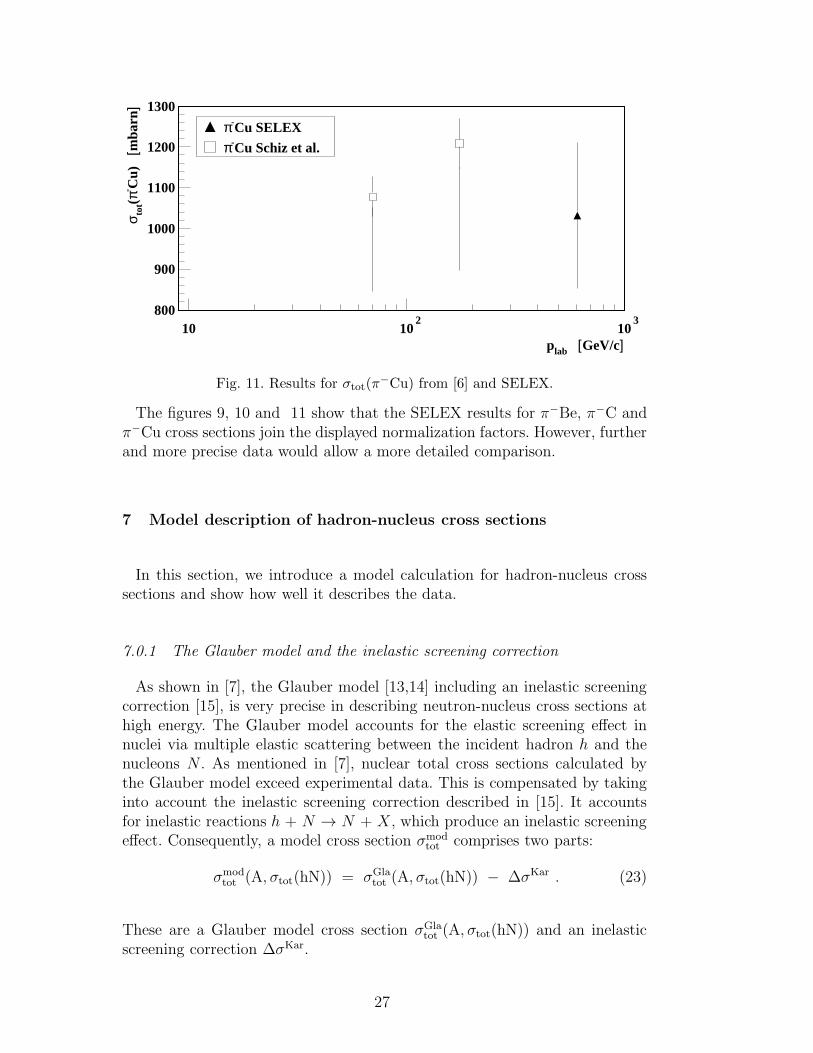
Fig. 11. Results for σtot(π−Cu) from [6] and SELEX.
The figures 9, 10 and 11 show that the SELEX results for π−Be, π−C andπ−Cu cross sections join the displayed normalization factors. However, furtherand more precise data would allow a more detailed comparison.
7 Model description of hadron-nucleus cross sections
In this section, we introduce a model calculation for hadron-nucleus crosssections and show how well it describes the data.
7.0.1 The Glauber model and the inelastic screening correction
As shown in [7], the Glauber model [13,14] including an inelastic screeningcorrection [15], is very precise in describing neutron-nucleus cross sections athigh energy. The Glauber model accounts for the elastic screening effect innuclei via multiple elastic scattering between the incident hadron h and thenucleons N . As mentioned in [7], nuclear total cross sections calculated bythe Glauber model exceed experimental data. This is compensated by takinginto account the inelastic screening correction described in [15]. It accountsfor inelastic reactions h + N → N + X , which produce an inelastic screeningeffect. Consequently, a model cross section σmod
tot comprises two parts:
σmodtot (A, σtot(hN)) = σGla
tot (A, σtot(hN)) − ∆σKar . (23)
These are a Glauber model cross section σGlatot (A, σtot(hN)) and an inelastic
screening correction ∆σKar.
27
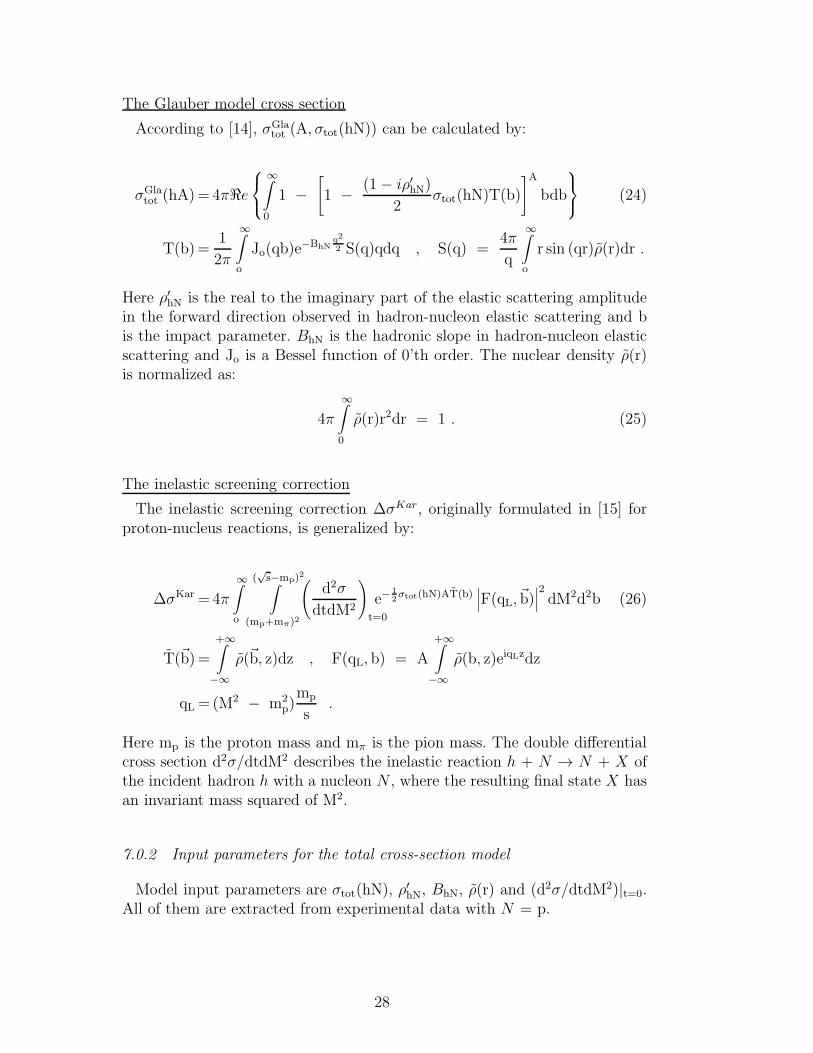
The Glauber model cross section
According to [14], σGlatot (A, σtot(hN)) can be calculated by:
σGlatot (hA)= 4πℜe
∞∫
0
1 −[
1 − (1− iρ′hN)
2σtot(hN)T(b)
]A
bdb
(24)
T(b)=1
2π
∞∫
o
Jo(qb)e−BhN
q2
2 S(q)qdq , S(q) =4π
q
∞∫
o
r sin (qr)ρ(r)dr .
Here ρ′hN is the real to the imaginary part of the elastic scattering amplitudein the forward direction observed in hadron-nucleon elastic scattering and bis the impact parameter. BhN is the hadronic slope in hadron-nucleon elasticscattering and Jo is a Bessel function of 0’th order. The nuclear density ρ(r)is normalized as:
4π
∞∫
0
ρ(r)r2dr = 1 . (25)
The inelastic screening correction
The inelastic screening correction ∆σKar, originally formulated in [15] forproton-nucleus reactions, is generalized by:
∆σKar =4π
∞∫
o
(√s−mp)2∫
(mp+mπ)2
(
d2σ
dtdM2
)
t=0
e−12σtot(hN)AT(b)
∣∣∣F(qL, ~b)
∣∣∣
2dM2d2b (26)
T(~b)=
+∞∫
−∞
ρ(~b, z)dz , F(qL, b) = A
+∞∫
−∞
ρ(b, z)eiqLzdz
qL =(M2 − m2p)mp
s.
Here mp is the proton mass and mπ is the pion mass. The double differentialcross section d2σ/dtdM2 describes the inelastic reaction h + N → N + X ofthe incident hadron h with a nucleon N , where the resulting final state X hasan invariant mass squared of M2.
7.0.2 Input parameters for the total cross-section model
Model input parameters are σtot(hN), ρ′hN, BhN, ρ(r) and (d2σ/dtdM2)|t=0.
All of them are extracted from experimental data with N = p.
28
Input parameter σtot(hN)
To be able to access σtot(hN) for special ranges of center of mass energies√s, data on pp and π−p total cross sections, taken from [8], were fit to a
smooth function:
σtot(hp, s) =aosa1
+ a2 log2(s) . (27)
The fit-parameters ai, their errors and the validity range of each parameteri-zation, are shown in table 4. The result of each parameterization is in mbarn,when using s in GeV2.
reaction ao a1 a2 momentum range
pp 49.51 ± 0.26 0.097 ± 0.002 0.314 ± 0.004 10 ... 3000 GeV/c
π−p 55.2 ± 7.2 0.255 ± 0.032 0.346 ± 0.020 80 ... 380 GeV/c
Table 4Fit-Parameters and validity range of the total cross-section parameterizations.
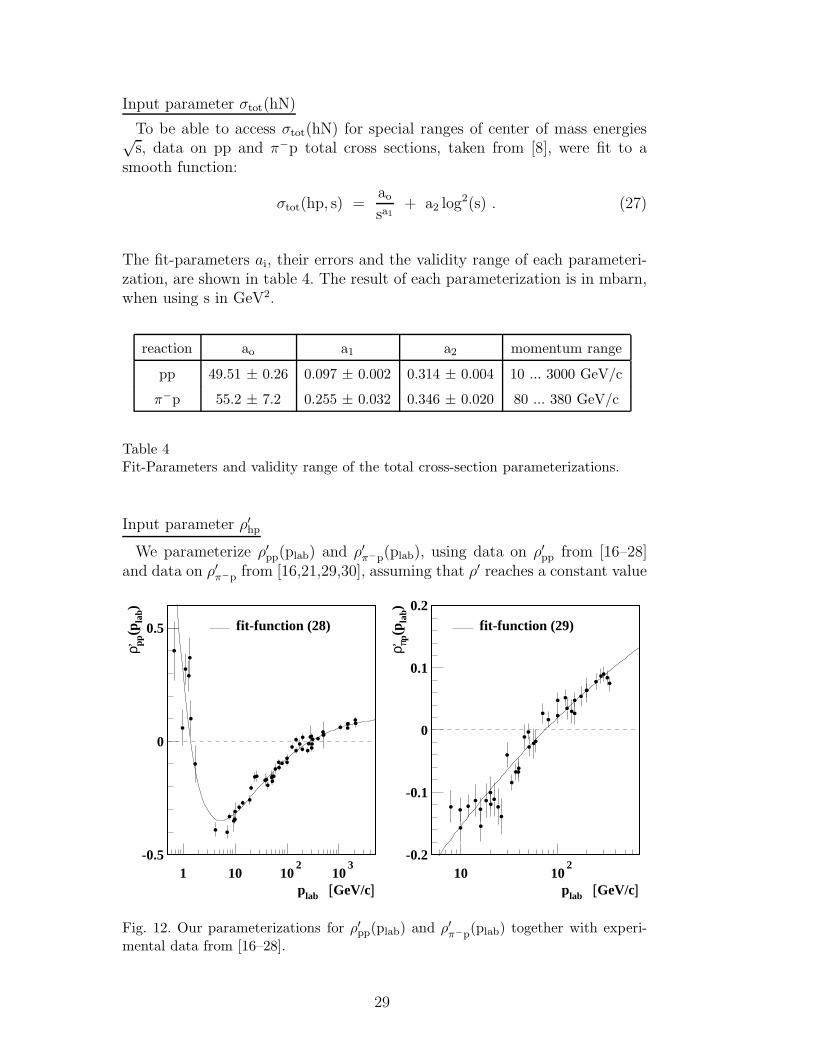
Input parameter ρ′hp
We parameterize ρ′pp(plab) and ρ′π−p(plab), using data on ρ′pp from [16–28]and data on ρ′π−p from [16,21,29,30], assuming that ρ′ reaches a constant value
-0.5
0
0.5
1 10 102
103
fit-function (28)
plab [GeV/c]
ρ, pp(p
lab)
-0.2
-0.1
0
0.1
0.2
10 102
fit-function (29)
plab [GeV/c]
ρ, πp(p
lab)
Fig. 12. Our parameterizations for ρ′pp(plab) and ρ′π−p(plab) together with experi-mental data from [16–28].
29

when plab goes to infinity. Our fits are
ρ′pp(plab) = +6.8
p0.742lab
− 6.6
p0.599lab
+ 0.124 (28)
for 0.8 GeV/c < plab < 2100 GeV/c
ρ′π−p(plab) = −0.92
p0.54lab
+ 0.54 (29)
for 8.0 GeV/c < plab < 345 GeV/c ,
where plab is in GeV/c. Figure 12 displays these fit-functions together with alldata points included in the fit.
Input parameter Bhp
For the hadronic slope parameters Bpp and Bπ−p we take the parameteriza-tions presented in [31]:
Bpp(plab)=
Bpp,1 = 11.13 − 6.21√plab
+ 0.30 logplab ; q2 = 0.02
Bpp,2 = 9.26 − 4.94√plab
+ 0.28 logplab ; q2 = 0.20
Bpp,3 = 9.67 − 7.51√plab
+ 0.10 logplab ; q2 = 0.40
(30)
Bπp(plab)=
Bπp,1 = 9.11 + 0.65√plab
+ 0.29 logplab ; q2 = 0.02
Bπp,2 = 6.95 + 0.65√plab
+ 0.27 logplab ; q2 = 0.20
Bπp,3 = 6.13 + 0.65√plab
+ 0.25 logplab ; q2 = 0.40 .
(31)
Here, q2 is in units of GeV2/c2. These parameterizations are linearly interpo-lated to account for the dependency of BhN on both plab and q2.
Input parameter (d2σ/dtdM2)|t=0
To calculate the inelastic screening correction ∆σKar, we use the parameter-ization of (d2σ/dtdM2)|t=0 for the process p + p → p + X , given in [7]:
(
d2σ
dtdM2
)
t=0
=
26.470(M2 − 1.17) − 35.969(M2 − 1.17)2 +
18.470(M2 − 1.17)3 − 4.143(M2 − 1.17)4 +
0.341(M2 − 1.17)5 for 1.17 < M2 < 5 GeV2/c2
4.4M2 for M2 > 5 GeV2/c2 .
(32)
In addition, we also use more recent parameterizations for (d2σ/dtdM2)|t=0
to describe the processes p + p → p + X and π + p → p + X , which are pre-
30
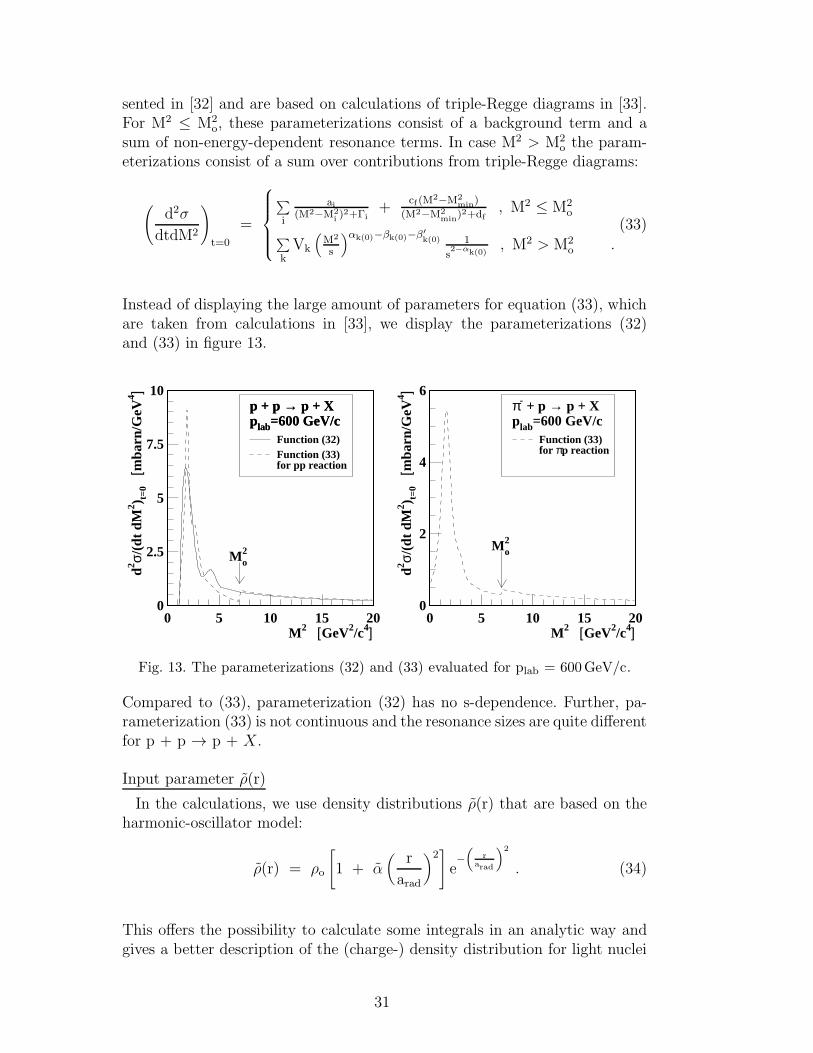
sented in [32] and are based on calculations of triple-Regge diagrams in [33].For M2 ≤ M2
o, these parameterizations consist of a background term and asum of non-energy-dependent resonance terms. In case M2 > M2
o the param-eterizations consist of a sum over contributions from triple-Regge diagrams:
(
d2σ
dtdM2
)
t=0
=
∑
i
ai(M2−M2
i )2+Γi
+cf (M
2−M2min)
(M2−M2min)
2+df, M2 ≤ M2
o
∑
kVk
(M2
s
)αk(0)−βk(0)−β′
k(0) 1
s2−αk(0)
, M2 > M2o .
(33)
Instead of displaying the large amount of parameters for equation (33), whichare taken from calculations in [33], we display the parameterizations (32)and (33) in figure 13.
0
2.5
5
7.5
10
0 5 10 15 20
Mo2
p + p → p + Xplab=600 GeV/c
Function (32)Function (33)for pp reaction
p + p → p + Xplab=600 GeV/c
M2 [GeV2/c4]
d2 σ/(d
t dM
2 ) t=0
[m
barn
/GeV
4 ]
0
2
4
6
0 5 10 15 20
Mo2
π- + p → p + Xplab=600 GeV/c
Function (33)for πp reaction
M2 [GeV2/c4]
d2 σ/(d
t dM
2 ) t=0
[m
barn
/GeV
4 ]
Fig. 13. The parameterizations (32) and (33) evaluated for plab = 600GeV/c.
Compared to (33), parameterization (32) has no s-dependence. Further, pa-rameterization (33) is not continuous and the resonance sizes are quite differentfor p + p → p + X .
Input parameter ρ(r)
In the calculations, we use density distributions ρ(r) that are based on theharmonic-oscillator model:
ρ(r) = ρo
[
1 + α(
r
arad
)2]
e−(
rarad
)2
. (34)
This offers the possibility to calculate some integrals in an analytic way andgives a better description of the (charge-) density distribution for light nuclei
31
than a standard two-parameter Fermi parameterization.
data from [34] fit result using (32) fit result using (33)nucleus e-A scattering in σmod
tot (NA, arad) in σmodtot (NA, arad)
α arad [fm] arad [fm] arad [fm]
beryllium 0.611 1.791 1.89981 2.02914carbon 1.067 1.687 1.79247 1.89277
Table 5Parameters of the density distribution ρ(r) from electron-nucleus elastic scatter-ing [34] and the radius parameters resulting from a fit of σmod
tot (arad,plab) to nAcross-section data in the momentum range 10 – 273GeV/c.
As reported in [7], we also find that the model does not provide a gooddescription of neutron-nucleus total cross sections if one uses both α andarad from electron-scattering data [34]. Therefore, we used α values from [34]and adjusted the radius parameter arad, such that the model cross sectionσmodtot (NA, arad) gives a best description of nA-cross section data in the mo-
mentum range 10 – 273GeV/c. Adjusting of arad was done for each nucleusand for each of the parameterizations (32) and (33) separately. Table 5 givesa summary of the density parameters.
7.0.3 Results of the model calculations
Results for nucleon-nucleus model cross sections
To show the quality of our model calculation after adjusting the nuclear den-sity parameter arad, we evaluated the total cross sections σmod
tot (Be, σtot(pp))and σmod
tot (C, σtot(pp)) using function (32). This was done for data on σtot(pp)taken from [8] and for values on σtot(pp) resulting from our fit (27). The cal-culations were done at many different values of plab to show the behavior overthe entire high momentum region. Scatter in the model calculations (observedwhen experimental data on σtot(pp) are used) demonstrate the sensitivity ofthe model to small changes in σtot(pp).Summaries of calculation and data are shown in figure 7 and 8. They show
that the calculations reflect quite well the cross-section data for plab > 5GeV/c.The nBe data of [7] in the range 131 – 273GeV/c suggest a rise of the nBecross section with energy that is also indicated by the model calculation. Ourdata point does not show any rise for pBe. In the case of nC cross sections ourmeasurements join both data at lower energy and calculation very nicely.
Results for π−-nucleus model cross sections
We evaluated the cross sections σmodtot (Be, σtot(π
−p)) and σmodtot (C, σtot(π
−p))using function (33) and the corresponding nuclear density parameter arad,
32
which was determined by a fit of the model cross section to neutron-nucleusdata. All further input parameters are specific for π−p-reactions. The calcu-lations were done for data on σtot(π
−p) taken from [8] and for values fromfunction (27).Results are shown in figure 9 and 10 together with data for π−-nucleus total
cross sections from [6] and the SELEX experiment. The figures show that thecalculations match our measurements quite well and agree within errors withlower-energy data from [6].
8 Results for hadron-nucleon cross sections
The hadron-nucleon cross sections σtot(Σ−N) and σtot(π
−N) were first deter-mined by a CH2 – C method. As this method provides hadron-nucleon crosssections only with a precision on the order of 10%, we improved the precisionusing a method which takes advantage of the more precise hadron-nucleuscross-section ratios.
8.1 Hadron-nucleon cross sections using a CH2 – C difference method
The hadron-nucleon cross sections σtot(Σ−N) and σtot(π
−N) can be deducedfrom corresponding cross sections measured on carbon and polyethylene by:
σtot(hN) =1
2[σtot(hCH2) − σtot(hC)] , (35)
where h denotes the incident hadron. Results obtained by this method arepresented in table 9. The quoted errors are calculated from the total errors inthe hadron-nucleus cross sections given in table 3.
8.2 Hadron-nucleon cross sections deduced from hadron-nucleus cross sec-
tions
In a second approach, we deduce hadron-nucleon cross sections from ratiosof measured hadron-nucleus cross sections. To motivate the method, we firstderive empirical relations between hadron-nucleon and hadron-nucleus crosssection ratios, which we then refine using the model calculation described insection 7.To derive empirical relations between hadron-nucleon and hadron-nucleus
33
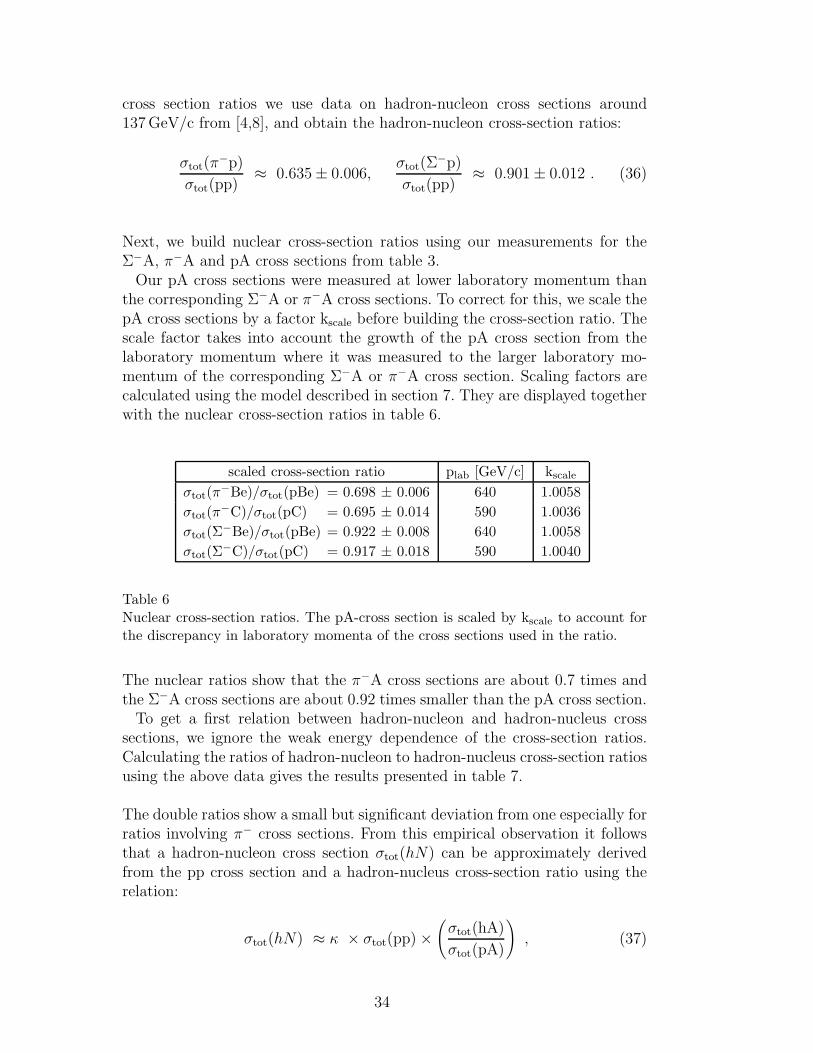
cross section ratios we use data on hadron-nucleon cross sections around137GeV/c from [4,8], and obtain the hadron-nucleon cross-section ratios:
σtot(π−p)
σtot(pp)≈ 0.635± 0.006,
σtot(Σ−p)
σtot(pp)≈ 0.901± 0.012 . (36)
Next, we build nuclear cross-section ratios using our measurements for theΣ−A, π−A and pA cross sections from table 3.Our pA cross sections were measured at lower laboratory momentum than
the corresponding Σ−A or π−A cross sections. To correct for this, we scale thepA cross sections by a factor kscale before building the cross-section ratio. Thescale factor takes into account the growth of the pA cross section from thelaboratory momentum where it was measured to the larger laboratory mo-mentum of the corresponding Σ−A or π−A cross section. Scaling factors arecalculated using the model described in section 7. They are displayed togetherwith the nuclear cross-section ratios in table 6.
scaled cross-section ratio plab [GeV/c] kscaleσtot(π
−Be)/σtot(pBe) = 0.698 ± 0.006 640 1.0058
σtot(π−C)/σtot(pC) = 0.695 ± 0.014 590 1.0036
σtot(Σ−Be)/σtot(pBe) = 0.922 ± 0.008 640 1.0058
σtot(Σ−C)/σtot(pC) = 0.917 ± 0.018 590 1.0040
Table 6Nuclear cross-section ratios. The pA-cross section is scaled by kscale to account forthe discrepancy in laboratory momenta of the cross sections used in the ratio.
The nuclear ratios show that the π−A cross sections are about 0.7 times andthe Σ−A cross sections are about 0.92 times smaller than the pA cross section.To get a first relation between hadron-nucleon and hadron-nucleus cross
sections, we ignore the weak energy dependence of the cross-section ratios.Calculating the ratios of hadron-nucleon to hadron-nucleus cross-section ratiosusing the above data gives the results presented in table 7.
The double ratios show a small but significant deviation from one especially forratios involving π− cross sections. From this empirical observation it followsthat a hadron-nucleon cross section σtot(hN) can be approximately derivedfrom the pp cross section and a hadron-nucleus cross-section ratio using therelation:
σtot(hN) ≈ κ × σtot(pp)×(
σtot(hA)
σtot(pA)
)
, (37)
34

double ratio result double ratio result
σtot(Σ−p)/σtot(pp)σtot(Σ−Be)/σtot(pBe) 0.977 ± 0.016 σtot(π−p)/σtot(pp)
σtot(π−Be)/σtot(pBe) 0.910 ± 0.012
σtot(Σ−p)/σtot(pp)σtot(Σ−C)/σtot(pC) 0.983 ± 0.023 σtot(π−p)/σtot(pp)
σtot(π−C)/σtot(pC) 0.915 ± 0.020
average (κ) 0.980 ± 0.014 average (κ) 0.913 ± 0.012
Table 7Ratios of the hadronic cross-section ratios at 137 GeV/c and the nuclear cross-section ratios around 600 GeV/c.
where κ is a parameter specific for the cross section ratio (compare with ta-ble 7). If we set κ = 1 for simplicity, we see that the precision of (37) is about10%. The precision is improved by adequate adjusting of κ.Unfortunately we cannot empirically derive κ from experimental cross sec-
tions for laboratory momenta around 600 GeV/c as necessary cross-sectiondata is missing. Thus, as we want to deduce hadron-nucleon cross sectionsfrom nuclear cross-section ratios with best precision, we improve the rela-tion between hadron-nucleon and hadron-nucleus cross sections using the totalcross-section model that was introduced in section 7.The idea of the model-based ratio method is the following: Rewriting (37)
yields the following relation between the experimental hadron-nucleus and themodel based hadron-nucleus cross-section ratios.
σtot(hA)
σtot(pA)︸ ︷︷ ︸
experimental
=σmodtot (A, σtot(hN))
σmodtot (A, σtot(pN))︸ ︷︷ ︸
theory + σtot-data
. (38)
Taking the ratio of model based quantities reduces the effect of uncertaintiesin the cross-section model. Further, as data for σtot(pp) is most precise andexists over a large energy range, it is convenient to use proton-nucleus crosssections in the denominator. As the energy dependence of the pp cross sectionis known at SELEX energies and the model is adjusted to describe NA crosssections for plab > 10 GeV/c, the energy dependence of σtot(hp), which wewant to determine, is taken into account through the energy dependence ofthe pp cross section.To deduce the cross section σtot(hN) from the measured nuclear cross-section
ratio, we fix σtot(pN) (= σtot(pp)) first and calculate the denominatorσmodtot (A, σtot(pp)) by taking σtot(pp) from parameterization (27) evaluated at
the laboratory momentum of the nuclear cross-section ratio as given in table 6.Iterating with respect to the model input parameter σtot(hN) until the modelbased total cross-section ratio in (38) equals the experimental one, yields thedesired hadron-nucleon cross section. At SELEX energy we interpret the resultσtot(hN) identical to σtot(hp).
35
8.2.1 Results for σtot(Σ−N) and σtot(π
−N) using the ratio method
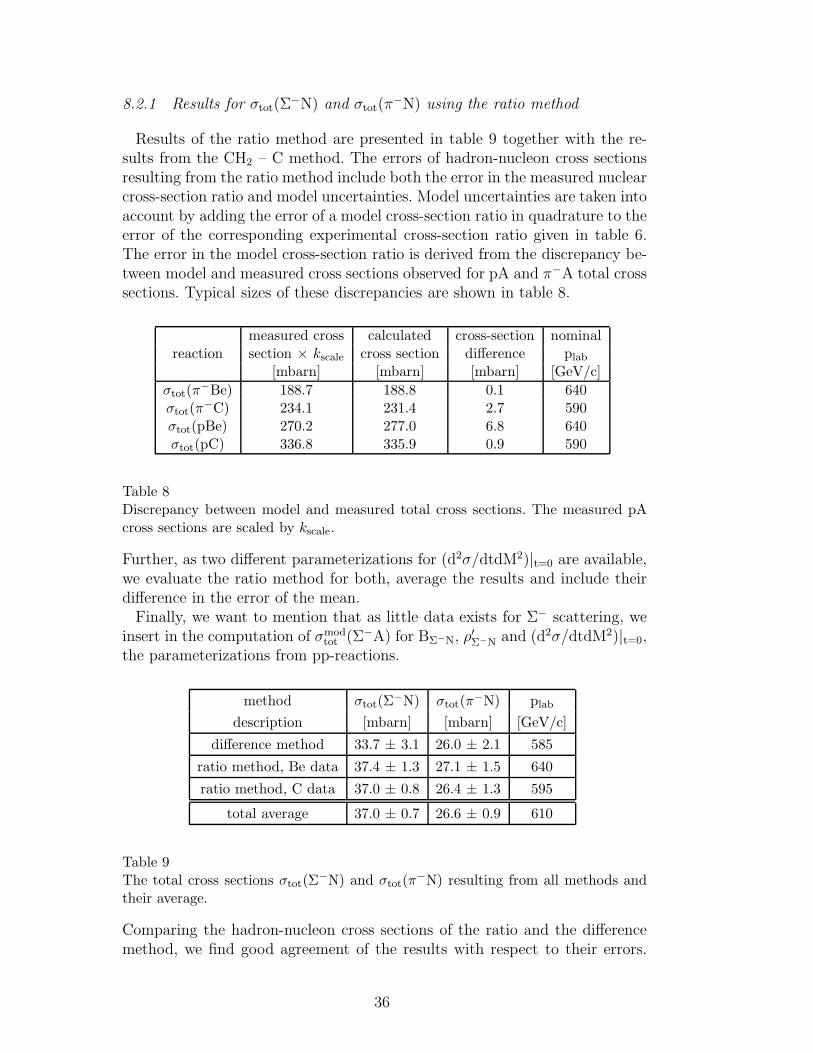
Results of the ratio method are presented in table 9 together with the re-sults from the CH2 – C method. The errors of hadron-nucleon cross sectionsresulting from the ratio method include both the error in the measured nuclearcross-section ratio and model uncertainties. Model uncertainties are taken intoaccount by adding the error of a model cross-section ratio in quadrature to theerror of the corresponding experimental cross-section ratio given in table 6.The error in the model cross-section ratio is derived from the discrepancy be-tween model and measured cross sections observed for pA and π−A total crosssections. Typical sizes of these discrepancies are shown in table 8.
measured cross calculated cross-section nominalreaction section × kscale cross section difference plab
[mbarn] [mbarn] [mbarn] [GeV/c]
σtot(π−Be) 188.7 188.8 0.1 640
σtot(π−C) 234.1 231.4 2.7 590
σtot(pBe) 270.2 277.0 6.8 640σtot(pC) 336.8 335.9 0.9 590
Table 8Discrepancy between model and measured total cross sections. The measured pAcross sections are scaled by kscale.
Further, as two different parameterizations for (d2σ/dtdM2)|t=0 are available,we evaluate the ratio method for both, average the results and include theirdifference in the error of the mean.Finally, we want to mention that as little data exists for Σ− scattering, we
insert in the computation of σmodtot (Σ−A) for BΣ−N, ρ
′Σ−N and (d2σ/dtdM2)|t=0,
the parameterizations from pp-reactions.
method σtot(Σ−N) σtot(π
−N) plab
description [mbarn] [mbarn] [GeV/c]
difference method 33.7 ± 3.1 26.0 ± 2.1 585
ratio method, Be data 37.4 ± 1.3 27.1 ± 1.5 640
ratio method, C data 37.0 ± 0.8 26.4 ± 1.3 595
total average 37.0 ± 0.7 26.6 ± 0.9 610
Table 9The total cross sections σtot(Σ
−N) and σtot(π−N) resulting from all methods and
their average.
Comparing the hadron-nucleon cross sections of the ratio and the differencemethod, we find good agreement of the results with respect to their errors.
36

As final result, we average the hadron-nucleon cross-section values from allmethods. These total averages are presented in the last row of table 9 togetherwith a corresponding averaged laboratory momentum.
8.3 Comparison to models
8.3.1 Comparisons for σtot(π−p)
Most of the models and parameterizations for hadron-nucleon cross sectionsexploit the interplay of 2 contributions. The Pomeron contribution, whichdominates asymptotics at high energies; and the Regge contribution, which isimportant at low and medium energies. Many models (e.g. [35,36]) describethe energy dependence of total cross sections quite well. Because of this, wesimply display in figure 14 experimental data from [8] and SELEX togetherwith the parameterization for σtot(π
−p, s):
σtot(π−p, s) = 35.9s−0.45 + 13.7s+0.079 (39)
for plab > 10GeV/c, σtot in mbarn, s in GeV2 ,
which was presented in the particle data book 1996 [37]. We want to mentionthat in the data files of the particle data group errors in the high precision
22
23
24
25
26
27
28
29
5 10 15 20 25 30 35 40
world data 1998
SELEX
fit of PDG 1996 (39)
√s [GeV]
σ tot(π
- p) [m
barn
]
Fig. 14. Existing data for σtot(π−p) in comparison with our results and parameter-
ization (39) of the particle data group 1996.
data of A.S. Caroll et al. [38] are not completely taken over from the reference.Thus, we added the missing error contributions (systematic error due to target
37

density and extrapolation uncertainty) in quadrature.We point out that so far the total cross section σtot(π
−p) has been measuredonly up to plab = 370GeV/c [38]. Thus, the SELEX total average for σtot(π
−N)at 610GeV/c is the first new measurement at higher laboratory momentum.In figure 14 parameterization (39) of the Particle Data Group, which uses a
Pomeron intercept of 0.079, is overlaid to the data. The qualitative inspectionof (39) suggests that it is strongly weighted by the huge amount of low energydata points and does not sufficiently well take into account the very accuratedata of [38] at high energy. Our result seems to strengthen the trend observedin data of [38]. This trend implies a faster rise of the π−p cross section withincreasing energy than represented by (39). We just want to point out thisobservation, which may turn out to be in conflict with the belief that theenergy increase of hadronic cross sections is universal. Further, we do not giveany quantitative estimate of the Pomeron intercept for the π−p cross section.Its value is correlated to the assumed Regge contribution at low energy andits determination requires a careful analysis of the data.
8.3.2 Comparisons for σtot(Σ−p)
Up to now, data on the total cross section σtot(Σ−p) are still scarce. In
the past, there have been only two hyperon-beam experiments [4,39] givinginformation about the behavior of σtot(Σ
−p) in the momentum range 19 –
32
33
34
35
36
37
38
39
5 6 7 8 9 10 20 30 40
Badier et al.
Biagi et al.
SELEX
Prediction H. Lipkin (40)
√s [GeV]
σ tot(Σ
- N)
[mba
rn]
Fig. 15. Existing data for σtot(Σ−p) in comparison with our results and predic-
tion (40).
136.9GeV/c. The SELEX total average for σtot(Σ−N) provides first new data
at higher energy. Figure 15 shows a compilation of data from previous experi-ments together with the SELEX result. Our measurement is 2.9mbarn largerthan the data point at 136.9GeV/c from [4]. It shows the rise of σtot(Σ
−p)with increasing beam energy.
38
Overlaid to the experiment data is the prediction for σtot(Σ−p, plab) from H.
Lipkin (see [36]), which is given by:
σtot(Σ−p, plab)= 19.5
(plab
20
)0.13
+ 13.2(plab
20
)−0.2
(40)
for plab > 10GeV/c, σtot in mbarn, plab in GeV/c .
The corresponding curve in figure 15 shows good agreement between our mea-surement and this prediction.It would be certainly desirable to find the Pomeron intercept for the Σ−p
cross section. But the lack of low energy data does not allow any reasonableestimate of the intercept.
9 Conclusions
The SELEX collaboration has measured the total cross sections σtot(π−Be),
σtot(π−C), σtot(π
−Cu), σtot(π−CH2), σtot(Σ
−Be), σtot(Σ−C), σtot(Σ
−Cu),σtot(pBe) and σtot(pC) in a broad momentum range around 600GeV/c us-ing a transmission method that was adapted to the specifics of the SELEXspectrometer. The accuracy of the results is within 0.6% - 1.5% for Be, C andCH2 and about 17.5% for Cu.The ratios of hadron-nucleus cross sections for Be and C show that π−-
nucleus cross sections are a about factor of 0.7 lower than correspondingproton-nucleus cross sections. Furthermore, we find that the Σ−-nucleus crosssections are about a factor of 0.92 smaller than corresponding proton-nucleuscross sections.We observe that the results for σtot(pBe), σtot(pC), σtot(π
−Be), σtot(π−C)
and σtot(π−Cu) join smoothly corresponding cross-section data at lower en-
ergy. The good agreement of the proton-nucleus and the π−-nucleus crosssections to Glauber model calculations which include an inelastic screeningcorrection and one adjustable parameter in the density distribution, justifythe deduction of σtot(Σ
−p) and σtot(π−p) from the nuclear cross sections.
We deduced the hadron-nucleon cross sections σtot(π−N) and σtot(Σ
−N),which we regard as σtot(π
−p) and σtot(Σ−p), from our nuclear data using a
CH2 – C difference and a model based ratio method. Results from the dif-ference method have an accuracy of 8.1–9.2%, while results from the ratiomethod have an accuracy of 2.2–5.5%.The total averages of all methods represent first new measurements for
σtot(π−p) and σtot(Σ
−p) at higher energy. Our result for σtot(Σ−p) shows
clearly a rise of this cross section with increasing beam energy, which agreeswith the prediction of [36].Our result for σtot(π
−p) joins nicely the high energy data of [38]. As men-
39
tioned in section 8.3.1, the data of [38] and our result may indicate a fasterincrease of the π−p cross section than predicted by the parameterization givenby the Particle Data Group in 1996.An indication of a faster increase of the π−p cross section compared to the
pp (and pp) one should be verified by a high statistic measurement using a π−
beam and a hydrogen target to avoid systematic errors inherent to the methodused in this experiment. In our opinion a measurement of the π−p cross sectionat 600GeV/c or higher is the only experimentally accessible case to test if thehigh energy behaviour of the hadronic cross section can be different from thepp and (and pp) one.
10 Acknowledgments
We are indebted to the Fermilab staff for the realization of this experiment.We wish to thank F. Pearsall and D. Northacker for technical support. Fur-ther, we are grateful to T. Olzanovski, V. Mallinger, U. Schwan, R. Schwan, J.Zimmer and the mechanic workshop of the Max-Planck-Institute for nuclearphysics at Heidelberg for support in organizing, machining and measuringtarget materials. We thank B. Kopeliovich and A.V. Tarasov for theoreticalsupport and are very grateful to G.T. Garvey, J. Pochodzalla, H.W. Siebertand M. Zavertyaev for various discussions and contributions to the analysis.Last but not least it was a pleasure for us to contact H. Lipkin about modelpredictions.This project was supported in part by the Bundesministerium fur Bildung,
Wissenschaft, Forschung und Technologie, the Consejo Nacional de Ciencia yTecnologıa (CONACyT), the Conselho Nacional de Desenvolvimento Cientıficoe Tecnologico, the Fondo de Apoyo a la Investigacion (UASLP), the Fundacaode Amparo a Pequisa do Estado de Sao Paulo (FAPESP), the Israel ScienceFoundation founded by the Israel Academy of Sciences and Humanities, theIstituto Nazionale di Fisica Nucleare (INFN), the International Science Foun-dation (ISF), the National Science Foundation (Phy#9602178), NATO (grantCR6.941058-1360/94), the Russian Academy of Science, the Russian Ministryof Science and Technology, the Turkish Scientific and Technological ResearchBoard (TUBITAK), the U.S. Department of Energy (DOE grant DE-FG02-91ER40664), and the U.S.-Israel Binational Science Foundation (BSF).
References
[1] J.L. Langland, Ph. D. thesis University of Iowa (USA) August 1995.
40
[2] Stuart A. Kleinfelder et al., IEEE Transactions on Nuclear Science Vol. 35, No.1, February 1988.
[3] U. Dersch, Ph. D. thesis Heidelberg 1998, Germany.
[4] S.F. Biagi et al., Nucl. Phys. B 186 (1981) 1 - 21.
[5] G. Bellettini et al., Nucl. Phys. 79 (1966) 609 - 624.
[6] A.M. Schiz et al., Phys. Rev. D 21 (1980) 3010 - 3022.
[7] P.V.R. Murthy et al., Nucl. Phys. B 92 (1975) 269 - 308.
[8] Particle Data Group, C. Caso et al., The European Physical Journal C 3
(1998) and data on total cross sections from computer readable files from:http://pdg.lbl.gov/1998/contents plots.html
[9] A.M. Schiz, Ph. D. thesis Yale University (USA) December 1979.
[10] Landolt Bornstein tables, Volume 7, Springer edition 1973.
[11] J. Engler et al., Phys. Lett. 32 B (1970) 716 - 719.
[12] A. Babaev et al., Phys. Lett. 51 B (1974) 501 - 504.
[13] R.J. Glauber, Boulder Lectures (1959) 315 - 413.
[14] V. Franco, Phys. Rev. C 6 (1972) 748 - 757.
[15] V.A. Karmanov and L.A. Kondratyuk, JETP Lett. 18 (1973) 266 - 268.
[16] J.P. Burq et al., Nucl. Phys. B 217 (1983) 285 - 335.
[17] D. Gross et al., Phys. Rev. Lett. 41 (1978) 217 - 220.
[18] G.G. Beznogikh et al., Phys. Lett. B 39 (1972) 411 - 413.
[19] A.A. Vorobyov et al., Phys. Lett. B 41 (1972) 639 - 641.
[20] K.J. Foley et al., Phys. Rev. Lett. 19 (1967) 857 - 859.
[21] L.A. Fajardo et al., Phys. Rev. D 24 (1981) 46 - 65.
[22] P. Jenni et al., Nucl. Phys. B 129 (1977) 232 - 252.
[23] R.E. Breedon et al., Phys. Rev. Lett. B 216 (1989) 459 - 465.
[24] N. Amos et al., Phys. Rev. Lett. B 128 (1983) 343 - 348.
[25] U. Amaldi et al., Phys. Rev. Lett. B 66 (1977) 390 - 394.
[26] N. Amos et al., Nucl. Phys. B 262 (1985) 689 - 714.
[27] V.D. Akopin et al., Sov. J. Nucl. Phys. 25 (1977) 51 - 55.
[28] I.V. Amirkhanov et al., Sov. J. Nucl. Phys. 17 (1973) 636 - 637.
[29] K.J. Foley et al., Phys. Rev. 181 (1969) 1775 - 1793.
41
[30] V.D. Apokin et al., Nucl. Phys. B 106 (1976) 413 - 429.
[31] J.P. Burq et al., Phys. Lett. B 109 (1982) 124 - 127.
[32] L.G. Dakhno, Sov. J. Nucl. Phys. 37 (1983) 590 - 598.
[33] Yu. M. Kazarinov et al., Sov. Phys. JETP 43 (1976) 598 - 606.
[34] C. W. De Jager et al., Atomic Data and Nuclear Data Tables 14 (1974) 479 -508.
[35] A. Donnachie and P. V. Landshoff, Phys. Lett. B 296 (1992) 227 - 232.
[36] H. Lipkin, Phys. Rev. D 11 (1975) 1827 - 1831.
[37] Particle Data Group, R.M. Barnett et al., Phys. Rev. D 54 (1996), 191 - 192.
[38] A.S. Carroll et al., Phys. Lett. B 80 (1979) 423 - 427.
[39] J. Badier et al., Phys. Lett. B 41 (1972) 387 - 392.
42