
arXiv:hep-ex/0102042v1 21 Feb 2001€¦arXiv:hep-ex/0102042v1 21 Feb 2001 Measurement of dijet...
39
arXiv:hep-ex/0102042v1 21 Feb 2001 Measurement of dijet production in neutral current deep inelastic scattering at high Q 2 and determination of α s ZEUS Collaboration Abstract Dijet production has been studied in neutral current deep inelastic e + p scattering for 470 <Q 2 < 20000 GeV 2 with the ZEUS detector at HERA using an inte- grated luminosity of 38.4 pb −1 . Dijet differential cross sections are presented in a kinematic region where both theoretical and experimental uncertainties are small. Next-to-leading-order (NLO) QCD calculations describe the measured differential cross sections well. A QCD analysis of the measured dijet fraction as a function of Q 2 allows both a precise determination of α s (M Z ) and a test of the energy-scale dependence of the strong coupling constant. A detailed analysis provides a realistic estimate of the uncertainties of the NLO QCD cross sections arising from the parton distribution functions of the proton. The value of α s (M Z ), as determined from the QCD fit, is α s (M Z )=0.1166 ± 0.0019 (stat.) +0.0024 −0.0033 (exp.) +0.0057 −0.0044 (th.).
-
Upload
duongkhuong -
Category
Documents
-
view
221 -
download
3
Transcript of arXiv:hep-ex/0102042v1 21 Feb 2001€¦arXiv:hep-ex/0102042v1 21 Feb 2001 Measurement of dijet...

arX
iv:h
ep-e
x/01
0204
2v1
21
Feb
2001
Measurement of dijet production in neutral
current deep inelastic scattering at high Q2
and determination of αs
ZEUS Collaboration
Abstract
Dijet production has been studied in neutral current deep inelastic e+p scattering
for 470 < Q2 < 20000 GeV2 with the ZEUS detector at HERA using an inte-
grated luminosity of 38.4 pb−1. Dijet differential cross sections are presented in a
kinematic region where both theoretical and experimental uncertainties are small.
Next-to-leading-order (NLO) QCD calculations describe the measured differential
cross sections well. A QCD analysis of the measured dijet fraction as a function
of Q2 allows both a precise determination of αs(MZ) and a test of the energy-scale
dependence of the strong coupling constant. A detailed analysis provides a realistic
estimate of the uncertainties of the NLO QCD cross sections arising from the parton
distribution functions of the proton. The value of αs(MZ), as determined from the
QCD fit, is αs(MZ) = 0.1166 ± 0.0019 (stat.)+0.0024
−0.0033 (exp.)+0.0057
−0.0044 (th.).
The ZEUS Collaboration
J. Breitweg, S. Chekanov, M. Derrick, D. Krakauer, S. Magill, B. Musgrave, A. Pellegrino,
J. Repond, R. Stanek, R. Yoshida
Argonne National Laboratory, Argonne, IL, USA p
M.C.K. Mattingly
Andrews University, Berrien Springs, MI, USA
P. Antonioli, G. Bari, M. Basile, L. Bellagamba, D. Boscherini1, A. Bruni, G. Bruni,
G. Cara Romeo, L. Cifarelli2, F. Cindolo, A. Contin, M. Corradi, S. De Pasquale, P. Giusti,
G. Iacobucci, G. Levi, A. Margotti, T. Massam, R. Nania, F. Palmonari, A. Pesci,
G. Sartorelli, A. Zichichi
University and INFN Bologna, Bologna, Italy f
G. Aghuzumtsyan, C. Amelung3, I. Brock, K. Coboken4, S. Goers, H. Hartmann, K. Heinloth5,
E. Hilger, P. Irrgang, H.-P. Jakob, A. Kappes6, U.F. Katz, R. Kerger, O. Kind, E. Paul,
J. Rautenberg, H. Schnurbusch, A. Stifutkin, J. Tandler, K.C. Voss, A. Weber, H. Wieber
Physikalisches Institut der Universitat Bonn, Bonn, Germany c
D.S. Bailey, O. Barret, N.H. Brook7, J.E. Cole, B. Foster1, G.P. Heath, H.F. Heath,
S. Robins, E. Rodrigues8, J. Scott, R.J. Tapper
H.H. Wills Physics Laboratory, University of Bristol, Bristol, U.K. o
M. Capua, A. Mastroberardino, M. Schioppa, G. Susinno
Calabria University, Physics Dept.and INFN, Cosenza, Italy f
H.Y. Jeoung, J.Y. Kim, J.H. Lee, I.T. Lim, K.J. Ma, M.Y. Pac9
Chonnam National University, Kwangju, Korea h
A. Caldwell, W. Liu, X. Liu, B. Mellado, S. Paganis, S. Sampson, W.B. Schmidke,
F. Sciulli
Columbia University, Nevis Labs., Irvington on Hudson, N.Y., USA q
J. Chwastowski, A. Eskreys, J. Figiel, K. Klimek, K. Olkiewicz, M.B. Przybycien10,
P. Stopa, L. Zawiejski
Inst. of Nuclear Physics, Cracow, Poland j
B. Bednarek, K. Jelen, D. Kisielewska, A.M. Kowal, T. Kowalski, M. Przybycien,
E. Rulikowska-Zarebska, L. Suszycki, D. Szuba
Faculty of Physics and Nuclear Techniques, Academy of Mining and Metallurgy, Cracow,
Poland j
A. Kotanski
Jagellonian Univ., Dept. of Physics, Cracow, Poland
I

L.A.T. Bauerdick, U. Behrens, J.K. Bienlein, K. Borras, V. Chiochia, J. Crittenden11,
D. Dannheim, K. Desler, G. Drews, A. Fox-Murphy, U. Fricke, F. Goebel, P. Gottlicher,
R. Graciani, T. Haas, W. Hain, G.F. Hartner, K. Hebbel, S. Hillert, W. Koch12†, U. Kotz,
H. Kowalski, H. Labes, B. Lohr, R. Mankel, J. Martens, M. Martınez, M. Milite, M. Moritz,
D. Notz, M.C. Petrucci, A. Polini, M. Rohde5, A.A. Savin, U. Schneekloth, F. Selonke,
S. Stonjek, G. Wolf, U. Wollmer, C. Youngman, W. Zeuner
Deutsches Elektronen-Synchrotron DESY, Hamburg, Germany
C. Coldewey, A. Lopez-Duran Viani, A. Meyer, S. Schlenstedt, P.B. Straub
DESY Zeuthen, Zeuthen, Germany
G. Barbagli, E. Gallo, A. Parenti, P. G. Pelfer
University and INFN, Florence, Italy f
A. Bamberger, A. Benen, N. Coppola, S. Eisenhardt13, P. Markun, H. Raach, S. Wolfle
Fakultat fur Physik der Universitat Freiburg i.Br., Freiburg i.Br., Germany c
M. Bell, P.J. Bussey, A.T. Doyle, C. Glasman, S.W. Lee, A. Lupi, N. Macdonald,
G.J. McCance, D.H. Saxon, L.E. Sinclair, I.O. Skillicorn, R. Waugh
Dept. of Physics and Astronomy, University of Glasgow, Glasgow, U.K. o
B. Bodmann, N. Gendner, U. Holm, H. Salehi, K. Wick, A. Yildirim, A. Ziegler
Hamburg University, I. Institute of Exp. Physics, Hamburg, Germany c
T. Carli, A. Garfagnini, A. Geiser, I. Gialas14, D. Kcira15, E. Lohrmann
Hamburg University, II. Institute of Exp. Physics, Hamburg, Germany c
R. Goncalo8, K.R. Long, D.B. Miller, A.D. Tapper, R. Walker
Imperial College London, High Energy Nuclear Physics Group, London, U.K. o
P. Cloth, D. Filges
Forschungszentrum Julich, Institut fur Kernphysik, Julich, Germany
T. Ishii, M. Kuze, K. Nagano, K. Tokushuku16, S. Yamada, Y. Yamazaki
Institute of Particle and Nuclear Studies, KEK, Tsukuba, Japan g
A.N. Barakbaev, E.G. Boos, N.S. Pokrovskiy, B.O. Zhautykov
Institute of Physics and Technology of Ministry of Education and Science of Kazakhstan,
Almaty, Kazakhstan
S.H. Ahn, S.B. Lee, S.K. Park
Korea University, Seoul, Korea h
H. Lim17, D. Son
Kyungpook National University, Taegu, Korea h
II
F. Barreiro, G. Garcıa, O. Gonzalez, L. Labarga, J. del Peso, I. Redondo18, J. Terron,
M. Vazquez
Univer. Autonoma Madrid, Depto de Fısica Teorica, Madrid, Spain n
M. Barbi, F. Corriveau, S. Padhi, D.G. Stairs, M. Wing
McGill University, Dept. of Physics, Montreal, Quebec, Canada a, b
T. Tsurugai
Meiji Gakuin University, Faculty of General Education, Yokohama, Japan
A. Antonov, V. Bashkirov19, P. Danilov, B.A. Dolgoshein, D. Gladkov, V. Sosnovtsev,
S. Suchkov
Moscow Engineering Physics Institute, Moscow, Russia l
R.K. Dementiev, P.F. Ermolov, Yu.A. Golubkov, I.I. Katkov, L.A. Khein,
N.A. Korotkova, I.A. Korzhavina, V.A. Kuzmin, O.Yu. Lukina, A.S. Proskuryakov,
L.M. Shcheglova, A.N. Solomin, N.N. Vlasov, S.A. Zotkin
Moscow State University, Institute of Nuclear Physics, Moscow, Russia m
C. Bokel, M. Botje, J. Engelen, S. Grijpink, E. Koffeman, P. Kooijman, S. Schagen,
A. van Sighem, E. Tassi, H. Tiecke, N. Tuning, J.J. Velthuis, J. Vossebeld, L. Wiggers,
E. de Wolf
NIKHEF and University of Amsterdam, Amsterdam, Netherlands i
N. Brummer, B. Bylsma, L.S. Durkin, J. Gilmore, C.M. Ginsburg, C.L. Kim, T.Y. Ling
Ohio State University, Physics Department, Columbus, Ohio, USA p
S. Boogert, A.M. Cooper-Sarkar, R.C.E. Devenish, J. Große-Knetter20, T. Matsushita,
O. Ruske, M.R. Sutton, R. Walczak
Department of Physics, University of Oxford, Oxford U.K. o
A. Bertolin, R. Brugnera, R. Carlin, F. Dal Corso, S. Dusini, S. Limentani, A. Longhin,
M. Posocco, L. Stanco, M. Turcato
Dipartimento di Fisica dell’ Universita and INFN, Padova, Italy f
L. Adamczyk21, L. Iannotti21, B.Y. Oh, J.R. Okrasinski, P.R.B. Saull21, W.S. Toothacker12†,J.J. Whitmore
Pennsylvania State University, Dept. of Physics, University Park, PA, USA q
Y. Iga
Polytechnic University, Sagamihara, Japan g
G. D’Agostini, G. Marini, A. Nigro
Dipartimento di Fisica, Univ. ’La Sapienza’ and INFN, Rome, Italy f
III
C. Cormack, J.C. Hart, N.A. McCubbin, T.P. Shah
Rutherford Appleton Laboratory, Chilton, Didcot, Oxon, U.K. o
D. Epperson, C. Heusch, H.F.-W. Sadrozinski, A. Seiden, R. Wichmann, D.C. Williams
University of California, Santa Cruz, CA, USA p
I.H. Park
Seoul National University, Seoul, Korea
N. Pavel
Fachbereich Physik der Universitat-Gesamthochschule Siegen, Germany c
H. Abramowicz22, S. Dagan, A. Gabareen, S. Kananov, A. Kreisel, A. Levy
Raymond and Beverly Sackler Faculty of Exact Sciences, School of Physics, Tel-Aviv
University, Tel-Aviv, Israel e
T. Abe, T. Fusayasu, T. Kohno, K. Umemori, T. Yamashita
Department of Physics, University of Tokyo, Tokyo, Japan g
R. Hamatsu, T. Hirose, M. Inuzuka, S. Kitamura23, K. Matsuzawa, T. Nishimura
Tokyo Metropolitan University, Dept. of Physics, Tokyo, Japan g
M. Arneodo24, N. Cartiglia, R. Cirio, M. Costa, M.I. Ferrero, S. Maselli, V. Monaco,
C. Peroni, M. Ruspa, R. Sacchi, A. Solano, A. Staiano
Universita di Torino, Dipartimento di Fisica Sperimentale and INFN, Torino, Italy f
D.C. Bailey, C.-P. Fagerstroem, R. Galea, T. Koop, G.M. Levman, J.F. Martin, A. Mirea,
A. Sabetfakhri
University of Toronto, Dept. of Physics, Toronto, Ont., Canada a
J.M. Butterworth, C. Gwenlan, M.E. Hayes, E.A. Heaphy, T.W. Jones, J.B. Lane, B.J. West
University College London, Physics and Astronomy Dept., London, U.K. o
J. Ciborowski, R. Ciesielski, G. Grzelak, R.J. Nowak, J.M. Pawlak, R. Pawlak, B. Smalska25,
T. Tymieniecka, A.K. Wroblewski, J.A. Zakrzewski, A.F. Zarnecki
Warsaw University, Institute of Experimental Physics, Warsaw, Poland j
M. Adamus, T. Gadaj
Institute for Nuclear Studies, Warsaw, Poland j
O. Deppe26, Y. Eisenberg, L.K. Gladilin27, D. Hochman, U. Karshon
Weizmann Institute, Department of Particle Physics, Rehovot, Israel d
W.F. Badgett, D. Chapin, R. Cross, C. Foudas, S. Mattingly, D.D. Reeder, W.H. Smith,
A. Vaiciulis28, T. Wildschek, M. Wodarczyk
University of Wisconsin, Dept. of Physics, Madison, WI, USA p
IV

A. Deshpande, S. Dhawan, V.W. Hughes
Yale University, Department of Physics, New Haven, CT, USA p
S. Bhadra, C.D. Catterall, W.R. Frisken, R. Hall-Wilton, M. Khakzad, S. Menary
York University, Dept. of Physics, Toronto, Ont., Canada a
V
1 now visiting scientist at DESY2 now at Univ. of Salerno and INFN Napoli, Italy3 now at CERN4 now at Sparkasse Bonn, Germany5 retired6 supported by the GIF, contract I-523-13.7/977 PPARC Advanced fellow8 supported by the Portuguese Foundation for Science and Technology (FCT)9 now at Dongshin University, Naju, Korea
10 now at Northwestern Univ., Evaston/IL, USA11 on leave of absence from Bonn University12 deceased13 now at University of Edinburgh, Edinburgh, U.K.14 visitor of Univ. of the Aegean, Greece15 supported by DAAD, Bonn - Kz. A/98/1271216 also at University of Tokyo17 partly supported by an ICSC-World Laboratory Bjorn H. Wiik Scholarship18 supported by the Comunidad Autonoma de Madrid19 now at Loma Linda University, Loma Linda, CA, USA20 supported by the Feodor Lynen Program of the Alexander von Humboldt foundation21 partly supported by Tel Aviv University22 an Alexander von Humboldt Fellow at University of Hamburg23 present address: Tokyo Metropolitan University of Health Sciences, Tokyo 116-8551,
Japan24 now also at Universita del Piemonte Orientale, I-28100 Novara, Italy25 supported by the Polish State Committee for Scientific Research, grant no. 2P03B 002
1926 now at EVOTEC BioSystems AG, Hamburg, Germany27 on leave from MSU, partly supported by University of Wisconsin via the U.S.-Israel
BSF28 now at University of Rochester, Rochester, NY, USA
VI

a supported by the Natural Sciences and Engineering Research Council of
Canada (NSERC)b supported by the FCAR of Quebec, Canadac supported by the German Federal Ministry for Education and Science,
Research and Technology (BMBF), under contract numbers 057BN19P,
057FR19P, 057HH19P, 057HH29P, 057SI75Id supported by the MINERVA Gesellschaft fur Forschung GmbH, the Israel Sci-
ence Foundation, the U.S.-Israel Binational Science Foundation, the Israel Min-
istry of Science and the Benozyio Center for High Energy Physicse supported by the German-Israeli Foundation, the Israel Science Foundation,
the U.S.-Israel Binational Science Foundation, and by the Israel Ministry of
Sciencef supported by the Italian National Institute for Nuclear Physics (INFN)g supported by the Japanese Ministry of Education, Science and Culture (the
Monbusho) and its grants for Scientific Researchh supported by the Korean Ministry of Education and Korea Science and Engi-
neering Foundationi supported by the Netherlands Foundation for Research on Matter (FOM)j supported by the Polish State Committee for Scientific Research, grant
No. 111/E-356/SPUB-M/DESY/P-03/DZ 3001/2000, 620/E-77/SPUB-
M/DESY/P-03/DZ 247/2000, and by the German Federal Ministry of Ed-
ucation and Science, Research and Technology (BMBF)l partially supported by the German Federal Ministry for Education and Science,
Research and Technology (BMBF)m supported by the Fund for Fundamental Research of Russian Ministry for
Science and Education and by the German Federal Ministry for Education
and Science, Research and Technology (BMBF)n supported by the Spanish Ministry of Education and Science through funds
provided by CICYTo supported by the Particle Physics and Astronomy Research Councilp supported by the US Department of Energyq supported by the US National Science Foundation
VII
1 Introduction
Dijet production in neutral current (NC) e+p deep inelastic scattering (DIS) provides a
rich testing ground of the theory of the strong interactions of quarks and gluons, namely
quantum chromodynamics (QCD). At leading order (LO) in the strong coupling constant,
αs, 2+1 jet production1 in NC DIS proceeds via the QCD-Compton (V ∗q → qg with V =
γ, Z0) and boson-gluon fusion (V ∗g → qq) processes. Thus, the differential cross section
for dijet production is directly sensitive to αs, which is the fundamental parameter of the
theory. Selecting a phase-space region where the perturbative QCD (pQCD) predictions
are least affected by theoretical uncertainties provides a compelling test of QCD and
permits a precise determination of the strong coupling constant.
In this paper, measurements of the differential cross sections for dijet production in NC
DIS are presented and compared with next-to-leading-order (NLO) pQCD predictions
after correction for hadronisation effects. The phase-space region is restricted to high
values of the virtuality, Q2, of the exchanged boson, 470 < Q2 < 20000 GeV2. In
this region, the experimental uncertainties on the reconstruction of both the positron
and the hadronic final state are smaller than at lower Q2. In addition, the theoretical
uncertainties due to the modelling of the hadronic final state, to the parton distribution
functions (PDFs) of the proton and to the higher-order contributions are minimised.
The comparison of the differential cross sections with the theoretical predictions of the
underlying hard processes provides a test of the NLO QCD description of dijet production.
The analysis takes fully into account the correlation between the value of αs(MZ) used in
the determination of the proton PDFs and that in the calculation of the partonic cross
sections. Furthermore, a detailed study of the theoretical uncertainties has been carried
out which includes the statistical and correlated systematic uncertainties from each data
set used in the determination of the proton PDFs. The QCD analysis yields a precise
determination of αs(MZ) and its energy-scale dependence. The twelve-fold increase in
integrated luminosity, in combination with the improved experimental and theoretical
methods used here, produces a significantly more accurate determination of αs(MZ) with
respect to the previous ZEUS measurement [1].
2 Theoretical framework
2.1 Kinematics
For a given e+p centre-of-mass energy,√
s, the cross section for NC DIS, e+p → e+ + X,
depends on two independent kinematic variables, which are chosen to be Q2 and Bjorken-
1 Hereafter we denote the proton remnant by “+1”.
1
x, defined by Q2 = −q2 and xBj = Q2/(2P · q), where P (q) is the four-momentum of the
incoming proton (exchanged virtual boson, V ∗).
For dijet production in NC DIS at LO, three additional variables, ξ, zp and Φ, are needed
in order to describe the kinematics of the two outgoing partons which form the two jets.
The fraction ξ of the proton four-momentum carried by the incoming parton is defined
by ξ = xBj · (1 + M212/Q
2), where M12 is the invariant mass of the two final-state partons.
The variable zp is defined for each outgoing parton i (i = 1, 2) with four-momentum pi by
zp,i =P · pi
P · q =1
2· (1 − cos θ∗i ) ≃ Ejet,i
L (1 − cos θjet,iL )
∑
k=1,2 Ejet,kL (1 − cos θjet,k
L ),
where θ∗i is the parton scattering angle in the V ∗-parton centre-of-mass system and
zp,1 + zp,2 = 1. Experimentally, zp can be determined from the energy, EjetL , and polar
angle, θjetL , of each of the two reconstructed jets in the laboratory frame. The angle Φ
is the azimuthal angle between the parton and lepton scattering planes in the V ∗-parton
centre-of-mass system.
2.2 Cross-section calculation
According to the QCD-improved parton model, as quantitatively expressed by the factori-
sation theorem of QCD [2] and perturbation theory, a NC DIS differential cross section2,
dσ, can be written as
dσ =∑
a=q,q,g
∫
dxfa(x, µ2F ; αs; {ζ}) · dσa(xP, αs(µR), µ2
R, µ2F ) · (1 + δhad), (1)
which can be interpreted as follows. The cross section has the form of a convolution of the
partonic hard cross sections, dσa, with the PDFs, fa(x, µ2F ), of the colliding proton, with
respect to the fraction x of the proton four-momentum carried by the incoming parton.
The partonic cross sections describe the short-distance structure of the interaction and
are calculable as power-series expansions in the strong coupling constant, which depends
on the renormalisation scale, µR. The PDFs contain the description of the long-distance
structure of the incoming proton. Their evolution with the factorisation scale, µF , at
which they are probed follows the DGLAP equations [3]. In Eq. (1), the dependence of
the PDFs on the value of the strong coupling constant assumed in the DGLAP equations
and on the parameters (collectively indicated by {ζ}) needed to model the x dependence
of the PDFs is explicitly indicated. In this analysis, the implicit αs(MZ) dependence of
2 The same symbol, dσ, is used for both the DIS inclusive, dσtot, and the dijet, dσ2+1, differential cross
sections. The same symbols with the superscript NLO indicate only the perturbative component (the
first term on the right-hand side of Eq. (1)).
2
the PDFs in the calculation of the NLO differential cross sections has been taken into
account. The non-perturbative contribution, δhad, to the inclusive DIS cross section, σtot,
can be safely neglected in the high-Q2 region studied here. For the differential dijet cross
sections, δhad was estimated using Monte Carlo (MC) models for the parton cascade and
fragmentation (see Section 4).
In the past few years there has been considerable theoretical progress on the development
of general (i.e. process- and observable-independent) algorithms that allow a complete
analytical cancellation of the soft and collinear singularities encountered in the calculation
of NLO jet cross sections [4, 5]; flexible programs that compute arbitrary infrared- and
collinear-safe DIS observables in NLO QCD are now available [5–8].
3 Experimental setup
The data sample was collected with the ZEUS detector [9] during the 1996-1997 data-
taking period at HERA and corresponds to an integrated luminosity of 38.4 ± 0.6 pb−1.
During this period HERA operated with protons of energy Ep = 820 GeV and positrons
of energy Ee = 27.5 GeV.
The compensating uranium-scintillator calorimeter (CAL) [10] covers 99.7% of the total
solid angle. It is divided into three parts with respect to the polar angle3, θ, as viewed
from the nominal interaction point: forward (FCAL, 2.6◦ < θ < 36.7◦), barrel (BCAL,
36.7◦ < θ < 129.1◦), and rear (RCAL, 129.1◦ < θ < 176.2◦). Each section is sub-
divided into towers which subtend solid angles between 0.006 and 0.04 steradian. Each
tower is longitudinally segmented into an electromagnetic and one (RCAL) or two (FCAL,
BCAL) hadronic sections. The electromagnetic section of each tower is further sub-divided
transversely into two (RCAL) or four (BCAL, FCAL) cells. Under test-beam conditions,
the calorimeter single-particle relative resolutions were 18%/√
E (GeV) for electrons and
35%/√
E (GeV) for hadrons.
Tracking information is provided by the central tracking detector (CTD) [11] operating
in a 1.43 T solenoidal magnetic field. The interaction vertex is measured with a typ-
ical resolution along (transverse to) the beam direction of 0.4 (0.1) cm. The CTD is
used to reconstruct the momenta of tracks in the polar angle region 15◦ < θ < 164◦.
The transverse momentum, pt, resolution for full-length tracks can be parameterised as
σ(pt)/pt = 0.0058 pt ⊕ 0.0065 ⊕ 0.0014/pt, with pt in GeV.
3 The ZEUS coordinate system is a right-handed Cartesian system, with the Z axis pointing in the
proton beam direction, referred to as the “forward direction”, and the X axis pointing left towards
the centre of HERA. The coordinate origin is at the nominal interaction point. The pseudorapidity
is defined as η = − ln(
tan θ
2
)
, where the polar angle, θ, is measured with respect to the proton beam
direction.
3
The luminosity is measured using the Bethe-Heitler reaction e+p → e+γp [12]. The
resulting small-angle energetic photons are measured by the luminosity monitor, a lead-
scintillator calorimeter placed in the HERA tunnel at Z = −107 m.
4 Monte Carlo models
NC DIS events including radiative effects were simulated using the HERACLES 4.5.2 [13]
MC program with the DJANGO6 2.4 [14] interface to the hadronisation programs. HER-
ACLES includes corrections for initial- and final-state radiation, vertex and propagator
terms, and two-boson exchange. The QCD cascade is simulated using the colour-dipole
model [15] including the LO QCD diagrams as implemented4 in ARIADNE 4.08 [17] and,
as a systematic check of the final results, with the MEPS model of LEPTO 6.5 [18]. Both
MC programs use the Lund string model [19] of JETSET 7.4 [20] for the hadronisation.
To estimate the uncertainty caused by the modelling of hadronisation, events were also
generated with the HERWIG 5.9 [21] program, in which the fragmentation is simulated
according to a cluster model [22].
The ZEUS detector response was simulated with a program based on GEANT 3.13 [23].
The generated events were passed through the simulated detector, subjected to the same
trigger requirements as the data, and processed by the same reconstruction and offline
programs.
The simulations based on ARIADNE and LEPTO give a very good description of the
shape and magnitude of the measured distributions of the inclusive event sample as a
function of xBj and Q2. The shape of most of the measured distributions of the di-
jet sample is also adequately described by these two programs. LEPTO gives a better
description of the jet pseudorapidity distributions, while ARIADNE gives a better de-
scription of the shape of the dijet cross section as a function of Q2. ARIADNE was used
to calculate the acceptance corrections; both programs give very similar results.
In addition, samples of events were generated without either Z0 exchange or electroweak
radiative events, allowing the measured cross sections to be corrected for these effects,
which at present are not included in the NLO QCD programs described below.
5 NLO QCD calculations
The NLO QCD calculations used in the analysis are based on the program DISENT
[5]. The calculations make use of a generalised version [5] of the subtraction method
4 A modified treatment of parton radiation at high Q2 [16] was included.
4
[24] and are performed in the massless MS renormalisation and factorisation schemes.
The number of flavours was set to 5, the scales µR and µF were both set to Q, and
αs(µR) was evaluated using the two-loop formula [25]. Various sets of proton PDFs,
hereafter generically referred to as MBFIT PDFs5, resulting from a recent analysis [26],
were used. This analysis provides the covariance matrix of the fitted PDF parameters and
the derivatives as a function of x and Q2 of the PDFs with respect to these parameters.
These are necessary to propagate the statistical and correlated systematic uncertainties
of each data set used in the NLO DGLAP fit to the NLO QCD differential cross sections.
The DISENT predictions have been cross-checked with results obtained with the program
DISASTER++ [7]. Agreement at the 1−2% level has been found between these programs
for all the observables discussed in this paper.
The NLO pQCD predictions to be compared with the data were corrected by a bin-by-bin
procedure for hadronisation effects according to dσ2+1 = dσNLO2+1 ·C−1
had. The hadronisation
correction factor, Chad (≡ (1 + δhad)−1), was defined as the ratio of the dijet cross sections
before and after the hadronisation process, Chad = dσMC,partons2+1 /dσMC,hadrons
2+1 . The value
of Chad was taken as the mean of the ratios obtained using the ARIADNE and HERWIG
programs, for which the predictions agree typically within 5%. The hadronisation correc-
tion was below 10% for most of the phase space. These programs only include the LO
matrix elements for the partonic cross sections and higher-order contributions are simu-
lated using various approximations to the parton cascade. This procedure for applying
hadronisation corrections to the NLO QCD predictions was verified by checking that the
shapes of the differential dijet cross sections at the parton level are reasonably reproduced
by the NLO QCD calculations.
6 Event selection and jet search
6.1 The NC DIS data sample
High-Q2 NC DIS events were selected according to criteria similar to those described in
a recent ZEUS publication [27]. The events are characterised by a high-energy isolated
positron in the detector, making them easy to distinguish from quasi-real photoproduction
(Q2 ∼ 0) and beam-gas interaction backgrounds.
In addition to the energy and polar angle of the positron6, the variables δ, net transverse
5 The MBFIT1M set of proton PDFs assumes αs(MZ) = 0.118.6 The positron polar angle, θe, was determined from the associated track if the positron cluster was
within the CTD acceptance, and otherwise from the position of the cluster and the reconstructed
vertex.
5
momentum, PT , and total transverse energy, ET , were used for event selection, where
δ = E − PZ , E is the total energy as measured in the CAL and P =∑
i Eiri . The sum
runs over all calorimeter energy deposits Ei, and ri is a unit vector along the line joining
the reconstructed vertex and the geometric centre of cell i. The following criteria were
applied offline:
• to ensure that event quantities can be accurately determined, a reconstructed vertex
with −50 < Z < 50 cm was required;
• to suppress photoproduction events, in which the scattered positron escapes through
the beam hole in the RCAL, δ was required to be greater than 38 GeV. For perfect
detector resolution, δ is twice the positron beam energy (55 GeV) for fully contained
DIS events, while, for photoproduction events, δ peaks at much lower values. This cut
also rejected events with hard initial-state QED radiation. The additional requirement
δ < 65 GeV removed cosmic ray background;
• positrons were identified based on calorimeter cluster quantities and tracking:
– to ensure high purity, the positron was required to have an energy of at least
10 GeV;
– to reduce background, isolated positrons were selected by requiring no more than
5 GeV in calorimeter cells not associated with the scattered positron in an η − φ
cone of radius 0.8 centred on the positron direction;
– each positron with θe > 17.2◦ was required to match to a charged track of at least
5 GeV momentum. For positrons beyond the tracking acceptance (θe < 17.2◦),
the tracking requirement in the positron selection was replaced by a cut on the
transverse momentum of the positron peT > 30 GeV and by the requirement δ >
44 GeV;
– a fiducial volume cut was applied to the positron position which excludes the
upper part of the central RCAL area (20 × 80 cm2) occluded by the cryogenic
supply for the solenoid magnet. The transition regions between FCAL and BCAL,
and BCAL and RCAL, corresponding to polar angles of 35.6◦ < θ < 37.3◦ and
128.2◦ < θ < 140.2◦, respectively, were also excluded;
• to reduce further the background from photoproduction, the variable y = Q2/(xBjs),
estimated from the positron energy and angle, ye, was required to satisfy ye < 0.95;
• the net transverse momentum, PT , is expected to be close to zero and was measured
with an error approximately proportional to√
ET (GeV). To remove cosmic rays and
beam-related background, PT (GeV) was required to be less than 4√
ET ( GeV).
6
The kinematic variables Q2, xBj and y were determined using the double angle (DA)
reconstruction method [28] and are referred to as Q2DA
, xDA and yDA, respectively. The
DA method is insensitive to errors in the absolute energy scale of the calorimeter and
MC studies [27] have shown it to be superior to other methods in the high-Q2 region
considered here.
6.2 Jet search and reconstruction
The longitudinally invariant kT -cluster algorithm [29] was used in the inclusive mode to
reconstruct jets in the hadronic final state both in data and in MC simulated events.
At the detector level, the algorithm was applied to the energy deposits in the CAL cells
after excluding those associated with the scattered positron candidate. The jet search
was also applied to the generated hadrons and to the partons in the MC samples, as
well as to the partons of the NLO QCD programs. The jet search was performed in the
Breit frame [30], in which the exchanged virtual boson is purely space-like with three-
momentum q = (0, 0,−Q). In this frame, the selection of the jets in terms of transverse
energy with respect to the direction of the virtual boson allows a natural suppression
of the contribution due to single-jet events and strongly reduces the contamination from
the proton remnant. The boost was performed using the four-momenta of the incoming
and scattered positrons. The scattered positron four-momentum was calculated using the
polar and azimuthal angles of the positron track7 and the DA positron energy, defined as
E′
e,DA = Q2DA
/(2Ee(1 + cos θe)).
The jet algorithm uses quantities defined in the Breit frame and with respect to the
direction of the incoming proton: the transverse energy, EiT,B, the pseudorapidity, ηi
B,
and the azimuthal angle, φiB, of the object i. The jet variables were defined according to
the Snowmass convention [31]:
EjetT,B =
∑
i
EiT,B , ηjet
B =
∑
i EiT,B ηi
B
EjetT,B
, φjetB =
∑
i EiT,B φi
B
EjetT,B
.
The comparison of the reconstructed jet variables between jets of hadrons and jets of
CAL cells in MC generated events showed no significant systematic shift in the angular
variables ηjetB and φjet
B . However, the jet transverse energy as measured by the CAL under-
estimated that of the jet of hadrons by an average of ≈ 15%. This effect is due mainly to
energy losses in the inactive material in front of the CAL and was corrected [32,33] using
the samples of MC generated events.
7 For events with θe < 17.2◦, the polar and azimuthal angles were calculated from the position of the
positron calorimeter cluster and the reconstructed vertex position.
7
6.3 Selected kinematic region
The differential cross sections and dijet fraction presented in Section 7 are quoted for
the DIS kinematic region defined by 470 < Q2 < 20000 GeV2 and 0 < y < 1, and
for the jet selection criteria Ejet,MT,B > 8 GeV, Ejet,m
T,B > 5 GeV and −1 < ηjetLab < 2,
where Ejet,MT,B (Ejet,m
T,B ) is the transverse energy of the jet in the Breit frame with the
highest (second highest) transverse energy in the event. Only events with exactly two jets
passing the above selection cuts were used to compute the cross sections. The final sample
contains 1637 dijet events. The restriction to a high-Q2 region was chosen to avoid the
large renormalisation-scale dependence of the NLO QCD dijet cross sections at lower Q2
(20 − 50% in the region 10 < Q2 < 100 GeV2) [33], to reduce the uncertainty due to the
proton PDFs (in particular the gluon density), and to improve the reconstruction of the
boost to the Breit frame. The asymmetric cuts on the EjetT,B of the jets avoided infrared
sensitive regions where the behaviour of the cross section as predicted by the NLO QCD
programs is unphysical [34].
7 Results
7.1 Dijet differential cross sections
The cross sections measured in the kinematic region defined in the previous section were
corrected for detector effects, QED radiative effects and Z0-exchange processes. In the
presented dijet cross sections, the two jets were ordered according to decreasing pseudora-
pidity in the Breit frame (ηjet,1B > ηjet,2
B ). The measurements of the differential dijet cross
sections are presented in Figs. 1 and 2. The inclusive and dijet cross sections, as well as
the dijet fraction, R2+1(Q2) ≡ (dσ2+1/dQ2)/(dσtot/dQ2), are presented as a function of
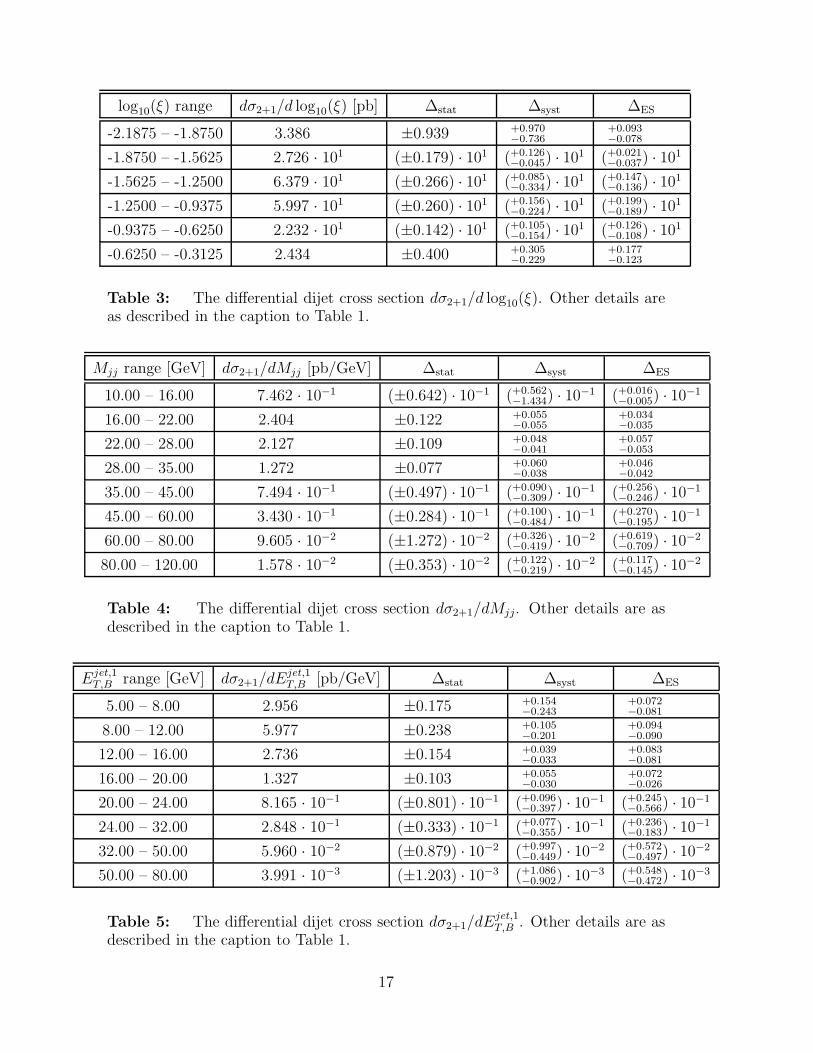
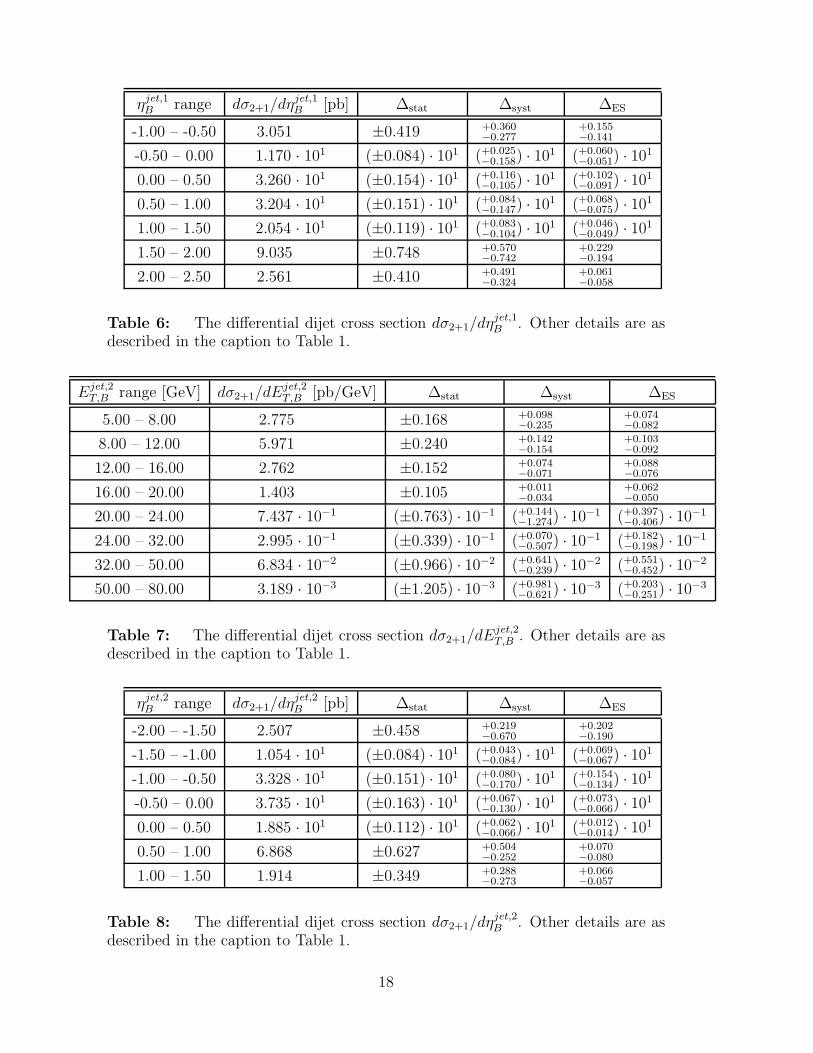
Q2 in Fig. 3. The values of the cross sections are listed in Tables8 1 to 11.
In Figs. 1 to 3, the measured differential dijet cross sections and dijet fraction are compared
to DISENT NLO QCD predictions, corrected for hadronisation effects. The hadronisation
correction, Chad, as well as its uncertainty, and the NLO QCD cross sections without
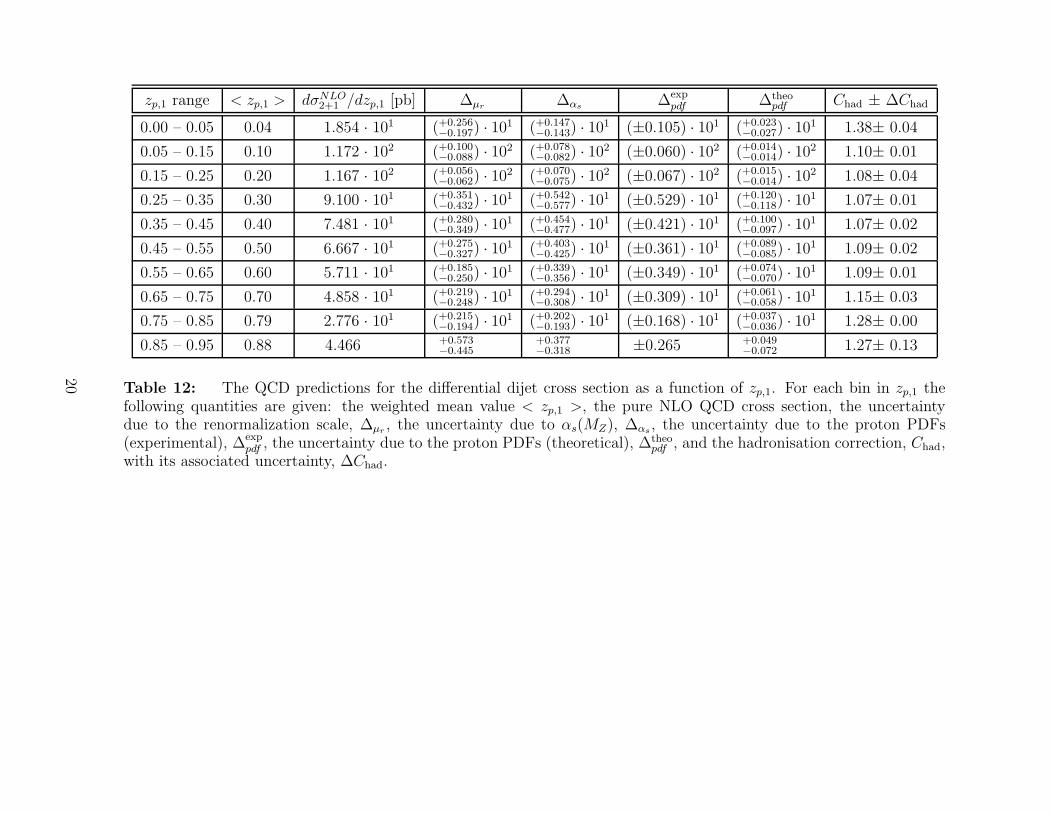
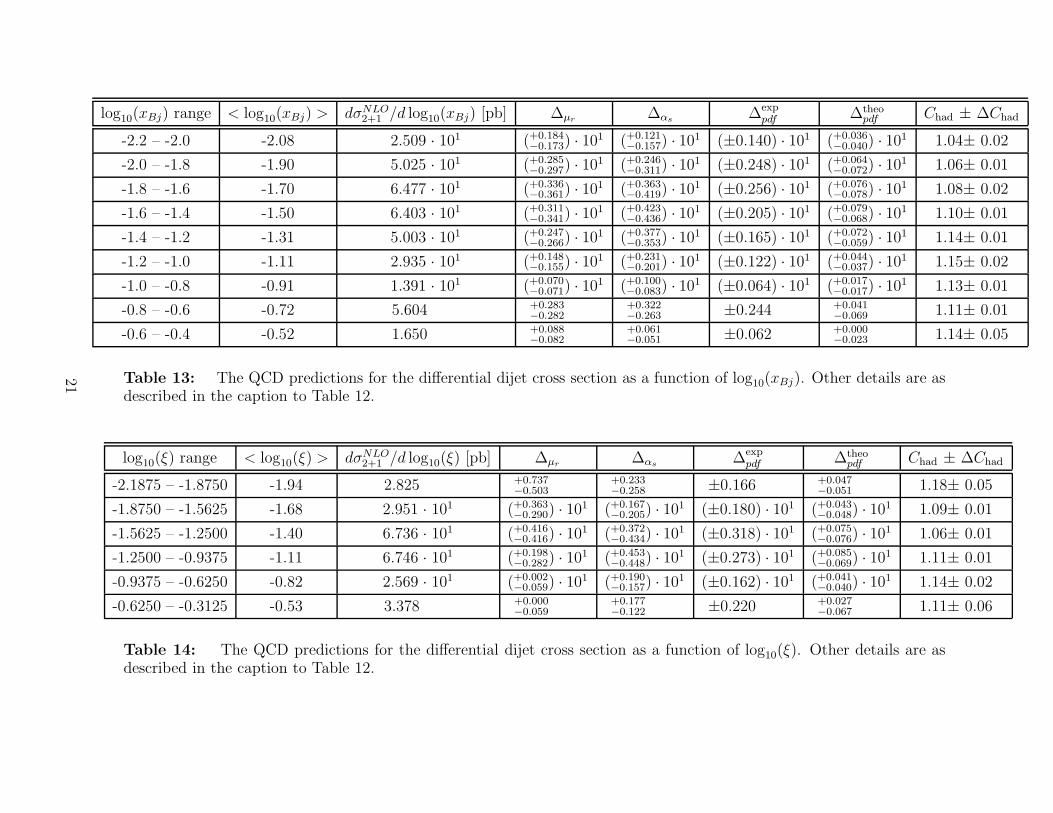
hadronisation corrections are shown in Figs. 1 to 3 and Tables 12 to 22. The QCD
predictions, which assume αs(MZ) = 0.118, provide a good overall description of both
the shape and the magnitude of the measured cross sections. The only case where the
agreement between data and NLO QCD is not good is the cross section as a function of the
pseudorapidity of the most backward jet in the Breit frame (see Fig. 2d), where the data lie
8 Tables of the results and their associated uncertainties are also available in electronic form from
the ZEUS WWW site at http://www-zeus.desy.de/zeus papers/zeus papers.html. They can also be
obtained by contacting the authors.
8
above the theoretical predictions in the region ηjet,2B > 0.5. However, hadronisation effects
are particularly large for this variable and vary more rapidly than for other variables.
The impact of such a discrepancy in the determination of αs(MZ) is minor since the
contribution to the total dijet cross section from the region ηjet,2B > 0.5 is small. The dijet
fraction increases with increasing Q2 due to phase-space effects. For the cross sections as
a function of the jet transverse energies and Q2, there is agreement at the ≈ 10% level
between data and theory over four orders of magnitude, demonstrating the validity of the
description of the dynamics of dijet production by the NLO QCD hard processes.
7.2 Experimental and theoretical uncertainties
A detailed study of each of the main sources contributing to the systematic uncertainties
of the measurements has been performed [33]. These sources, for which a typical value of
the systematic uncertainty in the dijet cross section dσ2+1/dQ2 is indicated in parentheses,
are listed below:
• uncertainties in the positron identification efficiency and in the positron energy-scale
[27] (1%);
• uncertainties in the reconstruction of the boost to the Breit frame (1%);
• use of the LEPTO program instead of ARIADNE to evaluate the acceptance correc-
tions to the observed dijet distributions (2%);
• uncertainties in the simulation of the trigger and in the cuts used to select the data
(2%);
• uncertainty of ±2% in the absolute jet energy scale of the CAL (±3.5%).
The last uncertainty is the dominant source of experimental systematic uncertainty and
is strongly correlated between measurements at different points. It is shown as a light
shaded band in Fig. 3b. In addition, there is an overall normalisation uncertainty of 1.6%
from the luminosity determination, which is not included in the figures.
The NLO QCD predictions for the dijet cross sections are affected by the following:
• uncertainties in the hadronisation correction, which were estimated as half the spread
between the Chad values obtained using the ARIADNE (string) and HERWIG (cluster)
models (1%);
• uncertainties due to terms beyond NLO, which were estimated by varying µR between
Q/2 and 2Q, keeping µF fixed at Q (6%);
9
• uncertainty in the value of αs(MZ), which was estimated by repeating the calculations
using MBFIT proton PDFs determined assuming αs(MZ) = 0.113 and 0.123 [26] (6%);
• uncertainties in the proton PDFs. The uncertainty due to the statistical and corre-
lated systematic experimental uncertainties of each data set used in the determination
of the MBFIT PDFs was calculated making use of the covariance matrix provided [26].
To estimate the uncertainties on the NLO QCD differential cross sections due to the
theoretical uncertainties affecting the extraction of the NLO PDFs, the calculation
of all the differential cross sections was repeated using a number of different MB-
FIT PDFs obtained under different theoretical assumptions in the DGLAP fit [26].
This uncertainty was added in quadrature to that estimated above to give the total
PDF-related uncertainty. The importance of taking the correlations among the PDF
parameters into account is illustrated in Fig. 4, which shows, as a function of Q2, the
relative uncertainties arising from the PDFs on the inclusive and dijet cross sections,
and the dijet fraction. The uncertainties were obtained by including or ignoring the
information provided by the covariance matrix mentioned above. The small uncer-
tainty on R2+1(Q2) due to the PDFs makes this observable particularly suitable for
extracting αs (2.5% on dσtot/dQ2, 4% on dσ2+1/dQ2 and 1.5% on R2+1(Q2)).
The total theoretical uncertainty was obtained by adding in quadrature the individual
uncertainties listed above.
7.3 Determination of αs
The measured dijet fraction as a function of Q2, R2+1(Q2), was used to determine αs(MZ).
The sensitivity of the measurements to the value of αs(MZ) is illustrated in Fig. 3b, which
compares the measured R2+1(Q2) with the NLO QCD calculations for three values of
αs(MZ).
The procedure to determine αs(MZ) was as follows:
• NLO QCD calculations of R2+1(Q2) were performed for three sets of MBFIT proton
PDFs obtained assuming αs(MZ) = 0.113, 0.118 and 0.123, respectively [26]. The
value of αs(MZ) used in each partonic cross-section calculation was that associated
with the corresponding set of PDFs;
• for each bin, i, in Q2, the NLO QCD calculations mentioned above, corrected for
hadronisation effects, were used to parameterise the αs dependence of the dijet fraction
according to the functional form:
Ri2+1(αs(MZ)) = Ai
1 · αs(MZ) + Ai2 · α2
s(MZ). (2)
10
This parameterisation allows a simple description of the αs dependence of R2+1(Q2)
over the entire αs range spanned by the MBFIT PDF sets, while using only three
NLO calculations of the dijet fraction;
• the value of αs(MZ) was then determined by a χ2-fit of Eq. (2) to the measured
R2+1(Q2) values.
This procedure correctly handles the complete αs-dependence of the NLO differential
cross sections (the explicit dependence coming from the partonic cross sections and the
implicit one coming from the PDFs) in the fit, while preserving the correlation between
αs and the PDFs. Its stability was checked with respect to variations in the PDFs and
αs, as well as to alternative parameterisations of R2+1(Q2, αs(MZ)).
Taking into account only the statistical errors on the measured dijet fraction, αs(MZ)
is found to be 0.1166 ± 0.0019 (stat.). The uncertainty on the value of αs(MZ) due to
the experimental systematic uncertainties of the measured dijet fraction was evaluated by
repeating the analysis above for each systematic check. For the ratio R2+1(Q2), some of
the systematic uncertainties largely cancel. The total experimental systematic uncertainty
on the value of αs(MZ) is +0.0024−0.0033. The largest uncertainty is that on the jet energy scale.
The following sources of theoretical uncertainties (evaluated as described in Section 7.2)
and cross-checks on the extracted value of αs(MZ) were considered [33]:
• terms beyond NLO: ∆αs(MZ) = +0.0055−0.0042;
• uncertainties in the proton PDFs: ∆αs(MZ) = +0.0012−0.0011;
• hadronisation effects: ∆αs(MZ) = ±0.0005;
• the dependence on the use of a renormalisation scale that involves the jet variables.
The analysis was repeated with µR = (Ejet,1T,B +Ejet,2
T,B ). The result is αs(MZ) = 0.1125±0.0018 (stat.), which is almost equal to that obtained with µR = Q/2. This source of
uncertainty was therefore neglected;
• the fit procedure. This was cross-checked by repeating the αs(MZ) determination
using the five sets of proton PDFs of the CTEQ4 “A-series” [35] and the three MRST
sets, central, αs ↑↑ and αs ↓↓ [36]. The results are in good agreement with the central
value determined above. This source of uncertainty was therefore neglected
The total theoretical uncertainty of +0.0057−0.0044 was obtained by adding in quadrature the
uncorrelated uncertainties on αs(MZ) due to the first three items mentioned above.
11
The value of αs(MZ) as determined from the measured R2+1(Q2) is therefore:
αs(MZ) = 0.1166 ± 0.0019 (stat.)+0.0024
−0.0033 (exp.)+0.0057
−0.0044 (th.).
This result is consistent with the current PDG world average αs(MZ) = 0.1181 ± 0.0020
[25, 37] and recent determinations by the H1 Collaboration [38].
7.4 The energy scale dependence of αs
To test the scale dependence of the renormalised strong coupling constant predicted by the
renormalisation group equation, the QCD fit of the dijet fraction was repeated in five Q2
bins. The principle of the fit is the same as outlined above, with the only difference being
that the αs dependence of the dijet fraction in Eq. (2) was parameterised not in terms
of αs(MZ) but in terms of αs(〈Q〉), where 〈Q〉 is the mean value of Q in each bin. The
measured αs(〈Q〉) values, with their experimental and theoretical systematic uncertainties
estimated as for αs(MZ), are shown in Fig. 5 and Table 23. The measurements are
compared with the renormalisation group predictions obtained from the PDG αs(MZ)
value and its associated uncertainty. The values are in good agreement with the predicted
running of the strong coupling constant over a large range in Q.
8 Summary
Differential dijet cross sections have been measured in neutral current deep inelastic e+p
scattering for 470 < Q2 < 20000 GeV2 with the ZEUS detector at HERA. These mea-
surements, which use events with only two jets, were performed in a kinematic region
where both theoretical and experimental uncertainties are small. Next-to-leading-order
QCD calculations give a good description of the shape and magnitude of the kinematic
distributions and cross sections. For the cross sections as a function of the jet transverse
energies and Q2, there is agreement at the ≈ 10% level between data and theory over four
orders of magnitude, demonstrating the validity of the description of the dynamics of dijet
production by the NLO QCD hard processes. A QCD fit of the measured dijet fraction
as a function of Q2 provides both a precise determination of the strong coupling constant
and a test of its energy-scale dependence. A comprehensive analysis of the uncertainties
of the calculations has been carried out, which takes into account the dependence of the
proton PDFs on the assumed value of αs and the statistical and correlated systematic
uncertainties from each data set used in the determination of the proton PDFs. The
value of αs(MZ) as determined by fitting the next-to-leading-order QCD calculations to
the measured dijet fraction is
αs(MZ) = 0.1166 ± 0.0019 (stat.)+0.0024
−0.0033 (exp.)+0.0057
−0.0044 (th.) ,
12
in good agreement with the world average [25]. The value of αs as a function of Q is in
good agreement, over a wide range of Q, with the running of αs as predicted by QCD.
Acknowledgements
We thank the DESY Directorate for their strong support and encouragement. The re-
markable achievements of the HERA machine group were essential for the successful
completion of this work and are greatly appreciated. We would like to thank D. Grau-
denz, M. Seymour and H. Spiesberger for valuable discussions and help in running their
NLO programs.
References
[1] ZEUS Collaboration, M. Derrick et al., Phys. Lett. B 363 (1995) 201.
[2] See e.g. J.C. Collins, D.E. Soper and G. Sterman, in Perturbative Quantum Chro-
modynamics, edited by A.H. Mueller, World Scientific, Singapore (1989), p. 1 and
references therein.
[3] V.N. Gribov and L.N. Lipatov, Sov. J. Nucl. Phys. 15 (1972) 438;
L.N. Lipatov, Sov. J. Nucl. Phys. 20 (1975) 94;
Y.L. Dokshitzer, Sov. Phys. JETP 46 (1977) 641;
G. Altarelli and G. Parisi, Nucl. Phys. B 126 (1977) 298.
[4] S.D. Ellis, Z. Kunszt and D.E. Soper, Phys. Rev. D 40 (1989) 2188 and Phys. Rev.
Lett. 69 (1992) 1496;
Z. Kunszt and D.E. Soper, Phys. Rev. D 46 (1992) 192;
W.T. Giele and E.W.N. Glover, Phys. Rev. D 46 (1992) 1980;
W.T. Giele, E.W.N. Glover and D.A. Kosower, Nucl. Phys. B 403 (1993) 633;
S. Frixione, Z. Kunszt and A. Signer, Nucl. Phys. B 467 (1996) 399;
Z. Nagy and Z. Trocsanyi, Nucl. Phys. B 486 (1997) 189.
[5] S. Catani and M. H. Seymour, Nucl. Phys. B 485 (1997) 291 and Erratum B 510
(1997) 503.
[6] E. Mirkes and D. Zeppenfeld, Phys. Lett. B 380 (1996) 205;
E. Mirkes, TTP-97-39 (hep-ph/9711224).
[7] D. Graudenz, hep-ph/9710244.
[8] B. Potter, Comp. Phys. Comm. 119 (1999) 45.
13
[9] ZEUS Collaboration, U. Holm (ed.), The ZEUS Detector, Status Report (unpub-
lished), DESY, 1993.
[10] M. Derrick et al., Nucl. Instr. and Meth. A 309 (1991) 77;
A. Andresen et al., Nucl. Instr. and Meth. A 309 (1991) 101;
A. Caldwell et al., Nucl. Instr. and Meth. A 321 (1992) 356;
A. Bernstein et al., Nucl. Instr. and Meth. A 336 (1993) 23.
[11] N. Harnew et al., Nucl. Instr. and Meth. A 279 (1989) 290;
B. Foster et al., Nucl. Phys. B (Proc. Suppl.) 32 (1993) 181;
B. Foster et al., Nucl. Instr. and Meth. A 338 (1994) 254.
[12] J. Andruszkow et al., DESY 92-066 (1992);
ZEUS Collaboration, M. Derrick et al., Z. Phys. C 63 (1994) 391.
[13] K. Kwiatkowski, H. Spiesberger and H.-J. Mohring, Comp. Phys. Comm. 69 (1992)
155.
[14] K. Charchu la, G.A. Schuler, and H. Spiesberger, Comp. Phys. Comm. 81 (1994) 381.
[15] Y. Azimov et al., Phys. Lett. B 165 (1985) 147;
G. Gustafson, Phys. Lett. B 175 (1986) 453;
G. Gustafson and U. Petersson, Nucl. Phys. B 306 (1988) 746;
B. Andersson, G. Gustafson and L. Lonnblad, Z. Phys. C 43 (1989) 625.
[16] L. Lonnblad, in Proc. Workshop on Monte Carlo Generators for HERA Physics, Apr.
1998, eds. A.T. Doyle, G. Grindhammer, G. Ingelman and H. Jung, p. 47, Hamburg,
Germany, DESY (1999).
[17] L. Lonnblad, Comp. Phys. Comm. 71 (1992) 15; Z. Phys. C 65 (1995) 285.
[18] G. Ingelman, A. Edin and J. Rathsman, Comp. Phys. Comm. 101 (1997) 108.
[19] B. Andersson et al., Phys. Rep. 97 (1983) 31.
[20] H.-U. Bengtsson and T. Sjostrand, Comp. Phys. Comm. 46 (1987) 43;
T. Sjostrand, Comp. Phys. Comm. 82 (1994) 74.
[21] G. Marchesini et al., Comp. Phys. Comm. 67 (1992) 465.
[22] B.R. Webber, Nucl. Phys. B 238 (1984) 492.
[23] R. Brun et al., CERN-DD/EE/84-1 (1987).
[24] R.K. Ellis, D.A. Ross and A.E. Terrano, Nucl. Phys. B 178 (1981) 421.
14
[25] Particle Data Group, D.E. Groom et al., Eur. Phys. J. C 15 (2000) 1.
[26] M. Botje, Eur. Phys. J. C 14 (2000) 285.
[27] ZEUS Collaboration, J. Breitweg et al., Eur. Phys. J. C 11 (1999) 447.
[28] S. Bentvelsen, J. Engelen, and P. Kooijman, in Proc. Workshop on Physics at HERA,
Oct. 1991, Volume 1, W. Buchmuller and G. Ingelman (eds.), DESY (1992), p. 23;
K. C. Hoeger, ibid., p. 43.
[29] S. Catani et al., Nucl. Phys. B 406 (1993) 187;
S.D. Ellis and D.E. Soper, Phys. Rev. D 48 (1993) 3160.
[30] R.P. Feynman, Photon-Hadron Interactions, Benjamin, (1972);
K.H. Streng, T.F. Walsh and P.M. Zerwas, Z. Phys. C 2 (1979) 237.
[31] J. Huth et al., in Proc. of the 1990 DPF Summer Study on High Energy Physics, ed.
E.L. Berger, p. 134, Snowmass, Colorado, World Scientific (1992).
[32] ZEUS Collaboration, J. Breitweg et al., Eur. Phys. J. C 8 (1999) 367.
[33] E. Tassi, Ph.D. Thesis, University of Hamburg (2001), in preparation.
[34] M. Klasen and G. Kramer, Phys. Lett. B 366 (1996) 385;
S. Frixione and G. Ridolfi, Nucl. Phys. B 507 (1997) 315;
B. Potter, Comp. Phys. Comm. 133 (2000) 105.
[35] H.L. Lai et al., Phys. Rev. D 55 (1997) 1280.
[36] A.D. Martin et al., Eur. Phys. J. C 4 (1998) 463.
[37] S. Bethke, J. Phys. G26 (2000) R27.
[38] H1 Collaboration, C. Adloff et al., DESY 00-145 (2000) and DESY 00-181 (2000).
15
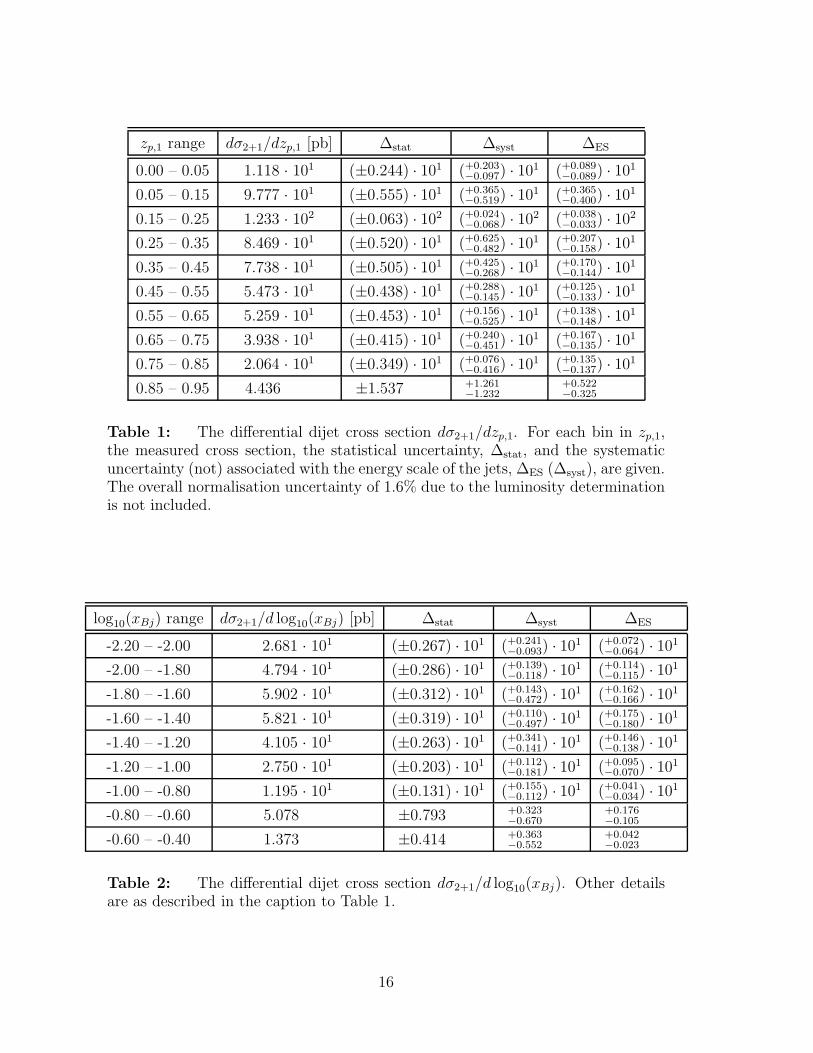
zp,1 range dσ2+1/dzp,1 [pb] ∆stat ∆syst ∆ES
0.00 – 0.05 1.118 · 101 (±0.244) · 101 (+0.203−0.097) · 101 (+0.089
−0.089) · 101
0.05 – 0.15 9.777 · 101 (±0.555) · 101 (+0.365−0.519) · 101 (+0.365
−0.400) · 101
0.15 – 0.25 1.233 · 102 (±0.063) · 102 (+0.024−0.068) · 102 (+0.038
−0.033) · 102
0.25 – 0.35 8.469 · 101 (±0.520) · 101 (+0.625−0.482) · 101 (+0.207
−0.158) · 101
0.35 – 0.45 7.738 · 101 (±0.505) · 101 (+0.425−0.268) · 101 (+0.170
−0.144) · 101
0.45 – 0.55 5.473 · 101 (±0.438) · 101 (+0.288−0.145) · 101 (+0.125
−0.133) · 101
0.55 – 0.65 5.259 · 101 (±0.453) · 101 (+0.156−0.525) · 101 (+0.138
−0.148) · 101
0.65 – 0.75 3.938 · 101 (±0.415) · 101 (+0.240−0.451) · 101 (+0.167
−0.135) · 101
0.75 – 0.85 2.064 · 101 (±0.349) · 101 (+0.076−0.416) · 101 (+0.135
−0.137) · 101
0.85 – 0.95 4.436 ±1.537 +1.261−1.232
+0.522−0.325
Table 1: The differential dijet cross section dσ2+1/dzp,1. For each bin in zp,1,the measured cross section, the statistical uncertainty, ∆stat, and the systematicuncertainty (not) associated with the energy scale of the jets, ∆ES (∆syst), are given.The overall normalisation uncertainty of 1.6% due to the luminosity determinationis not included.
log10(xBj) range dσ2+1/d log10(xBj) [pb] ∆stat ∆syst ∆ES
-2.20 – -2.00 2.681 · 101 (±0.267) · 101 (+0.241−0.093) · 101 (+0.072
−0.064) · 101
-2.00 – -1.80 4.794 · 101 (±0.286) · 101 (+0.139−0.118) · 101 (+0.114
−0.115) · 101
-1.80 – -1.60 5.902 · 101 (±0.312) · 101 (+0.143−0.472) · 101 (+0.162
−0.166) · 101
-1.60 – -1.40 5.821 · 101 (±0.319) · 101 (+0.110−0.497) · 101 (+0.175
−0.180) · 101
-1.40 – -1.20 4.105 · 101 (±0.263) · 101 (+0.341−0.141) · 101 (+0.146
−0.138) · 101
-1.20 – -1.00 2.750 · 101 (±0.203) · 101 (+0.112−0.181) · 101 (+0.095
−0.070) · 101
-1.00 – -0.80 1.195 · 101 (±0.131) · 101 (+0.155−0.112) · 101 (+0.041
−0.034) · 101
-0.80 – -0.60 5.078 ±0.793 +0.323−0.670
+0.176−0.105
-0.60 – -0.40 1.373 ±0.414 +0.363−0.552
+0.042−0.023
Table 2: The differential dijet cross section dσ2+1/d log10(xBj). Other detailsare as described in the caption to Table 1.
16
log10(ξ) range dσ2+1/d log10(ξ) [pb] ∆stat ∆syst ∆ES
-2.1875 – -1.8750 3.386 ±0.939 +0.970−0.736
+0.093−0.078
-1.8750 – -1.5625 2.726 · 101 (±0.179) · 101 (+0.126−0.045) · 101 (+0.021
−0.037) · 101
-1.5625 – -1.2500 6.379 · 101 (±0.266) · 101 (+0.085−0.334) · 101 (+0.147
−0.136) · 101
-1.2500 – -0.9375 5.997 · 101 (±0.260) · 101 (+0.156−0.224) · 101 (+0.199
−0.189) · 101
-0.9375 – -0.6250 2.232 · 101 (±0.142) · 101 (+0.105−0.154) · 101 (+0.126
−0.108) · 101
-0.6250 – -0.3125 2.434 ±0.400 +0.305−0.229
+0.177−0.123
Table 3: The differential dijet cross section dσ2+1/d log10(ξ). Other details areas described in the caption to Table 1.
Mjj range [GeV] dσ2+1/dMjj [pb/GeV] ∆stat ∆syst ∆ES
10.00 – 16.00 7.462 · 10−1 (±0.642) · 10−1 (+0.562−1.434) · 10−1 (+0.016
−0.005) · 10−1
16.00 – 22.00 2.404 ±0.122 +0.055−0.055
+0.034−0.035
22.00 – 28.00 2.127 ±0.109 +0.048−0.041
+0.057−0.053
28.00 – 35.00 1.272 ±0.077 +0.060−0.038
+0.046−0.042
35.00 – 45.00 7.494 · 10−1 (±0.497) · 10−1 (+0.090−0.309) · 10−1 (+0.256
−0.246) · 10−1
45.00 – 60.00 3.430 · 10−1 (±0.284) · 10−1 (+0.100−0.484) · 10−1 (+0.270
−0.195) · 10−1
60.00 – 80.00 9.605 · 10−2 (±1.272) · 10−2 (+0.326−0.419) · 10−2 (+0.619
−0.709) · 10−2
80.00 – 120.00 1.578 · 10−2 (±0.353) · 10−2 (+0.122−0.219) · 10−2 (+0.117
−0.145) · 10−2
Table 4: The differential dijet cross section dσ2+1/dMjj. Other details are asdescribed in the caption to Table 1.
Ejet,1T,B range [GeV] dσ2+1/dEjet,1
T,B [pb/GeV] ∆stat ∆syst ∆ES
5.00 – 8.00 2.956 ±0.175 +0.154−0.243
+0.072−0.081
8.00 – 12.00 5.977 ±0.238 +0.105−0.201
+0.094−0.090
12.00 – 16.00 2.736 ±0.154 +0.039−0.033
+0.083−0.081
16.00 – 20.00 1.327 ±0.103 +0.055−0.030
+0.072−0.026
20.00 – 24.00 8.165 · 10−1 (±0.801) · 10−1 (+0.096−0.397) · 10−1 (+0.245
−0.566) · 10−1
24.00 – 32.00 2.848 · 10−1 (±0.333) · 10−1 (+0.077−0.355) · 10−1 (+0.236
−0.183) · 10−1
32.00 – 50.00 5.960 · 10−2 (±0.879) · 10−2 (+0.997−0.449) · 10−2 (+0.572
−0.497) · 10−2
50.00 – 80.00 3.991 · 10−3 (±1.203) · 10−3 (+1.086−0.902) · 10−3 (+0.548
−0.472) · 10−3
Table 5: The differential dijet cross section dσ2+1/dEjet,1T,B . Other details are as
described in the caption to Table 1.
17
ηjet,1B range dσ2+1/dηjet,1
B [pb] ∆stat ∆syst ∆ES
-1.00 – -0.50 3.051 ±0.419 +0.360−0.277
+0.155−0.141
-0.50 – 0.00 1.170 · 101 (±0.084) · 101 (+0.025−0.158) · 101 (+0.060
−0.051) · 101
0.00 – 0.50 3.260 · 101 (±0.154) · 101 (+0.116−0.105) · 101 (+0.102
−0.091) · 101
0.50 – 1.00 3.204 · 101 (±0.151) · 101 (+0.084−0.147) · 101 (+0.068
−0.075) · 101
1.00 – 1.50 2.054 · 101 (±0.119) · 101 (+0.083−0.104) · 101 (+0.046
−0.049) · 101
1.50 – 2.00 9.035 ±0.748 +0.570−0.742
+0.229−0.194
2.00 – 2.50 2.561 ±0.410 +0.491−0.324
+0.061−0.058
Table 6: The differential dijet cross section dσ2+1/dηjet,1B . Other details are as
described in the caption to Table 1.
Ejet,2T,B range [GeV] dσ2+1/dEjet,2
T,B [pb/GeV] ∆stat ∆syst ∆ES
5.00 – 8.00 2.775 ±0.168 +0.098−0.235
+0.074−0.082
8.00 – 12.00 5.971 ±0.240 +0.142−0.154
+0.103−0.092
12.00 – 16.00 2.762 ±0.152 +0.074−0.071
+0.088−0.076
16.00 – 20.00 1.403 ±0.105 +0.011−0.034
+0.062−0.050
20.00 – 24.00 7.437 · 10−1 (±0.763) · 10−1 (+0.144−1.274) · 10−1 (+0.397
−0.406) · 10−1
24.00 – 32.00 2.995 · 10−1 (±0.339) · 10−1 (+0.070−0.507) · 10−1 (+0.182
−0.198) · 10−1
32.00 – 50.00 6.834 · 10−2 (±0.966) · 10−2 (+0.641−0.239) · 10−2 (+0.551
−0.452) · 10−2
50.00 – 80.00 3.189 · 10−3 (±1.205) · 10−3 (+0.981−0.621) · 10−3 (+0.203
−0.251) · 10−3
Table 7: The differential dijet cross section dσ2+1/dEjet,2T,B . Other details are as
described in the caption to Table 1.
ηjet,2B range dσ2+1/dηjet,2
B [pb] ∆stat ∆syst ∆ES
-2.00 – -1.50 2.507 ±0.458 +0.219−0.670
+0.202−0.190
-1.50 – -1.00 1.054 · 101 (±0.084) · 101 (+0.043−0.084) · 101 (+0.069
−0.067) · 101
-1.00 – -0.50 3.328 · 101 (±0.151) · 101 (+0.080−0.170) · 101 (+0.154
−0.134) · 101
-0.50 – 0.00 3.735 · 101 (±0.163) · 101 (+0.067−0.130) · 101 (+0.073
−0.066) · 101
0.00 – 0.50 1.885 · 101 (±0.112) · 101 (+0.062−0.066) · 101 (+0.012
−0.014) · 101
0.50 – 1.00 6.868 ±0.627 +0.504−0.252
+0.070−0.080
1.00 – 1.50 1.914 ±0.349 +0.288−0.273
+0.066−0.057
Table 8: The differential dijet cross section dσ2+1/dηjet,2B . Other details are as
described in the caption to Table 1.
18

Q2 range [GeV2] dσtot/dQ2 [pb/GeV2] ∆stat ∆syst
470. – 800. 1.217 ±0.011 +0.015−0.006
800. – 1500. 2.800 · 10−1 (±0.033) · 10−1 (+0.023−0.019) · 10−1
1500. – 2500. 6.509 · 10−2 (±0.130) · 10−2 (+0.103−0.090) · 10−2
2500. – 5000. 1.230 · 10−2 (±0.036) · 10−2 (+0.022−0.020) · 10−2
5000. – 20000. 7.378 · 10−4 (±0.400) · 10−4 (+0.051−0.163) · 10−4
Table 9: The differential inclusive cross section dσtot/dQ2. Other details are asdescribed in the caption to Table 1.
Q2 range [GeV2] dσ2+1/dQ2 [pb/GeV2] ∆stat ∆syst ∆ES
470. – 800. 8.061 · 10−2 (±0.306) · 10−2 (+0.212−0.294) · 10−2 (+0.287
−0.256) · 10−2
800. – 1500. 2.415 · 10−2 (±0.105) · 10−2 (+0.039−0.061) · 10−2 (+0.071
−0.072) · 10−2
1500. – 2500. 6.802 · 10−3 (±0.453) · 10−3 (+0.300−0.343) · 10−3 (+0.159
−0.160) · 10−3
2500. – 5000. 1.637 · 10−3 (±0.139) · 10−3 (+0.046−0.124) · 10−3 (+0.033
−0.028) · 10−3
5000. – 20000. 1.246 · 10−4 (±0.170) · 10−4 (+0.006−0.139) · 10−4 (+0.013
−0.018) · 10−4
Table 10: The differential dijet cross section dσ2+1/dQ2. Other details are asdescribed in the caption to Table 1.
Q2 range [GeV2] R2+1 ∆stat ∆syst ∆ES
470. – 800. 6.625 · 10−2 (±0.245) · 10−2 (+0.168−0.278) · 10−2 (+0.236
−0.210) · 10−2
800. – 1500. 8.627 · 10−2 (±0.362) · 10−2 (+0.144−0.267) · 10−2 (+0.255
−0.256) · 10−2
1500. – 2500. 1.045 · 10−1 (±0.066) · 10−1 (+0.043−0.057) · 10−1 (+0.024
−0.025) · 10−1
2500. – 5000. 1.331 · 10−1 (±0.106) · 10−1 (+0.039−0.119) · 10−1 (+0.027
−0.023) · 10−1
5000. – 20000. 1.688 · 10−1 (±0.211) · 10−1 (+0.008−0.185) · 10−1 (+0.017
−0.024) · 10−1
Table 11: The dijet fraction R2+1(Q2). Other details are as described in thecaption to Table 1.
19
zp,1 range < zp,1 > dσNLO2+1 /dzp,1 [pb] ∆µr
∆αs∆exp
pdf ∆theopdf Chad ± ∆Chad
0.00 – 0.05 0.04 1.854 · 101 (+0.256−0.197) · 101 (+0.147
−0.143) · 101 (±0.105) · 101 (+0.023−0.027) · 101 1.38± 0.04
0.05 – 0.15 0.10 1.172 · 102 (+0.100−0.088) · 102 (+0.078
−0.082) · 102 (±0.060) · 102 (+0.014−0.014) · 102 1.10± 0.01
0.15 – 0.25 0.20 1.167 · 102 (+0.056−0.062) · 102 (+0.070
−0.075) · 102 (±0.067) · 102 (+0.015−0.014) · 102 1.08± 0.04
0.25 – 0.35 0.30 9.100 · 101 (+0.351−0.432) · 101 (+0.542
−0.577) · 101 (±0.529) · 101 (+0.120−0.118) · 101 1.07± 0.01
0.35 – 0.45 0.40 7.481 · 101 (+0.280−0.349) · 101 (+0.454
−0.477) · 101 (±0.421) · 101 (+0.100−0.097) · 101 1.07± 0.02
0.45 – 0.55 0.50 6.667 · 101 (+0.275−0.327) · 101 (+0.403
−0.425) · 101 (±0.361) · 101 (+0.089−0.085) · 101 1.09± 0.02
0.55 – 0.65 0.60 5.711 · 101 (+0.185−0.250) · 101 (+0.339
−0.356) · 101 (±0.349) · 101 (+0.074−0.070) · 101 1.09± 0.01
0.65 – 0.75 0.70 4.858 · 101 (+0.219−0.248) · 101 (+0.294
−0.308) · 101 (±0.309) · 101 (+0.061−0.058) · 101 1.15± 0.03
0.75 – 0.85 0.79 2.776 · 101 (+0.215−0.194) · 101 (+0.202
−0.193) · 101 (±0.168) · 101 (+0.037−0.036) · 101 1.28± 0.00
0.85 – 0.95 0.88 4.466 +0.573−0.445
+0.377−0.318 ±0.265 +0.049
−0.072 1.27± 0.13
Table 12: The QCD predictions for the differential dijet cross section as a function of zp,1. For each bin in zp,1 thefollowing quantities are given: the weighted mean value < zp,1 >, the pure NLO QCD cross section, the uncertaintydue to the renormalization scale, ∆µr
, the uncertainty due to αs(MZ), ∆αs, the uncertainty due to the proton PDFs
(experimental), ∆exppdf , the uncertainty due to the proton PDFs (theoretical), ∆theo
pdf , and the hadronisation correction, Chad,with its associated uncertainty, ∆Chad.
20
log10(xBj) range < log10(xBj) > dσNLO2+1 /d log10(xBj) [pb] ∆µr
∆αs∆exp
pdf ∆theopdf Chad ± ∆Chad
-2.2 – -2.0 -2.08 2.509 · 101 (+0.184−0.173) · 101 (+0.121
−0.157) · 101 (±0.140) · 101 (+0.036−0.040) · 101 1.04± 0.02
-2.0 – -1.8 -1.90 5.025 · 101 (+0.285−0.297) · 101 (+0.246
−0.311) · 101 (±0.248) · 101 (+0.064−0.072) · 101 1.06± 0.01
-1.8 – -1.6 -1.70 6.477 · 101 (+0.336−0.361) · 101 (+0.363
−0.419) · 101 (±0.256) · 101 (+0.076−0.078) · 101 1.08± 0.02
-1.6 – -1.4 -1.50 6.403 · 101 (+0.311−0.341) · 101 (+0.423
−0.436) · 101 (±0.205) · 101 (+0.079−0.068) · 101 1.10± 0.01
-1.4 – -1.2 -1.31 5.003 · 101 (+0.247−0.266) · 101 (+0.377
−0.353) · 101 (±0.165) · 101 (+0.072−0.059) · 101 1.14± 0.01
-1.2 – -1.0 -1.11 2.935 · 101 (+0.148−0.155) · 101 (+0.231
−0.201) · 101 (±0.122) · 101 (+0.044−0.037) · 101 1.15± 0.02
-1.0 – -0.8 -0.91 1.391 · 101 (+0.070−0.071) · 101 (+0.100
−0.083) · 101 (±0.064) · 101 (+0.017−0.017) · 101 1.13± 0.01
-0.8 – -0.6 -0.72 5.604 +0.283−0.282
+0.322−0.263 ±0.244 +0.041
−0.069 1.11± 0.01
-0.6 – -0.4 -0.52 1.650 +0.088−0.082
+0.061−0.051 ±0.062 +0.000
−0.023 1.14± 0.05
Table 13: The QCD predictions for the differential dijet cross section as a function of log10(xBj). Other details are asdescribed in the caption to Table 12.
log10(ξ) range < log10(ξ) > dσNLO2+1 /d log10(ξ) [pb] ∆µr
∆αs∆exp
pdf ∆theopdf Chad ± ∆Chad
-2.1875 – -1.8750 -1.94 2.825 +0.737−0.503
+0.233−0.258 ±0.166 +0.047
−0.051 1.18± 0.05
-1.8750 – -1.5625 -1.68 2.951 · 101 (+0.363−0.290) · 101 (+0.167
−0.205) · 101 (±0.180) · 101 (+0.043−0.048) · 101 1.09± 0.01
-1.5625 – -1.2500 -1.40 6.736 · 101 (+0.416−0.416) · 101 (+0.372
−0.434) · 101 (±0.318) · 101 (+0.075−0.076) · 101 1.06± 0.01
-1.2500 – -0.9375 -1.11 6.746 · 101 (+0.198−0.282) · 101 (+0.453
−0.448) · 101 (±0.273) · 101 (+0.085−0.069) · 101 1.11± 0.01
-0.9375 – -0.6250 -0.82 2.569 · 101 (+0.002−0.059) · 101 (+0.190
−0.157) · 101 (±0.162) · 101 (+0.041−0.040) · 101 1.14± 0.02
-0.6250 – -0.3125 -0.53 3.378 +0.000−0.059
+0.177−0.122 ±0.220 +0.027
−0.067 1.11± 0.06
Table 14: The QCD predictions for the differential dijet cross section as a function of log10(ξ). Other details are asdescribed in the caption to Table 12.
21
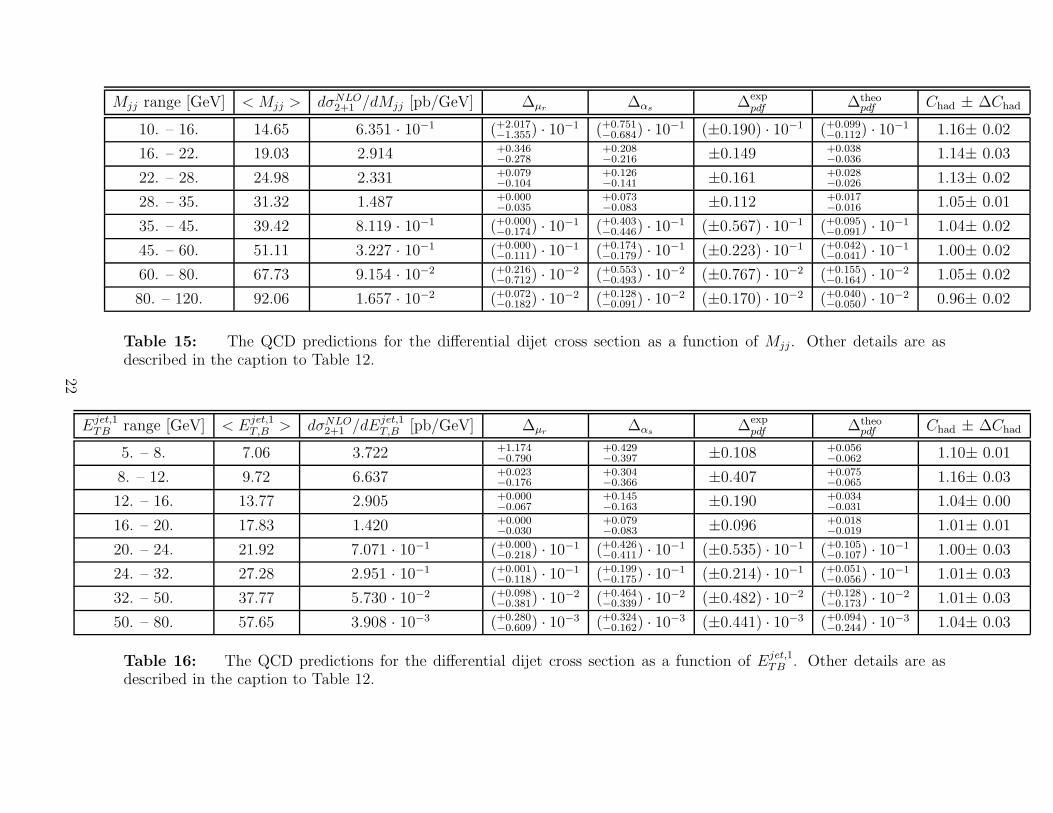
Mjj range [GeV] < Mjj > dσNLO2+1 /dMjj [pb/GeV] ∆µr
∆αs∆exp
pdf ∆theopdf Chad ± ∆Chad
10. – 16. 14.65 6.351 · 10−1 (+2.017−1.355) · 10−1 (+0.751
−0.684) · 10−1 (±0.190) · 10−1 (+0.099−0.112) · 10−1 1.16± 0.02
16. – 22. 19.03 2.914 +0.346−0.278
+0.208−0.216 ±0.149 +0.038
−0.036 1.14± 0.03
22. – 28. 24.98 2.331 +0.079−0.104
+0.126−0.141 ±0.161 +0.028
−0.026 1.13± 0.02
28. – 35. 31.32 1.487 +0.000−0.035
+0.073−0.083 ±0.112 +0.017
−0.016 1.05± 0.01
35. – 45. 39.42 8.119 · 10−1 (+0.000−0.174) · 10−1 (+0.403
−0.446) · 10−1 (±0.567) · 10−1 (+0.095−0.091) · 10−1 1.04± 0.02
45. – 60. 51.11 3.227 · 10−1 (+0.000−0.111) · 10−1 (+0.174
−0.179) · 10−1 (±0.223) · 10−1 (+0.042−0.041) · 10−1 1.00± 0.02
60. – 80. 67.73 9.154 · 10−2 (+0.216−0.712) · 10−2 (+0.553
−0.493) · 10−2 (±0.767) · 10−2 (+0.155−0.164) · 10−2 1.05± 0.02
80. – 120. 92.06 1.657 · 10−2 (+0.072−0.182) · 10−2 (+0.128
−0.091) · 10−2 (±0.170) · 10−2 (+0.040−0.050) · 10−2 0.96± 0.02
Table 15: The QCD predictions for the differential dijet cross section as a function of Mjj. Other details are asdescribed in the caption to Table 12.
Ejet,1TB range [GeV] < Ejet,1
T,B > dσNLO2+1 /dEjet,1
T,B [pb/GeV] ∆µr∆αs
∆exppdf ∆theo
pdf Chad ± ∆Chad
5. – 8. 7.06 3.722 +1.174−0.790
+0.429−0.397 ±0.108 +0.056
−0.062 1.10± 0.01
8. – 12. 9.72 6.637 +0.023−0.176
+0.304−0.366 ±0.407 +0.075
−0.065 1.16± 0.03
12. – 16. 13.77 2.905 +0.000−0.067
+0.145−0.163 ±0.190 +0.034
−0.031 1.04± 0.00
16. – 20. 17.83 1.420 +0.000−0.030
+0.079−0.083 ±0.096 +0.018
−0.019 1.01± 0.01
20. – 24. 21.92 7.071 · 10−1 (+0.000−0.218) · 10−1 (+0.426
−0.411) · 10−1 (±0.535) · 10−1 (+0.105−0.107) · 10−1 1.00± 0.03
24. – 32. 27.28 2.951 · 10−1 (+0.001−0.118) · 10−1 (+0.199
−0.175) · 10−1 (±0.214) · 10−1 (+0.051−0.056) · 10−1 1.01± 0.03
32. – 50. 37.77 5.730 · 10−2 (+0.098−0.381) · 10−2 (+0.464
−0.339) · 10−2 (±0.482) · 10−2 (+0.128−0.173) · 10−2 1.01± 0.03
50. – 80. 57.65 3.908 · 10−3 (+0.280−0.609) · 10−3 (+0.324
−0.162) · 10−3 (±0.441) · 10−3 (+0.094−0.244) · 10−3 1.04± 0.03
Table 16: The QCD predictions for the differential dijet cross section as a function of Ejet,1TB . Other details are as
described in the caption to Table 12.
22
ηjet,1B range < ηjet,1
B > dσNLO2+1 /dηjet,1
B [pb] ∆µr∆αs
∆exppdf ∆theo
pdf Chad ± ∆Chad
-1.0 – -0.5 -0.68 5.156 +0.305−0.294
+0.335−0.316 ±0.257 +0.054
−0.046 1.47± 0.05
-0.5 – 0.0 -0.21 1.972 · 101 (+0.066−0.086) · 101 (+0.115
−0.120) · 101 (±0.109) · 101 (+0.024−0.022) · 101 1.34± 0.05
0.0 – 0.5 0.26 3.596 · 101 (+0.126−0.163) · 101 (+0.205
−0.222) · 101 (±0.197) · 101 (+0.046−0.044) · 101 1.11± 0.01
0.5 – 1.0 0.73 3.136 · 101 (+0.152−0.168) · 101 (+0.194
−0.205) · 101 (±0.171) · 101 (+0.041−0.041) · 101 1.02± 0.02
1.0 – 1.5 1.22 1.888 · 101 (+0.144−0.132) · 101 (+0.129
−0.134) · 101 (±0.099) · 101 (+0.025−0.026) · 101 0.99± 0.04
1.5 – 2.0 1.71 8.064 +0.884−0.724
+0.596−0.617 ±0.413 +0.106
−0.112 1.00± 0.01
2.0 – 2.5 2.18 2.406 +0.384−0.287
+0.197−0.204 ±0.120 +0.031
−0.033 1.08± 0.01
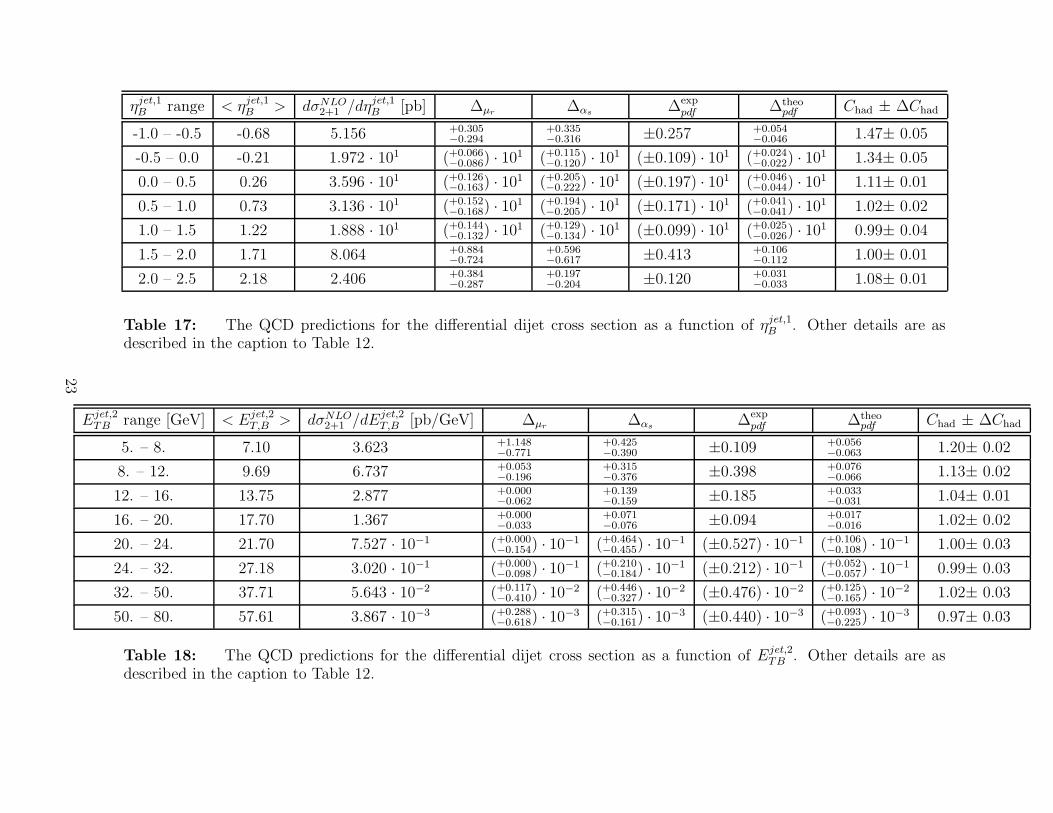
Table 17: The QCD predictions for the differential dijet cross section as a function of ηjet,1B . Other details are as
described in the caption to Table 12.
Ejet,2TB range [GeV] < Ejet,2
T,B > dσNLO2+1 /dEjet,2
T,B [pb/GeV] ∆µr∆αs
∆exppdf ∆theo
pdf Chad ± ∆Chad
5. – 8. 7.10 3.623 +1.148−0.771
+0.425−0.390 ±0.109 +0.056
−0.063 1.20± 0.02
8. – 12. 9.69 6.737 +0.053−0.196
+0.315−0.376 ±0.398 +0.076
−0.066 1.13± 0.02
12. – 16. 13.75 2.877 +0.000−0.062
+0.139−0.159 ±0.185 +0.033
−0.031 1.04± 0.01
16. – 20. 17.70 1.367 +0.000−0.033
+0.071−0.076 ±0.094 +0.017
−0.016 1.02± 0.02
20. – 24. 21.70 7.527 · 10−1 (+0.000−0.154) · 10−1 (+0.464
−0.455) · 10−1 (±0.527) · 10−1 (+0.106−0.108) · 10−1 1.00± 0.03
24. – 32. 27.18 3.020 · 10−1 (+0.000−0.098) · 10−1 (+0.210
−0.184) · 10−1 (±0.212) · 10−1 (+0.052−0.057) · 10−1 0.99± 0.03
32. – 50. 37.71 5.643 · 10−2 (+0.117−0.410) · 10−2 (+0.446
−0.327) · 10−2 (±0.476) · 10−2 (+0.125−0.165) · 10−2 1.02± 0.03
50. – 80. 57.61 3.867 · 10−3 (+0.288−0.618) · 10−3 (+0.315
−0.161) · 10−3 (±0.440) · 10−3 (+0.093−0.225) · 10−3 0.97± 0.03
Table 18: The QCD predictions for the differential dijet cross section as a function of Ejet,2TB . Other details are as
described in the caption to Table 12.
23
ηjet,2B range < ηjet,2
B > dσNLO2+1 /dηjet,2
B [pb] ∆µr∆αs
∆exppdf ∆theo
pdf Chad ± ∆Chad
-2.0 – -1.5 -1.69 4.973 +0.354−0.317
+0.343−0.309 ±0.264 +0.054
−0.051 1.51± 0.05
-1.5 – -1.0 -1.20 1.972 · 101 (+0.151−0.135) · 101 (+0.135
−0.133) · 101 (±0.104) · 101 (+0.024−0.022) · 101 1.40± 0.00
-1.0 – -0.5 -0.74 4.169 · 101 (+0.154−0.194) · 101 (+0.234
−0.258) · 101 (±0.238) · 101 (+0.051−0.048) · 101 1.21± 0.03
-0.5 – 0.0 -0.28 3.427 · 101 (+0.132−0.164) · 101 (+0.195
−0.216) · 101 (±0.180) · 101 (+0.044−0.043) · 101 0.99± 0.02
0.0 – 0.5 0.20 1.558 · 101 (+0.100−0.099) · 101 (+0.109
−0.110) · 101 (±0.077) · 101 (+0.023−0.024) · 101 0.92± 0.01
0.5 – 1.0 0.69 4.185 +0.459−0.377
+0.371−0.342 ±0.209 +0.071
−0.079 0.96± 0.00
1.0 – 1.5 1.19 9.857 · 10−1 (+2.051−1.459) · 10−1 (+1.041
−0.945) · 10−1 (±0.454) · 10−1 (+0.170−0.201) · 10−1 1.36± 0.03
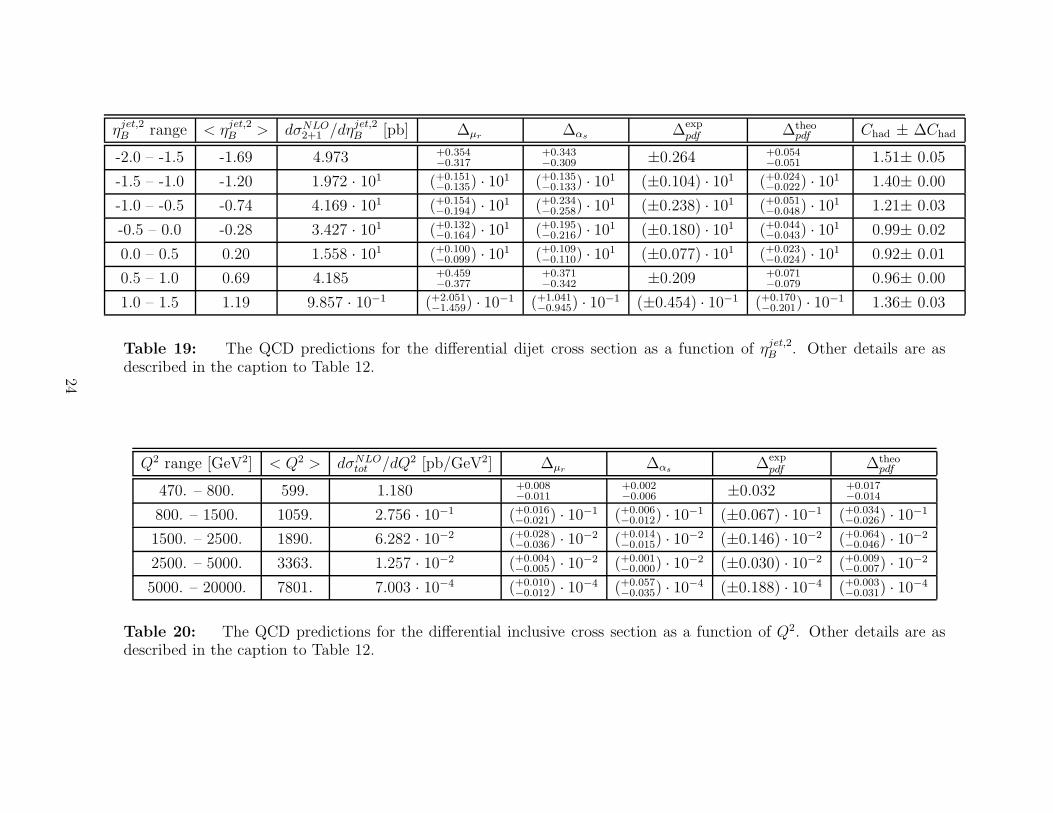
Table 19: The QCD predictions for the differential dijet cross section as a function of ηjet,2B . Other details are as
described in the caption to Table 12.
Q2 range [GeV2] < Q2 > dσNLOtot /dQ2 [pb/GeV2] ∆µr
∆αs∆exp
pdf ∆theopdf
470. – 800. 599. 1.180 +0.008−0.011
+0.002−0.006 ±0.032 +0.017
−0.014
800. – 1500. 1059. 2.756 · 10−1 (+0.016−0.021) · 10−1 (+0.006
−0.012) · 10−1 (±0.067) · 10−1 (+0.034−0.026) · 10−1
1500. – 2500. 1890. 6.282 · 10−2 (+0.028−0.036) · 10−2 (+0.014
−0.015) · 10−2 (±0.146) · 10−2 (+0.064−0.046) · 10−2
2500. – 5000. 3363. 1.257 · 10−2 (+0.004−0.005) · 10−2 (+0.001
−0.000) · 10−2 (±0.030) · 10−2 (+0.009−0.007) · 10−2
5000. – 20000. 7801. 7.003 · 10−4 (+0.010−0.012) · 10−4 (+0.057
−0.035) · 10−4 (±0.188) · 10−4 (+0.003−0.031) · 10−4
Table 20: The QCD predictions for the differential inclusive cross section as a function of Q2. Other details are asdescribed in the caption to Table 12.
24
Q2 range [GeV2] < Q2 > dσNLO2+1 /dQ2 [pb/GeV2] ∆µr
∆αs∆exp
pdf ∆theopdf Chad ± ∆Chad
470. – 800. 604. 8.985 · 10−2 (+0.583−0.577) · 10−2 (+0.539
−0.606) · 10−2 (±0.388) · 10−2 (+0.118−0.121) · 10−2 1.11± 0.01
800. – 1500. 1071. 2.597 · 10−2 (+0.128−0.139) · 10−2 (+0.167
−0.172) · 10−2 (±0.098) · 10−2 (+0.034−0.031) · 10−2 1.09± 0.01
1500. – 2500. 1901. 7.208 · 10−3 (+0.270−0.324) · 10−3 (+0.484
−0.460) · 10−3 (±0.263) · 10−3 (+0.095−0.080) · 10−3 1.07± 0.01
2500. – 5000. 3420. 1.734 · 10−3 (+0.051−0.067) · 10−3 (+0.114
−0.101) · 10−3 (±0.070) · 10−3 (+0.022−0.019) · 10−3 1.05± 0.01
5000. – 20000. 8095. 1.281 · 10−4 (+0.038−0.046) · 10−4 (+0.068
−0.057) · 10−4 (±0.055) · 10−4 (+0.008−0.014) · 10−4 1.04± 0.01
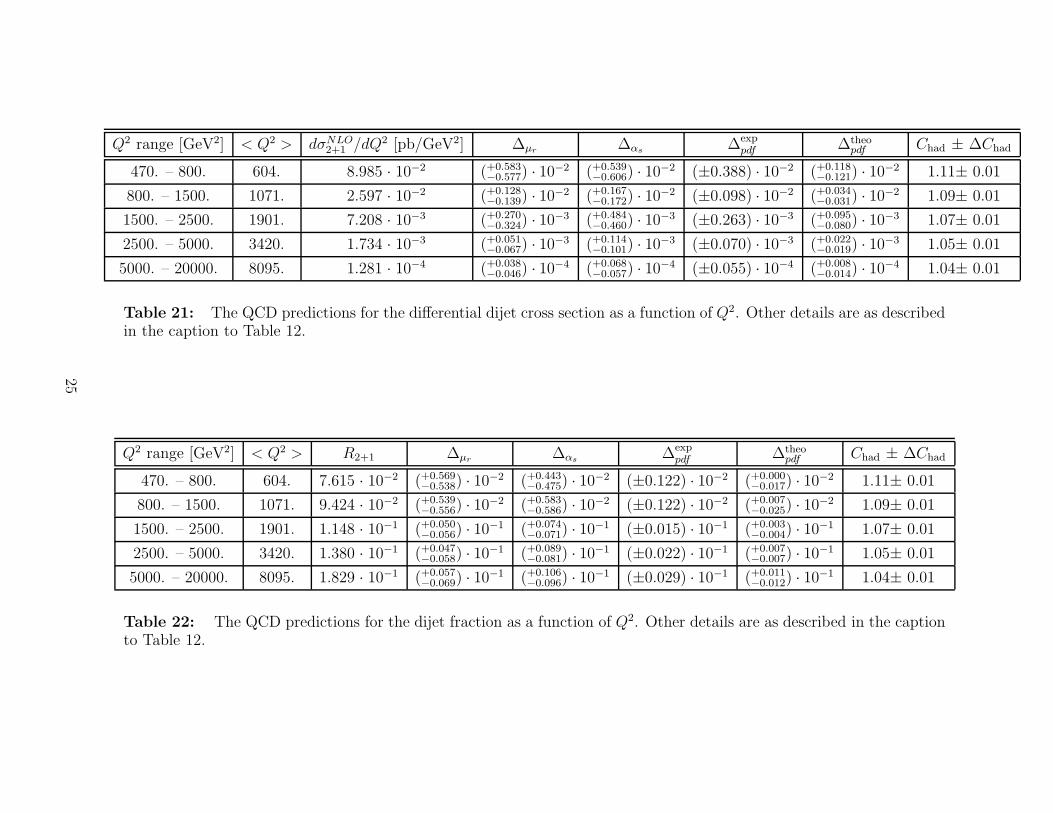
Table 21: The QCD predictions for the differential dijet cross section as a function of Q2. Other details are as describedin the caption to Table 12.
Q2 range [GeV2] < Q2 > R2+1 ∆µr∆αs
∆exppdf ∆theo
pdf Chad ± ∆Chad
470. – 800. 604. 7.615 · 10−2 (+0.569−0.538) · 10−2 (+0.443
−0.475) · 10−2 (±0.122) · 10−2 (+0.000−0.017) · 10−2 1.11± 0.01
800. – 1500. 1071. 9.424 · 10−2 (+0.539−0.556) · 10−2 (+0.583
−0.586) · 10−2 (±0.122) · 10−2 (+0.007−0.025) · 10−2 1.09± 0.01
1500. – 2500. 1901. 1.148 · 10−1 (+0.050−0.056) · 10−1 (+0.074
−0.071) · 10−1 (±0.015) · 10−1 (+0.003−0.004) · 10−1 1.07± 0.01
2500. – 5000. 3420. 1.380 · 10−1 (+0.047−0.058) · 10−1 (+0.089
−0.081) · 10−1 (±0.022) · 10−1 (+0.007−0.007) · 10−1 1.05± 0.01
5000. – 20000. 8095. 1.829 · 10−1 (+0.057−0.069) · 10−1 (+0.106
−0.096) · 10−1 (±0.029) · 10−1 (+0.011−0.012) · 10−1 1.04± 0.01
Table 22: The QCD predictions for the dijet fraction as a function of Q2. Other details are as described in the captionto Table 12.
25
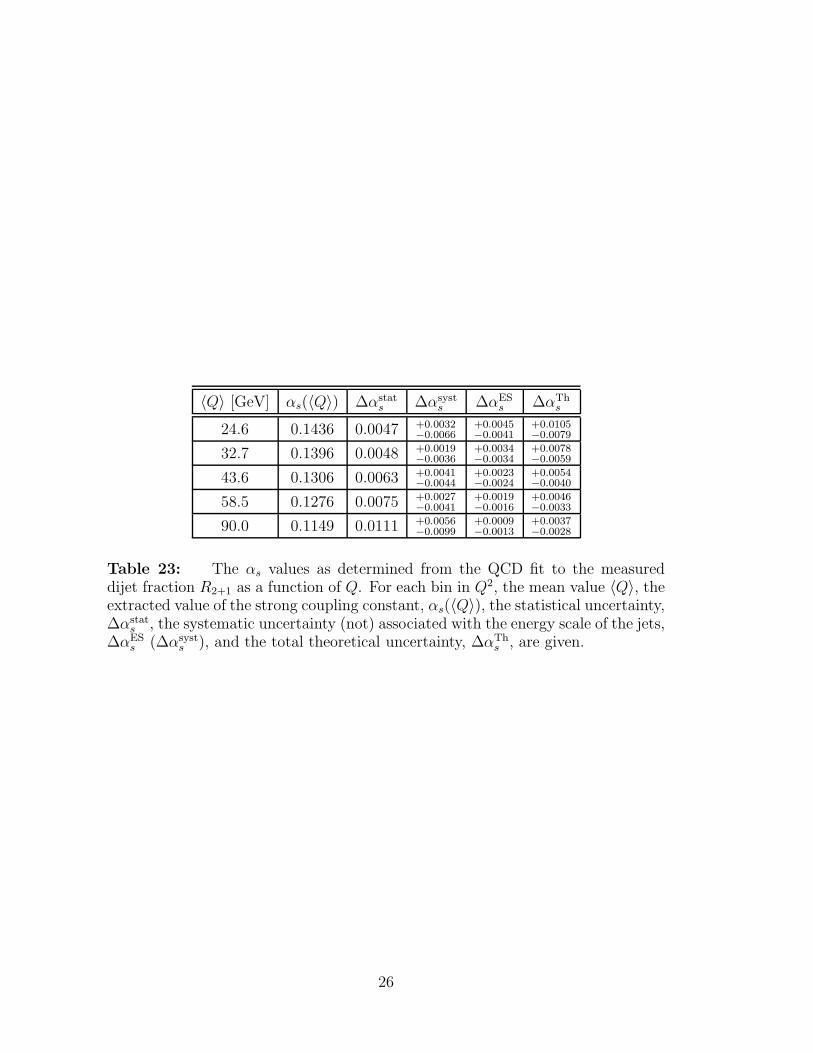
〈Q〉 [GeV] αs(〈Q〉) ∆αstats ∆αsyst
s ∆αESs ∆αTh
s
24.6 0.1436 0.0047 +0.0032−0.0066
+0.0045−0.0041
+0.0105−0.0079
32.7 0.1396 0.0048 +0.0019−0.0036
+0.0034−0.0034
+0.0078−0.0059
43.6 0.1306 0.0063 +0.0041−0.0044
+0.0023−0.0024
+0.0054−0.0040
58.5 0.1276 0.0075 +0.0027−0.0041
+0.0019−0.0016
+0.0046−0.0033
90.0 0.1149 0.0111 +0.0056−0.0099
+0.0009−0.0013
+0.0037−0.0028
Table 23: The αs values as determined from the QCD fit to the measureddijet fraction R2+1 as a function of Q. For each bin in Q2, the mean value 〈Q〉, theextracted value of the strong coupling constant, αs(〈Q〉), the statistical uncertainty,∆αstat
s , the systematic uncertainty (not) associated with the energy scale of the jets,∆αES
s (∆αsysts ), and the total theoretical uncertainty, ∆αTh
s , are given.
26
1
10
10 2
ZEUS
ZEUS 96-97
DISENT⊗ Had.DISENTMBFIT1MµR=µF=Q
a)dσ
2+1/
dzp,
1 (p
b)
0 0.2 0.4 0.6 0.8 1
zp,1
Rel
. diff
. 0.4
0
-0.4
1
10
10 2
b)
dσ2+
1/dl
og10
(xB
j) (p
b)-2 -1.5 -1 -0.5
log10(xBj)R
el. d
iff. 0.4
0
-0.4
10
10 2c)
dσ2+
1/dl
og10
(ξ)
(pb
)
-2 -1.5 -1 -0.5
log10(ξ)
Rel
. diff
. 0.4
0
-0.4
10-2
10-1
1
d)
dσ2+
1/dM
jj (
pb/G
eV)
20 40 60 80 100
Mjj(GeV)
Rel
. diff
. 0.4
0
-0.4
Cha
d 1.5
1.0 Cha
d 1.5
1.0
Cha
d 1.5
1.0 Cha
d 1.5
1.0
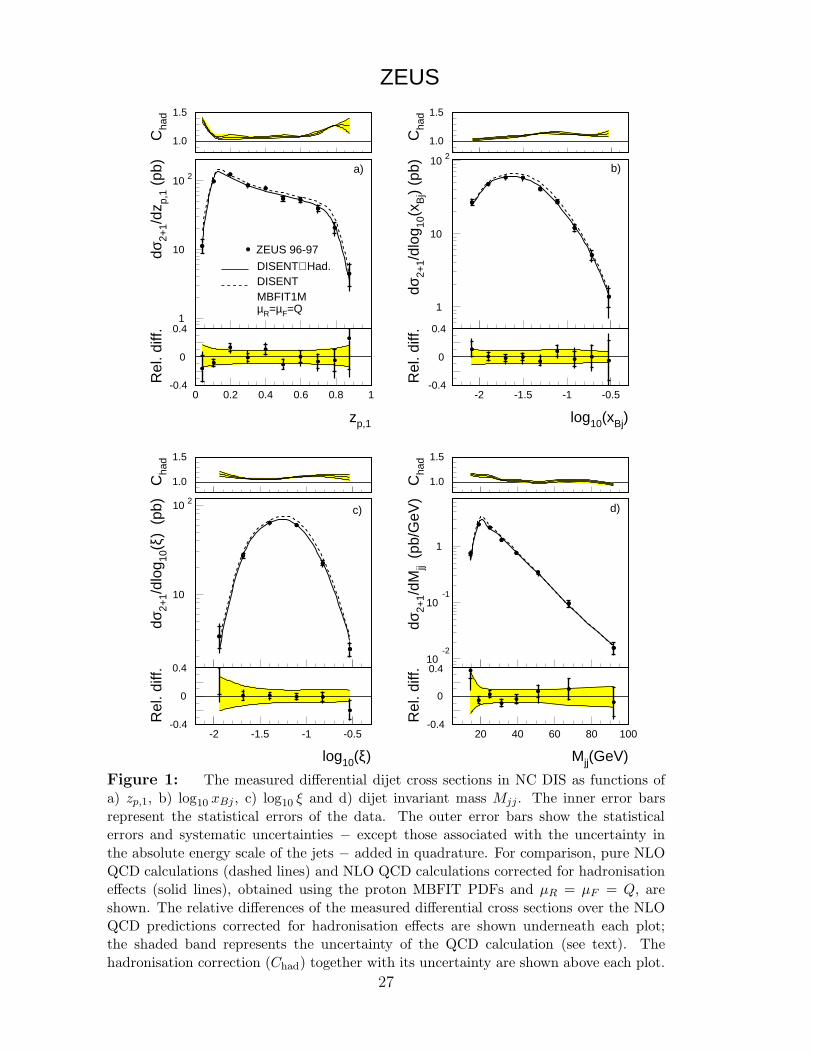
Figure 1: The measured differential dijet cross sections in NC DIS as functions of
a) zp,1, b) log10 xBj , c) log10 ξ and d) dijet invariant mass Mjj. The inner error bars
represent the statistical errors of the data. The outer error bars show the statistical
errors and systematic uncertainties − except those associated with the uncertainty in
the absolute energy scale of the jets − added in quadrature. For comparison, pure NLO
QCD calculations (dashed lines) and NLO QCD calculations corrected for hadronisation
effects (solid lines), obtained using the proton MBFIT PDFs and µR = µF = Q, are
shown. The relative differences of the measured differential cross sections over the NLO
QCD predictions corrected for hadronisation effects are shown underneath each plot;
the shaded band represents the uncertainty of the QCD calculation (see text). The
hadronisation correction (Chad) together with its uncertainty are shown above each plot.
27
10-3
10-2
10-1
1
10
ZEUS
ZEUS 96-97DISENT⊗ Had.DISENTMBFIT1MµR=µF=Q
a)
dσ2+
1/dE
jet,1
T,B
(pb
/GeV
)
0 20 40 60 80
Ejet,1
T,B (GeV)
Rel
. diff
. 0.4
0
-0.4
10
b)
dσ2+
1/dη
jet,1
B
(pb)
-1 0 1 2
ηjet,1
B
Rel
. diff
. 0.4
0
-0.4
10-3
10-2
10-1
1
10 c)
dσ2+
1/dE
jet,2
T,B
(pb
/GeV
)
0 20 40 60
Ejet,2
T,B (GeV)
Rel
. diff
. 0.4
0
-0.4
1
10
d)
dσ2+
1/dη
jet,2
B
(pb)
-2 -1 0 1
ηjet,2
B
Rel
. diff
. 0.8
0
-0.8
Cha
d 1.5
1.0 Cha
d 1.5
1.0
Cha
d 1.5
1.0 Cha
d 1.5
1.0
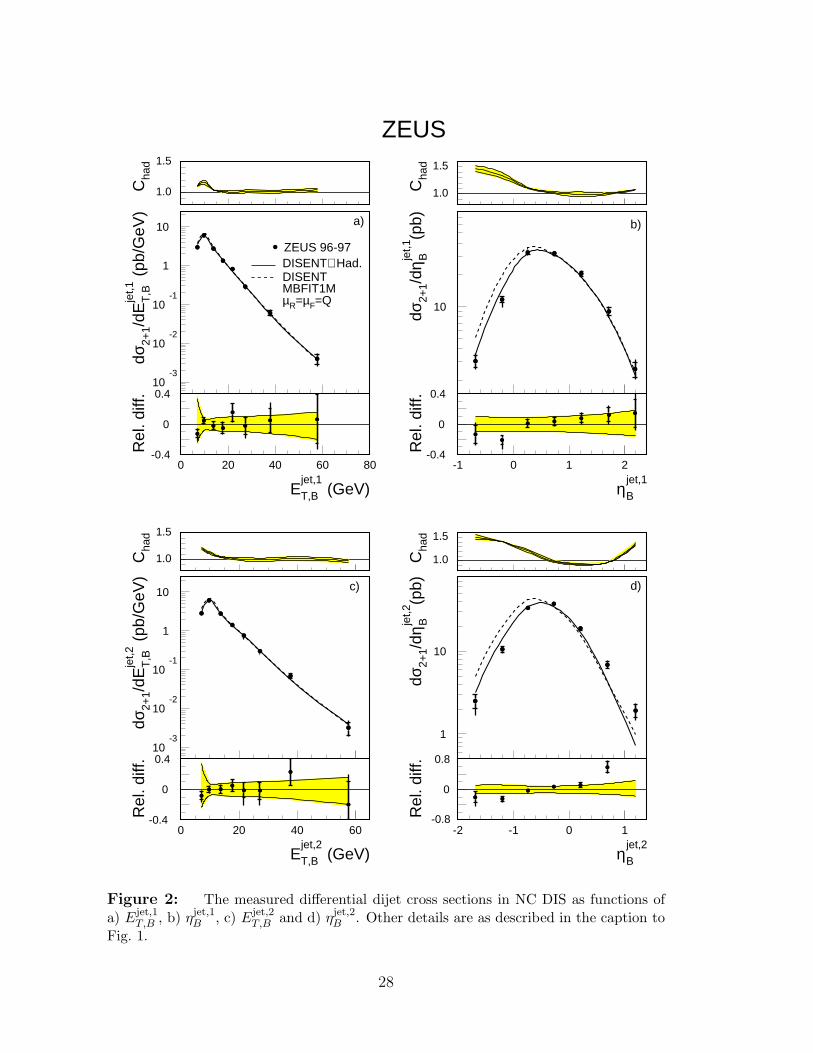
Figure 2: The measured differential dijet cross sections in NC DIS as functions of
a) Ejet,1T,B , b) ηjet,1
B , c) Ejet,2T,B and d) ηjet,2
B . Other details are as described in the caption to
Fig. 1.
28
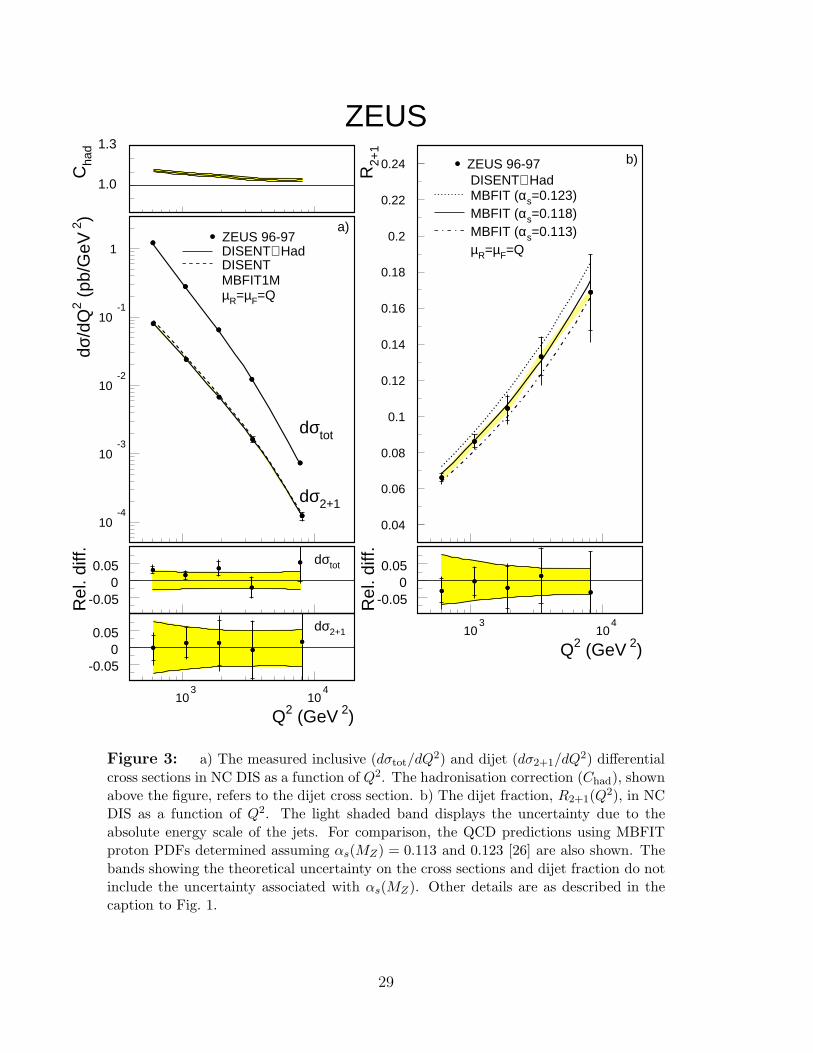
ZEUS
10-4
10-3
10-2
10-1
1
a)ZEUS 96-97DISENT⊗ HadDISENTMBFIT1MµR=µF=Q
dσtot
dσ2+1
dσ/d
Q2 (
pb/G
eV 2
)
0.04
0.06
0.08
0.1
0.12
0.14
0.16
0.18
0.2
0.22
0.24 b)ZEUS 96-97DISENT⊗ HadMBFIT (αs=0.123)MBFIT (αs=0.118)MBFIT (αs=0.113)µR=µF=Q
R2+
1
0.050
-0.05
dσtot
Rel
. diff
.
103
104
0.050
-0.05
Q2 (GeV 2)
Rel
. diff
.
103
104
0.050
-0.05
dσ2+1
Q2 (GeV 2)
1.3
1.0
Cha
d
Figure 3: a) The measured inclusive (dσtot/dQ2) and dijet (dσ2+1/dQ2) differential
cross sections in NC DIS as a function of Q2. The hadronisation correction (Chad), shown
above the figure, refers to the dijet cross section. b) The dijet fraction, R2+1(Q2), in NC
DIS as a function of Q2. The light shaded band displays the uncertainty due to the
absolute energy scale of the jets. For comparison, the QCD predictions using MBFIT
proton PDFs determined assuming αs(MZ) = 0.113 and 0.123 [26] are also shown. The
bands showing the theoretical uncertainty on the cross sections and dijet fraction do not
include the uncertainty associated with αs(MZ). Other details are as described in the
caption to Fig. 1.
29
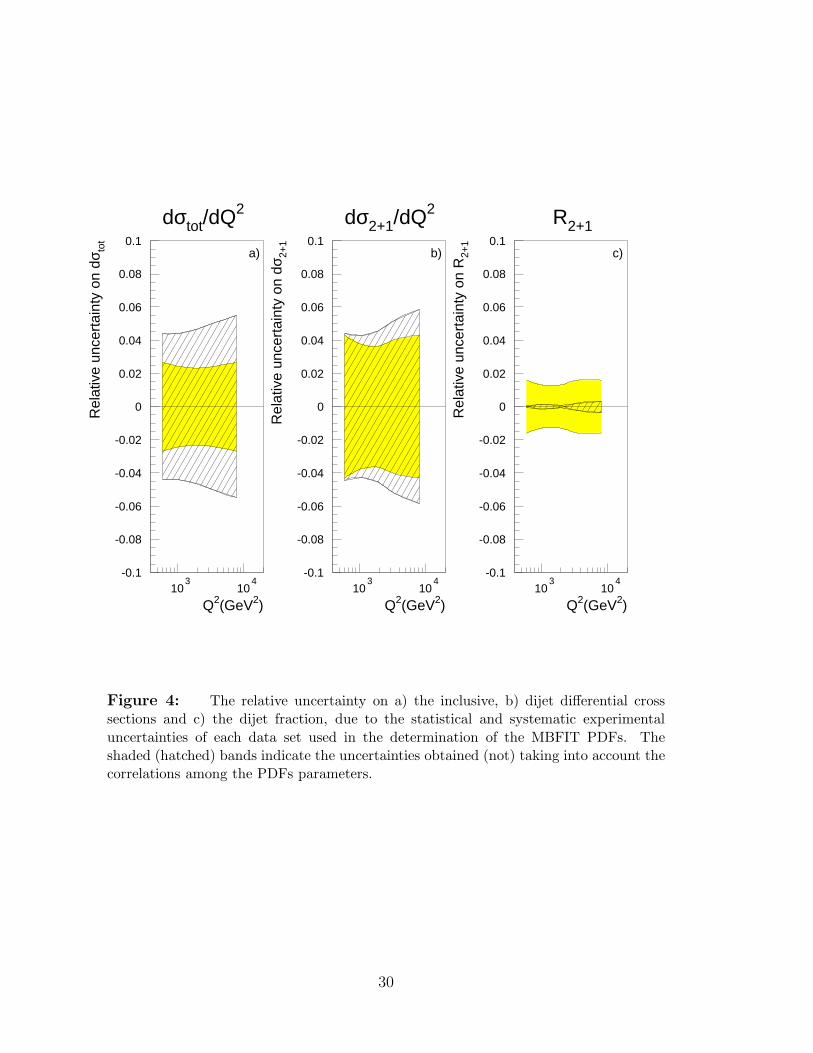
-0.1
-0.08
-0.06
-0.04
-0.02
0
0.02
0.04
0.06
0.08
0.1
103
104
Q2(GeV2)
Rel
ativ
e un
cert
aint
y on
dσ to
t
a)
dσtot/dQ2
-0.1
-0.08
-0.06
-0.04
-0.02
0
0.02
0.04
0.06
0.08
0.1
103
104
Q2(GeV2)
Rel
ativ
e un
cert
aint
y on
dσ 2+
1
b)
dσ2+1/dQ2
-0.1
-0.08
-0.06
-0.04
-0.02
0
0.02
0.04
0.06
0.08
0.1
103
104
Q2(GeV2)
Rel
ativ
e un
cert
aint
y on
R2+
1
c)
R2+1
Figure 4: The relative uncertainty on a) the inclusive, b) dijet differential cross
sections and c) the dijet fraction, due to the statistical and systematic experimental
uncertainties of each data set used in the determination of the MBFIT PDFs. The
shaded (hatched) bands indicate the uncertainties obtained (not) taking into account the
correlations among the PDFs parameters.
30
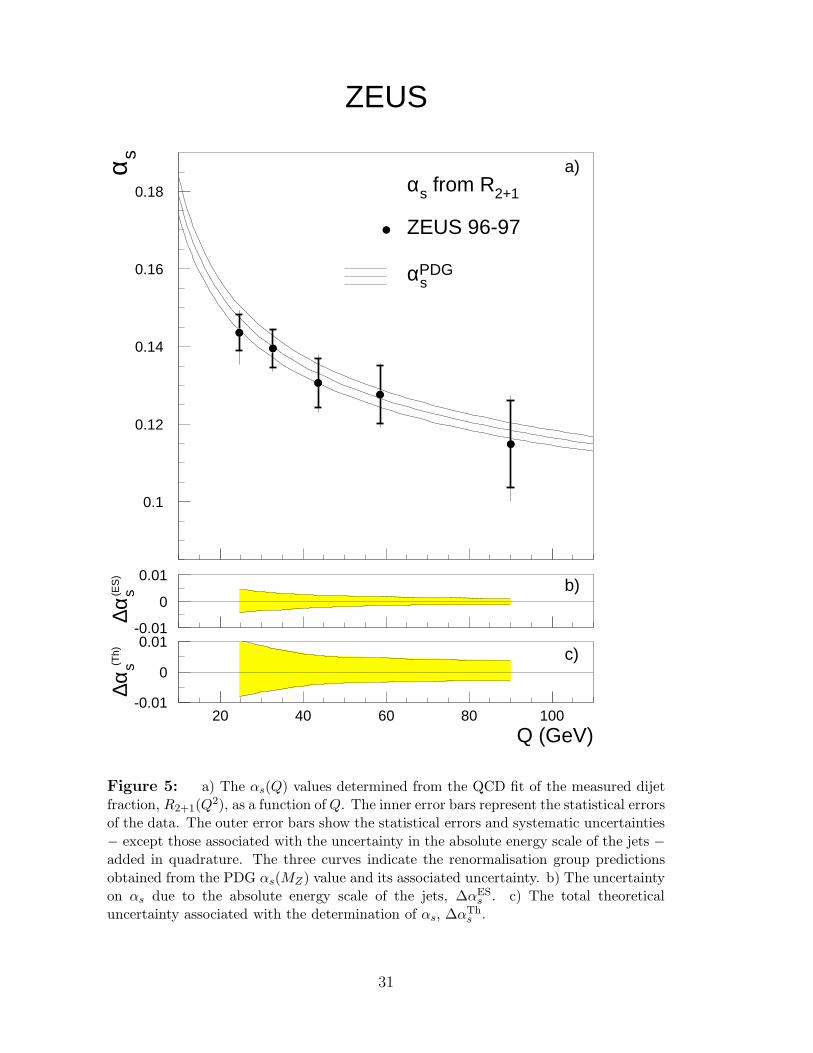
ZEUS
0.1
0.12
0.14
0.16
0.18
α s
αsPDG
ZEUS 96-97
αs from R2+1
a)
-0.01
0
0.01
∆αs(E
S)
b)
-0.01
0
0.01
20 40 60 80 100
∆αs(T
h)
Q (GeV)
c)
Figure 5: a) The αs(Q) values determined from the QCD fit of the measured dijet
fraction, R2+1(Q2), as a function of Q. The inner error bars represent the statistical errors
of the data. The outer error bars show the statistical errors and systematic uncertainties
− except those associated with the uncertainty in the absolute energy scale of the jets −added in quadrature. The three curves indicate the renormalisation group predictions
obtained from the PDG αs(MZ) value and its associated uncertainty. b) The uncertainty
on αs due to the absolute energy scale of the jets, ∆αESs . c) The total theoretical
uncertainty associated with the determination of αs, ∆αThs .
31


![The CMS Collaboration arXiv:1502.04155v1 [hep-ex] 14 Feb 2015 · crystal electromagnetic calorimeter, and a brass and scintillator hadron calorimeter. Muons are measured with three](https://static.fdocument.org/doc/165x107/5eab0bc27ec99f62775dc120/the-cms-collaboration-arxiv150204155v1-hep-ex-14-feb-2015-crystal-electromagnetic.jpg)