
are 50 μm, 5μm and 200nm, respectively. particle size of ... · Supplementary Figure 1|...
14
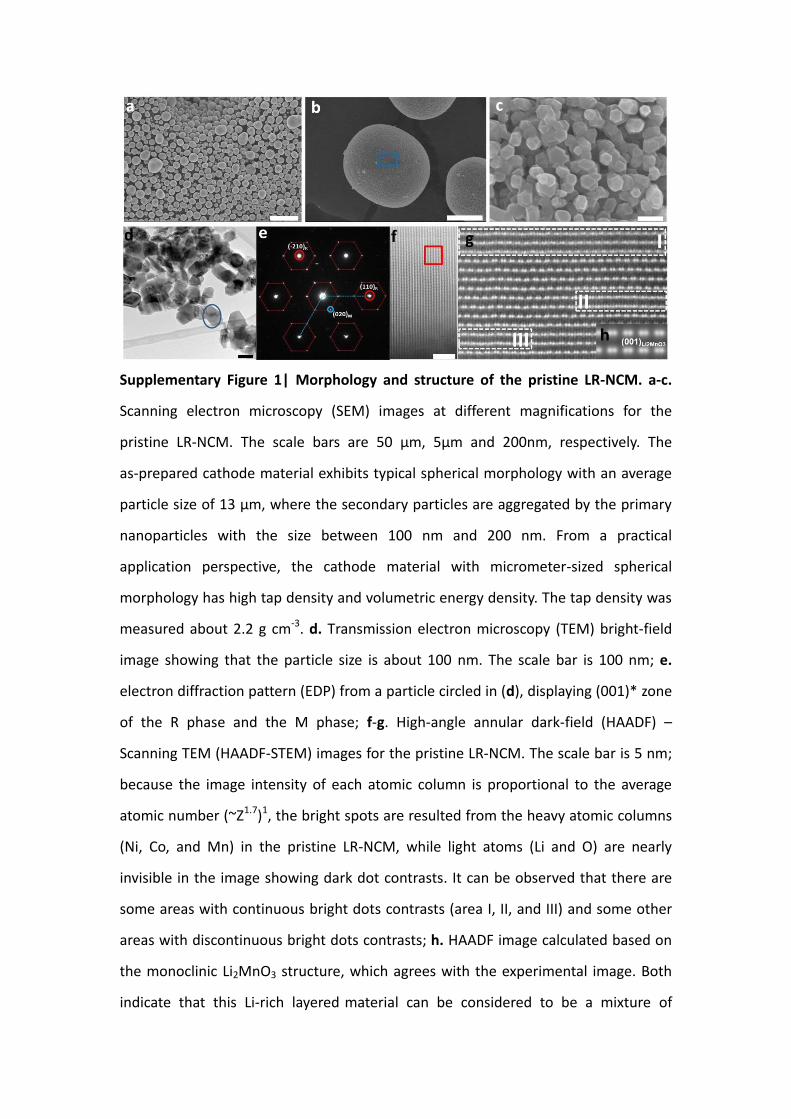
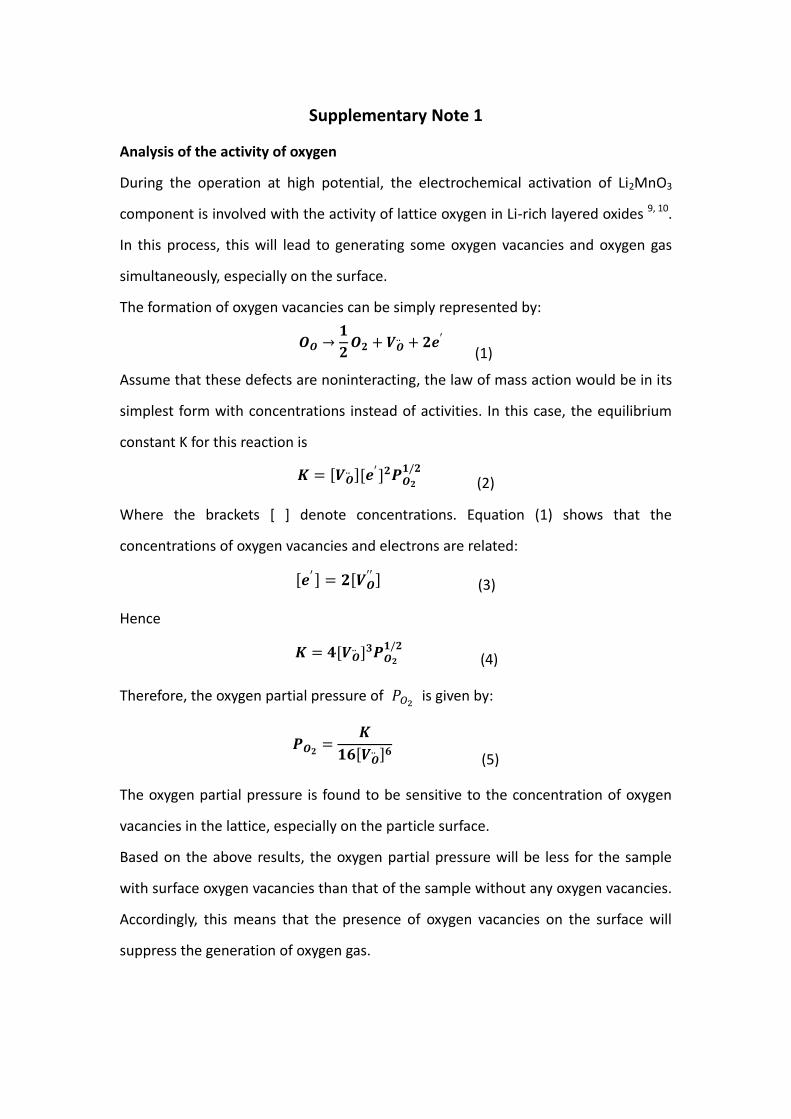
Supplementary Figure 1| Morphology and structure of the pristine LR-NCM. a-c. Scanning electron microscopy (SEM) images at different magnifications for the pristine LR-NCM. The scale bars are 50 μm, 5μm and 200nm, respectively. The as-prepared cathode material exhibits typical spherical morphology with an average particle size of 13 μm, where the secondary particles are aggregated by the primary nanoparticles with the size between 100 nm and 200 nm. From a practical application perspective, the cathode material with micrometer-sized spherical morphology has high tap density and volumetric energy density. The tap density was measured about 2.2 g cm -3 . d. Transmission electron microscopy (TEM) bright-field image showing that the particle size is about 100 nm. The scale bar is 100 nm; e. electron diffraction pattern (EDP) from a particle circled in (d), displaying (001)* zone of the R phase and the M phase; f-g. High-angle annular dark-field (HAADF) – Scanning TEM (HAADF-STEM) images for the pristine LR-NCM. The scale bar is 5 nm; because the image intensity of each atomic column is proportional to the average atomic number (~Z 1.7 ) 1 , the bright spots are resulted from the heavy atomic columns (Ni, Co, and Mn) in the pristine LR-NCM, while light atoms (Li and O) are nearly invisible in the image showing dark dot contrasts. It can be observed that there are some areas with continuous bright dots contrasts (area I, II, and III) and some other areas with discontinuous bright dots contrasts; h. HAADF image calculated based on the monoclinic Li 2 MnO 3 structure, which agrees with the experimental image. Both indicate that this Li-rich layered material can be considered to be a mixture of
Transcript of are 50 μm, 5μm and 200nm, respectively. particle size of ... · Supplementary Figure 1|...
Supplementary Figure 1| Morphology and structure of the pristine LR-NCM. a-c.
Scanning electron microscopy (SEM) images at different magnifications for the
pristine LR-NCM. The scale bars are 50 μm, 5μm and 200nm, respectively. The
as-prepared cathode material exhibits typical spherical morphology with an average
particle size of 13 μm, where the secondary particles are aggregated by the primary
nanoparticles with the size between 100 nm and 200 nm. From a practical
application perspective, the cathode material with micrometer-sized spherical
morphology has high tap density and volumetric energy density. The tap density was
measured about 2.2 g cm-3. d. Transmission electron microscopy (TEM) bright-field
image showing that the particle size is about 100 nm. The scale bar is 100 nm; e.
electron diffraction pattern (EDP) from a particle circled in (d), displaying (001)* zone
of the R phase and the M phase; f-g. High-angle annular dark-field (HAADF) –
Scanning TEM (HAADF-STEM) images for the pristine LR-NCM. The scale bar is 5 nm;
because the image intensity of each atomic column is proportional to the average
atomic number (~Z1.7)1, the bright spots are resulted from the heavy atomic columns
(Ni, Co, and Mn) in the pristine LR-NCM, while light atoms (Li and O) are nearly
invisible in the image showing dark dot contrasts. It can be observed that there are
some areas with continuous bright dots contrasts (area I, II, and III) and some other
areas with discontinuous bright dots contrasts; h. HAADF image calculated based on
the monoclinic Li2MnO3 structure, which agrees with the experimental image. Both
indicate that this Li-rich layered material can be considered to be a mixture of
nanosized rhombohedral LiMO2 and monoclinic Li2MnO3 components in a single
crystal particle.
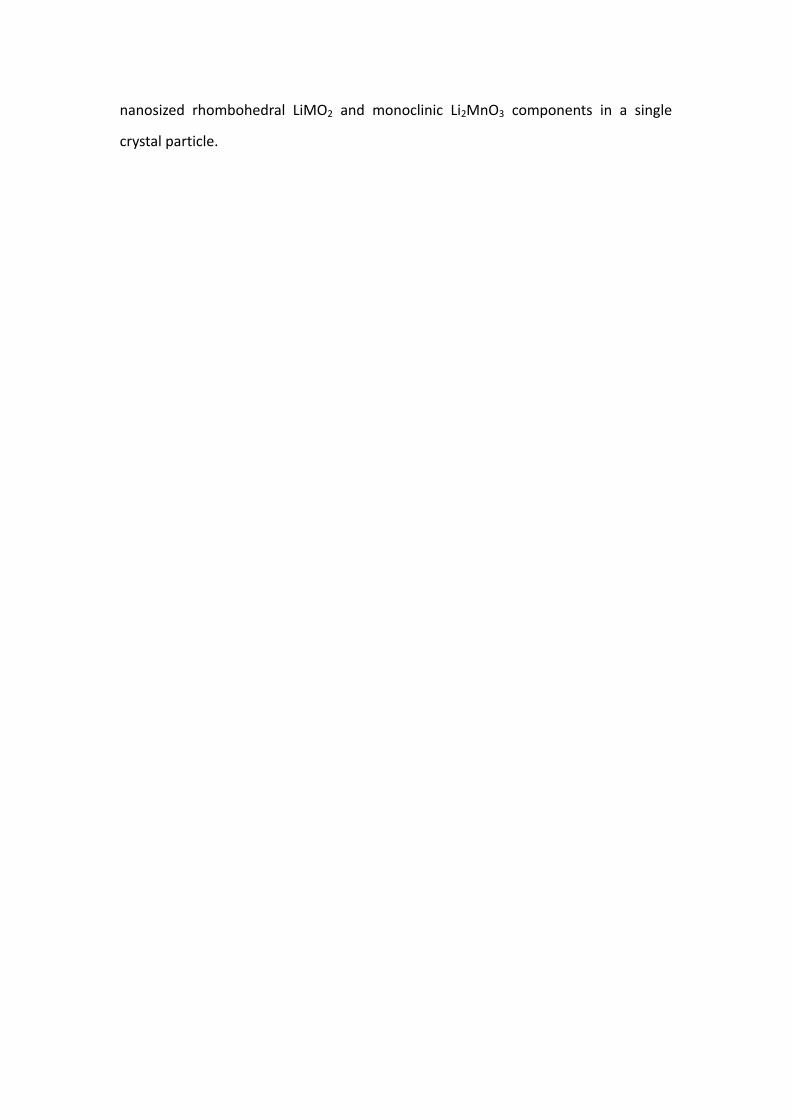
Supplementary Figure 2| Structural characterization of the pristine and GSIR
LR-NCM. Synchrotron X-ray diffraction (SXRD) patterns for the pristine (a) and GSIR
LR-NCM (b).
All the peaks in the diffraction patterns presented in Supplementary Fig. 2a and b
could be indexed to trigonal space group R-3m, whereas the weaker superstructure
peaks could be indexed to monoclinic space group C2/m. Both lattice parameters and
Li/Ni mixing show no big difference between the pristine and GSIR LR-NCM sample.
This finding implies that the surface modification does not strongly influence the
whole structure.
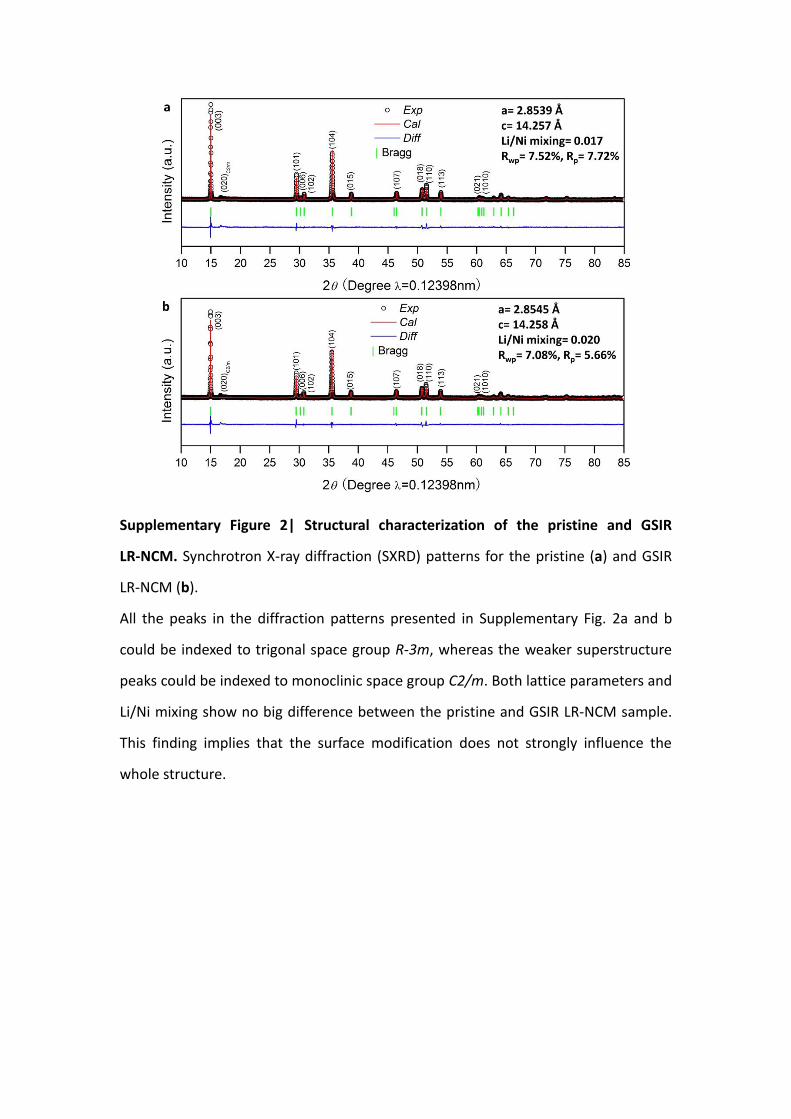
Supplementary Figure 3| Structural characterization of the pristine and GSIR
LR-NCM. Normalized K-edge X-ray absorption near edge structure (XANES) spectra
for the pristine and GSIR LR-NCM.
As shown in Supplementary Fig. 3, the K-edge XANES data fully overlap each other
with little distinction for the pristine and GSIR LR-NCM sample. The results are
consistent with the previously published XANES results of this system2, showing that
the average oxidation state is 2+ for Ni, 3+ for Co, and 4+ for Mn. Therefore, the total
average and local structure environments for transition metals have not been
significantly altered after the GSIR by this novel modification method.
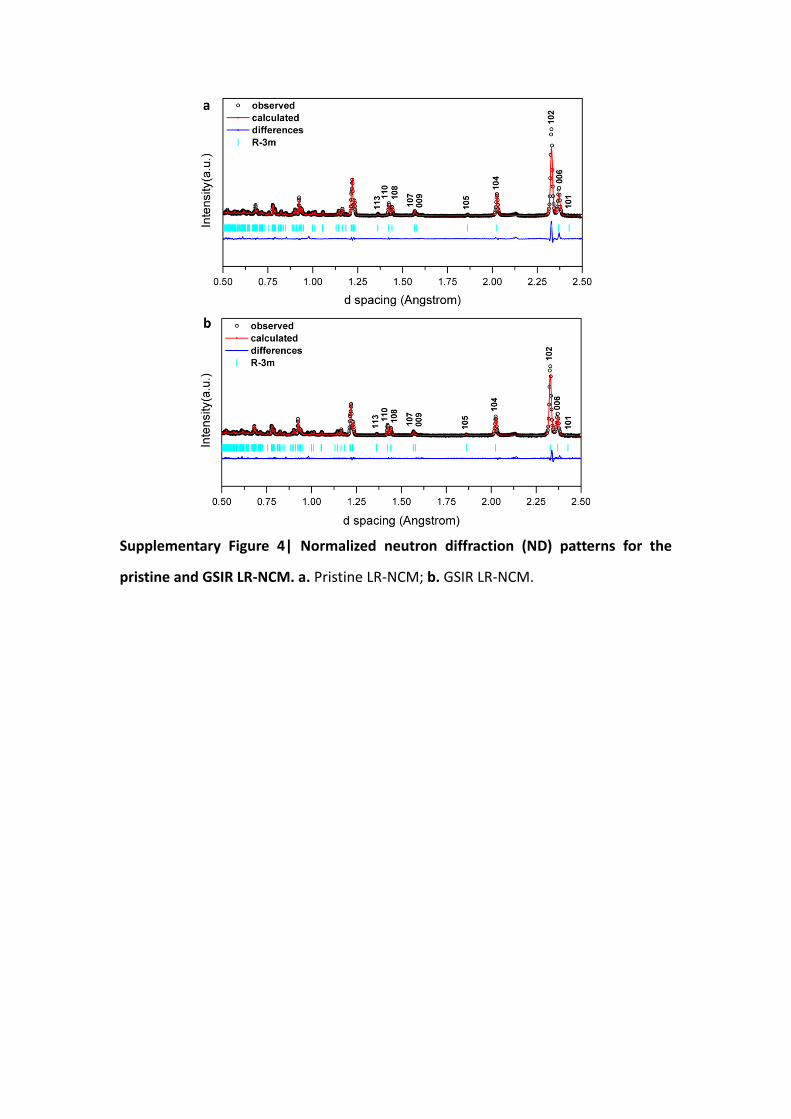
Supplementary Figure 4| Normalized neutron diffraction (ND) patterns for the
pristine and GSIR LR-NCM. a. Pristine LR-NCM; b. GSIR LR-NCM.
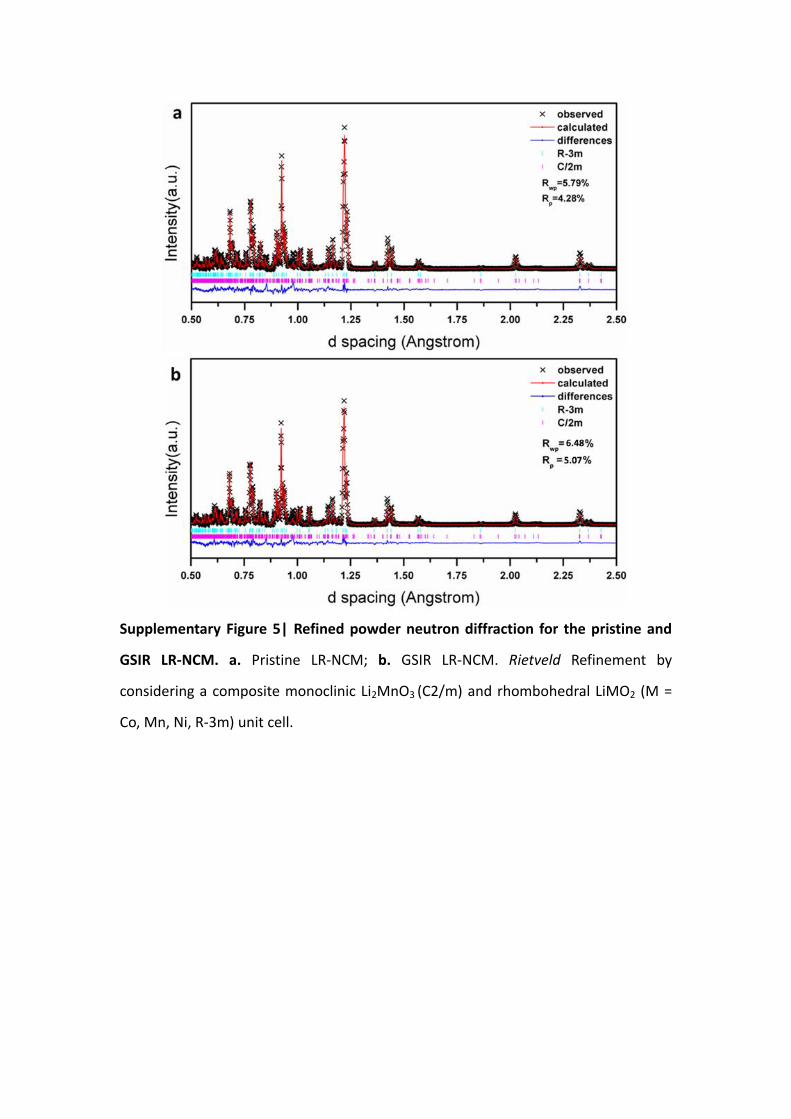
Supplementary Figure 5| Refined powder neutron diffraction for the pristine and
GSIR LR-NCM. a. Pristine LR-NCM; b. GSIR LR-NCM. Rietveld Refinement by
considering a composite monoclinic Li2MnO3 (C2/m) and rhombohedral LiMO2 (M =
Co, Mn, Ni, R-3m) unit cell.
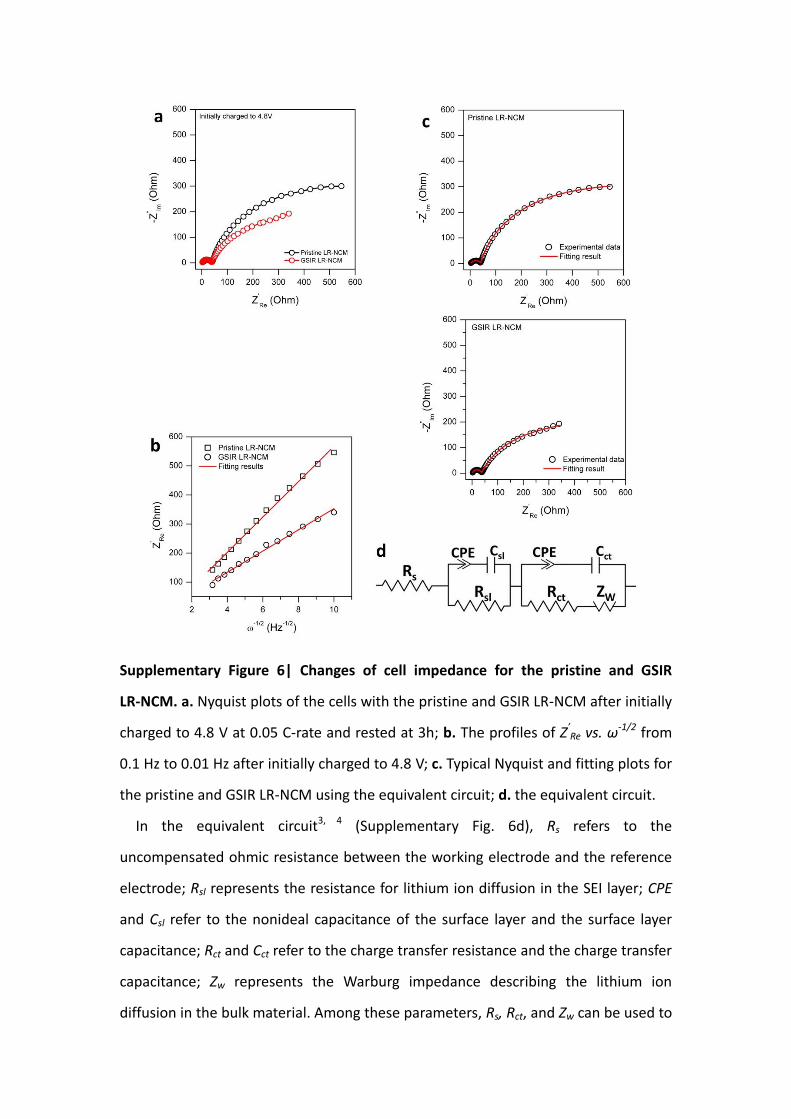
Supplementary Figure 6| Changes of cell impedance for the pristine and GSIR
LR-NCM. a. Nyquist plots of the cells with the pristine and GSIR LR-NCM after initially
charged to 4.8 V at 0.05 C-rate and rested at 3h; b. The profiles of Z’Re vs. ω-1/2 from
0.1 Hz to 0.01 Hz after initially charged to 4.8 V; c. Typical Nyquist and fitting plots for
the pristine and GSIR LR-NCM using the equivalent circuit; d. the equivalent circuit.
In the equivalent circuit3, 4 (Supplementary Fig. 6d), Rs refers to the
uncompensated ohmic resistance between the working electrode and the reference
electrode; Rsl represents the resistance for lithium ion diffusion in the SEI layer; CPE
and Csl refer to the nonideal capacitance of the surface layer and the surface layer
capacitance; Rct and Cct refer to the charge transfer resistance and the charge transfer
capacitance; Zw represents the Warburg impedance describing the lithium ion
diffusion in the bulk material. Among these parameters, Rs, Rct, and Zw can be used to
quantify the ohmic polarization, charge transfer polarization and diffusion
polarization. The fitted impedance parameters are listed in Supplementary Table 1. It
can be seen that the Rsl and Rct for the GSIR LR-NCM is lower than that of the pristine
one.
In addition, electrochemical impedance spectroscopy (EIS) is also an important
tool for evaluating the diffusion coefficient of a lithium ion within the particles. The
diffusion coefficient of the lithium ion is calculated according to the following
equation5, 6:
(1)
where DLi represents the diffusion coefficient of the lithium ion, R is the gas constant,
T is the absolute temperature, A is the surface area of electrode (Based on the BET
area), n is the number of charges on the Li ion per molecule during oxidization, F is
the Faraday constant, C is the concentration of lithium ion, and σ the Warburg factor,
σ relates to Z’Re through eqn. (2):
(2)
Its value can be obtained from the slope of the lines between Z’Re and ω-1/2 as shown
in Supplementary Fig. 6b.
Based on the eqn. (1), the diffusion coefficient of the lithium ion in pristine and GSIR
LR-NCM, after initially charged 4.8 V, is only related to the parameter σ. Therefore,
the diffusion coefficient DLi for GSIR LR-NCM exhibits an increase compared to that of
pristine LR-NCM.
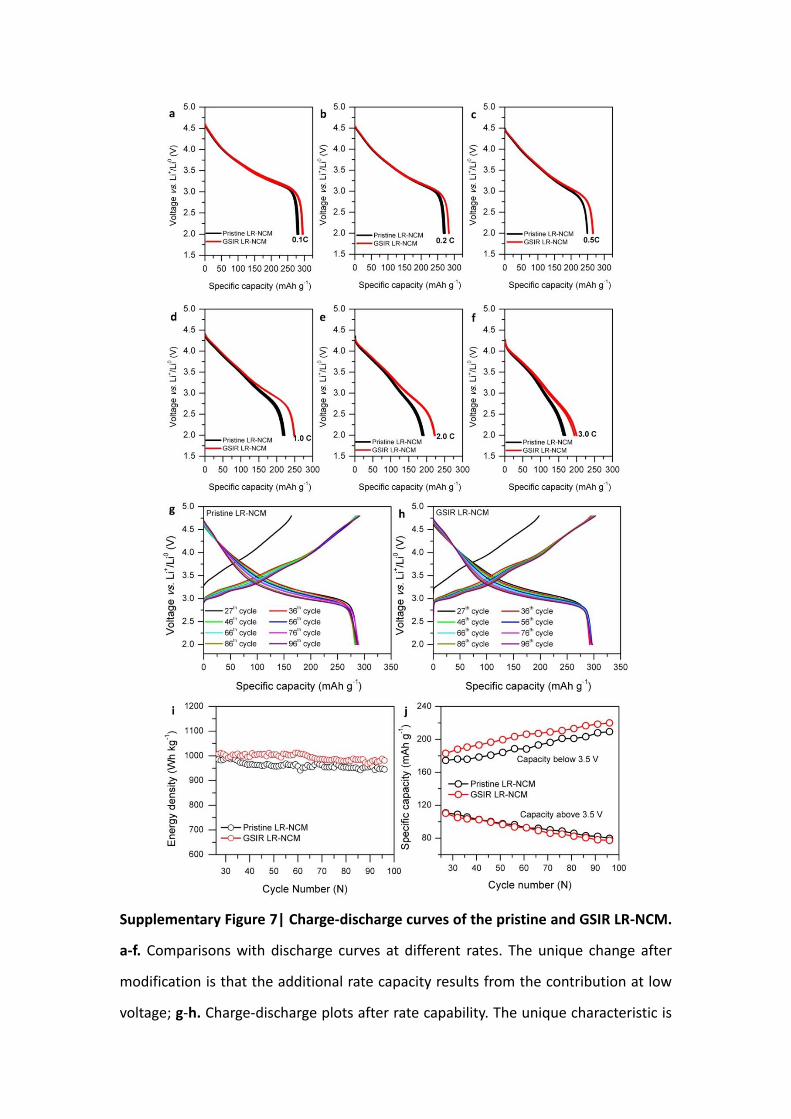
Supplementary Figure 7| Charge-discharge curves of the pristine and GSIR LR-NCM.
a-f. Comparisons with discharge curves at different rates. The unique change after
modification is that the additional rate capacity results from the contribution at low
voltage; g-h. Charge-discharge plots after rate capability. The unique characteristic is
that the voltage decay occurs gradually, while the discharge capacity nearly keeps
stable during the subsequent cycles. This voltage profile decay has been considered
as the layered-to-spinel transformation7, 8. i. Discharge energy density as a function
of cycle number during the cycling at 0.1 C; j. Discharge capacity above 3.5 V and
below 3.5 V vs. Li+/Li0 of the pristine and GSIR LR-NCM during the cycling.
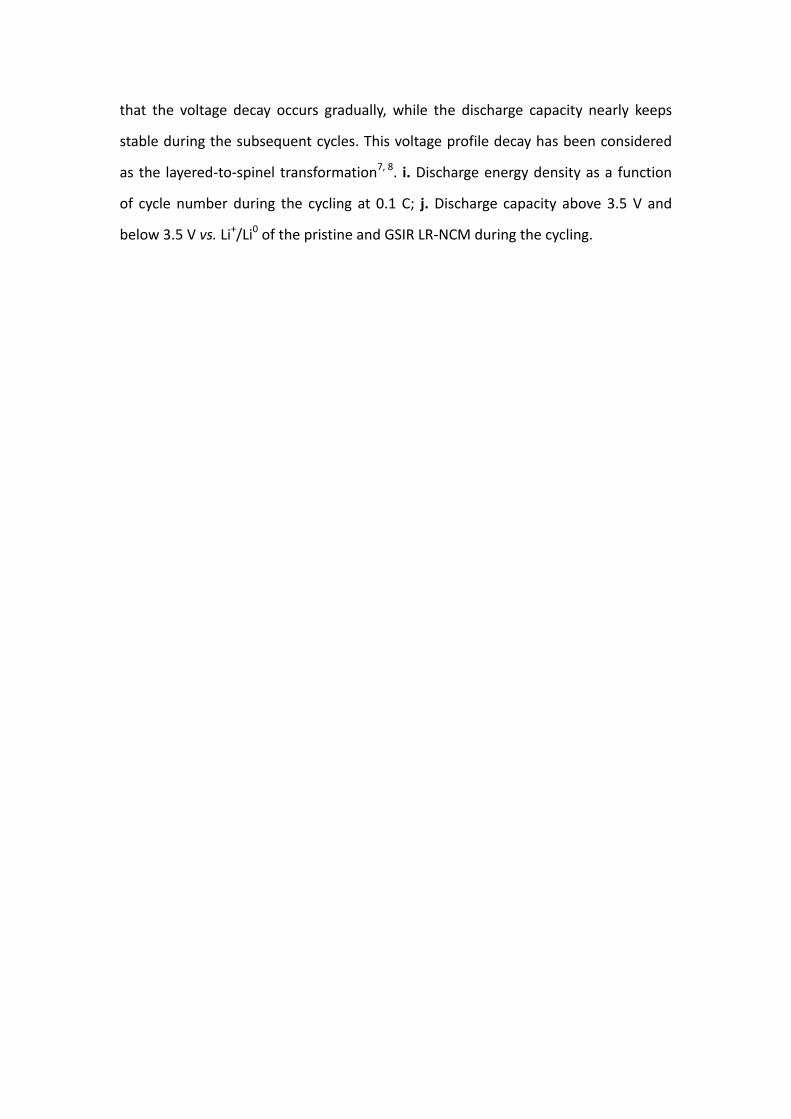
Supplementary Figure 8| Charge-discharge curves of the pristine and GSIR LR-NCM
at elevated temperature of 55 °C. a. Initial charge-discharge profiles of the pristine
and GSIR LR-NCM at 0.5 C-rate between 2.0 and 4.8 V at 55 °C, where 1.0 C-rate
corresponds to the current density of 250 mA g-1; b. Initial charge-discharge profiles
of the pristine and GSIR LR-NCM at 1.0 C-rate between 2.0 and 4.8V at 55 °C; c-d.
Discharge plots of the pristine and GSIR LR-NCM at 0.5 C-rate cycled between 2.0 and
4.8 V at 55 °C; e-f. Charge-discharge plots of the pristine and GSIR LR-NCM at 1.0
C-rate cycled between 2.0 and 4.8V at 55 °C.
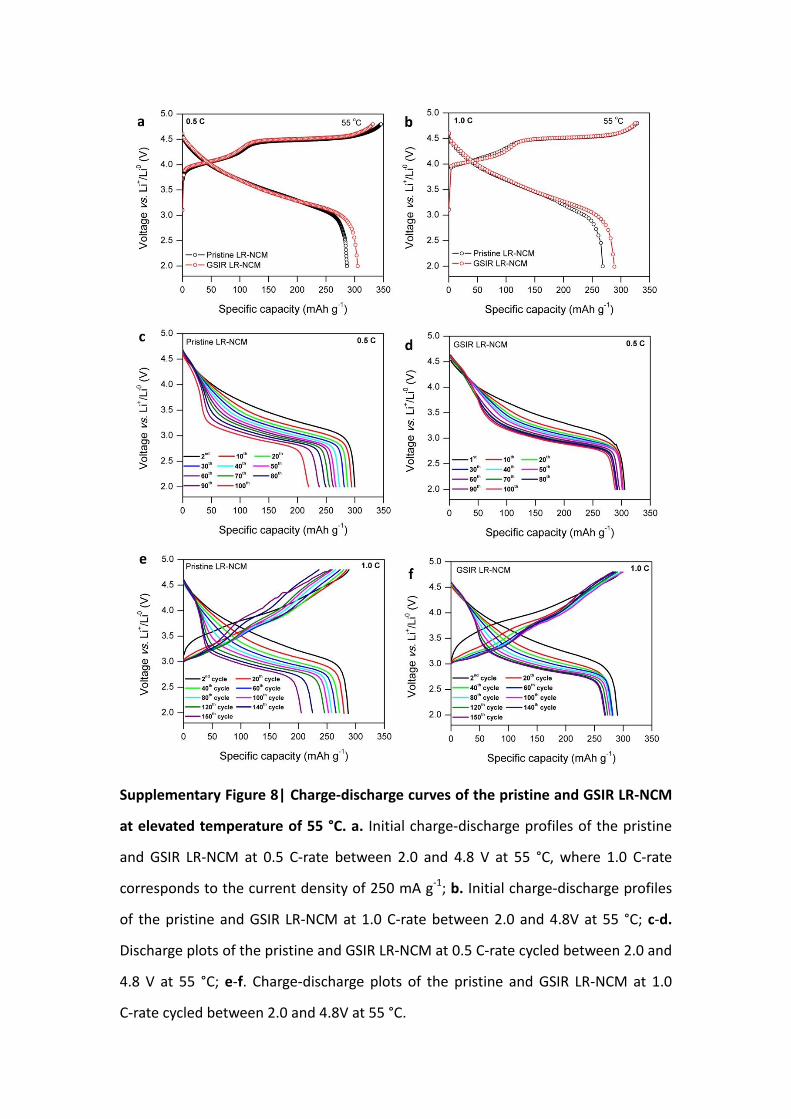
Supplementary Table 1 Impedance parameters of the pristine and GSIR LR-NCM
after initially charged to 4.8 V
Re (Ω) Rsl (Ω) Rct (Ω) σ
Pristine LR-NCM electrode 1.288 37.72 769.2 60.98
GSIR LR-NCM electrode 1.137 36.44 411.7 36.44
Supplementary Note 1
Analysis of the activity of oxygen
During the operation at high potential, the electrochemical activation of Li2MnO3
component is involved with the activity of lattice oxygen in Li-rich layered oxides 9, 10.
In this process, this will lead to generating some oxygen vacancies and oxygen gas
simultaneously, especially on the surface.
The formation of oxygen vacancies can be simply represented by:
(1)
Assume that these defects are noninteracting, the law of mass action would be in its
simplest form with concentrations instead of activities. In this case, the equilibrium
constant K for this reaction is
(2)
Where the brackets [ ] denote concentrations. Equation (1) shows that the
concentrations of oxygen vacancies and electrons are related:
(3)
Hence
(4)
Therefore, the oxygen partial pressure of 𝑃𝑂2 is given by:
(5)
The oxygen partial pressure is found to be sensitive to the concentration of oxygen
vacancies in the lattice, especially on the particle surface.
Based on the above results, the oxygen partial pressure will be less for the sample
with surface oxygen vacancies than that of the sample without any oxygen vacancies.
Accordingly, this means that the presence of oxygen vacancies on the surface will
suppress the generation of oxygen gas.
𝑶𝑶 →𝟏
𝟐𝑶𝟐 + 𝑽𝑶
.. + 𝟐𝒆′
𝑲 = 𝑽𝑶.. [𝒆′ ]𝟐𝑷𝑶𝟐
𝟏/𝟐
𝒆′ = 𝟐 𝑽𝑶′′
𝑲 = 𝟒[𝑽𝑶.. ]𝟑𝑷𝑶𝟐
𝟏/𝟐
𝑷𝑶𝟐=
𝑲
𝟏𝟔 𝑽𝑶.. 𝟔
Supplementary References
1. Yu, H. J. et al. Direct atomic-resolution observation of two phases in the
Li1.2Mn0.567Ni0.166Co0.067O2 cathode material for Li-ion Batteries. Angew. Chem. Int.
Ed. 52, 5969-5973 (2013).
2. Yu, X. Q. et al. Understanding the rate capability of high-energy-density Li-rich
layered Li1.2Ni0.13Mn0.54Co0.13O2 cathode materials. Adv. Energy Mater. 4,
1300950 (2014).
3. Zheng, J. M. et al. The effects of AlF3 coating on the performance of
Li[Li0.2Ni0.13Co0.13Mn0.54]O2 positive electrode material for lithium-ion battery. J.
Electrochem. Soc. 155, A775-A782 (2008).
4. Guo, S. H. et al. Surface coating of lithium-manganese-rich layered oxides with
Delaminated MnO2 nanosheets as cathode materials for Li-ion batteries. J. Mater.
Chem. A, 2, 4422-4428 (2014).
5. Luo, D. et al. A new spinel-layered Li-rich microsphere as a high-rate cathode
material for Li-ion batteries. Adv. Energy Mater. 4, 1400062 (2014).
6. Li, B. H. et al. Facile synthesis of Li4Ti5O12/C composite with super rate
performance, Energy Environ. Sci., 5, 9595-9602 (2012).
7. Zheng, J. et al. Mitigating voltage fade in cathode materials by improving the
atomic level uniformity of elemental distribution. Nano Lett, 14, 2628-2635
(2014).
8. Gu, M. et al. Formation of the spinel phase in the layered composite cathode
used in Li-ion batteries. ACS Nano, 7, 760-767 (2013).
9. Lu, Z. & Dahn, J. R. Understanding the anomalous capacity of Li/
Li[NixLi1/3-2x/3Mn2/3−x/3]O2 cells using in situ X-ray diffraction and electrochemical
studies. J. Electrochem. Soc. 149, A815-A822 (2002).
10. Armstrong, A. R. et al. Demonstrating oxygen loss and associated structural
reorganization in the lithium battery cathode Li[Ni0.2Li0.2Mn0.6]O2. J. Am. Chem.
Soc. 128, 8694-8698 (2006).


![α Physiologic correlation - medinfo2.psu.ac.thmedinfo2.psu.ac.th/pr/chest2012/chest2010/pdf/[12] Cases with physiologic correlation... · Morphology Physiology Physiology of lung](https://static.fdocument.org/doc/165x107/5d4b913888c99388658b7bf0/-physiologic-correlation-12-cases-with-physiologic-correlation-morphology.jpg)