Differential Pressure Calibration Static pressure range up to 80MPa 5 Pa to 78MPa ΔP
APPLICATION OF ULTRA HIGH HYDROSTATIC PRESSURE FOR
INVESTIGATING THE BINDING OF FLAVOR COMPOUNDS
TO β-LACTOGLOBULIN VIA HEADSPACE SOLID PHASE
MICROEXTRACTION-GAS CHROMATOGRAPHY
By
TINYEE ARDEN HOANG
A dissertation submitted in partial fulfillment of
the requirements for the degree of
DOCTOR OF PHILOSOPHY
WASHINGTON STATE UNIVERSITY
Department of Food Science & Human Nutrition
DECEMBER 2006
© Copyright by TINYEE ARDEN HOANG, 2006
All Rights Reserved

© Copyright by TINYEE ARDEN HOANG, 2006
All Rights Reserved
To the Faculty of Washington State University:
The members of the Committee appointed to examine the dissertation of
TINYEE ARDEN HOANG find it satisfactory and recommend that it be
accepted.
___________________________________
Chair
___________________________________
___________________________________
___________________________________
ii
ACKNOWLEDGMENT
I would like to express my sincere gratitude to my major advisor, Dr. Barry G.
Swanson. His straightforwardness and ability to tear up a dissertation like no other make
him very special, and I hope that I can continue to be his “unofficial student” as I become
part of the “real” world.
Great appreciation is also extended to other committee members Dr. Joseph R.
Powers and Dr. John K. Fellman for their time, patience, guidance, support, advice, and
encouragement from the beginning of my Ph. D. program to the completion of my
dissertation.
Words cannot express how thankful I am to have Dr. Stephanie Clark as a last
minute addition to my committee, but also as an advisor for the Food Product
Development Team and a friend. Her knowledge and charisma make her a tremendous
asset for students like me.
I want to thank Dr. Herbert H. Hill, Jr. for giving me guidance on special areas of
analytical chemistry and support for my “unofficial” minor in chemistry. I want to thank
Dr. Carolyn Ross for her acceptance as a substitute for Dr. Fellman’s absence in my
defense. I am especially thankful to my committee as a whole for guiding me in the right
direction and assisting my research activities throughout my Ph. D. program.
I would like to express my appreciation to Frank L. Younce for his assistance
with the use of the high hydrostatic pressure equipment in the pilot plant; Karen Weller
and Vaughn Sweet for their help with the use of the laboratory facilities; and Scott
Mattinson for his tremendous help, knowledge, expertise, and advice on gas
chromatography.
i
ii
I want to express my thanks to my dearest friends, Hamzah Al-Qadiri, Esteban
Mejia-Meza, Subba Rao Gurram, Seung-Yong Lim, Coco Umiker, Shantanu Agarwal,
Jaydeep Chauhan, and Todd Yee, as well as other friends for their advice and
encouragement. I will miss you guys.
I would also like to thank all faculty, staff, and colleagues who have been
involved at all stages of my education. Special thanks go to Dr. Boon Chew, for his
encouragement, support, and friendship. Their support and encouragement contributed to
my academic achievements and success.
Great appreciation is also due to my parents Tuan Hoang and Mysi Hoang for
their constant encouragement, some financial aid, and support throughout my academic
career; my sister Tinya for her jokes and sense of humor to get me through difficult
times; and my fiancée Huajing “Jing” Xing for her love and support throughout my Ph.
D. program.
Finally, I am most grateful to USDA for their financial support throughout my
Ph. D. study at Washington State University.
iv
APPLICATION OF ULTRA HIGH HYDROSTATIC PRESSURE FOR
INVESTIGATING THE BINDING OF FLAVOR COMPOUNDS
TO β-LACTOGLOBULIN VIA HEADSPACE SOLID PHASE
MICROEXTRACTION-GAS CHROMATOGRAPHY
Abstract
by Tinyee Arden Hoang, Ph.D.
Washington State University
December 2006
Chair: Barry G. Swanson
Fluorescence spectroscopy and headspace-solid phase microextraction (HS-
SPME) gas chromatography analysis were used to evaluate the effects of ultra high
hydrostatic pressure (UHP) (600 MPa) and pH (3.0-9.0) on β-lactoglobulin (BLG)
surface hydrophobicity and binding of selected flavor compounds. An increase in
tryptophan intrinsic fluorescence intensity of BLG was observed after UHP of 16 min,
which suggested that the tryptophan residues were exposed during the unfolding of BLG.
A 2 nm red-shift in tryptophan emission wavelength was observed after UHP come-up
time, indicating changes in the polarity of tryptophan residues from a less polar to a more
polar microenvironment. After UHP treatment come-up time of BLG at pH 9.0, there was
an increase in BLG surface hydrophobicity, suggesting a flexible molecular structure due
to surface denaturation of BLG at alkaline pH. UHP treatment of BLG solutions at pH
3.0, 5.0, and 9.0 resulted in decreases in the number of binding sites for the nonpolar
fluorescence probe 6-propionyl-2-(dimethylamino)-naphthalene (PRODAN). UHP
v
treatment did not show significant influences in the apparent dissociation constant of
PRODAN.
An extraction time of 10 min was used for HS-SPME of δ-decalactone, 2-
methylbutyraldehyde, ethyl lactate, and diacetyl. Although the CAR/PDMS fiber was
able to detect diacetyl, ethyl lactate, and 2-methylbutyraldehyde, the PDMS/DVB SPME
fiber was selected for the extraction of selected flavor compounds due to reproducible
and linear (R P
2P > 0.954) calibration plots, and its semi-polar nature to extract δ-
decalactone.
As observed by fluorescence quenching, there is no linear relationship between
UHP treatment of BLG at 600 MPa and the number of binding sites for diacetyl, 2-
methylbutyraldehyde, δ-decalactone, and ethyl lactate. BLG has low binding affinity for
the selected flavor compounds with polar groups, and UHP treatment of BLG did not
influence binding of 2-methylbutyraldehyde as observed by fluorescence quenching
experiments. Headspace analysis of UHP–treated BLG resulted in significant increases (p
< 0.05) in flavor retention over native BLG. In addition, a short UHP treatment time
(come-up time) may be adequate for flavor retention.
vi
TABLE OF CONTENTS
Page
ACKNOWLEDGEMENTS................................................................................................ iii
ABSTRACT..........................................................................................................................v
LIST OF TABLES...............................................................................................................ix
LISTOF FIGURES ...............................................................................................................x
CHAPTER
1. INTRODUCTION .................................................................................................1
2. SURFACE HYDROPHOBICITY OF ULTRA HIGH PRESSURE TREATED
β-LACTOGLOBULIN – PRODAN FLUORESCENT PROBE.........................29
Abstract ..........................................................................................................30
Introduction....................................................................................................31
Materials and methods ...................................................................................33
Results and discussion ...................................................................................37
Conclusions....................................................................................................45
References......................................................................................................46
3. APPLICATION OF SOLID-PHASE MICROEXTRACTION WITH
HEADSPACE GAS CHROMATOGRAPHY TO THE ANALYSIS OF
DIACETYL, 2-METHYLBUTYRALDEHYDE, ETHYL LACTATE, AND δ-
DECALACTONE IN MODEL BUFFER SOLUTION ......................................85
Abstract ..........................................................................................................86
Introduction....................................................................................................87
Materials and methods ...................................................................................91
Results and discussion ...................................................................................94
Conclusions....................................................................................................96
References......................................................................................................97
vii
4. APPLICATION OF SOLID-PHASE MICROEXTRACTION WITH
HEADSPACE GAS CHROMATOGRAPHY TO THE ANALYSIS OF
DIACETYL, 2-METHYLBUTYRALDEHYDE, ETHYL LACTATE, AND δ-
DECALACTONE IN ULTRA HIGH PRESSURE-TREATED β-
LACTOGLOBULIN SOLUTIONS...................................................................103
Abstract ........................................................................................................104
Introduction..................................................................................................105
Materials and methods .................................................................................109
Results and discussion .................................................................................112
Conclusion ...................................................................................................116
References....................................................................................................117
5. CONCLUSIONS..................................................................................................129
viii
LIST OF TABLES
Chapter 2: Surface hydrophobicity of ultra high pressure treated β-lactoglobulin –
PRODAN fluorescent probe
1. Apparent dissociation constant (K’d) and the number of binding sites (n)
of BLG for PRODAN after UHP treatment (600 MPa) for selected holding
times of 0 to 32 min (UHP0-UHP32) at pH 3.0-9.0 calculated using the
method by Cogan and others (1976).......................................................................84
Chapter 3: Application of solid-phase microextraction with headspace gas
chromatography to the analysis of diacetyl, 2-methylbutyraldehyde, ethyl lactate,
and δ-decalactone in model buffer solution
1. Volatile compounds identified using HS-SPME GC-FID....................................102
Chapter 4: Application of solid-phase microextraction with headspace gas
chromatography to the analysis of diacetyl, 2-methylbutyraldehyde, ethyl lactate,
and d-decalactone in ultra high pressure-treated β-lactoglobulin solutions
1. Static quenching constate (KSV), fractional number of binding sites (n), and
dissociation constate (K’d) of BLG for selected flavor compounds as a
function of UHP holding times (0, 8, 32 min) ......................................................124
ix
LIST OF FIGURES
Chapter 1: Introduction
1. Ribbon diagram of a single subunit of β-lactoglobulin .......................................28
Chapter 2: Surface hydrophobicity of ultra high pressure treated β-lactoglobulin –
PRODAN fluorescent probe
1. Intrinsic tryptophan emission spectra of native BLG solutions at pH 3.0,
5.0, 7.0, or 9.0 .........................................................................................................49
2. Intrinsic tryptophan emission spectra of BLG solutions at pH 3 treated
with UHP at 600 MPa for selected holding times from 0 to 32 min (UHP0-
UHP32) ...................................................................................................................50
3. Intrinsic tryptophan emission spectra of BLG solutions at pH 5 treated with
UHP at 600 MPa for selected holding times from 0 to 32 min (UHP0-
UHP32) ...................................................................................................................51
4. Intrinsic tryptophan emission spectra of BLG solutions at pH 7 treated with
UHP at 600 MPa for selected holding times from 0 to 32 min (UHP0-
UHP32) ...................................................................................................................52
5. Intrinsic tryptophan emission spectra of BLG solutions at pH 9 treated with
UHP at 600 MPa for selected holding times from 0 to 32 min (UHP0-
UHP32) ...................................................................................................................53
6. Extrinsic PRODAN emission spectra of BLG solutions at pH 3 treated with
UHP at 600 MPa for selected holding times from 0 to 32 min (UHP0-
UHP32) ...................................................................................................................54
x
7. Extrinsic PRODAN emission spectra of BLG solutions at pH 5 treated with
UHP at 600 MPa for selected holding times from 0 to 32 min (UHP0-
UHP32) ...................................................................................................................55
8. Extrinsic PRODAN emission spectra of BLG solutions at pH 7 treated with
UHP at 600 MPa for selected holding times from 0 to 32 min (UHP0-
UHP32) ...................................................................................................................56
9. Extrinsic PRODAN emission spectra of BLG solutions at pH 9 treated with
UHP at 600 MPa for selected holding times from 0 to 32 min (UHP0-
UHP32) ...................................................................................................................57
10. Extrinsic PRODAN emission spectra of native BLG solutions at pH 3.0-9.0 .......58
11. Surface hydrophobicity of BLG determined at pH 3.0-9.0 after ultra high
pressure (UHP) treatment times 0, 4, 8, 16, or 32 min with PRODAN..................59
12. PRODAN binding to BLG plotted by Cogan method (1976) to calculate K’BdB
and n for native BLG at pH 3.0...............................................................................60
13. PRODAN binding to BLG plotted by Cogan method (1976) to calculate K’BdB
and n for UHP treated (600 MPa) BLG with 0 min holding time at pH 3.0...........61
14. PRODAN binding to BLG plotted by Cogan method (1976) to calculate K’BdB
and n for UHP treated (600 MPa) BLG with 4 min holding time at pH 3.0...........62
15. PRODAN binding to BLG plotted by Cogan method (1976) to calculate K’BdB
and n for UHP treated (600 MPa) BLG with 8 min holding time at pH 3.0...........63
16. PRODAN binding to BLG plotted by Cogan method (1976) to calculate K’BdB
and n for UHP treated (600 MPa) BLG with 16 min holding time at pH 3.0.........64
xi
17. PRODAN binding to BLG plotted by Cogan method (1976) to calculate K’BdB
and n for UHP treated (600 MPa) BLG with 32 min holding time at pH 3.0.........65
18. PRODAN binding to BLG plotted by Cogan method (1976) to calculate K’BdB
and n for native BLG at pH 3.0...............................................................................66
19. PRODAN binding to BLG plotted by Cogan method (1976) to calculate K’BdB
and n for UHP treated (600 MPa) BLG with 0 min holding time at pH 5.0...........67
20. PRODAN binding to BLG plotted by Cogan method (1976) to calculate K’BdB
and n for UHP treated (600 MPa) BLG with 4 min holding time at pH 5.0...........68
21. PRODAN binding to BLG plotted by Cogan method (1976) to calculate K’BdB
and n for UHP treated (600 MPa) BLG with 8 min holding time at pH 5.0...........69
22. PRODAN binding to BLG plotted by Cogan method (1976) to calculate K’BdB
and n for UHP treated (600 MPa) BLG with 16 min holding time at pH 5.0.........70
23. PRODAN binding to BLG plotted by Cogan method (1976) to calculate K’BdB
and n for UHP treated (600 MPa) BLG with 32 min holding time at pH 5.0.........71
24. PRODAN binding to BLG plotted by Cogan method (1976) to calculate K’BdB
and n for native BLG at pH 7.0...............................................................................72
25. PRODAN binding to BLG plotted by Cogan method (1976) to calculate K’BdB
and n for UHP treated (600 MPa) BLG with 0 min holding time at pH 7.0...........73
26. PRODAN binding to BLG plotted by Cogan method (1976) to calculate K’BdB
and n for UHP treated (600 MPa) BLG with 4 min holding time at pH 7.0...........74
27. PRODAN binding to BLG plotted by Cogan method (1976) to calculate K’BdB
and n for UHP treated (600 MPa) BLG with 8 min holding time at pH 7.0...........75
xii
28. PRODAN binding to BLG plotted by Cogan method (1976) to calculate K’BdB
and n for UHP treated (600 MPa) BLG with 16 min holding time at pH 7.0.........76
29. PRODAN binding to BLG plotted by Cogan method (1976) to calculate K’BdB
and n for UHP treated (600 MPa) BLG with 32 min holding time at pH 7.0.........77
30. PRODAN binding to BLG plotted by Cogan method (1976) to calculate K’BdB
and n for native BLG at pH 9.0...............................................................................78
31. PRODAN binding to BLG plotted by Cogan method (1976) to calculate K’BdB
and n for UHP treated (600 MPa) BLG with 0 min holding time at pH 9.0...........79
32. PRODAN binding to BLG plotted by Cogan method (1976) to calculate K’BdB
and n for UHP treated (600 MPa) BLG with 4 min holding time at pH 9.0...........80
33. PRODAN binding to BLG plotted by Cogan method (1976) to calculate K’BdB
and n for UHP treated (600 MPa) BLG with 8 min holding time at pH 9.0...........81
34. PRODAN binding to BLG plotted by Cogan method (1976) to calculate K’BdB
and n for UHP treated (600 MPa) BLG with 16 min holding time at pH 9.0.........82
35. PRODAN binding to BLG plotted by Cogan method (1976) to calculate K’BdB
and n for UHP treated (600 MPa) BLG with 32 min holding time at pH 9.0.........83
Chapter 3: Application of solid-phase microextraction with headspace gas
chromatography to the analysis of diacetyl, 2-methylbutyraldehyde, ethyl lactate,
and δ-decalactone in model buffer solution
1. Exposure time of selected compounds adsorbed by a PDMS/DVB fiber ..............99
2. Exposure time of selected compounds adsorbed by a CAR/PDMS fiber.............100
3. Figure 3. Linearity data of ethyl lactate (▲, RP
2P=0.995), diacetyl (♦,
RP
2P=0.997), d-decalactone (■, RP
2P=0.951), and 2-methylbutyraldehyde (●,
xiii

RP
2P=0.954) in sodium phosphate buffer (0.01 M, pH 9.0) extracted by HS-
SPME. ..................................................................................................................101
Chapter 4: Application of solid-phase microextraction with headspace gas
chromatography to the analysis of diacetyl, 2-methylbutyraldehyde, ethyl lactate,
and d-decalactone in ultra high pressure-treated β-lactoglobulin solutions
1. Stern-Volmer plots of the fluorescence quenching of native and UHP
treated BLG after 0, 8, or 32 min by diacetyl .......................................................120
2. Stern-Volmer plots of the fluorescence quenching of native and UHP treated
BLG after 0, 8, or 32 min by ethyl lactate ............................................................121
3. Stern-Volmer plots of the fluorescence quenching of native and UHP treated
BLG after 0, 8, or 32 min by 2-methylbutyraldehyde ..........................................122
4. Stern-Volmer plots of the fluorescence quenching of native and UHP treated
BLG after 0, 8, or 32 min by δ-decalactone .........................................................123
5. Static headspace analysis of 2-methylbutyraldehyde (5 ppm) in BLG or
UHP treated BLG (600 MPa) with 0, 8, or 32 min holding time (UHP0,
UHP8, and UHP32) ..............................................................................................125
6. Static headspace analysis of δ-decalactone (5 ppm) in BLG or UHP treated
BLG (600 MPa) with 0, 8, or 32 min holding time (UHP0, UHP8, and
UHP32) .................................................................................................................126
7. Static headspace analysis of diacetyl (5 ppm) in BLG or UHP treated BLG
(600 MPa) with 0, 8, or 32 min holding time (UHP0, UHP8, and UHP32).........127
8. Static headspace analysis of ethyl lactate (5 ppm) in BLG or UHP treated
BLG (600 MPa) with 0, 8, or 32 min holding time (UHP0, UHP8, and UHP32)......128
xiv
CHAPTER ONE
INTRODUCTION
In the United States, health is a powerful driver for the food industry, especially
when nearly 60% of grocery shoppers are overweight and 12.5% of children are
diagnosed with two or more risk factors for heart disease (Sloan 2006). In Western
societies, excessive consumption of dietary fat is linked to obesity (Bray and Popkin
1999) and cardiovascular diseases (Law 2000). High intake of saturated fats, trans fats,
and cholesterol increase the risk of coronary heart disease (Law 2000). Currently, dietary
fat comprises nearly 36% of the energy content of the American diet. . The recommended
total fat intake is between 20 and 35 percent of calories for adults, and for Americans, it
is important to decrease their intake of saturated fats to less than 10 percent based on
population studies of American diets (Thompson and Veneman 2005).
One way to decrease energy from fat in the diet is to substitute low-fat foods for
high-fat foods. However, it may be difficult for some people to limit their dietary choices
to the low-fat foods. The National Dairy Council reports that foods high in energy density
are more palatable because of a high fat content, which may lead to overeating and
consequent weight gain (McBean 2000). Fat modifies the overall perception of flavor of
many foods through their effect on mouthfeel (e.g. creaminess of ice cream, richness of
whole milk) and on the volatility and threshold value of flavor compounds present
(Nawar 1996). Most flavor compounds are nonpolar, and fat is a flavor carrier for these
hydrophobic compounds (Guyot and others 1996). Therefore, when a considerable
amount of fat is removed, the flavor will be lost resulting in food that is often bland and
monotonous.
1
Advancements in food technology may offer ways of reducing fat and energy
consumption while satisfying consumer preference for high fat foods. High-fat foods
appeal to consumers because the foods are often flavorful and rich. Fat replacers or fat
substitutes are used to describe ingredients that replace fat or provide the physical and
sensory properties of fat to reduce fat in food applications, and are derived from several
chemical compounds that include carbohydrates, proteins, lipids, and synthetic
compounds (Lindsay 1996). Among the sensory qualities of reduced-fat foods, flavor is
one of the most important attributes consumers use as an index of acceptability, and
within the last 30 years, there is continued interest in improving protein functionality
through the binding of flavor compounds to proteins to improve flavor release and
perception of foods (Gremli 1974; Damodaran and Kinsella 1980; Dumont and Land
1986; Lubbers and others 1998; Guichard and Langourieux 2000; Burova and others
2003).
Basic properties of β-lactoglobulin
The Food and Drug Administration defines whey as “the liquid substance
obtained by separating the coagulum from milk, cream, or skim milk in cheese making”
(FDA 2005). For every 1 pound of cheese produced, approximately 9 pounds of liquid
whey result, and according to USDA statistics in 1999, total cheese production in the US
was 7.94 billion pounds, which equates to almost 72 billion pounds of liquid whey
(USDA 1999). Although not every dairy facility has the capability to process whey into a
usable product and often rely on disposing the whey by-product, whey can be recovered
and processed into animal feed, human food products, and pharmaceuticals.
2
β-Lactoglobulin (BLG) is a major whey protein in mammalian species, except for
rodents, lagomorphs and humans. In bovine whey, BLG is the predominant protein, at a
concentration of 2-4 g/L compared to α-lactalbumin (1-1.5 g/L), serum albumin (0.1-0.4
g/L), and immunoglobulin (0.6-1.0 g/L) (Swaisgood 1996). The characterization of BLG
by amino acid sequencing and isoelectric focusing has identified seven genetic
polymorphisms, A, B, C, D, E, F, and G (Phillips and others 1994). The most prevalent
are the A and B forms (Croguennec and others 2004) that differ by two amino acids
(substitutions Asp64 (A) � Gly (B); Val118 (A) � Ala (B)) (Brignon and Dumas 1973),
and is commercially available in pure form of either variant or as a mixture of both. BLG
is a polypeptide with a molecular weight of 18,350 Da (Brownlow and others 1997),
consisting of 162 amino acid residues. In milk, it exists as a dimer with a molecular
weight of 32,400 Da. BLG is a globular protein containing thiol and disulfide groups.
The orthorhombic crystal structure of BLG at pH 7.6 contains a nine-stranded,
flattened β-barrel or calyx and a flanking three-turn α-helix (Phillips and others 1994).
One curved face of the calyx is formed from a twisted antiparallel β-sheet containing the
N-terminal half of strand A, together with strands B-D (Figure 1) (Brownlow and others
1997). The other curved face is a similarly twisted antiparallel β-sheet containing strands
E-H and the C-terminal half of strand A. Strand A (residues 17-26) has a 90° bend at its
midpoint, Leu22, reflecting its participation in both sheets. A ninth strand (I) extends the
EFGHA sheet. The extended A-B loop (i.e. the loop connecting strand A to strand B) is
involved in hydrogen bonding interactions that form part of the dimer interface along
with strand I. The α-helix lies in the sequence between strands H and I. A disulfide bond
(Cys66-Cys160) connects the C-D loop to the carboxyl-terminal region and is on the
3
outside of the molecule, close to the mouth of the hydrophobic pocket (Brownlow and
others 1997). The second disulfide bond (Cys106-Cys119) links strands G and H. Cys121
is buried at the sheet-helix interface (Phillips and others 1994), and does not normally
participate in a disulfide linkage in BLG (Uhrinova and others 2000).
The structure of BLG is pH dependent. At acidic pH less than 3.5, the dimer
reversibly dissociates due to strong electrostatic repulsive interactions, but no
conformation changes occur (Molinari and others 1996). At pH 2.6, an overall positive
charge of BLG may cause a disruption of tertiary as well as quaternary structure
(Uhrinova and others 2000). At pH 2 to 3, at which the protein has a net charge of ~+20,
BLG is essentially monomeric under salt-free conditions (Timasheff and Townend 1961;
Baldini and others 1999; Sakurai and others 2001). In the pH range of 3.7 to 5.2, BLG
reversibly forms a larger oligomer. This self-association process has a maximum around
pH 4.6, just below the isoelectric point, and is more pronounced for BLG-A than for
BLG-B (Townend and Timasheff 1960; Timasheff and Townend 1961; McKenzie and
others 1967). Light scattering studies indicated that intermediate oligomers (tetramers
and hexamers) are present in significant amounts at 8 °C and 15 °C and at BLG
concentrations of less than 1 mM (Kumosinski and Timasheff 1966). At neutral pH and
BLG concentration greater than 50µM, BLG is predominantly dimeric. Six percent of the
monomer surface area is buried at the dimer interface where 12 intermolecular hydrogen
bonds and 2 ion pairs are involved (Brownlow and others 1997; Qin and others 1998). In
the pH range of 6-8, a reversible refolding of BLG polypeptide chains is called the
Tanford transition (Tanford and others 1959). At pH greater than 8, the open end of the
BLG calyx provides an access route to a cavity at the center of BLG, which is a binding
4
site for small hydrophobic molecules; this may be considered as an “open” conformation,
as opposed to a “closed” conformation occurring at acidic pH (2.6) (Uhrinova and others
2000).
Most lipocalins bind small hydrophobic molecules within the calyx. It has been
suggested that BLG is involved in the transport of retinol and/or fatty acids (Cogan and
others 1976; Sawyer and others 1998). A proposed retinol binding site, or hydrophobic
pocket, is located in the cavity surrounded by β strands BCDEFG where residue side
chains that line the cavity are all hydrophobic (Sawyer and others 1998). There is a
concentration of hydrophobic residues lining the cleft formed between the α-helix and
the β-sheet with charged or polar groups at one end of the cleft, thus forming a possible
site for fatty acid binding (Figure 1).
Intrinsic Protein Fluorescence
Ultraviolet spectrophotometry is a fast, accurate quantitative and nondestructive
technique used in studies of protein structure and function of membranes, polymers, and
biological macromolecules (Demchenko 1992). Fluorescence is the emission of photons
which results from the transition of paired electrons from a higher-energy orbital to the
lower orbital (Lakowicz 1983). Following light absorption, a fluorophore is excited to a
higher vibrational level. The electronic transition down to the lowest electronic level
results in an excited vibrational state. The absorption spectrum of the molecule reflects
the vibrational levels of the electronically excited states, and the emission spectrum
reflects the vibrational levels of the ground electronic state. As a result, the vibrational
structures seen in the absorption and the emission spectra are similar (Lakowicz 1983).
5
There are several intrinsic fluorophores in proteins (mainly aromatic amino acids:
tryptophan, tyrosine, and phenylalanine) that have been used to explore protein structure-
function relationships or molecule interactions in association with other physical
parameters such as temperature and pressure (Lakowicz 1983). Among these
fluorophores, the tryptophan residue (Trp) is most often used. The characteristics of its
fluorescence emission spectra depend on its environment. The emission maximum
wavelength (λBmaxB) of free Trp in aqueous solution is at about 352 nm and becomes shorter
(blue shift) when Trp is in an nonpolar solvent or in a hydrophobic environment such as
inside the protein core. The more nonpolar the environment, the larger the Trp λ B maxB blue
shift. When the protein is gradually unfolded, the Trp residue becomes more and more
exposed to the bulk aqueous solution. Then the λB maxB shifts to the red and finally reaches
352 nm (free Trp in water) when Trp is totally solvated, i.e. when the protein is fully
denatured. Therefore protein Trp fluorescence can be used as a probe related to the
medium polarity allowing for detection and following protein conformational changes,
from which information about protein structure-function, unfolding and molecule
interaction, can be obtained. In comparison with Trp, tyrosine and phenylalanine residues
in proteins have not been often used for such studies, mainly because their fluorescence
quantum yields are lower and less sensitive to the environment (Lakowicz 1983), i.e. less
sensitive to conformational changes. To measure the Trp fluorescence emission coming
only from Trp residues, without disturbance from the excitation of tyrosine and
phenylalanine residues, the protein is often excited at 295 nm or at longer wavelength,
where tyrosine and phenylalanine do not absorb (Lakowicz 1983).
Extrinsic Fluorescence
6
Some extrinsic fluorescence probes including 1-anilinonaphthalene-8-sulfonic
acid (ANS) and cis-parinaric acid (CPA) are widely used in BLG structure-function
studies, especially for determining protein hydrophobicity. Upon binding of the probes to
accessible hydrophobic regions of proteins, an increase in fluorescence is observed,
which is used as a measure of protein surface hydrophobicity. However, due to the
possible contribution of both electrostatic and hydrophobic interactions to the binding of
these anionic probes, the interpretation based on these probes has not been easy.
PRODAN (6-propionyl-2-dimethylaminonaphthalene), introduced by Weber and
Farris (1979), is a fluorescent probe that is very sensitive to the polarity of the
environment. The binding of PRODAN to protein results in a fluorescence enhancement
and a blue shift that provides for easy separation of the fluorescence contribution from
the free and bound probe (Moreno and others 1999). PRODAN is suitable for studies of
polarity of many protein cavities by spectroscopic techniques (McGregor and Weber
1986). Other uses for PRODAN were described for the study of pressure effects on
ligand-protein complexes (Chong and Weber 1983) and on the dielectric constant in
phosphatidylcholine lipid bilayers (Chong 1988).
Using an uncharged probe (PRODAN) for measuring protein surface
hydrophobicity, especially under conditions of varying pH, is advantageous over using
anionic probes ANS and CPA. Alizadeh-Pasdar and Li-Chan (2000) reported low surface
hydrophobicity of BLG when using ANS or CPA at pH 3.0 as opposed to relatively high
surface hydrophobicity when using PRODAN for unheated and heated (80°C) BLG. The
presence or absence of a permanent charge results in electrostatic interactions that may
overestimate protein hydrophobicity determined under selected pH conditions (Alizadeh-
7
Pazdar and Li-Chan 2000). Haskard and Li-Chan (1998) reported that increasing the
ionic strength of buffers to 1.0 M NaCl had a negative effect on surface hydrophobicity
determination of bovine serum albumin when using ANS and no significant effect when
using PRODAN.
Flavor-Protein Interactions
Flavor is considered one of the most important attributes of food in the
determination of acceptance by a consumer. The mixture of odorous compounds that is
present in food is often very complex. Individual components may be present in
extremely small concentrations (µg to sub-pg/Kg) and may be unstable or volatile. As a
consequence, it is difficult to concentrate flavor compounds from foods representative of
the original flavor and free of contaminants and artifacts.The quantities of flavor
compounds perceived by the human nose are determined by the release of flavor
compounds from the food matrix. The rate of release is based on the affinity of the flavor
compounds for biopolymers that make up the food matrix.
The predominant influence of proteins on flavor release and perception is caused
by interactions of flavor components with the protein. The interactions that occur
between proteins and flavor compounds are either reversible binding, including hydrogen
bonds, hydrophobic interactions, and ionic bonds, or irreversible binding via covalent
linkages and the condensation of aldehydes with amino (NHB2B) and sulfhydryl (SH)
groups (Izzo and Ho 1993; Fischer and Widder 1997; Lubbers and others 1998; Adams
and others 2001).
One of the most widely used proteins in flavor binding studies is BLG, which is
known to interact with many flavor compounds, such as ketones, ionones, aldehydes, and
8
esters (van Ruth and Villeneuve 2002). Increases in percentage of retention of BLG with
increasing chain length for a series of alkanones and ethyl esters suggest hydrophobic
interactions (Andriot and others 2000). Most of the binding that occurs between the
flavor compound and BLG is reversible through hydrophobic affinity and hydrogen
binding (Tromelin and Guichard 2003; Guichard 2006). Any factor affecting
hydrophobic affinity or surface hydrophobicity of BLG influences flavor binding.
Salting-in-type salts, such as BaClB2B, CaClB2B, MgClB2B and MnClB2B, destabilizes hydrophobic
interactions thereby decreasing flavor binding, whereas salting-out type salts, such as
MgSO B4B and Na B2BSO B4B, increase flavor binding through preferential hydration of proteins
(Arakawa and Timasheff 1984). Two opposing factors, the surface tension effect
contributing to an unfavorable free energy change and the salt binding to peptide bonds
and some side chains as major sources of favorable free energy, are responsible for
protein preferential interactions with salts (Arakawa and Timasheff 1984). The binding of
salting-out type salts to proteins is greater than the binding of salting-in type salts to
proteins is due to the surface tension effect that leads to significant preferential hydration
of proteins.
BLG is a possible carrier for flavor compounds and may be effective in delivering
or delaying release of flavor compounds. BLG can be altered to bind to a wide range of
volatile flavor compounds during food manufacturing or to release these flavor
compounds in a more or less controlled way upon modifications through chemical or
thermal means (Kuhn and others 2006).
Ultra High Hydrostatic Pressure of Foods
9
Introduced in 1899 by Bert H. Hite for the preservation of milk, meats, and juices
by high pressure processing (Johnston 1995), ultra-high pressure (UHP), or high
hydrostatic pressure (HHP), treatment of foods and other biological tissues affects the
structural stability of chemical constituents, including proteins, vitamins, lipids,
saccharides and pigments in such a way that may improve their intrinsic functional
properties in terms of color, flavor, and texture retention. UHP treatment involves
subjecting food materials to a high pressure (up to 87,000 pounds per square inch or 600
MPa) and holding (isobarically) the food under constant pressure for a specific period of
time (less than 30 min) before pressure release. UHP is sufficient in bringing about the
necessary level of treatment in terms of protein conformational change, microbial
deactivation, and extended shelf-life (Tedford and others 1999). There is a growing body
of literature concerning the effects of UHP on selected food ingredients. Reversible
effects such as dissociation of polymeric structures or partial unfolding are observed
below 200 MPa (Iametti and others 1997). Structural changes are induced in proteins
when pressures greater than 200 MPa are employed. Pressures greater than 500 MPa
result in irreversible unfolding of monomeric proteins, aggregation of monomers
stabilized by thiol/disulfide interchange reactions (Futenberger and others 1997), and
formation of gel structures of stable polymers made of denatured monomers, yet only
occurs in 10% of the total protein as observed by circular dichroism (Iametti and others
1997). However, temperature induces irreversible denaturation of the whole protein
through the hydrolysis of covalent bonds and/or aggregation of denatured proteins
(Tedford and others 1999).
10
Effects on protein structure
The effects of pressure on proteins can be understood in terms of the Le Chatelier
principle which states that any reaction, conformational change, or phase transition that is
accompanied by a decrease in volume will be enhanced when pressure increases, while
reactions involving an increase in volume will be inhibited (Johnston 1995; Ledward
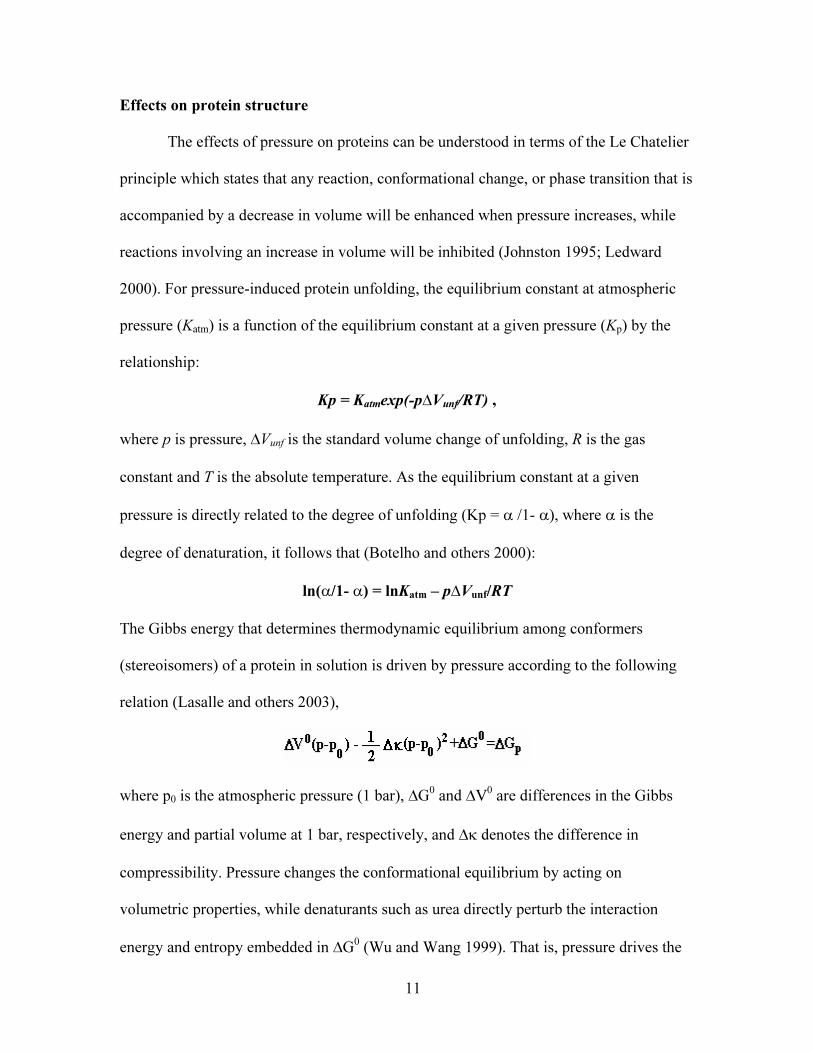
2000). For pressure-induced protein unfolding, the equilibrium constant at atmospheric
pressure (KBatm B) is a function of the equilibrium constant at a given pressure (KBpB) by the
relationship:
Kp = KBatmBexp(-p∆VBunfB/RT) ,
where p is pressure, ∆V BunfB is the standard volume change of unfolding, R is the gas
constant and T is the absolute temperature. As the equilibrium constant at a given
pressure is directly related to the degree of unfolding (Kp = α /1- α), where α is the
degree of denaturation, it follows that (Botelho and others 2000):
ln(α/1- α) = lnKBatmB – p∆VBunfB/RT
The Gibbs energy that determines thermodynamic equilibrium among conformers
(stereoisomers) of a protein in solution is driven by pressure according to the following
relation (Lasalle and others 2003),
where p B0B is the atmospheric pressure (1 bar), ∆GP
0P and ∆V P
0P are differences in the Gibbs
energy and partial volume at 1 bar, respectively, and ∆κ denotes the difference in
compressibility. Pressure changes the conformational equilibrium by acting on
volumetric properties, while denaturants such as urea directly perturb the interaction
energy and entropy embedded in ∆G P
0P (Wu and Wang 1999). That is, pressure drives the
11
equilibrium to increase the population of the lower volume conformer to the higher
volume conformer (Weber and Drickamer 1983).
Proteins in solution may adopt a variety of conformations between the native state
and the fully denatured state. The molten globule state is one of the conformations
observed in globular proteins that is thermodynamically stable (Ptitsyn 1995) and is a
compact denatured state under mild denaturing conditions with native-like secondary
structure, with loss of tight native tertiary structure (Yang and others 2001). While in the
molten globule state, the amino acid residues exhibit increased mobility compared to the
native state (Ptitsyn 1995). Molten globules have increased exposure and hydration of
hydrophobic residues compared with the native state (Dagget and Levitt 1992), as
evidenced by increased binding of hydrophobic probes, especially ANS (Yang and others
2001), decreased solubility in water, increased susceptibility to aggregation, and
increased heat capacity (Ptitsyn 1987).
The molten globule state can be induced for many proteins using chemical and
physical methods such as acid denaturation, chemical denaturants (urea or guanidine
hydrochloride), heating, high pressure treatment, or ethanol (Kumar and others 2004)
(Engelhard and Evans 1995; Yang and others 2001; Mazon and others 2004; Paci and
others 2005).
Pressure may affect the secondary, tertiary, and quaternary structure of proteins.
Moderate pressure does not disrupt secondary structures because hydrogen bonds that
stabilize the secondary structure are not affected by the little effect of pressure (Masson
and Clery 1996). Belloque and others (2000) showed that at pressure treatments of 300
and 400 MPa, the BLG structure exhibits a high degree of flexibility through the
12
exposure of a thiol group near β-strands FGH, and exists in a completely unfolded state.
However, the conformation of the BLG core after pressure release is identical to the
native structure. The preservation of the core implies that most of the β-barrel is
structured. Belloque and others (2000) suggested that after pressure treatment of 400
MPa, complete refolding of BLG may occur when BLG is returned to ambient pressure
or during pressurization BLG did not unfold completely. Iametti and others (1997) used
circular dichroism and fluorometry and observed that only 10% of the BLG structure was
lost at both 600 and 900 MPa. Moller and others (1998) reported that the exposure of the
thiol group after pressure treatment of 150 MPa decreased after 2 days, indicating the
refolding of BLG. Hydrophobic amino acids are found in discrete patches on the surface
of proteins. Iametti and Bonomi (1993) reported that physical denaturing agents can
modify the number and properties of these surface hydrophobic patches. After pressure
treatment of 900 MPa, a decrease in the number of surface hydrophobic sites was
observed with a concomitant decrease of the affinity of BLG for hydrophobic probes
(Iametti and others 1997).
Effects on flavor-protein binding
UHP treatment changes the structure of BLG, thus affecting the protein-flavor
interactions. Liu and others (2005) have reported effects of UHP treatment on whey
protein-flavor binding using fluorescence spectroscopy and headspace analysis.
Depending on the structure of the flavor compounds, benzaldehyde and methyl ketones,
the flavor concentration, and UHP treatment times, the number of binding sites and
apparent dissociation constants were either unaffected or increased upon UHP treatment
(Liu and others 2005).
13

Solid Phase Microextraction
Sample preparation techniques based on adsorption have been applied for the
extraction of volatiles for instrumental analysis (Yang and Peppard 1994). Solid phase
microextraction (SPME), developed by Pawliszyn and co-workers (Arthur and Pawliszyn
1990; Zhang and others 1994), involves the extraction of compounds onto a chemically
modified fused silica optical fiber. It is a convenient and solvent-free method that is
suitable for the analysis of food, beverages, oils (Page and Lacroix 1993; Yang and
Peppard 1994; Steffen and Pawliszyn 1996; Ai 1997; Kataoka and others 2000), and
many dairy products, including the detection of flavor compounds in headspace of β-
lactoglobulin (Jung and Ebeler 2003). SPME is used in combination with gas
chromatography (GC) (Rocha and others 2001), GC-mass spectrometry (GC-MS) (Jelen
and others 2003), and GC-olfactometry (GC-O) (Rega and others 2003), and introduced
for direct coupling with HPLC and LC-MS for the analysis of weak volatile or thermally
labile compounds not amenable to GC or GC-MS (Pawliszyn 1999).
SPME is a multiphase equilibrium process. Most extraction systems are complex
consisting of an aqueous phase with suspended particles having various adsorption
interactions with analytes, and a gaseous headspace. During extraction, analytes migrate
between all three phases until equilibrium is reached. A number of factors must be
considered to ensure good accuracy and precision in the development of a SPME method.
The SPME fiber coating is determined by the chemical nature of the target analyte, and
its polarity and volatility characteristics. Polydimethylsiloxane (PDMS) is often
considered first for its rugged liquid coating to withstand high injector temperatures, up
to about 300 °C. PDMS is a nonpolar phase that extracts nonpolar analytes very well.
14
However, it can be successfully applied to extract more polar analytes, particularly after
optimizing extraction conditions. It is important to consider the use of mixed phase
coatings for extraction of volatile compounds, and perform experiments with different
fibers to identify the optimal coating type for a broad range of compound characteristics
(Pawliszyn 1997).
The extraction mode is selected by considering the sample matrix, analyte
volatility, and its affinity to the matrix. Headspace extraction is preferred due to faster
equilibration times and for medium to high volatile analytes. For very polar analytes,
such as acids and bases, which can have high affinity toward the matrix, changing the pH
of the matrix can improve extraction.
Efficient desorption and rapid transfer of the analytes from the injector of the GC
to the column require high linear flow rates of the carrier gas around the coating, and can
be accomplished by using a narrow bore injector insert. Temperature also plays an
important role in accelerating the desorption process. When the maximum allowable
coating temperature is used as the injector temperature, adjustment of the desorption time
facilitates quantitative desorption in a single injection.
The equilibration time is defined as the time after which the amount of analyte
extracted remains constant and corresponds within the limits of experimental error to the
amount extracted at infinite extraction time (Pawliszyn 1999). When equilibration times
are excessively long, shorter extraction times can be used. Care must be taken when
determining the equilibration time in HS-SPME determinations, especially when a rapid
rise of the equilibration curve is followed by a very slow increase that is related to the
mass transfer of the analyte from water through the headspace to the fiber. At
15
equilibrium, small variations in the extraction time do not affect the amount of the
analyte extracted by the fiber. However, at the steep part of the curve, even small
variations in the extraction time may result in significant variations in the amount
extracted.
Gas Chromatography
Gas chromatography (GC) with inactive glass capillary columns is the most
suitable method for the separation of flavor compounds. Gas chromatography is used
extensively to analyze fatty acids, sterols, aldehydes, ketones, carbonyls, alcohols, and
other volatiles and derivatized flavor compounds. Some of the purposes of using GC are
to separate mixtures of compounds; determine the quantity of individual compounds in a
mixture; and analyze aroma components, solvents, pesticides, or additives.
GC is a technique for separating chemical compounds in which a compound is
carried by a mobile phase streaming through a column where separation is being affected
by interaction of individual compounds with the stationary phase of the column. The
mobile phase may be a gas and the stationary phase may be a liquid film on the surface of
an inert support material or a solid surface. Affinity of the solute for the stationary phase
results in retardation of its movement through the chromatography system. The
distribution ratio (K) defines the distribution of compounds between the mobile phase and
the stationary phase at equilibrium, and is described as
where CBSB is the concentration of a compound in the stationary phase per unit volume, and
CBMB is the concentration of a compound in the mobile phase per unit volume. Each
16
compound separated will ideally have a different K, reflecting relative affinities for the
stationary phase.
The factors that influence the distribution and retention of volatile compounds are
composition and properties of the mobile phase and stationary phase; the intermolecular
forces among component(s), stationary and mobile phases; and temperature. The
intermolecular forces that influence retardation of components are based on Coulomb’s
Law,
where F is the force between charged particles, qBa B and q BbB. The separation between the
particles is r, and k is a constant (8.99 x 10 P
9P NmP
2P/cP
2P). Coulomb’s Law is the interaction
between charged molecules, such that when F is negative the force between the
molecules is attractive (Pratt and Pumplin; Braithwaite and Smith 1999). The two main
types of electrostatic interactions are polar van der Waal’s retention forces from
interaction between molecules with surface charge and nonpolar dispersion forces
between neutral molecules or functional groups.
An ideal chromatogram is judged by the resolution between peaks where adjacent
peaks are resolved sufficiently so that accurate determination of the peak areas can be
obtained (Braithwaite and Smith 1999). Therefore, there should be a baseline separation
between the peaks and no overlap of the tail of one peak with the leading edge of the next
peak. Resolution is a function of retention characteristics of the components (k), column
efficiency (N) and the selectivity or separating capabilities (α) of the column:
17
where tBR B is the retention time, w BhB is the width at half height of the peak, and N is column
efficiency. For a given column length, optimum column efficiency is obtained when the
equilibrium step or plate height is at a minimum, described by the van Deemter equation:
where the A term describes the eddy diffusion of component molecules and the variable
pathways the mobile phase may follow through the stationary phase packing in the
capillary column; the B term describes the random motion of molecules dispersed in the
mobile phase along the longitudinal axis of the column, or longitudinal diffusion; and the
C term describes molecules’ constant movement between the mobile and stationary
phases to establish equilibrium defined by the distribution ratio, K.
Many studies on the binding between flavor compounds and proteins focused on
methods to study interactions between protein and flavor compounds (Jung and others
2002; Jung and Ebeler 2003), modeling flavor release (Castellano and Snow 2001),
reduction of off-flavors of soy products (Zhou and Cadwallader 2006), developing new
soy products (Zhou and others 2006), adding flavor to emulsions with proteins as
emulsifiers (Pelletier and others 1998), and adding sulfur-containing compounds for
roasted and savory flavors to meat products (Adams and others 2001). Considine and
others (2005) reported that nonflavor ligands added prior to high pressure treatment
inhibited the formation of intermediate, non-native protein species. Therefore, further
investigation on the binding of flavor compounds associated with high-fat foods with
proteins for use in reduced-fat foods, and the addition of flavor ligands to protein prior to
UHP treatment is warranted.
18
There is an increasing demand for healthier low-fat foods. In reduced-fat foods,
carbohydrates and proteins are dominant components that interact differently with flavor
compounds compared with fat, and thus change the perceived flavor. Therefore, a better
understanding of the science behind protein-flavor interactions is required for the
development of improved food flavor, particularly that of low-fat foods.
Investigation of UHP on the flavor binding capabilities of BLG will assist in the
design of proteins as a flavor carrier system in reduced-fat foods.
The objectives of this research are to:
1) evaluate the combined effects of UHP and holding time at selected pH
values on the hydrophobic properties of BLG using intrinsic
tryptophan and an extrinsic fluorescence probe;
2) develop a method to extract and quantitate selected flavor compounds
using headspace-solid phase microextraction gas chromatography from
a buffer solution; and
3) investigate the binding properties of selected flavor compounds with
both untreated and UHP treated BLG through the use of intrinsic
fluorescence quenching and static headspace analysis.
(Moller and others 1998)
(Considine and others 2005)
19
REFERENCES
Adams RL, Mottram DS, Parker JK, Brown HM. 2001. Flavor-protein binding: disulfide
interchange reactions between ovalbumin and volatile disulfides. J. Agric. Food Chem.
49: 4333-4336.
Ai J. 1997. Headspace solid phase microextraction. Dynamics and quantitative analysis
before reaching a partition equilibrium. Anal. Chem. 69: 3260-3266.
Alizadeh-Pazdar N, Li-Chan ECY. 2000. Comparison of protein surface hydrophobicity
measured at various pH values using three different fluorescent probes. J. Agric. Food
Chem. 48: 328-334.
Andriot I, Harrison M, Fournier N, Guichard E. 2000. Interaction between methyl
ketones and β-lactoglobulin: sensory analysis, headspace analysis, and mathematical
modeling. J. Agric. Food Chem. 48: 4246-4251.
Arakawa T, Timasheff SN. 1984. Mechanism of protein salting in and salting out by
divalent cation salts; balance between hydration and salt binding. Biochem. 23: 5912-
5923.
Arthur CL, Pawliszyn J. 1990. Solid phase microextraction with thermal desorption using
fused silica optical fibers. Anal. Chem. 62: 2145-2148.
Baldini G, Beretta S, Chirica G, Franz H, Maccioni E, Mariani P, Spinozzi F. 1999. Salt-
induced association of b-lactoglobulin by light and X-ray scattering. Macromolecules 32:
6128-6138.
Botelho MM, Valente-Mesquita VL, Oliveira KMG, Polikarpov I, Ferreira ST. 2000.
Pressure denaturation of β-lactoglobulin. Eur. J. Biochem 267: 2235-2241.
Braithwaite A, Smith FJ. 1999. Chromatographic methods. Dordrecht: Kluwer Academic
Publishers. 559p.
Bray GA, Popkin BM. 1999. Dietary fat intake does affect obesity. Amer. J. Clin. Nutr.
68(6): 1157-1173.
Brignon G, Dumas BR. 1973. Localisation dans la chaine peptidique de la b
lactoglobuline bovine de la substitution Glu/Gln differenciant les variants genetiques B et
D. FEBS Lett. 33: 73-76.
Brownlow S, Cabral JHM, Cooper R, Flower DR, Yewdall SJ, Polikarpov I, North ACT,
Sawyer L. 1997. Bovine β-lactoglobulin at 1.8Α resolution - still an enigmatic lipocalin.
Structure 5: 481-495.
20
Burova TV, Grinberg NV, Grinberg VY, Tolstoguzov VB. 2003. Binding of odorants to
individual proteins and their mixtures. Effects of protein denaturation and association. A
plasticized globule state. Colloids Surfaces. A. Physico. Eng. Aspects 213: 235-244.
Castellano J, Snow NH. 2001. Modeling flavor release using inverse gas
chromatography-mass spectrometry. J. Agric. Food Chem. 49: 4296-4299.
Chong PL. 1988. Effects of hydrostatic pressure on the location of PRODAN in lipid
bilayers and cellular membranes. Biochem. 27: 399-404.
Chong PL, Weber G. 1983. Pressure dependence of 1,6-diphenyl-1,3,5-hexatrine
fluorescence in single-component phosphatidylcholine liposomes. Biochem. 22: 5544-
5551.
Cogan U, Kopelman M, Mokady S, Shinitzky M. 1976. Binding affinities of retinol and
related compounds to retinol bindin proteins. Eur. J. Biochem. 65: 71-78.
Considine T, Singh H, Patel HA, Creamer LK. 2005. Influence of binding of sodium
dodecyl sulfate, all-trans-retinol, and 8-anilino-1-naphthalenesulfonate on the high-
pressure-induced unfolding and aggregation of b-lactoglobulin B. J. Agric. Food Chem.
53: 8010-8018.
Croguennec T, O'Kennedy BT, Mehra R. 2004. Heat-induced denaturation/aggregation of
β-lactoglobulin A and B: kinetics of the first intermediates formed. Int. Dairy J. 14: 399-
409.
Dagget V, Levitt M. 1992. A model of the molten globule state from molecular dynamics
simulations. Proc. Natl. Acad. Sci. 89: 5142-5146.
Damodaran S, Kinsella JE. 1980. Flavor protein interactions. Binding of carbonyls to
bovine serum albumin: thermodynamic and conformation effects. J. Agric. Food Chem.
28: 567-571.
Demchenko AP. 1992. Fluorescence and dynamics in proteins. In: Lakowicz JR. Topics
in fluorescence spectroscopy. New York: Plenum Press. p 65-111.
Dumont JP, Land DG. 1986. Binding of diacetyl by pea proteins. J. Agric. Food Chem.
34: 1041-1045.
Engelhard M, Evans PA. 1995. Kinetics of interaction of partially folded proteins with a
hydrophobic dye: evidence that molten globule character is maximal in early folding
intermediates. Prot. Sci. 4: 1553-1562.
Food and Drug Administration. 2005. Direct food substances affirmed as generally
recognized as safe. FDA.
21
Fischer N, Widder S. 1997. How proteins influence food flavor. Food Technol. 51(1): 68-
70.
Futenberger S, Dumay E, Cheftel JC. 1997. High-pressure promotes β-lactoglobulin
aggregation through SH/S-S interchange reactions. J. Agric. Food Chem. 45: 912-921.
Gremli HA. 1974. Interaction of flavor compounds with soy protein. J. Am. Oil Chem.
Soc. 51: A95-A97.
Guichard E. 2006. Flavour retention and release from protein solutions. Biotech. Adv. 24:
226-229.
Guichard E, Langourieux S. 2000. Interactions between β-lactoglobulin and flavor
compounds. Food Chem. 71: 301-308.
Guyot C, Bonnafont C, Lesschaeve I, Issanchou S, Voilley A, Spinnler HE. 1996. Effect
of fat content on odor intensity of three aroma compounds in model emulsions: D-
decalactone, diacetyl, and butyric acid. J. Agric. Food Chem. 44(8): 2341-2348.
Iametti S, Transidico P, Bonomi F, Vecchio G, Pittia P, Rovere P, Dall'Aglio G. 1997.
Molecular modifications of β-lactoglobulin upon exposure to high pressure. J. Agric.
Food Chem. 45: 23-29.
Izzo HV, Ho CT. 1993. Effect of residual amide content on aroma generation and
browning in heated gluten-glucose model systems. J. Agric. Food Chem. 41: 2364-2367.
Jelen HH, Majcher M, Zawirska-Wojtasiak R, Wiewiorowska M, Wasowicz E. 2003.
Determination of geosmin, 2-methylisoborneol, and a musty-earthy odor in wheat grain
by SPME-GC-MS, profiling volatiles, and sensory analysis. J. Agric. Food Chem. 51:
7079-7085.
Johnston DE. 1995. High pressure effects on milk and meat. In: Ledward DA, Johnston
DE, Earnshaw RG and Hasting APM. High pressure processing of foods. Loughborough:
Nottingham University Press. p 99-121.
Jung D, Ebeler SE. 2003. Headspace solid-phase microextraction method for the study of
the volatility of selected flavor compounds. J. Agric. Food Chem. 51: 200-205.
Jung D, Ebeler SE. 2003. Investigation of binding behavior of α- and β-ionones to β-
lactoglobulin at different pH values using a diffusion-based NOE pumping technique. J.
Agric. Food Chem. 51: 1988-1993.
Jung D-M, de Ropp JS, Ebeler SE. 2002. Application of pulsed field gradient NMR
techniques for investigating binding of flavor compounds to macromolecules. J. Agric.
Food Chem. 50: 4262-4269.
22
Kataoka H, Lord HL, Pawliszyn J. 2000. Applications of solid-phase microextraction in
food analysis. J. Chrom. A 880: 35-62.
Kuhn J, Considine T, Singh H. 2006. Interactions of milk proteins and volatile flavor
compounds: Implications in the development of protein foods. J. Food Sci. 71: R72-R82.
Kumar Y, Tayyab S, Muzammil S. 2004. Molten-globule like partially folded states of
human serum albumin induced by fluoro and alkyl alcohols at low pH. Arch. Biochem.
Biophys. 426: 3-10.
Kumosinski TF, Timasheff SN. 1966. Molecular interactions in b-lactoglobulin, X: The
stoichiometry of the β-lactoglobulin mixed tertramerization. J. Am. Chem. Soc.
88(5635-5642).
Lakowicz JR. 1983. Principles of fluorescence spectroscopy. New York: Plenum Press.
496p.
Lasalle MW, Li H, Yamada H, Akasaka H, Redfield C. 2003. Pressure-induced unfolding
of the molten globule of all-Ala α-lactalbumin. Prot. Sci. 12: 66-72.
Law M. 2000. Dietary fat and adult diseases and the implications for childhood nutrition:
an epidemic approach. Am. J. Clin. Nutr. 72: 1291S-1296S.
Ledward DA. 2000. Effects of pressure on protein structure. High Pressure Res. 19: 1-10.
Lindsay RC. 1996. Food additives. In: Fennema OR. Food Chemistry. Third Edition.
New York: Marcel Dekker, Inc. p 767-821.
Liu X, Powers JR, Swanson BG, Hill HH, Clark S. 2005. Modification of whey protein
concentrate hydrophobicity by high hydrostatic pressure. Innov. Food Sci. Emerg.
Technol. 6(3): 310-317.
Lubbers S, Landy P, Voilley A. 1998. Retention and release of aroma compounds in
foods containing proteins. Food Technol. 52: 68-74, 208-214.
Masson P, Clery C. 1996. Pressure-induced molten globule states of proteins. In: Hayashi
R. High pressure bioscience and biotechnology. London: Elsevier Applied Science
Publishers. p 117-126.
Mazon H, Marcillat O, Forest E, Smith DL, Vial C. 2004. Conformational dynamics of
the GdmHCl-induced molten globule state of creatine kinase monitored by hydrogen
exchange and mass spectrometry. Biochem. 43: 5045-5054.
McBean LD. 2000. Insights into weight management. Dietary determinants of obesity.
HTThttp://www.nationaldairycouncil.org/NationalDairyCouncil/Health/Digest/dcd71-
2Page3.htmTT H. 05-02-06
23
McGregor RB, Weber G. 1986. Estimation of the polarity of the protein interior by
optical spectroscopy. Nature 319: 70-73.
McKenzie HA, Sawyer WH, Smith MB. 1967. Optical rotatory dispersion and
sedimentation in the study of association-dissociation: bovine β-lactglobulins near pH 5.
Biochim. Biophys. Acta 147: 73-92.
Molinari H, Ragona L, Varani L, Musco G, Consonni R, Zetta L, Monaco HL. 1996.
Partially folded structure of monomeric bovine β-lactoglobulin. FEBS Letters 381: 237-
243.
Moller RE, Stapelfeldt H, Skibsted LH. 1998. Thiol reactivity in pressure-unfolded β-
lactoglobulin. Antioxidative properties and thermal refolding. J. Agric. Food Chem. 46:
425-430.
Moreno F, Cortijo M, Gonzalez-Jimenez J. 1999. The fluorescent probe Prodan
characterizes the warfarin binding site on human serum albumin. Photochem. and
Photobiol. 69(1): 8-15.
Nawar WW. 1996. Lipids. In: Fennema OR. Food chemistry. Third Edition. New York:
Marcel Dekker, Inc. p 225-319.
Paci E, Greene LH, Jones RM, Smith LJ. 2005. Characterization of the molten globule
state of retinol-binding protein using a molecular dynamics simulation approach. FEBS J.
272: 4826-4838.
Page B, Lacroix G. 1993. Application of solidphase microextraction to the headspace gas
chromatographic analysis of halogenated volatiles in selected foods. J. Chrom. 48: 199-
211.
Pawliszyn J. 1997. Solid phase microextraction: theory and practice. New York: Wiley-
VCH, Inc. 247p.
Pawliszyn J. 1999. Applications of solid phase microextraction. Cambridge: The Royal
Society of Chemistry. 655.
Pelletier E, Sostmann K, Guichard E. 1998. Measurement of interactions between b-
lactoglobulin and flavor compounds (esters, acids, and pyrazines) by affinity and
exclusion size chromatography. J. Agric. Food Chem. 46(4): 1506-1509.
Phillips LG, Whitehead DM, Kinsella JE. 1994. Structural and chemical properties of β-
lactoglobulin. In: Structure-function properties of food proteins. New York: Academic
Press. p 75-106.
24
Pratt S, Pumplin J. Coulomb's law.
HTThttp://www.pa.msu.edu/courses/1997spring/PHY232/lectures/coulombslaw/TTH. July 15,
2006
Ptitsyn OB. 1987. Protein folding: hypotheses and experiments. J. Prot. Chem. 6: 273-
293.
Ptitsyn OB. 1995. Molten globule and protein folding. Adv. Prot. Chem. 47: 83-229.
Qin BY, Bewley MC, Creamer LK, Baker HM, Baker EN, Jameson GB. 1998. Structural
basis of the tanford transition of bovine β-lactoglobulin. Biochem. 37: 14014-14023.
Rega B, Fournier N, Guichard E. 2003. Solid phase microextraction (SPME) of oragne
juice flavor: odor representativeness by direct gas chromatography olfactometry (D-GC-
O). J. Agric. Food Chem. 51: 7092-7099.
Rocha S, Ramalheira V, Barros A, Delgadillo I, Coimbra MA. 2001. Headspace solid
phase microextraction (SPME) analysis of flavor compounds in wine. Effect of the
matrix volatile composition in the relative response factors in a wine model. J. Agric.
Food Chem. 49: 5142-5151.
Sakurai K, Oobatake M, Goto Y. 2001. Salt-dependent monomer-dimer equilibrium of
bovine β-lactoglobulin at pH 3. Prot. Sci. 10: 2325-2335.
Sawyer L, Brownlow S, Polikarpov I, Wu SY. 1998. β-Lactoglobulin: structural studies,
biological clues. Int. Dairy J. 8: 65-72.
Sloan AE. 2006. Top 10 functional food trends. Food Technol. 60(4): 22-39.
Steffen A, Pawliszyn J. 1996. Analysis of flavor volatiles using headspace solid-phase
microextraction. J. Agric. Food Chem. 44: 2187-2193.
Swaisgood HE. 1996. Characteristics of milk. In: Fennema OR. Food chemistry. New
York: Marcel Dekker, Inc. p 841-878.
Tanford C, Bunville LG, Nozaki Y. 1959. The reversible transformation of β-
lactoglobulin at pH 7.5. J. Am. Chem. Soc. 81: 4032-4035.
Tedford L-A, Smith D, Schaschke CJ. 1999. High pressure processing effect on the
molecular structure of ovalbumin, lysozyme and β-lactoglobulin. Food Res. Int. 32: 101-
106.
Thompson TG, Veneman AM. 2005. Dietary guidelines for Americans 2005.
HTTwww.health.gov/dietaryguidelines/dga2005/document/html/chapter6.htmTTH. 10-6-06
25
Timasheff SN, Townend R. 1961. Molecular interactions in β-lactoglobulin, V: The
association of the genetic species of β-lactoglobulin below the isoelectric point. J. Am.
Chem. Soc. 83: 464-469.
Timasheff SN, Townend R. 1961. Molecular interactions in β-lactoglobulin. VI. The
dissociation of the genetic species of β-lactoglobulin at acid pH's. J. Am. Chem. Soc. 83:
470-473.
Townend R, Timasheff SN. 1960. Molecular interactions in β-lactoglobulin. III. Light
scattering investigation of the stoichiometry of the association between pH 3.7 and 5.2. J.
Am. Chem. Soc. 82: 3168-3174.
Tromelin A, Guichard E. 2003. Use of catlyst in a 3D-QSAR study of the interactions
between flavor compounds and β-lactoglobulin. J. Agric. Food Chem. 51: 1977-1983.
Uhrinova S, Smith MH, Jameson GB, Uhrin D, L. S, Barlow PN. 2000. Structure changes
accompanying pH-induced dissociation of the β-lactoglobulin dimer. Biochem. 39: 3565-
3574.
USDA. 1999. Dairy products 1999 summary.
HTThttp://usda.mannlib.cornell.edu/reports/nassr/dairy/pdp-bban/daryan00.txtTTH.
van Ruth SM, Villeneuve E. 2002. Influence of β-lactoglobulin, pH and presence of other
aroma compounds on the air/liquid partition coefficients of 20 aroma compounds varying
in functional group and chain length. Food Chem. 79: 157-164.
Weber G, Drickamer HG. 1983. The effect of high pressure upon proteins and other
biomolecules. Q. Rev. Biophys. 16: 89-112.
Wu JW, Wang ZX. 1999. New evidence for the denaturant binding model. Prot. Sci. 8:
2090-2097.
Yang J, Dunker AK, Powers JR, Clark S, Swanson BG. 2001. β-Lactoglobulin molten
globule induced by high pressure. J. Agric. Food Chem. 49: 3236-3243.
Yang X, Peppard T. 1994. Solid-phase microextraction for flavor analysis. J. Agric. Food
Chem. 42: 1925-1930.
Zhang Z, Yang MJ, Pawliszyn J. 1994. Solid phase micro-extraction. J. Anal. Chem. 66:
844A-853A.
Zhou Q, Cadwallader KR. 2006. Effect of flavor compound chemical structure and
environmental relative humidity on the binding of volatile flavor compounds to
dehydrated soy protein isolates. J. Agric. Food Chem. 54: 1838-1843.
26
Zhou Q, Lee S-Y, Cadwallader KR. 2006. Inverse gas chromatographic evaluation of the
influence of soy protein on the binding of selected butter flavor compounds in a wheat
soda cracker system. J. Agric. Food Chem. 54: 5516-5520.
27
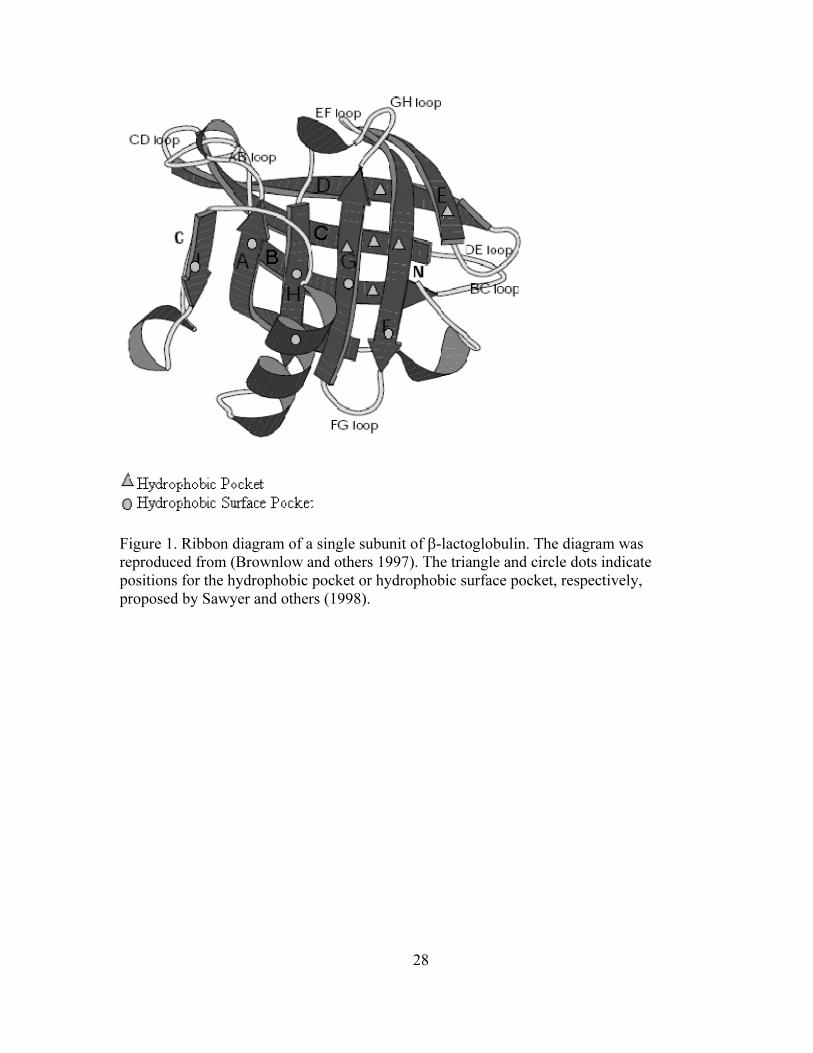
Figure 1. Ribbon diagram of a single subunit of β-lactoglobulin. The diagram was
reproduced from (Brownlow and others 1997). The triangle and circle dots indicate
positions for the hydrophobic pocket or hydrophobic surface pocket, respectively,
proposed by Sawyer and others (1998).
28

CHAPTER TWO
Surface Hydrophobicity of Ultra High Pressure Treated β-Lactoglobulin –
PRODAN Fluorescent Probe
Tinyee HoangP
1P, Joseph R. Powers P
1P, John K. Fellman P
2P, Stephanie ClarkP
1P and Barry
SwansonP
1P
(1) Dept. of Food Science & Human Nutrition, (2) Dept. of Horticulture & Landscape
Architecture, Washington State Univ., PO Box 646376, Pullman, WA 99164-6376
29
ABSTRACT
The effects of ultra-high hydrostatic pressure (UHP) treatment at 600 MPa with
treatment times of 0 to 32 min and pH values of 3.0 to 9.0 on intrinsic tryptophan
fluorescence of β-lactoglobulin (BLG) and the binding properties of 6-propionyl-2-
(dimethylamino)-naphthalene (PRODAN) extrinsic probe to BLG were studied. UHP
treatment of BLG at selected pH values resulted in increases in tryptophan fluorescence
peak intensities with unfolding of BLG structure. A red shift in the emission peak
wavelength after UHP come-up time at pH 7.0 indicated an increase in the polarity of the
microenvironment of tryptophan. Significant increases in surface hydrophobicity of
UHP-treated BLG were observed with the greatest value at pH 9.0 after come-up time,
probably resulting from irreversible unfolding and exposure of hydrophobic sites of BLG
to PRODAN. Significant changes in the number of binding sites and increases in
dissociation constants of BLG for PRODAN were observed as a function of pH and UHP
treatment time. A linear relationship was not observed between UHP treatment and
number of binding sites. However, at pH 7.0, BLG had relatively low dissociation
constants, with more binding sites than BLG of other pH values, suggesting that UHP-
treated BLG can be used as an ingredient for improvement of flavor in most reduced fat
foods close to neutral pH.
30
INTRODUCTION
Recent developments and advances in ultra high pressure (UHP) processing
technology are now at a stage where certain foodstuffs can be commercially processed
isobarically at pressures on the order of hundreds of mega-pascals (MPa). In contrast to
thermal processing, UHP processing affects the structural stability of food constituents
such as proteins in such a way that can improve their intrinsic functional properties for
new ingredients.
UHP involves subjecting a food material to pressures up to 600 MPa and holding
the food isobarically for up to 30 min before pressure release (Ramaswamy and others).
UHP treatment is sufficient in bringing about necessary molecular change, microbial
deactivation, pasteurization, and extended shelf-life.
High pressures act by altering the balance of intramolecular and solvent-protein
interactions. Pressure-induced denaturation results from the disruption of both
hydrophobic interactions and salt bridges. The extent of the changes in proteins depends
on factors such as temperature, pH, solvent, and ionic strength, as well as on the nature of
the native protein structure and pressure applied to the proteins (Iametti and others 1997).
Pressure-induced protein structure unfolding is accompanied by a reduction in volume
and hydration of nonpolar amino acid residues (Damodaran 1996). The unfolding
mechanism of pressure-induced protein denaturation is not yet fully understood, although
UHP treatment results in changes in the structure of the protein molecules due to the
cleavage of weak hydrogen bonds and van der Waals forces while covalent bonds are
unaffected (Tedford and others 1999).
31
Fluorescence spectroscopy is a useful technique to study the structure and
dynamics of protein molecules, providing the primary protein structure harbors intrinsic
chromophores. The sensitivity and noninvasiveness of fluorometry is a promising and
widely used technique in medicine, biology, biochemistry, and molecular biophysics
(Royer 1995). The intrinsic fluorescence of tryptophan residues in proteins is particularly
sensitive to protein microenvironments and provides a sensitive method to study
conformational changes of proteins (Busti and others 2002).
Extrinsic fluorescent probes can bind specifically to proteins, influencing both the
intrinsic fluorescence of the protein and the fluorescence of the probe. PRODAN (6-
propionyl-2-(dimethylamino)-naphthalene) exhibits sensitivity to the polarity of the
environment in biological materials (Alizadeh-Pazdar and Li-Chan 2000). Although
PRODAN exhibits low quantum yield in aqueous solutions, PRODAN becomes highly
fluorescent in nonpolar solvents or when bound to hydrophobic sites on proteins or
membranes (Vazquez and others 2005). Without a charge on PRODAN, electrostatic
interactions are eliminated during the determination of surface hydrophobicity. Spectral
shifts of PRODAN fluorescence that reflect changes in polarity of the environment and
absence of ionic interactions due to lack of a permanent charge are supported by studies
on spectral properties of PRODAN (Weber and Farris 1979), and binding with spectrin,
egg and milk proteins (Alizadeh-Pazdar and others 2004), bovine serum albumin,
ovalbumin (Haskard and Li-Chan 1998), thionin (Huang and others 1997), and lipid
bilayers (Kusube and others 2005).
Recently the PRODAN probe was used by Alizadeh-Pasdar and Li-Chan (2000)
for the quantitation of protein surface hydrophobicity at pH 3.0, 5.0, 7.0, and 9.0. In that
32
study (Alizadeh-Pazdar and Li-Chan 2000), a method was developed with PRODAN to
quantitate protein surface hydrophobicity comparing the binding of PRODAN versus
aromatic 1-anilinonaphthalene-8-sulfonic acid (ANS) and anionic aliphatic cis-parinaric
acid (CPA) fluorescent probes to whey protein isolate (WPI), β-lactoglobulin (BLG), and
bovine serum albumin (BSA) during thermal treatment at 80°C. Alizadeh-Pazdar and Li-
Chan (2000) reported lower hydrophobicity at pH 3.0 than other pH values for BSA,
BLG, and WPI determined using PRODAN, whereas hydrophobicity determined using
ANS was high at pH 3.0 for the proteins compared to other pH values. They also reported
that heating (80 °C for 30 min) of BSA, BLG and WPI at pH 3.0, 5.0, 7.0, or 9.0 either
had no effect or significantly decreased (p ≤ 0.05) surface hydrophobicity determined
using PRODAN.
Some authors have reported using ANS and CPA to determine hydrophobicity of
UHP treated BLG or whey protein concentrate (Yang and others 2001; Liu and others
2005) and others have reported using PRODAN for characterizing binding sites of human
serum albumin (Moreno and others 1999). It is the aim of this research to use PRODAN
to observe changes in hydrophobicity of BLG as a function of UHP treatment and pH.
MATERIALS & METHODS
β-Lactoglobulin (BLG) and PRODAN were purchased from Sigma Chemical Co.
(St. Louis, MO, no. L-0130) and Molecular Probes (Eugene, OR), respectively.
Ultra-high Hydrostatic Pressure (UHP) Treatment
BLG solutions, at selected protein concentrations of 0.05 to 0.50 mg/mL in 0.05
mg/mL increments were prepared with sodium phosphate buffer (0.01 M) and adjusted to
selected pH values of 3.0, 5.0, 7.0, or 9.0. The concentrations of BLG at pH 7.0 were
33
spectrophotometrically determined using a molar extinction coefficient of εB280B = 17600
MP
-1P cm P
-1Pat 280 nm. BLG solutions, at an initial temperature of 4°C, were treated with an
isostatic pressing system (Engineered Pressure Systems, Inc., Andover, MA) composed
of a cylindrical pressure chamber (height = 0.25 m, diameter = 0.10 m) at 600 MPa for 0
(come-up time), 4, 8, 16, or 32 min. The come-up time (5.25 min) is the compression
time required to reach a pressure of 600 MPa. After exposure to high pressure, the BLG
solutions were assayed immediately or stored at 4 °C.
Intrinsic and Extrinsic Fluorescence Spectra
Conformational changes of BLG solutions were monitored by observing intrinsic
tryptophan and extrinsic fluorescence spectra. Intrinsic fluorescence was assayed using
an excitation wavelength of 295 nm to avoid excitation of tyrosine (Bhattacharjee and
Das 2000; Muresan and others 2001) and observing fluorescence intensity at the emission
wavelength of 338 nm. Extrinsic PRODAN fluorescence of BLG solutions was assayed
using an excitation wavelength of 365 nm and observing the fluorescence intensity at the
emission spectra at wavelengths from 375 to 600 nm. Ten microliters of PRODAN
(0.153 mM in methanol) solution was added to 4 mL of untreated or UHP-treated BLG
solutions (0.05-0.5 mg/mL) for the extrinsic PRODAN assay. Intrinsic and extrinsic
fluorescence data were collected with a Fluoro Max-3 fluorometer (Jobin Yvon Horiba
Spex, Edison, NJ) and data-conversion software (DATAMAX and GRAMS/32 P
TMP, Jobin
Yvon Horiba Spex, Edison, NJ).
Surface Hydrophobicity
The extrinsic aromatic uncharged hydrophobic PRODAN fluorescent probe is
unlike other probes used to determine hydrophobicity of proteins. Unlike PRODAN,
34
fluorescent probes such as ANS or CPA are anionic and may contribute charged
interactions on the determination of surface hydrophobicity at various pH values
(Alizadeh-Pazdar and Li-Chan 2000). PRODAN, on the other hand, has no charge,
eliminating possible electrostatic contributions, and hence the PRODAN probe was used
to assay the hydrophobic nature of BLG.
Surface hydrophobicity of BLG was determined using the PRODAN probe. A
stock solution of 1.53 x 10P
-4 PM PRODAN was prepared in methanol, sealed with Parafilm
to prevent evaporation of methanol, covered with aluminum foil to avoid exposure to
light, and stirred for 5 hr. The PRODAN stock solution was stored in the freezer (-11P
oPC)
until the day of the assay, and held on ice throughout the experiment. The concentration
of PRODAN in the stock solution was spectrophotometrically determined using a molar
absorption coefficient of εB360B = 1.8 x 10⁴ M P
-1P cm P
-1P (Chakrabarti 1996) before performing
the assay.
Intrinsic tryptophan fluorescence determinations were performed using
excitation/emission wavelengths of 295 nm/338 nm and slits were set at 5 nm/5 nm to
avoid excitation of tyrosine. Even though tyrosine has a high quantum yield, the tyrosine
emission of most proteins is small and undetectable due to quenching by the presence of
nearby charged or uncharged amino groups (Lakowicz 1983). The fluorescence emission
of tryptophan is often studied for its solvent sensitivity and characterization of the protein
structure during denaturation as evidenced by its blue or red shifts (Lakowicz 1983).
Extrinsic fluorescence determination of PRODAN assay hydrophobicity of BLG was
performed with excitation/emission wavelengths of 365 nm/465 nm and slits were set at 5
nm/5 nm. A 10 µL aliquot of the PRODAN stock solution was added to 4 mL of diluted
35
native and UHP treated proteins, and mixed well by vortexing. After 20 min equilibration
in the dark, the relative fluorescence intensity (RFI) of each solution was determined in
replicate, starting with a buffer blank (buffer plus probe) and then the smallest to the
greatest protein concentration. The fluorometer quartz cell (Starna Cells, Inc, Atascadero,
CA, no.3-Q-10) was rinsed between fluorescence assays with a small volume of the
future solution being assayed. The RFI of each protein dilution blank (no probe) was
subtracted from the RFI of each corresponding protein solution with PRODAN to obtain
net RFI. Line fitting analysis (Microsoft Excel 2002 for Windows XP) was used to
determine the linearity of the plot of net RFI versus protein concentration, and the
resulting slope was observed as an index of BLG surface hydrophobicity according to
Alizadeh-Pazdar and Li-Chan (2000).
Determination of the Apparent Dissociation Constants
PRODAN binding properties were calculated with the Cogan method (Cogan and
others 1976). The number of accessible binding sites and apparent dissociation constants
of PRODAN with BLG were calculated with equation (1)
(1)
where P B0B is the total protein concentration, α is defined as the fraction of free binding
sites on the protein molecules, n is the number of independent binding sites for
PRODAN, R B0B is total PRODAN concentration, and K’d is the apparent dissociation
constant of a single site. The value of α was calculated with equation (2)
(2)
36
where F represents the fluorescence intensity of PRODAN at selected RB0B, F BmaxB represents
the fluorescence intensity of PRODAN upon saturation of protein molecules, and FB0B is
the initial fluorescence intensity of PRODAN in the absence of BLG.
Statistical Analysis
Data collected from the binding studies of PRODAN to BLG were analyzed using
an analysis of variance (ANOVA) procedure using the General Linear Model, with
further analysis using Tukey’s pairwise comparison test to determine differences (p <
0.05) between UHP and pH treatment means (SAS for Windows, version 9.1 TS Level
1M2, SAS Institute Inc., Cary, NC, USA.).
RESULTS & DISCUSSION
Conformational Change - Intrinsic Fluorescence
The tryptophan fluorescence spectra of native BLG treated at selected pH values
are presented in Figure 1. A difference in peak intensity of the emission spectra was
observed between native BLG at pH 3.0 and pH 7.0, and can be accounted for the
stability of native BLG through dimerization at the higher pH as observed by Busti and
others (2002). A high fluorescence peak intensity observed for native BLG at pH 5.0
results from the displacement of water through protein-protein interactions of monomers
near its isoelectric point of 5.2 (Phillips and others 1994). In Figure 1, the emission
wavelengths occurring at peak intensity for native BLG at pH 7.0 and pH 9.0 were
observed at 339 and 345 nm. The change in emission wavelength, or red shift, with an
increase in pH indicates that the microenvironment surrounding Trp19 and Trp 61 is
becoming more polar (Lakowicz 1983).
37

The tryptophan fluorescence spectra of BLG treated at 600 MPa for selected times
and pH values are presented in Figures 2-5. At pH 3.0 (Figure 2), BLG exhibited a two-
stage increase in tryptophan emission peak maximum with the first increase observed
after pressure was applied (come-up time) and the second increase of fluorescence
emission peak maximum after 16 min of pressurization. The increases in tryptophan
fluorescence maxima of BLG upon unfolding by UHP are consistent with the results of
Yang and others (2001) and Liu and others (2005). The increase in tryptophan
fluorescence maxima of BLG during UHP treatment suggests the dissociation of the BLG
dimer. Small increases in tryptophan fluorescence intensities observed after UHP
treatment indicates that unfolding of the compact structure of BLG at acid pH may or
may not be complete (Phillips and others 1994).
After exposure of BLG solutions of pH 5.0 to UHP, precipitation of BLG from
the solution was observed visually. The tryptophan emission peak maximum of native
BLG increased by 18% after UHP come-up time, and remained at this intensity after
UHP of 32 min (Figure 3). After UHP treatment of 16 min, the peak emission wavelength
increased by 2 nm, indicating that the tryptophan microenvironment became more polar.
Although BLG was near its isoelectric point of 5.3, a precipitate was only noticeable
visually after UHP treatment. Around pH 4.5, BLG is prone to form octameric structures,
and Timasheff and others (1966) proposed that the transition between the native
isoelectric form of BLG and the acid forms facilitates this octamer formation. The
applied pressure to BLG at pH 5.0 may have unfolded the subunits exposing the
hydrophobic interior of BLG. The exposed cysteine groups of each BLG molecule then
can readily participate in sulfhydryl-disulfide interchange reactions with neighboring
38
BLG molecules (Swaisgood 1996) to minimize unfavorable interactions of hydrophobic
groups with water, thereby causing the precipitation of BLG from solution (Petsko and
Ringe 2004).
Following UHP come-up time at pH 7.0, the tryptophan fluorescence emission
peak maximum decreased slightly from 1.37 x 10 P
7P to 1.34 x 10 P
7P with 2 nm red shift in the
tryptophan emission wavelength (Figure 4). By increasing pressure times to 16 min, the
tryptophan fluorescence maximum increased to 1.39 x 10P
7P. The observed decrease in the
tryptophan emission spectra can be accounted for by the Tanford transition that occurs in
BLG between pH 6.0 and 8.0 (Taulier and Chalikian 2001). Taulier and Chalikian (2001)
believed that the transition induced a change in local microenvironment of aromatic
residues with loosening of the interior packing. This loosening may explain the increase
in the tryptophan emission peak maximum after 16 or 32 min of UHP, and also results
from the transition to the intermediate molten globule structure as reported by Yang and
others (2001). The increase in the fluorescence intensity observed is attributed to the β-
strand EF loop of BLG adopting an “open” conformation that promotes access to large
internal hydrophobic pockets (Adams and others 2006).
The tryptophan emission peak maxima of BLG after UHP treatment at pH 9.0
exhibited a decrease from 1.36 x 10P
7P to 1.25 x 10 P
7P after 4 min of UHP and an increase to
1.34 x 10 P
7P after UHP of 16 min (Figure 5). Although lower than the observed
fluorescence emission maxima of BLG at pH 3.0 to 7.0, this value may be possibly due to
the retention of BLG secondary structure (Casal and others 1988). At alkaline pH, BLG is
susceptible to surface denaturation, or base-induced denaturation (Timasheff and others
1966), accompanied by a more open flexible molecular structure (Phillips and others
39
1994). The increases in tryptophan intrinsic fluorescence after 16 min of UHP treatment
may indicate further unfolding of the BLG monomer with loosening of secondary
structure as observed for effects of chaotropic agents, such as urea, greater than 1.5 M on
BLG (Phillips and others 1994; Yang and others 2001).
Conformational Change - Extrinsic PRODAN Fluorescence
PRODAN fluorescence emission spectra were observed at 25°C as a function of
UHP (600 MPa) for selected times and pH (Figures 6-9). The PRODAN fluorescence
emission spectrum of untreated BLG exhibited two peaks: free PRODAN showed a green
emission peak at 520 nm, and PRODAN bound to BLG showed a blue emission peak at
450 nm (Hiratsuki 1998). The binding of PRODAN, as observed by increases in extrinsic
fluorescence intensity, did not indicate binding to specific binding sites of BLG, but may
suggest similar binding properties of other nonpolar flavor compounds. It can be seen in
Figure 6 that at pH 3.0 or 5.0, native BLG exhibited an emission wavelength 25 nm less
than observed emission wavelengths of 450 nm for BLG at pH 7.0 or 9.0, suggesting that
the binding areas for PRODAN in BLG is nonpolar at acidic pH. UHP treatment of BLG
at pH 3.0 (Figure 7), after come-up time, resulted in a decrease in the PRODAN extrinsic
fluorescence intensity. The compact structure of BLG at pH less than 4.0 may increase
BLG resistance to pressure denaturation occluding PRODAN molecules from entering
the hydrophobic interior (Phillips and others 1994). However, after 4 min UHP treatment
of BLG, BLG may not resist pressure denaturation hence an observed increase in
extrinsic fluorescence.
At pH 5.0 (Figure 8), the PRODAN fluorescence emission peak of native BLG
observed at 450 nm increased with increasing UHP treatment time. After an 8 min UHP
40
treatment of BLG, a 152% increase in PRODAN fluorescence intensity was observed,
indicating large numbers of PRODAN molecules bound to BLG. The binding of
PRODAN molecules suggests that BLG is unfolding under UHP and exposing the
hydrophobic interior, suggesting under these conditions, BLG is favorable for binding of
hydrophobic flavor compounds.
The difference in fluorescence intensity maxima between native BLG at pH 5.0
and 7.0 (Figure 6) and continued increase in intensity after UHP treatment (Figure 9)
indicate that the conformation of a loop containing β-strands, β-E and β-F, changes as a
function of pH, and the EF loop is folded back to reveal the interior of the calyx in an
open conformation (Qin and others 1998).
Unlike the fluorescence intensities as observed of BLG at pH 7.0, the changes in
intensities observed of BLG at pH 9.0 (Figure 10) is the result of base-induced
denaturation disrupting the native dimeric structure into unfolded monomers (Taulier and
Chalikian 2001). The small decreases in PRODAN fluorescence intensities observed after
UHP treatment of BLG may account for hydration of BLG monomers, decreasing access
of PRODAN molecules to the hydrophobic interior.
In summary, BLG may resist pressure-induced denaturation at acid pH, however,
as pH increases towards the isoelectric point (pH 5.3), precipitation of BLG allows
PRODAN molecules to bind BLG. At neutral pH, the molten globule state of BLG occurs
after pressurization, and hydrophobic binding of PRODAN is enhanced at pH 9.0 through
base-induced denaturation.
Surface Hydrophobicity
41

Linear plots that were generated from net RFI versus protein concentration gave a
slope as an index of BLG surface hydrophobicity. The quantitation of protein
hydrophobicity is important for predicting protein functionality. Surface or effective
hydrophobicity is termed for a portion of nonpolar amino acid residues, positioned in the
interior of protein molecules in solutions to avoid contact with the aqueous environment,
which participate in polar and nonpolar interactions, and does not correlate with total
hydrophobicity (Nakai 1983).
The pH significantly affected surface hydrophobicity (Figure 11) of untreated
BLG (p < 0.05), with the smallest surface hydrophobicity observed at pH 3.0, which is
consistent with results of Alizadeh-Pasdar and Li-Chan (2000). The findings also support
the suggestion that the E-F loop (residues 86-89) is arranged so as to occlude the open
end of the calyx, giving the closed conformation (Uhrinova and others 2000). UHP
treatment of BLG after 4, 8, or 16 min at pH 3.0 significantly increased surface
hydrophobicity (p < 0.05). UHP treatment come-up time or 4 min significantly decreased
surface hydrophobicity (p < 0.005) at pH 5.0 through formation of protein aggregates.
The formation of disulfide bonds following SH/S-S interchange (Futenberger and others
1995) decreased the accessibility of PRODAN to the surface hydrophobic site, especially
at or near the isoelectric point (pH 5.3) of BLG. UHP treatment had little observed effect
on surface hydrophobicity of BLG at pH 7.0. However, there was a decrease in surface
hydrophobicity observed after UHP of 16 min, probably due to the interaction of partially
denatured proteins resulting in burial of effective hydrophobic regions (Alizadeh-Pazdar
and Li-Chan 2000). Surface hydrophobicity of BLG increased significantly (p < 0.005)
after UHP come-up time at pH 9.0, which are consistent with results of thermal treatment
42

of BLG observed using PRODAN from Alizadeh-Pasdar and Li-Chan (2000).
Additionally, the E-F loop is in the open conformation, providing access to the
hydrophobic pocket.
The surface hydrophobic site of BLG at pH 3.0 has little accessibility to
PRODAN molecules. The observed increase in PRODAN extrinsic fluorescence at pH
7.0 may indicate that BLG has other hydrophobic sites to which PRODAN molecules can
bind. At alkaline pH, UHP treatment of BLG after come-up time may partially unfold
BLG at the cleft formed by β strands A, H, and I, thereby increasing BLG surface
hydrophobicity through exposure of other nonpolar amino acid residues.
PRODAN Binding to BLG
Titrations of BLG with PRODAN (Figures 12-35) were plotted according to the
Cogan method (1976). At pH 3.0, native BLG exhibited 2.26 binding sites for PRODAN
per molecule of protein with an apparent dissociation constant of 114.79 x 10P
-7P M (Table
1). At pH 5.0 and 7.0, native BLG exhibited 1 binding site for PRODAN and a K’ BdB of
5.57 x 10 P
-7P M and 6.14 x 10 P
-7P M, respectively. Yang and others (2003) reported that
native BLG at pH 7.0 exhibited 0.41 binding sites for ANS with a dissociation constant
of 4.5 x 10 P
-5P M. At pH 9.0, native BLG had 0.80 binding sites with K’ BdB of 3.71 x 10P
-7P M.
The number of binding sites of BLG for PRODAN observed in the present research is
higher than the results Yang and others (2003) reported for BLG to ANS, which suggests
that anionic probes, such as ANS, may underestimate the number of binding sites through
ionic interactions between ANS and BLG, or uncharged probes, like PRODAN, may
overestimate the number of binding sites.
43
There were significant differences (p < 0.05) between dissociation constants of
BLG for PRODAN as a function of pH and UHP treatment times. A 1.2-fold increase in
the dissociation constant of BLG was observed after 32 min of UHP treatment (Table 1)
at pH 3.0. The number of binding sites at pH 3.0 decreased with UHP treatment from
2.26 to 1.32 after UHP of 8 min. However after 16 min, the number of binding sites
increased to 1.92 probably due to a loosening of the compact structure from an extended
UHP hold time. At pH 5.0, untreated BLG exhibited the largest number of binding sites
and UHP-treated BLG after 16 min exhibited a large dissociation constant of 7.16 x 10P
-7P
M, which may indicate a decrease in the binding affinity of BLG for PRODAN. At pH
7.0, there was a slight increase in the number of binding sites after UHP of 4 min with
highest K’d (8.42 x 10 P
-7P M) after UHP of 32 min, which may suggest that during UHP
treatment, changes in secondary structure around the loosely structured surface loops may
decrease accessibility to the binding sites for PRODAN (Creamer 1995). At pH 9.0, the
highest n was observed after come-up time and 32 min.
Yang and others (2003) reported that the surface hydrophobic site of UHP-
induced BLG dimers were surrounded by hydrophobic amino acid residues, which
resulted in an increase of hydrophobic affinity of BLG for CPA at the surface
hydrophobic site. This is consistent with the current study in which increases in the
binding affinity of BLG of pH 3.0 for PRODAN were observed after 4 min of UHP
treatment. It can be seen from Table 1 that BLG of pH 3.0 was observed of having the
most number of binding sites, regardless of UHP treatment times, and the greatest
dissociation constants than BLG of other pH values. On the other hand, BLG of pH 7.0
exhibits lower values of dissociation constants compared to BLG of pH 3.0, and may be
44
appropriate for further binding experiments due to the number of binding sites of more
than 0.8 under the different UHP treatment times tested. Most foods occur close to
neutral pH, and binding studies of BLG with flavor compounds carried out at pH 7.0 may
show improvement in flavor characteristics of reduced-fat foods.
CONCLUSIONS
Tryptophan emission spectra and PRODAN binding provide evidence that UHP
treatment at 600 MPa and pH 7.0 induces BLG to form a molten globule. PRODAN may
be used to determine the surface hydrophobicity of proteins over a wide range of pH
values. In addition to pressure-induced denaturation, the base-induced denaturation of
BLG at alkaline pH may prove useful in increasing the binding properties of BLG.
45
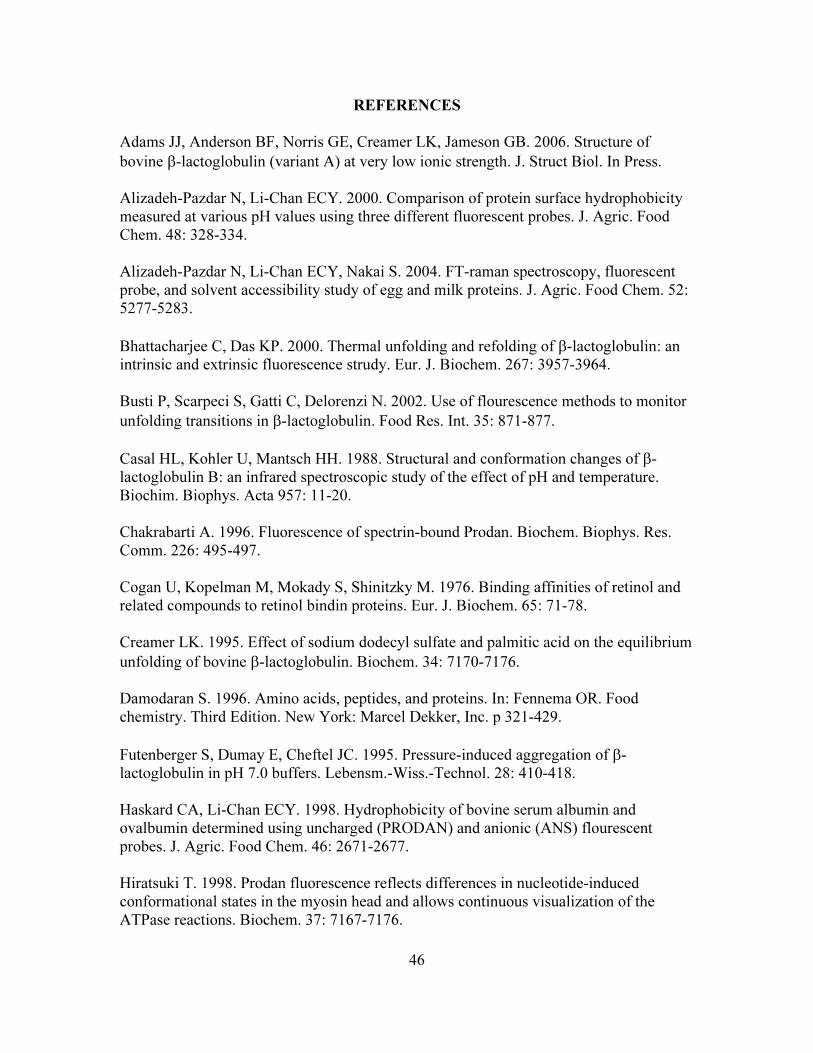
REFERENCES
Adams JJ, Anderson BF, Norris GE, Creamer LK, Jameson GB. 2006. Structure of
bovine β-lactoglobulin (variant A) at very low ionic strength. J. Struct Biol. In Press.
Alizadeh-Pazdar N, Li-Chan ECY. 2000. Comparison of protein surface hydrophobicity
measured at various pH values using three different fluorescent probes. J. Agric. Food
Chem. 48: 328-334.
Alizadeh-Pazdar N, Li-Chan ECY, Nakai S. 2004. FT-raman spectroscopy, fluorescent
probe, and solvent accessibility study of egg and milk proteins. J. Agric. Food Chem. 52:
5277-5283.
Bhattacharjee C, Das KP. 2000. Thermal unfolding and refolding of β-lactoglobulin: an
intrinsic and extrinsic fluorescence strudy. Eur. J. Biochem. 267: 3957-3964.
Busti P, Scarpeci S, Gatti C, Delorenzi N. 2002. Use of flourescence methods to monitor
unfolding transitions in β-lactoglobulin. Food Res. Int. 35: 871-877.
Casal HL, Kohler U, Mantsch HH. 1988. Structural and conformation changes of β-
lactoglobulin B: an infrared spectroscopic study of the effect of pH and temperature.
Biochim. Biophys. Acta 957: 11-20.
Chakrabarti A. 1996. Fluorescence of spectrin-bound Prodan. Biochem. Biophys. Res.
Comm. 226: 495-497.
Cogan U, Kopelman M, Mokady S, Shinitzky M. 1976. Binding affinities of retinol and
related compounds to retinol bindin proteins. Eur. J. Biochem. 65: 71-78.
Creamer LK. 1995. Effect of sodium dodecyl sulfate and palmitic acid on the equilibrium
unfolding of bovine β-lactoglobulin. Biochem. 34: 7170-7176.
Damodaran S. 1996. Amino acids, peptides, and proteins. In: Fennema OR. Food
chemistry. Third Edition. New York: Marcel Dekker, Inc. p 321-429.
Futenberger S, Dumay E, Cheftel JC. 1995. Pressure-induced aggregation of β-
lactoglobulin in pH 7.0 buffers. Lebensm.-Wiss.-Technol. 28: 410-418.
Haskard CA, Li-Chan ECY. 1998. Hydrophobicity of bovine serum albumin and
ovalbumin determined using uncharged (PRODAN) and anionic (ANS) flourescent
probes. J. Agric. Food Chem. 46: 2671-2677.
Hiratsuki T. 1998. Prodan fluorescence reflects differences in nucleotide-induced
conformational states in the myosin head and allows continuous visualization of the
ATPase reactions. Biochem. 37: 7167-7176.
46
Huang W, Vernon LP, Hansen LD, Bell JD. 1997. Interactions of thionin from Pyrularia
pubera with dipalmitoylphosphatidylglycerol large unilamellar vesicles. Biochem.
36(10): 2860-2866.
Iametti S, Transidico P, Bonomi F, Vecchio G, Pittia P, Rovere P, Dall'Aglio G. 1997.
Molecular modifications of β-lactoglobulin upon exposure to high pressure. J. Agric.
Food Chem. 45: 23-29.
Kusube M, Tamai N, Matsuki H, Kaneshina S. 2005. Pressure-induced phase transitions
of lipid bilayers observed by fluorescent probes prodan and laurdan. Biophys. Chem.
117(3): 199-206.
Lakowicz JR. 1983. Principles of fluorescence spectroscopy. New York: Plenum Press.
496p.
Liu X, Powers JR, Swanson BG, Hill HH, Clark S. 2005. Modification of whey protein
concentrate hydrophobicity by high hydrostatic pressure. Innov. Food Sci. Emerg.
Technol. 6(3): 310-317.
Moreno F, Cortijo M, Gonzalez-Jimenez J. 1999. The fluorescent probe Prodan
characterizes the warfarin binding site on human serum albumin. Photochem. and
Photobiol. 69(1): 8-15.
Muresan S, van der Bent A, de Wolf FA. 2001. Interaction of β-lactoglobulin with small
hydrophobic ligands as monitored by fluorometry and equilibrium dialysis: nonlinear
quenching effects related to protein-protein association. J. Agric. Food Chem. 49: 2609-
2618.
Nakai S. 1983. Structure-function relationships of food proteins with an emphasis on the
importance of protein functionality. J. Agric. Food Chem. 31: 676-683.
Petsko GA, Ringe D. 2004. Protein structure and function. London: New Science Press
Ltd. 195p.
Phillips LG, Whitehead DM, Kinsella JE. 1994. Structural and chemical properties of β-
lactoglobulin. In: Structure-function properties of food proteins. New York: Academic
Press. p 75-106.
Qin BY, Bewley MC, Creamer LK, Baker HM, Baker EN, Jameson GB. 1998. Structural
basis of the tanford transition of bovine β-lactoglobulin. Biochem. 37: 14014-14023.
Ohio State University. High pressure processing: Fact sheet for food processors.
Ramaswamy R, Balasubramaniam VM, Kaletunc G. Columbus. 1-3
Royer CA. 1995. Approaches to teaching fluorescence spectroscopy. Biophys. J. 68:
1191-1195.
47
Swaisgood HE. 1996. Characteristics of milk. In: Fennema OR. Food chemistry. New
York: Marcel Dekker, Inc. p 841-878.
Taulier N, Chalikian TV. 2001. Characterization of pH-induced transitions of β-
lactoglobulin: ultrasonic, densimetric, and spectroscopic studies. J. Mol. Biol. 314: 873-
889.
Tedford L-A, Smith D, Schaschke CJ. 1999. High pressure processing effect on the
molecular structure of ovalbumin, lysozyme and β-lactoglobulin. Food Res. Int. 32: 101-
106.
Timasheff SN, Mescanti L, Basch JJ, Townend R. 1966. Conformational transitions of
bovine β-lactoglobulin A, B, C. J. Biol. Chem. 241: 2496-2501.
Uhrinova S, Smith MH, Jameson GB, Uhrin D, L. S, Barlow PN. 2000. Structure changes
accompanying pH-induced dissociation of the β-lactoglobulin dimer. Biochem. 39: 3565-
3574.
Vazquez ME, Blanco JB, Imperiali B. 2005. Photophysics and biological applications of
the environment-sensitive fluorophore 6-N,N-dimethylamino-2,3-naphthalimide. J. Am.
Chem. Soc. 127(4): 1300-1306.
Weber G, Farris FJ. 1979. Synthesis and spectral properties of a hydrophobic fluorescent
probe: 6-propionyl-2-(dimethylamino)-naphthalene. Biochem. 18: 3075-3078.
Yang J, Dunker AK, Powers JR, Clark S, Swanson BG. 2001. β-Lactoglobulin molten
globule induced by high pressure. J. Agric. Food Chem. 49: 3236-3243.
Yang J, Dunker AK, Powers JR, Clark S, Swanson BG. 2003. Ligand and flavor binding
functional properties of β-lactoglobulin in the molten globule state induced by high
pressure. J. Food Sci. 68: 444-452.
48
Fig
ure
1.
Intr
insi
c tr
ypto
ph
an e
mis
sio
n s
pec
tra
of
nat
ive
BL
G s
olu
tio
ns
at p
H 3
.0, 5
.0, 7
.0, o
r 9
.0.
Fig
ure
1.
Intr
insi
c tr
ypto
ph
an e
mis
sio
n s
pec
tra
of
nat
ive
BL
G s
olu
tio
ns
at p
H 3
.0, 5
.0, 7
.0, o
r 9
.0.
49
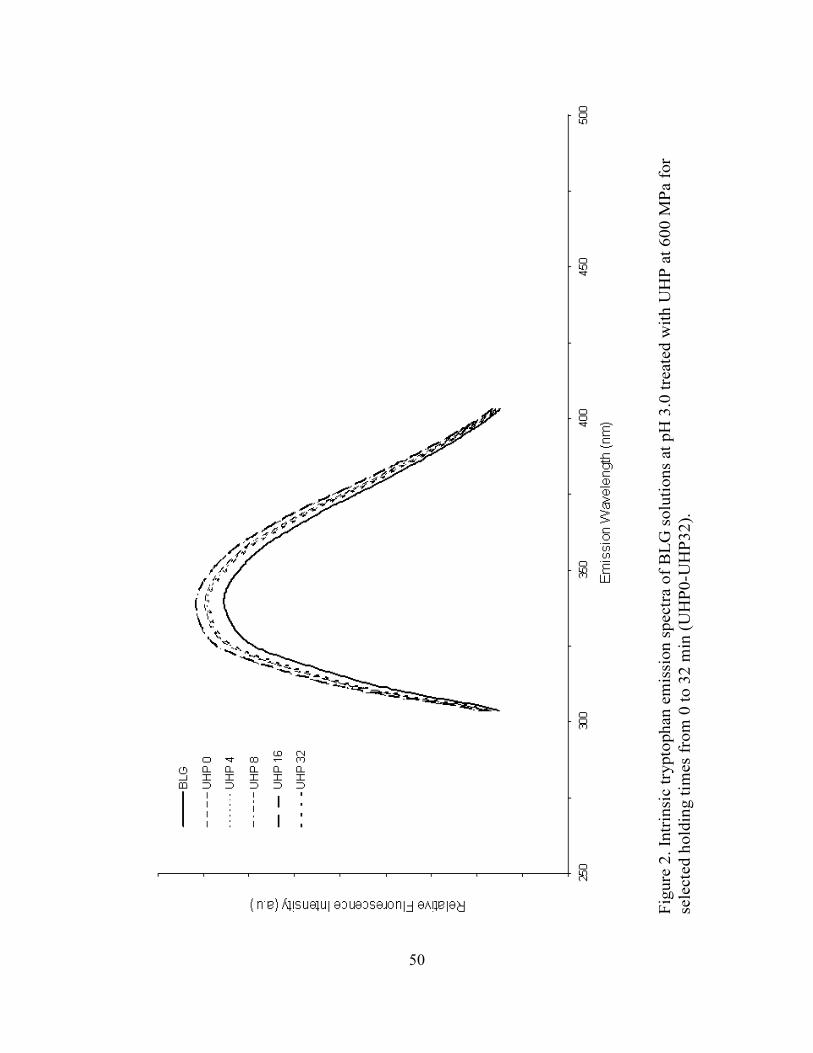
Fig
ure
2.
Intr
insi
c t
ryp
top
han
em
issi
on
sp
ectr
a o
f B
LG
so
luti
on
sat
pH
3.0
tre
ate
d w
ith
UH
P a
t 6
00
MP
afo
r
sele
cte
d h
old
ing t
imes
fro
m 0
to
32
min
(U
HP
0-U
HP
32
).
50
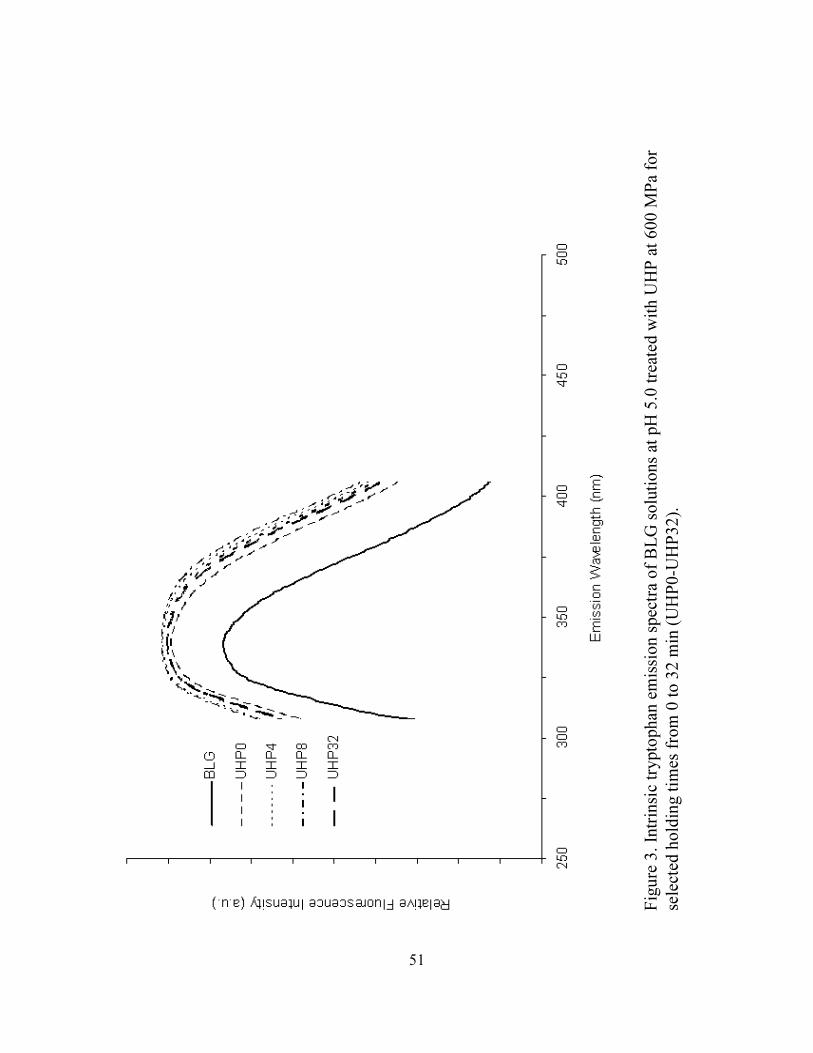
Fig
ure
3.
Intr
insi
c tr
yp
top
han
em
issi
on
sp
ectr
a o
f B
LG
so
luti
on
sat
pH
5.0
tre
ated
wit
h U
HP
at
60
0 M
Pa
for
sele
cted
ho
ldin
g t
imes
fro
m 0
to
32
min
(U
HP
0-U
HP
32
).
51
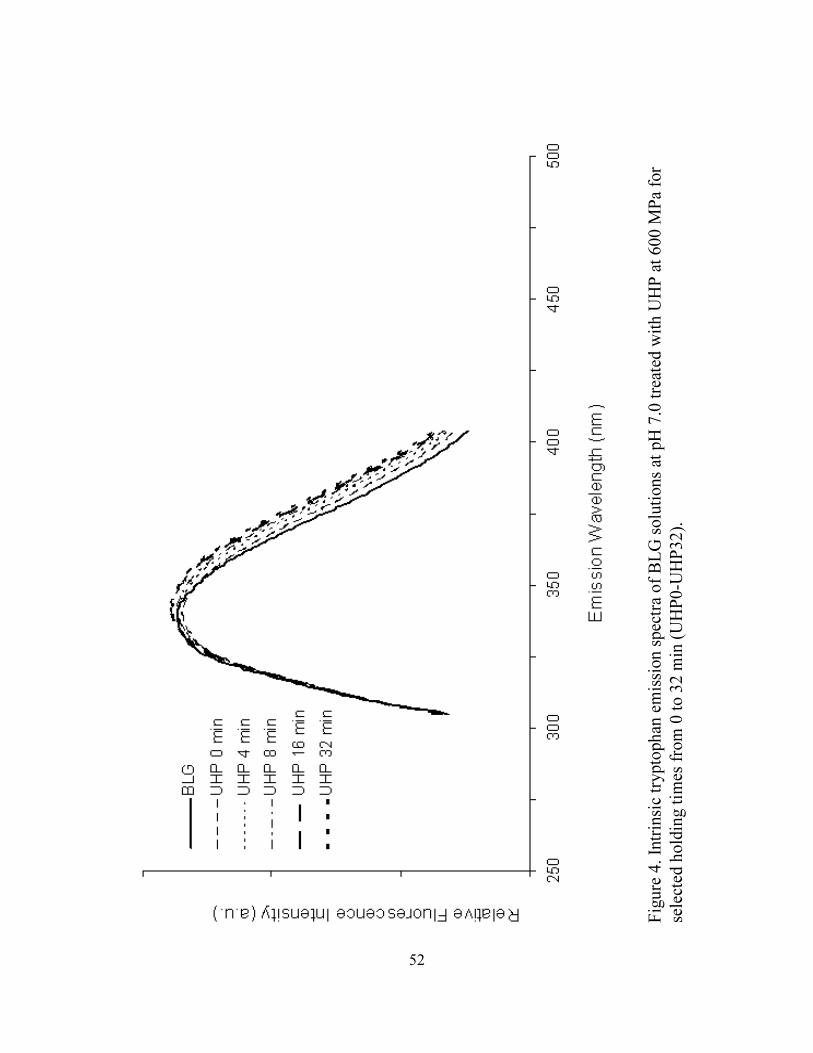
Fig
ure
4.
Intr
insi
c tr
yp
top
han
em
issi
on
sp
ectr
a o
f B
LG
so
luti
on
sat
pH
7.0
tre
ated
wit
h U
HP
at
60
0 M
Pa
for
sele
cted
ho
ldin
g t
imes
fro
m 0
to
32
min
(U
HP
0-U
HP
32
).
52
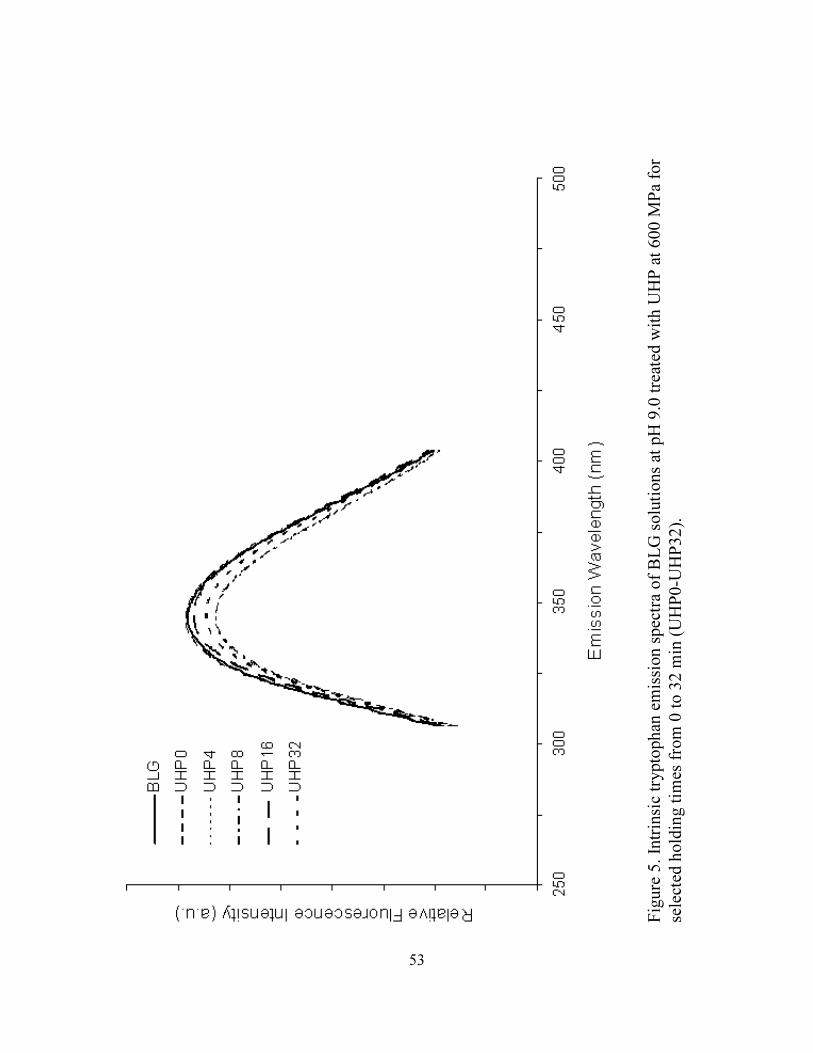
Fig
ure
5.
Intr
insi
c tr
ypto
phan
em
issi
on s
pec
tra
of
BL
G s
olu
tions
at p
H 9
.0 t
reat
ed w
ith U
HP
at
600 M
Pa
for
sele
cted
hold
ing t
imes
fro
m 0
to 3
2 m
in (
UH
P0-U
HP
32).
53

Fig
ure
6.
Ex
trin
sic P
RO
DA
N e
mis
sio
n s
pectr
a o
f n
ati
ve B
LG
so
luti
on
s at
pH
3.0
-9.0
.
54

Fig
ure
7.
Ex
trin
sic
PR
OD
AN
em
issi
on
sp
ectr
a o
f B
LG
so
luti
on
s at
pH
3.0
tre
ated
wit
h U
HP
at
60
0 M
Pa
for
sele
cted
ho
ldin
g t
imes
fro
m 0
to
32
min
(U
HP
0-U
HP
32
).
55
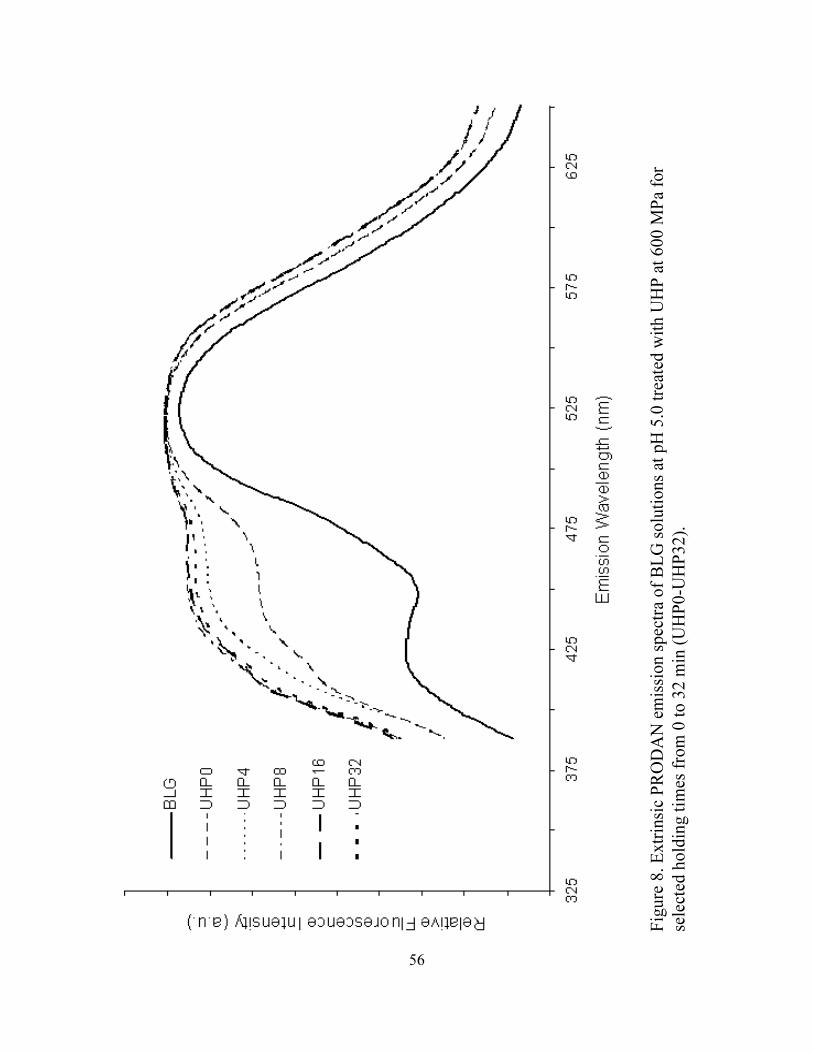
Fig
ure
8.
Ex
trin
sic
PR
OD
AN
em
issi
on
sp
ectr
a o
f B
LG
so
luti
on
s at
pH
5.0
tre
ated
wit
h U
HP
at
60
0 M
Pa
for
sele
cted
ho
ldin
g t
imes
fro
m 0
to
32
min
(U
HP
0-U
HP
32
).
56
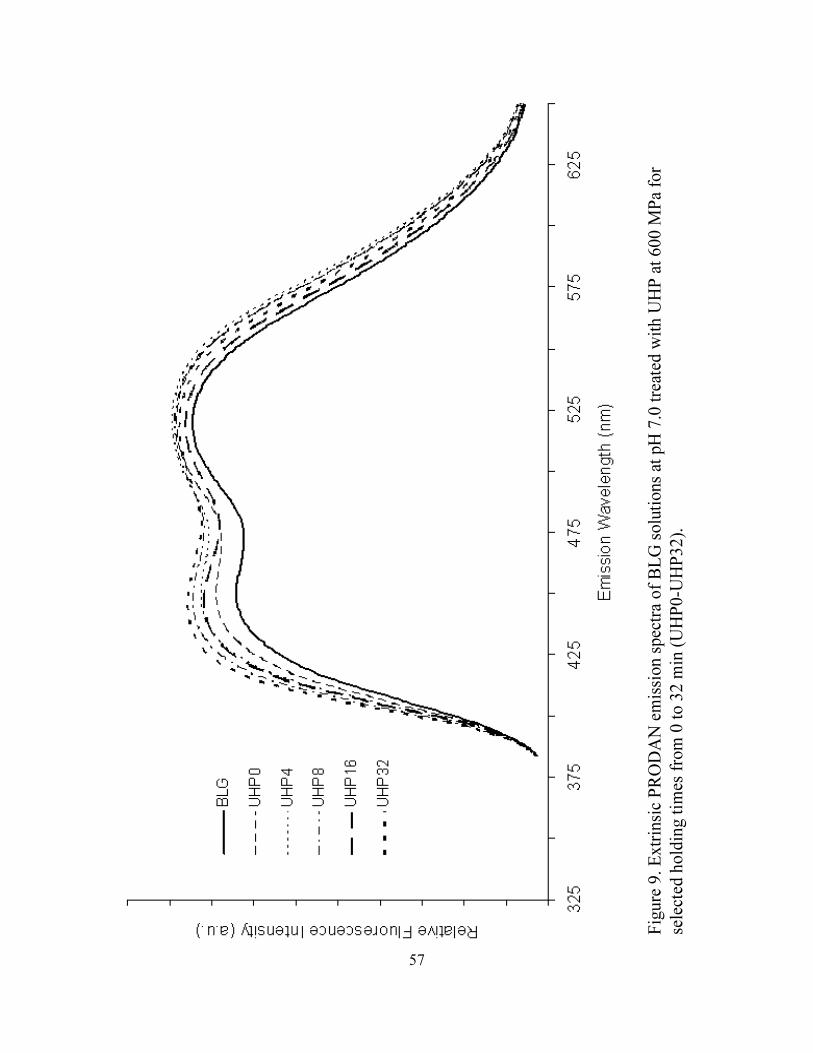
Fig
ure
9.
Ex
trin
sic
PR
OD
AN
em
issi
on
sp
ectr
a o
f B
LG
so
luti
on
s at
pH
7.0
tre
ated
wit
h U
HP
at
60
0 M
Pa
for
sele
cted
ho
ldin
g t
imes
fro
m 0
to
32
min
(U
HP
0-U
HP
32
).
57

Fig
ure
10
. E
xtr
insi
c P
RO
DA
N e
mis
sio
n s
pec
tra
of
BL
G s
olu
tio
ns
atp
H 9
.0 t
reat
ed w
ith
UH
P a
t 6
00
MP
afo
r
sele
cted
ho
ldin
g t
imes
fro
m 0
to
32
min
(U
HP
0-U
HP
32
).
58
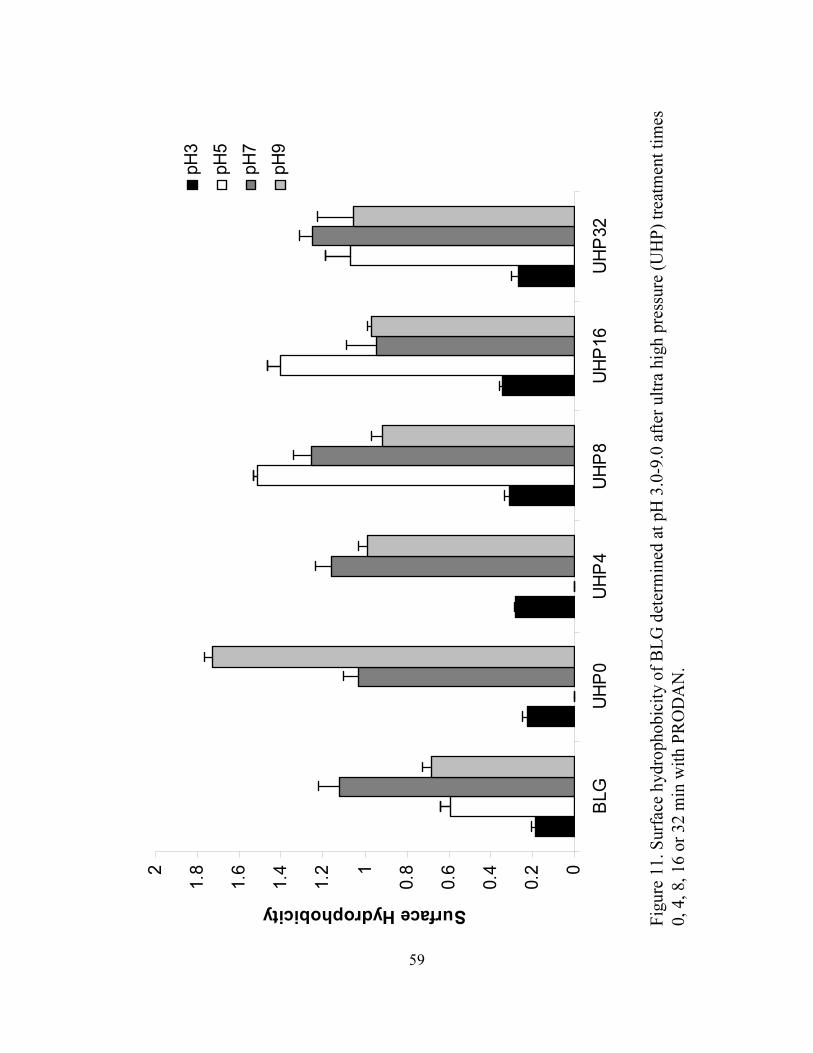
0
0.2
0.4
0.6
0.81
1.2
1.4
1.6
1.82
BLG
UHP0
UHP4
UHP8
UHP16
UHP32
Surface Hydrophobicity
pH3
pH5
pH7
pH9
Fig
ure
11
. S
urf
ace
hyd
rop
ho
bic
ity o
f B
LG
det
erm
ined
at
pH
3.0
-9.0
aft
er u
ltra
hig
h p
ress
ure
(U
HP
) tr
eatm
ent
tim
es
0,
4,
8,
16
or
32
min
wit
h P
RO
DA
N.
59
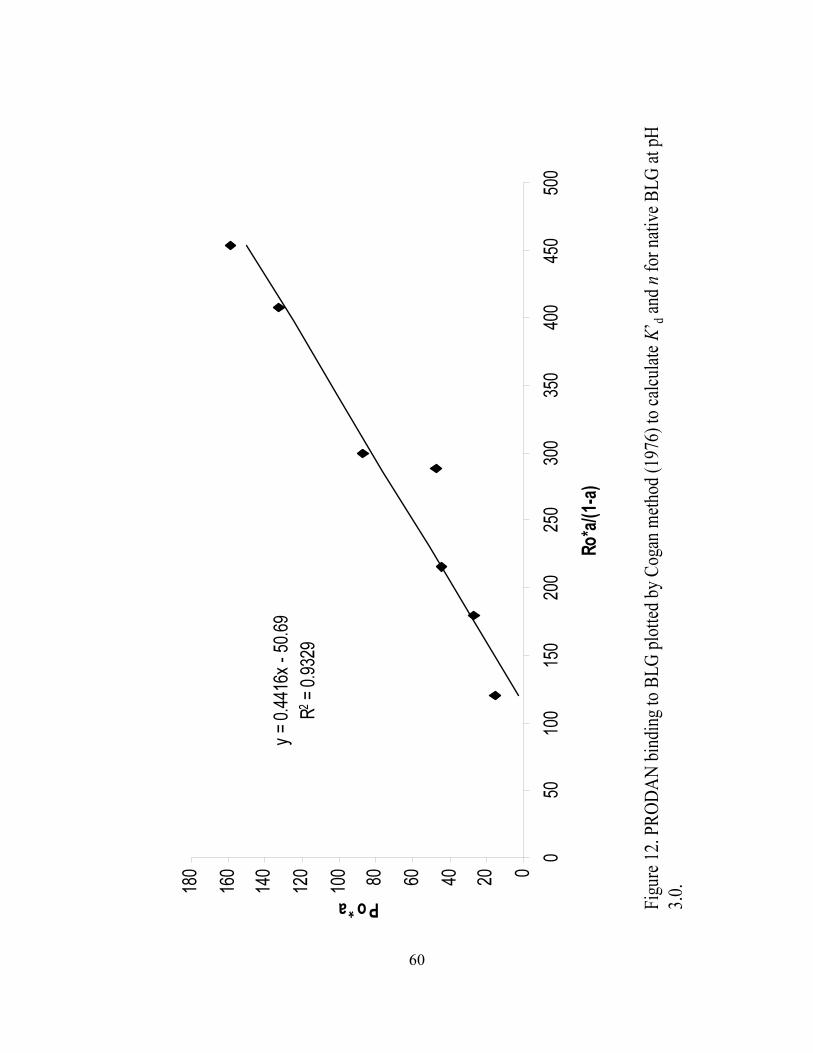
Fig
ure
12. P
RO
DA
N b
indi
ng to
BL
G p
lott
ed b
y C
ogan
met
hod
(197
6) to
cal
cula
te K
’ dan
d n
for
nati
ve B
LG
at p
H
3.0.
y =
0.44
16x
- 50
.69
R2 =
0.9
329
020406080100
120
140
160
180
050
100
150
200
250
300
350
400
450
500
Ro*a/(1-a)
Po*a
60
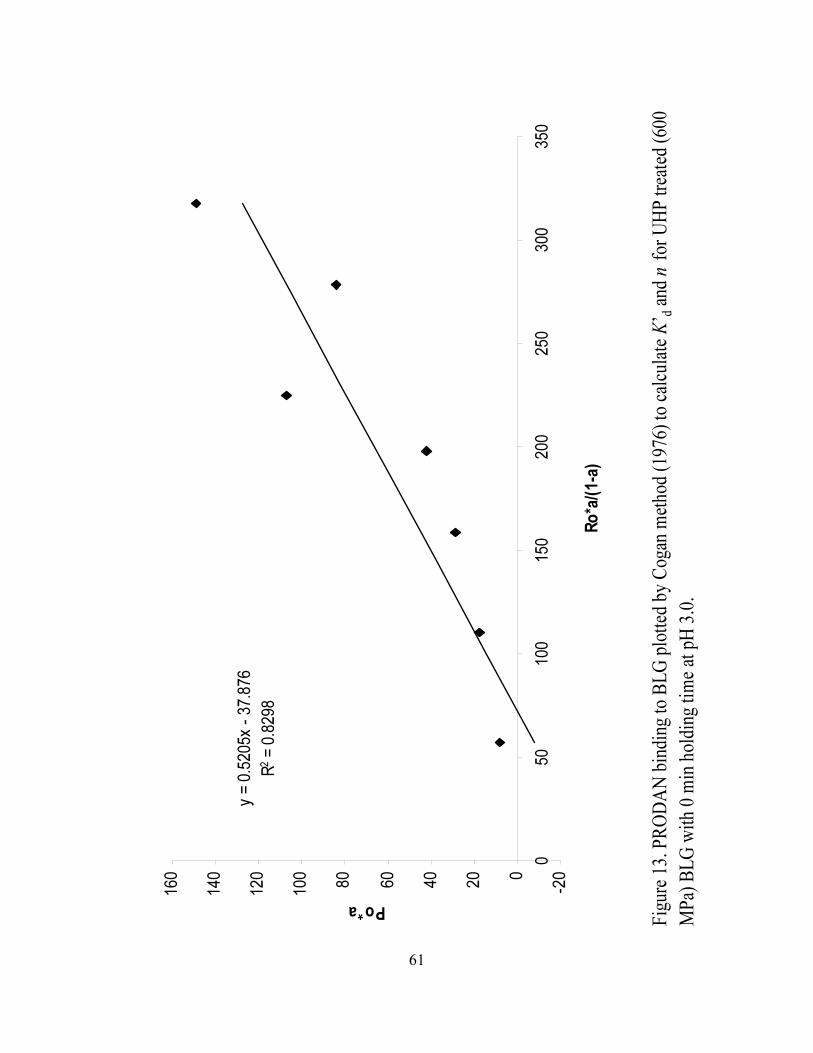
Fig
ure
13. P
RO
DA
N b
indi
ng to
BL
G p
lott
ed b
y C
ogan
met
hod
(197
6) to
cal
cula
te K
’ dan
d n
for
UH
P tr
eate
d (6
00
MP
a) B
LG
wit
h 0
min
hol
ding
tim
e at
pH
3.0
.
y =
0.5
205x -
37.8
76
R2 =
0.8
298
-200
20
40
60
80
100
120
140
160
050
100
150
200
250
300
350
Ro*a/(1-a)
Po*a
61
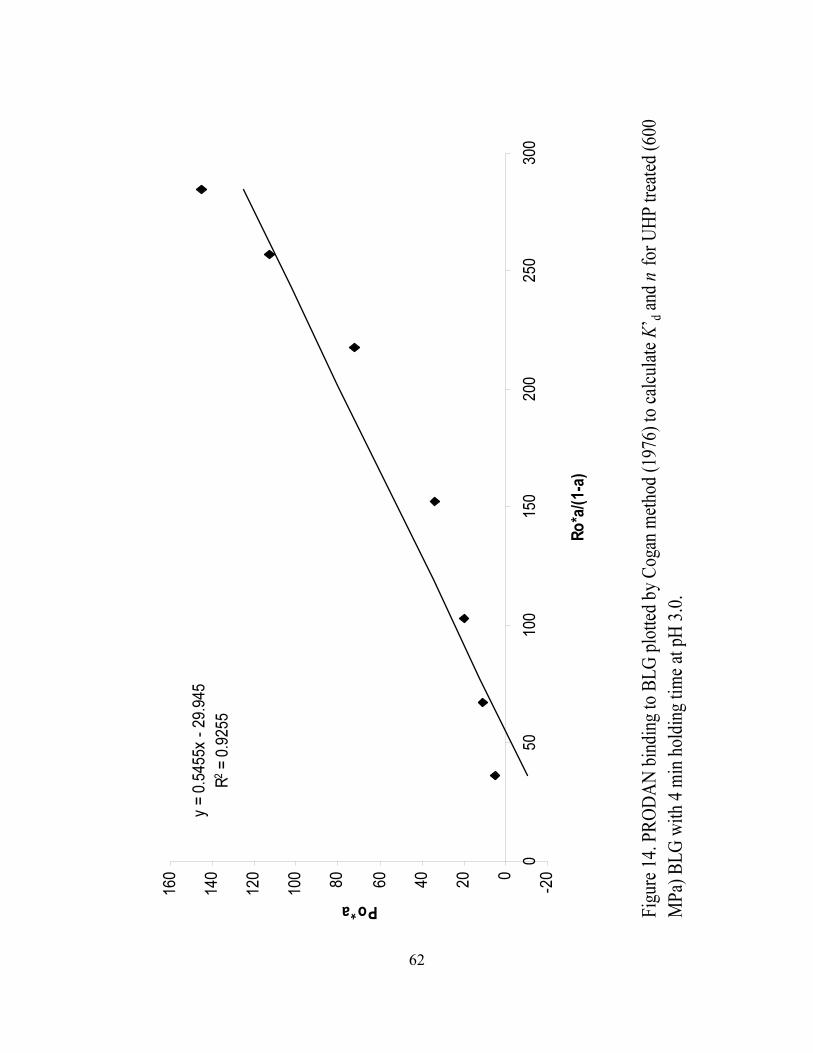
Fig
ure
14. P
RO
DA
N b
indi
ng to
BL
G p
lott
ed b
y C
ogan
met
hod
(197
6) t
o ca
lcul
ate K
’ dan
d n
for
UH
P tr
eate
d (6
00
MP
a) B
LG
wit
h 4
min
hol
ding
tim
e at
pH
3.0
.
y =
0.5
455x -
29.9
45
R2 =
0.9
255
-200
20
40
60
80
100
120
140
160
050
100
150
200
250
300
Ro*a/(1-a)
Po*a
62
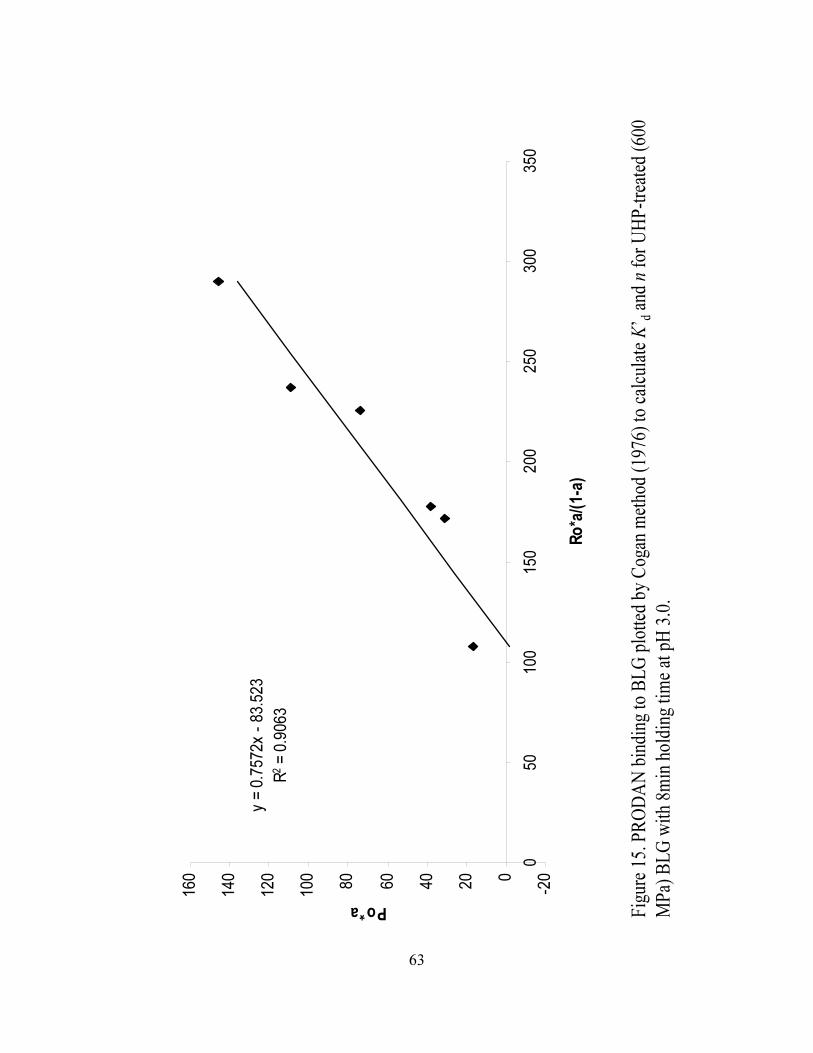
Fig
ure
15. P
RO
DA
N b
indi
ng to
BL
G p
lott
ed b
y C
ogan
met
hod
(197
6) to
cal
cula
te K
’ dan
d n
for
UH
P-t
reat
ed (
600
MP
a) B
LG
wit
h 8m
in h
oldi
ng ti
me
at p
H 3
.0.
y =
0.7
572x -
83.5
23
R2 =
0.9
063
-200
20
40
60
80
100
120
140
160
050
100
150
200
250
300
350
Ro*a/(1-a)
Po*a
63
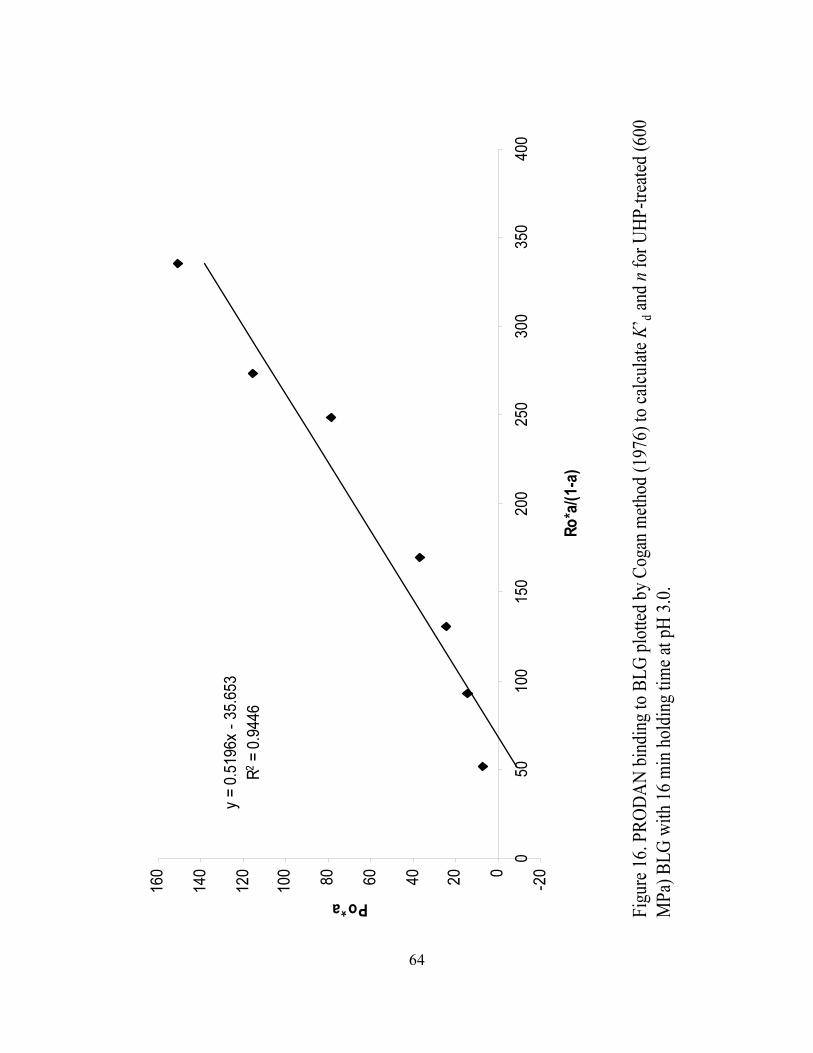
Fig
ure
16. P
RO
DA
N b
indi
ng t
o B
LG
plo
tted
by
Cog
an m
etho
d (1
976)
to
calc
ulat
e K
’ dan
d n
for
UH
P-t
reat
ed (
600
MP
a) B
LG
wit
h 16
min
hol
ding
tim
e at
pH
3.0
.
y =
0.5
196x -
35.6
53
R2 =
0.9
446
-200
20
40
60
80
100
120
140
160
050
100
150
200
250
300
350
400
Ro*a/(1-a)
Po*a
64
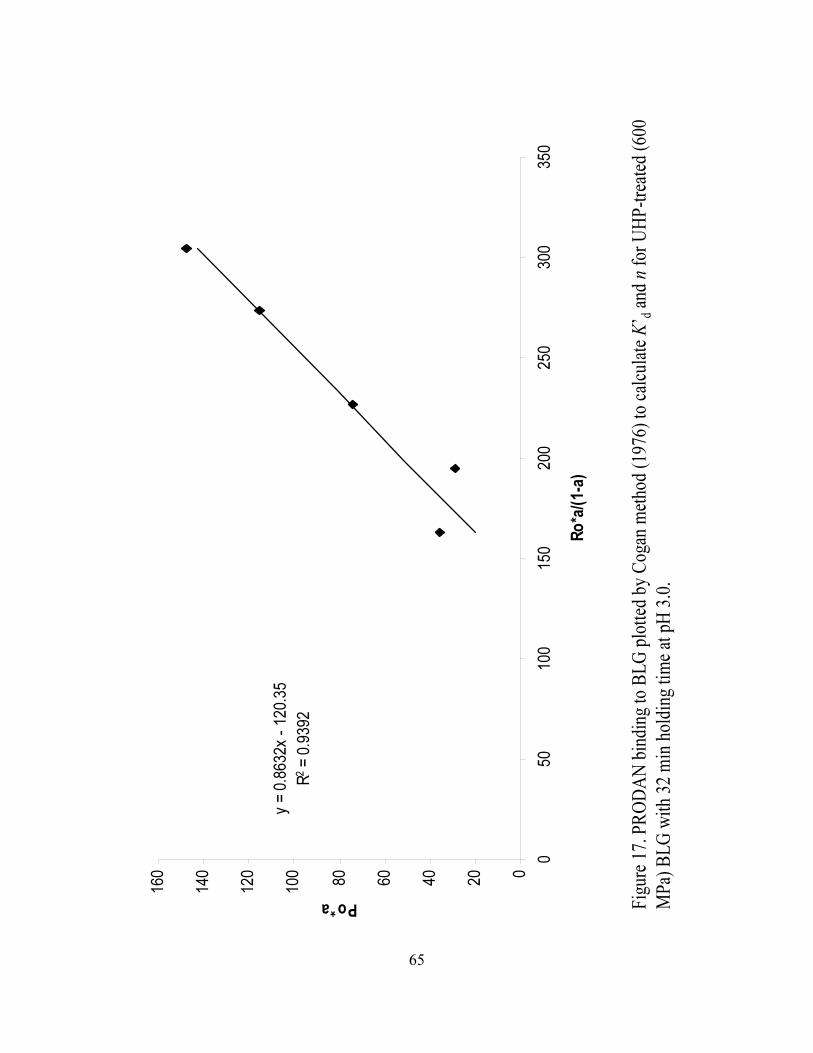
Fig
ure
17. P
RO
DA
N b
indi
ng to
BL
G p
lott
ed b
y C
ogan
met
hod
(197
6) to
cal
cula
te K
’ dan
d n
for
UH
P-t
reat
ed (
600
MP
a) B
LG
wit
h 32
min
hol
ding
tim
e at
pH
3.0
.
y =
0.8
632x -
120.3
5
R2 =
0.9
392
0
20
40
60
80
100
120
140
160
05
010
0150
200
250
300
35
0
Ro*a/(1-a)
Po*a
65
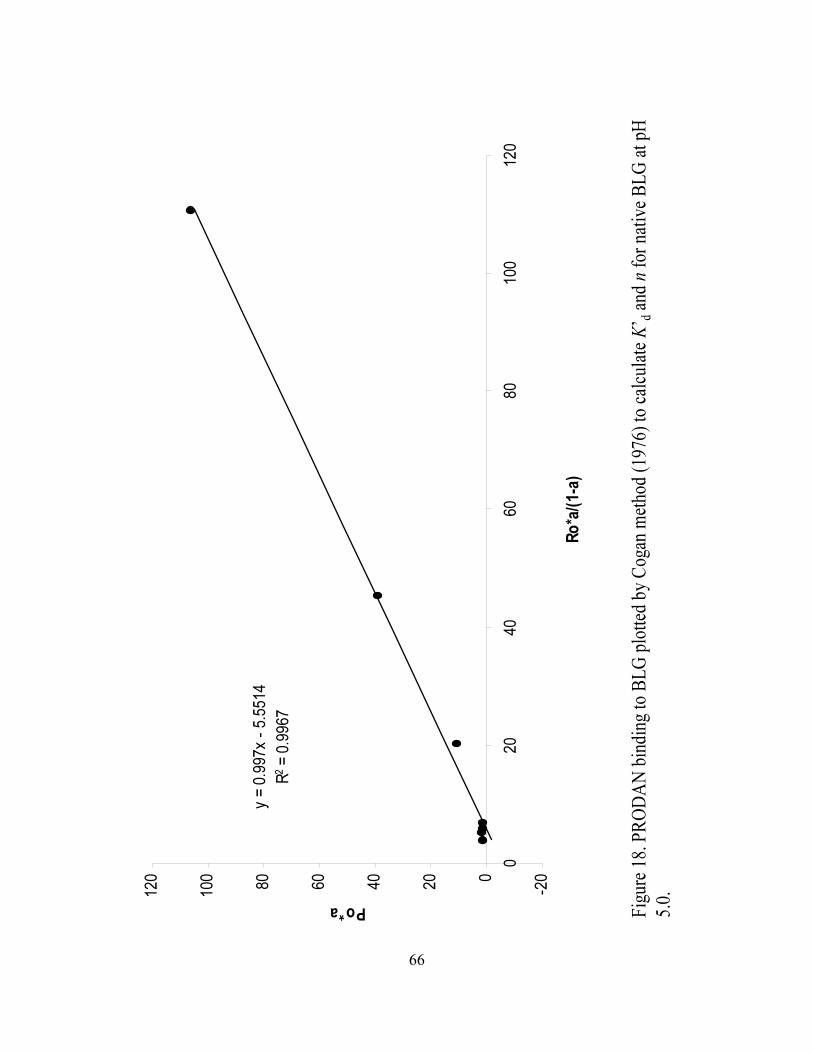
Fig
ure
18. P
RO
DA
N b
indi
ng to
BL
G p
lott
ed b
y C
ogan
met
hod
(197
6) to
cal
cula
te K
’ dan
d n
for
nati
ve B
LG
at p
H
5.0.
y =
0.9
97x -
5.5
514
R2 =
0.9
967
-200
20
40
60
80
100
120
020
40
60
80
100
120
Ro*a/(1-a)
Po*a
66
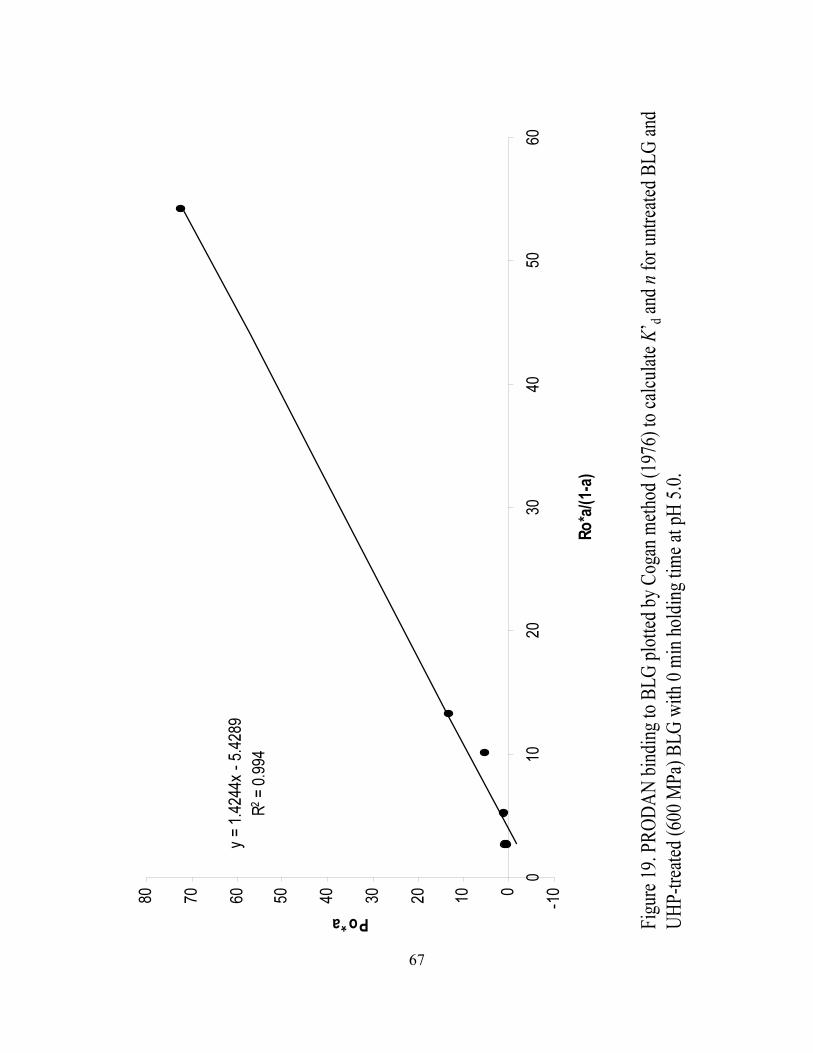
Fig
ure
19. P
RO
DA
N b
indi
ng to
BL
G p
lott
ed b
y C
ogan
met
hod
(197
6) to
cal
cula
te K
’ dan
d n
for
untr
eate
d B
LG
and
UH
P-t
reat
ed (
600
MP
a) B
LG
wit
h 0
min
hol
ding
tim
e at
pH
5.0
.
y =
1.42
44x
- 5.
4289
R2 =
0.9
94
-1001020304050607080
010
2030
4050
60
Ro*a/(1-a)
Po*a
67
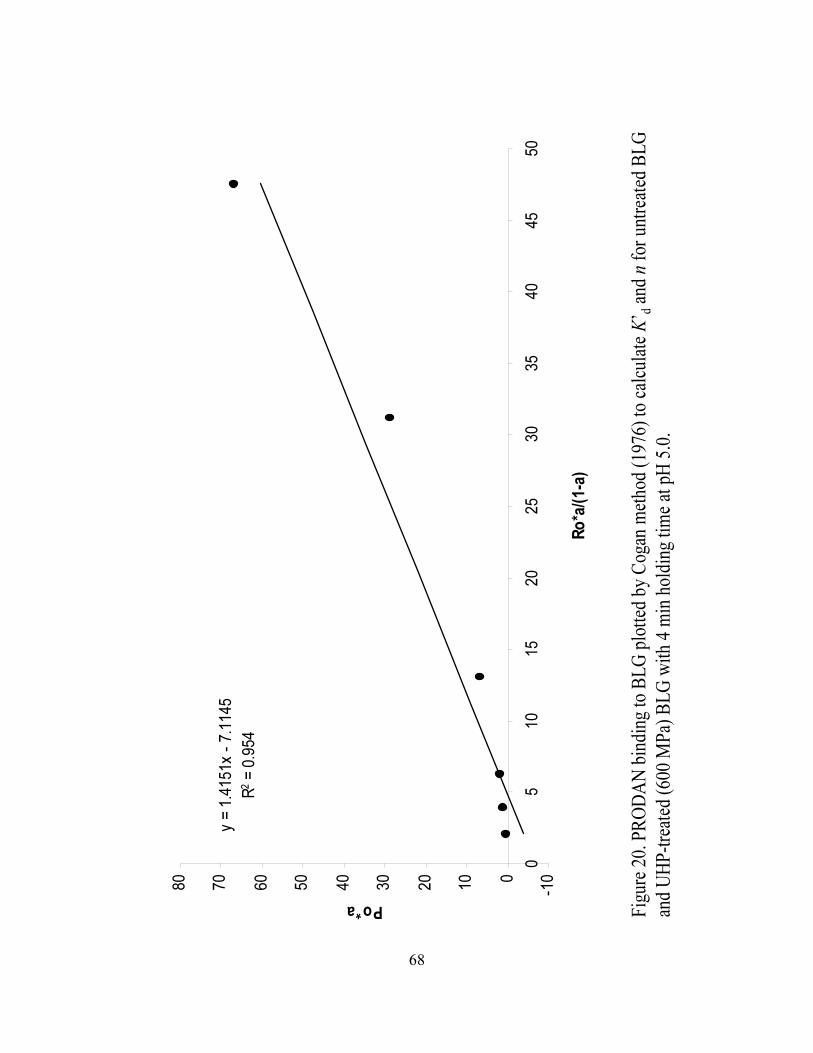
Fig
ure
20. P
RO
DA
N b
indi
ng to
BL
G p
lott
ed b
y C
ogan
met
hod
(197
6) to
cal
cula
te K
’ dan
d n
for
untr
eate
d B
LG
and
UH
P-t
reat
ed (
600
MP
a) B
LG
wit
h 4
min
hol
ding
tim
e at
pH
5.0
.
y =
1.4
151x -
7.1
145
R2 =
0.9
54
-100
10
20
30
40
50
60
70
80
05
10
15
20
25
30
35
40
45
50
Ro*a/(1-a)
Po*a
68
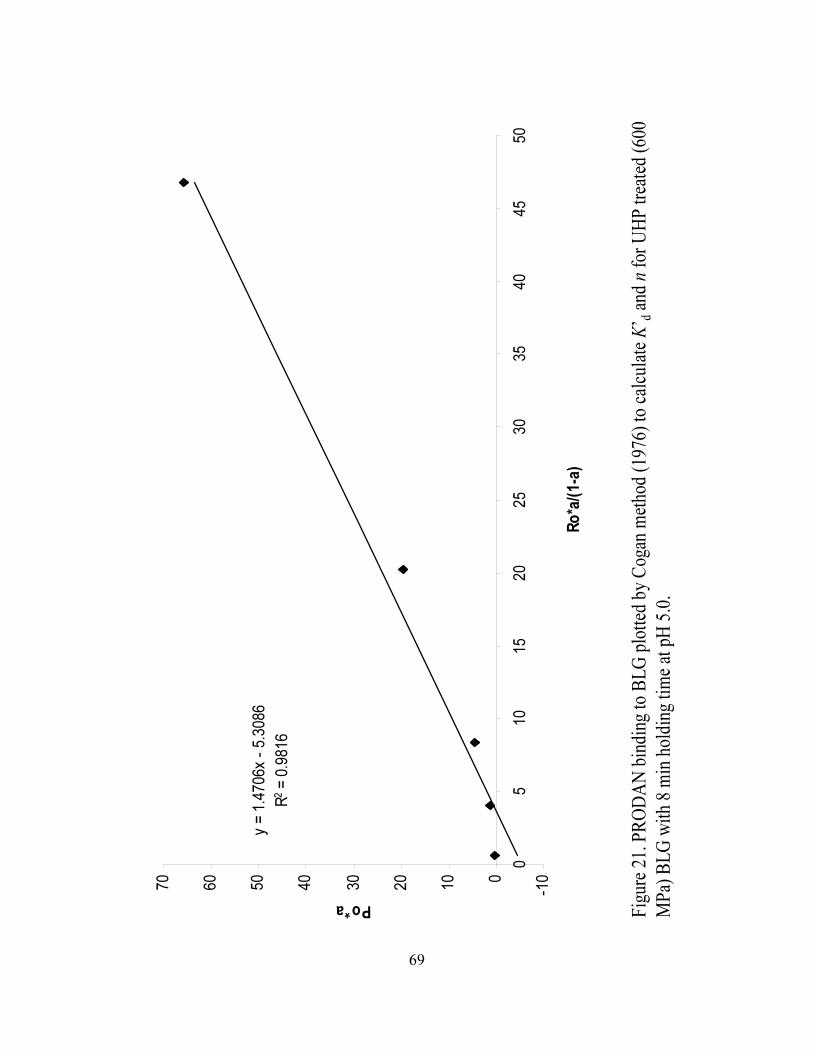
Fig
ure
21. P
RO
DA
N b
indi
ng to
BL
G p
lott
ed b
y C
ogan
met
hod
(197
6) to
cal
cula
te K
’ dan
d n
for
UH
P tr
eate
d (6
00
MP
a) B
LG
wit
h 8
min
hol
ding
tim
e at
pH
5.0
.
y =
1.4
706x -
5.3
086
R2 =
0.9
816
-100
10
20
30
40
50
60
70
05
10
15
20
25
30
35
40
45
50
Ro*a/(1-a)
Po*a
69
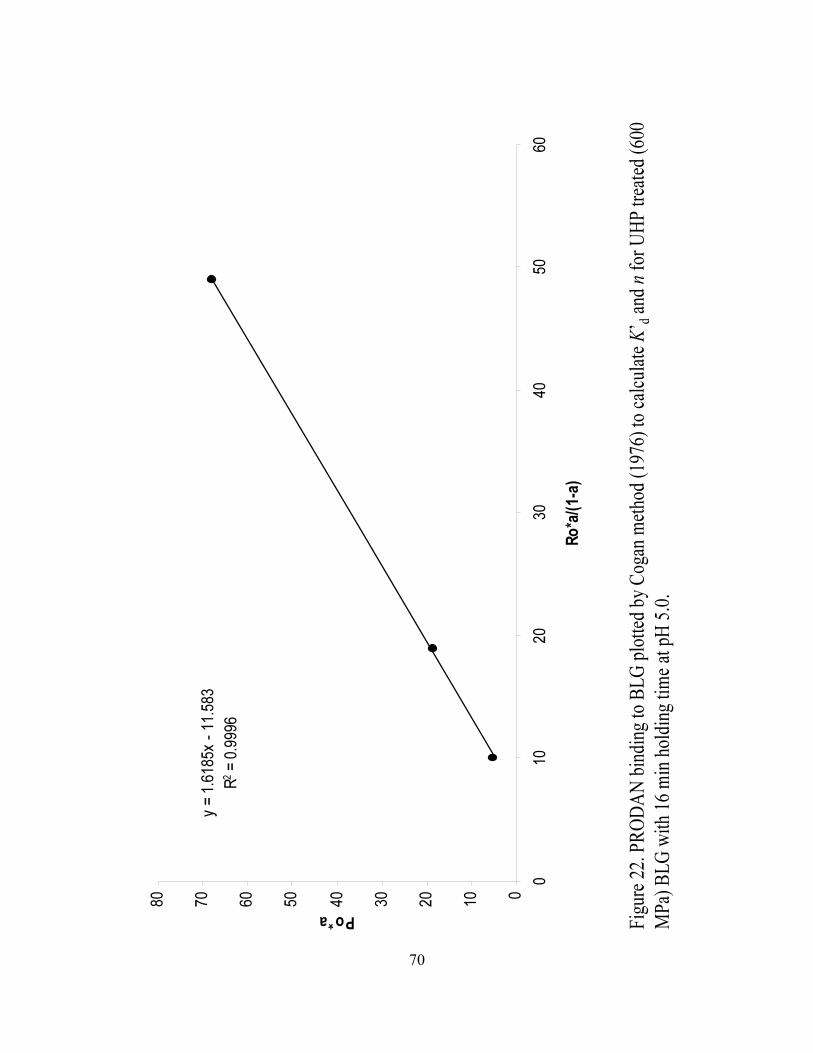
Fig
ure
22. P
RO
DA
N b
indi
ng to
BL
G p
lott
ed b
y C
ogan
met
hod
(197
6) to
cal
cula
te K
’ dan
d n
for
UH
P tr
eate
d (6
00
MP
a) B
LG
wit
h 16
min
hol
ding
tim
e at
pH
5.0
.
y =
1.61
85x
- 11
.583
R2 =
0.9
996
01020304050607080
010
2030
4050
60
Ro*a/(1-a)
Po*a
70

Fig
ure
23. P
RO
DA
N b
indi
ng to
BL
G p
lott
ed b
y C
ogan
met
hod
(197
6) to
cal
cula
te K
’ dan
d n
for
UH
P tr
eate
d (6
00
MP
a) B
LG
wit
h 32
min
hol
ding
tim
e at
pH
5.0
.
y = 1
.4841x -
5.1
371
R2 =
0.9
83
-100
10
20
30
40
50
60
70
05
10
15
20
25
30
35
40
45
50
Ro*a/(1-a)
Po*a
71
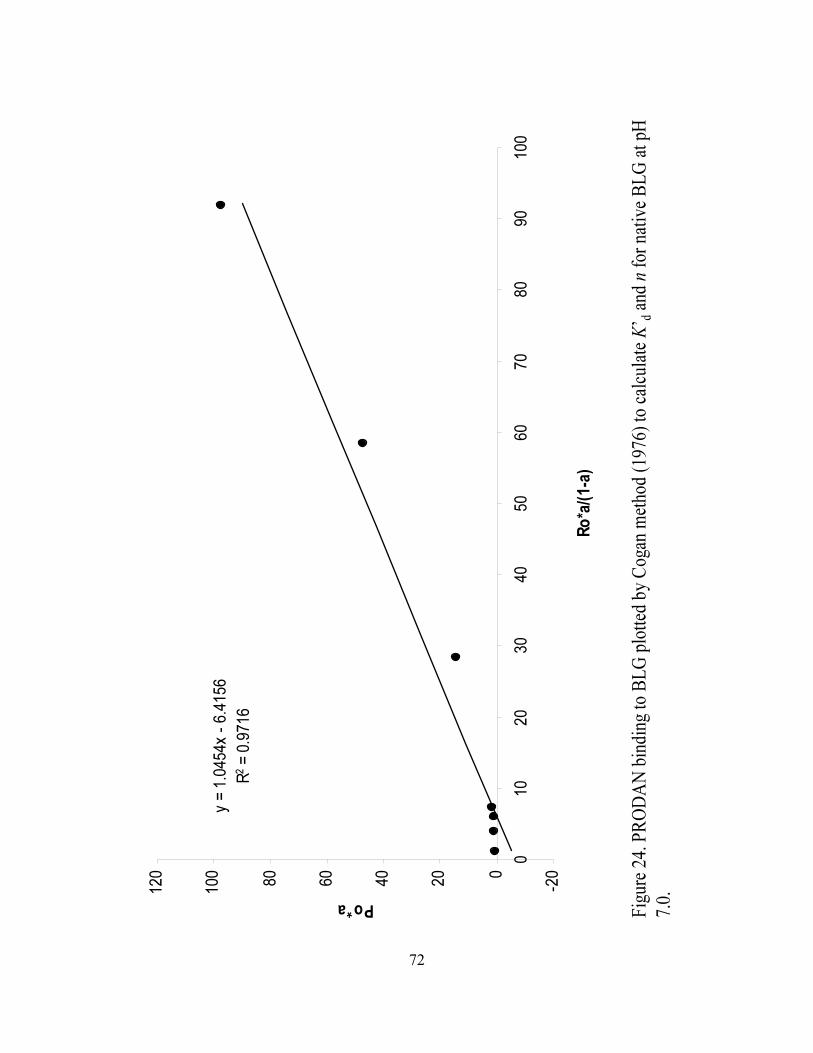
Fig
ure
24. P
RO
DA
N b
indi
ng to
BL
G p
lott
ed b
y C
ogan
met
hod
(197
6) t
o ca
lcul
ate K
’ dan
d n
for
nati
ve B
LG
at p
H
7.0.
y =
1.0
454x -
6.4
156
R2 =
0.9
716
-200
20
40
60
80
100
120
010
20
30
40
50
60
70
80
90
100
Ro*a/(1-a)
Po*a
72
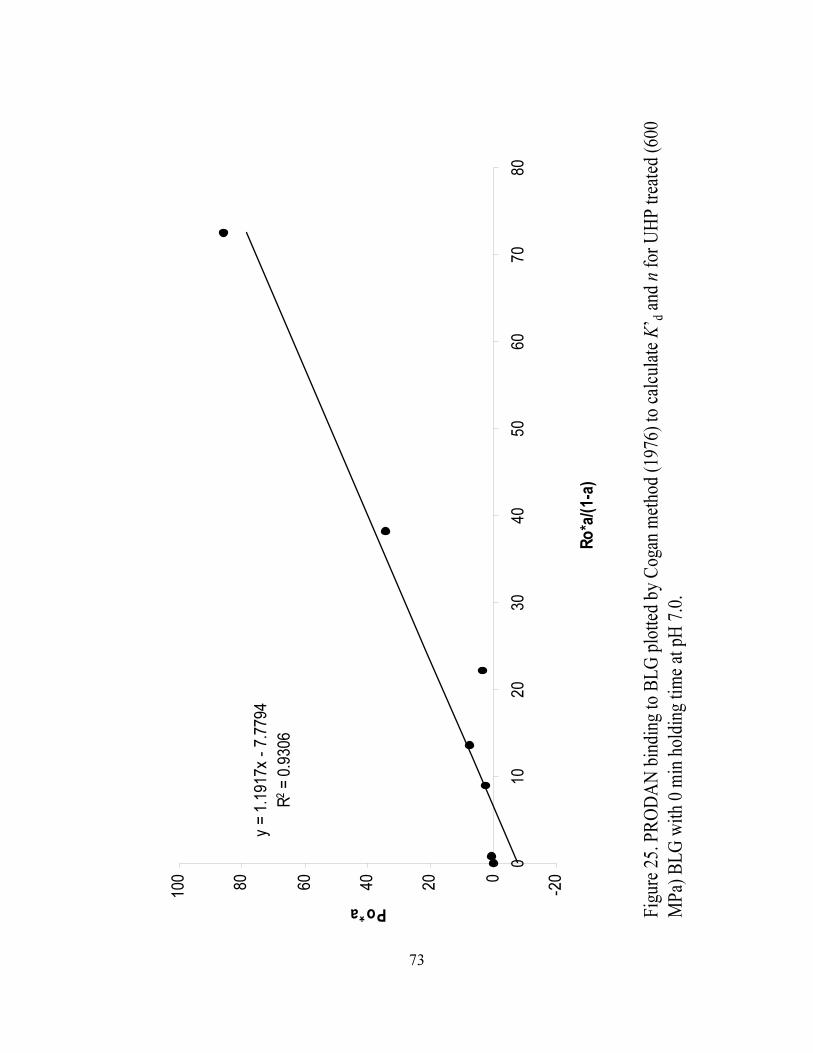
Fig
ure
25. P
RO
DA
N b
indi
ng to
BL
G p
lott
ed b
y C
ogan
met
hod
(197
6) to
cal
cula
te K
’ dan
d n
for
UH
P tr
eate
d (6
00
MP
a) B
LG
wit
h 0
min
hol
ding
tim
e at
pH
7.0
.
y =
1.1
917x -
7.7
794
R2 =
0.9
306
-200
20
40
60
80
100
010
20
30
40
50
60
70
80
Ro*a/(1-a)
Po*a
73

Fig
ure
26. P
RO
DA
N b
indi
ng t
o B
LG
plo
tted
by
Cog
an m
etho
d (1
976)
to
calc
ulat
e K
’ dan
d n
for
UH
P t
reat
ed (
600
MP
a) B
LG
wit
h 4
min
hol
ding
tim
e at
pH
7.0
.
y =
1.2
602x -
5.7
985
R2 =
0.9
858
-100
10
20
30
40
50
60
70
80
90
010
20
30
40
50
60
70
80
Ro*a/(1-a)
Po*a
74
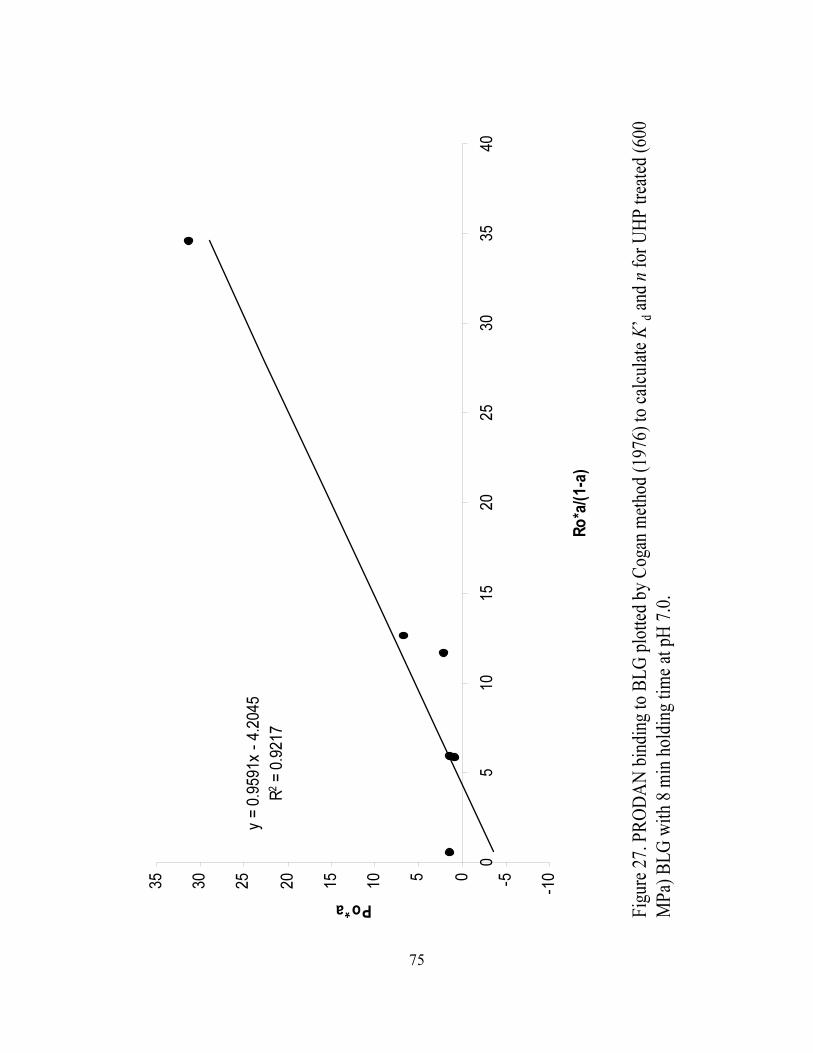
Fig
ure
27. P
RO
DA
N b
indi
ng t
o B
LG
plo
tted
by
Cog
an m
etho
d (1
976)
to
calc
ulat
e K
’ dan
d n
for
UH
P t
reat
ed (
600
MP
a) B
LG
wit
h 8
min
hol
ding
tim
e at
pH
7.0
.
y =
0.9
591x -
4.2
045
R2 =
0.9
217
-10-505
10
15
20
25
30
35
05
10
15
20
25
30
35
40
Ro*a/(1-a)
Po*a
75
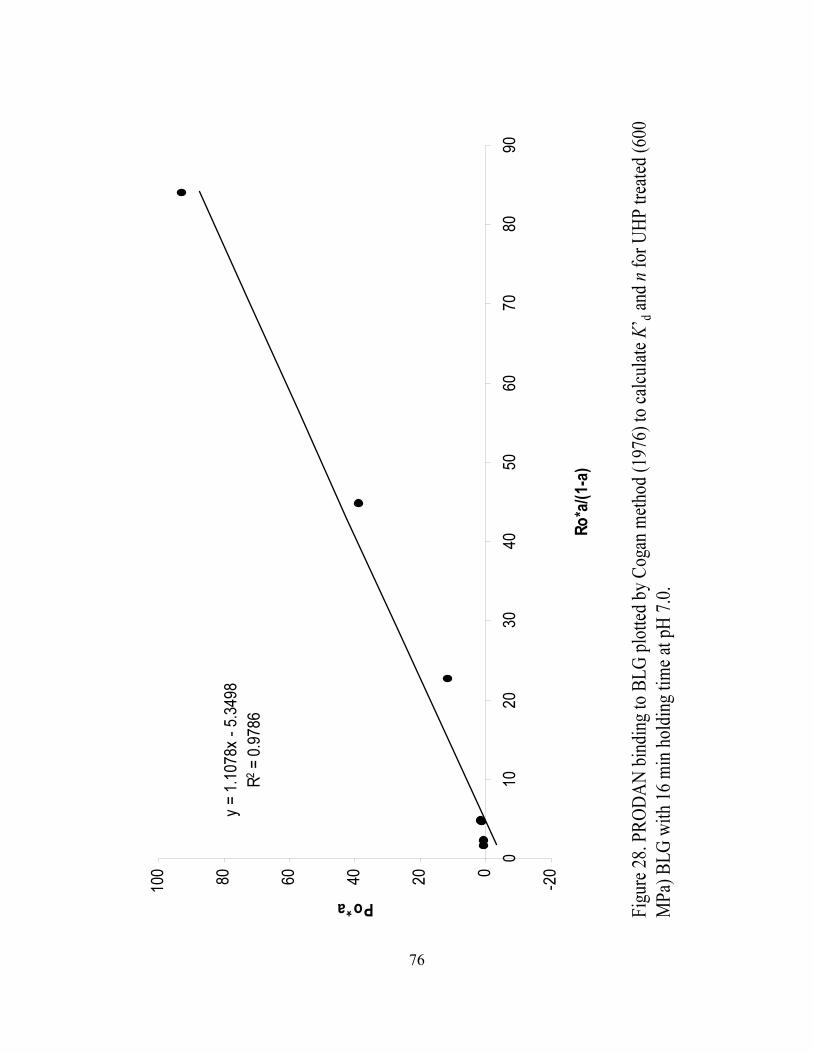
Fig
ure
28. P
RO
DA
N b
indi
ng t
o B
LG
plo
tted
by
Cog
an m
etho
d (1
976)
to
calc
ulat
e K
’ dan
d n
for
UH
P tr
eate
d (6
00
MP
a) B
LG
wit
h 16
min
hol
ding
tim
e at
pH
7.0
.
y =
1.1
078x -
5.3
498
R2 =
0.9
786
-200
20
40
60
80
100
010
20
30
40
50
60
70
80
90
Ro*a/(1-a)
Po*a
76
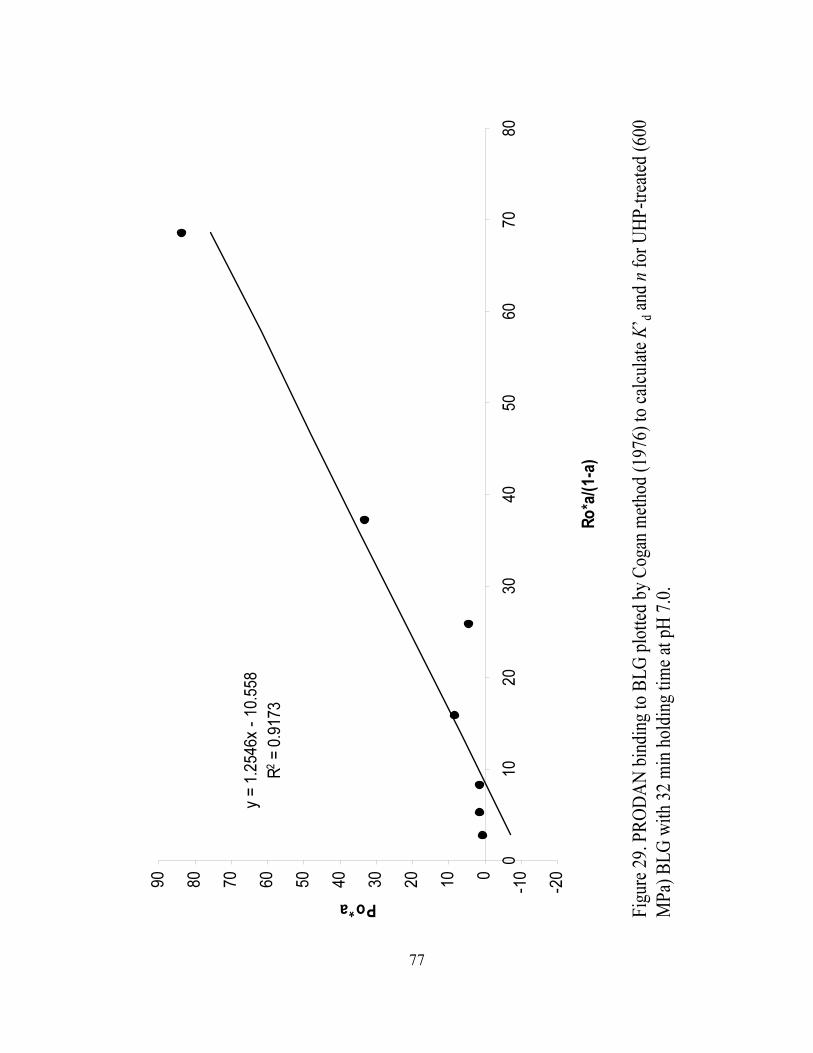
Fig
ure
29. P
RO
DA
N b
indi
ng t
o B
LG
plo
tted
by
Cog
an m
etho
d (1
976)
to
calc
ulat
e K
’ dan
d n
for
UH
P-t
reat
ed (
600
MP
a) B
LG
wit
h 32
min
hol
ding
tim
e at
pH
7.0
.
y =
1.2
546x -
10.5
58
R2 =
0.9
173
-20
-100
10
20
30
40
50
60
70
80
90
010
20
30
40
50
60
70
80
Ro*a/(1-a)
Po*a
77
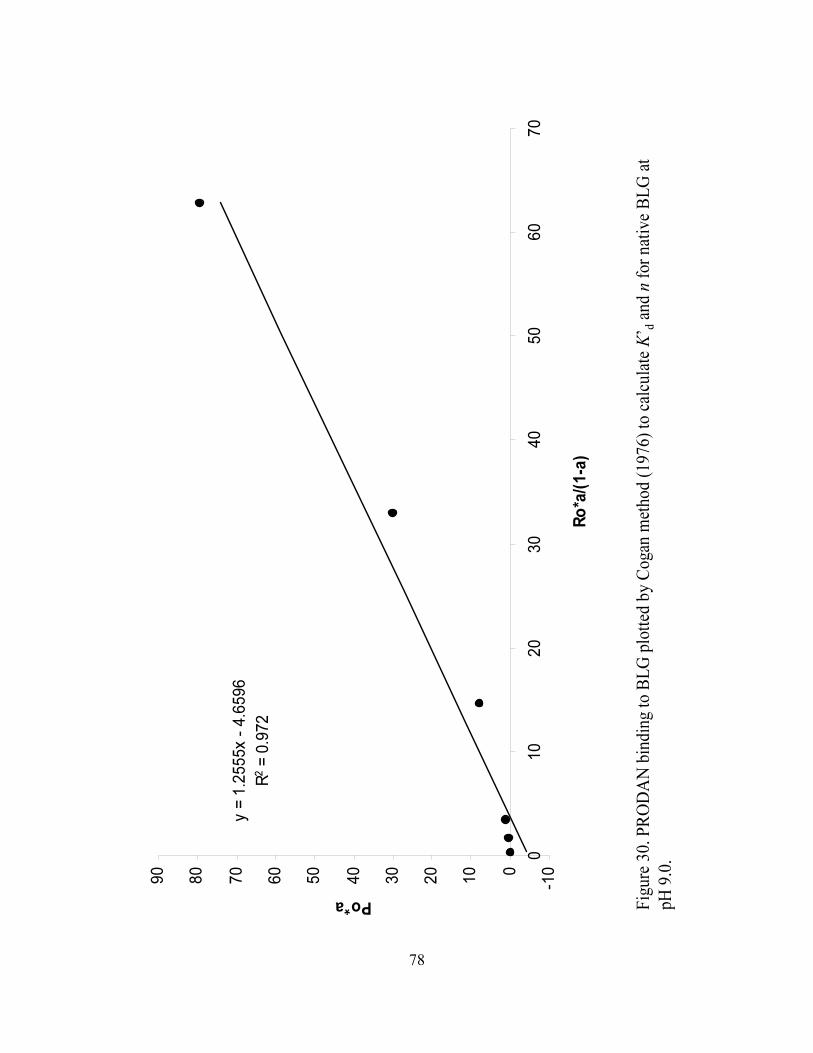
Fig
ure
30
. P
RO
DA
N b
ind
ing
to B
LG
plo
tted
by
Co
gan
met
ho
d (
19
76
) to
cal
cula
te K
’ dan
d n
for
nat
ive
BL
G a
t
pH
9.0
.
y =
1.2
555x -
4.6
596
R2 =
0.9
72
-100
10
20
30
40
50
60
70
80
90
010
20
30
40
50
60
70
Ro*a/(1-a)
Po*a
78
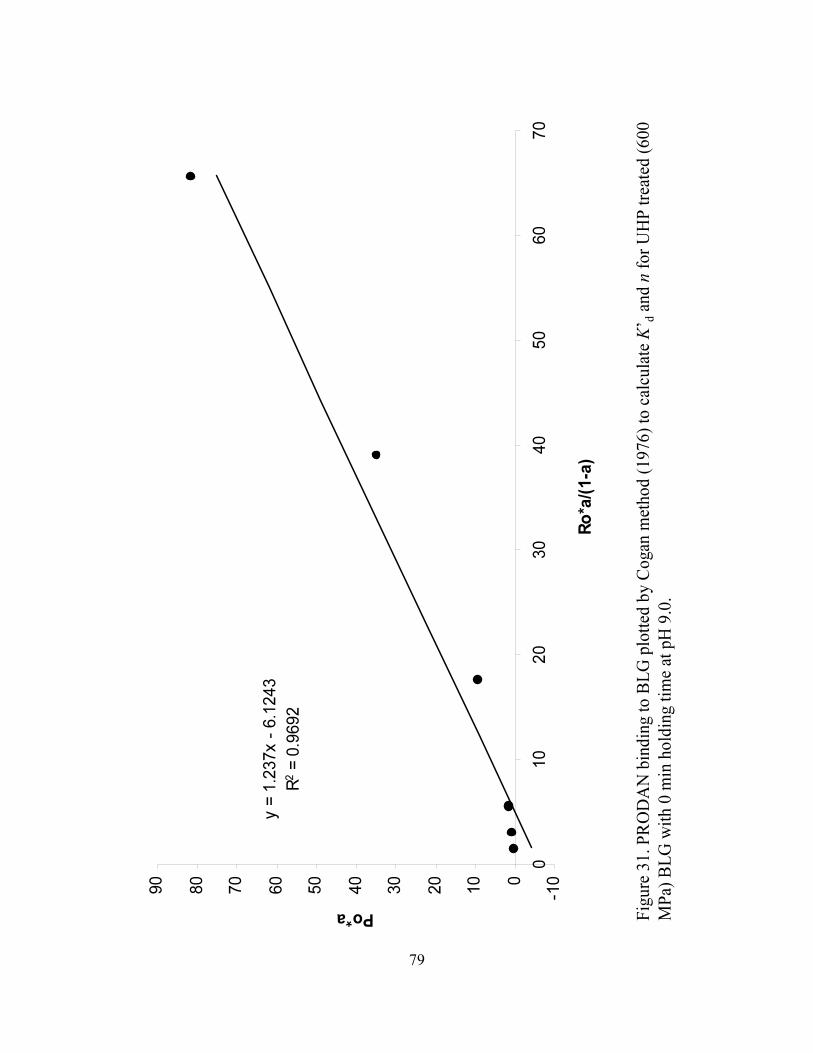
Fig
ure
31
. P
RO
DA
N b
ind
ing t
o B
LG
plo
tted
by C
ogan
met
ho
d (
19
76
) to
cal
cula
te K
’ dan
d n
for
UH
P t
reat
ed (
60
0
MP
a) B
LG
wit
h 0
min
ho
ldin
g t
ime
at p
H 9
.0.
y =
1.2
37x -
6.1
243
R2 =
0.9
692
-100
10
20
30
40
50
60
70
80
90
010
20
30
40
50
60
70
Ro*a/(1-a)
Po*a
79
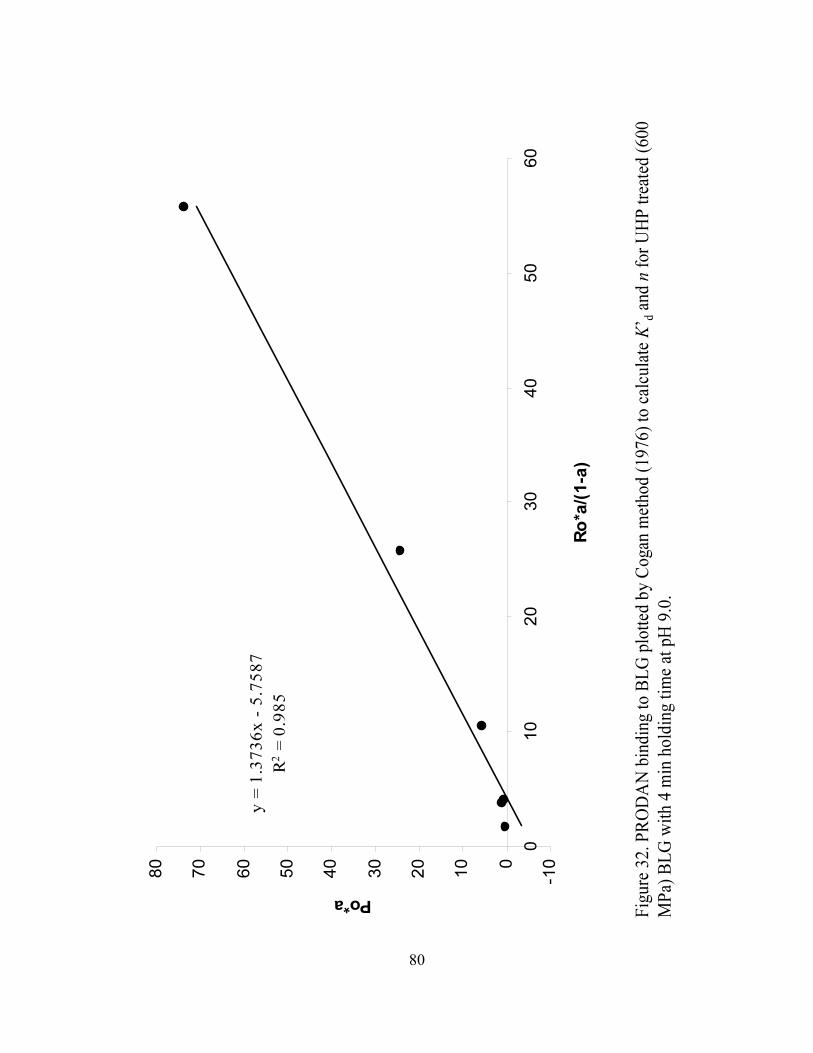
Fig
ure
32. P
RO
DA
N b
indin
g t
o B
LG
plo
tted
by
Cogan
met
hod (
1976)
to c
alcu
late
K’ d
and n
for
UH
P t
reat
ed (
600
MP
a) B
LG
wit
h 4
min
hold
ing t
ime
at p
H 9
.0.
y =
1.3
73
6x
- 5
.75
87
R2 =
0.9
85
-100
10
20
30
40
50
60
70
80
010
20
30
40
50
60
Ro*a/(1-a)
Po*a
80
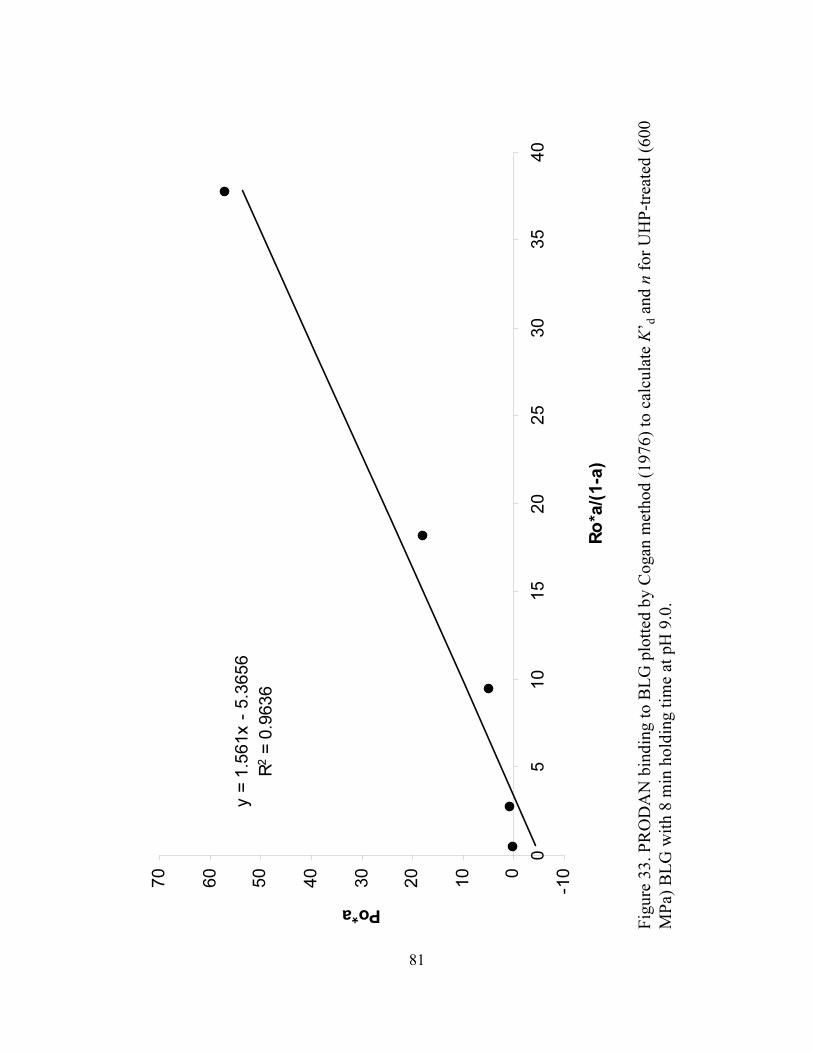
Fig
ure
33. P
RO
DA
N b
indin
g t
o B
LG
plo
tted
by C
ogan
met
hod (
1976)
to c
alcu
late
K’ d
and n
for
UH
P-t
reat
ed (
600
MP
a) B
LG
wit
h 8
min
hold
ing t
ime
at p
H 9
.0.
y =
1.5
61x -
5.3
656
R2 =
0.9
636
-100
10
20
30
40
50
60
70
05
10
15
20
25
30
35
40
Ro*a/(1-a)
Po*a
81
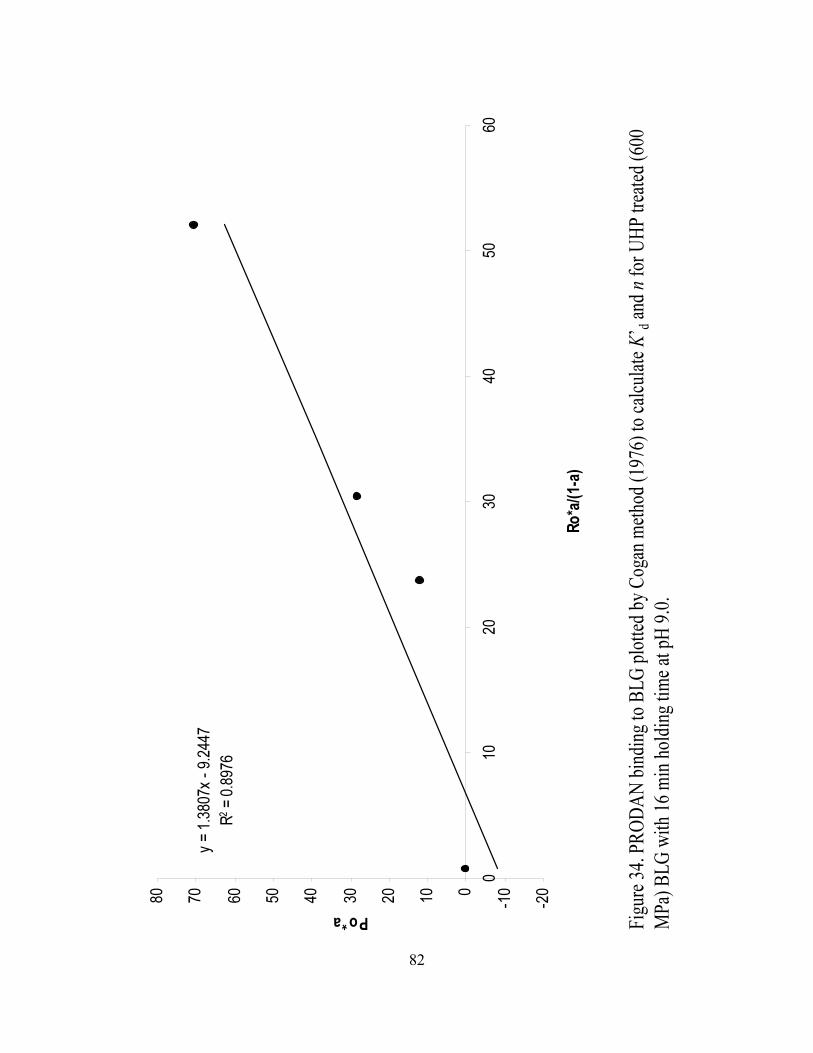
Figu
re 3
4. P
RO
DA
N b
indi
ng to
BL
G p
lott
ed b
y C
ogan
met
hod
(197
6) to
cal
cula
te K
’ dan
d n
for
UH
P tr
eate
d (6
00
MP
a) B
LG
wit
h 16
min
hol
ding
tim
e at
pH
9.0
.
y =
1.38
07x
- 9.
2447
R2 =
0.8
976
-20
-1001020304050607080
010
2030
4050
60
Ro*a/(1-a)
Po*a
82
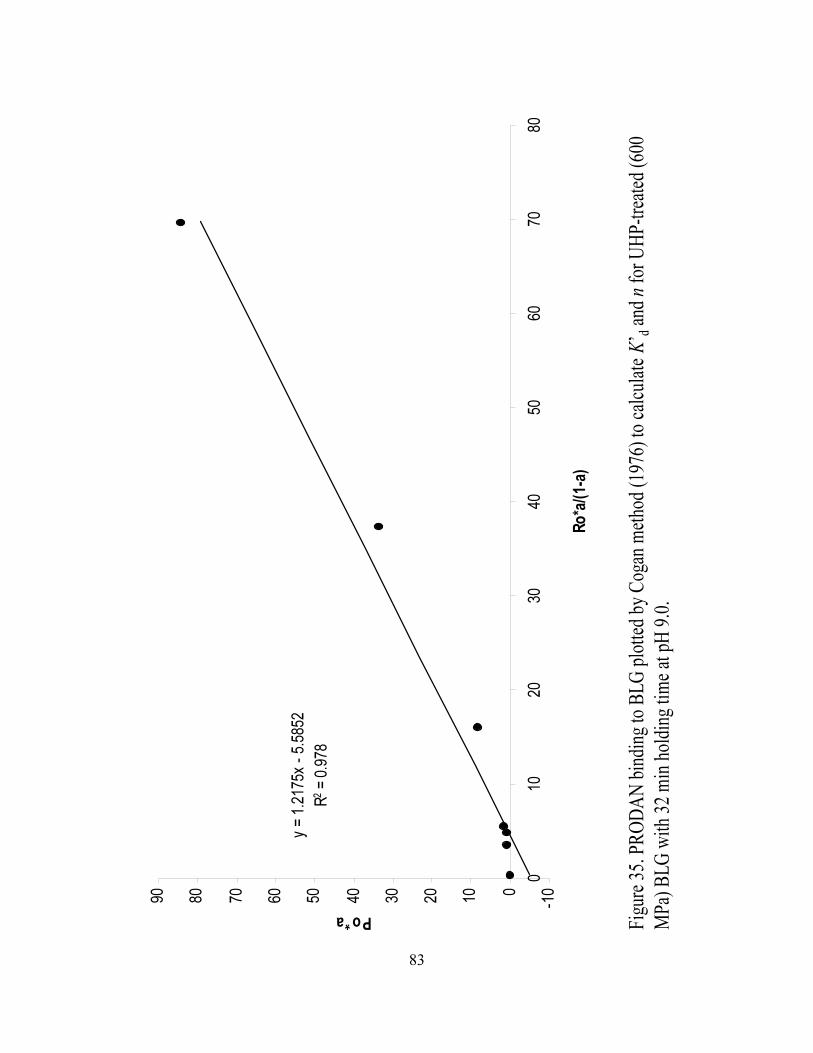
Figu
re 3
5. P
RO
DA
N b
indi
ng to
BL
G p
lott
ed b
y C
ogan
met
hod
(197
6) to
cal
cula
te K
’ dan
d n
for
UH
P-tr
eate
d (6
00
MPa
) B
LG
with
32
min
hol
ding
tim
e at
pH
9.0
.
y =
1.21
75x
- 5.
5852
R2 =
0.9
78
-100102030405060708090
010
2030
4050
6070
80
Ro*a/(1-a)
Po*a
83

Tab
le 1
. A
pp
aren
t d
isso
ciat
ion
co
nst
ants
(K
’ d)
and
th
e n
um
ber
of
bin
din
g s
ites
(n
) of
BL
G f
or
PR
OD
AN
aft
er U
HP
trea
tmen
t (6
00
MP
a) f
or
sele
cted
ho
ldin
g t
imes
of
0 t
o 3
2 m
in (
UH
P0
-UH
P3
2)
at p
H 3
.0-9
.0 c
alcu
late
d u
sin
g t
he
met
ho
d b
y C
ogan
an
d o
ther
s (1
97
6)*
.
pH
3p
H5
pH
7p
H9
K' d
(10-7
M)1
n2
K' d
(10-7
M)1
n2
K' d
(10
-7 M
)1n
2K
' d (
10-7
M)1
n2
BLG
112.1
42.2
55.5
51.0
46.1
50.9
53.7
10.8
9
UH
P0
72.5
31.8
63.5
50.7
86.7
50.8
64.6
30.7
9
UH
P4
53.9
91.8
05.0
90.7
44.5
11.0
54.1
00.7
5
UH
P8
110.4
21.2
53.8
40.7
24.8
61.0
43.3
10.6
2
UH
P16
67.7
91.9
07.1
40.6
24.8
40.9
56.7
00.7
3
UH
P32
138.8
71.1
63.4
10.6
98.4
40.7
84.5
70.8
4
*:
Dat
a ar
e m
eans
of
thre
e an
aly
ses
calc
ula
ted
usi
ng m
etho
d b
y C
ogan a
nd
oth
ers
(19
76
).1,2
: M
eans
wit
h d
iffe
rent
lett
ers
in t
he
colu
mn a
re s
ignif
ican
tly d
iffe
rent
(p <
0.0
5).
a b c d e f
a b c d e f
a b c d e f
a b c d e f
a b c d e f
a b c d e f
a b c d e f
a b c d e f
pH
3p
H5
pH
7p
H9
K' d
(10-7
M)1
n2
K' d
(10-7
M)1
n2
K' d
(10
-7 M
)1n
2K
' d (
10-7
M)1
n2
BLG
112.1
42.2
55.5
51.0
46.1
50.9
53.7
10.8
9
UH
P0
72.5
31.8
63.5
50.7
86.7
50.8
64.6
30.7
9
UH
P4
53.9
91.8
05.0
90.7
44.5
11.0
54.1
00.7
5
UH
P8
110.4
21.2
53.8
40.7
24.8
61.0
43.3
10.6
2
UH
P16
67.7
91.9
07.1
40.6
24.8
40.9
56.7
00.7
3
UH
P32
138.8
71.1
63.4
10.6
98.4
40.7
84.5
70.8
4
*:
Dat
a ar
e m
eans
of
thre
e an
aly
ses
calc
ula
ted
usi
ng m
etho
d b
y C
ogan a
nd
oth
ers
(19
76
).1,2
: M
eans
wit
h d
iffe
rent
lett
ers
in t
he
colu
mn a
re s
ignif
ican
tly d
iffe
rent
(p <
0.0
5).
a b c d e fa b c d e f
a b c d e fa b c d e f
a b c d e fa b c d e f
a b c d e fa b c d e f
a b c d e fa b c d e f
a b c d e fa b c d e f
a b c d e fa b c d e f
a b c d e fa b c d e f
84

CHAPTER THREE
Application of solid-phase microextraction with headspace gas chromatography for
the analysis of diacetyl, 2-methylbutyraldehyde, ethyl lactate, and δ-decalactone in
Model Buffer Solution
Tinyee HoangP
1P, D. Scott MattinsonP
2P, John K. Fellman P
2P, Joseph R. Powers P
1P, and Barry
SwansonP
1P
(1) Dept. of Food Science & Human Nutrition, (2) Dept. of Horticulture & Landscape
Architecture, Washington State Univ., PO Box 646376, Pullman, WA 99164-6376
85
ABSTRACT
A headspace solid phase microextraction (HS-SPME) method was developed for
the detection of selected flavor compounds, diacetyl, δ-decalactone, 2-
methylbutyraldehyde, and ethyl lactate, in sodium phosphate buffer (0.01M, pH 9). The
method required a total analysis time of 1.7 h for both extraction (10 min) and detection.
PDMS/DVB and CAR/PDMS SPME fibers were used to examine their extraction
efficiencies for the flavor compounds tested. Extraction time was investigated to
determine the analytical performance of these fibers for the selected flavor compounds.
The calibration plots were reproducible and linear (RP
2P > 0.954) for the selected flavor
compounds with the PDMS/DVB fiber tested. δ-Decalactone was not detected when
using the CAR/PDMS fiber due to the long chain length and presence of a hydrocarbon
tail of δ-decalactone under the current GC conditions.
86
INTRODUCTION
The extraction of flavor compounds from food involves concentrating the flavor
compounds using headspace, purge and trap, liquid-liquid extraction, solid phase
extraction, or simultaneous distillation/extraction techniques (Cai and others 2001;
Cullere and others 2003; Apps and Tock 2005; Blythe and others 2006), followed by
quantitation. The challenges of flavor compound analysis include extensive preparation
time or excessive use of organic solvents. Static headspace using a gas-tight syringe and
headspace solid-phase microextraction (SPME) are simple techniques, which are portable
and inexpensive, that eliminate these drawbacks (Saraulio and others 1997). SPME
requires no solvents or complicated apparatus that may introduce errors, can be used to
concentrate volatile and nonvolatile compounds in liquid or vapor phases, provides linear
results over wide concentrations of analytes, and can be coupled with any gas
chromatograph or gas chromatograph-mass spectrometer system for the identification and
quantitation of volatile compounds (Pawliszyn 2001).
With headspace (HS)-SPME, equilibrium involves the partitioning of analytes
between the aqueous phase of sample, the vapor phase and the extraction phase of the
SPME fiber. Extraction conditions must therefore be systematically optimized to increase
the partitioning of analytes in the coated fiber. Besides extraction conditions and analyte
properties, the choice of fiber coating is one of the most important aspects of
optimization, because the coating is dependent on analyte properties. Several SPME fiber
coatings are commercially available for extraction of nonpolar and polar compounds
from liquid or gaseous samples. Pawliszyn (2001) suggested considering
polydimethylsiloxane (PDMS) first, because of its ability to withstand high injection
87
temperatures. Although PDMS is a nonpolar liquid phase, it can successfully be applied
to extracting more polar compounds after optimizing extraction conditions (Pawliszyn
2001). Factors that improve the extraction of analytes by SPME are agitation, addition of
salt to the analyte solution, sample volume, headspace volume, pH or temperature of the
analyte solution, or sampling mode (immersion vs. headspace).
Gas chromatography (GC) is an important tool in analytical chemistry. Capillary
columns increase separating capabilities of GC so that complex compounds such as
flavors can be successfully resolved from solutions containing hundreds of components
(Braithwaite and Smith 1999). The factors that influence the retention of flavor
compounds are composition and properties of the mobile phase; type and properties of
the stationary phase; the intermolecular forces between the compound(s) and stationary
and mobile phases; and temperature of the column. Electrostatic interactions between
molecules include polar van der Waal’s retention forces arising from interaction between
molecules having a surface charge; and nonpolar dispersion forces between neutral
molecules or functional groups. Polar van der Waal’s retention forces are dipole-dipole
interactions and hydrogen bonding between molecules. Hydrogen bonded solvents will
attract polar solute molecules but will exhibit varying degrees of repulsion to nonpolar
molecules. Thus, solute molecules will be attracted towards the phase of similar polarity
in the GC system. In nonpolar solvents or stationary phase, London’s dispersion forces
are the main interactions between molecules. London dispersion forces are weak
intermolecular forces that arise from the attractive force between transient multipoles of
nonpolar molecules without permanent multipole moments. Multipole moments are
created when the electron densities are not evenly distributed throughout the nonpolar
88
molecule. Therefore, multipoles of one nonpolar molecule may interact with multipoles
of other nonpolar molecules (French 2000).
Diacetyl, 2-methylbutyraldehyde, ethyl lactate, and δ-decalactone were selected
based on the flavor profiles of foods perceived to contain or are rich, such as dairy
products (Badings and Neeter 1980; Milo and Reineccius 1997), chocolate, or cream-
based foods.
Diacetyl, or 2,3-butanedione, is one of the major flavor compounds in dairy
products and wine. Diacetyl contributes a characteristic buttery aroma and complexity to
the final sensory impact of food. Diacetyl is naturally produced upon the conversion of
lactose to lactic acid by lactic acid bacteria in cultured milks and fresh cheeses (Urbach
1995). After alcoholic fermentation ceases when fermentative yeasts die, malolactic
fermentation continues, either naturally or by inoculation, in wines and produces diacetyl
among other aroma compounds (Hayasaka and Bartowsky 1999). Diacetyl is an
important flavor compound in many dairy products and wine, yet is not studied or
extensively subjected to quantitative analyses due to analytical difficulties in the
quantitation from its high volatility. Diaz and others (2004) evaluated fiber selection,
extraction time, temperature and ionic strength for headspace SPME analysis of diacetyl
from water samples of the Llobregat River in Spain. They determined that extraction of
diacetyl for 30 min with a CAR/PDMS fiber and polar column at 60 °C resulted good
linearity (rP
2P > 0.999) and good reproducibility (R.S.D. < 20%).
2-Methylbutyraldehyde (2MB) is a Strecker aldehyde that contributes a
characteristic cocoa aroma. 2MB is formed from the deamination and decarboxylation of
branched chain amino acid isoleucine by brewing yeast, and can be reduced
89
enzymatically to ‘fusel’ alcohols (Ford and Ellis 2002). The ‘fusel’ alcohols and their
subsequent esters are important in the development of flavor during the brewing process.
Foese and others (1999) were able to detec 2-methylbutyraldehyde quantitatively in
disinfected water by purging water samples with N2 and trapping on Tenax-TA ™
adsorbent. The adsorbent was thermally desorbed by heating to 200 C, transferring the
analyte into a nonpolar GC column. Guillen and Ibargoitia (1999) used dichloromethane,
an organic solvent, to extract liquid smoke components, such as 2-methylbutyraldehyde,
and concentrated the components by evaporation prior to direct injection into a GC. Little
research is available on 2-methybutyraldehyde as a flavor ingredient in foods.
Ethyl lactate (EL) contributes a characteristic fruity, buttery and butterscotch
aroma. EL is used in yeast fermentations to produce roasted aromas that contribute to the
desirable flavor of thermally processed foods such as meat and bread (Rhlid and others
2002). Ethyl lactate was identified as a flavor compound in fresh coconut sap via direct
injection of a solvent concentrate into a GC-MS (Borse and others 2006). According to
the official method of the Office International de la Vigne et du Vin (OIV) (1994), ethyl
lactate is quantitatively determined using gas chromatography with a polar capillary
column. Soufleros and others (1994) modified the mthod by OIV in which analytes were
extracted by a mixture of solvents, mixed with an internal standard, and injected directly
into a GC with a polar capillary column.
Although fruits such as peaches, apricots and nectarines contain the pleasant
aromas of δ-lactones (Tamura and others 2005), δ-decalactone (dDL) imparts a creamy
and coconut note to foods. Guillot and others (2006) used headspace-SPME-GC to
quantitate various flavor compounds, including γ-decalactone, from apricot puree. They
90
reported that γ-decalactone was extracted in more quantities by a PDMS fiber than by
Carboxen/PDMS fiber when using a polar (DB-WAX) capillary column. Tamura and
others (2005) assessed the authenticity of δ-decalactone from peach, apricot, and
nectarine fruits by direct injection of analytes containing the flavor compound into a DB-
WAX column using a temperature program of 5-200 °C at a rate of 5 °C/min.
The objective of this research was to develop one method that can accommodate
the extraction and quantitation of diacetyl, ethyl lactate, δ-decalactone, and 2-
methylbutyraldehyde, separately and together, using HS-SPME coupled with gas
chromatography.
MATERIALS & METHODS
Diacetyl, 2-methylbutyraldehyde, δ-decalactone, and ethyl lactate were purchased
from Sigma-Aldrich (St. Louis, MO, USA ). The SPME fibers were purchased from
Supelco (Bellefonte, PA, USA). Polydimethylsiloxane-divinylbenzene (PDMS/DVB) of
65 µm thickness and carboxen- polydimethylsiloxane (CAR/PDMS) of 75 µm thickness
SPME fibers were selected based upon their affinity for the flavor. Fibers were
conditioned prior to use according to the manufacturer’s instructions: PDMS/DVB was
inserted into the GC injector at 250 °C for 0.5 h and CAR/PDMS at 300°C for 1-1.5 h.
SPME Procedure
Individual standard stock solutions of selected flavor compounds were prepared at
a concentration of 1 µg/mL in 10% ethanol and water to solubilize the flavor compounds.
An aliquot of each standard stock solution was mixed with 2 mL of sodium phosphate
buffer (0.01 M, pH 9.0) and 0.65 g NaCl to selected concentrations (0.001-0.01 µg/mL)
in a 4 mL amber vial sealed with a silicone septum.
91
An amber vial containing buffer, individual or combined flavor compounds, and
salt was placed on a magnetic hot stir plate (model PC-220, Corning, NY) and stirred at
400 rpm for 5 min to pre-equilibrate volatiles for each headspace (HS)-SPME analysis. A
pre-equilibration temperature of 37°C was chosen to mimic the temperature of the mouth
when flavor compounds are released during eating. The buffer containing the flavor
compounds and salt continue to stir during adsorption. The SPME needle pierced the
septum and the fiber was extended through the needle to bring the stationary phase in
contact with the assay headspace above selected concentrations of flavor solutions. The
fiber was withdrawn into the needle after an exposure time from 1 to 60 min. The
volatiles adsorbed to the SPME fiber were thermally desorbed into the injection port of a
Hewlett-Packard HP 5890A (Agilent Technologies, Palo Alto, CA, USA) gas
chromatograph connected to a FID detector in splitless mode. A DB-WAX column (60 m
x 0.32 mm i.d., 0.5 um film thickness, J&W Scientific, Folsom, CA) was chosen
according to methods by Diaz and others (2004), OIV (1994), Guillot and others (2006),
and Tamura and others (2005). Helium was used as the carrier gas. The injector
temperature was 250°C, according to the method of Adahchour and others (2005). The
oven temperature program was adopted from Tamura (2005) with a change at which the
oven was maintained at 33 °C, for 5 min before increasing to 50 °C, at a rate of 2 °C/min,
then to 200 °C, at a rate of 5 °C/min, and held for 37 min.
A standard curve, to assure a linear response of HS-SPME, was prepared by
adding selected flavor compounds in 10% ethanol to amber vials containing 2 mL sodium
phosphate buffer (0.01M, pH 9.0) and 0.65 g NaCl to yield solution concentrations from
4.02 µg/mL to 20.62 µg/mL of the flavor compounds. Volatile compounds in the vial
92
headspace were extracted using HS-SPME from 1 to 60 min at 37°C, and a calibration
curve was prepared by plotting peak area against solution concentration of specific flavor
compounds.
The characterization of chemical compounds using absolute gas chromatographic
retention times, or even specific retention volumes, is problematic, due to changes in
most of the critical gas chromatographic parameters for a given column that can occur
gradually with time. Thus, marked differences often exist between one chromatographic
system and the next (Peppard and Ramus 1988). Consequently the Kovats’ retention
index (KI) overcomes such problems. The KI relates the retention of compounds during
isothermal GC to the retention of a series of n-alkanes analyzed under identical
conditions. Each compound is thus bracketed by two hydrocarbons, both of which are
assigned a retention index value corresponding to the number of carbon atoms in the
molecule multiplied by 100. The KI for each flavor compound for the selected
temperature GC program was based on the following equation:
ytt
ttKI
yRzR
yRxR100*100
)()(
)()(+
⎟⎟
⎠
⎞
⎜⎜
⎝
⎛
−
−=
where tBR B is retention time, x is the solute of interest (i.e. flavor compound), y is the
normal alkane with y number of carbon atoms eluting before x, and z is the normal alkane
with z number of carbon atoms eluting after x.
Statistical Analysis
Data were analyzed by using one-way analysis of variance (ANOVA) procedure
using the General Linear Model, with further analysis using Tukey’s pairwise comparison
test to determine significance at p < 0.05 (SAS for Windows, version 9.1 TS Level, 1M2,
SAS Institute., Cary, NC, USA). 93
RESULTS & DISCUSSION
Extraction Time
The extraction time profiles of the PDMS/DVB and CAR/PDMS SPME fibers
were established by plotting detector response against extraction time. The equilibration
time is reached when a further increase in extraction time does not result in a significant
increase in detector response. Figures 1 and 2 present the time profiles for the
PDMS/DVB and CAR/PDMS fibers, respectively. Different extraction time profiles were
observed for the analytes on the tested coatings. The signals obtained increased with
increasing extraction time for all analytes; equilibration time was, however, different for
each coating. The PDMS/DVB fiber is a made of a blend of porous divinylbenzene
polymer particles with a liquid polydimethylsiloxane polymer. The PDMS polymer has a
high degree of porosity (1.5 mL/g) that can physically retain analytes, producing a strong
retention of analytes that fit tightly into the pores. DVB is mesoporous with micropores
that are fairly larger than Carboxen particles, and is ideal for trapping CB6B-CB15B analytes
(Pawliszyn 1999). The combination of PDMS and DVB has better affinity for polar
analytes. CAR/PDMS, on the other hand, is ideal for the analyses of molecules in the CB2B-
CB12B range, and has unique pores that pass completely through the particles so that small
analytes can be rapidly desorbed (Pawliszyn 1999).
The equilibration time for diacetyl, δ-decalactone, and ethyl lactate was 10 min,
and for 2-methylbutyraldehyde was 20 min for the PDMS/DVB fiber. The semipolar
nature of PDMS/DVB allows for the extraction of the selected flavor compounds,
including dDL, which has a polar head and a 5-carbon tail. Higher uptake of diacetyl,
ethyl lactate, and 2-methylbutyraldehyde was observed for the CAR/PDMS fiber,
94
because the polar fiber has a higher affinity for the low molecular mass compounds, and
Diaz and others (2004) have reported that the fiber presented greater efficiency than other
polar fibers, such as CAR-DVB-PDMS. This observation indicated that, though dDL is
within the detectable limits of CAR/PDMS, dDL is not detectable under the GC
conditions set in the method, because of its chain length and polarity (Figure 2).
For quantitative analysis, it is not necessary for the analytes to reach equilibrium,
as long as the extractions are carefully timed and the mixing conditions and volumes
remain constant (Ai 1997). An extraction time of 10 min was selected to keep the total
extraction time comparable with the chromatographic run time. The equilibrium
conditions for the selected flavor compounds reached after about 20 min, and the slope of
the curve is small. Therefore, a 1-min deviation in the exposure of the fiber results in
about the same absolute error independent of the extraction time (Pawliszyn 1997). The
PDMS/DVB fiber was chosen over the CAR/PDMS fiber, because of higher recovery of
diacetyl, ethyl lactate, 2-methylbutyraldehyde, and δ-decalactone and decreased
extraction time.
Analytical Characteristics
To check the performance of the procedure, SPME was applied to the analysis of
sodium phosphate buffer solutions containing known concentrations of flavor compounds
using the PDMS/DVB fiber. The linearity of the method was investigated by determining
calibration plots over the concentration range 5-20 µg/mL. Series of three concentrations
were obtained by spiking sodium phosphate buffer with the flavor compounds to generate
calibration plots. Each solution was extracted with the PDMS/DVB fiber, in replicates of
two, and analysis was performed by GC-FID. The line of best fit for the relationship
95
between the mean peak area and the concentration of analyte in the buffer was
determined by linear regression. The procedure revealed linear behavior over the whole
concentration range tested with correlation coefficients RP
2P > 0.954 for selected flavor
compounds (Figure 3). The calculated KI for diacetyl, 2-methylbutyraldehyde, ethyl
lactate, and δ-decalactone are presented in Table 1.
CONCLUSIONS
The SPME adsorption-GC detection method developed is a convenient
quantitative analytical technique for diacetyl, ethyl lactate, 2-methylbutyraldehyde, and
δ-decalactone in a model buffer solution. The small amount of time and materials
required for SPME concentration and extraction, and GC separation and detection
resulted in an inexpensive and simple method for analysis. The combination of extraction
and concentration into one SPME adsorption step significantly decreased the time
required for analysis. SPME adsorption-GC detection method described required 1.7 h
for both extraction and detection of selected flavor compounds. The selectivity of the
SPME method versus more common methods such as liquid-liquid extraction, excludes
necessary clean-up procedures which may introduce errors and extend the time necessary
for an efficient and sensitive analytical method.
(Diaz and others 2004)
96
REFERENCES
Ai J. 1997. Solid phase microextraction for quantitative analysis in nonequilibrium
situations. Anal. Chem. 69: 1230-1236.
Apps P, Tock MLA. 2005. Enhanced flavor extraction in continuous liquid-liquid
extractors. J. Chrom. A 1083: 215-218.
Badings HT, Neeter R. 1980. Recent advances in the study of aroma compounds of milk
and dairy products. Neth. Milk Dairy J. 34(1): 9-30.
Blythe JW, Heitz A, Joll CA, Kagi RI. 2006. Determination of trace concentrations of
bromophenols in water using purge-and-trap in situ acetylation. J. Chrom. A 1102: 73-83.
Borse BB, Rao LJM, Ramalakshmi K, Raghavan B. 2006. Chemical composition of
volatiles from coconut sap (neera) and effect of processing. Food Chem. In Press.
Braithwaite A, Smith FJ. 1999. Chromatographic methods. Dordrecht: Kluwer Academic
Publishers. 559p.
Cai J, Liu B, Su Q. 2001. Comparison of simultaneous distillation extraction and solid-
phase microextraction for the determination of volatile flavor components. J. Chrom. A
930: 1-7.
Cullere L, Aznar M, Cacho J, Ferreira V. 2003. Fast fractionation of complex organic
extracts by normal-phase chromatography on a solid-phase extraction polymeric sorbent
optimization of a method of fractionate wine flavor extracts. J. Chrom. A 1017: 17-26.
Diaz A, Ventura F, Galceran MT. 2004. Identification of 2,3-butanedione (diacetyl) as
the compound causing odor events at trace levels in the Llobregat River and Barcelon's
treated water (Spain). J. Chrom. A 1034: 175-182.
Ford G, Ellis EM. 2002. Characterization of Ypr1p from Saccharomyces cerevisiae as a
2-methylbutyraldehyde reductase. Yeast 19: 1087-1096.
French RH. 2000. Origins and applications of London dispersion forces and Hamaker
constants in ceramics. J. Am. Ceram. Soc. 83: 2117-2146.
Hayasaka Y, Bartowsky EJ. 1999. Analysis of diacetyl in wine using solid-phase
microextraction combined with gas chromatography-mass spectrometry. J. Agric. Food.
Chem. 47: 612-617.
Milo C, Reineccius GA. 1997. Identification and quantification of potential odorants in
regular-fat and low-fat mild cheddar cheeses. J. Agric. Food Chem. 45(9): 3590-3594.
97
Pawliszyn J. 1997. Solid phase microextraction: theory and practice. New York: Wiley-
VCH, Inc. 247p.
Pawliszyn J. 1999. Applications of solid phase microextraction. Cambridge: The Royal
Society of Chemistry. 655.
Pawliszyn J. 2001. Solid phase microextraction. In: Rouseff R and Cadwallader K.
Headspace analysis of foods and flavors. New York: Kluwer Academic/Plenum
Publishers. p 73-87.
Peppard TL, Ramus SA. 1988. Use of Kovats' gas chromatographic retention indices in
beer flavor studies. J. ASBC 46: 26-30.
Rhlid RB, Fleury Y, Blank I, Fay LB, Welti DH, Vera FA, Juillerat MA. 2002.
Generation of roasted notes based on 2-acetyl-2-thiazoline and its precursor, 2-(1-
hydroxyethyl)-4,5-dihydrothiazole, by combined bio and thermal approaches. J. Agric.
Food Chem. 50(8): 2350-2355.
Saraulio A, Martos PA, Pawliszyn J. 1997. Water analysis by solid phase microextraction
based on physical chemical properties of the coating. Anal. Chem. 69: 1992-1998.
Tamura H, Appel M, Richling E, Schreier P. 2005. Authenticity assessment of γ- and δ-
decalactone from Prunus fruits by gas chromatography combustion/pyrolysis isotope
ratio mass spectrometry (GC-C/P-IRMS). J. Agric. Food Chem. 53: 5397-5401.
Urbach G. 1995. Contribution of lactic acid bacteria to flavour compound formation in
dairy products. Int. Dairy J. 5: 877-903.
98
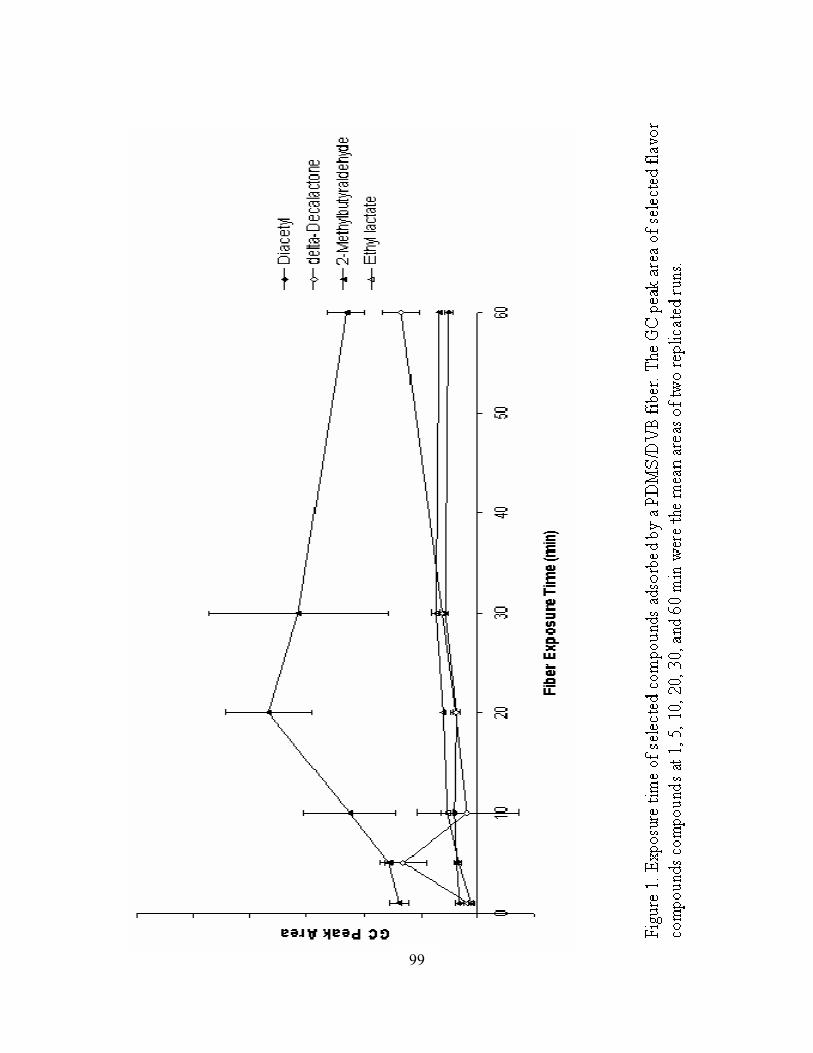
99
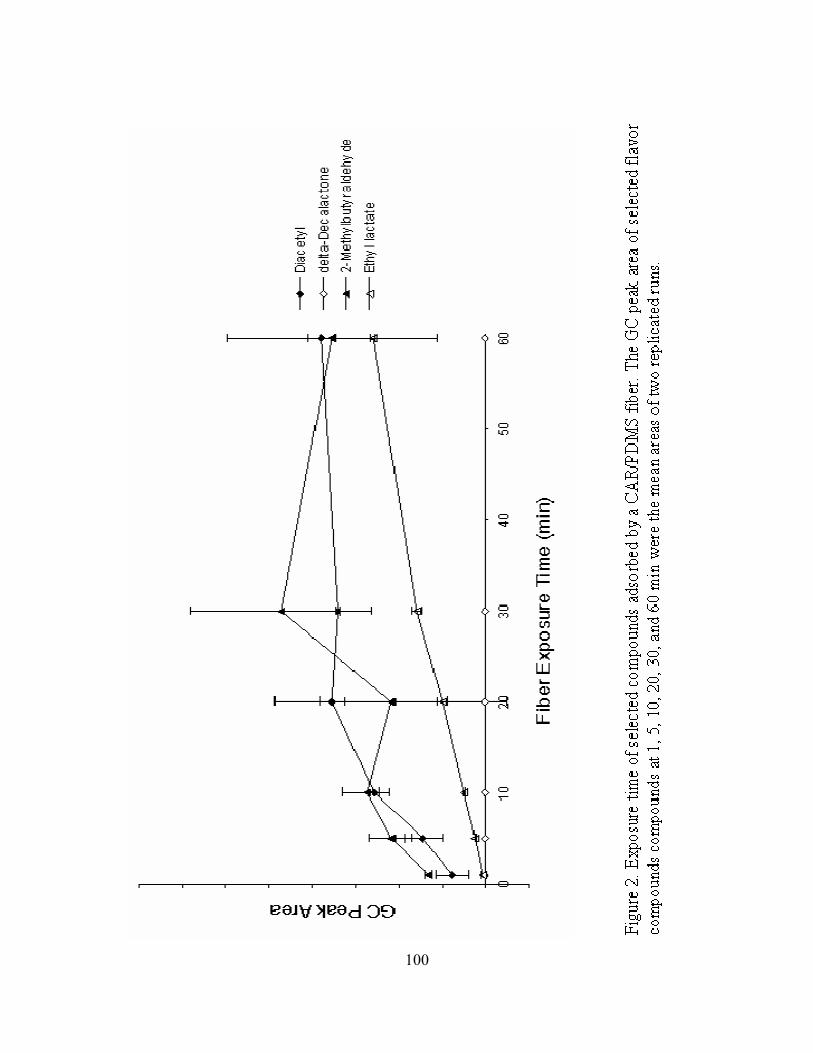
100
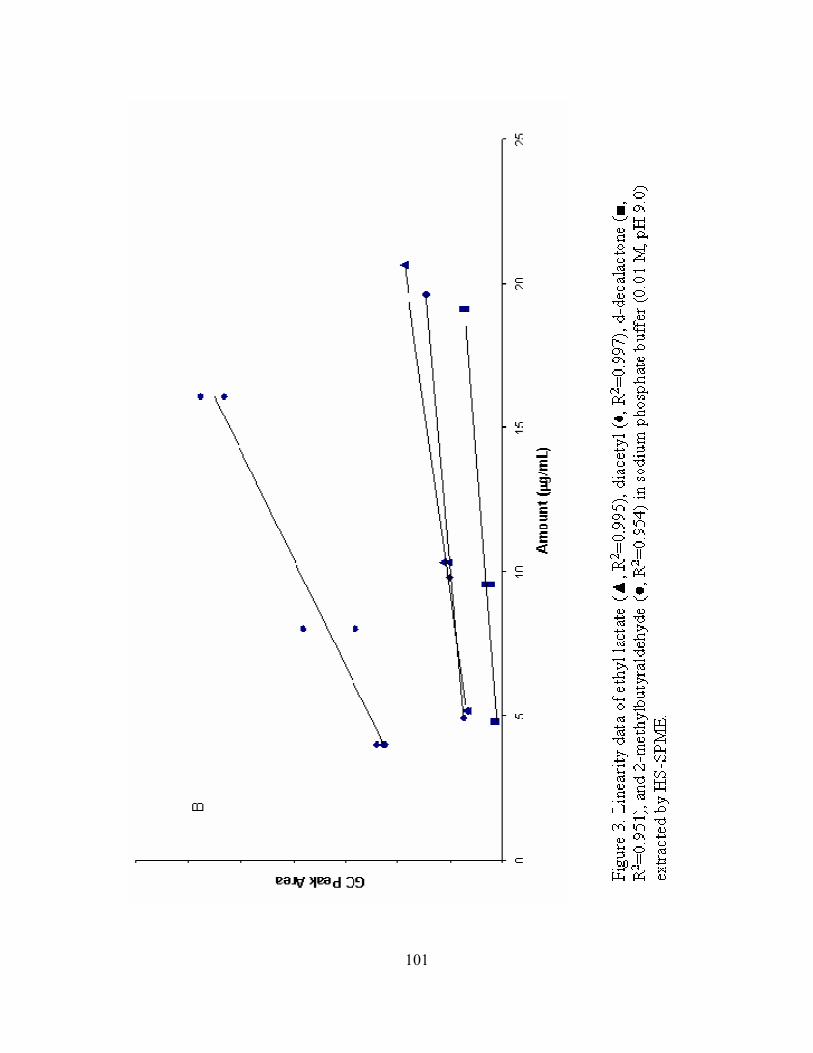
101
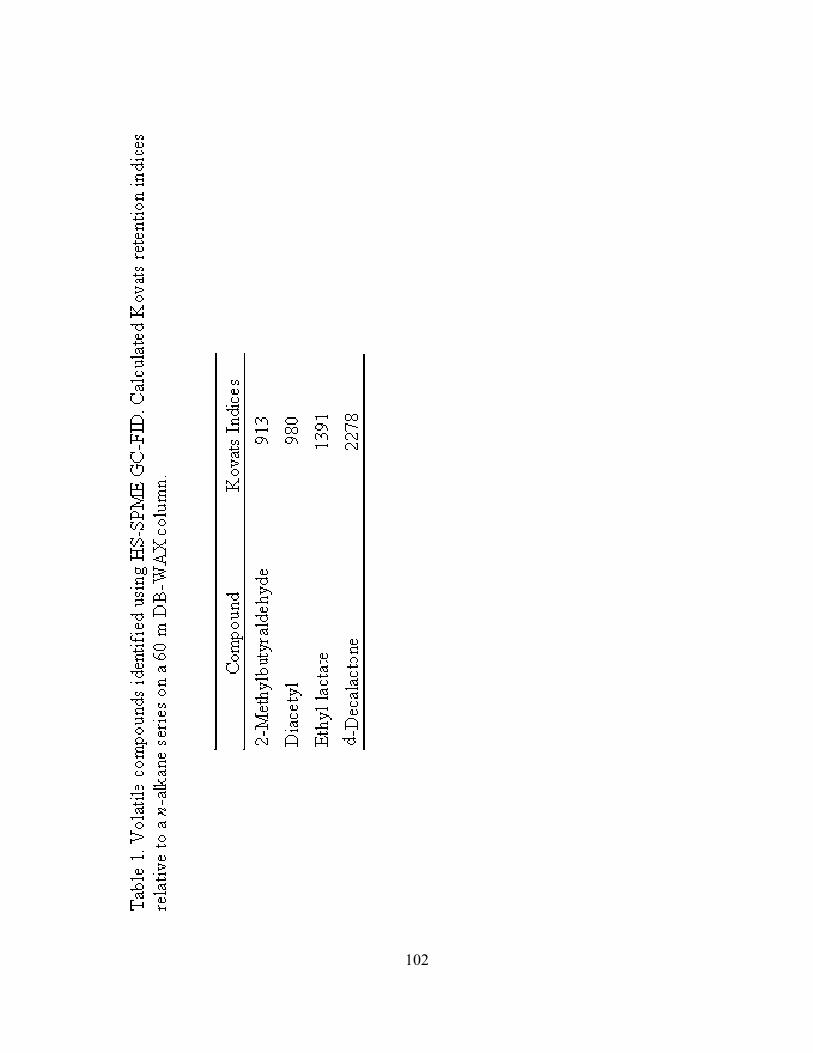
102
CHAPTER FOUR
Application of solid-phase microextraction with headspace gas chromatography to
the analysis of diacetyl, 2-methylbutyraldehyde, ethyl lactate, and
δ-decalactone in ultra high pressure-treated
β-lactoglobulin solutions
Tinyee HoangP
1P, Joseph R. Powers P
1P, John K. Fellman P
2P, and Barry Swanson P
1P
(1) Dept. of Food Science & Human Nutrition, (2) Dept. of Horticulture & Landscape
Architecture, and (3) Dept. of Chemistry Washington State Univ., PO Box 646376,
Pullman, WA 99164-6376
103
ABSTRACT
The effects of ultra high pressure (UHP) treatment on the flavor-binding
properties of β-lactoglobulin (BLG) were determined with selected flavor compounds
diacetyl, ethyl lactate, 2-methylbutyraldehyde, and δ-decalactone. Following UHP
treatment (600 MPa, for 0, 8, 32 min) of BLG, intrinsic tryptophan fluorescence
quenching, static headspace solid-phase microextraction (HS-SPME) and GC analysis
were used to study the flavor binding properties of BLG. Fluorescence quenching data
indicated an increase in the fractional number of binding sites of BLG for diacetyl, δ-
decalactone, and ethyl lactate with high dissociation constant values. As observed by HS-
SPME GC, native BLG retained approximately 50% of the concentration of the selected
flavor compounds added to BLG solutions. UHP treatments of BLG resulted in
significant increases (p < 0.005) in the flavor retention of the selected flavor compounds,
with the greatest retention for diacetyl following UHP of 32 min.
104
INTRODUCTION
Volatile constituents in food are contributing factors to flavor, exhibited by the
observation that elimination of our sense of smell (e.g. by a common cold), results in
many foods tasting bland. The food industry is aware of the importance of flavor as an
essential factor in food selection and acceptance. Flavor is one of the most important
attributes of a food, driving consumer acceptance.
In the process of perception, food is first assessed by appearance, and then
followed by aroma, consistency and texture, and flavor evaluation, yet these attributes
tend to overlap (Meilgaard and others 1999). Aroma is the odor perceived by the
olfactory system when volatiles enter the nasal passage, either orthonasally or
retronasally. A sufficient concentration of a flavor compound in the vapor phase (nasal)
or aqueous phase (saliva) must be achieved to elicit olfactory and taste receptor
responses. The quantity of volatiles released from a food is dependent upon the
temperature and chemical properties of the flavor compounds. Flavor is defined as the
sum of perceptions resulting from stimulation of the sensory receptors grouped together
at the entrance of the alimentary and respiratory tracts (Meilgaard and others 1999),
otherwise perceived in the mouth.
Food is a complex system in which equilibrium of flavors between the aqueous,
gaseous, and solid phases is rarely reached during preparation or eating, but physical
chemistry provides tools useful for understanding and predicting flavor behavior.
Equilibrium partitioning theory can explain the interaction of flavor compounds in the
gas phase and aqueous phase or their combinations. The partition coefficient (K) of flavor
compounds between the gas phase and the aqueous phase in a closed system is described
105
by gs
CCK = , where C BsB is the concentration of the flavor compound in the aqueous
phase and CBgB is the concentration of the flavor compound in the gas phase. The partition
coefficients represent the quantity of flavor compounds in the gas phase and are useful in
the quantitative determination of the availability of flavor compounds to be detected by
sensory receptors.
Flavor perception in foods, which is an important determinant of food acceptance,
is influenced by flavor binding and release between flavor compounds and a variety of
food components, such as protein, carbohydrates, and lipids. Proteins in foods often
decrease the volatility of flavor compounds. Proteins interact with volatile flavor
compounds, both reversibly and irreversibly, with a decrease in flavor perception for the
latter (Fabre and others 2002). In general, proteins retain volatile compounds by
reversible hydrophobic adsorption or absorption, resulting in chemical affinities of
various strengths. BLG is one of the best known and most studied of proteins. The whey
protein is extensively characterized, exhibits good emulsification, and can interact with
many flavor compounds such as aldehydes and ketones (van Ruth and Villeneuve 2002),
ionones (Jung and Ebeler 2003), and hydrocarbons (Wishnia and Pinder 1966).
Analytical techniques, including exclusion chromatography, equilibrium dialysis,
static headspace, fluorometry, affinity chromatography, as well as sensory evaluation, are
used to detect the binding of proteins to flavor compounds (Damodaran and Kinsella
1980; Steffen and Pawliszyn 1996; Pelletier and others 1998; Guichard and Langourieux
2000; Fabre and others 2002; Apps and Tock 2005). Fluorescence methods are important
tools to investigate the structure, function and reactivity of proteins and other biological
molecules. Fluorescence quenching is defined as a process which decreases the
106
fluorescence intensity of a given substance (Lakowicz 1983), and is widely used to study
the accessibility and localization of intrinsic fluorophores of proteins and the
permeability of membranes to quenchers (Lakowicz 1983). Busti and others (2002) have
used external quenching of intrinsic protein fluorescence by acrylamide to monitor BLG
denaturation, and reported that BLG denatures with the dissociation of dimers preceding
the unfolding of monomers at both pH 6.8 and pH 2.5. Equilibrium headspace analysis of
volatile components in the headspace equilibrated over a food using solid-phase
microextraction (SPME) gives the association or binding of flavor to food constituents
(Damodaran and Kinsella 1980; Guichard and Langourieux 2000). However, collection
of headspace volatile flavors compounds using a syringe is not sensitive enough to detect
small concentrations resulting in irreproducible chromatography (Rouseff and
Cadwallader 2001).
Studies have been done to understand the effects of thermal denaturation on
binding of flavors to whey proteins (Burova and others 2003; Patel and others 2006).
Damodaran and Kinsella (1980) reported that the affinity of ketones for bovine serum
albumin increased with chain length, the binding is hydrophobic in nature, and the
thermodynamic driving force for binding is entropic. Whey protein was found to have
higher affinity to vanillin than soy or casein proteins, and binding was enthalpy driven
(Li and others 2000). There are many research studies that try to understand the structural
changes BLG undergoes during ultra high pressure treatment (UHP). Increases in the
surface hydrophobicity (Knudsen and others 2004) and aggregation (Futenberger and
others 1995) of BLG were observed when BLG was treated with UHP between 200 and
400 MPa. Yang and others (2001) reported that the native ordered state of BLG contains
107
an intrinsic pocket that binds 1-anilinonaphthalene-8-sulfonate (ANS). An increase in the
extrinsic fluorescence of ANS after high pressure treatment (600 MPa, 50C) of BLG
follows the transition from the ordered to molten globular state. Also, a decrease in near-
UV circular dichroism intensity from aromatic side chains occurs during the transition of
BLG from native to molten globule states (Dolgikh and others 1981). At pH 2.0,
pressure-induced denaturation of BLG is reversible (Ikeuchi and others 2001). Proteins in
the molten globule state usually retain the secondary structure of the native state and
exhibit a compact tertiary structure, but exhibit increased mobility and looser packing of
the protein chain (Ptitsyn 1995). Kolakowski and others (2001) reported that using low
pressure (300 MPa) and low temperature (4 °C) minimizes the loss of native structure,
decreases undesirable aggregation, and enhances the exposure of the hydrophobic regions
of BLG to the solvent. Limited research has been done on the effects of ultra high
pressure (UHP) treatment of BLG on binding of flavor compounds with the purpose of
enhancing food flavors and perception of reduced-fat foods. Liu and others (2005)
studied the effects of UHP on the flavor-binding properties of whey protein concentrate
(WPC), and reported that there is not one pressure treatment for WPC that increases the
number of binding sites or apparent dissociation constant of any flavor compound. A
pressure treatment of 600 MPa for 0, 10, or 30 min holding time on WPC increased the
number of binding sites and apparent dissociation constant for benzaldehyde, but only a
0-min hold time was required to increase the number of binding sites and apparent
dissociation constant for heptanone and octanone (Liu and others 2005). Currently there
is no research that focuses on pre-incubating a mixture of flavor compounds and proteins,
108

subjecting the mixture to UHP treatment, and then analyzing the mixture through
extraction and detection procedures.
The objectives of this study were to investigate the binding properties of selected
flavor compounds with UHP-treated β-lactoglobulin. Intrinsic fluorescence quenching of
tryptophan and headspace SPME-GC analysis were employed in the present research.
MATERIALS & METHODS
Materials
β-Lactoglobulin (BLG) (90% pure) was purchased from Sigma Chemical Co. (St.
Louis, MO, no. L-0130). BLG with the same lot number was used throughout the
experiments.
Pre-Incubation
δ-Decalactone, diacetyl, ethyl lactate and 2-methylbutyraldehyde were flavor
compounds selected to bind with BLG. These flavor compounds were selected because
they are associated with fat-rich foods, such as dairy products (Badings and Neeter 1980;
Milo and Reineccius 1997), chocolate, or cream-based foods , and also for their
characteristic physical properties. Each flavor compound (in 10% aqueous ethanol) was
added to BLG solutions to reach final concentrations of 1-200 ppm and held at 4 °C prior
to UHP treatment.
Ultra High Pressure Treatment
BLG solutions, at a concentration of 0.35 mg/mL in sodium phosphate buffer
(0.01 M, pH 7), that contained selected flavor compounds were treated with UHP of 600
MPa for holding times of 0 (come-up time), 8, or 32 min in the presence of ice to reduce
effects of temperature. Temperature was measured before and after UHP treatment was
109
5°C and 8°C, respectively. The come-up time (5.45 min) was the compression time
required to reach a pressure of 600 MPa. After exposure to UHP, BLG solutions were
studied immediately or stored at 4 °C for fewer than 10 days, otherwise the protein
precipitated.
Flavor Compound Fluorescence Binding Assay
Stern-Volmer analysis
Flavor binding experiments were performed in 0.01 M sodium phosphate buffer
(pH 7.0, adjusted with 0.01 N HCl or NaOH) with selected flavor concentrations.
Intrinsic tryptophan fluorescence was assayed using an excitation wavelength of 287 nm
and emission at a wavelength of 332 nm. The quantitative binding of ligands was
determined from the decrease of the protein tryptophan fluorescence at 332 nm (Dufour
and Haertle 1991). Since the flavor-BLG complex is responsible for the fluorescence
quenching of tryptophan in BLG, we assume that static quenching is responsible for the
decrease of BLG fluorescence upon addition of flavor compounds. Stern-Volmer analysis
for static quenching predicts that the ratio F B0B/F between the fluorescence of BLG in the
absence of selected flavor compounds (F B0B) and the fluorescence of BLG in the presence
of selected flavor compounds (F) is, for small amounts of flavor compounds, a linear
function of the concentration of the flavor compound (Q) (Tian and others 2006).
[ ] 10
+= QKF
FSV
(1)
The slope obtained from the linear regression provides the static quenching constant, a
relevant binding parameter.
110
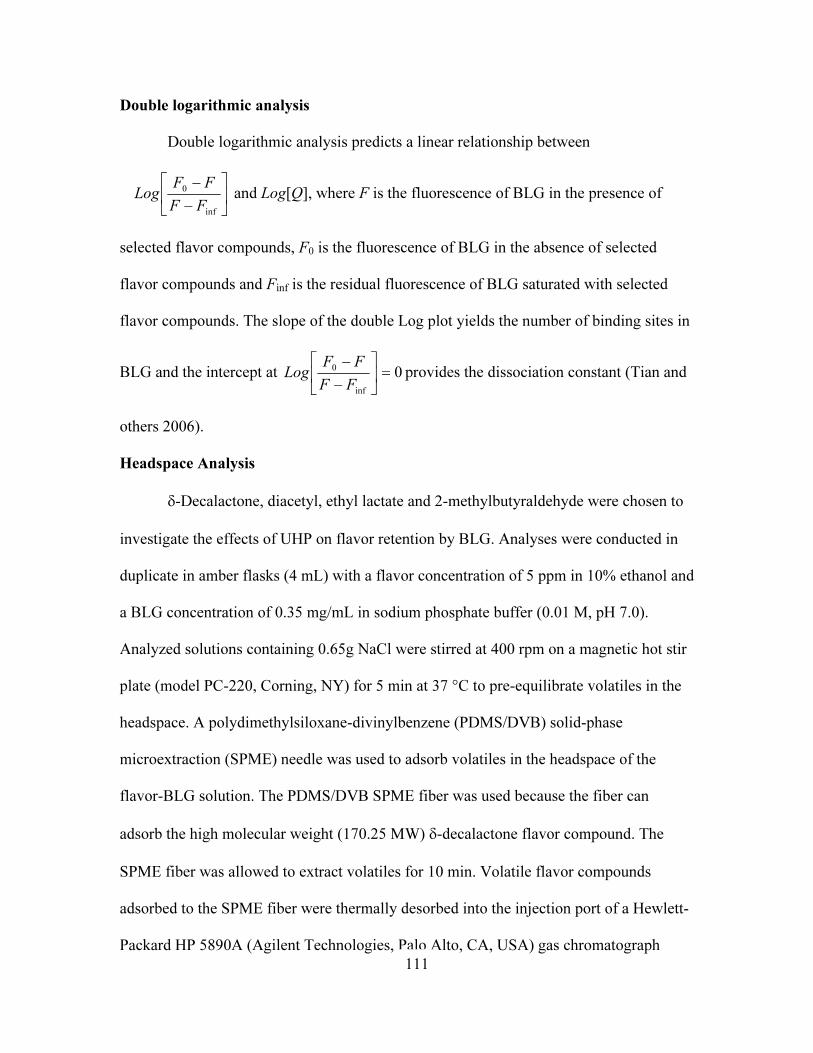
Double logarithmic analysis
Double logarithmic analysis predicts a linear relationship between
⎥⎦
⎤⎢⎣
⎡
−
−
inf
0
FF
FFLog and Log[Q], where F is the fluorescence of BLG in the presence of
selected flavor compounds, F B0B is the fluorescence of BLG in the absence of selected
flavor compounds and F BinfB is the residual fluorescence of BLG saturated with selected
flavor compounds. The slope of the double Log plot yields the number of binding sites in
BLG and the intercept at 0
inf
0 =⎥⎦
⎤⎢⎣
⎡
−
−
FF
FFLog provides the dissociation constant (Tian and
others 2006).
Headspace Analysis
δ-Decalactone, diacetyl, ethyl lactate and 2-methylbutyraldehyde were chosen to
investigate the effects of UHP on flavor retention by BLG. Analyses were conducted in
duplicate in amber flasks (4 mL) with a flavor concentration of 5 ppm in 10% ethanol and
a BLG concentration of 0.35 mg/mL in sodium phosphate buffer (0.01 M, pH 7.0).
Analyzed solutions containing 0.65g NaCl were stirred at 400 rpm on a magnetic hot stir
plate (model PC-220, Corning, NY) for 5 min at 37 °C to pre-equilibrate volatiles in the
headspace. A polydimethylsiloxane-divinylbenzene (PDMS/DVB) solid-phase
microextraction (SPME) needle was used to adsorb volatiles in the headspace of the
flavor-BLG solution. The PDMS/DVB SPME fiber was used because the fiber can
adsorb the high molecular weight (170.25 MW) δ-decalactone flavor compound. The
SPME fiber was allowed to extract volatiles for 10 min. Volatile flavor compounds
adsorbed to the SPME fiber were thermally desorbed into the injection port of a Hewlett-
Packard HP 5890A (Agilent Technologies, Palo Alto, CA, USA) gas chromatograph
111
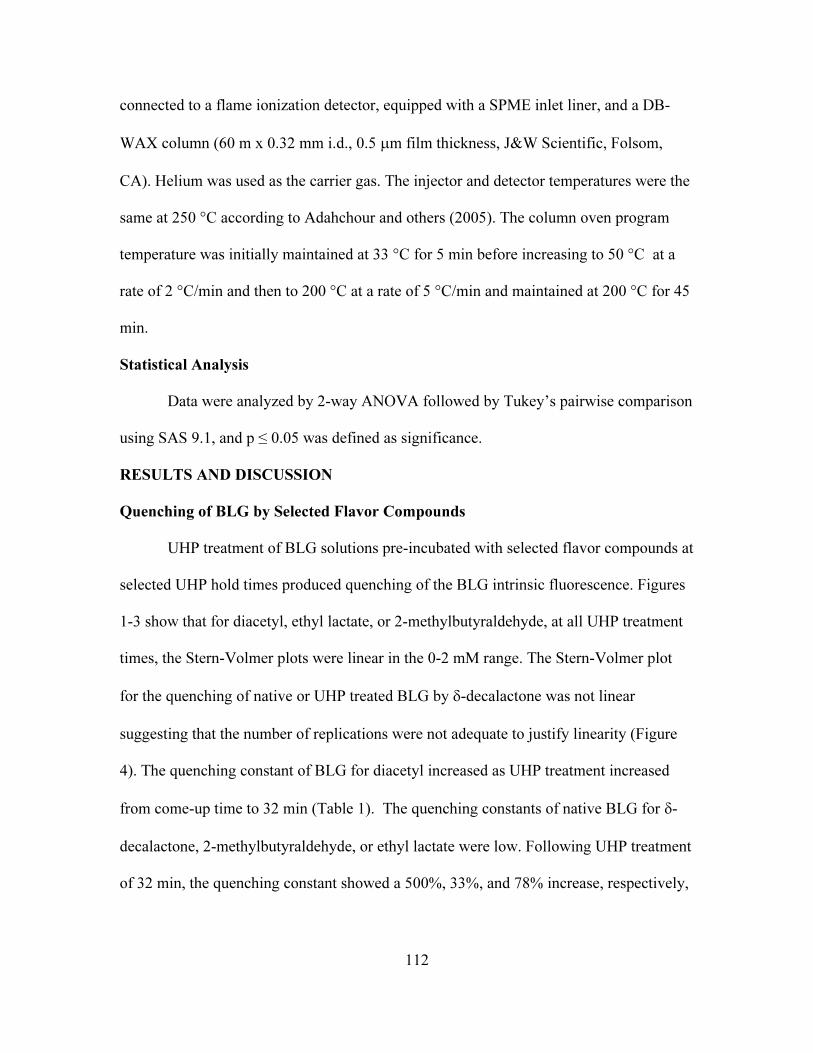
connected to a flame ionization detector, equipped with a SPME inlet liner, and a DB-
WAX column (60 m x 0.32 mm i.d., 0.5 µm film thickness, J&W Scientific, Folsom,
CA). Helium was used as the carrier gas. The injector and detector temperatures were the
same at 250 °C according to Adahchour and others (2005). The column oven program
temperature was initially maintained at 33 °C for 5 min before increasing to 50 °C at a
rate of 2 °C/min and then to 200 °C at a rate of 5 °C/min and maintained at 200 °C for 45
min.
Statistical Analysis
Data were analyzed by 2-way ANOVA followed by Tukey’s pairwise comparison
using SAS 9.1, and p ≤ 0.05 was defined as significance.
RESULTS AND DISCUSSION
Quenching of BLG by Selected Flavor Compounds
UHP treatment of BLG solutions pre-incubated with selected flavor compounds at
selected UHP hold times produced quenching of the BLG intrinsic fluorescence. Figures
1-3 show that for diacetyl, ethyl lactate, or 2-methylbutyraldehyde, at all UHP treatment
times, the Stern-Volmer plots were linear in the 0-2 mM range. The Stern-Volmer plot
for the quenching of native or UHP treated BLG by δ-decalactone was not linear
suggesting that the number of replications were not adequate to justify linearity (Figure
4). The quenching constant of BLG for diacetyl increased as UHP treatment increased
from come-up time to 32 min (Table 1). The quenching constants of native BLG for δ-
decalactone, 2-methylbutyraldehyde, or ethyl lactate were low. Following UHP treatment
of 32 min, the quenching constant showed a 500%, 33%, and 78% increase, respectively,
112
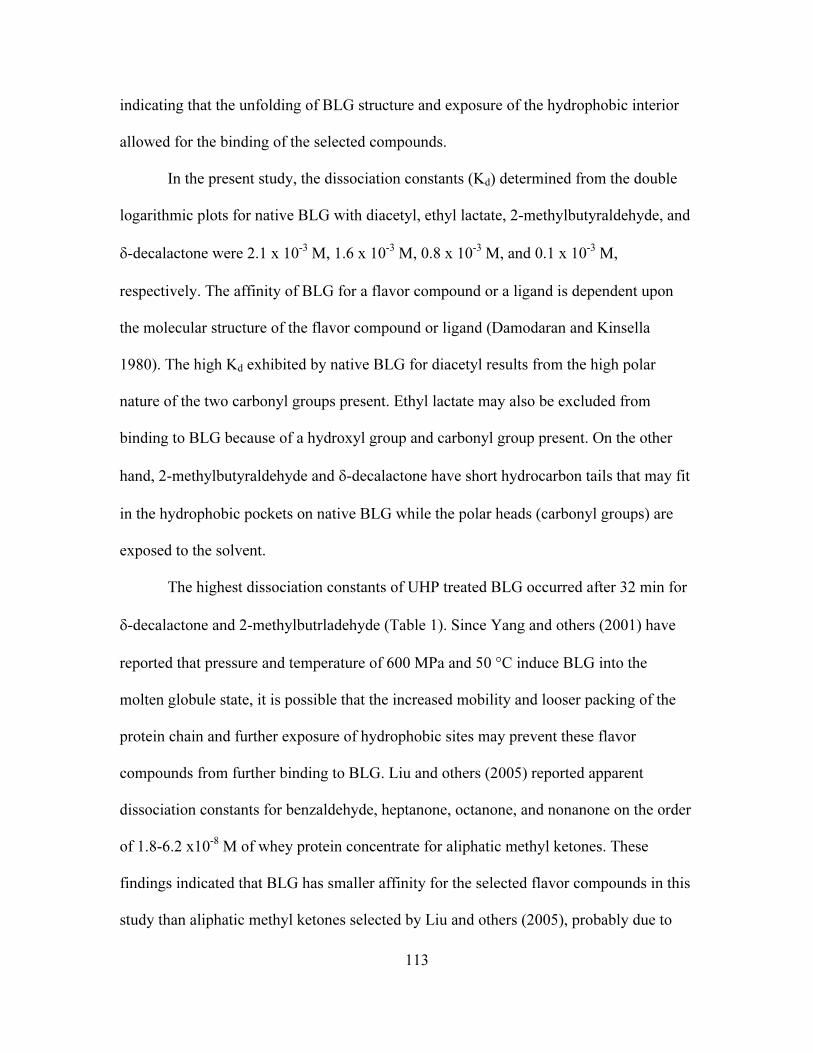
indicating that the unfolding of BLG structure and exposure of the hydrophobic interior
allowed for the binding of the selected compounds.
In the present study, the dissociation constants (K BdB) determined from the double
logarithmic plots for native BLG with diacetyl, ethyl lactate, 2-methylbutyraldehyde, and
δ-decalactone were 2.1 x 10 P
-3P M, 1.6 x 10 P
-3P M, 0.8 x 10 P
-3P M, and 0.1 x 10 P
-3P M,
respectively. The affinity of BLG for a flavor compound or a ligand is dependent upon
the molecular structure of the flavor compound or ligand (Damodaran and Kinsella
1980). The high K BdB exhibited by native BLG for diacetyl results from the high polar
nature of the two carbonyl groups present. Ethyl lactate may also be excluded from
binding to BLG because of a hydroxyl group and carbonyl group present. On the other
hand, 2-methylbutyraldehyde and δ-decalactone have short hydrocarbon tails that may fit
in the hydrophobic pockets on native BLG while the polar heads (carbonyl groups) are
exposed to the solvent.
The highest dissociation constants of UHP treated BLG occurred after 32 min for
δ-decalactone and 2-methylbutrladehyde (Table 1). Since Yang and others (2001) have
reported that pressure and temperature of 600 MPa and 50 °C induce BLG into the
molten globule state, it is possible that the increased mobility and looser packing of the
protein chain and further exposure of hydrophobic sites may prevent these flavor
compounds from further binding to BLG. Liu and others (2005) reported apparent
dissociation constants for benzaldehyde, heptanone, octanone, and nonanone on the order
of 1.8-6.2 x10 P
-8P M of whey protein concentrate for aliphatic methyl ketones. These
findings indicated that BLG has smaller affinity for the selected flavor compounds in this
study than aliphatic methyl ketones selected by Liu and others (2005), probably due to
113
the hydrophobic binding sites on interior of the proteins favoring nonpolar flavor
compounds. However, small K BdB values were observed after UHP come-up time for
diacetyl and ethyl lactate, 1.2 and 0.9 x 10 P
-3P M, respectively, suggesting that a short UHP
treatment may improve the retention of certain flavor compounds.
The fractional number of binding sites determined by the slope of the double log
plot shows an increase in binding sites of BLG after UHP come-up time for diacetyl, δ-
decalactone, and ethyl lactate. A decrease in the fractional number of binding sites of
native BLG following UHP was observed with 2-methylbutyraldehyde (Table 1). The
fractional number of binding sites did not increase with increasing pressure treatment
indicating that ultra high pressure does not improve binding.
Headspace Analysis
The effect of UHP on the retention of flavor by BLG was studied by HS-SPME
GC analysis. Static headspace analysis determines the quantity of volatiles contained in
the gas phase above a sample, usually in a sealed system at equilibrium. The composition
of the headspace depends on the partitioning of volatiles between the gas phase and
aqueous phase. The headspace composition may be influenced by many other factors,
such as temperature, the addition of salts, headspace volume, and vial shape (Pawliszyn
1997).
The quantity of flavor compounds detected in the headspace significantly
decreased (p < 0.05) in the presence of UHP treated BLG compared to the quantity of 2-
methylbuyraldehyde (Figure 5), δ-decalactone (Figure 6), diacetyl (Figure 7), and ethyl
lactate (Figure 8) in the presence of native BLG, resulting from hydrophobic and polar
interactions between the flavor compounds and BLG (Guichard 2006). The retention of
114
the selected flavor compounds by native BLG in decreasing order is: δ-decalactone >
ethyl lactate > diacetyl > 2-methylbutyraldehyde. The retention of the selected flavor
compounds after UHP-treatment of BLG in decreasing order is: diacetyl > ethyl lactate >
δ-decalactone > 2-methylbutyraldehyde. The percentage of retention of 2-
methylbutyraldehyde, δ-decalactone, diacetyl, and ethyl lactate were 30.6%, 40.9%,
55.8%, and 56.9%, respectively. These findings demonstrate larger retentions with a pre-
incubation step than previously reported when selected flavor compounds were added to
BLG already treated with UHP (Yang and others 2002; Liu and others 2005). The
increase in BLG retention of selected flavor compounds was attributed to the pre-
incubation period of flavor compounds with BLG prior to UHP treatment. Significant
increases of 88-97% in retention were observed with UHP treatment of BLG over native
BLG with diacetyl, ethyl lactate and 2-methylbutyraldehyde. Small, yet significant (p ≤
0.05), increases in retention (56-65%) were observed for δ-decalactone, consistent with
previously reported results for the retention of ketones in BLG solutions (Jouenne and
Crouzet 2000). Although decreases in headspace concentration of selected flavor
compounds may not be reflected in the results from fluorescence quenching experiments,
flavor compounds may bind to sites on BLG far from tryptophan not detected by the
fluorescence quenching experiments.
CONCLUSIONS
Fluorescence quenching data that were used to generate double logarithmic plots
for the determination of dissociation constants suggested that UHP-treated BLG had low
affinity for the selected flavor compounds. However, HS-SPME GC analysis exhibited a
high degree of retention of BLG following UHP treatment. It may be that the
115
fluorescence quenching technique may not be appropriate in delineating the binding
properties of BLG to flavor compounds.
116
REFERENCES
Adahchour M, Wiewel J, Verdel R, Vreuls RJJ, Brinkman UAT. 2005. Improved
determination of flavour compounds in butter by solid-phase (micro)extraction and
comprehensive two-dimensional gas chromatography. J. Chrom. A 1086: 99-106.
Adahchour M, Wiewel J, Verdel R, Vreuls RJJ, Brinkman UAT. 2005. Improved
determination of flavour compounds in butter by solid-phase (micro)extraction and
comprehensive two-dimensional gas chromatography. J. Chrom. A 1086: 99-106.
Apps P, Tock MLA. 2005. Enhanced flavor extraction in continuous liquid-liquid
extractors. J. Chrom. A 1083: 215-218.
Badings HT, Neeter R. 1980. Recent advances in the study of aroma compounds of milk
and dairy products. Neth. Milk Dairy J. 34(1): 9-30.
Burova TV, Grinberg NV, Grinberg VY, Tolstoguzov VB. 2003. Binding of odorants to
individual proteins and their mixtures. Effects of protein denaturation and association. A
plasticized globule state. Colloids Surfaces. A. Physico. Eng. Aspects 213: 235-244.
Damodaran S, Kinsella JE. 1980. Flavor protein interactions. Binding of carbonyls to
bovine serum albumin: thermodynamic and conformation effects. J. Agric. Food Chem.
28: 567-571.
Dolgikh DA, Gilmanshin RI, Brazhnikov EV, Bychkova VE, Semisotnov SY, Ptitsyn
OB. 1981. α-Lactalbumin: compact state with fluctuating tertiary structure? FEBS Lett.
136: 311-315.
Dufour E, Haertle T. 1991. Binding of retinoids and β-carotene to β-lactoglobulin.
Influence of protein modifications. Biochim. Biophys. Acta 1079: 316-320.
Fabre M, Aubry V, Guichard E. 2002. Comparison of different methods: static and
dynamic headspace and solid-phase microextraction for the measurement of interactons
between milk proteins and flavor compounds with an application to emulsions. J. Agric.
Food Chem. 50: 1497-1501.
Futenberger S, Dumay E, Cheftel JC. 1995. Pressure-induced aggregation of β-
lactoglobulin in pH 7.0 buffers. Lebensm.-Wiss.-Technol. 28: 410-418.
Guichard E. 2006. Flavour retention and release from protein solutions. Biotech. Adv. 24:
226-229.
Guichard E, Langourieux S. 2000. Interactions between β-lactoglobulin and flavor
compounds. Food Chem. 71: 301-308.
117
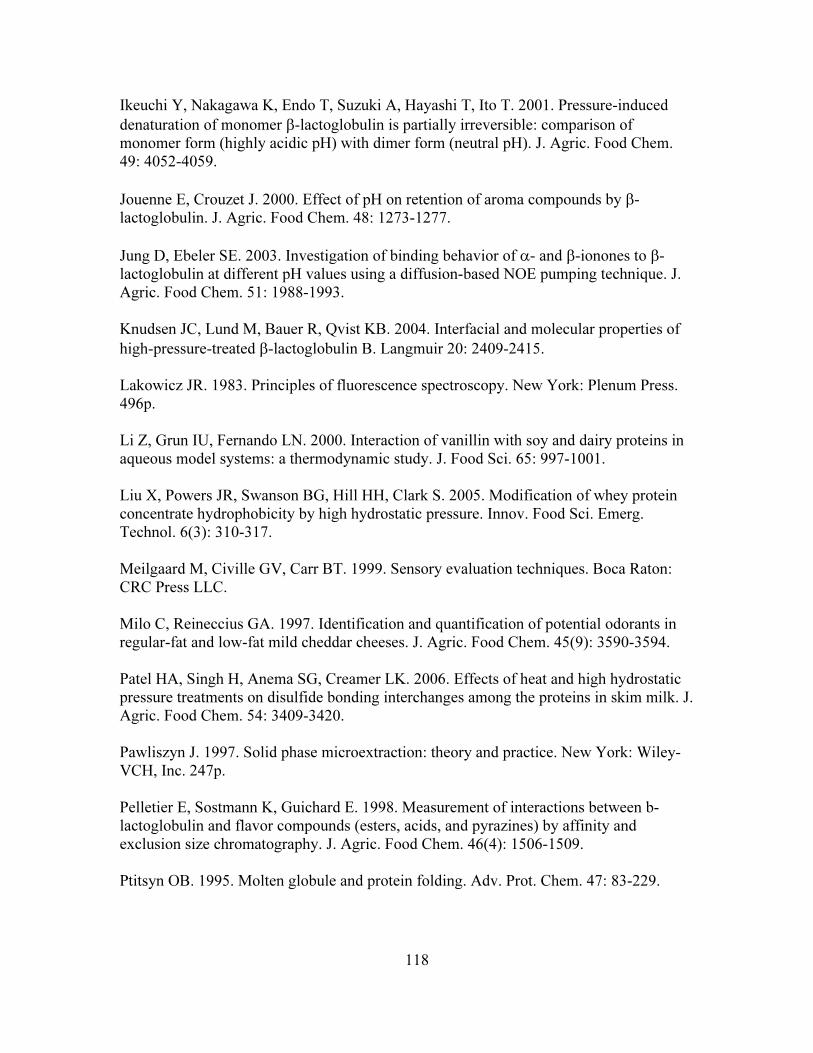
Ikeuchi Y, Nakagawa K, Endo T, Suzuki A, Hayashi T, Ito T. 2001. Pressure-induced
denaturation of monomer β-lactoglobulin is partially irreversible: comparison of
monomer form (highly acidic pH) with dimer form (neutral pH). J. Agric. Food Chem.
49: 4052-4059.
Jouenne E, Crouzet J. 2000. Effect of pH on retention of aroma compounds by β-
lactoglobulin. J. Agric. Food Chem. 48: 1273-1277.
Jung D, Ebeler SE. 2003. Investigation of binding behavior of α- and β-ionones to β-
lactoglobulin at different pH values using a diffusion-based NOE pumping technique. J.
Agric. Food Chem. 51: 1988-1993.
Knudsen JC, Lund M, Bauer R, Qvist KB. 2004. Interfacial and molecular properties of
high-pressure-treated β-lactoglobulin B. Langmuir 20: 2409-2415.
Lakowicz JR. 1983. Principles of fluorescence spectroscopy. New York: Plenum Press.
496p.
Li Z, Grun IU, Fernando LN. 2000. Interaction of vanillin with soy and dairy proteins in
aqueous model systems: a thermodynamic study. J. Food Sci. 65: 997-1001.
Liu X, Powers JR, Swanson BG, Hill HH, Clark S. 2005. Modification of whey protein
concentrate hydrophobicity by high hydrostatic pressure. Innov. Food Sci. Emerg.
Technol. 6(3): 310-317.
Meilgaard M, Civille GV, Carr BT. 1999. Sensory evaluation techniques. Boca Raton:
CRC Press LLC.
Milo C, Reineccius GA. 1997. Identification and quantification of potential odorants in
regular-fat and low-fat mild cheddar cheeses. J. Agric. Food Chem. 45(9): 3590-3594.
Patel HA, Singh H, Anema SG, Creamer LK. 2006. Effects of heat and high hydrostatic
pressure treatments on disulfide bonding interchanges among the proteins in skim milk. J.
Agric. Food Chem. 54: 3409-3420.
Pawliszyn J. 1997. Solid phase microextraction: theory and practice. New York: Wiley-
VCH, Inc. 247p.
Pelletier E, Sostmann K, Guichard E. 1998. Measurement of interactions between b-
lactoglobulin and flavor compounds (esters, acids, and pyrazines) by affinity and
exclusion size chromatography. J. Agric. Food Chem. 46(4): 1506-1509.
Ptitsyn OB. 1995. Molten globule and protein folding. Adv. Prot. Chem. 47: 83-229.
118
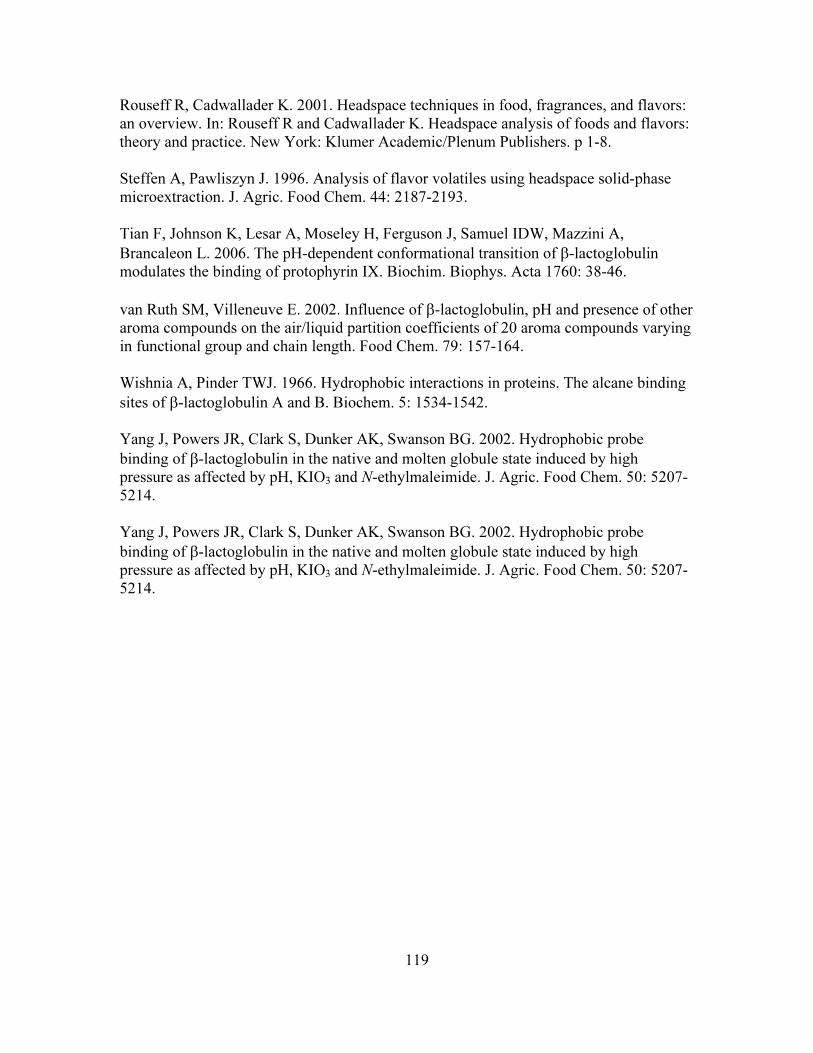
Rouseff R, Cadwallader K. 2001. Headspace techniques in food, fragrances, and flavors:
an overview. In: Rouseff R and Cadwallader K. Headspace analysis of foods and flavors:
theory and practice. New York: Klumer Academic/Plenum Publishers. p 1-8.
Steffen A, Pawliszyn J. 1996. Analysis of flavor volatiles using headspace solid-phase
microextraction. J. Agric. Food Chem. 44: 2187-2193.
Tian F, Johnson K, Lesar A, Moseley H, Ferguson J, Samuel IDW, Mazzini A,
Brancaleon L. 2006. The pH-dependent conformational transition of β-lactoglobulin
modulates the binding of protophyrin IX. Biochim. Biophys. Acta 1760: 38-46.
van Ruth SM, Villeneuve E. 2002. Influence of β-lactoglobulin, pH and presence of other
aroma compounds on the air/liquid partition coefficients of 20 aroma compounds varying
in functional group and chain length. Food Chem. 79: 157-164.
Wishnia A, Pinder TWJ. 1966. Hydrophobic interactions in proteins. The alcane binding
sites of β-lactoglobulin A and B. Biochem. 5: 1534-1542.
Yang J, Powers JR, Clark S, Dunker AK, Swanson BG. 2002. Hydrophobic probe
binding of β-lactoglobulin in the native and molten globule state induced by high
pressure as affected by pH, KIO B3B and N-ethylmaleimide. J. Agric. Food Chem. 50: 5207-
5214.
Yang J, Powers JR, Clark S, Dunker AK, Swanson BG. 2002. Hydrophobic probe
binding of β-lactoglobulin in the native and molten globule state induced by high
pressure as affected by pH, KIO B3B and N-ethylmaleimide. J. Agric. Food Chem. 50: 5207-
5214.
119
120

121
122
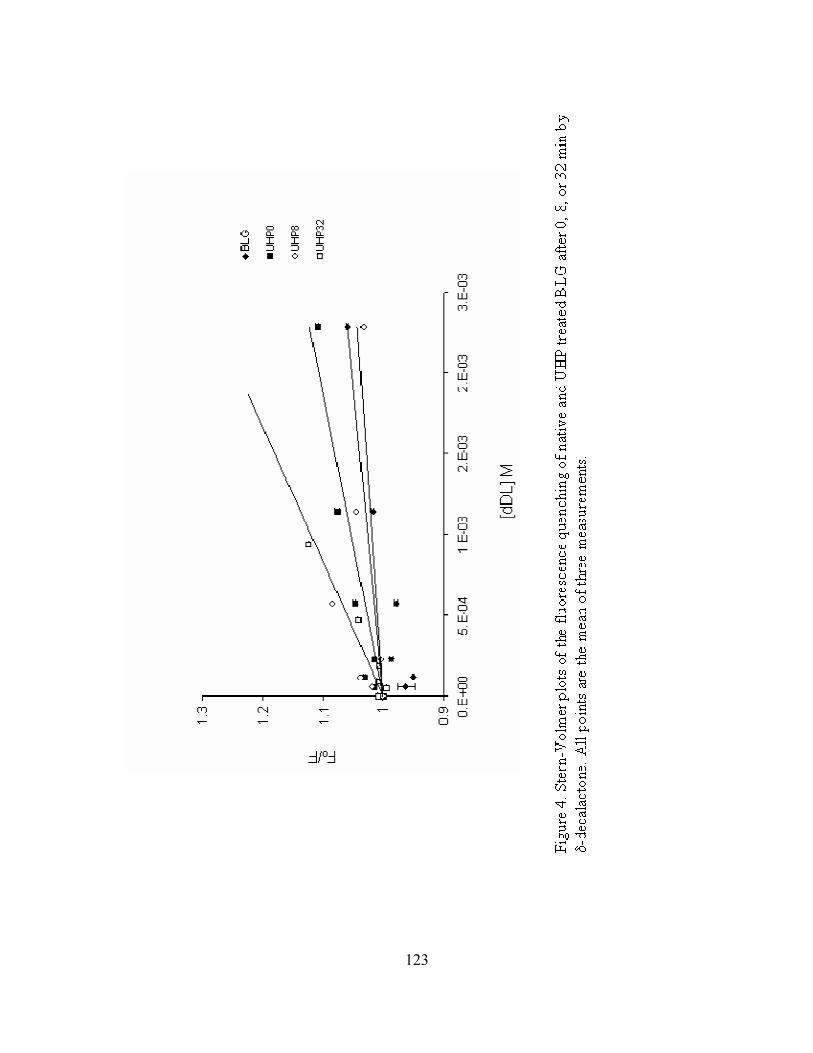
123
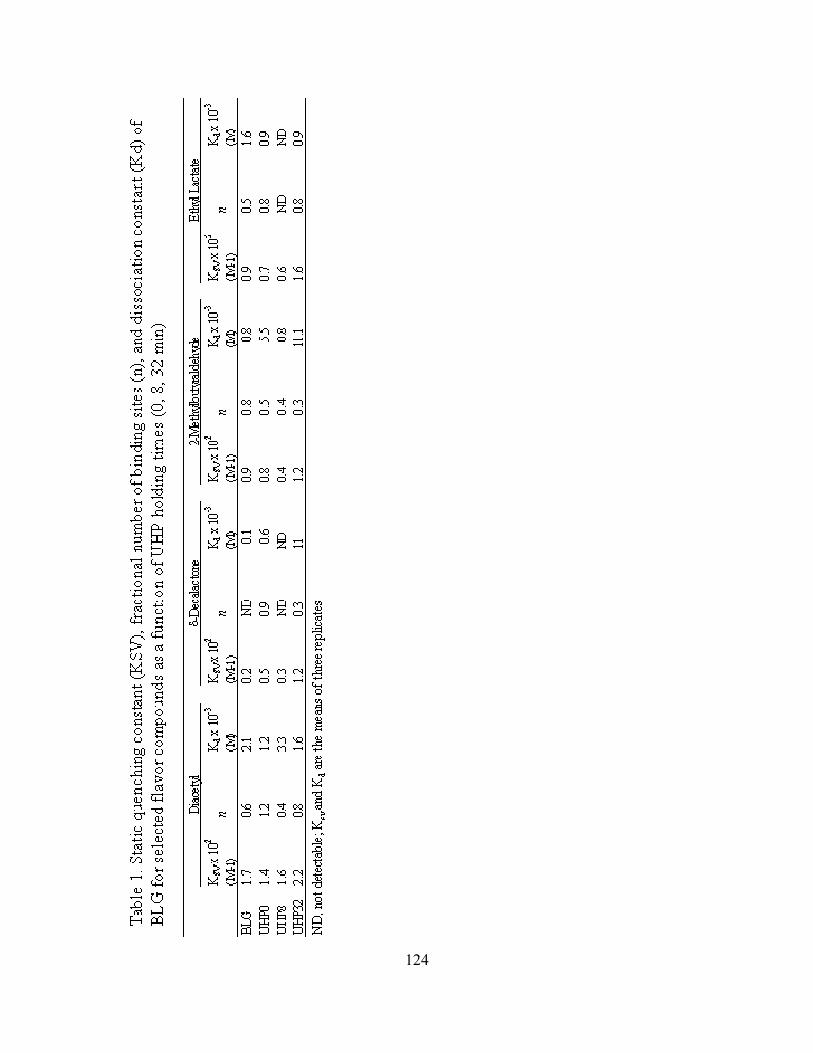
124
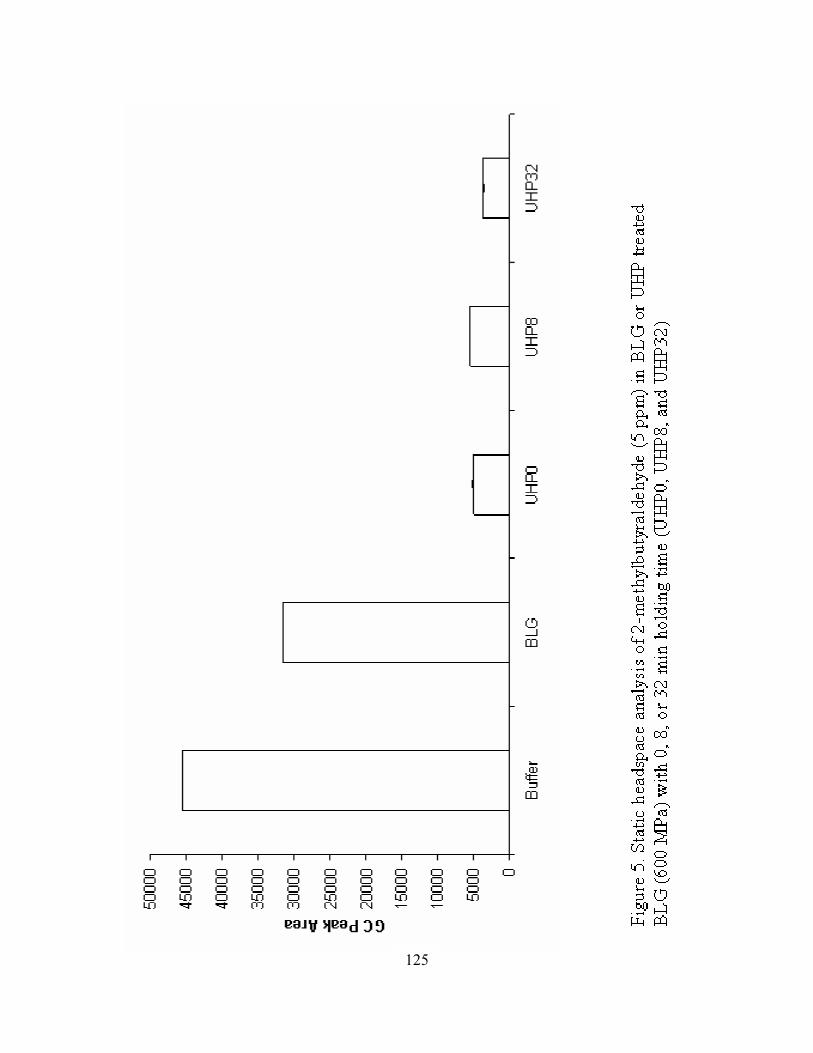
125
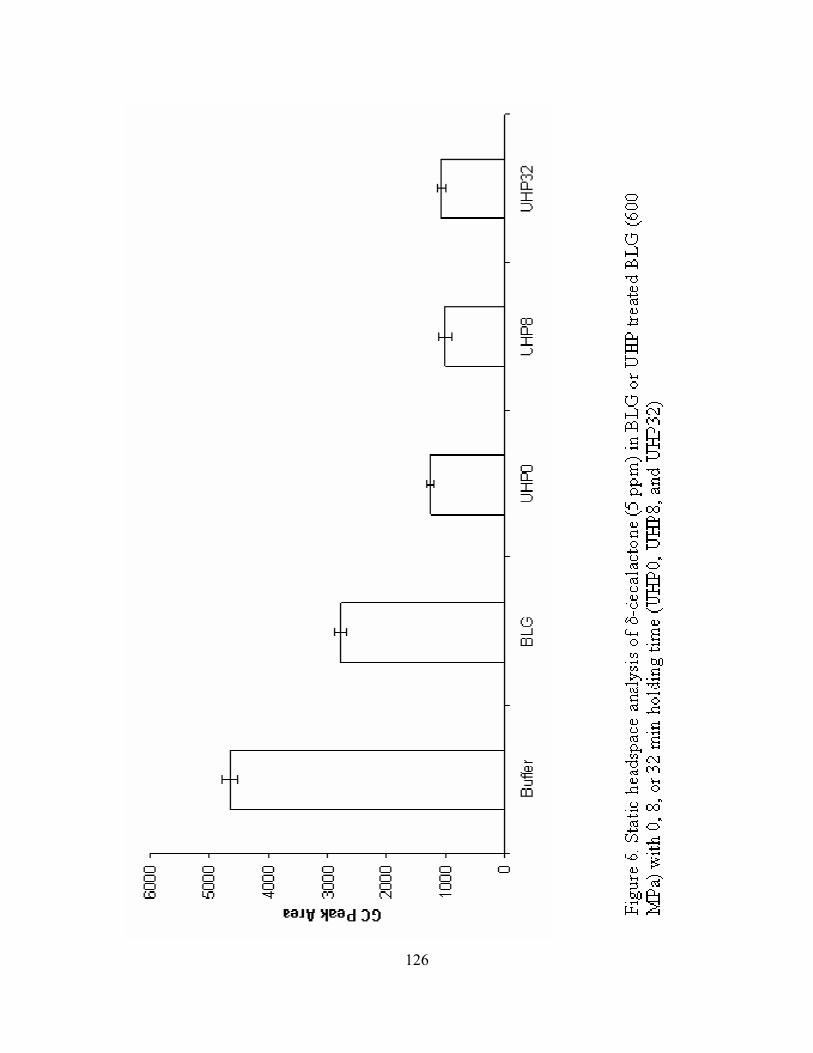
126
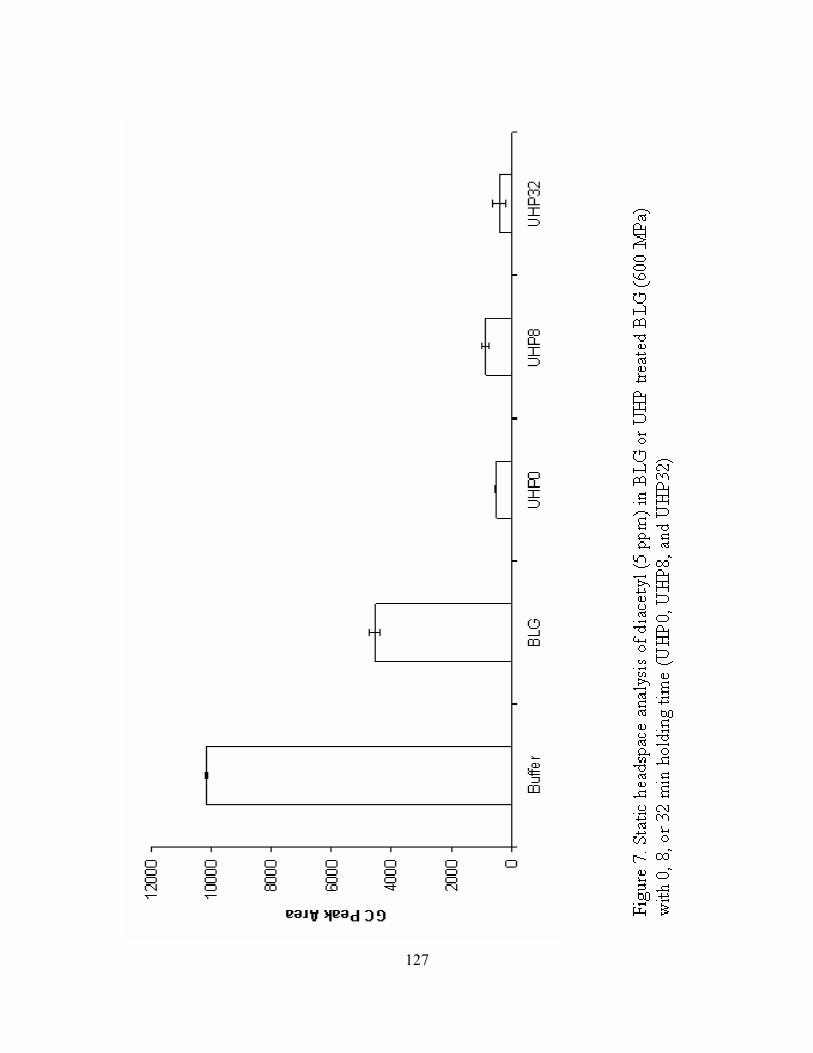
127
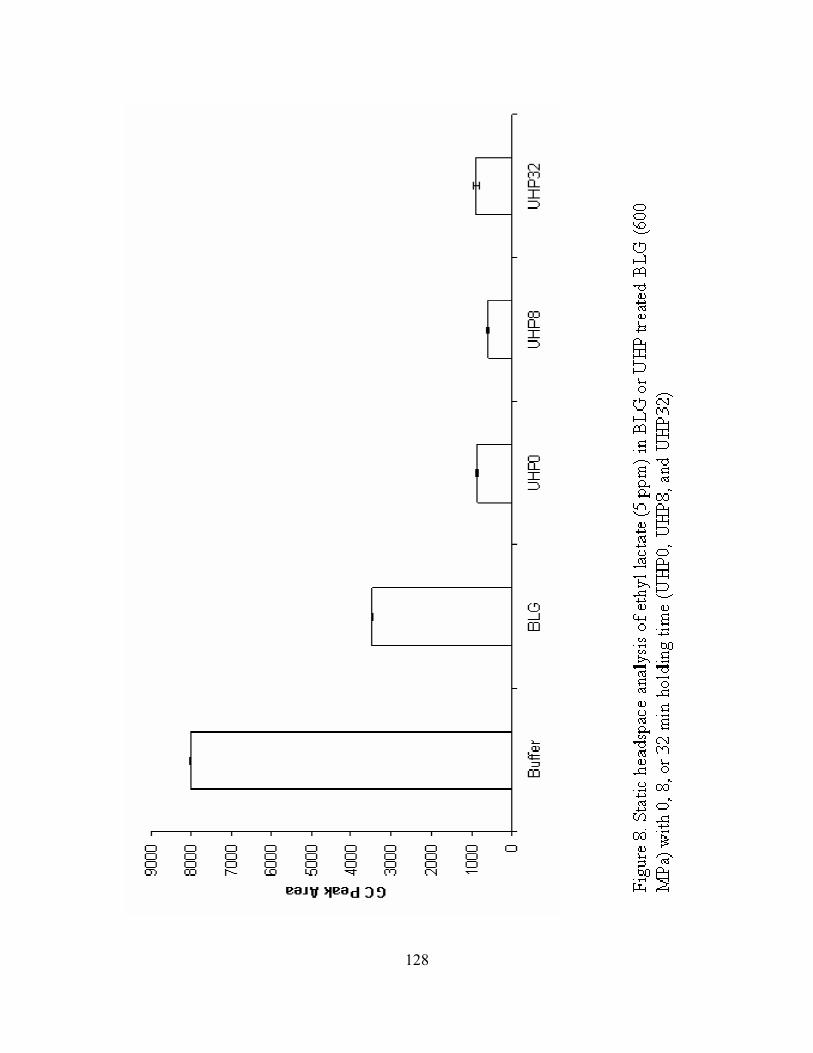
128
CHAPTER FIVE
CONCLUSIONS
Ultra high hydrostatic pressure (UHP) treatment of BLG at 600 MPa resulted in
an increase in tryptophan intrinsic fluorescence intensity at pH 7.0. A red shift in the
emission wavelength occurred at pH 7.0, indicating a polarity shift from a less polar to a
more polar tryptophan microenvironment and an unfolding of BLG, exposing the
hydrophobic interior. These results provide evidence that UHP treatment induces BLG
into the molten globule state. After come-up time at pH 9.0, BLG exhibited the greatest
surface hydrophobicity, suggesting that UHP treatment increases the flexibility of the
secondary structure concomitant with base-induced denaturation. Following UHP
treatment (32 min) of BLG at pH 3.0, the number of binding sites for the nonpolar
fluorescence probe 6-propionyl-2-(dimethylamino)-naphthalene (PRODAN) decreased
from 2.26 to 1.16. These results indicate that BLG does not require long UHP treatment
times to achieve more binding.
A ten minute extraction time for δ-decalactone, diacetyl, ethyl lactate, and 2-
methylbutyraldehyde is adequate for headspace analysis via solid phase microextraction.
The GC method described is short, requiring 1.7 h for both extraction and detection of
selected flavor compounds.
UHP treatment of BLG does not increase the binding properties of BLG for
diacetyl, 2-methylbutyraldehyde, ethyl lactate and δ-decalactone as observed by intrinsic
fluorescence quenching, suggesting that the fluorescence technique may not be
appropriate for the determination of BLG binding properties. BLG has low binding
affinity for selected flavor compounds with polar groups. On the other hand, as observed
129
by headspace analysis, UHP treatment of BLG resulted in increases of retention of
selected flavor compounds, indicating that HS-SPME is a dependable method for
quantifying headspace concentrations of flavor compounds.
β-Lactoglobulin has potential as a functional ingredient in the food industry. Fat
replacers are used to provide the physical and sensory properties of fat, and when BLG is
included as a flavor carrier, BLG offers consumers alternative choices of eating healthy,
while maintaining the full flavor experience.
130