Annealing of -decay damage in zircon: a Raman spectroscopic study · intermediate degrees of damage...
18
J. Phys.: Condens. Matter 12 (2000) 3131–3148. Printed in the UK PII: S0953-8984(00)10414-X Annealing of α-decay damage in zircon: a Raman spectroscopic study Ming Zhang†, Ekhard K H Salje†, Gian Carlo Capitani‡, Hugues Leroux‡, Andrew M Clark§, Jochen Schl¨ uter and Rodney C Ewing¶ † Department of Earth Sciences, University of Cambridge, Downing Street, Cambridge CB2 3EQ, UK ‡ Laboratoire de Structure et Propri´ et´ es de l’Etat Solide, Bˆ atiment C6, Universit´ e Sciences et Technologies de Lille, 59655 Villeneuve d’Ascq, France § Department of Mineralogy, The Natural History Museum, Cromwell Road, London SW7 5BD, UK Mineralogisches Museum, Mineralogisch-Petrographisches Institut, Universit¨ at Hamburg, Grindelallee 48, D-20146 Hamburg, Germany ¶ Department of Nuclear Engineering and Radiological Sciences Department of Geological Sciences, University of Michigan, Ann Arbor, MI 48109-2104, USA E-mail: [email protected] (M Zhang) Received 16 December 1999 Abstract. Recrystallization and structural recovery in α-decay damage in zircon samples have been studied using Raman spectroscopy. Fifteen zircon samples with different degrees of radiation damage have been thermally annealed between 600 K and 1800 K for up to 28 days and 8 hours. The experimental results from this study reveal that recrystallization in the damaged zircon samples is a multi-stage process that depends on the degree of initial damage of the samples. In partially damaged samples the lattice recovery of damaged crystalline ZrSiO 4 takes place at temperatures as low as about 700 K, as shown by a remarkable band-sharpening and a significant increase in the frequencies of ν 1 and ν 3 Si–O stretching vibrations together with the external band near 357 cm −1 with increasing temperature. A dramatic increase of Raman scattering intensity of ZrSiO 4 occurs in partially damaged samples near 1000 K due to a recrystallization process involving epitaxial growth. Heavily damaged samples tend to decompose into ZrO 2 and SiO 2 at high temperatures. Tetragonal ZrO 2 has been observed under annealing between 1125 K and about 1600 K in heavily damaged samples while monoclinic ZrO 2 appears above 1600 K. Weak signals from ZrSiO 4 were detected at 1125 K in highly metamict zircon although the main recrystallization appears to occur near 1500 K accompanied by a decrease of the volumes of ZrO 2 as well as SiO 2 . This suggests that this recrystallization is associated with the reaction of ZrO 2 with SiO 2 to form ZrSiO 4 . A possible intermediate phase has been observed, for the first time, by Raman spectroscopy in damaged zircons annealed at temperatures between 800 K and 1400 K. This phase is characterized by strong, broad Raman signals near 670, 798 and 1175 cm −1 . Prolonged isothermal annealing at 1050 K results in a decrease of these characteristic bands and eventually the disappearance of this intermediate phase. 1. Introduction Zircon (ZrSiO 4 ) is widely used in the ceramic, foundry and refractory industries. It has also been proposed as a waste form for the disposal of plutonium from dismantled nuclear weapons (Burakov 1993, Anderson et al 1993, Ewing et al 1995, Weber et al 1996, Ewing 1999). Self-radiation damage from α-decay of the incorporated actinides can affect the durability and 0953-8984/00/133131+18$30.00 © 2000 IOP Publishing Ltd 3131
Transcript of Annealing of -decay damage in zircon: a Raman spectroscopic study · intermediate degrees of damage...
J. Phys.: Condens. Matter 12 (2000) 3131–3148. Printed in the UK PII: S0953-8984(00)10414-X
Annealing of α-decay damage in zircon: a Ramanspectroscopic study
Ming Zhang†, Ekhard K H Salje†, Gian Carlo Capitani‡, Hugues Leroux‡,Andrew M Clark§, Jochen Schluter‖ and Rodney C Ewing¶† Department of Earth Sciences, University of Cambridge, Downing Street,Cambridge CB2 3EQ, UK‡ Laboratoire de Structure et Proprietes de l’Etat Solide, Batiment C6,Universite Sciences et Technologies de Lille, 59655 Villeneuve d’Ascq, France§ Department of Mineralogy, The Natural History Museum, Cromwell Road, London SW7 5BD,UK‖ Mineralogisches Museum, Mineralogisch-Petrographisches Institut, Universitat Hamburg,Grindelallee 48, D-20146 Hamburg, Germany¶ Department of Nuclear Engineering and Radiological Sciences Department of GeologicalSciences, University of Michigan, Ann Arbor, MI 48109-2104, USA
E-mail: [email protected] (M Zhang)
Received 16 December 1999
Abstract. Recrystallization and structural recovery in α-decay damage in zircon samples havebeen studied using Raman spectroscopy. Fifteen zircon samples with different degrees of radiationdamage have been thermally annealed between 600 K and 1800 K for up to 28 days and 8 hours.The experimental results from this study reveal that recrystallization in the damaged zircon samplesis a multi-stage process that depends on the degree of initial damage of the samples. In partiallydamaged samples the lattice recovery of damaged crystalline ZrSiO4 takes place at temperaturesas low as about 700 K, as shown by a remarkable band-sharpening and a significant increase in thefrequencies of ν1 and ν3 Si–O stretching vibrations together with the external band near 357 cm−1
with increasing temperature. A dramatic increase of Raman scattering intensity of ZrSiO4 occursin partially damaged samples near 1000 K due to a recrystallization process involving epitaxialgrowth. Heavily damaged samples tend to decompose into ZrO2 and SiO2 at high temperatures.Tetragonal ZrO2 has been observed under annealing between 1125 K and about 1600 K in heavilydamaged samples while monoclinic ZrO2 appears above 1600 K. Weak signals from ZrSiO4 weredetected at 1125 K in highly metamict zircon although the main recrystallization appears to occurnear 1500 K accompanied by a decrease of the volumes of ZrO2 as well as SiO2. This suggeststhat this recrystallization is associated with the reaction of ZrO2 with SiO2 to form ZrSiO4.
A possible intermediate phase has been observed, for the first time, by Raman spectroscopy indamaged zircons annealed at temperatures between 800 K and 1400 K. This phase is characterizedby strong, broad Raman signals near 670, 798 and 1175 cm−1. Prolonged isothermal annealing at1050 K results in a decrease of these characteristic bands and eventually the disappearance of thisintermediate phase.
1. Introduction
Zircon (ZrSiO4) is widely used in the ceramic, foundry and refractory industries. It has alsobeen proposed as a waste form for the disposal of plutonium from dismantled nuclear weapons(Burakov 1993, Anderson et al 1993, Ewing et al 1995, Weber et al 1996, Ewing 1999).Self-radiation damage from α-decay of the incorporated actinides can affect the durability and
0953-8984/00/133131+18$30.00 © 2000 IOP Publishing Ltd 3131
3132 M Zhang et al
performance of these actinide-bearing phases. The evaluation of the effect of radiation on thecrystalline phase and understanding of the damage and recrystallization mechanisms and thestructure of the damaged phase are one of the critical concerns for this application.
Zircon is tetragonal (I41/amd and Z = 4) (Hazen and Finger 1979). The idealstructure consists of a chain of alternating, edge-sharing SiO4 tetrahedra and ZrO8 triangulardodecahedra extending parallel to the crystallographic c-axis. Natural zircons are commonlyfound with U and Th, as well as other rare earth elements. Due to radioactive decay of naturallyoccurring radionuclides and their daughter products in the 238U, 235U and 232Th decay seriesthe structure of zircon can become heavily damaged over geological time. As a result, naturalzircon is commonly found in the ‘metamict’ state, an aperiodic or amorphous state caused byα-decay radiation damage (Ewing 1994).
Annealing of metamict zircon is typically done in order to restore the original crystalstructure for the purpose of phase identification and to gain an understanding of therecrystallization mechanism. Previous investigations (Stott and Hilliard 1946, Vaz and Senftle1971, Vance and Anderson 1972, Mursic et al 1992a, Weber 1991, 1993, Ellsworth et al 1994,Farges 1994, McLaren et al 1994, Jaeger et al 1997, Colombo and Chrosch 1998a, b, Meldrumet al 1998, Colombo et al 1999, Begg et al 2000, Capitani et al 2000) elucidated some aspectsof the mechanism and kinetics of recrystallization of metamict zircon although several issuesare still not clear.
Firstly, what happens at an atomic level during high temperature annealing is not knownand even the local structure of metamict zircon remains elusive. Based on density and XRDmeasurements, Weber (1991, 1993) reported a two-stage recovery in Pu-doped zircon annealedat high temperatures. The author suggested that the first-stage recovery, appearing near 1323 K,was related to decomposition of damaged zircon and the second-stage recovery was associatedwith the transformation back to the original ZrSiO4 crystal structure at a higher temperature(the author could not determine exactly when recrystallization to ZrSiO4 structure started dueto the uncertainty in the XRD data). An in situ single-crystal neutron diffraction study onpartially metamict zircon samples up to 2000 K by Mursic et al (1992a) showed that foruntreated metamict samples the probability density function of the oxygen atoms exhibitedminima in directions towards Zr and Si atoms, but for samples annealed at 1573 K and 1873 Kthe minima disappeared and there was an increased density shift towards the Si atoms. Theseauthors suggested that the observed recrystallization of the damaged zircon could be relatedto a structural relaxation at high temperatures which was seen in a synthetic sample (Mursicet al 1992b). Farges (1994) reported that XRD data showed a decrease of the cell parametera from 6.674 Å at 573 K to 6.610 Å at 873 K for a damaged zircon and Zr-K EXAFS analysisindicated a progressive (VII) Zr⇒ (VIII) Zr transition, associated with a recovery of thecrystalline zircon medium-range environment at higher temperatures (approximately between927 K and 1273 K).
Secondly, although it has been generally agreed that highly metamict zircon tends todecompose into ZrO2 and SiO2 at high temperatures, different polymorphs of ZrO2 have beenreported in different studies. In a thermal anneal study using x-rays, Vance and Anderson(1972) reported cubic and tetragonal ZrO2 at 1073 K and 1373 K, respectively. Farges (1994)reported monoclinic ZrO2 in heavily damaged samples heated to 1373 K. McLaren et al (1994)observed, in heavily damaged zircon with high uranium content, that annealing at 1173 Kproduced randomly orientated ZrO2 crystallites of roughly 10 nm size while annealing at1523 K produced baddeleyite crystals (monoclinic ZrO2) of 1000 nm dimensions and an easilyidentifiable silica glass phase in the regions that were initially optically isotropic. Ellsworthet al (1994) observed crystalline ZrO2 in heavily damaged zircon annealed at 1273 K. Due toits broad x-ray diffraction peaks, these authors could not determine whether it was cubic or
Annealing of α-decay damage in zircon 3133
tetragonal. Ellsworth et al (1994) also pointed out that decomposition of metamict zircon intoZrO2 and SiO2 could be one possible path for recrystallization. An x-ray powder diffractionstudy at high temperature (Colombo and Chrosch 1998b) reported the appearance of pseudo-cubic ZrO2. Meldrum et al (1998) observed a decomposition of zircon into tetragonal ZrO2
when irradiating zircon with heavy ions at around 950 K.Finally, there are some experimental results suggesting that zircon samples with different
degrees of damage show different recovery behaviours. A thermoluminescence study by Vazand Senftle (1971) showed that heating samples with different degrees of α-decay damageto 1223 K for 20 h in N2 atmosphere resulted in an increase in signals of zircon, but theincrease in terms of light output was α-dose dependent. Ellsworth et al (1994) reported thatthe enthalpy (relative to crystalline zircon) of annealing varied sigmoidally as a function ofradiation dose and it reached a saturation plateau (−59 ± 3 kJ mol−1) at radiation dose greaterthan 5×10¹⁸ α-events g−1. A recent study using time-differential perturbed angular correlationspectroscopy (Jaeger et al 1997) showed that at some temperatures the degree of recovery wasrelated to the degree of the initial damage of the sample.
We undertook this study to understand the mechanism and kinetics of recrystallization andstructural recovery of metamict zircon on annealing. Raman spectroscopy was used becauseit has a correlation length scale of about a few unit cells and it has been widely used in thestudy of amorphous and nanometric materials and ZrO2 (Siu et al 1999, Zhang et al 2000).We shall show in later sections that recrystallization in zircon is strongly dose dependent andheavily damaged zircon samples exhibit a more complex recrystallization path than weaklydamaged zircon samples. Heating heavily damaged samples to high temperatures can leadto the appearance of tetragonal and monoclinic ZrO2 and unavoidable SiO2 phases. We shallalso report experimental data showing the existence of a possible intermediate phase occurringduring annealing at temperatures above 800 K.
2. Experiment
The samples used in this study were analysed using electron microprobe, x-ray and infraredspectroscopy. Seven of them have been previously studied by Murakami et al (1991), Salje et al(1999) and Zhang et al (2000). The lattice parameters of some of the samples were determinedby x-ray Guinier powder diffraction with Si as internal standards. Electron microprobe analysiswas performed on polished thin sections of zircon samples using a Cameca SX5D electronmicroprobe with a Link AN10000 energy-dispersive spectrometer. A beam size of 5 µmwas used with a beam current of 100 nA. Tables 1 and 2 list the details. According to x-raydiffraction patterns, unit cell parameters, infrared and Raman spectra, samples Vigene, Moroto,Miass, Green River, UG13, Henderson and 269 are undamaged or slightly damaged (withestimated dose of less than 2 × 10¹⁸ α-events g−1); samples Cam26, Cam10 and 4604 haveintermediate degrees of damage (between 2 and 3.5 × 10¹⁸ α-events g−1); samples Cam27,Ni12 and Z3 are heavily damaged with dose between 5.6 and 7.9×10¹⁸ α-events g−1; samples157 (with dose of 13.1 × 10¹⁸ α-events g−1) and Sd4 (15.9 × 10¹⁸ α-events g−1) are highlymetamict. All annealing experiments were carried out in N2 atmosphere in a vertical furnace.Annealed samples were quenched in air.
Raman spectra were recorded at room temperature using a Bruker IFS 66v spectrometeradapted with a Bruker FRA 106 FT–Raman accessory. A silicon-coated calcium fluoride beam-splitter and radiation of 1064 nm from an Nd:YAG laser were used for the excitation laser whichcan produce 350 mW output. A liquid-nitrogen-cooled, high sensitivity Ge detector was used.The spectra were recorded with a laser power of 45–100 mW and a back scattering geometry.The focused beam was about 200 µm in size. For crystalline zircon samples 250–512 scans
3134 M Zhang et al
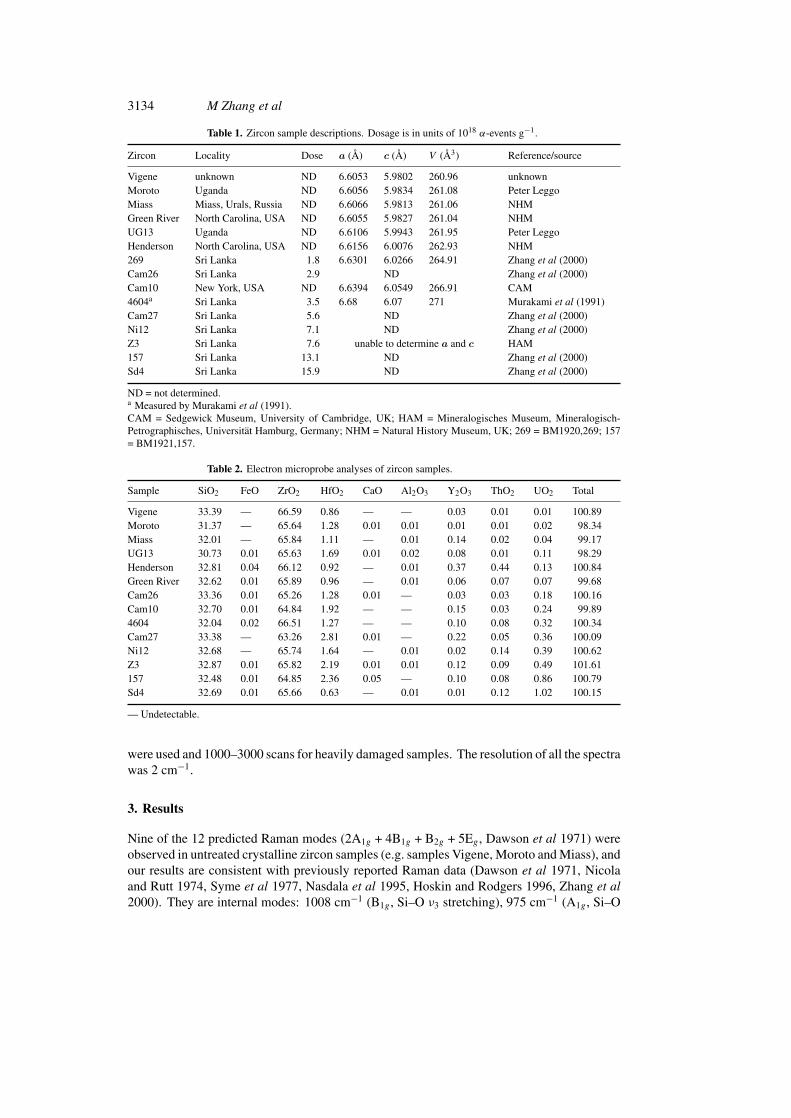
Table 1. Zircon sample descriptions. Dosage is in units of 1018 α-events g−1.
Zircon Locality Dose a (Å) c (Å) V (Å3) Reference/source
Vigene unknown ND 6.6053 5.9802 260.96 unknownMoroto Uganda ND 6.6056 5.9834 261.08 Peter LeggoMiass Miass, Urals, Russia ND 6.6066 5.9813 261.06 NHMGreen River North Carolina, USA ND 6.6055 5.9827 261.04 NHMUG13 Uganda ND 6.6106 5.9943 261.95 Peter LeggoHenderson North Carolina, USA ND 6.6156 6.0076 262.93 NHM269 Sri Lanka 1.8 6.6301 6.0266 264.91 Zhang et al (2000)Cam26 Sri Lanka 2.9 ND Zhang et al (2000)Cam10 New York, USA ND 6.6394 6.0549 266.91 CAM4604a Sri Lanka 3.5 6.68 6.07 271 Murakami et al (1991)Cam27 Sri Lanka 5.6 ND Zhang et al (2000)Ni12 Sri Lanka 7.1 ND Zhang et al (2000)Z3 Sri Lanka 7.6 unable to determine a and c HAM157 Sri Lanka 13.1 ND Zhang et al (2000)Sd4 Sri Lanka 15.9 ND Zhang et al (2000)
ND = not determined.a Measured by Murakami et al (1991).CAM = Sedgewick Museum, University of Cambridge, UK; HAM = Mineralogisches Museum, Mineralogisch-Petrographisches, Universitat Hamburg, Germany; NHM = Natural History Museum, UK; 269 = BM1920,269; 157= BM1921,157.
Table 2. Electron microprobe analyses of zircon samples.
Sample SiO2 FeO ZrO2 HfO2 CaO Al2O3 Y2O3 ThO2 UO2 Total
Vigene 33.39 — 66.59 0.86 — — 0.03 0.01 0.01 100.89Moroto 31.37 — 65.64 1.28 0.01 0.01 0.01 0.01 0.02 98.34Miass 32.01 — 65.84 1.11 — 0.01 0.14 0.02 0.04 99.17UG13 30.73 0.01 65.63 1.69 0.01 0.02 0.08 0.01 0.11 98.29Henderson 32.81 0.04 66.12 0.92 — 0.01 0.37 0.44 0.13 100.84Green River 32.62 0.01 65.89 0.96 — 0.01 0.06 0.07 0.07 99.68Cam26 33.36 0.01 65.26 1.28 0.01 — 0.03 0.03 0.18 100.16Cam10 32.70 0.01 64.84 1.92 — — 0.15 0.03 0.24 99.894604 32.04 0.02 66.51 1.27 — — 0.10 0.08 0.32 100.34Cam27 33.38 — 63.26 2.81 0.01 — 0.22 0.05 0.36 100.09Ni12 32.68 — 65.74 1.64 — 0.01 0.02 0.14 0.39 100.62Z3 32.87 0.01 65.82 2.19 0.01 0.01 0.12 0.09 0.49 101.61157 32.48 0.01 64.85 2.36 0.05 — 0.10 0.08 0.86 100.79Sd4 32.69 0.01 65.66 0.63 — 0.01 0.01 0.12 1.02 100.15
— Undetectable.
were used and 1000–3000 scans for heavily damaged samples. The resolution of all the spectrawas 2 cm−1.
3. Results
Nine of the 12 predicted Raman modes (2A1g + 4B1g + B2g + 5Eg , Dawson et al 1971) wereobserved in untreated crystalline zircon samples (e.g. samples Vigene, Moroto and Miass), andour results are consistent with previously reported Raman data (Dawson et al 1971, Nicolaand Rutt 1974, Syme et al 1977, Nasdala et al 1995, Hoskin and Rodgers 1996, Zhang et al2000). They are internal modes: 1008 cm−1 (B1g , Si–O ν3 stretching), 975 cm−1 (A1g , Si–O
Annealing of α-decay damage in zircon 3135
ν1 stretching), 439 cm−1 (A1g , Si–O ν2 bending), and 269 cm−1 (B2g , Si–O ν2 bending) andexternal modes: 393, 355, 225, 214 and 202 cm−1 (Syme et al 1977, Hoskin and Rodgers1996). The other predicted bands are too weak to useful for this study.
3.1. Effects of annealing temperature
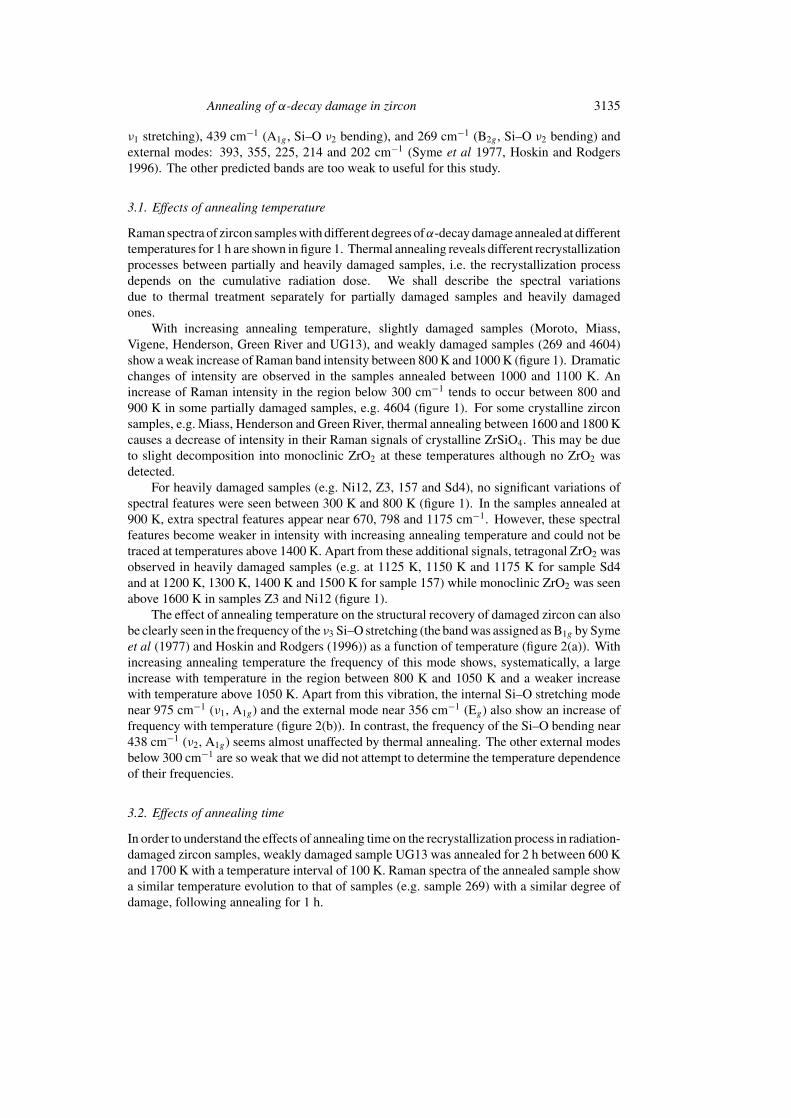
Raman spectra of zircon samples with different degrees ofα-decay damage annealed at differenttemperatures for 1 h are shown in figure 1. Thermal annealing reveals different recrystallizationprocesses between partially and heavily damaged samples, i.e. the recrystallization processdepends on the cumulative radiation dose. We shall describe the spectral variationsdue to thermal treatment separately for partially damaged samples and heavily damagedones.
With increasing annealing temperature, slightly damaged samples (Moroto, Miass,Vigene, Henderson, Green River and UG13), and weakly damaged samples (269 and 4604)show a weak increase of Raman band intensity between 800 K and 1000 K (figure 1). Dramaticchanges of intensity are observed in the samples annealed between 1000 and 1100 K. Anincrease of Raman intensity in the region below 300 cm−1 tends to occur between 800 and900 K in some partially damaged samples, e.g. 4604 (figure 1). For some crystalline zirconsamples, e.g. Miass, Henderson and Green River, thermal annealing between 1600 and 1800 Kcauses a decrease of intensity in their Raman signals of crystalline ZrSiO4. This may be dueto slight decomposition into monoclinic ZrO2 at these temperatures although no ZrO2 wasdetected.
For heavily damaged samples (e.g. Ni12, Z3, 157 and Sd4), no significant variations ofspectral features were seen between 300 K and 800 K (figure 1). In the samples annealed at900 K, extra spectral features appear near 670, 798 and 1175 cm−1. However, these spectralfeatures become weaker in intensity with increasing annealing temperature and could not betraced at temperatures above 1400 K. Apart from these additional signals, tetragonal ZrO2 wasobserved in heavily damaged samples (e.g. at 1125 K, 1150 K and 1175 K for sample Sd4and at 1200 K, 1300 K, 1400 K and 1500 K for sample 157) while monoclinic ZrO2 was seenabove 1600 K in samples Z3 and Ni12 (figure 1).
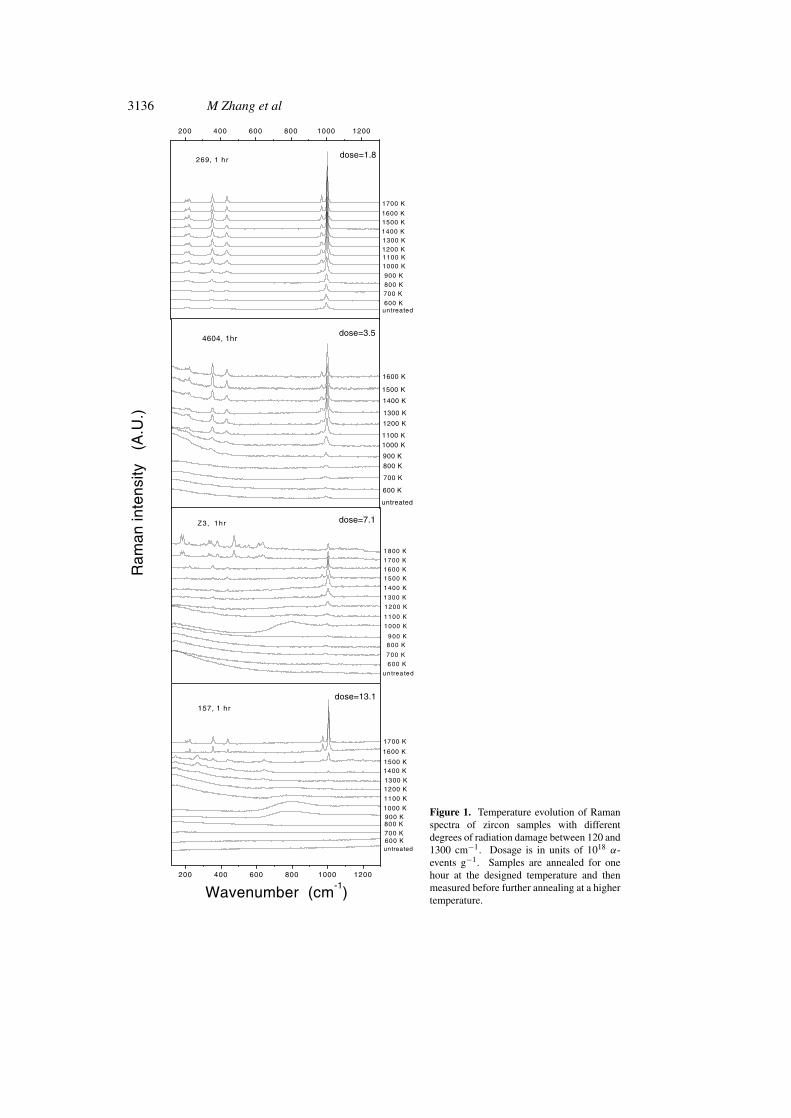
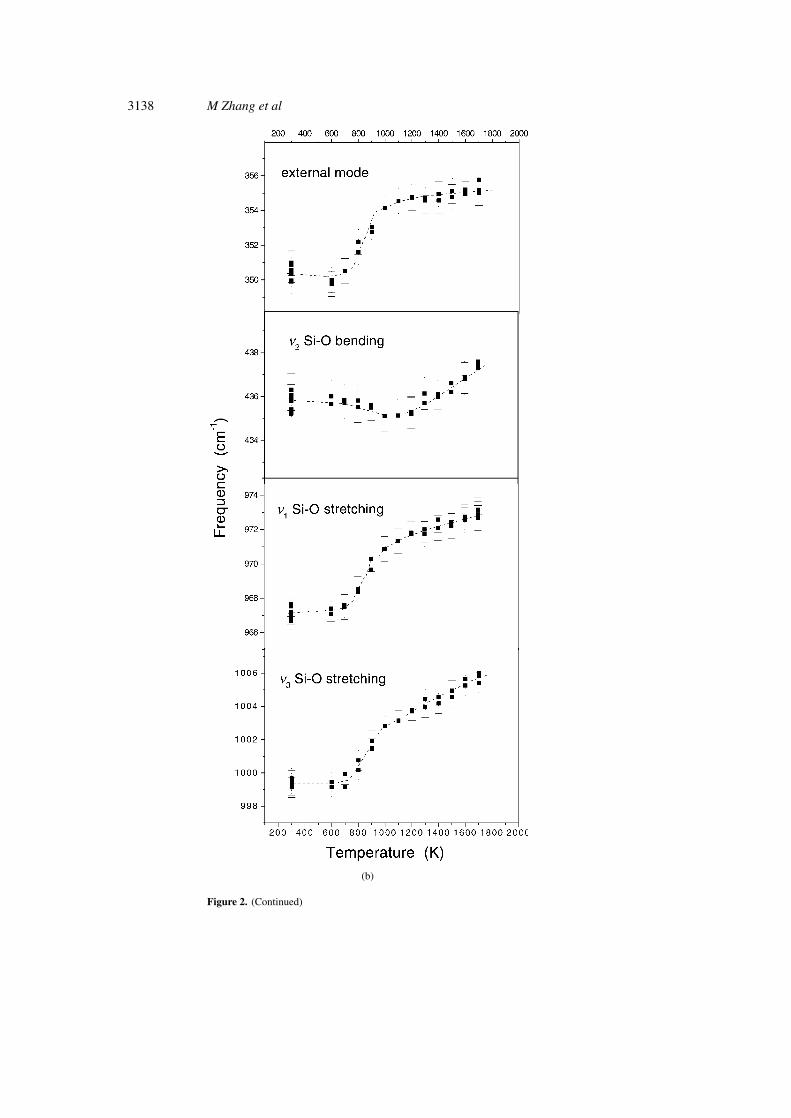
The effect of annealing temperature on the structural recovery of damaged zircon can alsobe clearly seen in the frequency of the ν3 Si–O stretching (the band was assigned as B1g by Symeet al (1977) and Hoskin and Rodgers (1996)) as a function of temperature (figure 2(a)). Withincreasing annealing temperature the frequency of this mode shows, systematically, a largeincrease with temperature in the region between 800 K and 1050 K and a weaker increasewith temperature above 1050 K. Apart from this vibration, the internal Si–O stretching modenear 975 cm−1 (ν1, A1g) and the external mode near 356 cm−1 (Eg) also show an increase offrequency with temperature (figure 2(b)). In contrast, the frequency of the Si–O bending near438 cm−1 (ν2, A1g) seems almost unaffected by thermal annealing. The other external modesbelow 300 cm−1 are so weak that we did not attempt to determine the temperature dependenceof their frequencies.
3.2. Effects of annealing time
In order to understand the effects of annealing time on the recrystallization process in radiation-damaged zircon samples, weakly damaged sample UG13 was annealed for 2 h between 600 Kand 1700 K with a temperature interval of 100 K. Raman spectra of the annealed sample showa similar temperature evolution to that of samples (e.g. sample 269) with a similar degree ofdamage, following annealing for 1 h.
3136 M Zhang et al
dose=13.1
dose=7.1
dose=3.5
dose=1.8
1800 K
1700 K
1600 K
1500 K
1400 K
1300 K
1200 K
1100 K
1000 K
900 K800 K
700 K
600 K
untrea ted
Z3, 1hr
700 K
600 K
800 K
900 K
1000 K1100 K
1200 K
1300 K
1400 K
1500 K
untreated
1600 K
4604, 1hr
200 400 600 800 1000 1200
1700 K
1600 K1500 K
1400 K1300 K1200 K1100 K1000 K
900 K
800 K700 K
600 Kuntreated
269, 1 hr
200 400 600 800 1000 1200
700 K
157, 1 hr
900 K
1100 K
1300 K
1500 K
1600 K
1400 K
1200 K
1000 K
800 K
600 Kuntreated
1700 K
Wavenumber (cm-1)
Ram
an in
tens
ity
(A
.U.)
Figure 1. Temperature evolution of Ramanspectra of zircon samples with differentdegrees of radiation damage between 120 and1300 cm−1. Dosage is in units of 1018 α-events g−1. Samples are annealed for onehour at the designed temperature and thenmeasured before further annealing at a highertemperature.
Annealing of α-decay damage in zircon 3137
200 400 600 800 1000 1200 1400 1600 1800 2000992
994
996
998
1000
1002
1004
1006
1008
1010
metamict
crystalline
MiassMorotoHendersonUG13269 Cam264604Z3Ni12157
Fre
quen
cy
(cm
-1)
Annealing Temperature (K)
(a)
Figure 2. Phonon frequencies as a function of annealing temperature. (a) ν3 Si–O stretching;(b) external and internal modes for sample 269. All the samples were annealed for 1 h exceptUG13 (2 h) and Cam26 (16 h).
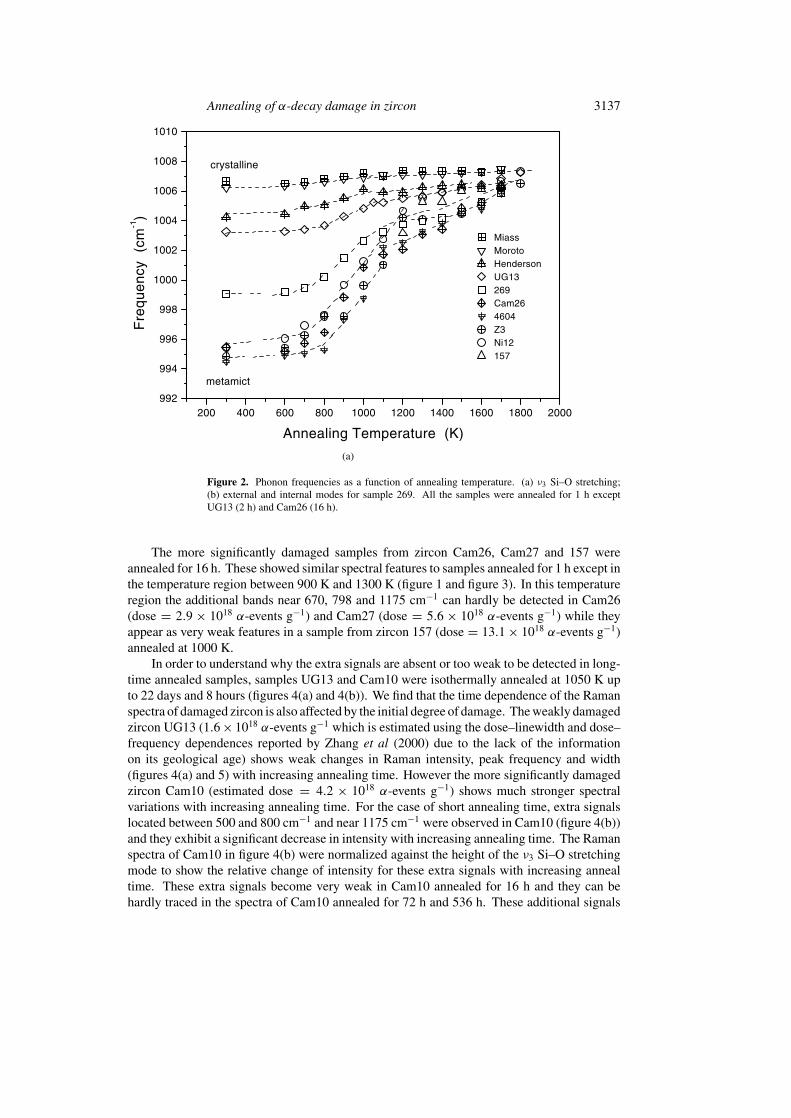
The more significantly damaged samples from zircon Cam26, Cam27 and 157 wereannealed for 16 h. These showed similar spectral features to samples annealed for 1 h except inthe temperature region between 900 K and 1300 K (figure 1 and figure 3). In this temperatureregion the additional bands near 670, 798 and 1175 cm−1 can hardly be detected in Cam26(dose = 2.9 × 10¹⁸ α-events g−1) and Cam27 (dose = 5.6 × 10¹⁸ α-events g−1) while theyappear as very weak features in a sample from zircon 157 (dose = 13.1 × 10¹⁸ α-events g−1)annealed at 1000 K.
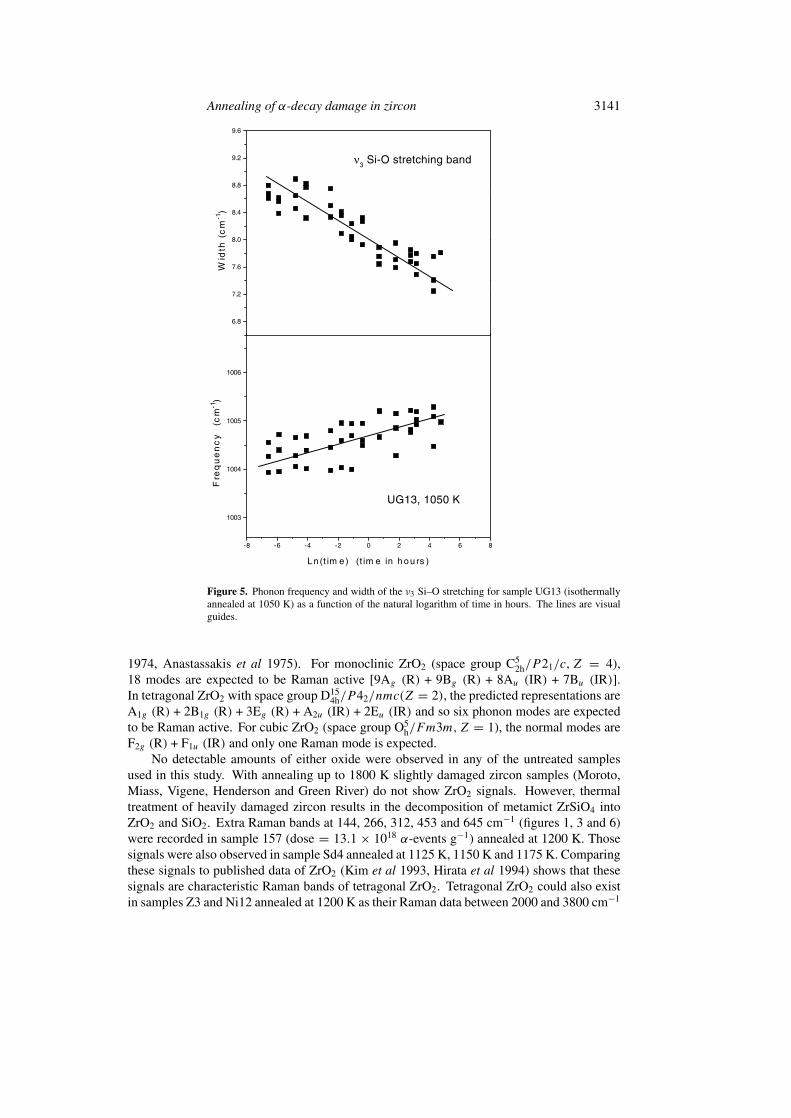
In order to understand why the extra signals are absent or too weak to be detected in long-time annealed samples, samples UG13 and Cam10 were isothermally annealed at 1050 K upto 22 days and 8 hours (figures 4(a) and 4(b)). We find that the time dependence of the Ramanspectra of damaged zircon is also affected by the initial degree of damage. The weakly damagedzircon UG13 (1.6 × 10¹⁸ α-events g−1 which is estimated using the dose–linewidth and dose–frequency dependences reported by Zhang et al (2000) due to the lack of the informationon its geological age) shows weak changes in Raman intensity, peak frequency and width(figures 4(a) and 5) with increasing annealing time. However the more significantly damagedzircon Cam10 (estimated dose = 4.2 × 10¹⁸ α-events g−1) shows much stronger spectralvariations with increasing annealing time. For the case of short annealing time, extra signalslocated between 500 and 800 cm−1 and near 1175 cm−1 were observed in Cam10 (figure 4(b))and they exhibit a significant decrease in intensity with increasing annealing time. The Ramanspectra of Cam10 in figure 4(b) were normalized against the height of the ν3 Si–O stretchingmode to show the relative change of intensity for these extra signals with increasing annealtime. These extra signals become very weak in Cam10 annealed for 16 h and they can behardly traced in the spectra of Cam10 annealed for 72 h and 536 h. These additional signals
3138 M Zhang et al
(b)
Figure 2. (Continued)

Annealing of α-decay damage in zircon 3139
dose=2.9
dose=5.6
dose=13.1
, 16 hr
, 16 hr
, 16 hr
(c)
(b)
(a)
Wavenumber (cm-1
)
Ram
an in
tens
ity
(A.U
.)
2 0 0 4 0 0 6 0 0 8 0 0 1 0 0 0 1 2 0 0
1 5 7
1600 K
1400 K
1200 K
1000 K
800 K
600 K
untreated
2 0 0 4 0 0 6 0 0 8 0 0 1 0 0 0 1 2 0 0
1700 K
1600 K
1500 K
1400 K
1300 K
1200 K
1100 K
1000 K
900 K
800 K
700 K
600 K
untreated
C a m 2 6
1700 K
1600 K
1500 K
1400 K
1300 K
1200 K1100 K
1000 K
900 K
800 K
700 K600 K
untreated
Ca m2 7
Figure 3. Temperature evolution of Raman spectra between 120 and 1300 cm−1 of zircons annealedfor 16 h. (a) Cam26; (b) Cam27; (c) 157. Fresh samples were annealed at each temperature. Dosageis in units of 1018 α-events g−1.

3140 M Zhang et al
Figure 4. Time evolution of Raman spectra between 120 and 1500 cm−1 (annealing temperature =1050 K). (a) UG13; (b) Cam10. For the case of (b), the Raman spectra are normalized by the heightof the Si–O stretching band near 1007 cm−1 to show the detailed spectral changes. Fresh sampleswere annealed.
could indicate an intermediate phase which starts to appear between 800 K and 900 K and ittends to disappear above 1400 K or during prolonged annealing.
A crystal from sample 157 was annealed at 1100 K for 21 days. The annealed sample didnot show any detectable crystalline ZrSiO4. A crystal of sample 157 annealed at 1400 K for16 h shows sharper Raman lines of crystalline ZrSiO4 than those samples annealed at the sametemperature for 1 h and a higher intensity of Si–O stretching ν3 of ZrSiO4 relative to that ofthe 643 cm−1 Zr–O band of tetragonal ZrO2.
3.3. ZrO2 and SiO2
Zirconia has three common polymorphs: the monoclinic, tetragonal and cubic phase (Smithand Newkirk 1965). The different polymorphs of ZrO2 can be distinguished by Raman andinfrared spectroscopy. Factor-group analysis predicts the irreducible representations of opticalphonons (for zero wave vector) for each polymorph of zirconia ZrO2 (Keramidas and White
Annealing of α-decay damage in zircon 3141
-8 -6 -4 -2 0 2 4 6 8
1003
1004
1005
1006
Fre
qu
en
cy
(c
m-1
)
L n (t im e ) (t im e in ho u rs )
6.8
7.2
7.6
8.0
8.4
8.8
9.2
9.6
Wid
th (
cm
-1)
ν3 Si-O stretching band
UG13, 1050 K
Figure 5. Phonon frequency and width of the ν3 Si–O stretching for sample UG13 (isothermallyannealed at 1050 K) as a function of the natural logarithm of time in hours. The lines are visualguides.
1974, Anastassakis et al 1975). For monoclinic ZrO2 (space group C52h/P 21/c, Z = 4),
18 modes are expected to be Raman active [9Ag (R) + 9Bg (R) + 8Au (IR) + 7Bu (IR)].In tetragonal ZrO2 with space group D15
4h/P 42/nmc(Z = 2), the predicted representations areA1g (R) + 2B1g (R) + 3Eg (R) + A2u (IR) + 2Eu (IR) and so six phonon modes are expectedto be Raman active. For cubic ZrO2 (space group O5
h/Fm3m, Z = 1), the normal modes areF2g (R) + F1u (IR) and only one Raman mode is expected.
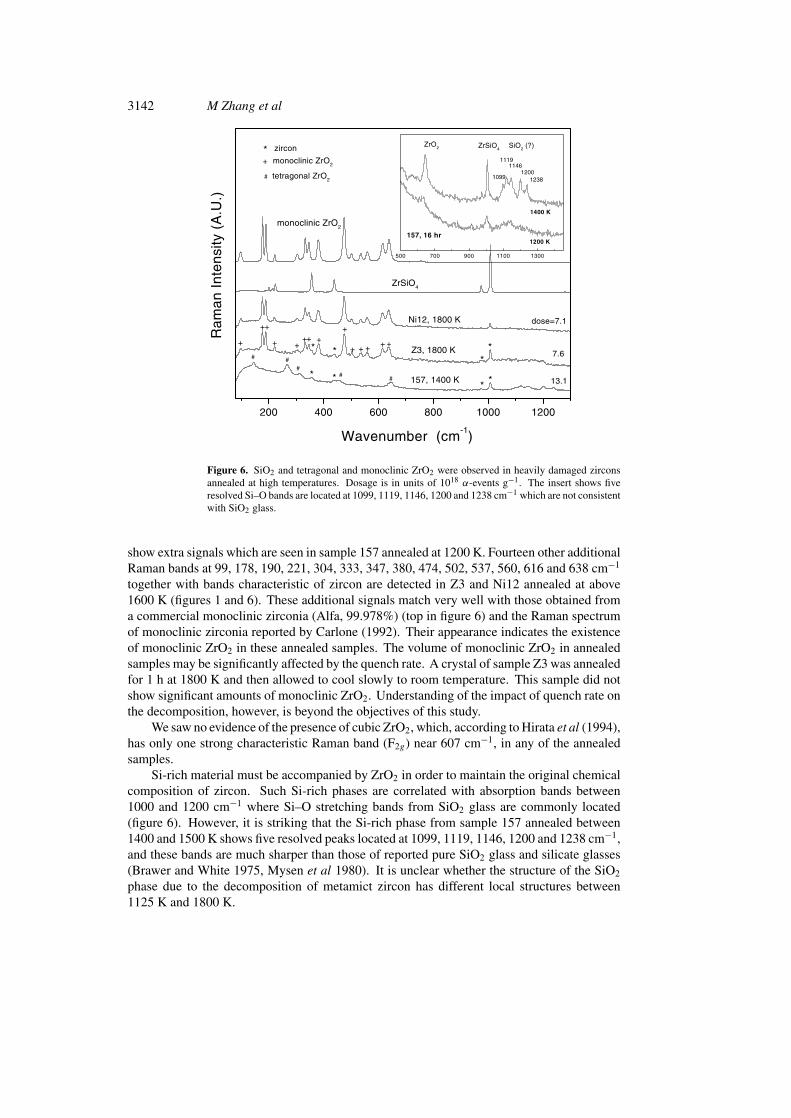
No detectable amounts of either oxide were observed in any of the untreated samplesused in this study. With annealing up to 1800 K slightly damaged zircon samples (Moroto,Miass, Vigene, Henderson and Green River) do not show ZrO2 signals. However, thermaltreatment of heavily damaged zircon results in the decomposition of metamict ZrSiO4 intoZrO2 and SiO2. Extra Raman bands at 144, 266, 312, 453 and 645 cm−1 (figures 1, 3 and 6)were recorded in sample 157 (dose = 13.1 × 10¹⁸ α-events g−1) annealed at 1200 K. Thosesignals were also observed in sample Sd4 annealed at 1125 K, 1150 K and 1175 K. Comparingthese signals to published data of ZrO2 (Kim et al 1993, Hirata et al 1994) shows that thesesignals are characteristic Raman bands of tetragonal ZrO2. Tetragonal ZrO2 could also existin samples Z3 and Ni12 annealed at 1200 K as their Raman data between 2000 and 3800 cm−1
3142 M Zhang et al
200 400 600 800 1000 1200
7.6
13.1
dose=7.1
500 700 900 1100 1300
1200 K
1400 K
157, 16 hr
SiO2 (?)ZrSiO
4ZrO
2
tetragonal ZrO2
monoclinic ZrO2
zircon
+*
* *
*
* *#
#
#
# #
#
* * *+++++
++++
+
++
++
12381200
11461119
1099
157, 1400 K
Z3, 1800 K
Ni12, 1800 K
ZrSiO4
monoclinic ZrO2
Ram
an I
nten
sity
(A
.U.)
Wavenumber (cm-1)
Figure 6. SiO2 and tetragonal and monoclinic ZrO2 were observed in heavily damaged zirconsannealed at high temperatures. Dosage is in units of 1018 α-events g−1. The insert shows fiveresolved Si–O bands are located at 1099, 1119, 1146, 1200 and 1238 cm−1 which are not consistentwith SiO2 glass.
show extra signals which are seen in sample 157 annealed at 1200 K. Fourteen other additionalRaman bands at 99, 178, 190, 221, 304, 333, 347, 380, 474, 502, 537, 560, 616 and 638 cm−1
together with bands characteristic of zircon are detected in Z3 and Ni12 annealed at above1600 K (figures 1 and 6). These additional signals match very well with those obtained froma commercial monoclinic zirconia (Alfa, 99.978%) (top in figure 6) and the Raman spectrumof monoclinic zirconia reported by Carlone (1992). Their appearance indicates the existenceof monoclinic ZrO2 in these annealed samples. The volume of monoclinic ZrO2 in annealedsamples may be significantly affected by the quench rate. A crystal of sample Z3 was annealedfor 1 h at 1800 K and then allowed to cool slowly to room temperature. This sample did notshow significant amounts of monoclinic ZrO2. Understanding of the impact of quench rate onthe decomposition, however, is beyond the objectives of this study.
We saw no evidence of the presence of cubic ZrO2, which, according to Hirata et al (1994),has only one strong characteristic Raman band (F2g) near 607 cm−1, in any of the annealedsamples.
Si-rich material must be accompanied by ZrO2 in order to maintain the original chemicalcomposition of zircon. Such Si-rich phases are correlated with absorption bands between1000 and 1200 cm−1 where Si–O stretching bands from SiO2 glass are commonly located(figure 6). However, it is striking that the Si-rich phase from sample 157 annealed between1400 and 1500 K shows five resolved peaks located at 1099, 1119, 1146, 1200 and 1238 cm−1,and these bands are much sharper than those of reported pure SiO2 glass and silicate glasses(Brawer and White 1975, Mysen et al 1980). It is unclear whether the structure of the SiO2
phase due to the decomposition of metamict zircon has different local structures between1125 K and 1800 K.
Annealing of α-decay damage in zircon 3143
4. Discussion
4.1. Structural recovery in damaged crystalline domains
Samples with intermediate degrees of damage contain crystalline and amorphous domains.Thermal annealing of these samples below 900 K does not produce significant changes inRaman intensities of crystalline zircon (figures 1 and 3). This shows that in this temperaturerange there is no significant increase in the volume of the crystalline parts implying that thegrowth of crystalline parts is very slow or absent entirely. This observation is consistentwith TEM data from samples Z3 (Capitani et al 2000) as well as the work by McLaren et al(1994).
The increase in phonon frequencies on annealing in this study is consistent with theRaman observations of metamict zircon reported by Nasdala et al (1995) and Zhang et al(2000). These authors observed the converse process, i.e. α-decay radiation damage leadingto systematic broadening of Raman bands and a significant decrease of Si–O stretchingband frequencies reflecting the weakening of the zircon structure and the accumulation ofdefects. The data from this study also confirm that the observed structural softening indamaged samples by Zhang et al (2000) is due to radiation damage rather than chemicalimpurities. The remarkable variations in Si–O stretching bands during metamictization andthermal annealing are consistent with recent computer simulations of zircon (Williford et al1998) which suggested displacement energy values of 20.4, 90.4 and 53.1 eV for Si, Zr andO, respectively. Our observations also agree with the x-ray work by Farges (1994) who noteda decrease of cell parameter a from 6.674 to 6.610 Å when heating damaged samples from573 K to 873 K.
It is striking that the temperature dependences of phonon frequencies of zircon show akink around 1050 K (figure 2). The physical implication of this observation is unclear. Basedon a single-crystal neutron diffraction measurement at high temperatures, Mursic et al (1992a)proposed that heating a partially damaged zircon to 1250 K could lead to a structural relaxationinvolving a sudden expansion of Si–O bonds and of SiO4 tetrahedral volume and allow corner-sharing SiO4 tetrahedra to rotate. As a result, the strain due to the structural disorder presentedin the metamict zircon is released.
The further increase of phonon frequencies and line-sharpening above 1000 K (figures 1and 2) indicates that the structure of the recovered crystalline domains is still not perfect.In fact, samples annealed at 1500 K show Raman bands that are still broader than those ofundamaged samples. This suggests that the temperature required for the full recovery of thecrystal structure in damaged zircon must be higher than this temperature for a specimen ofzircon with intermediate degrees of radiation damage. Vance (1975) reported a completerecovery of the ZrSiO4 infrared spectrum in severely damaged natural zircon after annealingat 1723 K and Weber (1993) reported that 100% recovery occurred near 1738 K for Pu-dopedZrSiO4.
4.2. Recrystallization and crystal growth
Thermal annealing reveals different recrystallization processes in partially and highly metamictzircon samples. For partially damaged samples, annealing at 1100 K for 1 h results in asignificant increase in the intensity of phonon bands of crystalline zircon. It can be understoodthat the remaining crystalline domains in damaged samples act as seeds for recrystallization.TEM work has shown epitaxial recrystallization in sample Z3 (Capitani et al 2000). Theexistence and growth of these domains might prevent or restrain amorphous parts fromdecomposition between 1100 K and 1200 K.
3144 M Zhang et al
Sample 157 annealed at 1100 K for 21 days did not show signals of crystalline ZrSiO4
and ZrO2, but ZrSiO4 was observed accompanied by tetragonal ZrO2 in sample 157 annealedat 1200 K for only one hour (figure 1). This observation appears to suggest that the nucleationof crystalline ZrSiO4 in metamict zircon probably occurs between 1100 K and 1200 K. Buta very limited number of damaged crystalline ZrSiO4 domains may still exist in such heavilydamaged samples (the radiation doses for 157 and Sd4 are 13.1 and 15.9 × 10¹⁸ α-events g−1,respectively), and they tend to grow in this temperature region as Salje et al (1999) showedthat zircon samples with doses as high as 7.2 × 10¹⁸ α-events g−1 still showed Bragg peaks.
Between 1200 K and 1400 K, sample 157 does not show any significant increase in theRaman intensity of crystalline ZrSiO4, although a weak signal from the ν3 Si–O stretchingvibration was seen at 1200 K. These could be due to the coexistence of ZrO2, SiO2 andZrSiO4 in this sample in this temperature region. The growth of crystalline ZrSiO4 is probablyrestrained by the presence and the growth of the oxides produced by the decomposition. Themain recrystallization in sample 157 occurs near 1500 K, and it is evidenced by the dramaticincrease of signals of crystalline zircon accompanied by the disappearance of tetragonal ZrO2
(figure 1). This suggests that for this highly metamict sample the main recrystallization (near1500 K) occurs via the reaction of ZrO2 with SiO2 in contrast to partially damaged zirconsamples in which the remaining crystalline domains play a dominate role in the epitaxialgrowth near 1000 K.
We have also noted that it is difficult to determine which recrystallization processesare occurring in some heavily damaged samples (e.g. Cam 27, Ni12 and Z3; with dosesof 5.6–7.1 × 10¹⁸ α-events g−1) (see figures 1 and 3). These two different growth mechanismsprobably take place simultaneously, but the decomposition into ZrO2 and SiO2 and theappearance of the intermediate phase with characteristic bands near 670, 798 and 1175 cm−1
complicate the analysis of the recrystallization process.
4.3. Decomposition of ZrSiO4 into ZrO2 and SiO2
In a comprehensive study using x-ray diffraction, infrared, near infrared and visiblespectroscopy, Vance (1975) did not observe ZrO2 in untreated zircon samples and ZrO2 wasrecorded in only heated samples. Based on x-ray observation of crystalline ZrO2 in two heatedsamples, Ellsworth et al (1994) suspected the SiO2–ZrO2 unmixing had occurred in the startingmetamict zircon. Zhang et al (2000) reported that ZrO2 and SiO2 are not the principal productsof metamictization (but they could not rule out the existence of a small amount of ZrO2 innatural samples due to experimental resolution). The results from our study suggest that ZrO2
and SiO2, as well as an intermediate phase, can occur when damaged samples are heated tohigh temperatures. Furthermore, our data show that decomposition is more likely to happenin heavily damaged zircon.
Our observation of ZrO2 is consistent with the observations reported by Weber (1991),Ellsworth et al (1994) and McLaren et al (1994). In x-ray diffraction data of zircon samplesheated up to 1273 K, Ellsworth et al (1994) did not detect crystalline ZrO2 in eight partiallydamaged samples with doses ranging from 0.061 up to 6.8×10¹⁸ α-events g−1, but one samplewith dose of 7.2×10¹⁸ α-events g−1 showed two phases after annealing, both zircon and ZrO2.In a more damaged sample (with dose of 11.7 × 10¹⁸ α-events g−1) heated to 1273 K, onlyZrO2 was seen in the diffraction pattern by Ellsworth et al (1994). Our results further supportthe observations of Ellsworth et al that more heavily damaged samples tend to decompose athigh temperatures. The x-ray diffraction peaks were so broad that Ellsworth et al (1994) wereunable to determine whether the ZrO2 was tetragonal or cubic. Our results also demonstratethat different ZrO2 polymorphs can be easily determined using Raman spectroscopy.
Annealing of α-decay damage in zircon 3145
It was reported by Meldrum et al (1998) that irradiating synthetic zircon with heavyions at round 950 K led to the appearance of tetragonal ZrO2, and the authors explained thatthe observed decomposition of zircon into ZrO2 and SiO2 was due to heavy-ion irradiationrather than heating. However, our results show that heating alone can produce an unknownintermediate phase around 900 K while tetragonal ZrO2 appears at a higher temperature (thelowest temperature at which we observed tetragonal ZrO2 is 1125 K in this experiment).Crystalline ZrO2 has also been observed in annealed natural samples by other workers attemperatures higher than that (950 K) reported by Meldrum et al (1998) (e.g. 1173 K byMcLaren et al (1994), 1273 K by Ellsworth et al (1994), at 1373 K by Vance and Anderson(1972), 1323 K by Weber (1991), 1173 K by Colombo and Chrosch (1998b)). Some of theseauthors might have had problems in the determination of cubic and tetragonal ZrO2 from x-raydiffraction patterns, and the problem of distinguishing between cubic and tetragonal ZrO2 hasbeen discussed by Wittels et al (1962). We may consider several possible causes discussedbelow which account for the difference of observations between heavy-ion-irradiated zirconand naturally damaged zircon.
Since natural zircon contains appreciable amounts of trace elements, it is expected that thereaction temperature varies due to these impurities. Effects of impurities on amorphization andannealing were noted in ion-beam irradiation studies of natural monazites (with high impuritycontents) and synthetic monazite (Meldrum et al 1997b). This may explain the differencein annealing temperature between natural and synthetic zircon samples. The discrepanciesmay also be due to the nature of the sample forms (bulk versus thin foils) and the type ofexperiment (high-temperature annealing versus irradiation at high temperature). It is alsocurrently unknown whether there is any possible connection between the phases ZrO2 and SiO2
observed while irradiating zircon with heavy ions near 950 K by Meldrum et al (1998) andthe intermediate phase observed this study which started to appear between 800 K and 900 K.
This issue may be also related to a fundamental and general question: what is therelationship between the structural characteristic of disordered materials and the variousphysical processes used to produce the amorphous state? Sales et al (1990) have reportedstructural differences between a glass state obtained by thermally quenching melts and ion-beam-amorphized states of lead pyrophosphate. In an EXAFS study of the Zr, Th and Usites in aperiodic/metamict (Ca,Th)ZrTi2O7 (zirconolite) (Farges et al 1993), it was suggestedthat there are fundamental structural differences in cation environments between radiation-induced aperiodic (metamict) phases and glasses quenched from melts. In a study of electron-irradiation-induced nucleation and growth in ScPO4, Meldrum et al (1997a) noted that samplesamorphized using 800 keV Kr2+ ions were somewhat slower to crystallize under electronirradiation than those treated with 1500 keV Kr+ ions (requiring ∼ 20% higher dose). In astudy of ion-bombarded and naturally damaged zircon samples, it was reported that severalimportant similarities and differences exist among ion-irradiated specimens and minerals thatundergo radiation damage from α-decay processes (Meldrum et al 1999). Therefore, it is alsounclear whether the above addressed experimental difference is due to the possible structuraldifferences between the ion-irradiation-induced amorphous state and the α-decay-radiation-induced metamict state.
The observation of five resolved bands between 1050 and 1250 cm−1 in sample 157annealed between 1400 K and 1500 K was unexpected as TEM observations (McLaren et al1994) suggested that the Si-rich phase in decomposed samples was silica glass. These wellresolved Raman bands observed in this study appear too sharp to be simply taken as a normalSiO2 glass. The apparent implication from our observation is that the local structure of theSi-rich phase in this decomposed zircon is probably different from that of SiO2 glass obtainedthrough quenching melts.

3146 M Zhang et al
4.4. Intermediate phase
We explain the appearance of additional Raman signals above 800 K as an indication ofa structural modification and the formation of an intermediate phase in the correspondingtemperature range. This phase is observed mainly in heavily damaged samples at hightemperatures (figures 1 and 4) while it could not be detected in untreated zircon. This suggeststhat this intermediate phase is most likely related to the impact of heating on the damagedparts in metamict zircon. It is unclear whether this phase has the chemical composition ofZrSiO4. However, its characteristic Raman bands near 670, 798 and 1175 cm−1 do not matchwith those of SiO2 glass in terms of the number of Raman bands and their frequencies (Ramanbands of SiO2 glass at 430, 490, 600, 795, 1059 and 1188 cm−1 were observed by Mysenet al 1980) and more clearly the strongest Raman band near 430 cm−1 in SiO2 glass dueto Si–O bending is absent in this intermediate phase. The lack of the strong characteristicRaman band of cubic ZrO2 near 607 cm−1 (Hirata et al 1994) suggests that these additionalsignals are unlikely to be due to cubic ZrO2 although tetragonal and monoclinic ZrO2 areobserved at higher temperatures. These extra Raman bands seem due to Si–O vibrations astheir frequencies, especially 788 and 1175 cm−1, are too high for interactions between Zr andO. If they are Si–O bands, the 670 cm−1 band is likely to be due to Si–O bending while the798 and 1175 cm−1 bands probably due to Si–O stretching. The appearance of these bands,particularly the 670 cm−1 band, could indicate a different Si–O–Si linkage. At this stage, thereis no clear evidence from the Raman data to rule out or to support the conclusion that this phaseis due to decomposition of metamict zircon. Holland and Gottfried (1955) observed in theirx-ray data a systematic development and disappearance of an extra peak near 2θ of 35–36.5◦
with increasing degree of α-decay radiation damage. These authors proposed the formation ofan intermediate polycrystalline phase in zircon samples with intermediate dose. It is currentlyunknown whether there is any possible connection between the intermediate phase proposedby Holland and Gottfried (1955) in unheated samples and the intermediate phase observed thisstudy. Further work by other experimental methods is in progress to understand the nature ofthe phase observed in our study.
5. Conclusion
The experimental results from this Raman study show that the recrystallization and structurerecovery process in damaged zircon through thermal annealing are far more complicatedthan previous observations have indicated, and that partially and very heavily damagedzircons exhibit significantly different recrystallization processes. The main recrystallizationprocess—the epitaxial growth of crystalline zircon—occurs near 1000 K in partially damagedsamples while structural defects in crystalline domains are gradually annealed out at evenlower temperatures (starting at 700 K). The lattice recovery is indicated by an increasein the phonon frequencies of the ν1 and ν3 Si–O stretching modes and the external bandnear 357 cm−1 together with a sharpening of those phonon bands with increasing annealingtemperature.
Heavily damaged zircon tends to decompose into tetragonal ZrO2 at temperatures around1125 K and monoclinic ZrO2 at temperatures above 1600 K. For the highly metamict sample157 (dose = 13.1 × 10¹⁸ α-events g−1), crystalline zircon does not occur until temperaturesbetween 1100 K and 1200 K are reached and a dramatic increase in the intensities of the Ramanbands of zircon is observed near 1500 K accompanied by a decrease in the signals of ZrO2
and SiO2. This indicates that the ZrSiO4 crystal growth in this metamict sample is associatedwith the reaction of ZrO2 with SiO2.
Annealing of α-decay damage in zircon 3147
Extra Raman signals near 670, 798 and 1175 cm−1 have been recorded, for the first time,by Raman spectroscopy in heavily damaged samples. These bands start to appear at around800 K and becomes undetectable in samples annealed above 1400 K. This observation probablysuggests the existence of an intermediate phase in this temperature range.
Increasing annealing time does not significantly affect the recrystallization mechanismsand the decomposition process except that it causes changes in the real volumes of the observeddifferent phases. Prolonged isothermal annealing at 1050 K results in a dramatic decrease inthe signals due to the intermediate phase and eventually they become undetectable in a sampleannealed for 28 days and 8 hours.
Acknowledgments
The authors thank S J B Reed for assistance with the electron microprobe analysis, A Graeme-Barber for assistance with the x-ray diffraction analysis and P Leggo for providing samplesUG13 and Moroto used in this study. Financial support from EU network ERB-FMRX-CT97-0108 is gratefully acknowledged.
References
Anastassakis E, Papanicolaou B and Asher I M 1975 J. Phys. Chem. Solids 36 667Anderson E B, Burakov B E and Vasiliev V G 1993 Proc. Safe Waste ’93 vol 2 p 29Begg B D, Hess N J, Weber W J, Conradson S D, Schweiger M J and Ewing R C 2000 J. Nucl. Mater. at pressBrawer S A and White W B 1975 J. Chem. Phys. 63 2421Burakov B E 1993 Proc. Safe Waste ’93 vol 2 p 19Capitani G C, Leroux H, Doukhan J C, Rıos S, Zhang M and Salje E K H 2000 Phys. Chem. Mineral at pressCarlone C 1992 Phys. Rev. B 45 2079Colombo M and Chrosch J 1998a Radiat. Phys. Chem. 53 555——1998b Radiat. Phys. Chem. 53 563Colombo M, Chrosch J, Biagini R and Memmi I 1999 Neues Jahrbuch Mineral.-Monatshefte 113Dawson P, Hargreave M M and Wilkinson G F 1971 J. Phys. C: Solid State Phys. 4 240Ellsworth S, Navrotsky A and Ewing R C 1994 Phys. Chem. Mineral. 21 140Ewing R C 1994 Nucl. Instrum. Methods B 91 22——1999 Proc. Natl Acad. Sci. 96 3432Ewing R C, Lutze W and Weber W J 1995 J. Mater. Res. 10 243Farges F 1994 Phys. Chem. Mineral. 20 504Farges F, Ewing R C and Brown G E Jr 1993 J. Mater. Res. 8 1983Hazen R M and Finger L W 1979 Am. Mineral. 64 157Hirata T, Asari E and Kitajima M 1994 J. Solid State Chem. 110 201Holland H D and Gottfried D 1955 Acta Crystallogr. 8 291Hoskin P W O and Rodgers K A 1996 Eur. J. Solid State Inorg. Chem. 33 1111Jaeger H, AbuRaddad L and Wick D J 1997 Appl. Radiat. Isot. 48 1083Keramidas V G and White W B 1974 J. Am. Ceram. Soc. 57 22Kim D J, Jung H J and Yang I S 1993 J. Am. Ceram. Soc. 76 2106McLaren A C, Fitz J D and Williams I S 1994 Geochim. Cosmochim. Acta 58 993Meldrum A, Boatner L A and Ewing R C 1997a J. Mater. Res. 12 1816——1997b Phys. Rev. B 56 13 805Meldrum A, Boatner L A, Zinkle S J, Wang S X, Wang L M and Ewing R C 1999 Can. Mineral. 37 207Meldrum A, Zinkle S J, Boatner L A and Ewing R C 1998 Nature 395 56Murakami T, Chakoumakos B C, Ewing R C, Lumpkin G R and Weber W J 1991 Am. Mineral. 76 1510Mursic Z, Vogt T, Boysen H and Frey F 1992a J. Appl. Crystallogr. 25 519Mursic Z, Vogt T and Frey F 1992b Acta Crystallogr. B 48 584Mysen B O, Virgo D and Scarfe C M 1980 Am. Mineral. 65 690Nasdala L, Irmer G and Wolf D 1995 Eur. J. Mineral. 7 471Nicola H H and Rutt H N 1974 J. Phys. C: Solid State Phys. 7 1381

3148 M Zhang et al
Sales B C, Ramey J O, McCallum J C and Boatner L A 1990 J. Non-Cryst. Solids 126 179Salje E K H, Chrosch J and Ewing R C 1999 Am. Mineral. 84 1107Siu G G, Stokes M J and Liu Y 1999 Phys. Rev. B 59 3173Smith D K and Newkirk H K 1965 Acta Crystallogr. 18 982Stott V H and Hilliard A 1946 Mineral. Mag. 27 198Syme R W G, Lockwood D J and Kerr H J 1977 J. Phys. C: Solid State Phys. 10 1335Vance E R 1975 Radiat. Eff. 24 1Vance E R and Anderson B W 1972 Mineral. Mag. 38 605Vaz J E and Senftle F E 1971 J. Geophys. Res. 76 2038Weber W J 1991 Radiat. Eff. Defects Solids 115 341——1993 J. Am. Ceram. Soc. 76 1729Weber W J, Ewing R C and Lutze W 1996 Mater. Res. Soc. Symp. Proc. vol 412 (Pittsburgh, PA: National Research
Society) p 25Williford R E, Devanathan R and Weber W J 1998 Nucl. Instrum. Methods B 141 94Wittels M C, Steigler J O and Sherrill F A 1962 J. Nucl. Energy A/B 16 237Zhang M, Salje E K H, Farnan I, Graeme-Barber A, Daniel P, Ewing R C, Clark A M and Leroux H 2000 J. Phys.:
Condens. Matter 12 1915